1. Introduction
The increasing demand for energy in buildings, driven by population growth and urbanization, has significantly raised energy consumption levels. Buildings are currently responsible for consuming 74% of electricity in the U.S. [
1], with projections indicating that building energy use will rise by 40% within the next two decades [
2]. Such escalation in energy consumption exacerbates environmental impacts, particularly through heightened greenhouse gas (GHG) emissions. In response, the concept of net-zero energy buildings (NZEBs) has been advocated as a vital solution, designed to equalize the energy consumed with the energy produced on-site through renewable sources [
3,
4,
5]. Beyond theoretical frameworks, NZEBs offer a tangible approach to markedly reduce the carbon footprint of building infrastructures.
Buildings can be classified into three major categories based on their primary use: residential, commercial, and industrial. Numerous studies have been conducted on each building type with the aim of achieving net-zero energy consumption. For example, it is noted in [
6] that advancements in residential NZEBs focus on optimizing energy infrastructure connections, renewable energy sources, and energy-efficiency measures to reduce energy consumption and emissions. In [
7], a real-world residential building is retrofitted and concluded that this can reduce greenhouse gas emissions by over 60%, with potential reductions of up to 96% through more advanced measures. Similarly, a net-zero energy management approach for commercial buildings is proposed in [
8] using renewable energy, pumped hydro storage, and hydrogen taxis offering a framework for urban decarbonization by 2050. The key themes for commercial NZEB are discussed in [
9], identifying key themes such as energy efficiency and life cycle assessment through bibliometric and qualitative analysis. In [
10], the authors discuss region-specific transition plans and policy packages to achieve net-zero industrial emissions by mid-century, such as material efficiency, carbon pricing, and decarbonized technologies. The authors in [
11] outlined emission reduction challenges in the cement industry and proposed solutions across its value chain to achieve net-zero emissions and minimize environmental impacts.
In addition, the challenges associated with NZEBs can be broadly categorized into two distinct phases: the planning phase and the operation phase. The planning phase focuses on site selection, design, energy modeling, and sizing of energy equipment. Meanwhile, the operation phase emphasizes real-time energy monitoring, regular maintenance, and optimal energy management. The benefits of multi-energy system co-planning in nearly zero-energy districts are discussed in [
12] while identifying key research gaps related to temporal and spatial representations. An investment planning approach for NZEB in Canada is proposed in [
13] examining the influence of geographical factors on energy retrofits. The significance of planning NZESs for large energy consumers, like data centers, is discussed in [
14] to facilitate the integration of volatile renewable energy sources. The operational and energy management aspects of NZEBs are discussed in [
15,
16,
17] where energy management of a real building in China is accessed in [
15], the role of HVAC in achieving net zero is discussed in [
16], and role of efficiency measures is discussed in [
17].
However, the adoption of NZEBs encounters considerable challenges. Primarily among these are the unpredictability of renewable energy sources and the complexities associated with efficient energy management [
18]. Solar power’s intermittency introduces uncertainties in the building energy system, affecting the consistency of power output from photovoltaic (PV) systems. To mitigate these issues, various predictive models have been developed. For instance, the authors in [
19] have developed a hybrid machine-learning model integrating an extreme learning machine with a genetic algorithm and a similar day analysis for precise hourly PV power output predictions. This model has been validated through robust performance metrics such as the coefficient of determination, mean absolute error, and normalized root mean square error, demonstrating high accuracy and stability in day-ahead PV power predictions. Another study in [
20] has utilized machine learning tools to develop a PV output prediction model that includes data quality checks, a machine learning algorithm, weather clustering, and accuracy assessments, resulting in enhanced prediction capabilities when linear regression coefficients are applied.
Despite advances in forecasting accuracy, exactly predicting the PV output under constantly changing weather conditions remains impossible, leading to operational complexities in NZEBs. Numerous studies have tackled the optimal operation of NZEBs under such uncertainties [
21]. For instance, the authors in [
22] have developed a framework combining multi-objective optimization with robustness analysis to design integrated building energy systems, employing two-stage stochastic programming for balancing economic and environmental goals while validating robustness through Monte Carlo simulations. The authors in [
23] have developed a multi-objective optimization process, aiming to minimize the operating GHG emissions and the life-cycle cost. The process has been applied to a typical multi-residential building and tested in the four Greek climate zones.
Although existing research studies [
19], [
20], [
22], [
23] have significantly focused on enhancing the accuracy of prediction models or on optimizing NZEB operations, more studies are still required to develop comprehensive operational frameworks for building energy management systems with the necessary features. Additionally, developing a user-friendly graphical user interface (GUI) that provides real-time visualization of system status and integrates both predictive and optimization functionalities could greatly assist building operators in managing and controlling building energy systems more effectively.
To address these multifaceted challenges, this study proposes an optimization framework specifically designed for NZEBs. The framework comprises two primary phases: accurately predicting renewable energy outputs, especially from PV systems, and strategically optimizing energy production and consumption. The initial phase utilizes neural network (NN)-based prediction models to forecast the output power of the PV system accurately, taking into account a range of environmental and technical factors. The subsequent phase focuses on optimizing building systems for cooling, heating, and electricity generation using mixed integer linear programming (MILP), aiming to minimize operational costs and maximize efficiency. This approach not only enhances the reliability and performance of NZEBs but also reduces their dependence on external power sources, thereby bolstering the sustainability of building operations. Additionally, the implementation of a GUI facilitates intuitive and user-friendly interaction with the system, enabling building operators to manage and optimize their energy resources efficiently.
2. System Models
2.1. System Configuration
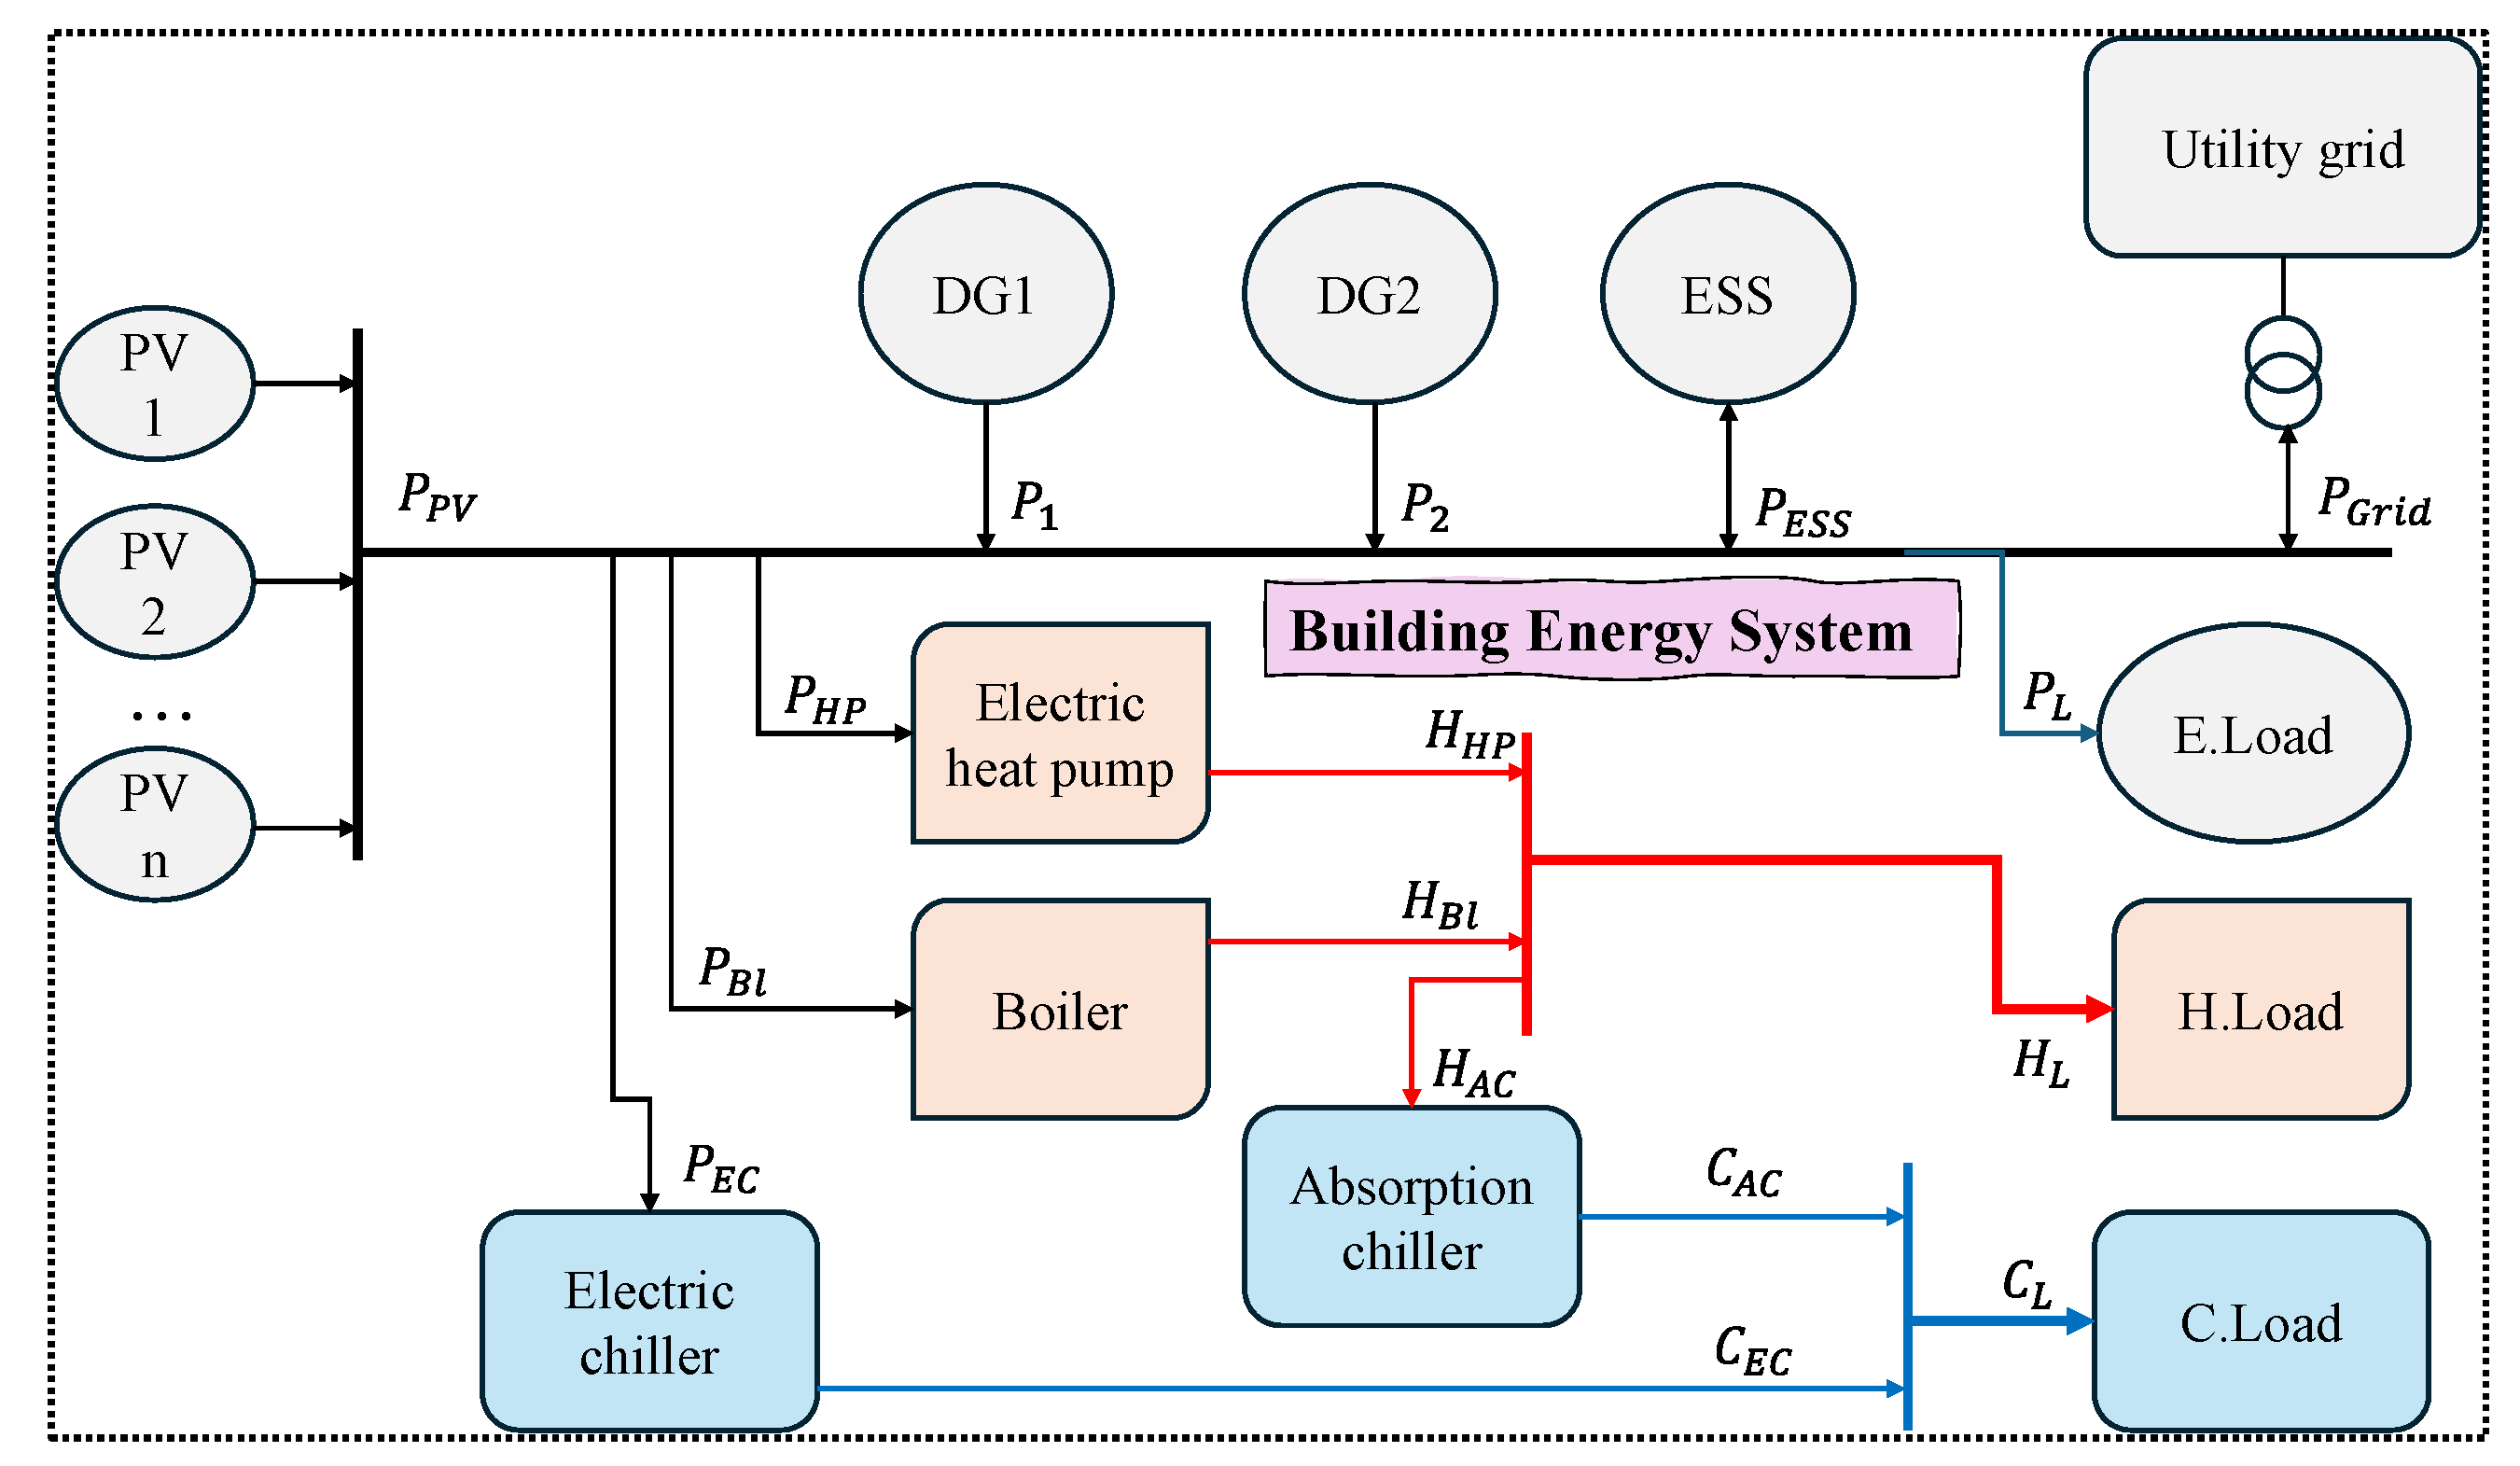
Figure 1 shows the typical configuration and energy flow of a building energy system (BES), which integrates various sources of energy to fulfill electric, heat, and cooling energy demands. By combining the energy generated from these sources, the BES helps in ensuring that the energy supply throughout the building is balanced and efficiently distributed. This integration, which allows the system to harness energy from multiple sources, will increase the reliability of the BES while reducing dependency on a single energy provider. Not only will the system become more reliable, but there is also higher risk mitigation associated with energy supply disruptions (e.g. power outages). The system presents a way to seamlessly obtain energy from other energy sources in the building.
In the test system, the PV systems, distributed generators (DGs), and energy storage systems (ESSs) are used to supply electricity to the building energy system, fulfilling all electrical loads as well as powering other heating and cooling sources such as electric heat pumps, boilers, and electric chillers. The system is also connected to the utility grid, which can help supply the entire system during periods of power shortage when the output from local resources is insufficient. The heat generated by the boiler and electric heat pump is used to meet the heat load and the heat energy consumed by the absorption chiller (AC). The cooling load is fulfilled by the electric chiller (EC) and the AC. The operation of the entire building’s energy is managed by a building energy management system.
2.2. Proposal Optimization Framework
The proposed optimization framework includes two major models: a prediction model of PV output power and a multi-objective optimization model for operation of entire building systems. These models are interdependent, as the output of the prediction model serves as input for configuring the building’s operational optimization. The prediction model produces forecast of expected output from a PV system based on environmental factors.
First, three prediction models were assessed and analyzed on their performance on PV generation data from Berlin, Germany using the PVWatts API [
24]. The prediction models chosen were ARIMA, support vector regression (SVR), and a feedforward neural network (FNN). To maintain consistency and accurate comparisons, the same input data were used across all models. The input data used in the model were beam irradiance, diffuse irradiance, ambient temperature, wind speed, and date and time. The output parameter was the output power of the PV system.
After testing the three chosen models and gathering their actual and predicted output, the following testing error metrics, including mean absolute error (MAE), root mean squared error (RMSE), and normalized root mean squared error (nRMSE), are calculated for each prediction model. To better evaluate the developed models, these metrics are also compared among one-day and three-day predictions.
Regarding the optimization model, we developed a MILP-based multi-objective optimization model to find the most efficient way to operate the energy system to minimize costs while at the same time ensuring that all energy demands from electricity, heating, and cooling are met. Decision variables such as generation output of the boiler, heat pump, DGs, and chillers are the quantities that need to be optimized. To ensure that optimal results are achieved by the model, power constraints were implemented. To find the most efficient way to operate, the optimization model will explore many combinations of decision variable values to end up with the smallest possible cost.
2.3. Mathematical Models
In this section, a detailed MILP-based mathematical model is presented with a multi-objective function aimed at minimizing building energy operation costs and reducing dependency on the utility grid. Additionally, the operational constraints of DGs, ESSs, and energy balances, including electrical, heating, and cooling systems, are also presented in detail.
Nomenclatures
|
Output of PV system at t |
|
Output of DGs 1 and 2 at t |
|
Minimum and maximum output of DG i |
|
The weight of sub-objectives |
|
Capacity of ESS |
|
Charging and discharging amount of ESS at t |
|
State of charge of ESS at t |
|
Discharging and charging losses of ESS |
|
Buying and selling amount with utility grid at t |
|
Electric load amount at t |
|
Power consumption by electric heat pump at t |
|
Power consumption by boiler and electric chiller at t |
|
Heat energy output of heat pump at t |
|
Heat energy output of boiler at t |
|
Heat load at t |
|
Heat consumption by absorption chiller at t |
|
Cooling output of absorption chiller at t |
|
Cooling output of electric chiller at t |
|
Cooling load at t |
|
Operation cost of DGs 1 and 2 at t |
|
Trading price with the utility grid at t |
The following multi-objective function (1) is utilized in the optimization model for optimal operation of energy building. The first term of the objective function presents the operation cost of the entire building network, and the second term shows the dependence of the building on the external utility grid.
This multi-objective function not only aims to minimize the operation cost of the entire building energy system but also to reduce the building's dependency on external energy systems. The cost of power produced by DGs and the cost/profit of trading power with the utility grid are calculated at every time step. When the objective function is minimized, the optimal values for the decision variables are determined. This ensures efficient and cost-effective usage of our building energy system, along with encouraging the use of sustainable energy.
There are various constraints that must be fulfilled during the operation of buildings. The given equations (2)-(6) show the operational constraints and energy balance of a system involving DGs, ESS, and energy flows between various components. The operation boundary of DGs is given in (2), ensuring that their output stays within the minimum and maximum limits. Equations (3) and (4) describe the charging and discharging power constraints of the ESS. Equation (3) ensures that the charging power does not exceed the maximum allowable charging rate considering the current SOC and the charging loss. Similarly, equation (4) shows the discharging power based on the current SOC and discharging loss. SOC update is given in (5), where the SOC at the next step depends on the current SOC and the actual amount of charging and/or discharging power. Finally, the power balance within the system is ensured by (6), where the total power generated from PVs, DGs, ESS discharging, and grid purchases must meet the total load, including the building load, electric consumption by the heat pump, boiler, and electric chiller, along with the amount of power exported to the utility grid.
Similarly, the heat generated by the HP and boiler should balance the heat load and the heat supplied to the AC, as shown in (7)–(9). The electric-to-heat ratio of the HP and boiler are
and
, respectively.
Finally, the cooling load should always be fulfilled by the cooling generated by the AC and the EC, as expressed in (10)–(12). The heat-to-cooling and electric-to-cooling ratios are selected as
.5 and
, respectively.
3. Numerical Results
In this section, a detailed analysis is provided for dataset correlation calculation, the prediction model, and the optimal operation of the energy building. First, we select features that exhibit a high correlation with PV output to improve the accuracy of the PV output prediction model. Next, the predicted output is integrated into the optimization model to schedule the operation of the entire building energy system, aiming to minimize both operational costs and the building’s dependency on external energy systems.
3.1. Input Data
The one-year PV dataset is derived from the output of a PV system, sourced from PVWatts [
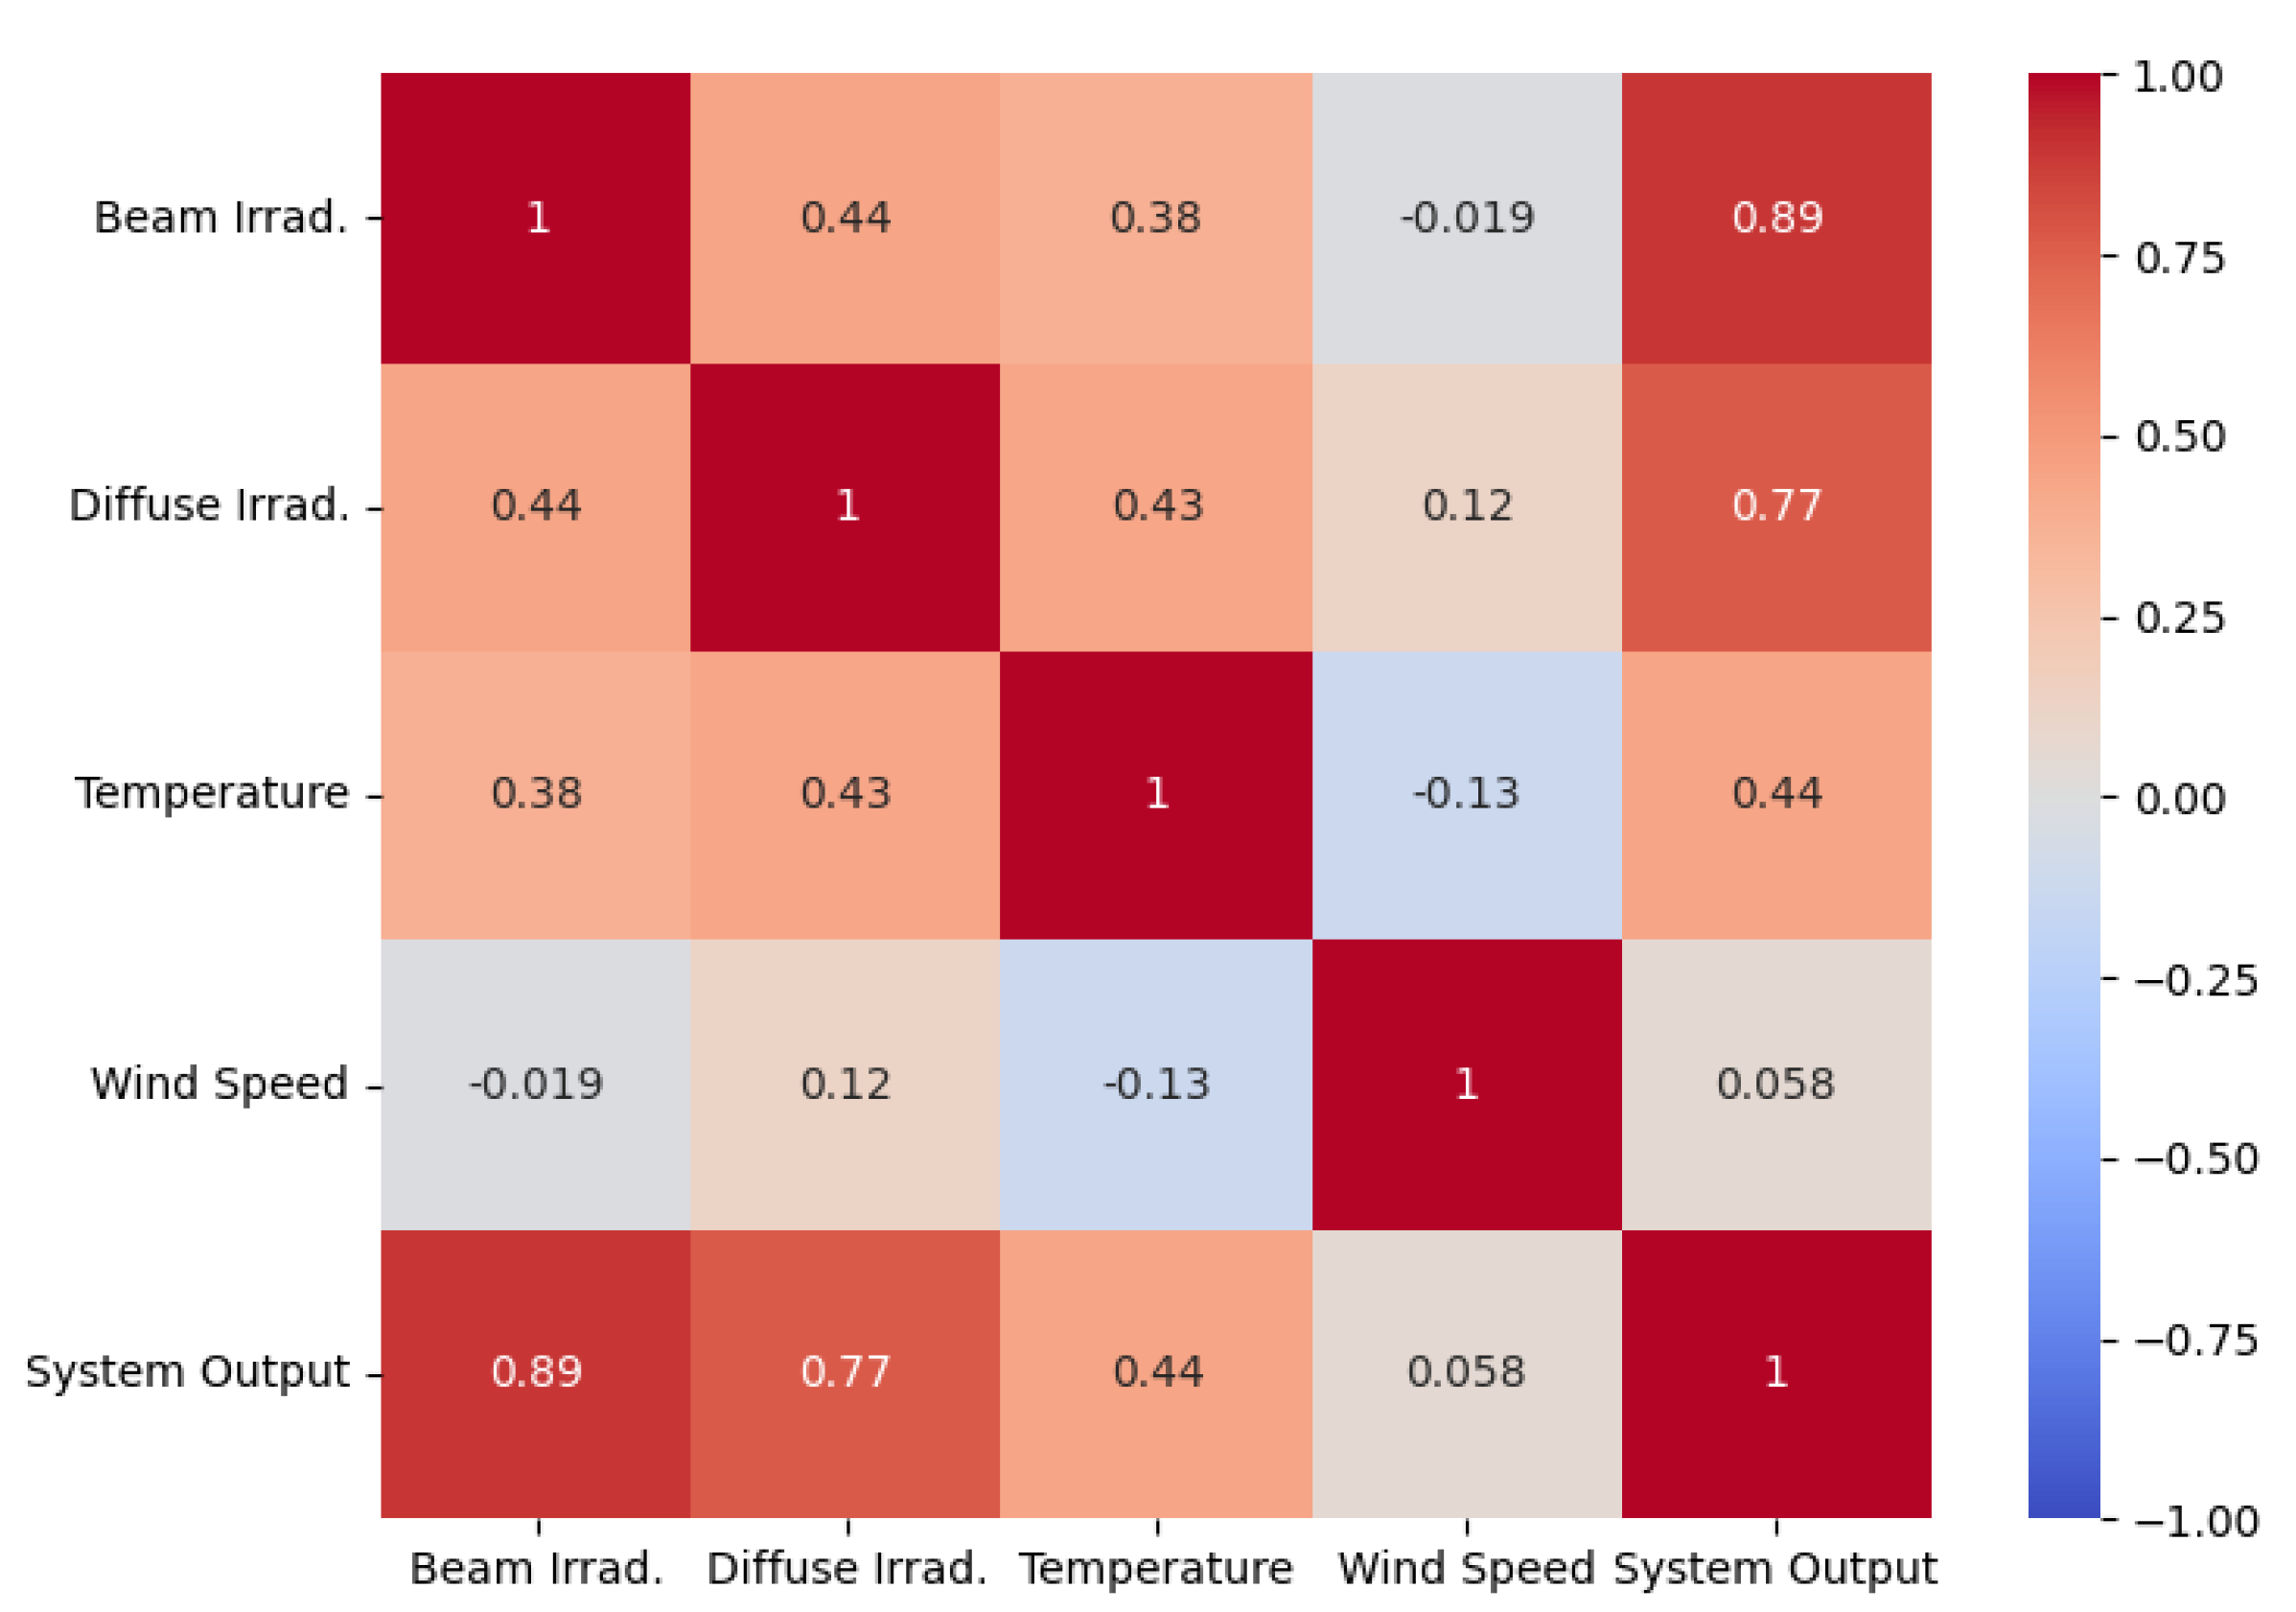
24]. Observing the correlations between the variables in the dataset provides valuable insights into which parameters most significantly impact PV system output. This understanding can further assist in predictive modeling, PV system design, and the selection of installation sites. As shown in
Figure 2, beam irradiance—the direct sunlight received by the panels—has the strongest correlation with PV system output (r = 0.89). This indicates that as the amount of direct sunlight increases, the energy output of the system rises.
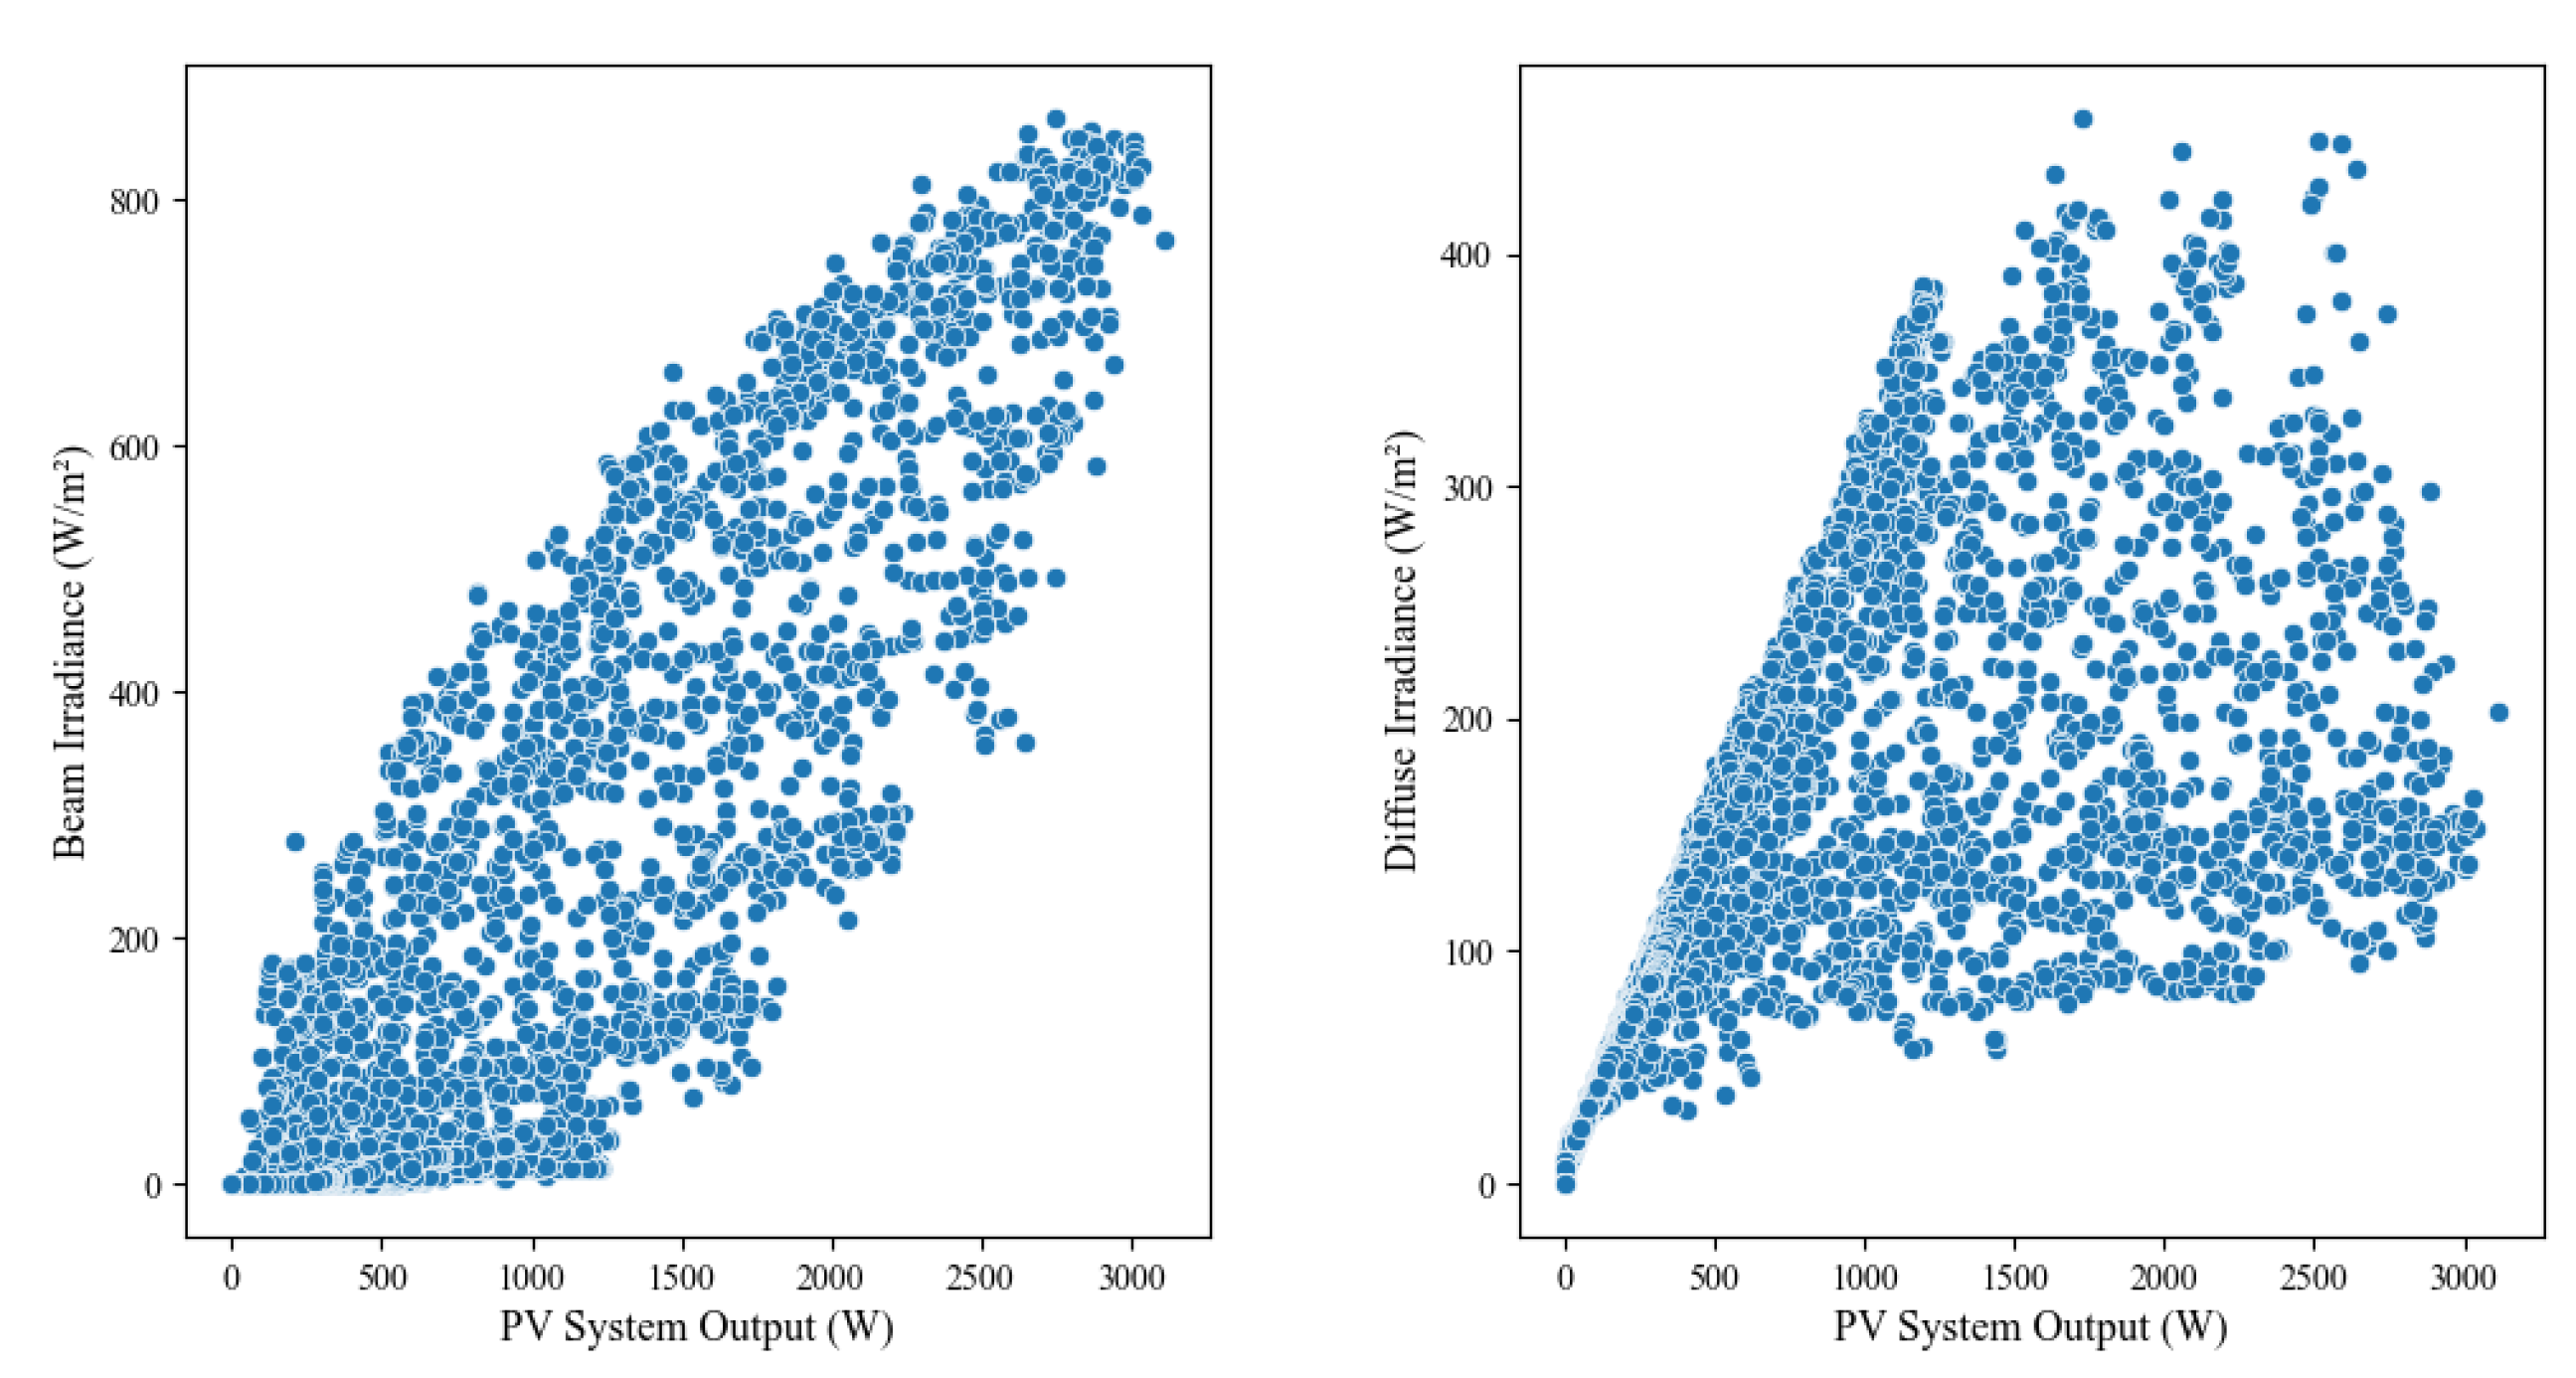
The second strongest correlation is between diffuse irradiance and PV system output (r = 0.77). Diffuse irradiance refers to sunlight that has been scattered by the atmosphere, rather than direct sunlight. Despite this distinction, it still contributes positively to system output. Both irradiance measures demonstrate a positive correlation with output, as shown in
Figure 3, indicating that PV energy production increases with the total sunlight exposure, whether direct or indirect.
In contrast, ambient temperature has a weaker correlation with PV system output, with an r value of 0.44 (
Figure 2), suggesting that while temperature may have some influence, it is not a key factor in determining system performance. The weakest correlation is found between wind speed and PV system output, with an r value of 0.058 (
Figure 2), reflecting the minimal impact of wind speed on the system.
Figure 4 further illustrates the lack of correlation between wind speed and output, highlighting its insignificant effect.
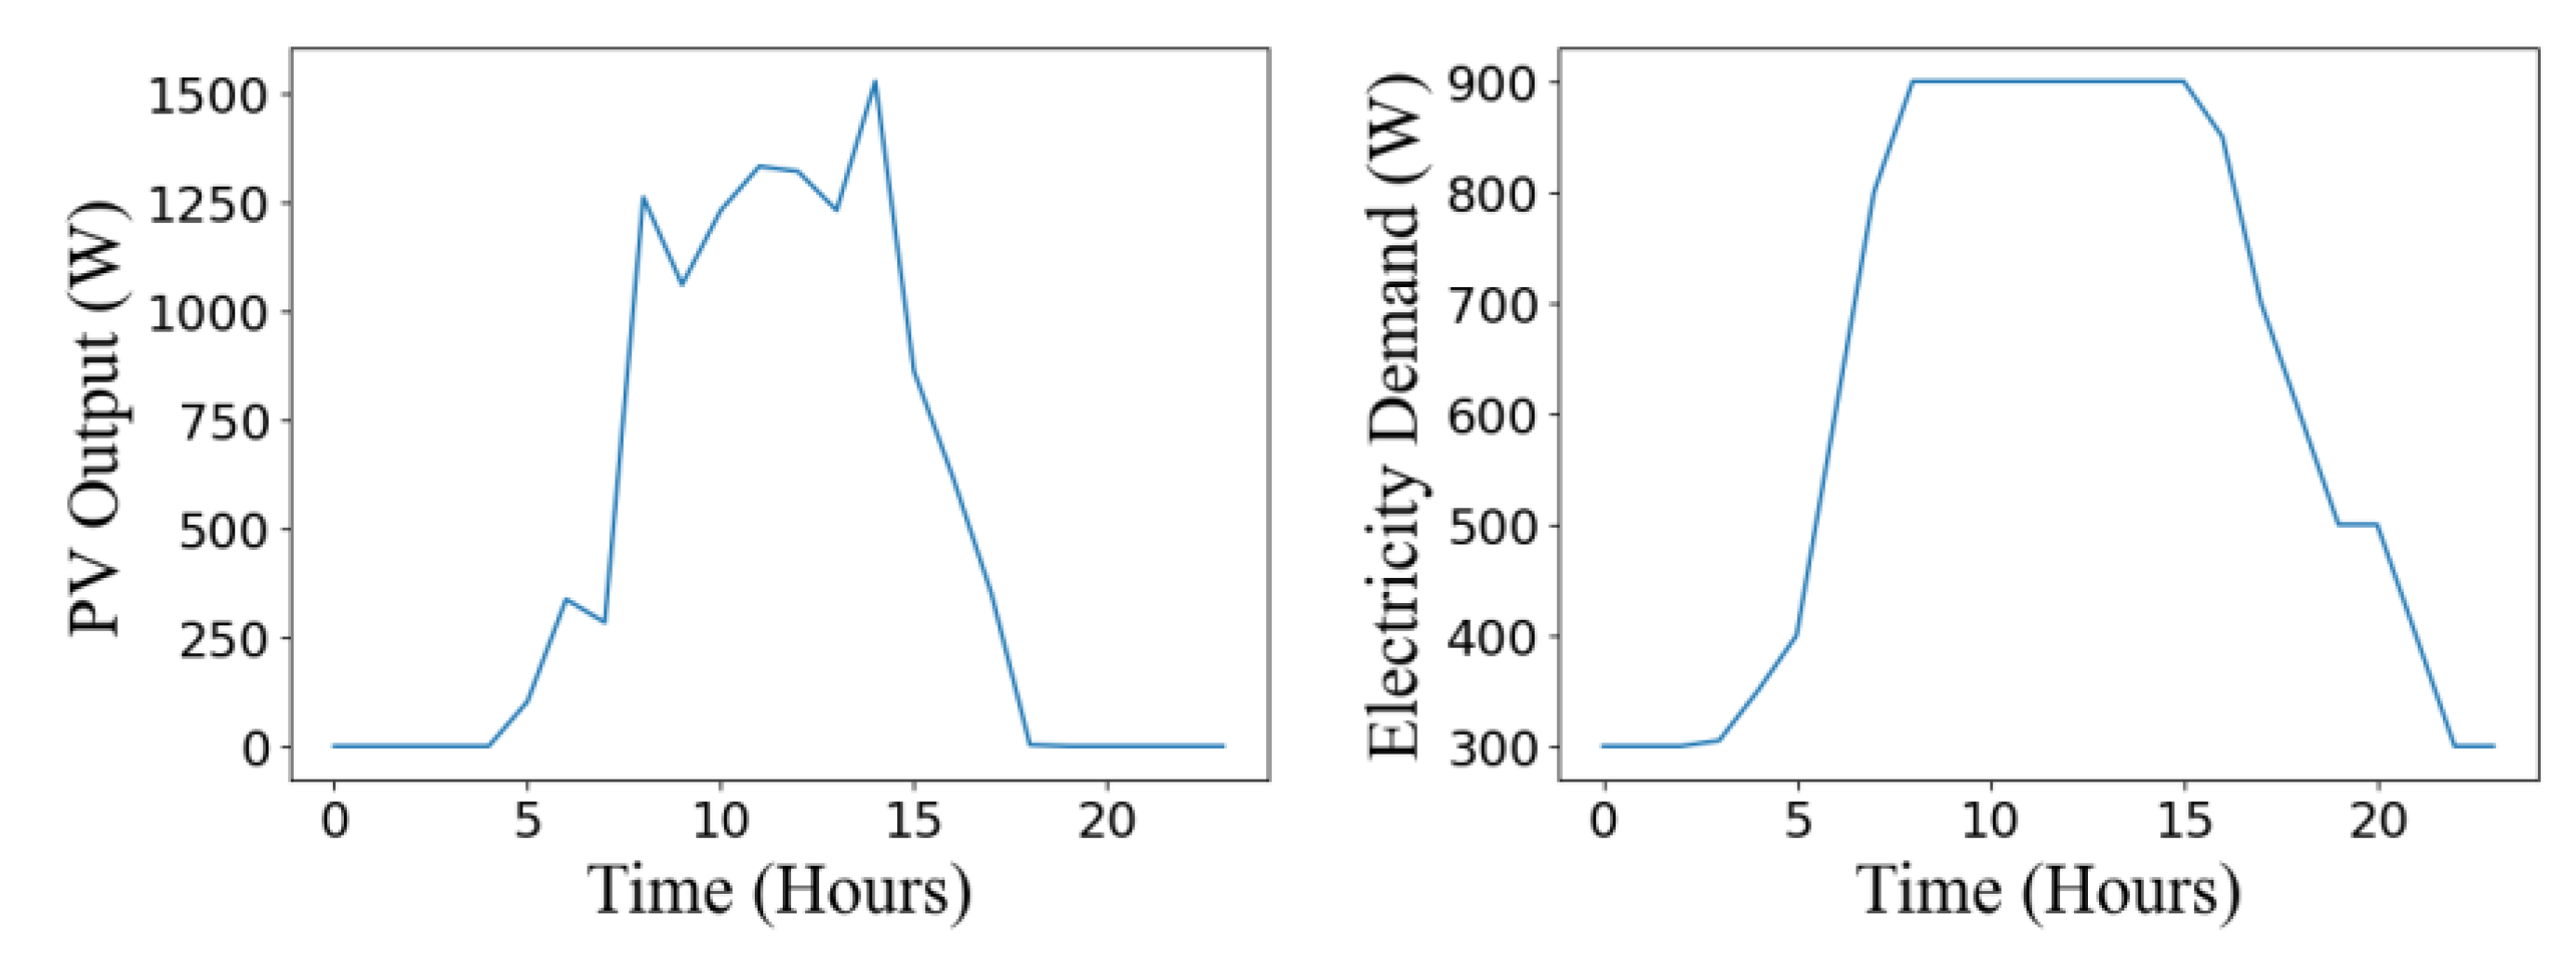
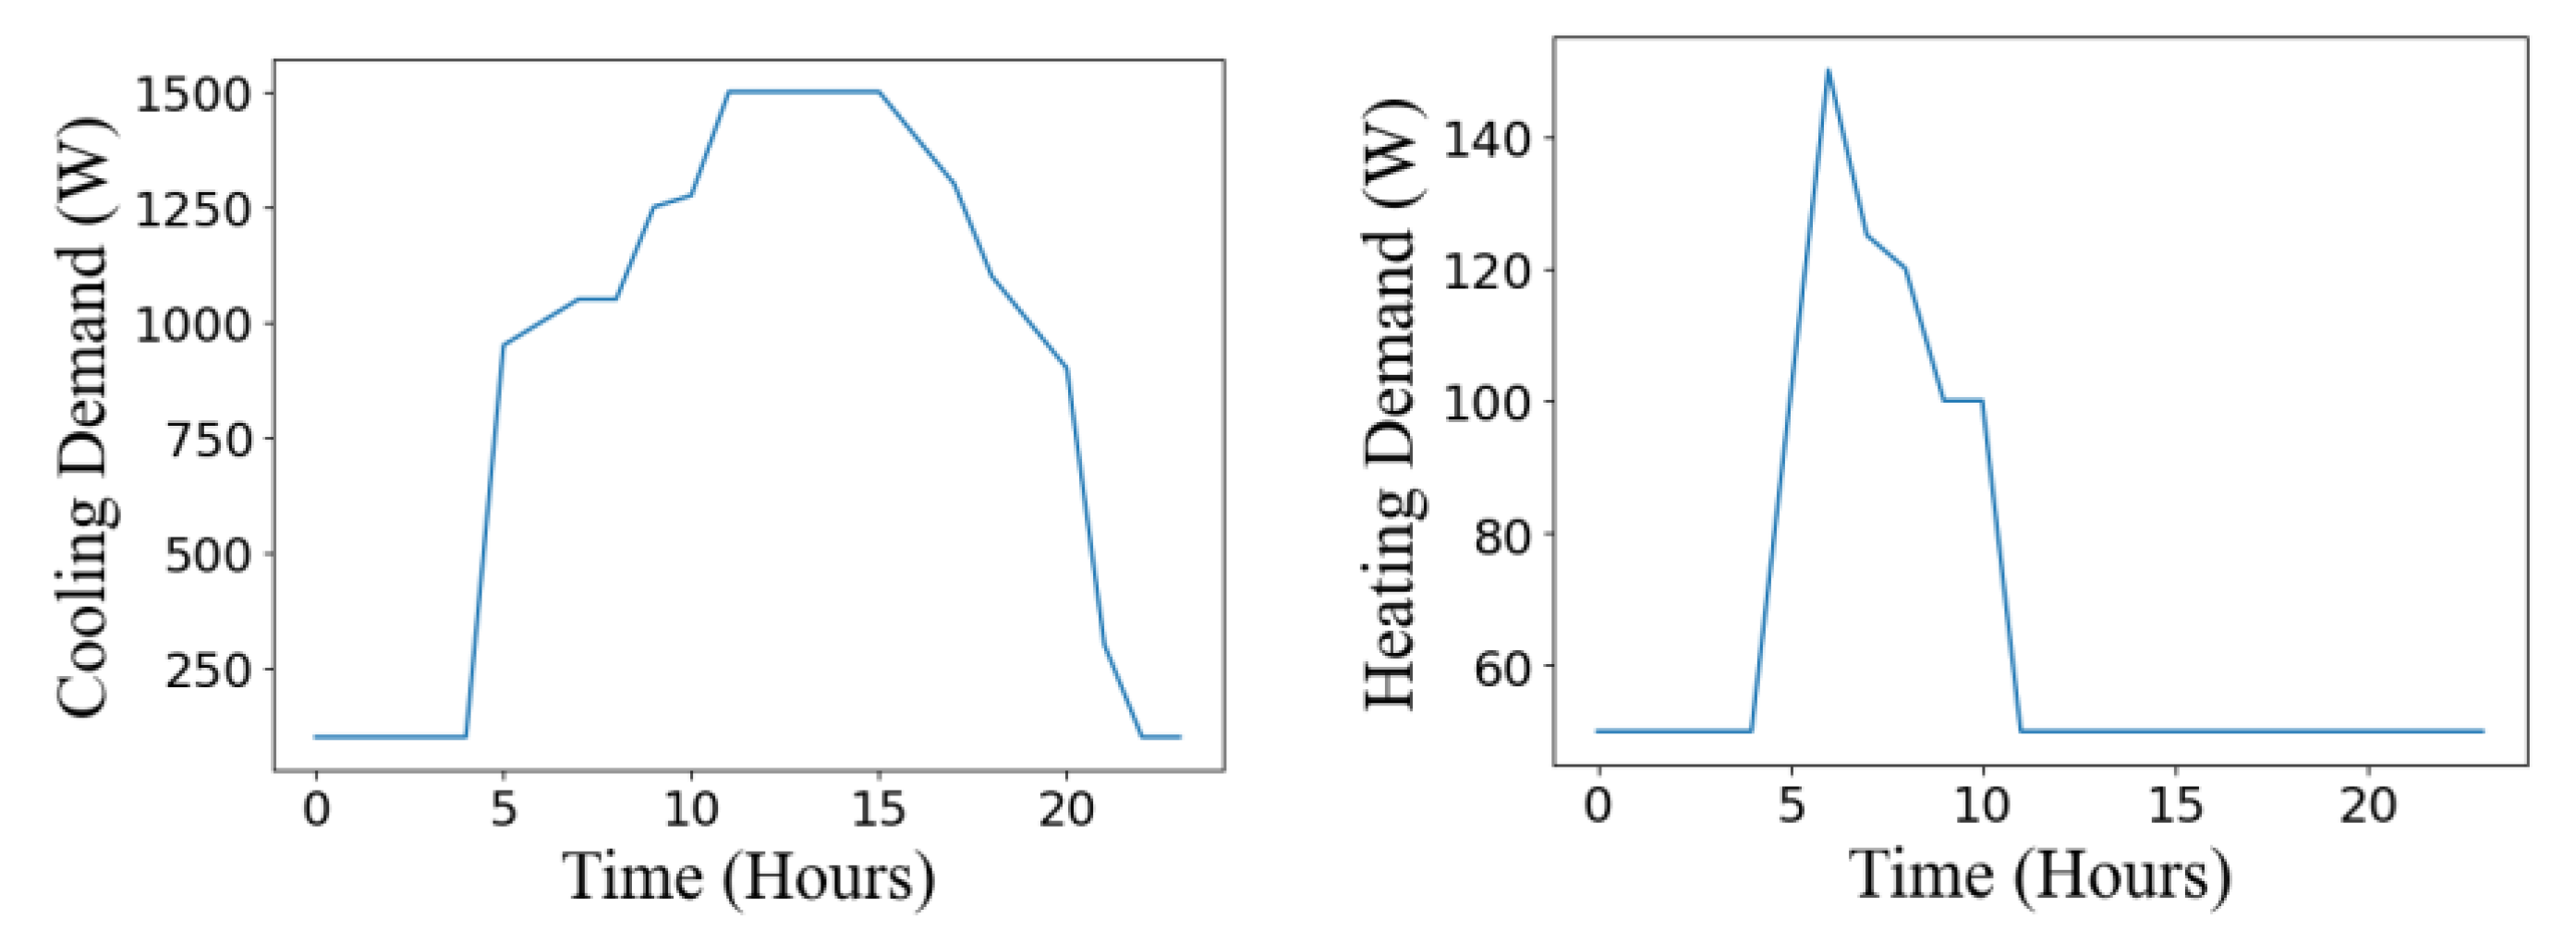
The output power of PVs is obtained by performing the PV prediction model, as illustrated in
Figure 5(a). The electric, heat, and cooling loads are taken from a combined cooling, heat, and power system in an office building [
25], as depicted in
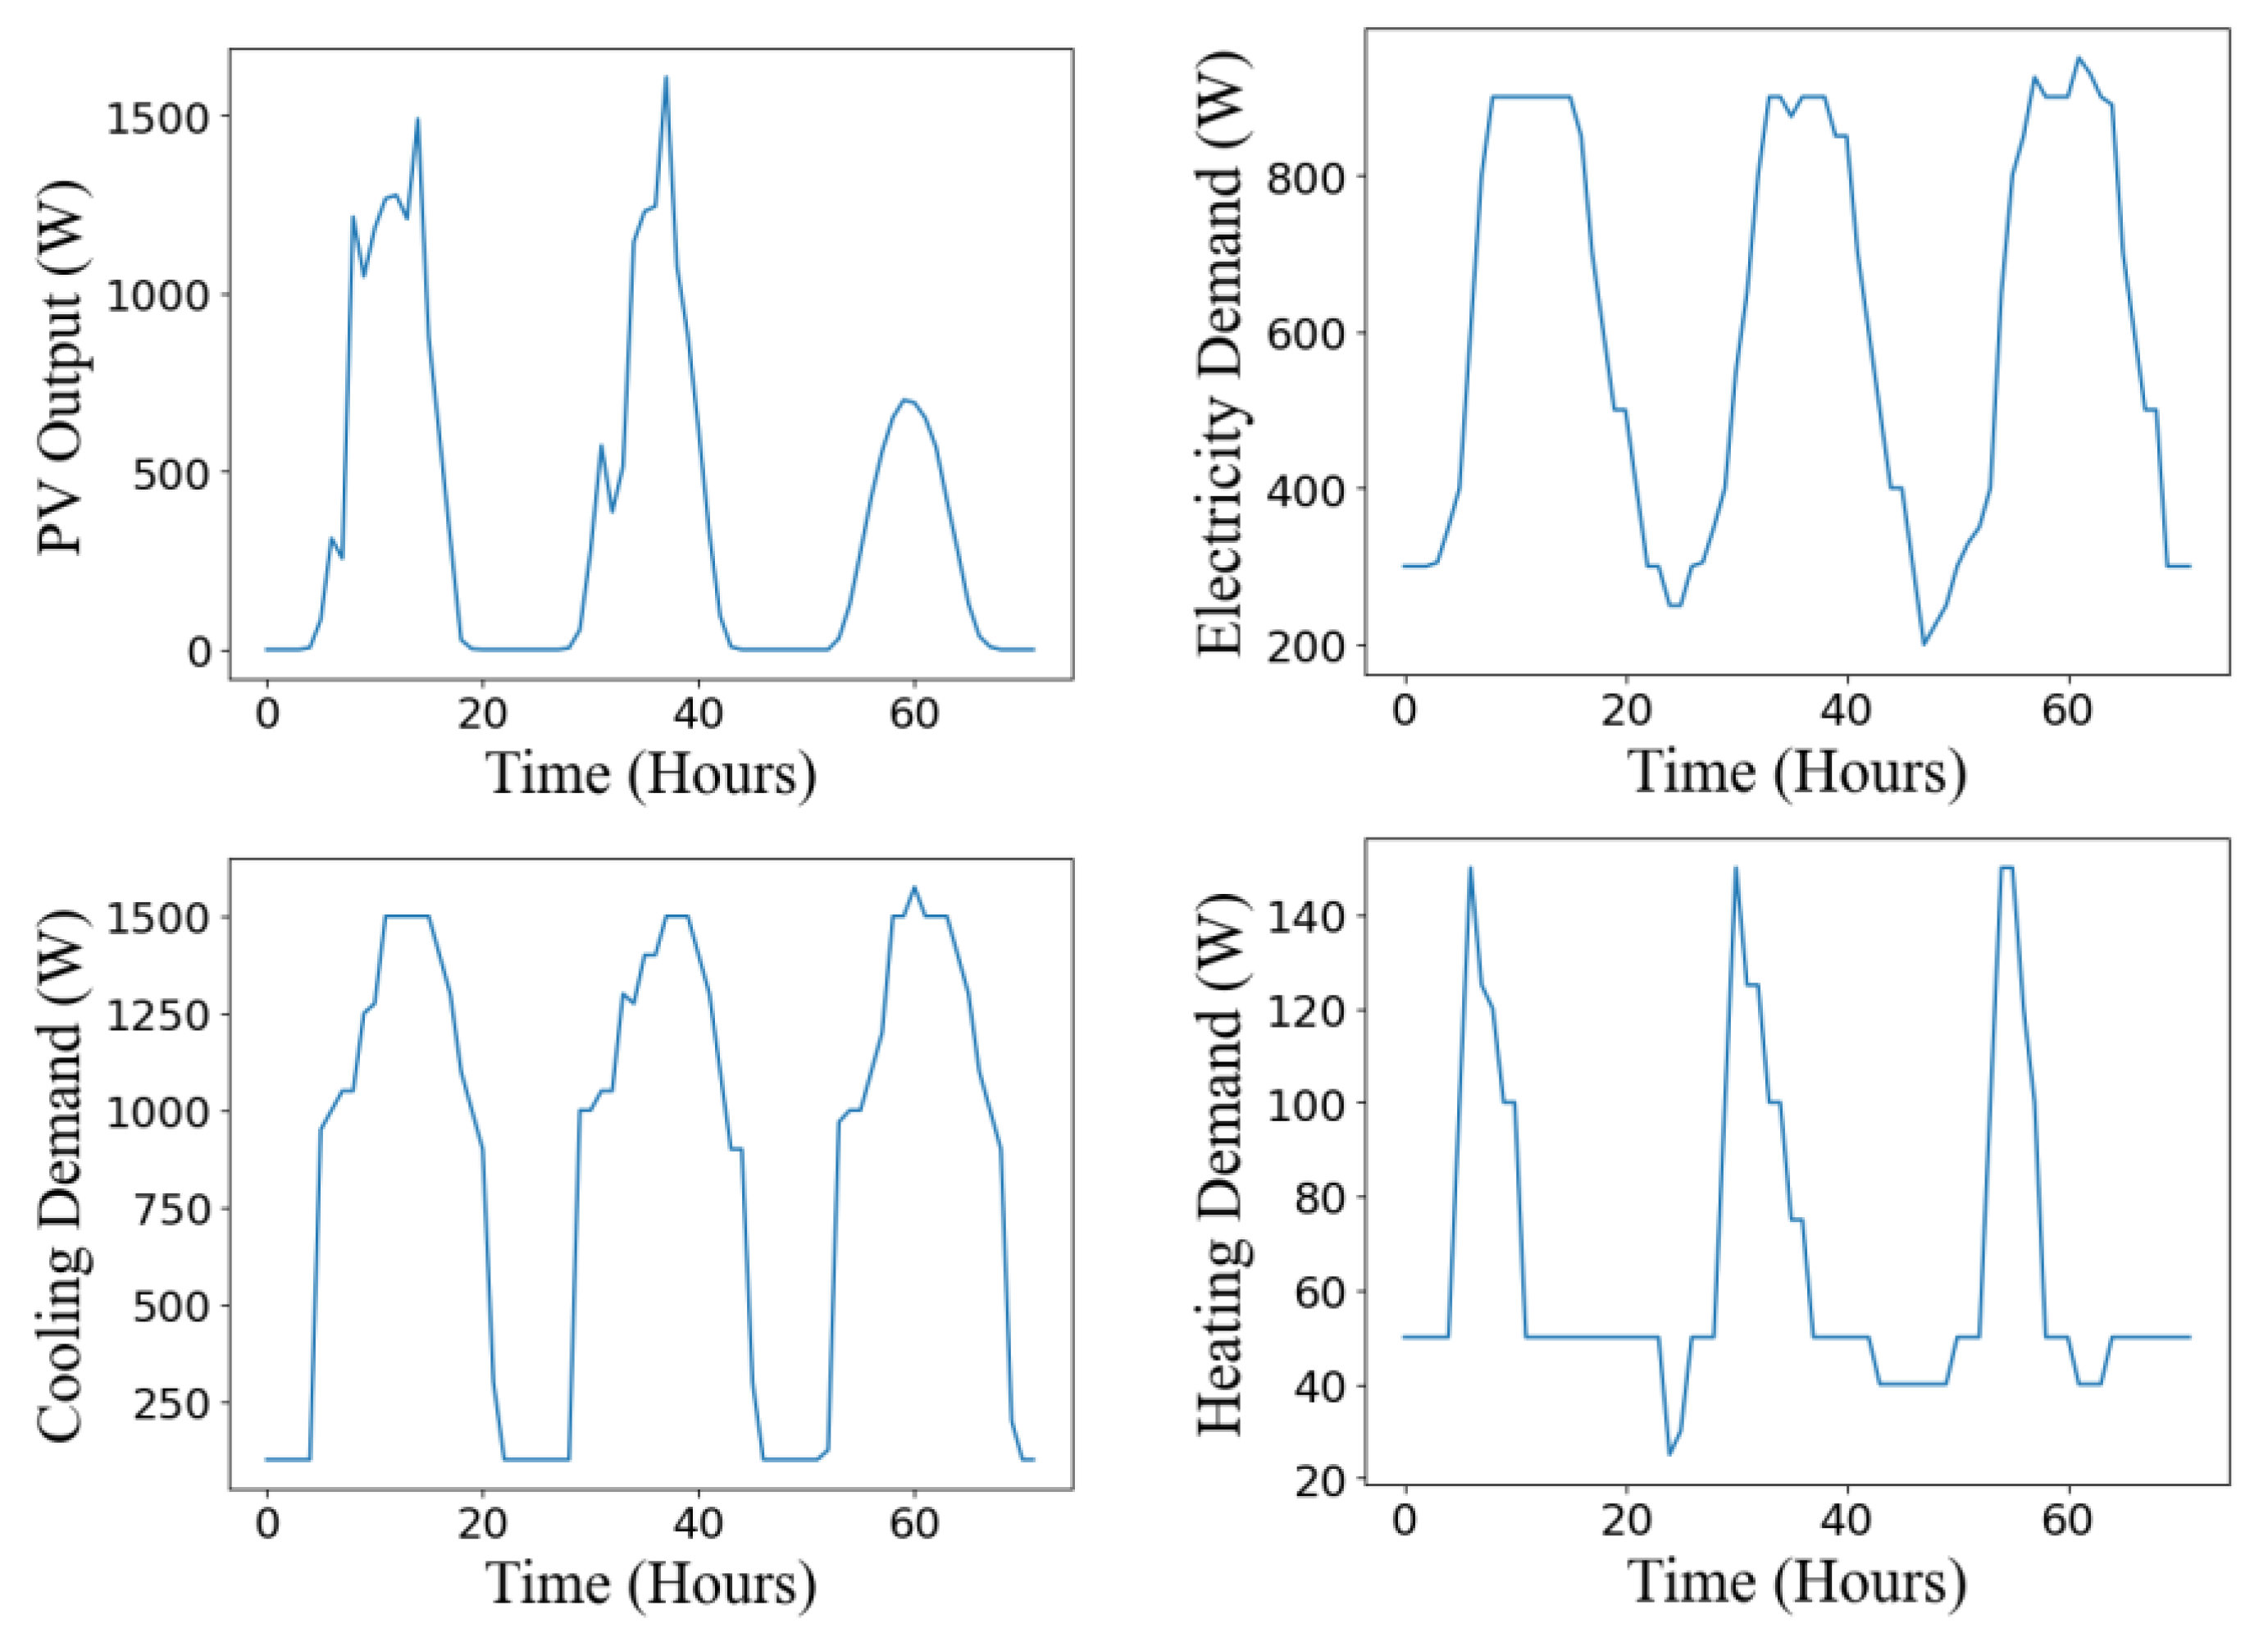
Figure 5(b)–(d). Similarly, the data for three-day-ahead optimization are presented in
Figure 6(a)–(d).
3.2. Prediction Models
The chosen prediction model utilizes a NN architecture. This architecture refers to the arrangement of neurons into layers along with the connection patterns between layers. It depicts how a network transforms the received input into output. The NN model integrated in this project uses Keras, which is a high-level neural network API. The following characteristics of the model and its layers differ slightly among one-day and three-day predictions to account for the different levels of complexity. The input layer of the NN model represents the parameters used to help generate the output layer. The specific input parameters utilized in the model are ambient temperature, beam irradiance, diffuse irradiance, wind speed, and date and time. Both one- and three-day prediction models have densely connected input layers with 7 neurons.
The distinguishing factor between the models for one-day versus three-day simulation is the size of the hidden layer. A hidden layer is an intermediary layer between the input and the output. This is where the data received by the model are essentially studied for intricate patterns to produce accurate predictions. The hidden layer size for the one- and the three-day simulations is 7 and 14 neurons, respectively. There are more data to consider for three-day prediction, so having 14 neurons in the hidden layer allows the model to train more efficiently and handle the complexities and size of the data. The output layer for the one- and the three-day model is 24 and 72 neurons, respectively, which corresponds to the number of hours for which we want to obtain predictions. The adaptive moment estimation (Adam) optimizer is utilized during the compilation of each model. This ensures enhanced performance and the minimization of the model’s loss function.
The results from the comparison
Table 1 show that the NN model produced the most accurate results. It received the lowest values for each testing error metric compared with ARIMA and SVR. This high performance can be attributed to the model’s architecture comprising hidden layers that utilize activation functions, ensuring that complex and non-linear patterns are captured.
3.2.1. One-Day Prediction
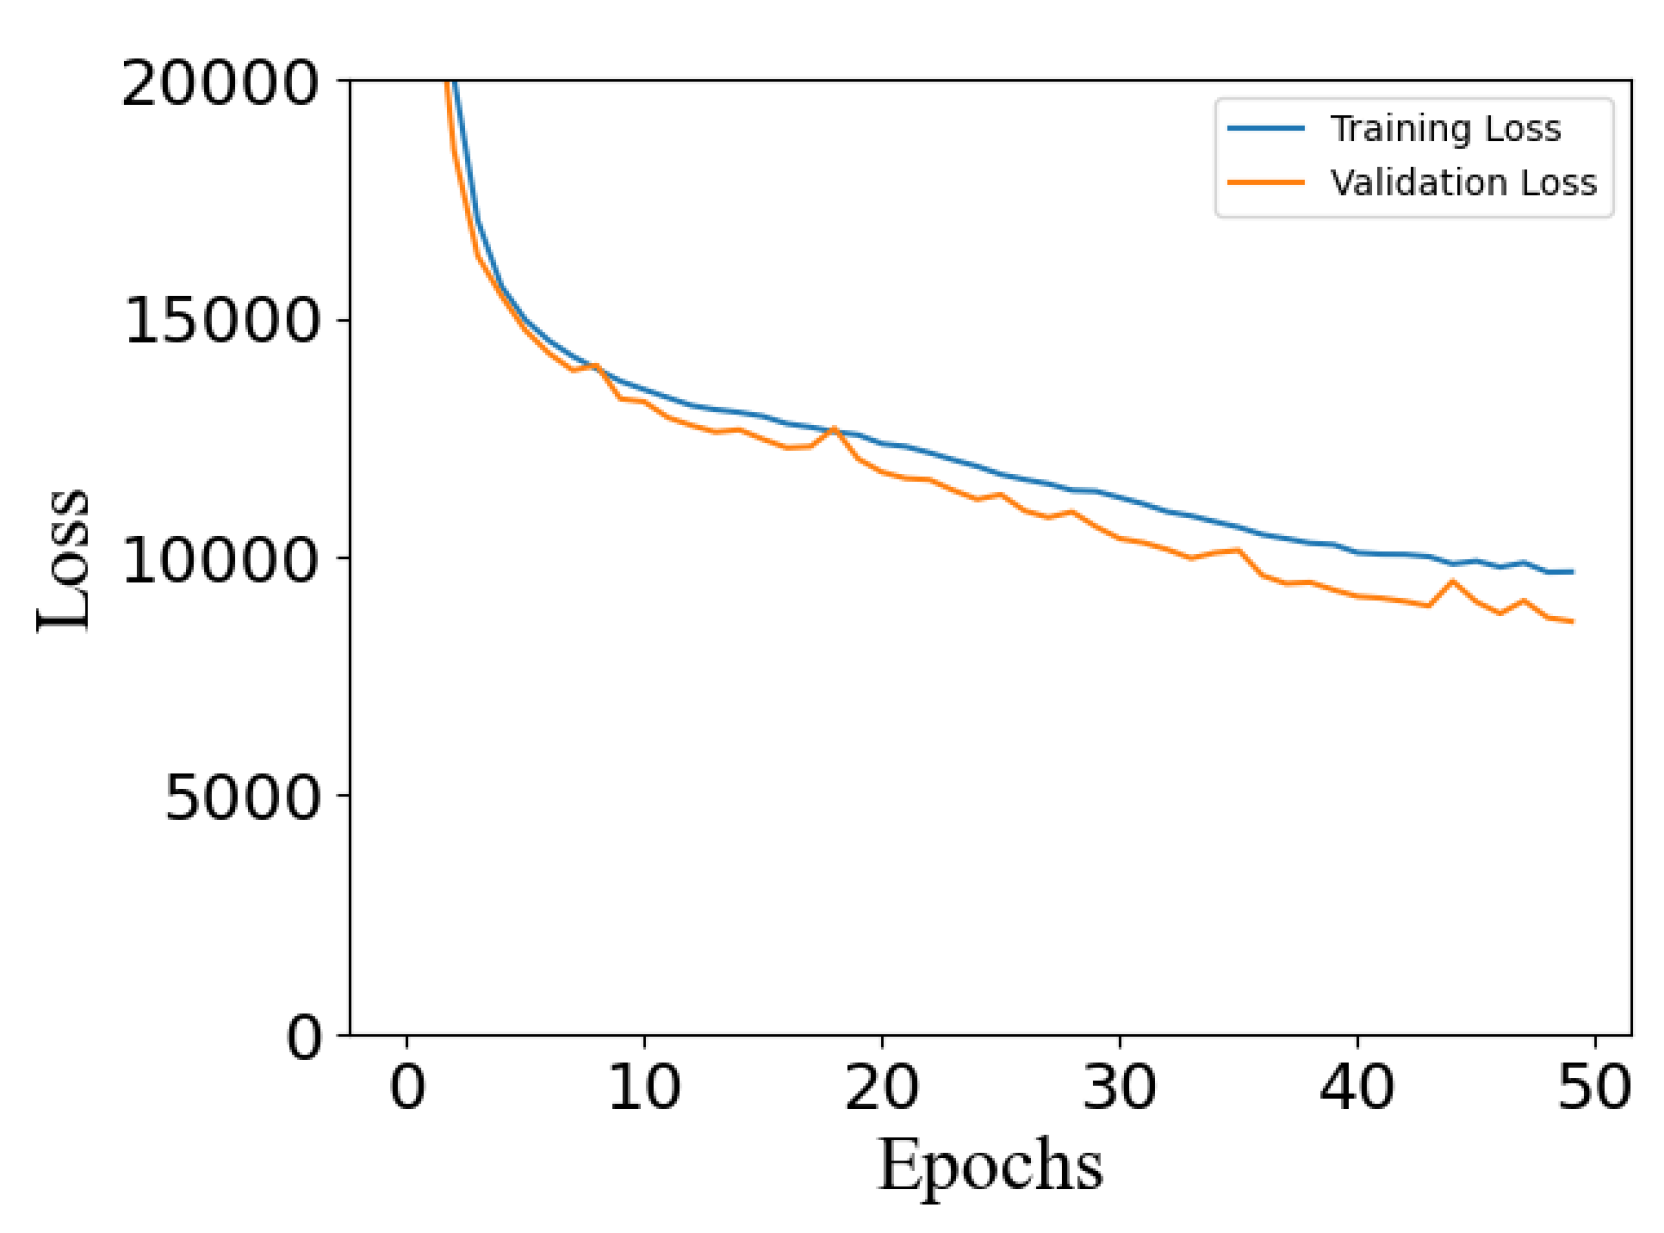
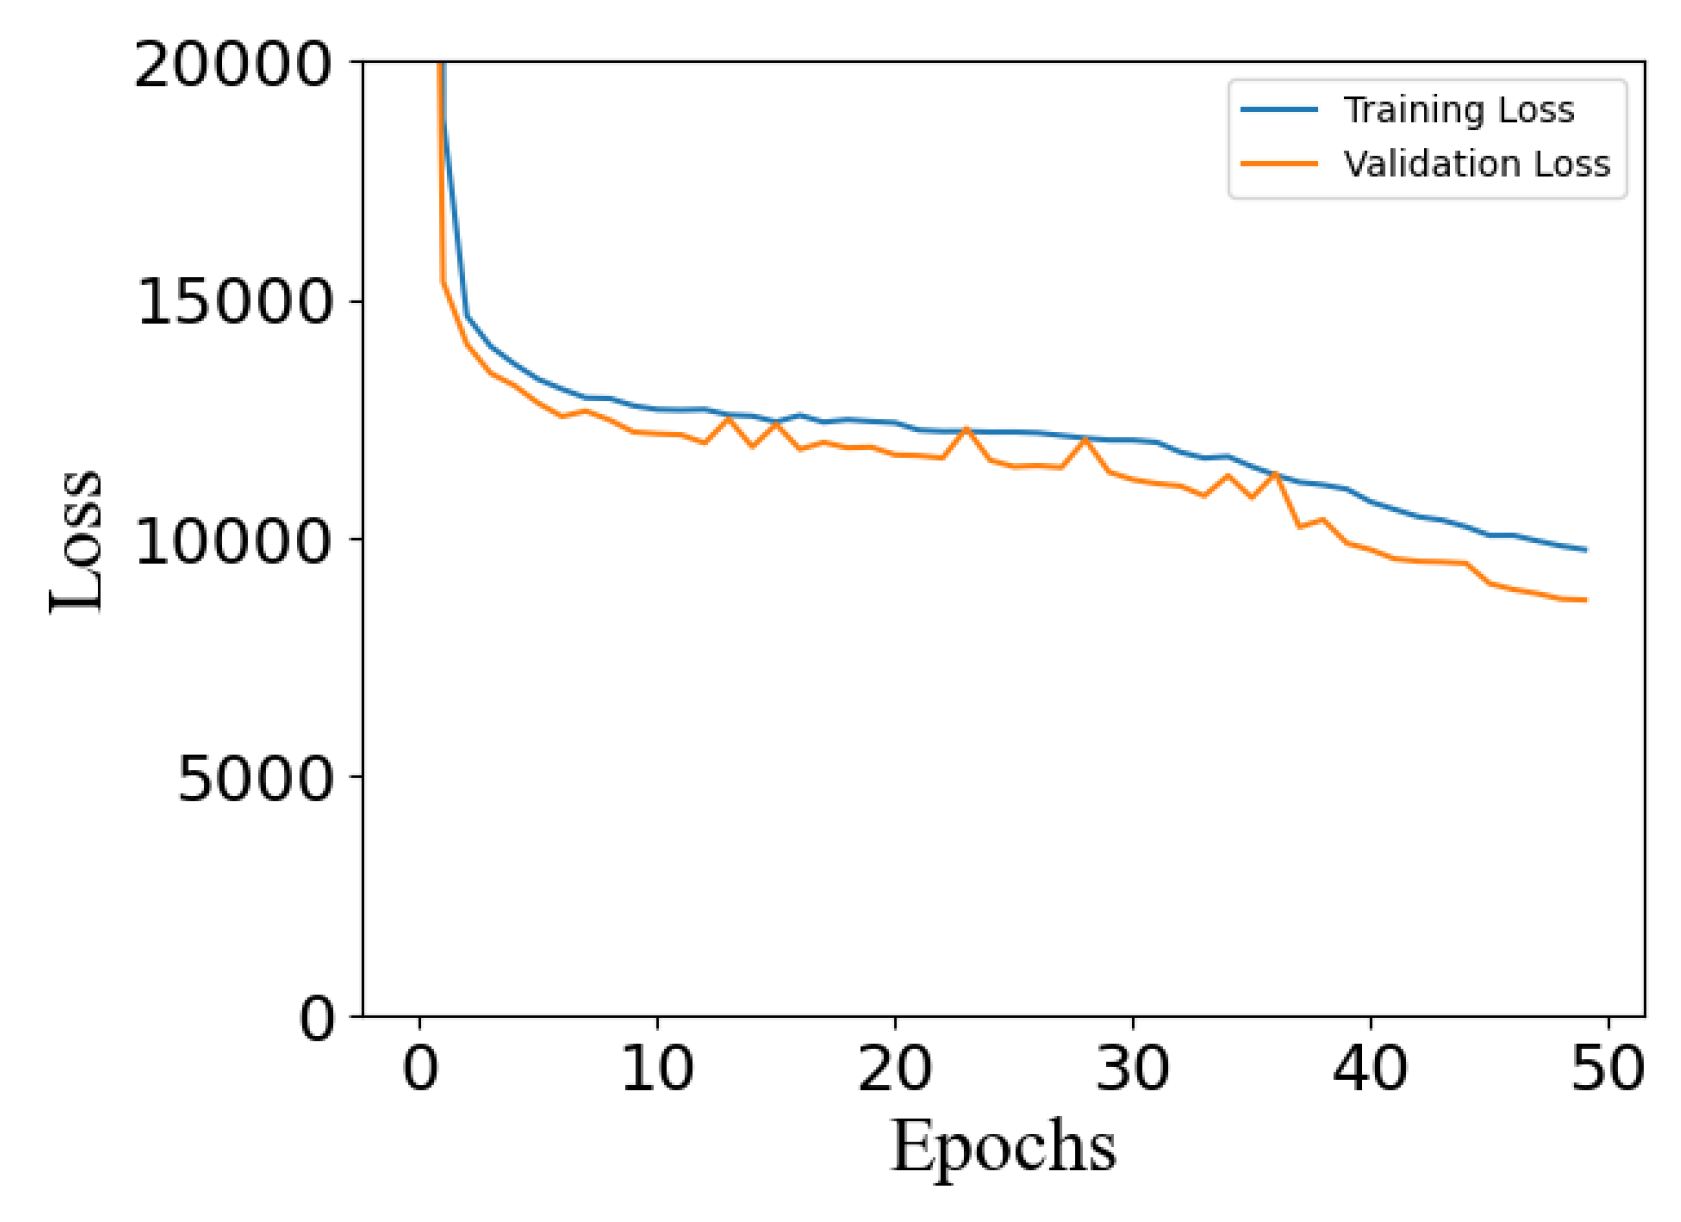
To further validate the model’s training results, a training and validation loss is presented with the model loss over epochs. Training loss is an indication of how well a model is fitting training data, or how effectively it is learning patterns. Validation loss displays how well the model fits new, unseen data. As shown in
Figure 7, both training and validation loss have an initial decrease. A decreasing trend for training loss indicates that the model is learning and showing improvement toward the training data. A decreasing validation loss shows that the model is improving its predictions on unseen data. We can also infer that the model has an optimal fit because both losses decrease, and they stabilize at a certain point.
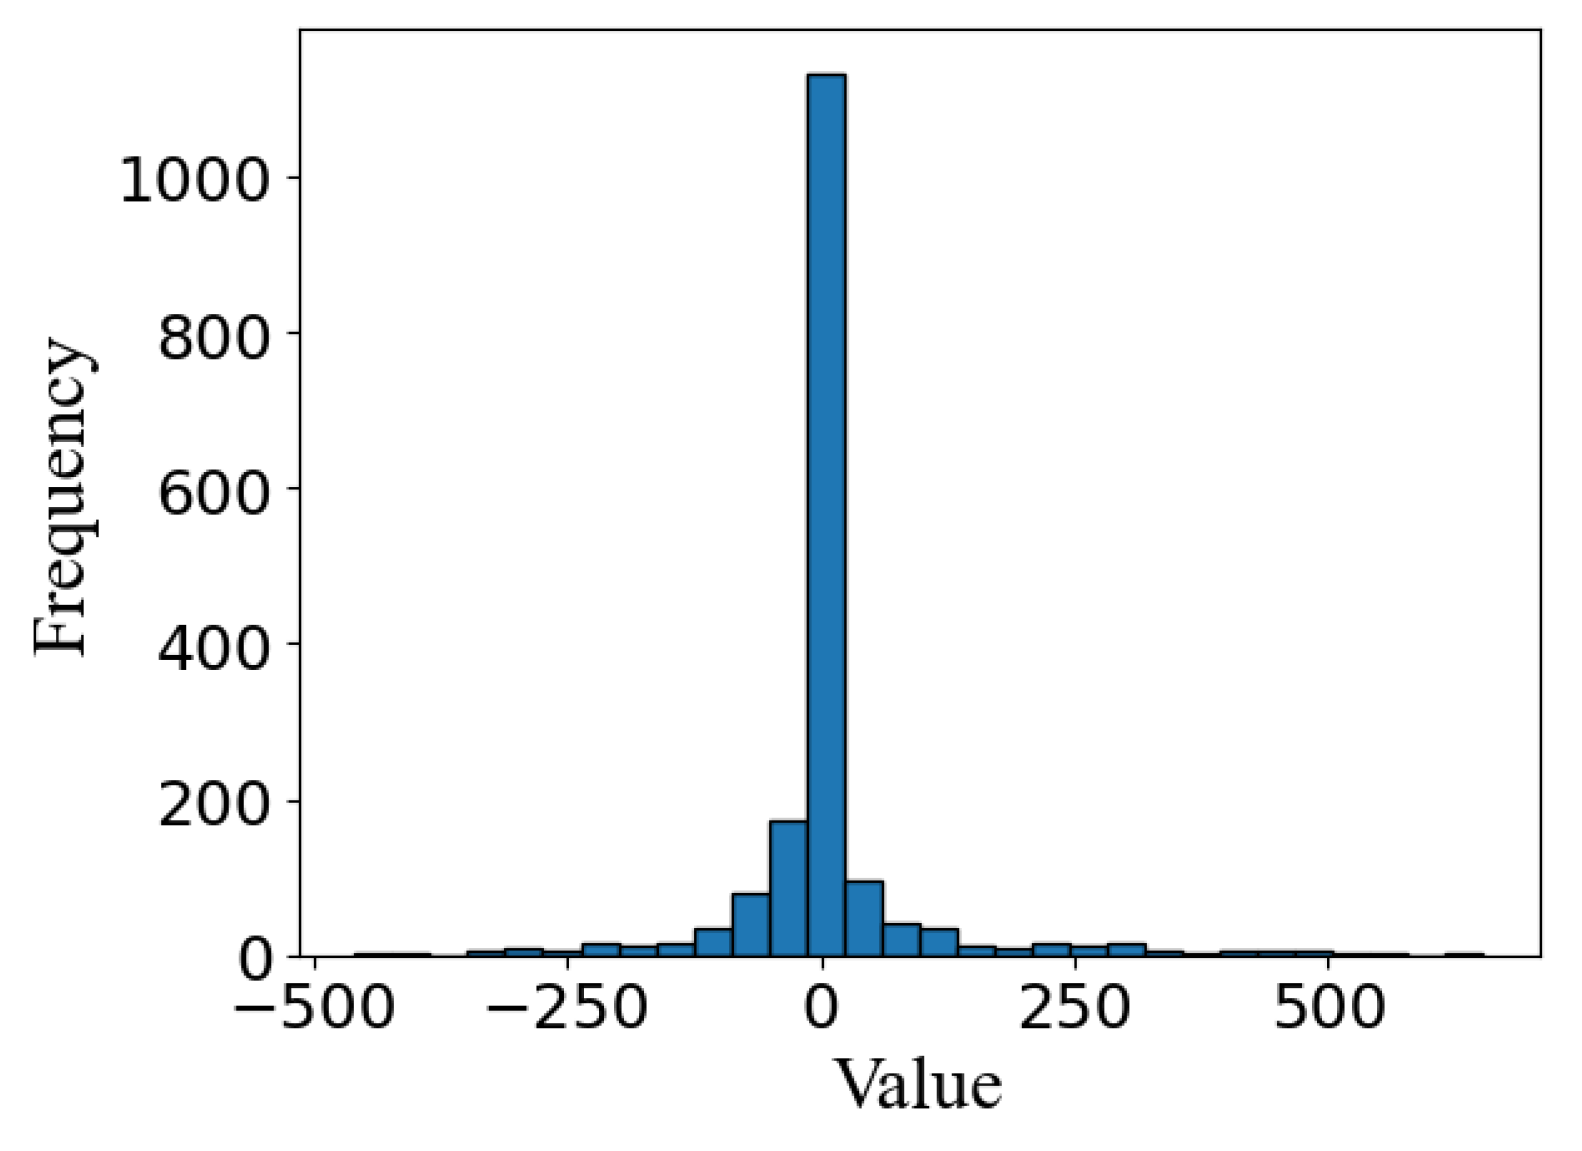
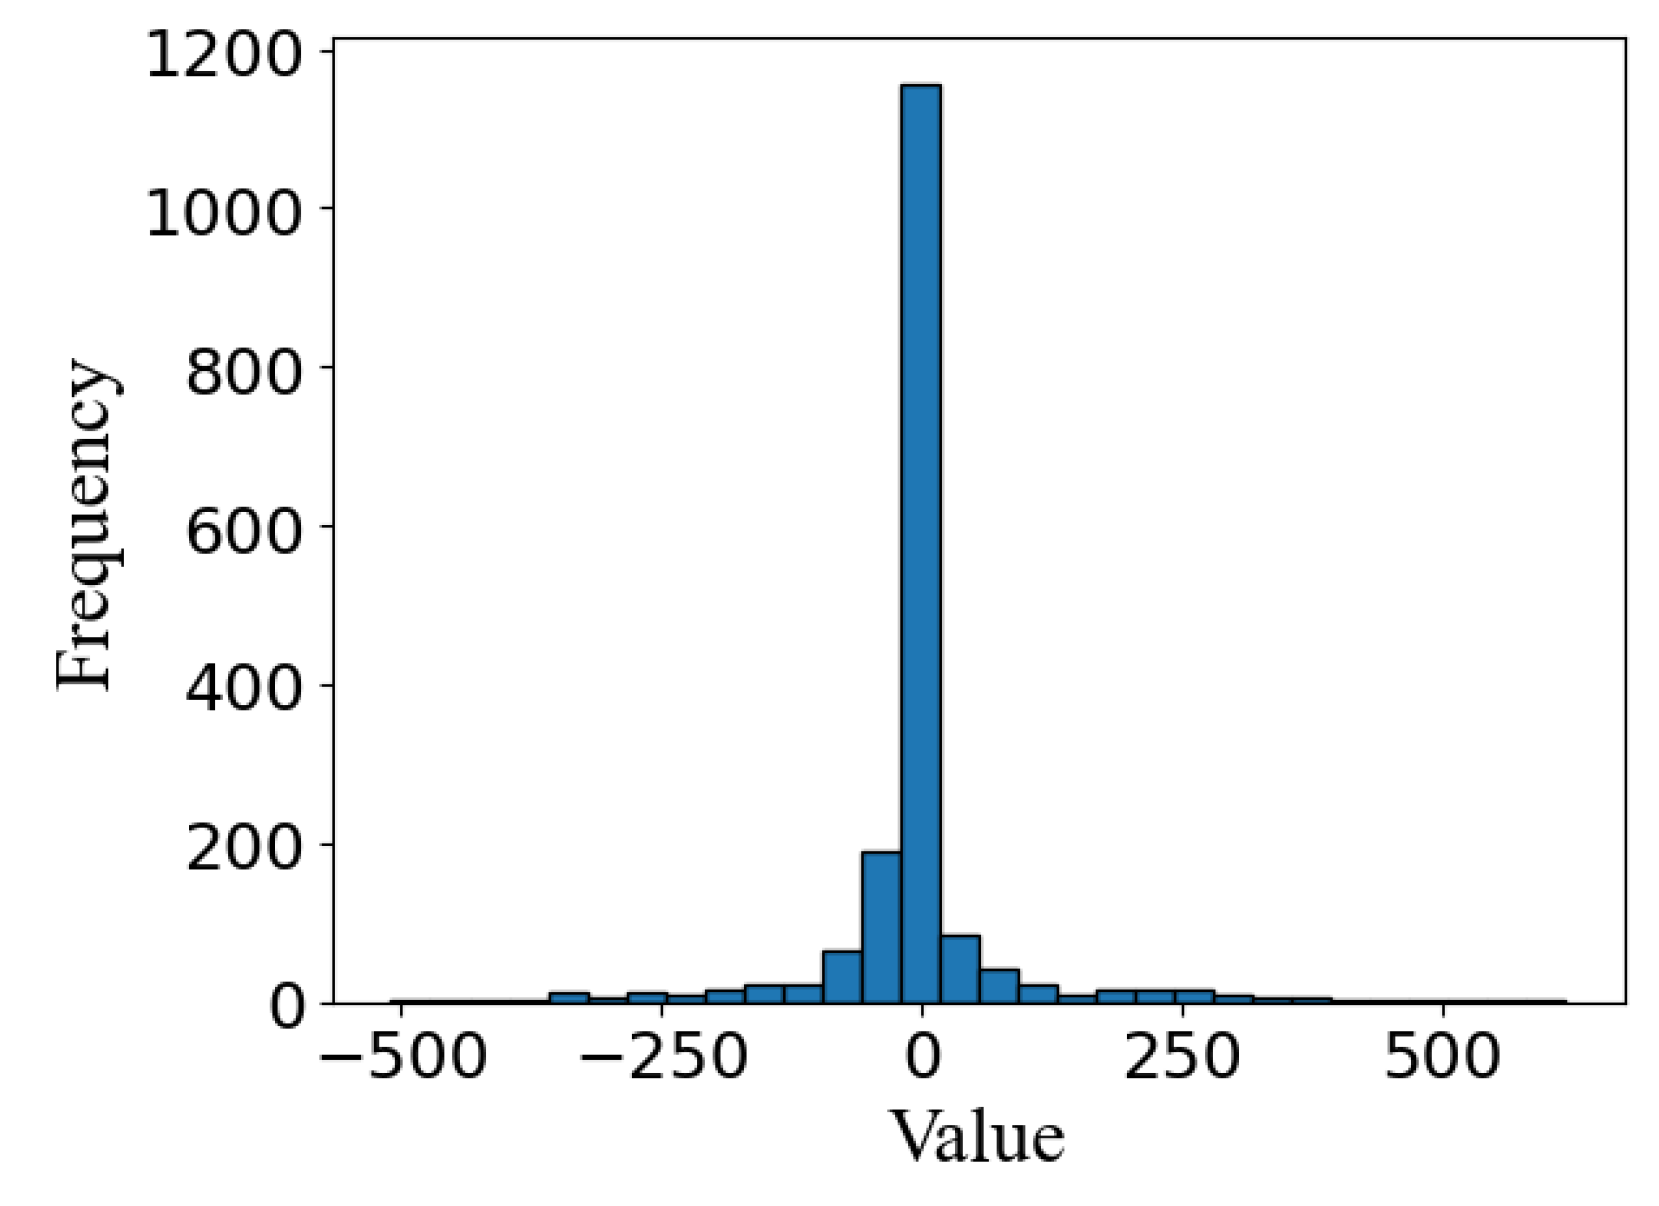
Figure 8 illustrates that the frequency of error for the one-day prediction has a high concentration of values surrounding zero, indicating high levels of model accuracy.
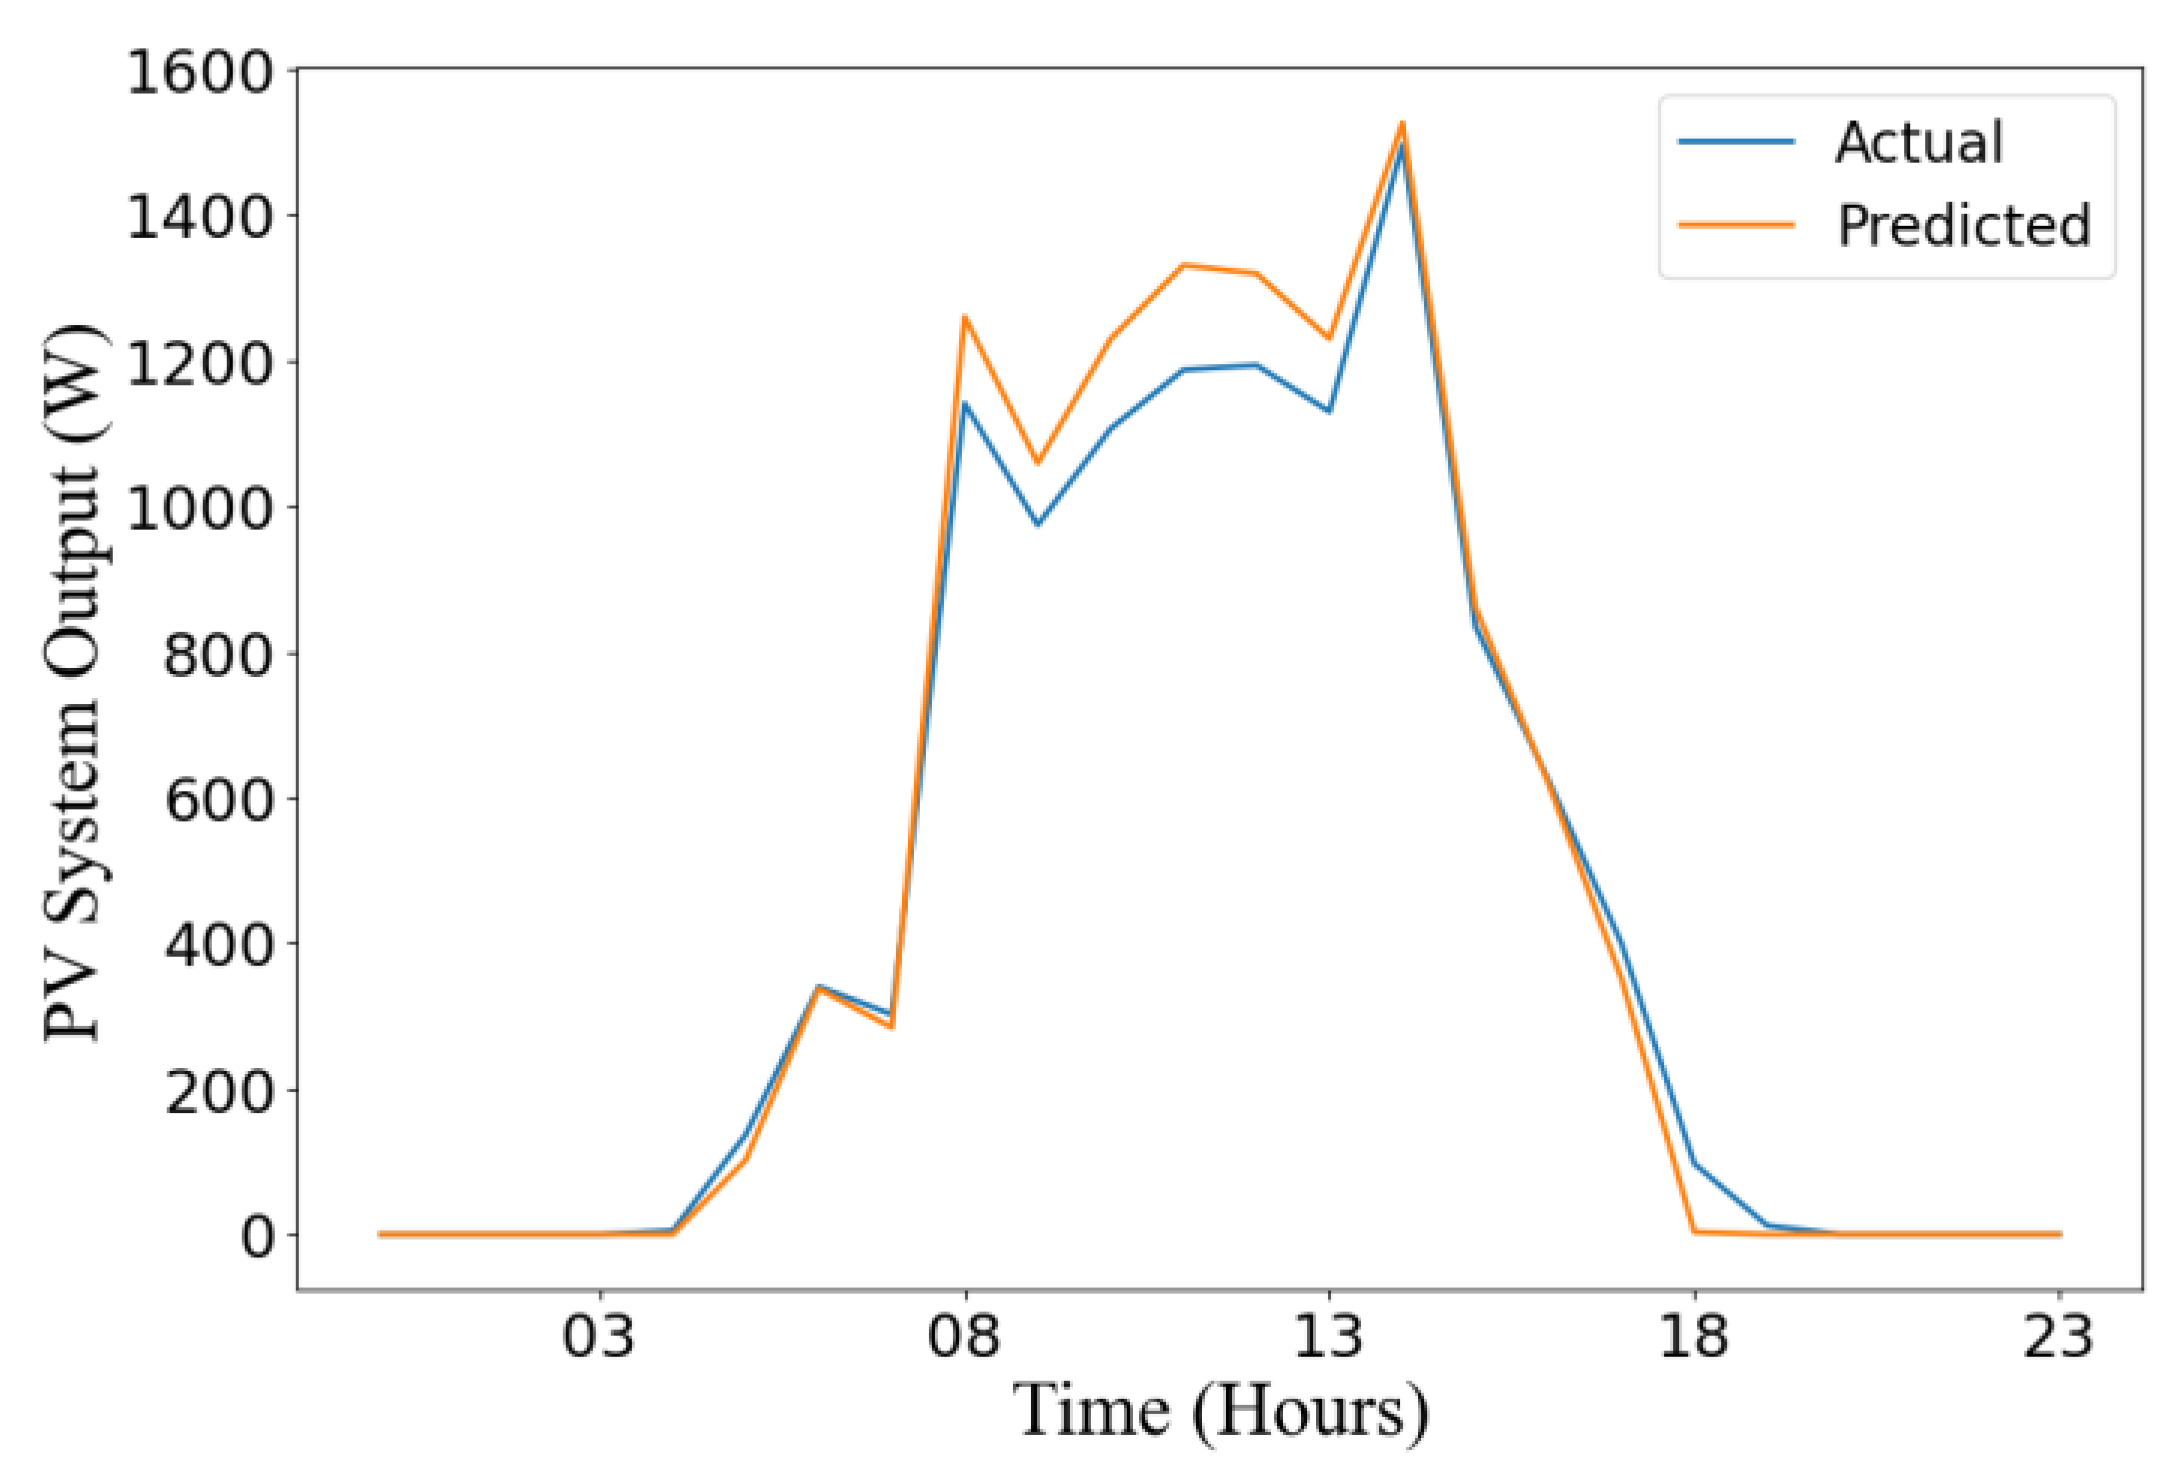
Figure 9 depicts the actual versus predicted results of PV system output over a span of 24 hours. The actual results are obtained from PVWatts, while the predicted output comes from the NN model. As depicted in the graph, the predictions shown are highly accurate, proving the effectiveness of the model.
3.2.2. Three-Day Prediction
Similarly to the one-day time frame, the performance of the model was also analyzed over a three-day period. The significance of performing predictions over a wider horizon is to strengthen the validity of how well the model performs over different time ranges. This proves that the model can provide accurate predictions for different time ranges, this will assist in future operational planning and energy management.
In
Figure 10, both training and validation loss also have an initial steep decrease. A decreasing trend for training loss indicates learning and improvement toward the training data. The model is also improving its predictions on unseen data for a three-day range, as evident by the decreasing validation loss.
Figure 11 showcases that the model can still perform at high levels of accuracy over three days because of the high concentration of zeros for the frequency of error. The results shown in
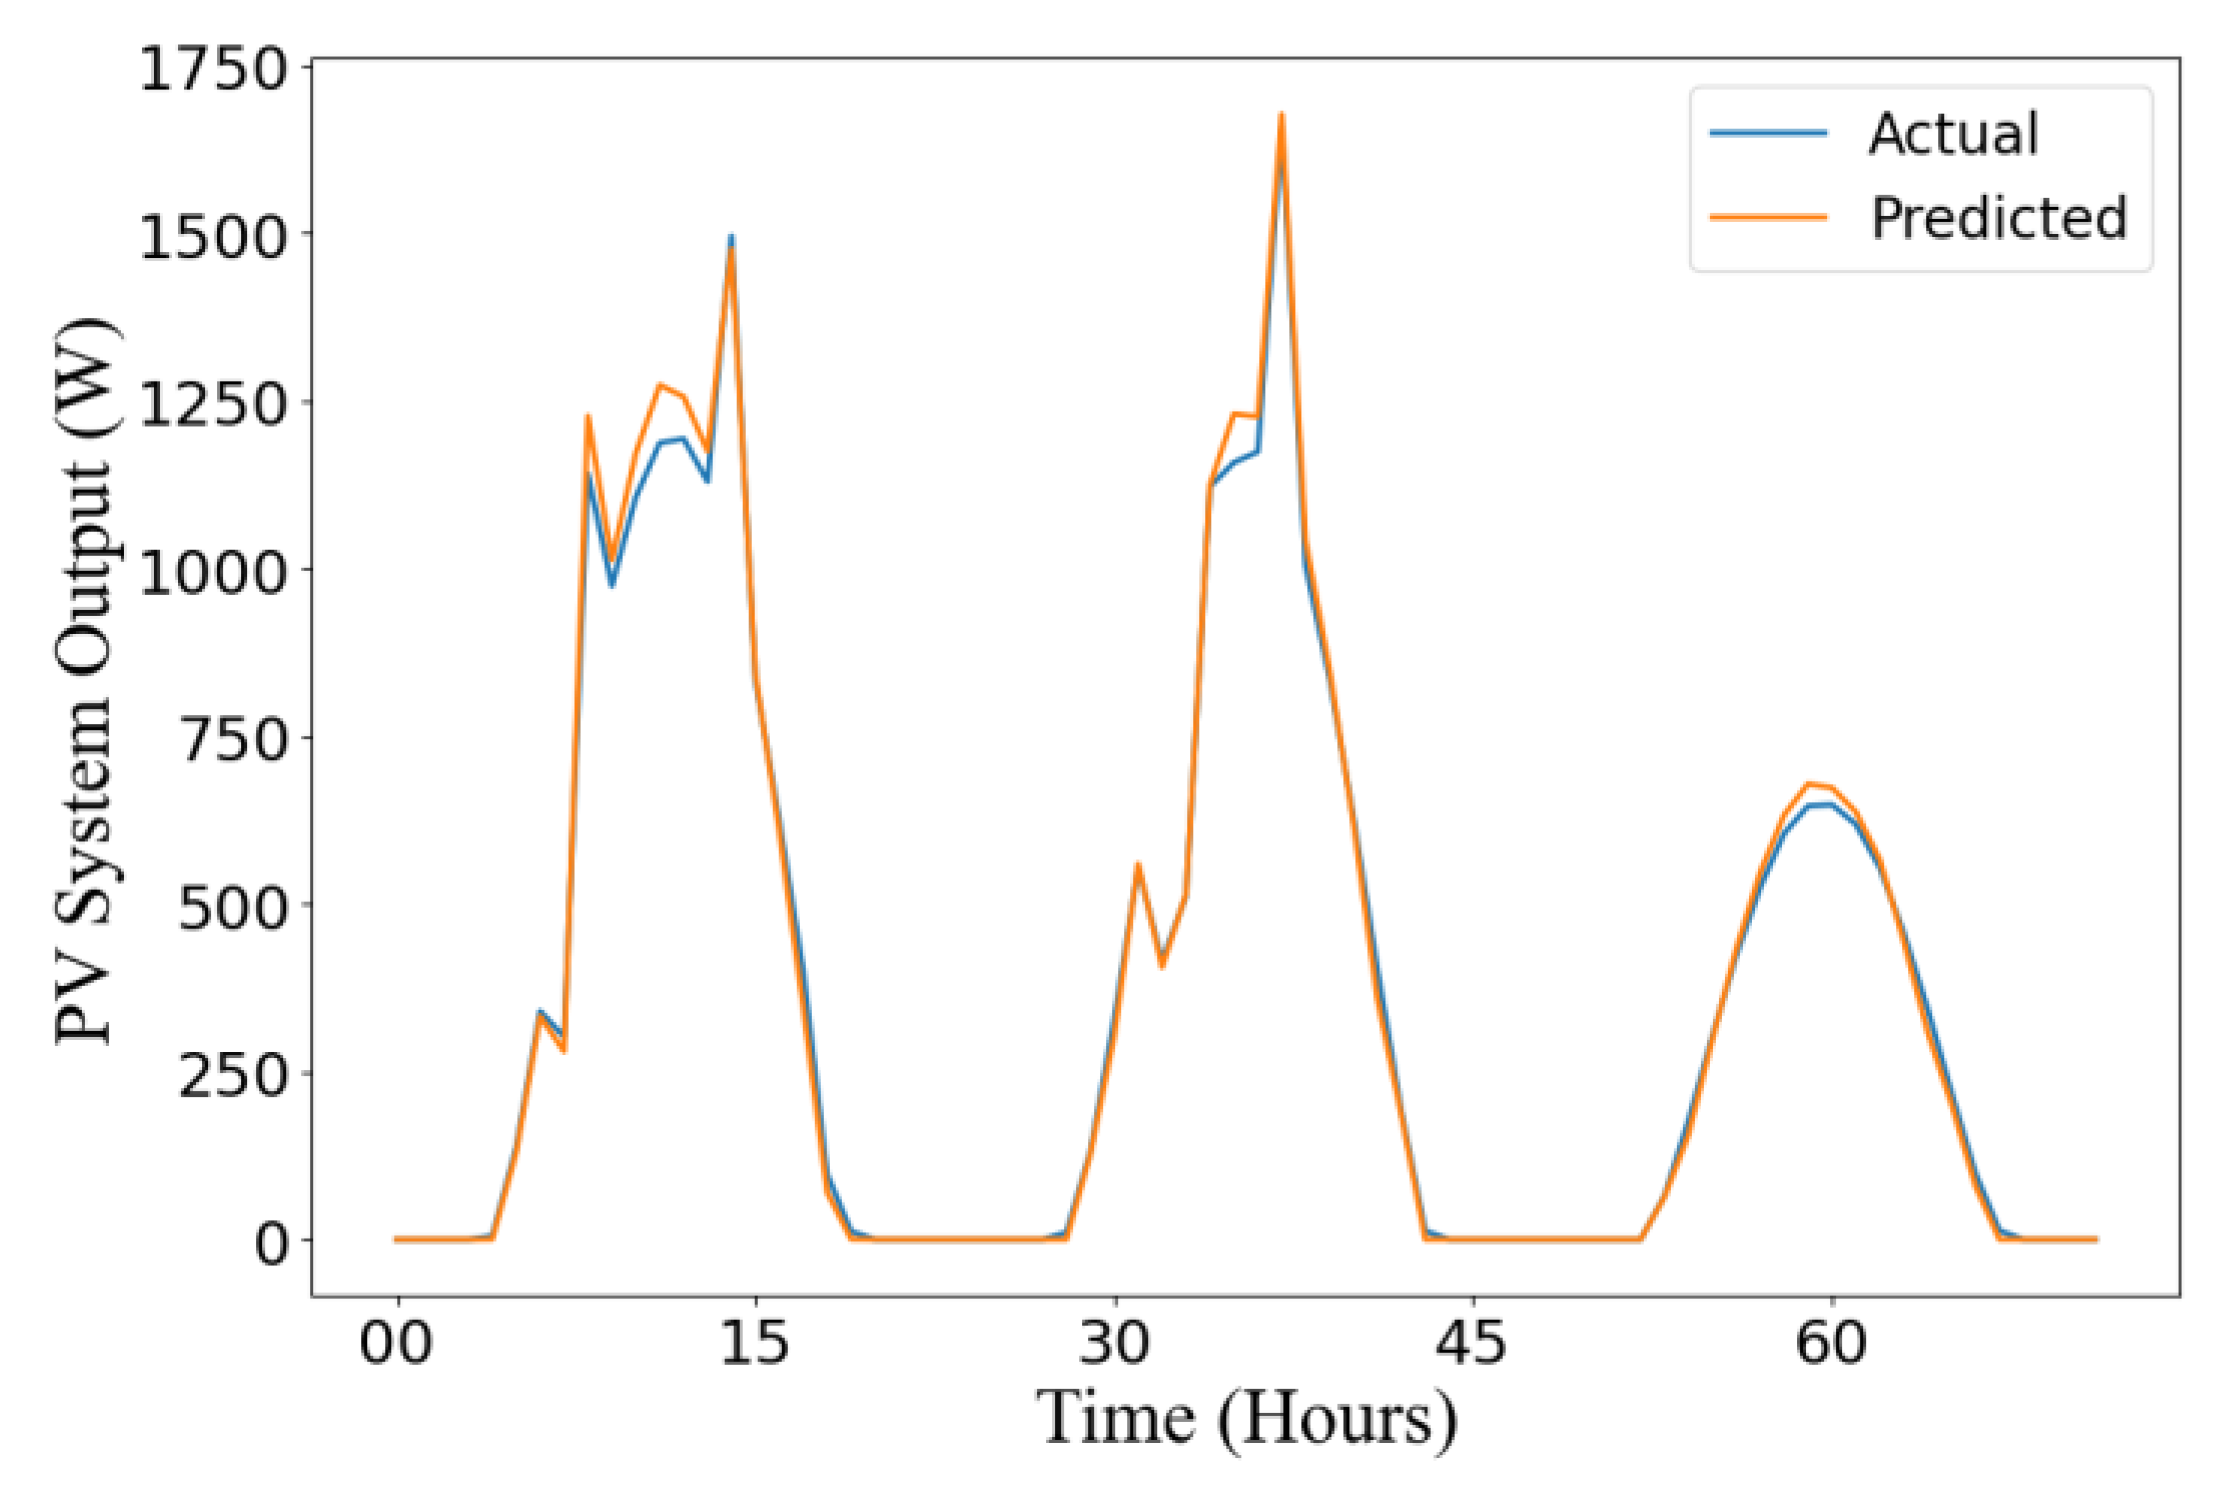
Figure 12 for the three-day predictions are similar to those for the one-day predictions, where the model produces highly accurate results.
3.3. Day-ahead Scheduling
The results from the optimization model show how the building’s energy demands for cooling, heating, and electricity are met. As shown in
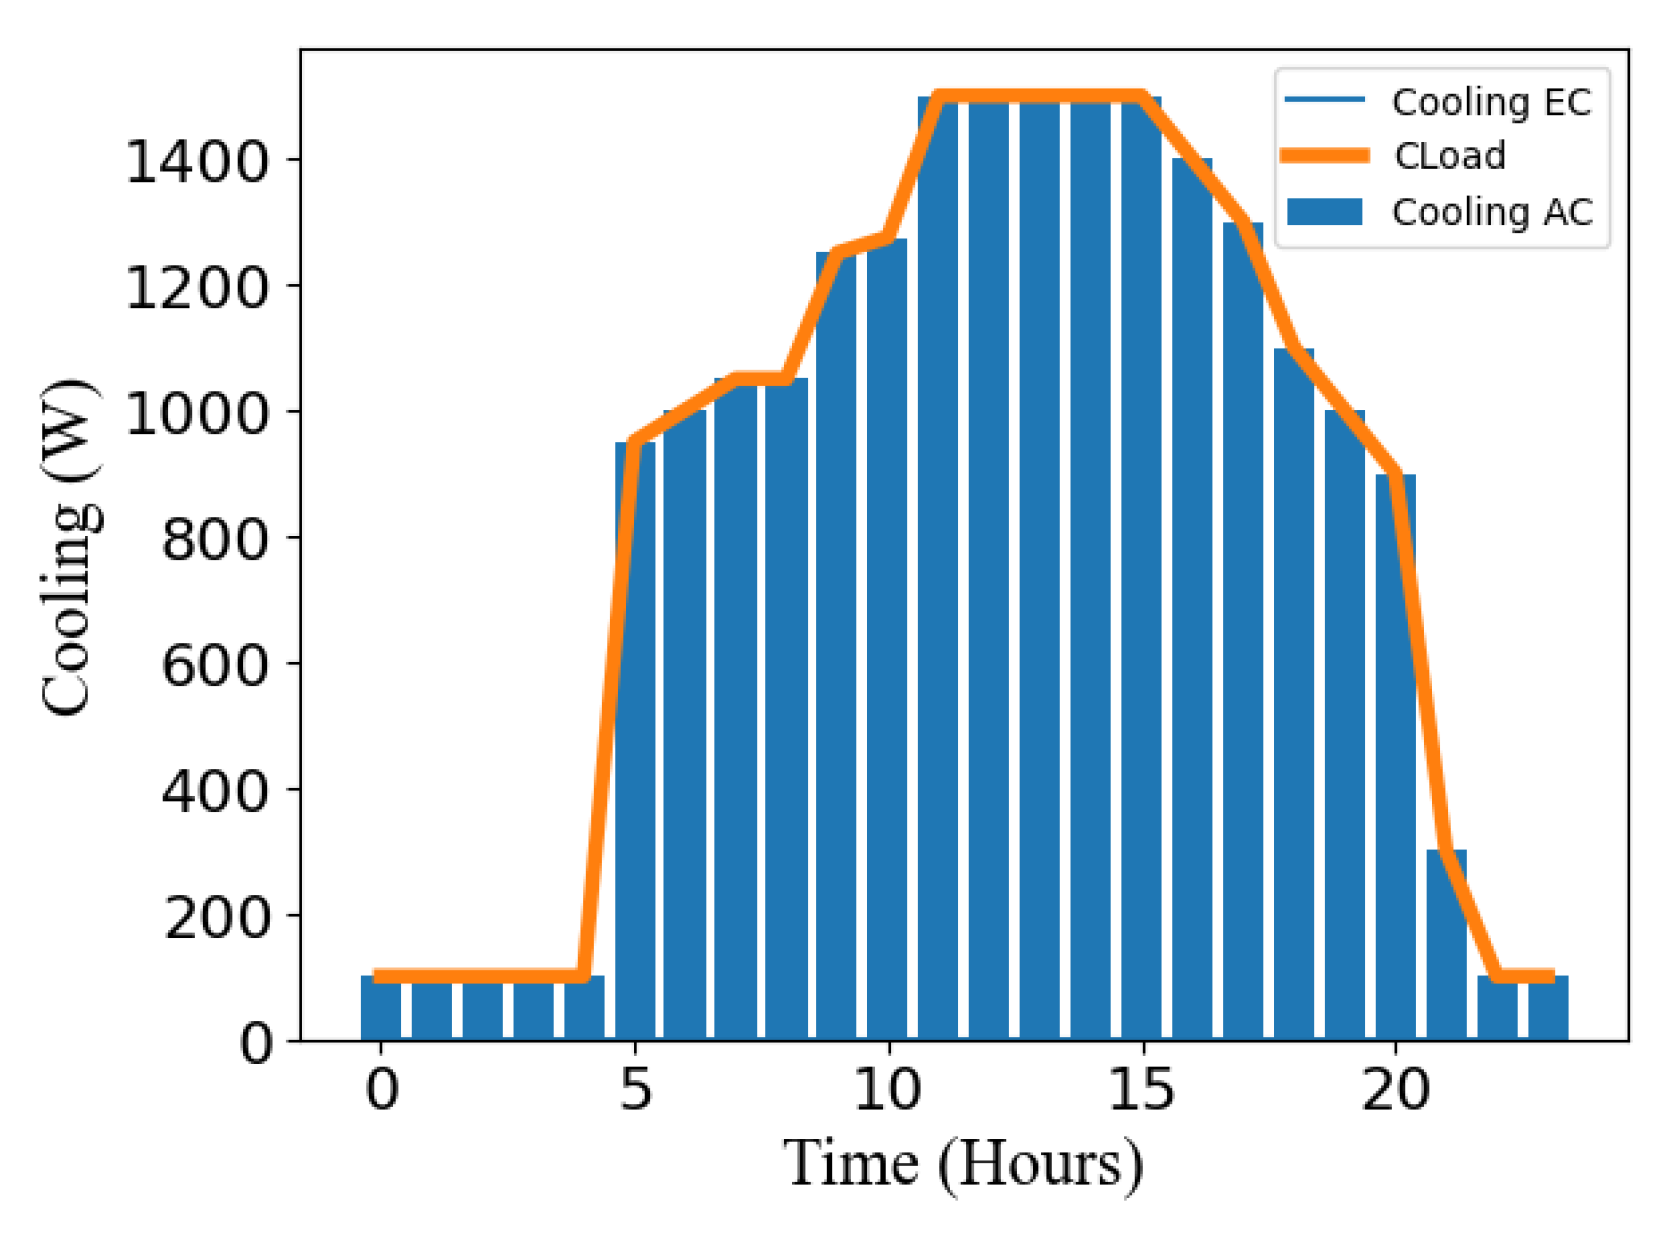
Figure 13, the cooling energy balance is always maintained, with the energy output precisely meeting the building’s cooling requirements. The energy supply is primarily provided by the AC rather than the EC, due to the former being more cost-effective.
In
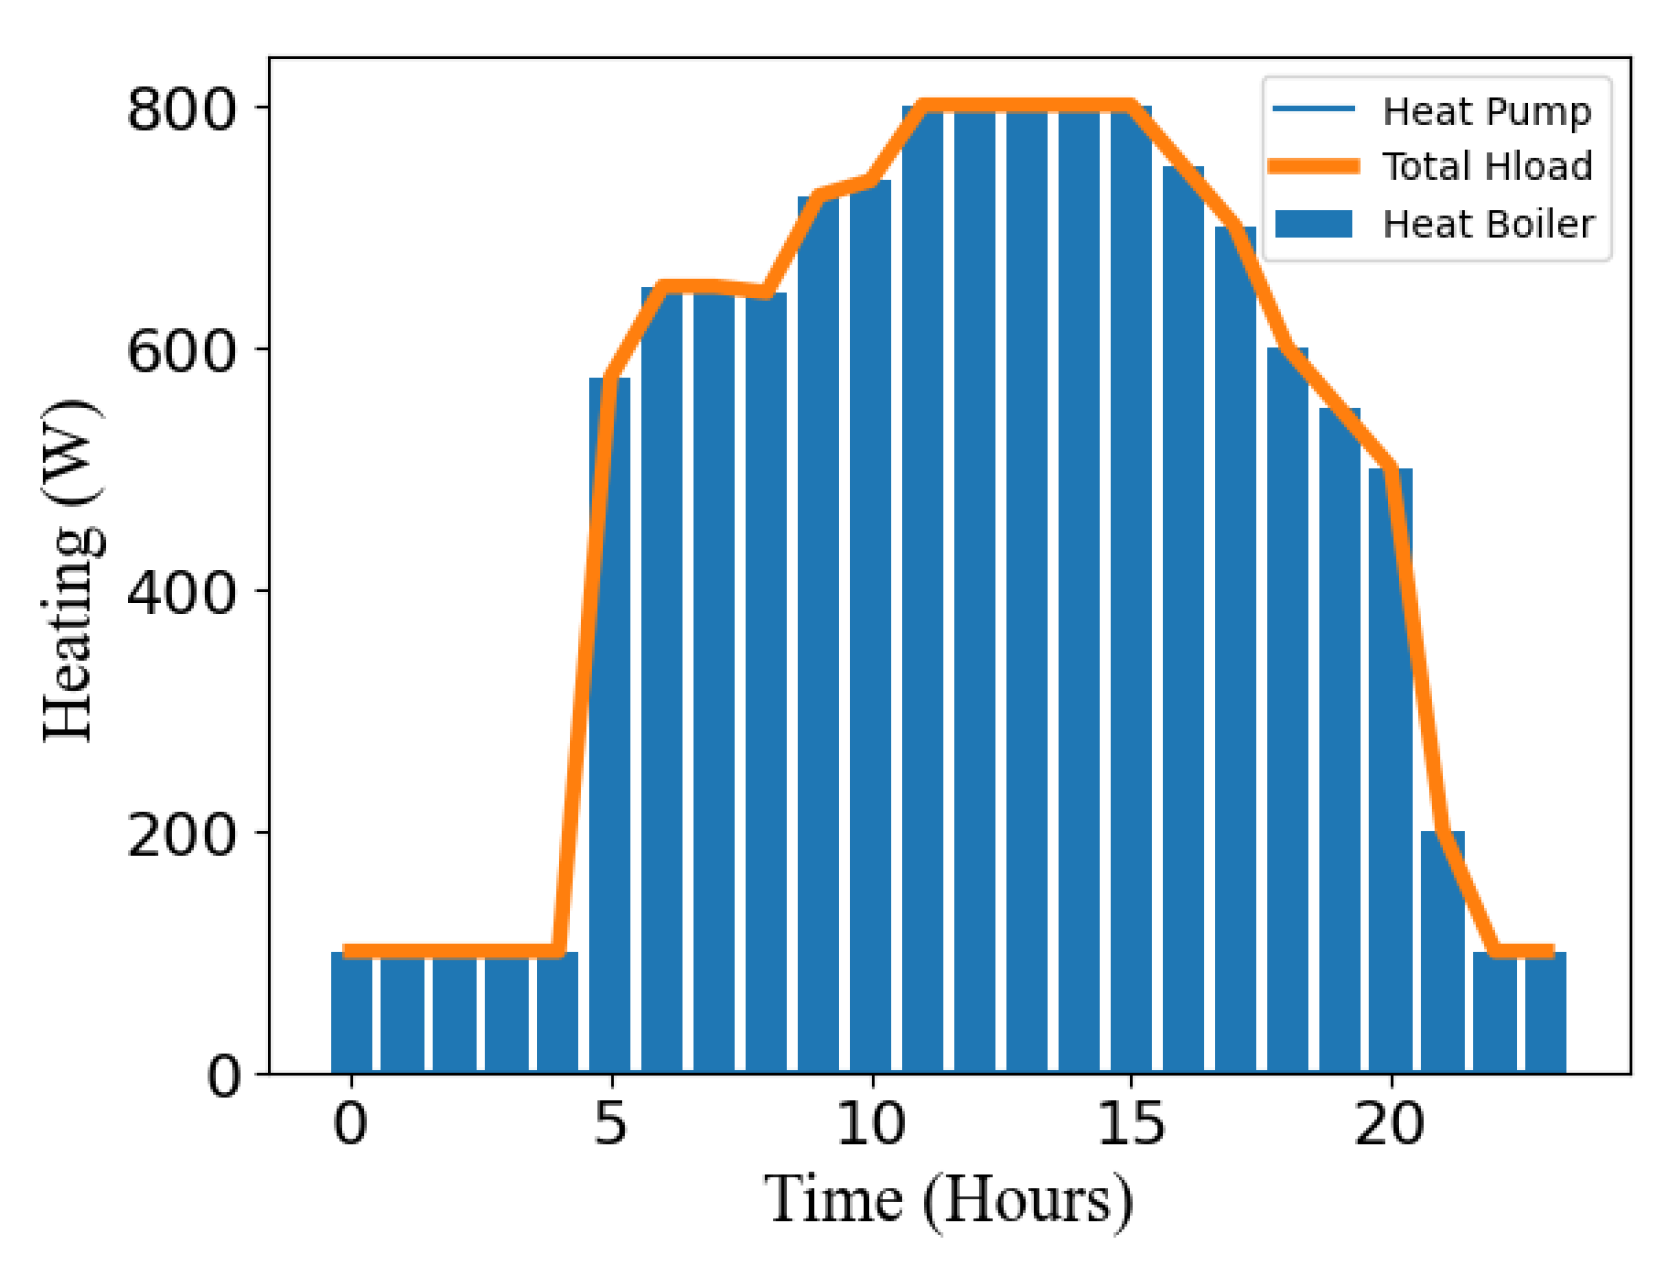
Figure 14, the optimization model ensures that the heating supply from the boiler meets the building’s heat load. The heat pump is not utilized, as the model adopts the most cost-effective approach to meet the building’s energy needs.
As given in (6), the electric power provided by the energy sources should equal the power demanded by the building.
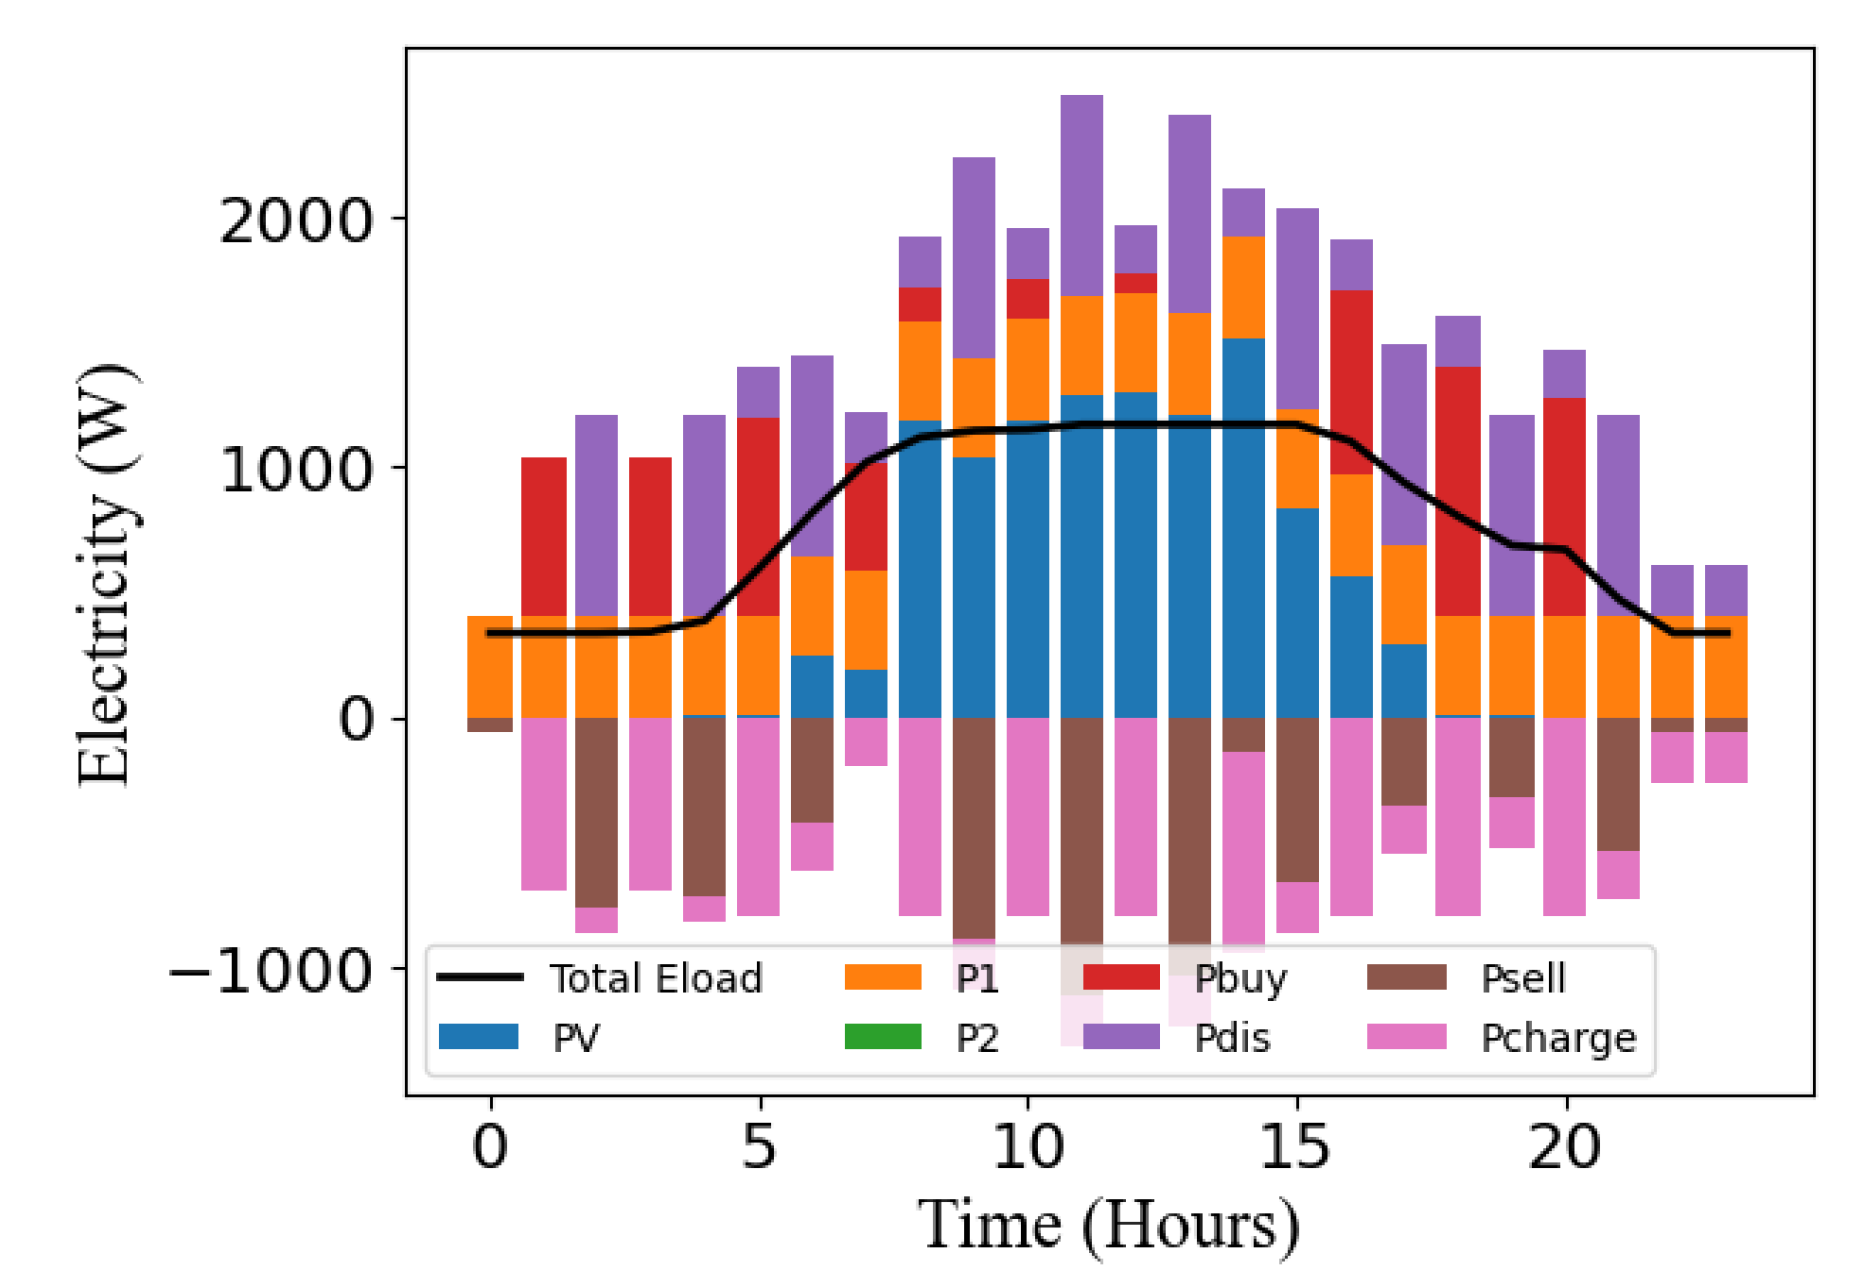
Figure 15 depicts this balance, showing that the sum of the building’s energy supply at every time step equals the demand, represented in the graph as the total electric load.
3.4. Three-Day-Ahead Scheduling
Similarly to the one-day results, the three-day optimization model demonstrates how the building’s energy demands are met. As shown in
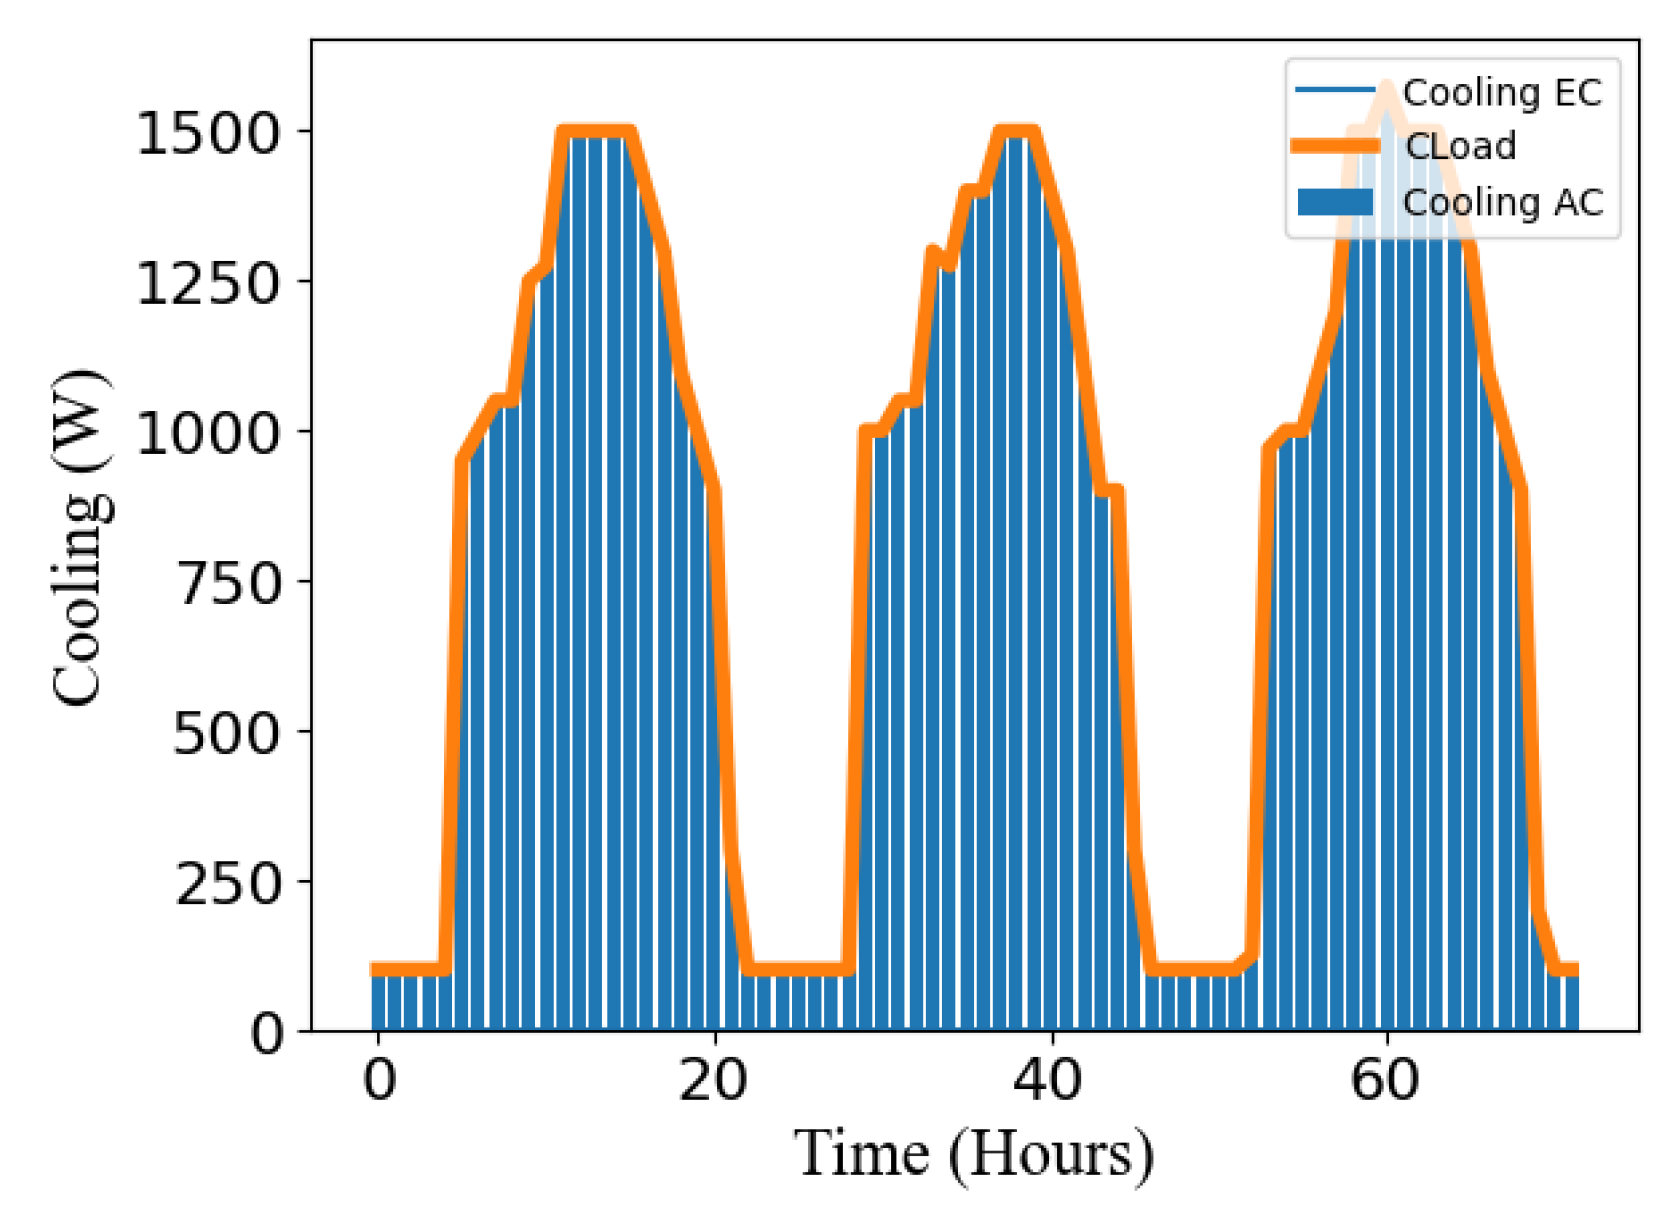
Figure 16, the cooling energy balance is maintained, with no surplus/shortage in energy output. Cost-effectiveness is achieved by sourcing the cooling energy supply from the AC.
In
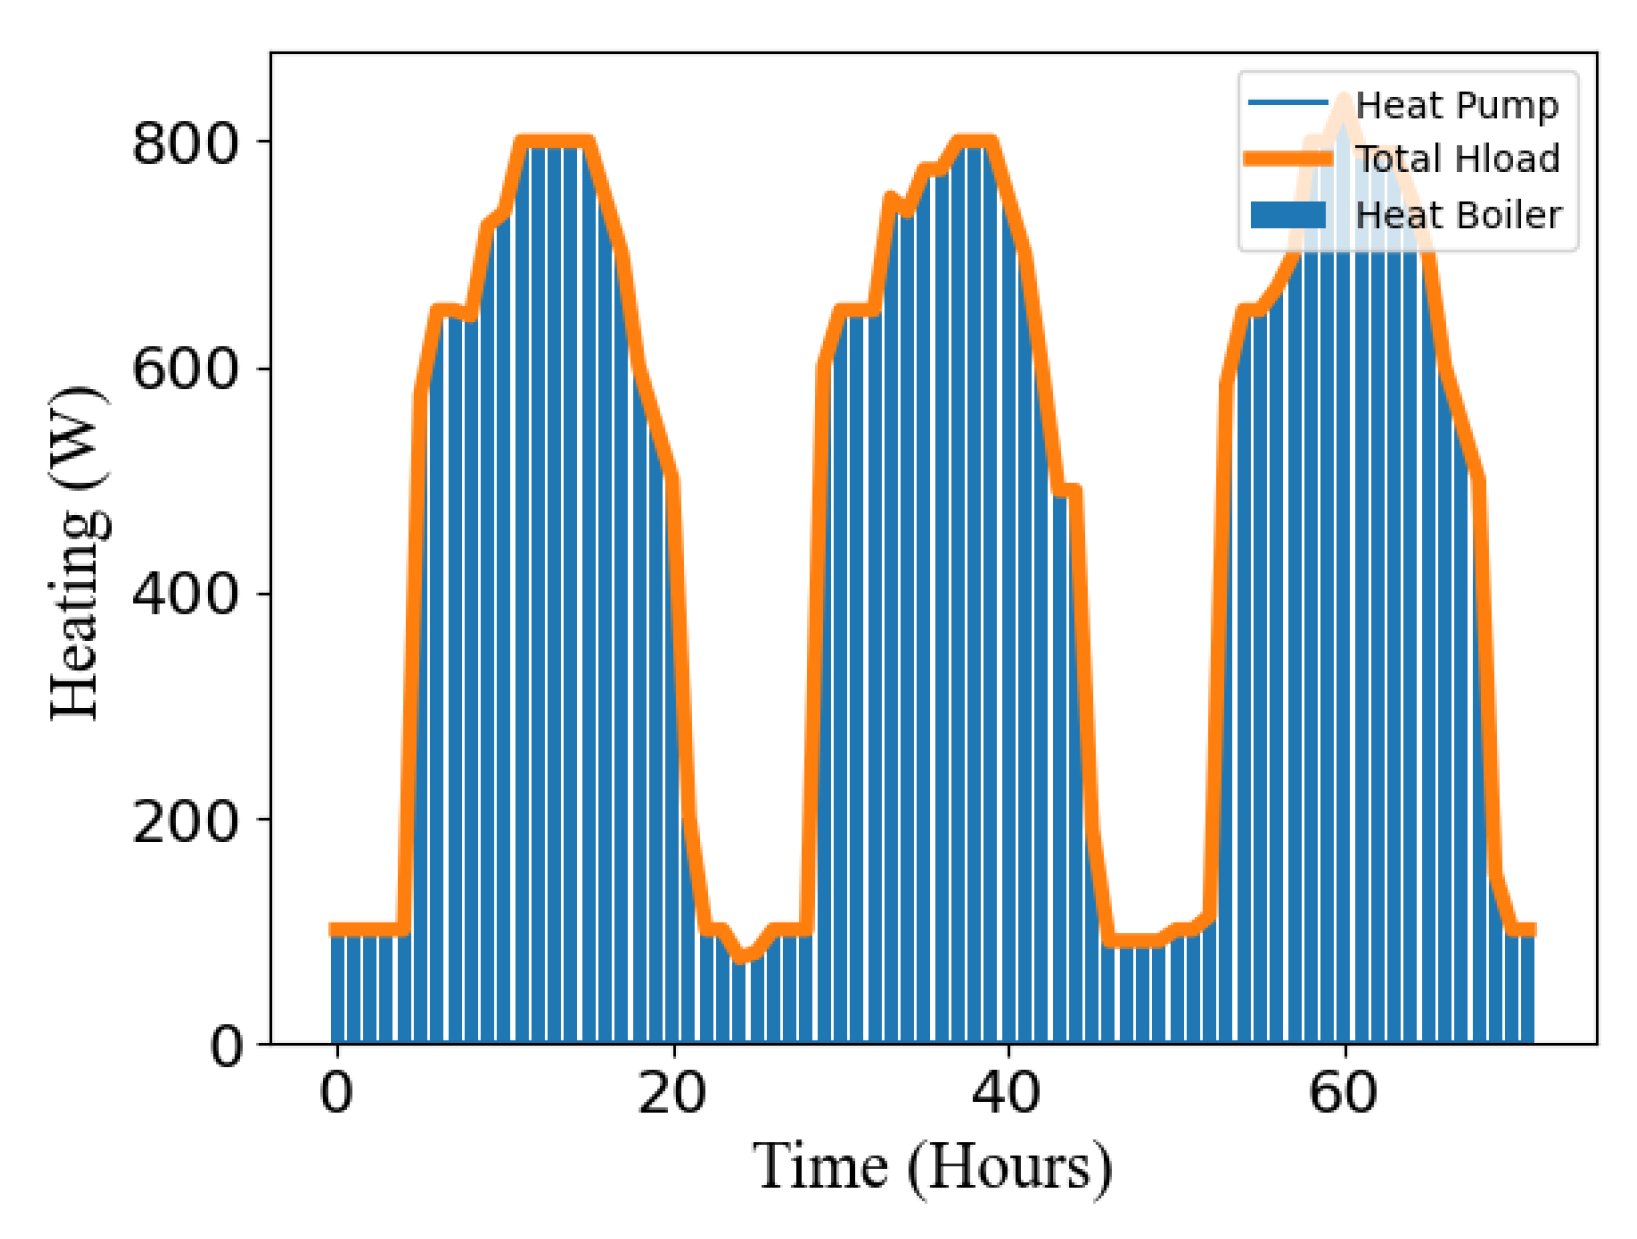
Figure 17, the optimization model guarantees that the building’s heat load requirements are being met by the boiler’s heating supply. The heat pump is not used, as the model recognizes that it would be a more costly option.
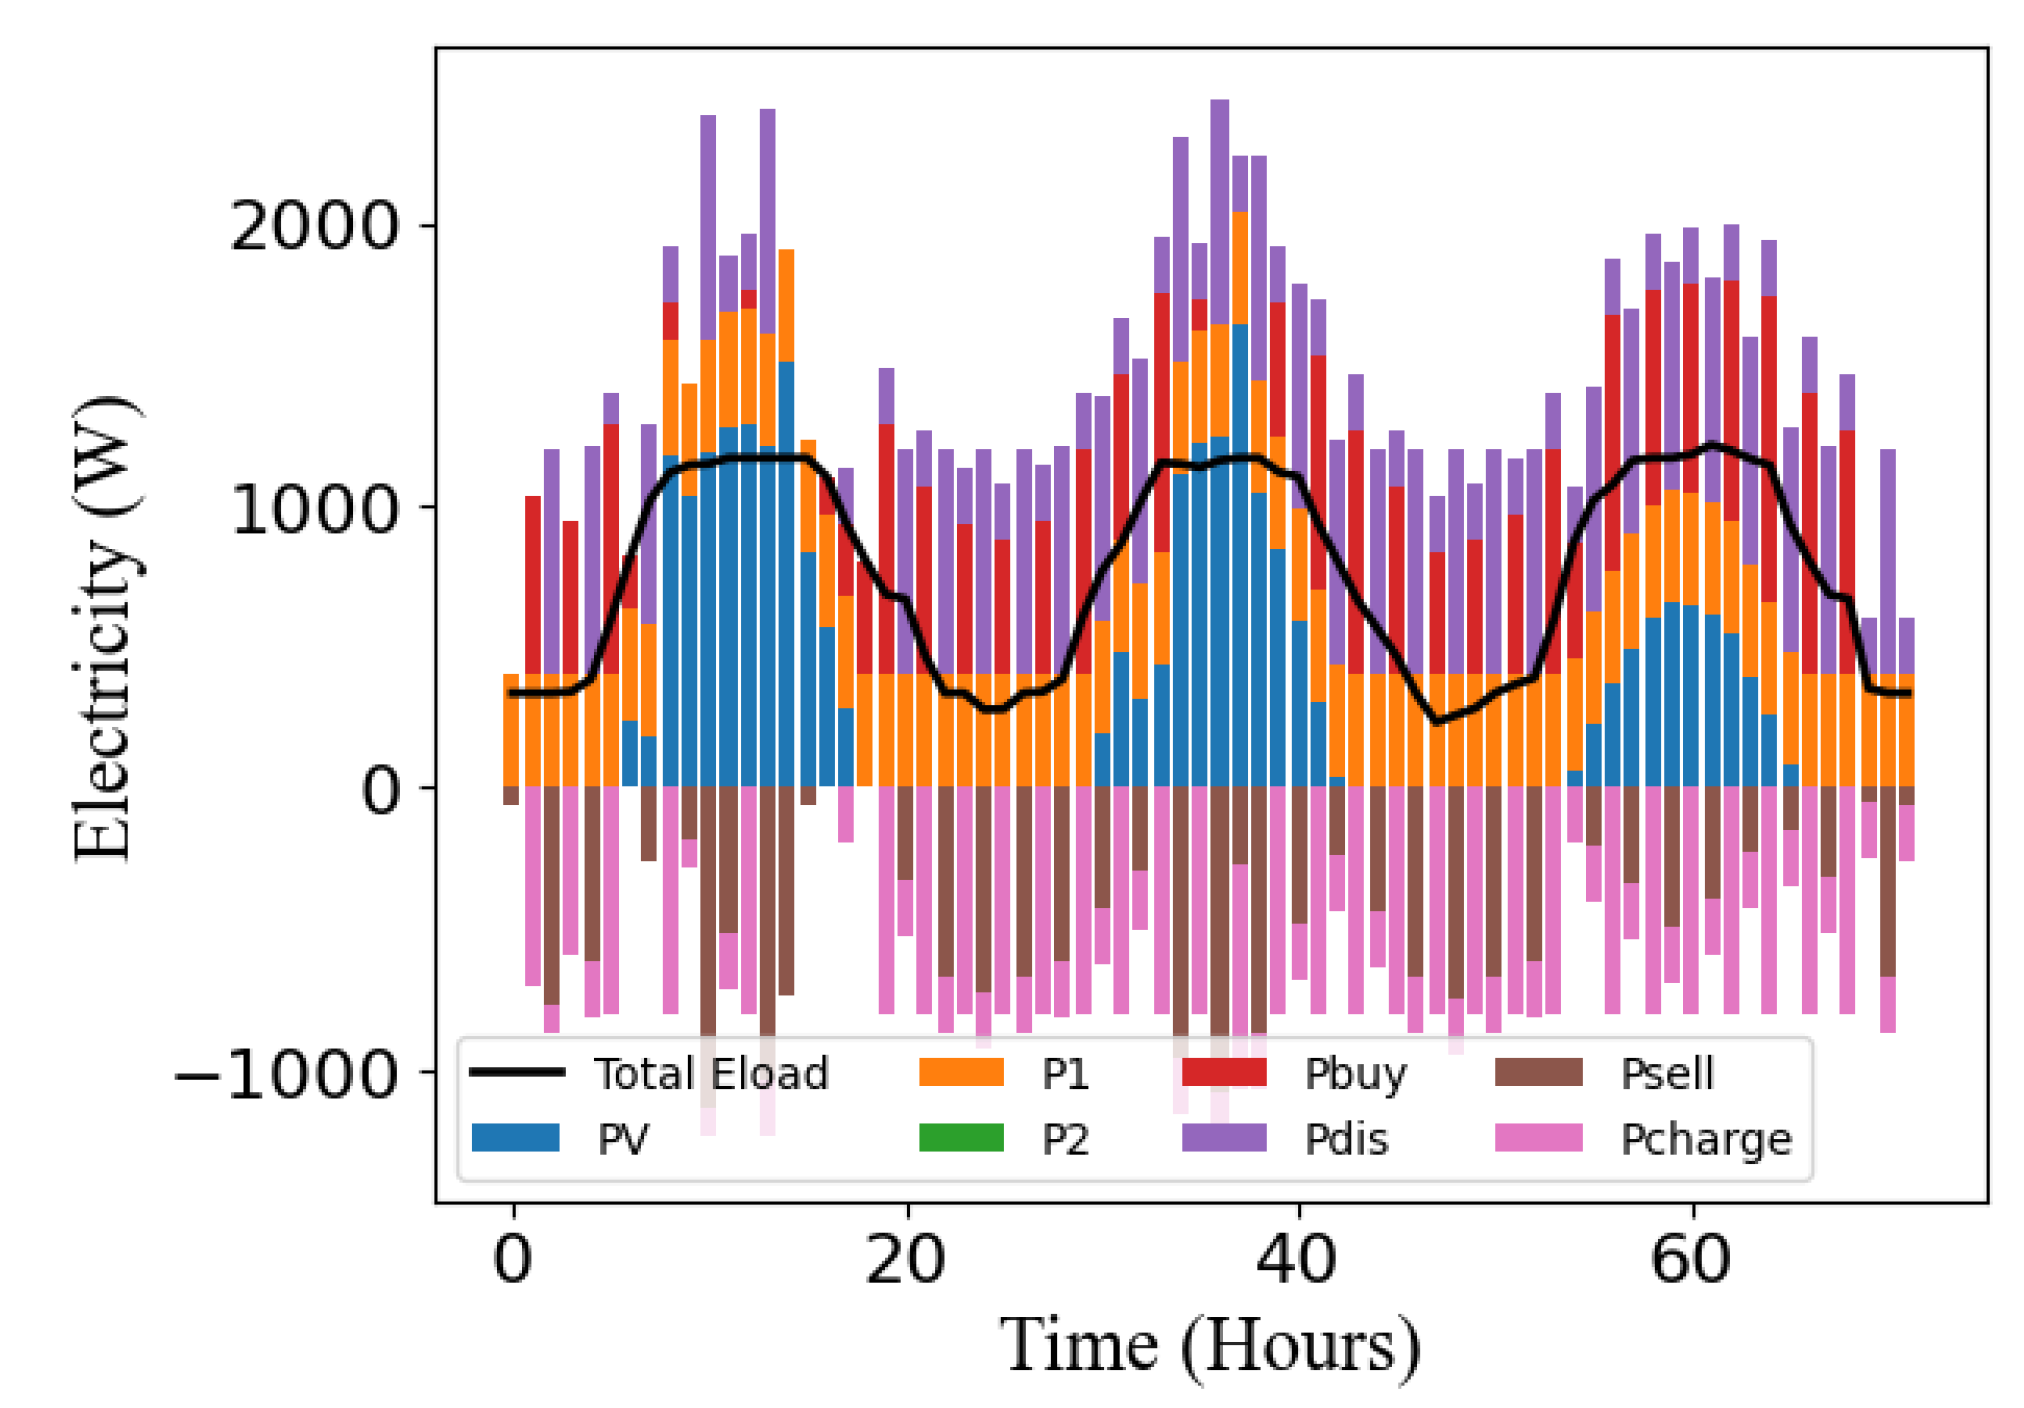
Finally, the electric power supplied by the energy sources must match the building’s power demand.
Figure 18 depicts this balance, showcasing that the total supply of energy at every time step is equal to the demand.
3.5. GUI Development
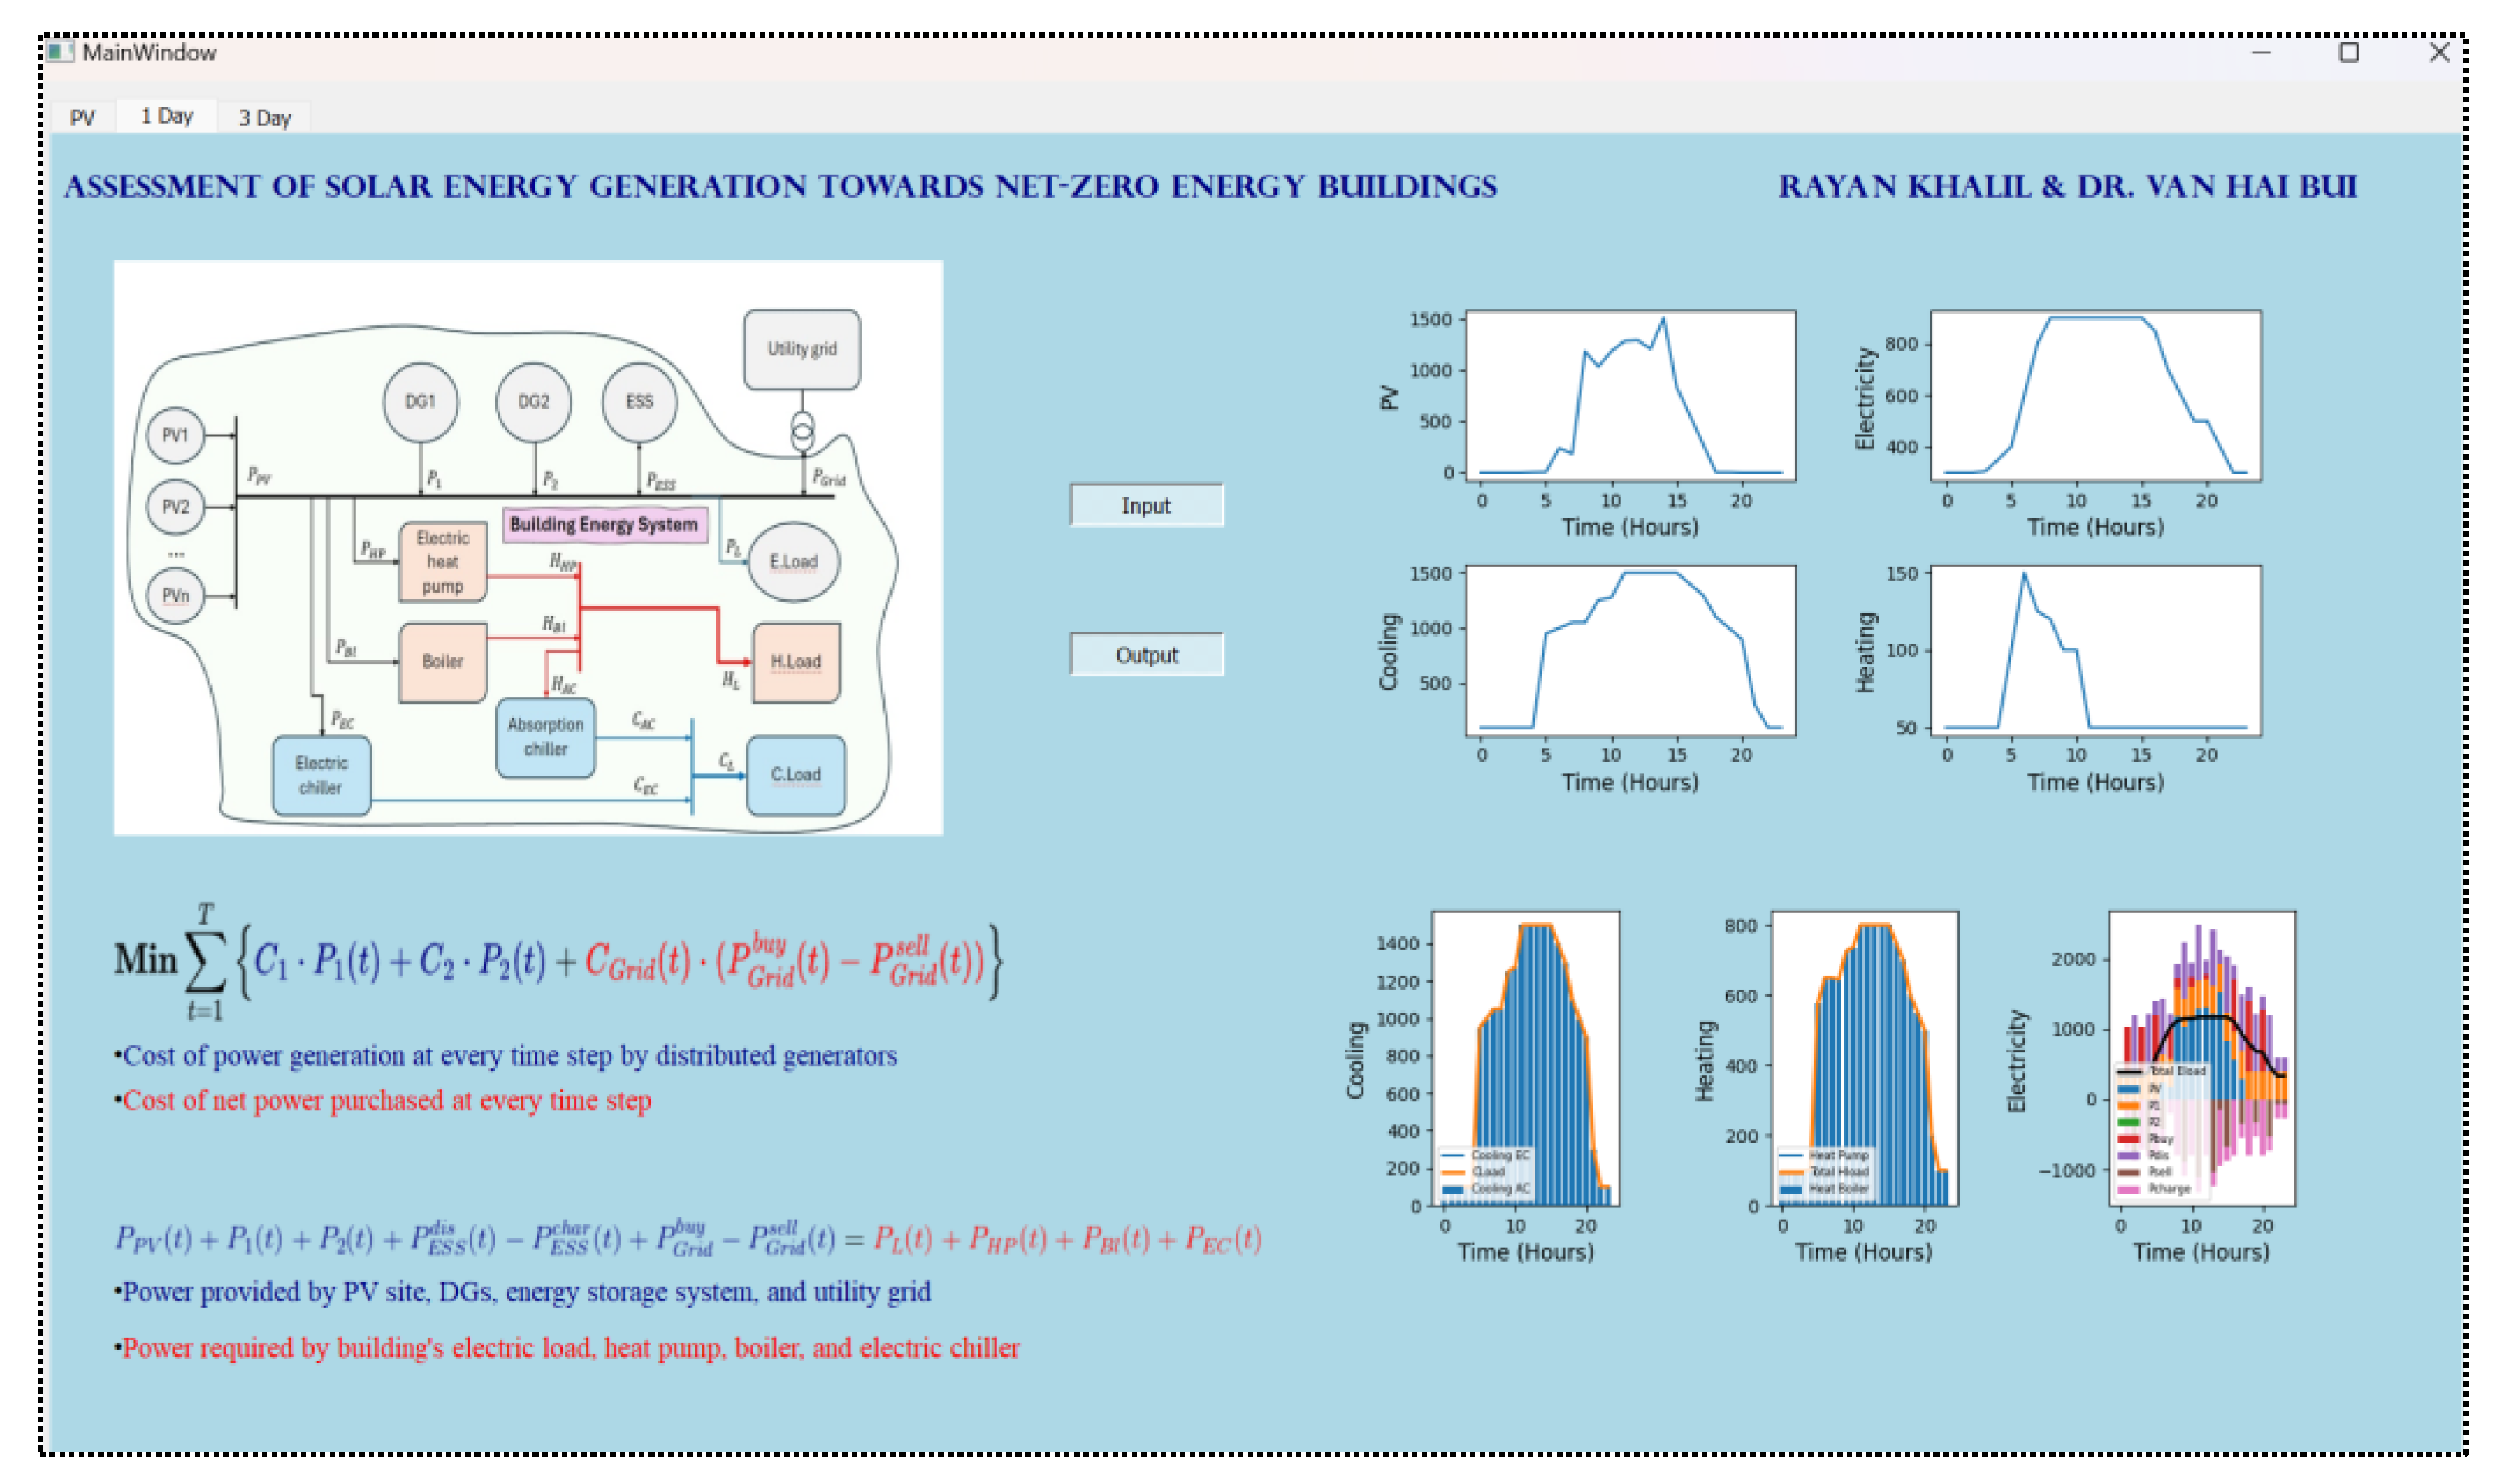
The development of a GUI significantly enhances the user experience by enabling the visualization of data and results. Users can interact with the interface to view both the input and output of the optimization model through graphical representations. In this study, different tabs are designed as shown in
Figure 19, which allows users to navigate easily through the results of the optimization model for both one-day and three-day data. Additionally, access to a dedicated tab enables users to retrain the neural network model and run the PV predictions for both one-day and three-day models. This tab includes a basic visual representation of the neural network model along with a summary detailing the number of neurons in each layer. To showcase model efficiency, a plot depicting the training and validation loss is displayed along with a histogram of the frequency of error.
The optimization model tabs hold key equations to further facilitate user comprehension of how the system optimizes building energy use. The visual of the project’s BES is also provided, illustrating how power is sourced and distributed throughout the building. The comprehensive design of the GUI ensures that users can interact seamlessly with the optimization and prediction framework and directly view the results. The future development of this GUI will allow for the integration of additional building energy demands, enabling the adaptation to more complex energy systems. The extended functionality will provide the visualization of energy solutions tailored to the unique requirements of each building. This will aim to further enhance the scalability, allowing the GUI to accommodate different building types and energy demands.
5. Conclusions
In this study, we developed a comprehensive optimization framework for the optimal operation of NZEBs, consisting of a prediction model and an optimization model. Initially, a neural network-based prediction model was trained with PV data to provide highly accurate estimated output power of PV systems, which was then fed into the optimization model. This model determines the optimal set-points for each component in the network and can accommodate various operational horizons, from one to three days. The framework not only minimizes operational costs but also reduces NZEBs’ dependence on external grids. Additionally, we developed a detailed GUI to visualize optimization outputs and monitor the system’s operational status, helping operators to track changes easily, particularly in emergency operation modes.
Future expansions could focus on the real-time operation of NZEBs using IoT devices and a data-driven control approach. Furthermore, incorporating multi-objective optimization that simultaneously addresses cost minimization and emission reduction could significantly enhance the economic and environmental sustainability of NZEB operations.
Author Contributions
Conceptualization, V.H.B.; methodology, R.K. and V.H.B.; software, R.K., G.V.H., and A.H.; validation, V.H.B. and W.S.; formal analysis, R.K., G.V.H., and A.H.; investigation, R.K. and V.H.B.; resources, G.V.H. and A.H.; data curation, R.K. and W.S.; writing—original draft preparation, R.K. and V.H.B.; writing—review and editing, R.K., G.V.H., A.H., and W.S.; visualization, R.K., G.V.H., and A.H.; supervision, V.H.B. and W.S.; project administration, V.H.B.; funding acquisition, V.H.B.. All authors have read and agreed to the published version of the manuscript.
Figure 1.
Energy building systems.
Figure 1.
Energy building systems.
Figure 2.
Correlation matrix illustrating the relationships between: beam irradiance, diffuse irradiance, ambient temperature, wind speed, and PV system output.
Figure 2.
Correlation matrix illustrating the relationships between: beam irradiance, diffuse irradiance, ambient temperature, wind speed, and PV system output.
Figure 3.
Correlation plots between beam irradiance, diffuse irradiance, and PV system output. a. PV output and beam irradiance; b. PV output and diffuse irradiance.
Figure 3.
Correlation plots between beam irradiance, diffuse irradiance, and PV system output. a. PV output and beam irradiance; b. PV output and diffuse irradiance.
Figure 4.
Correlation plots between ambient temperature, wind speed, and PV system output. a. PV output and ambient temperature; b. PV output and wind speed.
Figure 4.
Correlation plots between ambient temperature, wind speed, and PV system output. a. PV output and ambient temperature; b. PV output and wind speed.
Figure 5.
Input data for one-day simulation. 5a. PV data; 5b. Electricity data; 5c. Cooling data; 5d. Heating data.
Figure 5.
Input data for one-day simulation. 5a. PV data; 5b. Electricity data; 5c. Cooling data; 5d. Heating data.
Figure 6.
Input data for three-day simulation. a. PV data; b. Electricity data; c. Cooling data; 6d. Heating data.
Figure 6.
Input data for three-day simulation. a. PV data; b. Electricity data; c. Cooling data; 6d. Heating data.
Figure 7.
Training and validation loss for one-day prediction.
Figure 7.
Training and validation loss for one-day prediction.
Figure 8.
Frequency of errors for one-day prediction.
Figure 8.
Frequency of errors for one-day prediction.
Figure 9.
Actual vs. predicted output over 24 hours.
Figure 9.
Actual vs. predicted output over 24 hours.
Figure 10.
Training and validation loss for three-day prediction.
Figure 10.
Training and validation loss for three-day prediction.
Figure 11.
Frequency of errors for three-day prediction.
Figure 11.
Frequency of errors for three-day prediction.
Figure 12.
Actual vs. predicted output over 72 hours.
Figure 12.
Actual vs. predicted output over 72 hours.
Figure 13.
Optimization model cooling output over 24 hours.
Figure 13.
Optimization model cooling output over 24 hours.
Figure 14.
Optimization model heating output over 24 hours.
Figure 14.
Optimization model heating output over 24 hours.
Figure 15.
Optimization model electricity outputs over 24 hours.
Figure 15.
Optimization model electricity outputs over 24 hours.
Figure 16.
Optimization model of cooling output over 72 hours.
Figure 16.
Optimization model of cooling output over 72 hours.
Figure 17.
Optimization model of heating output over 72 hours.
Figure 17.
Optimization model of heating output over 72 hours.
Figure 18.
Optimization model of electricity output over 72 hours.
Figure 18.
Optimization model of electricity output over 72 hours.
Figure 19.
Developed GUI.
Figure 19.
Developed GUI.
Table 1.
Testing error comparison across three models.
Table 1.
Testing error comparison across three models.
| Models |
Testing Error (RMSE) |
| One-day prediction |
Three-day prediction |
Seven-day prediction |
| ARIMA |
244.09 |
182.37 |
194.16 |
| SVR |
291.23 |
200.03 |
191.97 |
| FNN |
63.07 |
61.37 |
195.93 |
| Models |
Testing Error (MAE) |
| 1 day |
3 days |
7 days |
| ARIMA |
143.25 |
103.64 |
119.5 |
| SVR |
206.59 |
103.4 |
107.13 |
| FNN |
43.62 |
41.37 |
113.45 |
| Models |
Testing Error (nRMSE) |
| 1 day |
3 days |
7 days |
| ARIMA |
0.163 |
0.110 |
0.066 |
| SVR |
0.194 |
0.120 |
0.066 |
| FNN |
0.042 |
0.037 |
0.067 |
