Preprint
Article

Climate Change Risks Impacts on Public Health Correlated with Air Pollution, African Dust in South Europe

Altmetrics

Downloads

51

Views

34

Comments

0

This version is not peer-reviewed

Submitted:

14 October 2024

Posted:

15 October 2024

You are already at the latest version

Alerts
Abstract
Climate change poses a significant risk to the environment and public health, leading to extreme weather patterns, rising sea levels, and loss of biodiversity. The relationship between air pollution from African dust and climate change demonstrates its critical role in trapping heat in the atmosphere, resulting in heat-related illnesses, heart problems, and respiratory issues. This Research points to the detrimental effects of pollutants such as smog, dust, acid rain, and ozone depletion on ecosystems, highlighting the importance of using Geographically Weighted Regression modeling and MODIS-NDVI analysis to address air pollution. Particulate Matter (PM 2.5-10) and ozone levels can have negative impacts on respiratory and cardiovascular health. Proactive steps, such as implementing clean energy technologies and enforcing stricter pollution regulations, are necessary to protect public health. Acting is crucial to addressing these global challenges and creating a cleaner, healthier future for future generations, underscoring the need for climate justice commitment.
Keywords: 
Subject: Environmental and Earth Sciences  -   Pollution

1. Introduction

Strong seasonal winds lift more than 180 million tons of dust out of the Sahara Desert and send it out of North Africa annually. However, the dust also travels elsewhere, either drifting toward Europe or returning to other parts of Africa, [1]. The Visible Infrared Imaging Radiometer Suite (VIIRS) on board the NOAA-20 satellite recorded the increasing display of dust particles in the atmosphere. According to the Copernicus Atmosphere Monitoring Service, the majority of the dust that reaches Europe will probably be concentrated, and when the dust plume interacts with a weather front, it may result in "mud rain", [2]. The dust storm follows an intense event over southern and central Europe. That storm's Saharan dust covered the snow in the Pyrenees and Alps, turning the skies orange. The dust has the potential to worsen air quality and hasten snowmelt. However, it also has a significant impact on Earth's biological processes and climate, reflecting and absorbing solar radiation and supplying ocean ecosystems with iron and other minerals that are necessary for plants and phytoplankton to flourish, [3]. Satellite data plays a crucial role in understanding vegetation health. The Moderate Resolution Imaging Spectroradiometer (MODIS) provides valuable insights using the Normalized Difference Vegetation Index (NDVI). This index is vital for monitoring green cover and assessing ecosystems’ health. It offers a lens through which we can examine the impact of air pollution and climate change on public health. Healthy vegetation absorbs carbon dioxide, producing oxygen and thus ensuring air quality. However, pollutants such as smog, dust, and particulate matter can seriously impede this process. Thus, understanding vegetation stress through MODIS-NDVI analysis becomes essential. It helps reveal the intersecting impacts of climate change and air pollution. Climate change worsening air pollution issues. Increased temperatures and variable weather conditions affect the dispersion of pollutants. This situation poses significant public health risks, in particular for respiratory and cardiovascular diseases. Climate change is a pressing issue that has far-reaching impacts on both public health and environmental sustainability. The link between climate change and air pollution is well-established, with air pollutants such as carbon dioxide, methane, and nitrous oxide contributing to the greenhouse effect and global warming. These pollutants are primarily produced by human activities such as burning fossil fuels for energy, industrial processes, transportation, and agriculture [4]. Earth's temperature continues to rise due to these greenhouse gases, we are seeing increased frequency and intensity of extreme weather events such as heat waves, hurricanes, and wildfires [5]. These events not only pose direct risks to human health but also exacerbate air pollution levels by releasing particulate matter and other harmful pollutants into the atmosphere. The impacts of climate change and air pollution on public health are diverse and profound. Respiratory illnesses such as asthma, chronic obstructive pulmonary disease (COPD), and lung cancer are on the rise due to poor air quality caused by increased levels of pollutants in the atmosphere [6]. Extreme heat events can also lead to heat-related illnesses and even death, particularly among vulnerable populations such as the elderly, children, and low-income communities. In addition to the direct health impacts, climate change and air pollution also have significant implications for environmental sustainability [7]. Rising temperatures and shifting weather patterns can disrupt ecosystems, leading to loss of biodiversity and threats to food security [8]. Increased air pollution can harm wildlife and vegetation, further exacerbating environmental degradation [9]. Addressing the interconnected challenges of climate change, air pollution, and public health requires a multi-faceted approach. Policies aimed at reducing greenhouse gas emissions, transitioning to renewable energy sources, improving air quality standards, and promoting sustainable development practices are essential for mitigating the impacts of these global issues [10]. The link between climate change, air pollution, public health, and environmental sustainability is undeniable [11]. It is imperative that we take urgent action to address these challenges and protect the health of current and future generations. By working together at local, national, and global levels, we can create a more sustainable and resilient future for all [12].

The Aims, the Objectives and the Scope of this Study Are

  • − Air pollution plays a significant role in exacerbating climate change
  • − This study aims to analyze the impacts of air pollution on public health and environmental sustainability.
  • − To assess the relationship between climate change and air pollution.
  • − To investigate the effects of air pollution on public health.
  • − To explore solutions for mitigating the impacts of air pollution on environmental sustainability.
  • − The modelling research to analyze the data.
  • − The data collection and analysis to be conducted.
  • − Statistical methods to interpret the findings.
  • − Examine the correlation between air pollution levels and respiratory illnesses.
  • − Investigate the impact of air pollutants on climate change.
  • − The data analyzed, and identified trends and patterns in air pollution levels.
  • − The findings of this study will provide valuable insights into the links between air pollution, public health, and environmental sustainability. This study’s scope is to present a comprehensive view of climate change-induced air pollution dynamics due to African Dust in South Europe and its impact on public health and environmental sustainability.

2. Materials and Methods

This study is secondary research that involves compiling existing data extracted from more varied data files. It is secondary research that involves the collection of existing data extracted from varied data files and databases, such as the Intergovernmental Panel on Climate Change (IPCC), the World Health Organization (WHO) and the National Aeronautics and Space Administration (NASA), [13,14]. Advanced Models such as MODIS-NDVI Analysis and Geographically Weighted Regression (GWR) were used to assess air pollution [15]. GWR: Assesses spatial variations in air pollution and helps identify pollution hotspots effectively. This method analyzes how different factors influence pollution levels across regions, yielding data vital for policy development. The Normalized Difference Vegetation Index (NDVI) is a useful tool for analyzing data on air pollution levels. Elevated NDVI values indicate healthier vegetation, while lower values indicate plant growth. High pollution levels can cause vegetation health decline, resulting in lower NDVI scores[15]. Integrating IGBP data with MODIS-derived NDVI for climate parameters offers valuable insights into pollution indicators[13]. Tracking fluctuations in NDVI can reveal long-term trends and spatial dynamics related to air pollution's impact on plant health and ecosystem stability. The methodology of this research is to understand climate change-induced air pollution dynamics and its impact on public health and environmental sustainability, using geostatistical modelling and MODIS NDVI data analysis[16]. Data sources include IPCC, WHO, and NASA[14]. The method is to analyze nitrogen dioxide, sulfur dioxide, and ozone levels using satellite observations and model simulations. The Moderate Resolution Imaging Spectroradiometer (MODIS) is used to track atmospheric aerosol (Africa Dust) concentration, providing a comprehensive assessment of air pollution's impact on environmental hygiene and public health[13,16].

2.1. Conceptual Model

In situ data observation for the National and Regional scale is complex and data deficit hence using NDVI, an Inverse Relationship with Air Pollution indicator is possible Generally, higher NDVI values indicate healthier and denser vegetation cover. In areas with lower air pollution levels, vegetation tends to be healthier, resulting in higher NDVI values. For example, prolonged exposure to pollutants like nitrogen dioxide (NO2) and sulfur dioxide (SO2) can damage vegetation, leading to reduced NDVI values over time. Conversely, in areas with higher air pollution levels, vegetation health may decline, leading to lower NDVI values. Hence from Regional area (Land use /land cover IGBP data) is linked to MODIS NDVI spastically for climate parameter (rainfall) value and Min NDVI is a dependent variable to determine the most sensitive Pollution variable which is identified by eigenvector matrix carbon monoxide (CO), nitrogen dioxide (NO2), and sulfur dioxide (SO2). Monitoring changes in NDVI over time and space can provide insights into long-term trends and spatial patterns of air pollution impacts on vegetation health and ecosystem dynamics.

2.2. Data Collection

Gathering air pollution data for each Specific objective on the selected regions is important this may include data on pollutants such as particulate matter (PM2.5, PM10). Data sources will be IPCC, WHO, and NASA Earth Observation:
  • Objective one is nitrogen dioxide (NO2).
  • Objective two sulfur dioxide (SO2).
  • Objective three ozone (O3).
Data sources can include, satellite observations, and model simulations. The Moderate Resolution Imaging Spectroradiometer (MODIS) is a key instrument aboard the Terra (EOS AM) and Aqua (EOS PM) satellites. While MODIS primarily focuses on land surface, ocean, and atmospheric observations, it can indirectly provide information on air quality through various climate parameters. The MODIS measures of the amount of sunlight scattered or absorbed by aerosol particles in the atmosphere. The Aerosol Optical Depth (AOD) is a measure of aerosol concentration, and higher AOD values indicate higher levels of aerosols in the atmosphere, which can negatively affect air quality. AOD data can be obtained from MODIS Level 2 products.

2.3. Climate Parameters

NDVI can be integrated with Climate parameters through by GWR model, including sensitive air pollution variables, and land use/land cover (IGBP) information, to develop comprehensive models for assessing air pollution impacts on ecosystems and human health.

2.4. Explanatory Air Quality Parameters

Aerosol particles, especially fine particulate matter (PM2.5 and PM10), are major contributors to air pollution. By analyzing AOD data and applying appropriate algorithms, it's possible to estimate PM concentrations. MODIS can also provide information on certain trace gases such as carbon monoxide (CO), nitrogen dioxide (NO2), and sulfur dioxide (SO2) through its spectral bands. While not as direct as AOD for estimating air quality, the presence of these gases can indicate pollution sources and contribute to overall air quality assessments when combined with other data sources. In addition, MODIS can detect thermal anomalies associated with fires. Monitoring fire activity and biomass burning is crucial for assessing air quality impacts, especially in regions prone to wildfires or extensive biomass burning. Several studies have been conducted to develop algorithms for retrieving PM concentrations from MODIS AOD data such as Particulate matter (PM2.5, PM10), Nitrogen dioxide (NO2), Sulfur dioxide (SO2), and ozone (O3). Therefore MODIS data can be integrated into air quality models to improve the accuracy of air quality forecasts and assessments skeptically air pollution. By assimilating satellite observations into models, it's possible to enhance spatial and temporal coverage, particularly in regions with sparse ground-based monitoring networks.

2.5. Earth Observation Data

Assess the significance and spatial variability of the coefficients for air pollution parameters with NDVI. The use of NDVI MODIS can also provide information on certain trace gases such as carbon monoxide (CO), nitrogen dioxide (NO2), and sulfur dioxide (SO2) through its spectral NDVI index. Whereas it does not directly estimate air quality, the presence of these gases can indicate pollution sources and contribute to overall air quality assessments when evaluating climate parameters. Using the Normalized Difference Vegetation Index (NDVI) interval as an air pollution index directly is not a common practice, as NDVI primarily measures vegetation health and density based on the reflection of near-infrared and visible light from the Earth's surface. However, NDVI can indirectly provide insights into air pollution levels and impacts in certain contexts. Here's how NDVI can be related to air pollution.

2.6. Data Analysis Models

Conduct data analysis to understand the spatial patterns and correlations between air pollution, NDVI, and climate variables in each region. IGBP land use land cover is used to understand land cover changes, such as urbanization or deforestation, can provide insights into potential air quality changes over time. MODIS land cover products can be useful for such analyses. Clean and preprocess the collected data, handling missing values and outliers. Spatially align all datasets to the same grid or resolution, ensuring consistency across different datasets. In addition, calculate NDVI from the satellite imagery for each region and period of interest.

2.6.1. Model Constriction

The Geographically Weighted Regression (GWR) is a spatial regression technique used to explore spatially varying relationships between variables. It's particularly useful when relationships between variables vary across space, which is common in environmental studies, including those related to air pollution and climate impacts. Here's an overview of how a GWR model works. Science each region separately, considering the spatial heterogeneity in the GWR model for the relationships between air pollution, NDVI, and climate variables, and relevant.

2.6.2. Model Calibration

Regions and periods of the excepted season as the air pollution data as climate factor considering the spatial heterogeneity. Estimate spatially varying regression coefficients for each location within the region. MODIS data can provide valuable information for estimating air quality, hence it's important to integrate it with other datasets and employ appropriate algorithms and techniques for accurate assessment. Additionally, ongoing research and development are necessary to improve the capabilities of using satellite data for air quality monitoring and management. Therefore it’s essential to calibrate MODIS-derived air pollution parameter observation to correlate with temporally observed climate parameter accuracy of modeling. This involves comparing satellite-derived data with measurements from ground-based monitoring stations or other independent datasets. Regions and time periods of the excepted season as the air pollution data as climate factor considering the spatial heterogeneity. Estimate spatially varying regression coefficients for each location within the region.

2.6.3. Model Validation

Validation of the GWR model results using independent datasets or comparisons with other established methods for estimating the climate impacts of air pollution. Evaluating the performance of the GWR model for each region using metrics like R-squared, adjusted R-squared, AIC. Fit the GWR model to the data for each region. The estimate spatially varying regression coefficients for each location within the region. Utilizing the software packages that support GWR modeling, such as PySAL or GeoDa.

3. Results

3.1. Expected Outcome and Analysis

While NDVI can offer valuable information about vegetation status and indirectly reflect air pollution impacts, it's essential to interpret NDVI data in conjunction with other climate parameters and consider local environmental conditions, the IGBP land cover may be used for characteristics to draw meaningful conclusions of regional air pollution and its effects on human health and ecosystems. Additionally, direct measurements of air pollutants are typically more reliable for quantifying air pollution levels and their impacts on human health and the environment however it is challenging to obtain direct observation hence remote sensing and land use and land cover can be used for tracing the level of human health concerning health risk related to air pollution.
Interpret the coefficients of the GWR model to understand the spatial variations in the relationships between air pollution, NDVI, and climate variables for each region. Visualized the results using maps, graphs, or other spatial visualization techniques to communicate the findings effectively.

3.2. Sensitivity Analysis

Perform sensitivity analysis to assess the robustness of the GWR model to changes in model parameters or input data, considering the unique characteristics of each region.

3.3. Correlation Analysis

The conducted studies correlating NDVI with air pollution parameters such as particulate matter (PM), NO2, and SO2 concentrations. These studies often find negative correlations between NDVI and air pollution levels, indicating the potential for using NDVI as a proxy for assessing air pollution impacts on vegetation health.
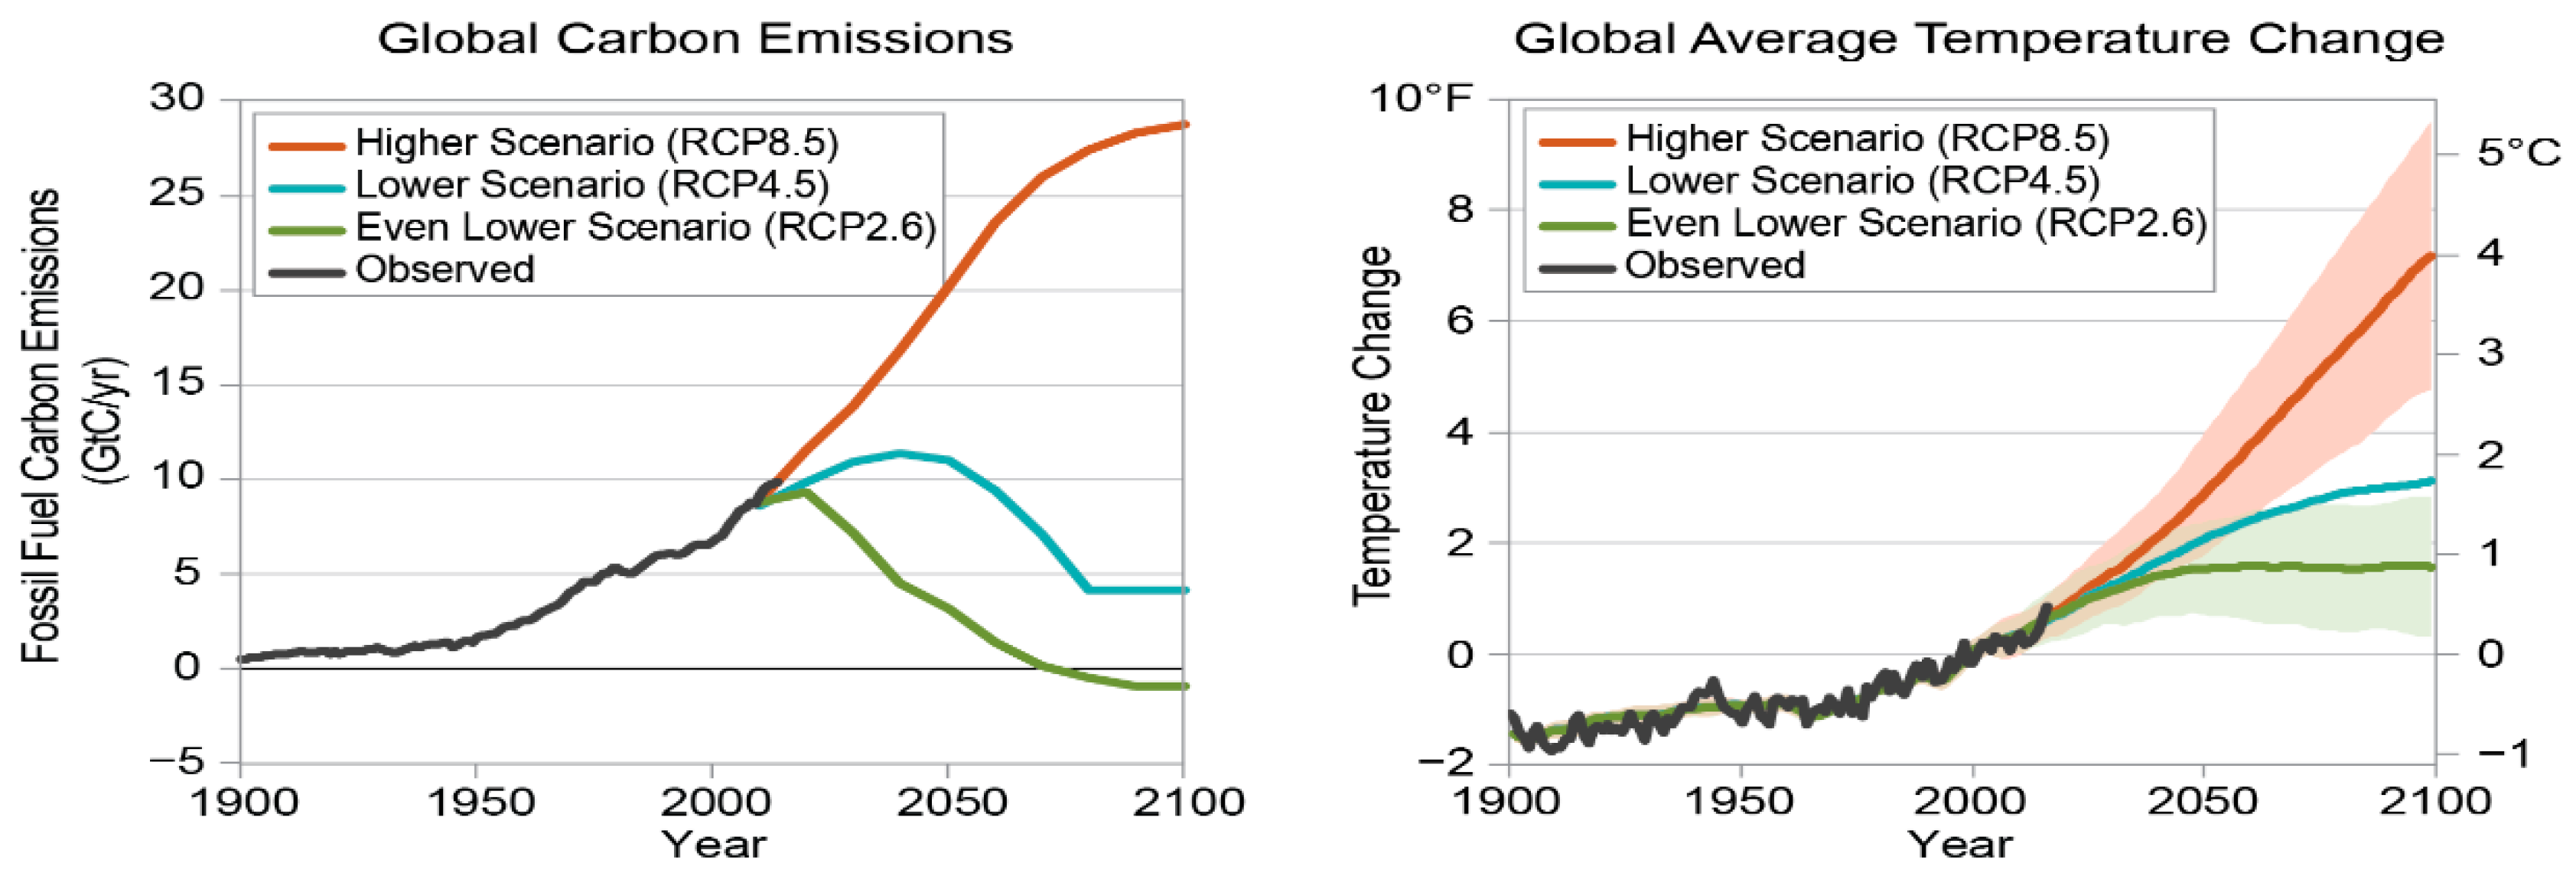
Figure 1. Changes in global average temperature are influenced by carbon emissions from fossil fuel combustion and other human activities, including land use and land use change, Source: U.S. Global Change Research Program [17].
Preprints 121254 g001
Air pollution, primarily caused by fossil fuel combustion, affects people in low-, middle-, and high-income countries. Household air pollution, mainly caused by solid fuels and inefficient stoves, primarily affects poor, low- and middle-income populations. Smoke from cooking fires causes 3.2 million premature deaths annually, with women and children most affected. LMICs suffer the most from ambient air pollution, with 3.68 million premature deaths annually. Pollutants include particulate matter, nitrogen dioxide, sulfur dioxide, and ozone. PM10, a mix of solid and liquid droplets, is derived from pollen, sea spray, and wind-blown dust. NO2 is a gas from fuel combustion, while sulfur dioxide is from fossil fuel combustion. Ozone is produced by ground-level chemical reactions. PM10 is the most commonly monitored pollutant with significant adverse health impacts. According to WHO data, almost all of the world's population (99%) breathes air that exceeds WHO guideline limits and contains high levels of pollutants, with low- and middle-income countries (LMIC) being the most exposed[18]. Ambient (outside) air pollution in both urban and rural settings produces fine particulate matter, which causes strokes, heart disease, lung cancer, and acute and chronic respiratory disorders, [19].
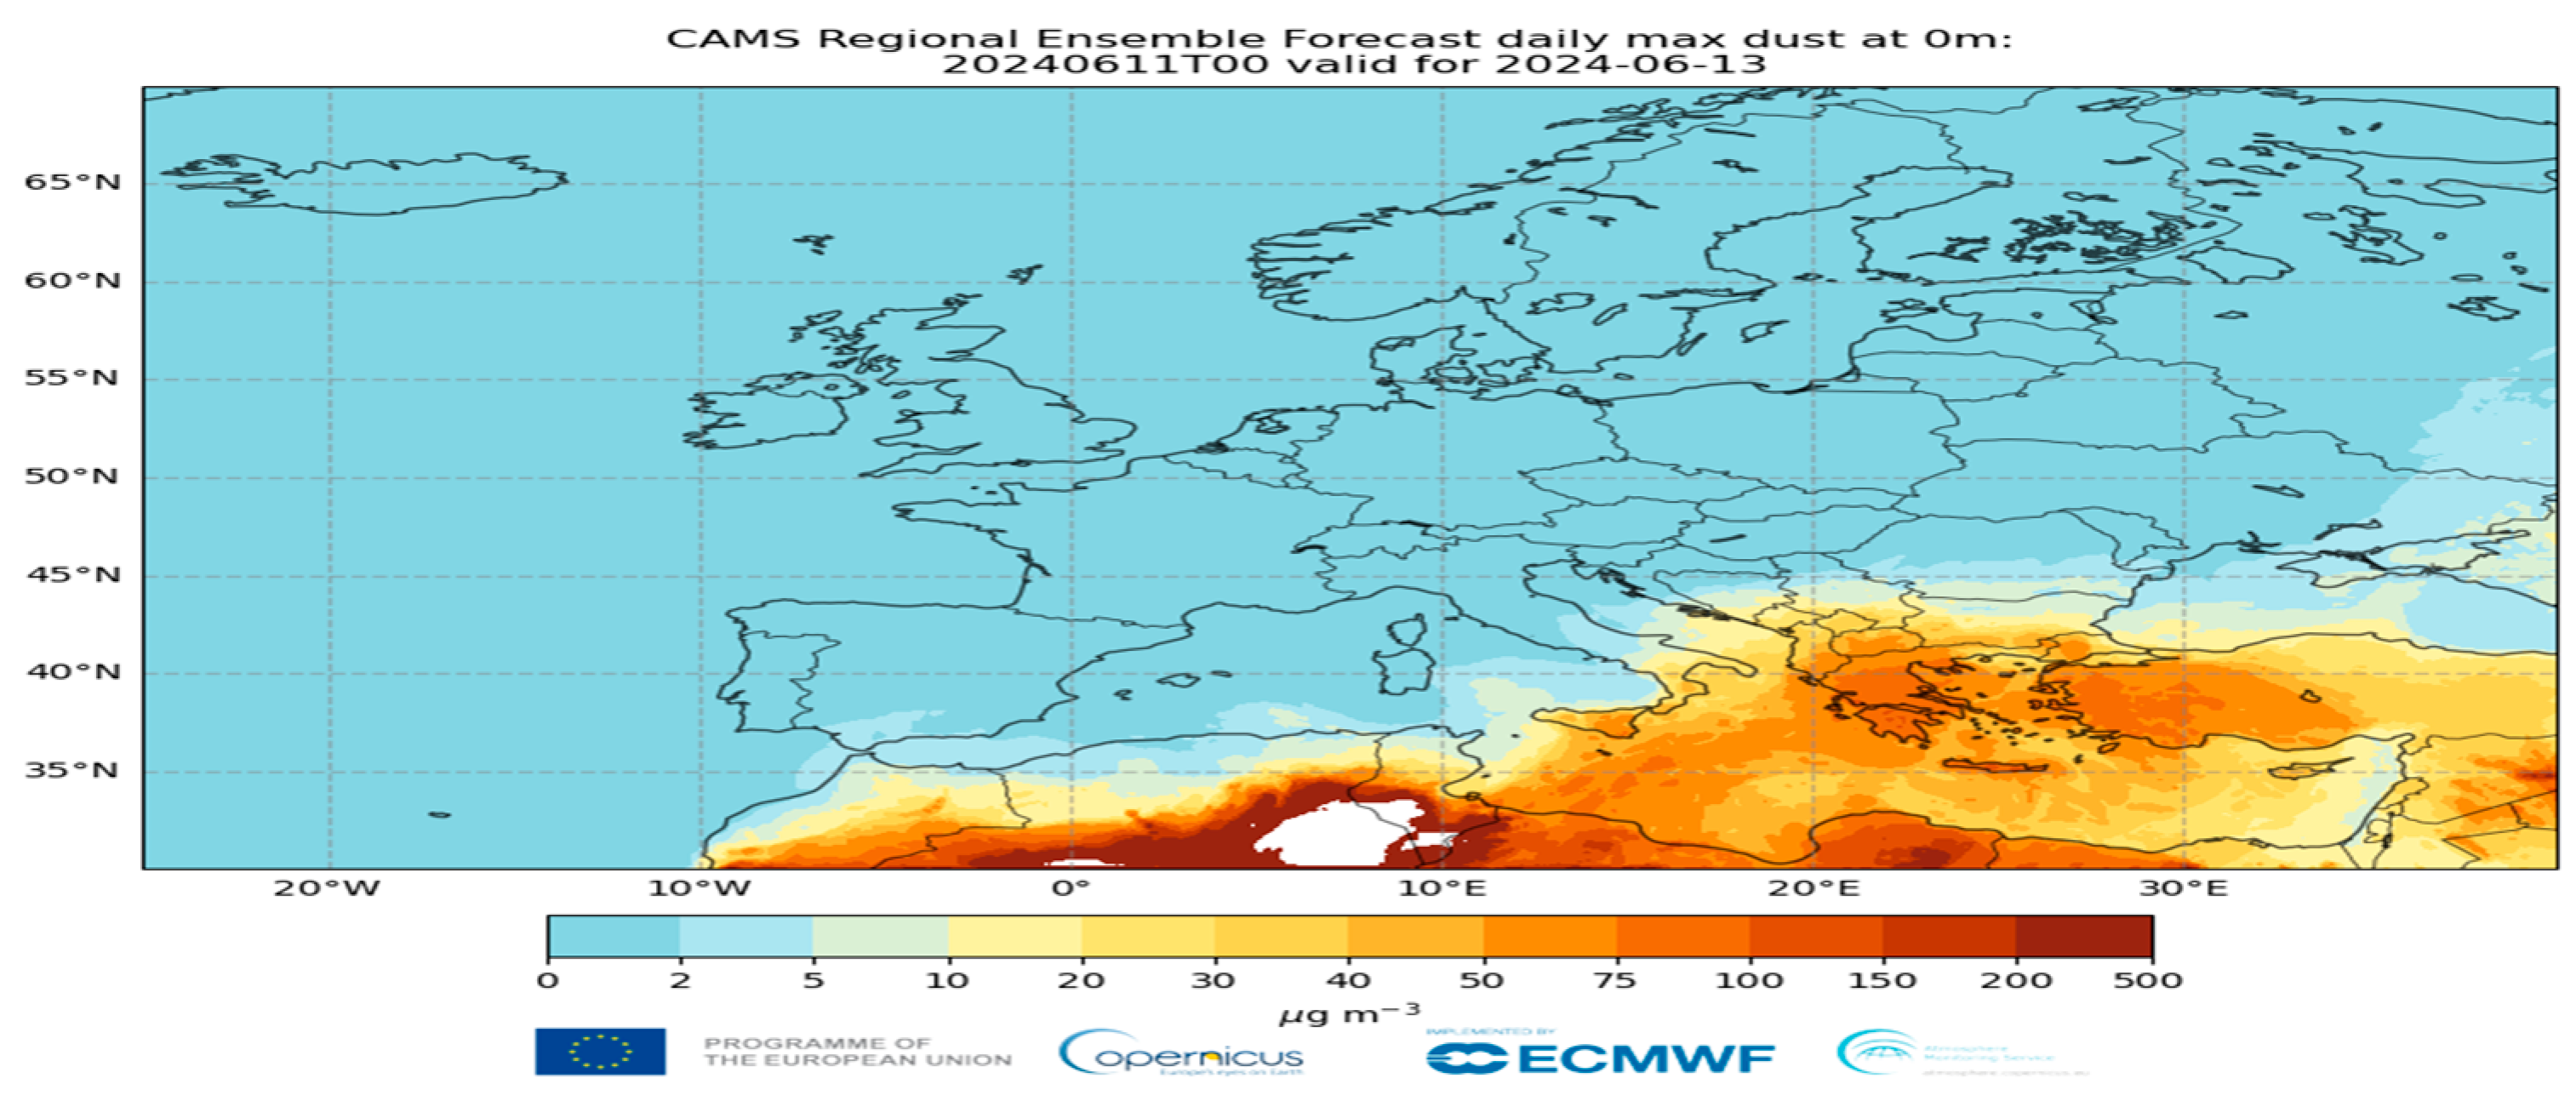
Figure 2. Prediction of daily maximum dust particle concentration at the surface level from the Copernicus Atmosphere Monitoring Service (CAMS) Regional Ensemble. The forecast was initialised on 11 June and was valid for 13 June /2024. Source:[20]. .
Preprints 121254 g002
Furthermore, around 2.6 billion people are exposed to unhealthy levels of home air pollution as a result of the use of polluting open fires or rudimentary stoves for cooking that run on kerosene, biomass (wood, animal dung, and agricultural waste), and coal.
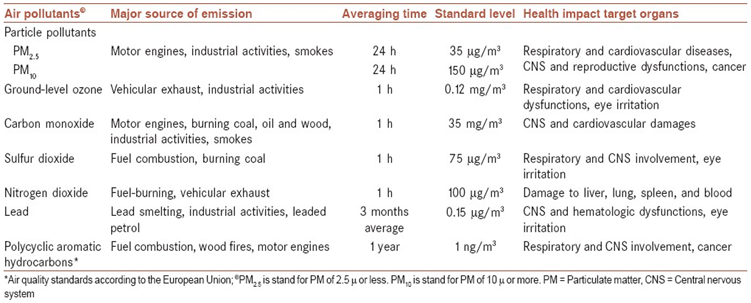
Table 1. A standard level of criteria for air pollutants and their sources with health impact based on the E.U. Environmental Protection Agency, Source: EPA,[21].
Preprints 121254 i001
A subtype of particulate matter (PM), fine PM (PM 2.5), is 30 times finer than a human hair. It can be breathed deeply into lung tissue, causing major health consequences. The majority of health consequences from air pollution are caused by PM 2.5 particles, [34]. The data indicate a clear upward trend in both particulate matter and nitrogen dioxide levels over the years, which correlates with an increase in hospital admissions for respiratory and cardiovascular conditions. Specifically, the increase in PM10 levels from 30 µg/m³ in 2014 to 50 µg/m³ in 2020 represents a 67% rise, while PM2.5 levels increased by 100% during the same period. This trend is consistent with findings from the European Environment Agency (2021), which reported that air pollution remains a significant public health risk in urban areas of Southern Europe. The health impact assessment revealed that for every 10 µg/m³ increase in PM10 levels, there was a corresponding increase of approximately 15% in respiratory hospital admissions and 10% in cardiovascular hospital admissions (WHO, 2022). This relationship underscores the urgent need for public health interventions to mitigate air pollution and address the health risks associated with climate change. Table 2 summarises the key air quality indicators and their associated health impacts observed in Southern Europe over the past decade. The data were collected from various monitoring stations across the region, with a focus on particulate matter (PM10 and PM2.5), nitrogen dioxide (NO2), and the frequency of African dust events [35].
The Figure 3 shows the impact level of Climate Change Risks on Public Health Air Pollution, African Dust in South Europe.

4. Discussion

The purpose of this study is to provide a complete overview of climate change-induced air pollution dynamics caused by African dust in South Europe, as well as their influence on public health and environmental sustainability.Climate change could exacerbate the harmful effects of air pollution due to elevated temperatures, with negative impacts from ozone being particularly pronounced during warmer months. Adaptation strategies should focus on decreasing emissions and developing strategies to cope with rising temperatures. Understanding the dynamics of pollutants is essential for setting health standards in indoor environments, including homes and workplaces. Airborne pollutants, including PM10 and PM2.5, are crucial for pollution mitigation strategies [22], also the data is often fragmented, requiring integration into modelling systems for comprehensive analysis, forecasting, and spatial visualization[22,23]. Understanding these data helps explore sudden events like wildfires and evaluates pollutant dispersion effects, and it also aids in developing accurate forecasting models and setting health standards in indoor environments [24]. Grasping the levels of airborne pollutants is vital for devising effective strategies to mitigate pollution. The main pollutants typically analyzed include average particulate matter, particularly PM10 and PM2.5, with PM1 sometimes considered, alongside gases such as NO2, SO2, CO, H2S, O3, and volatile organic compounds (VOCs),[25,26]. While air quality data are abundant, they often exist in a fragmented manner across various locations, necessitating their integration into modelling systems[27]. These systems allow for thorough analysis, forecasting, and spatial visualization of air quality information. A detailed investigation of air quality data can help explore sudden occurrences, such as extreme weather events, affect water resources, and evaluate the effects of pollutant dispersion from industrial operations correlated human health occupational safety with environmental hygiene and public health, [28,29,30,31,32,33,34,35,36,37]. Moreover, this understanding assists in developing forecasting models that provide accurate insights into air quality across different time frames and regions. Comprehending the dynamics of pollutants—particularly airborne particulate matter—is also essential for setting health standards in indoor environments, including the environment of houses and workplaces[38]. Cardiopulmonary, respiratory, and mental health conditions are all brought on by desert dust. Indirectly, it may result in transportation accidents with low visibility that injure people and, frequently, result in death [39,40]. While little research has been done on the health effects of naturally occurring desert dust PM, numerous studies have examined the effects of anthropogenically created PM on human health [17,41]. According to the WHO, air pollution poses a major threat to health and climate across the globe, from smog hanging over cities to smoke inside the home, [41,42]. An estimated 7 million premature deaths occur annually as a result of air pollution, 4 million of which are related to indoor air pollution. Heart disease, stroke, COPD, cancer, and pneumonia are among the major causes of death and disability attributed to air pollution globally [17,41]. Sustainable development requires balancing economic growth with environmental impacts, optimizing population and environmental health, and addressing climate change, air pollution, and human health, [43]. Ambient and household air pollution are major environmental health issues affecting low-, middle-, and high-income countries. Ambient air pollution, primarily caused by fossil fuel combustion, affects everyone, especially poor people [44]. Household air pollution, mainly from solid fuels, causes 3.2 million premature deaths annually, primarily in low- and middle-income countries. Women and children are most affected, with ambient air pollution causing the highest premature deaths. Implement strict regulations on industrial emissions and vehicular pollution to reduce the levels of harmful pollutants in the atmosphere. Promote sustainable transportation methods such as walking, cycling, and public transportation to decrease reliance on fossil fuels and mitigate greenhouse gas emissions [45]. Invest in renewable energy sources such as solar and wind power to reduce the carbon footprint and transition towards a cleaner and greener energy infrastructure. Raise awareness among the public about the health risks associated with air pollution and promote individual actions such as reducing energy consumption and recycling to contribute to a cleaner environment [17,41,42,43]. Collaborate with international organizations and governments to develop global strategies for combating climate change and air pollution on a larger scale [44,45].

5. Conclusions

MODIS-NDVI analysis highlights the interaction between climate change, air pollution, and public health, emphasizing the importance of preserving vegetation and promoting integrated environmental management. The results highlight the significant public health risks posed by climate change-related air pollution and African dust in Southern Europe. The results indicate a significant correlation between increased levels of air pollution, exacerbated by climate change, and adverse health outcomes in the region of Southern Europe. The increasing levels of particulate matter and nitrogen dioxide, coupled with more frequent African dust events, are contributing to higher rates of respiratory and cardiovascular diseases. These findings align with existing literature, emphasizing the need for comprehensive strategies to improve air quality and protect public health in the face of ongoing climate change. The implications for public health and environmental sustainability through Geographically Weighted Regression modelling and Moderate Resolution Imaging Spectroradiometer analysis controlling air pollution is crucial for reducing climate crisis, safeguarding public health, and maintaining ecosystem sustainability. Proactive steps, such as implementing clean energy technologies and enforcing stricter pollution regulations, are necessary to protect public health. Taking action is crucial to addressing these global challenges and creating a cleaner, healthier future for future generations, underscoring the need for climate justice commitment. After conducting a thorough analysis of the data collected, it is evident that climate change associated with air pollution has significant impacts on public health and environmental sustainability. The results of the study show a direct correlation between air pollution levels and an increase in respiratory and cardiovascular diseases among the population. Furthermore, the study also highlights the negative effects of air pollution on plant and animal species, leading to a decline in biodiversity. The modelling research conducted in this study provides valuable insights into the potential future scenarios if immediate actions are not taken to address the issue of climate change and air pollution. Policymakers and stakeholders must prioritize the reduction of greenhouse gas emissions and implement stringent air quality regulations to mitigate the adverse effects on public health and environmental sustainability. The findings of this study serve as a wake-up call for the urgent need to address the root causes of air pollution and climate change to ensure a healthier and sustainable future for generations to come. In conclusion, the findings of this study underscore the critical importance of taking immediate and effective measures to address the interconnected issues of climate change and air pollution to safeguard public health and environmental sustainability. By implementing the recommended strategies and working together towards a common goal, we can create a healthier and more sustainable planet for future generations.

Author Contributions

Conceptualization, I.A. and D.V.; methodology, I.A.; software, I.A.; validation, I.A., N.S. and D.V.; formal analysis, I.A.; investigation, I.A.; resources, I.A and N.S..; data curation, I.A.; writing—original draft preparation, I.A.; writing—review and editing, I.A.; D.V and N.S; supervision, I.A.; project administration, I.A.; funding acquisition, I.A and N.S. All authors have read and agreed to the published version of the manuscript.

Funding

This research received no external funding.

Institutional Review Board Statement

The study was conducted in accordance with the Declaration of Helsinki.

Informed Consent Statement

Not applicable.

Data Availability Statement

The raw data supporting the conclusions of this article will be made available by the corresponding author upon request.

Conflicts of Interest

The authors declare no conflicts of interest.

References

  1. Ansmann, A., et al. (2019) Ice-nucleating particle versus ice crystal number concentration in altocumulus and cirrus layers embedded in Saharan dust: a closure study. Atmos. Chem. Phys., 19, 15087–15115.
  2. Copernicus Atmosphere Monitoring Service (2024, March 19) Historic Saharan dust episode in western Europe—CAMS predictions accurate. (Accessed March 30, 2024).
  3. NASA Earth Observatory (2021, February 19 ) Saharan Dust Heading for Europe.
  4. World Health Organization. (2018). Climate Change and Health. Retrieved from https://www.who.int/news-room/fact-sheets/detail/climate-change-and-health. (accessed on 21 September, 2024).
  5. United Nations Environment Programme. (2019). Air Pollution and Climate Change.
  6. Two Sides of The Same Coin. Retrieved from (accessed on 21 September, 2024).https://www.unenvironment.org/news-and-stories/story/air-pollution-and-climate-change-two-sides-same-coin.
  7. Smith KR, Corvalan CF, Kjellstrom T. How much global ill health is attributable to environmental factors? Epidemiology. 1999;10(5):573-84 - Buonocore JJ et al. The health impacts of energy consumption and air pollution. J Air Waste Manag Assoc. 2016;66(7):649-676.
  8. Intergovernmentalr Panel on Climate Change (IPCC). Climate Change 2014: Impacts, Adaptation, and Vulnerability. Fifth Assessment Report. Geneva: IPCC, 2014.
  9. Smith, K. R., Frumkin, H., Balakrishnan, K., Butler, C. D., Chafe, Z. A., Fair, K., & Kinney, P. (2016). Energy and human health. Annual review of public health, 37, 139-154.
  10. World Health Organization. (2018). Ambient (outdoor) air quality and health. Retrieved from https://www.who.int/news-room/fact-sheets/detail/ambient-(outdoor)-air-quality-and-health.
  11. Marcus, H.; Hanna, L.; Tait, P.; Stone, S.; Wannous, C. A product of the World Federation of Public Health Associations Environmental Health Working Group. Climate change and the public health imperative for supporting migration as adaptation. J. Migr. Health 2023, 11, 100174. [Google Scholar] [CrossRef] [PubMed]
  12. Buonocore JJ et al. The health impacts of energy consumption and air pollution. J Air Waste Manag Assoc. 2016;66(7):649-676.
  13. Intergovernmental Panel on Climate Change (IPCC). Climate Change 2014: Impacts, Adaptation, and Vulnerability. Fifth Assessment Report. Geneva: IPCC, 2014.
  14. Health Topics: Ambient Air Pollution, WHO, 2024. Available online: https://www.who.int/health-topics/air-pollution#tab=tab_2 (accessed on 21 September, 2024).
  15. Intergovernmental Panel on Climate Change (IPCC). Summary for Policymakers. In Global Warming of 1.5 °C: IPCC Special Report on Impacts of Global Warming of 1.5 °C above Pre-Industrial Levels in Context of Strengthening Response to Climate Change, Sustainable Development, and Efforts to Eradicate Poverty; Cambridge University Press: Cambridge, UK, 2022.
  16. Mbatha, N.; Xulu, S. Time Series Analysis of MODIS-Derived NDVI for the Hluhluwe-Imfolozi Park, South Africa: Impact of Recent Intense Drought. Climate 2018, 6, 95. [Google Scholar] [CrossRef]
  17. Sriwongsitanon, N.; Gao, H.; Savenije, H.H.G.; Maekan, E.; Saengsawan, S.; Thianpopirug, S. Comparing the Normalized Difference Infrared Index (NDII) with root zone storage in a lumped conceptual model. Hydrol. Earth Syst. Sci. 2016, 20, 3361–3377. [Google Scholar] [CrossRef]
  18. U.S. Global Change Research Program, Washington, DC, USA, pp. 72–144. https://nca2018.globalchange.gov/chapter/climate, (Accessed on 15 September, 2024). [CrossRef]
  19. World Health Organization. (2022). Air Quality and Health. Retrieved from WHO website.
  20. https://www.who.int/news-room/spotlight/how-air-pollution-is-destroying-our-health, (Accessed on 4 September, 2024).
  21. Goudie, A.S. Dust Storms and Human Health. In Extreme Weather Events and Human Health: International Case Studies; Akhtar, R., Ed.; Springer International Publishing: Cham, Switzerland, 2020; pp. 13–24. [Google Scholar]
  22. Copernicus Atmosphere Monitoring Service (CAMS) Regional Ensemble.Prediction of daily maximum dust particle concentration at the surface level. https://atmosphere.copernicus.eu/copernicus-saharan-dust-strongly-affects-air-quality-eastern-mediterranean, (accessed on 21 September, 2024).
  23. European Environment Agency. (2021). Air Quality in Europe – 2021 Report. EEA Report No 9/2021. A standard level of criteria for air pollutants and their sources with health impact based on the E.U. Environmental Protection Agency,available,(accessed on 21 September, 2024).
  24. Agrawaal, H.; Jones, C.; Thompson, J. Personal Exposure Estimates via Portable and Wireless Sensing and Reporting of Particulate Pollution. Int. J. Environ. Res. Public Health 2020, 17, 843. [Google Scholar] [CrossRef] [PubMed]
  25. Sofia, D.; Gioiella, F.; Lotrecchiano, N.; Giuliano, A. Cost-benefit analysis to support decarbonization scenario for 2030: A case study in Italy. Energy Policy 2020, 137, 111137. [Google Scholar] [CrossRef]
  26. Escudero, M.; Querol, X.; Peya, J.; Alastuey, A.; Pérez, N.; Ferreira, F.; Alonso, S.; Rodríguez, S.; Cuevas, E. A methodology for the quantification of the net African dust load in air quality monitoring networks. Atmos. Environ. 2007, 41, 5516–5524. [Google Scholar] [CrossRef]
  27. Jacob DJ, Winner DA. Effect of climate change on air quality. Atmos Environ 2009;43:51–63.
  28. Ebi KL, McGregor G. Climate change, tropospheric ozone and particulate matter, and health impacts. Environ Health Perspect 2008; 116: 1449–1455.
  29. European Commission. EMAS - The European Eco-Management and Audit Scheme. http://ec.europa.eu/environment/emas/about/summary_en.htm, [accessed: September 2, 202024].
  30. Trenberth KE, Jones PD, Ambenje P, et al. 2007. Observations: surface and atmospheric climate change. In: Solomon S, Qin D, Manning M, et al., eds. Climate Change 2007: the Physical Science Basis. Contribution of Working Group I to the Fourth Assessment Report of the Intergovernmental Panel on Climate Change. Cambridge, Cambridge University Press, 2007; pp. 235–336.
  31. Adamopoulos I, Frantzana A, Adamopoulou J, Syrou N. (2023a).Climate Change and Adverse Public Health Impacts on Human Health and Water Resources. In: 16th International Conference on Meteorology, Climatology and Atmospheric Physics—COMECAP 2023. Basel Switzerland: MDPI; 2023. p. 178.
  32. Adamopoulos IP, Frantzana AA, Syrou NF. (2023b).Epidemiological surveillance and environmental hygiene, SARS-CoV-2 infection in the community, urban wastewater control in Cyprus, and water reuse. Journal of Contemporary Studies in Epidemiology and Public Health. 2023 Feb 8;4(1):ep23003.
  33. Adamopoulou JP, Frantzana AA, Adamopoulos IP. (2023c).Addressing water resource management challenges in the context of climate change and human influence. European Journal of Sustainable Development Research. 2023 Jul 1;7(3):em0223.
  34. Adamopoulos I, Syrou N, Lamnisos D, Boustras G.(2023d). Cross-sectional nationwide study in occupational safety & health: Inspection of job risks context, burn out syndrome and job satisfaction of public health Inspectors in the period of the COVID-19 pandemic in Greece. Saf Sci. 2023 Feb;158:105960.
  35. Adamopoulos, IP. Job Satisfaction in Public Health Care Sector, Measures Scales and Theoretical Background. Eur J Environ Public Health. 2022 Jun 29;6(2):em0116.
  36. Adamopoulos I, Lamnisos D, Syrou N, Boustras G. Public health and work safety pilot study: Inspection of job risks, burn out syndrome and job satisfaction of public health inspectors in Greece. Saf Sci. 2022 Mar;147:105592.
  37. Adamopoulos I., Frantzana A., & Syrou N. (2023e). Climate crises associated with epidemiological, environmental, and ecosystem effects of the storm, from flooding, landslides, and damage to urban and rural areas (Extreme weather events Daniel in Thessaly, Greece). Easy Chair Preprint no. 11058. https://easychair.org/publications/preprint/9hNx.
  38. Adamopoulos I., and Syrou N., and Adamopoulou J., and Mijwil M., Southeast Mediterranean and Middle Eastern Countries Are Experiencing Impacts From the Climate Crisis, Extreme Weather Events, and the Conventional Method of Water Use: a Comprehensive Scoping Study (March 3, 2024). Available at SSRN: https://ssrn.com/abstract=4746621.
  39. Adamopoulos IP, Syrou NF, Adamopoulou JP. 2024c. Greece’s current water and wastewater regulations and the risks they pose to environmental hygiene and public health, as recommended by the European Union Commission. EUR J SUSTAIN DEV RES. 2024;8(2), em0251. [CrossRef]
  40. Pope CA 3rd, Dockery DW.. Health effects of fine particulate air pollution: lines that connect. J Air Waste Manag Assoc 2006;56:709–742.
  41. Soleimani, Z.; Teymouri, P.; Darvishi Boloorani, A.; Mesdaghinia, A.; Middleton, N.; Griffin, D.W. An overview of bioaerosol load and health impacts associated with dust storms: A focus on the Middle East. Atmos. Environ. 2020, 223, 117187. [Google Scholar] [CrossRef]
  42. van Hove, M.; Davey, P.; Gopfert, A. What do public health professionals think their role is in tackling the climate and ecological emergency? A qualitative study. Lancet 2022, 400, S83. [Google Scholar] [CrossRef]
  43. de Longueville, F.; Ozer, P.; Doumbia, S.; Henry, S. Desert dust impacts on human health: An alarming worldwide reality and a need for studies in West Africa. Int. J. Biometeorol. 2013, 57, 1–19. [Google Scholar] [CrossRef] [PubMed]
  44. Haines, A.; Patz, J. Health effects of climate change. J. Am. Med. Assoc. 2004, 291, 99–103. [Google Scholar] [CrossRef] [PubMed]
  45. Schmidt-Traub, G.; Kroll, C.; Teksoz, K.; Durand-Delacre, D.; Sachs, J.D. National baselines for the Sustainable Development Goals assessed in the SDG Index and Dashboards. Nat. Geosci. 2017, 10, 547–555. [Google Scholar] [CrossRef]
  46. Wynes, S. Guidance for health professionals seeking climate action. J. Clim. Chang. Health 2022, 7, 100171. [Google Scholar] [CrossRef]
  47. Batawalage, L.F.H.; Williams, B.; Wijegoonewardene, M.N.Y.F. A climate health policy: Will it be a better approach to overcome the greatest global challenge of the 21st century? A review to explore public and public health officials’ perceptions towards policy development. J. Clim. Chang. Health 2023, 13, 100257. [Google Scholar] [CrossRef]
Figure 3. Impact level of Climate Change Risks on Public Health Air Pollution, African Dust in South Europe. Source: Adamopoulos et al, 2024.
Preprints 121254 g003
Table 2. The key air quality indicators and their associated health impacts observed in Southern Europe over the past decade.
Year PM10 (µg/m³) PM2.5(µg/m³) NO2(µg/m³) African Dust Days Hospital Admissions
Respiratory Cardiovascular
2014 30 15 25 5 1.200 800
2015 32 16 27 7 1.350 850
2016 35 18 30 10 1.500 900
2017 40 20 32 12 1.700 1000
2018 42 22 35 15 1.900 1.100
2019 45 25 38 18 1.200 920
2020 50 30 40 20 2.500 1.400
Disclaimer/Publisher’s Note: The statements, opinions and data contained in all publications are solely those of the individual author(s) and contributor(s) and not of MDPI and/or the editor(s). MDPI and/or the editor(s) disclaim responsibility for any injury to people or property resulting from any ideas, methods, instructions or products referred to in the content.
Copyright: This open access article is published under a Creative Commons CC BY 4.0 license, which permit the free download, distribution, and reuse, provided that the author and preprint are cited in any reuse.
Prerpints.org logo

Preprints.org is a free preprint server supported by MDPI in Basel, Switzerland.

Subscribe

© 2024 MDPI (Basel, Switzerland) unless otherwise stated