Background
Cancer is a multi-faceted disease that confers resilience and survival advantages over normal cells. These advantages include sustained proliferative signaling, resistance to growth suppressors, invasion and metastasis, and immune evasion [
1]. During cancer development, cancer cells interact intimately with the immune cells in the microenvironment to facilitate its survival and progression. These interactions promotes an immunosuppressive environment to allow cancer cells to proliferate without surveillance and elimination by immune cells. This is mediated by expression of co-inhibitory ICs, infiltration of pro-tumoral immune cells, lowering the expression of self-antigens, and the release of immunosupperssive cytokines [
2].
Deciphering complex mechanisms that support immune evasion has given rise to various immunotherapies that unveil cancer cells and reinstate immune recognition and elimination of cancer cells. There are various mechanisms tackled by immunotherapies including the inhibition of co-inhibitory IC interactions by ICB, cancer-cell surface target recognition and induced cytotoxicity by CAR-T therapy, and recruiting anti-tumoral immune cell infiltration by promoting inflammation using cytokine-based therapies. Of these therapies, ICBs have shown great promise in clinical use, however, only 30-40% of the patient population are eligible for these therapies and upto 12.5% of the eligible patients respond to treatment [
3]. The reported reasons for the lack of response to immunotherapies include primary and acquired resistance, low expression of intended targets amongst patient populations, and even relapses after treatment [
4,
5]. As the ineligible patient population expands, the exploration for alternative therapeutic strategies and targets are warranted.
Our previous review surveyed transcriptional regulators of ICs and oncoimmunology, so-called master regulators of immune evasion (MR-IE) [
6]. Here we describe how transcription factors such as MYC and STAT3 play a pivotal role in the context of oncoimmunology, including the regulation of IC molecules gene expression, maturation of dendritic cells, the release of pro-tumoral cytokines, inhibiting anti-tumor immune cells, and promoting angiogenesis [
7,
8]. Hence, we surmise that these MR-IE, would be more effective immunotherapeutic targets for cancers.
The present investigation identified (mortality-associated) MR-IE per cancer type by a robust integration bioinformatics tools to stratify and subset The Cancer Genome Atlas (TCGA) Pan Cancer dataset based on their IC molecule expression and their predicted immune cell infiltration levels. We validated the top-ranking candidate in CCA, as it has been previously reported to have a complex immune architecture [
9], and has a concerning incidence and mortality rate, with limited treatment options in Thailand [
10]. This investigation not only aims to introduce a novel and effective immunotherapeutic strategy by targeting MR-IE, but also offer more potent immunotherapeutic treatment options for CCA.
Methodology
Dataset Acquisition and Classification
TCGA Pan Cancer Atlas RNA-Seq dataset was obtained from
https://gdc.cancer.gov/about-data/publications/pancanatlas , along with its respective sample annotation, tumor subtype annotation and its clinical data. This dataset was used to draw immune cellular fraction estimates using CIBERSORT, as described in Thorsson
et al’s investigation [
11,
12]. Using the datasets provided in the paper, we selected TCGA samples that were in the first and third quartile of CD8+ T-cell infiltration (less than 25% and greater than 75%) to represent low infiltration and high CD8+ T-cell infiltration, respectively. Additionally, we summed the infiltration scores of CD4+ and CD8+ T-cells of the TCGA tumors and selected samples that were in the first and third quartile to represent low and high CD4+ and CD8+ T-cell infiltration. Lastly, using the Leukocyte Fraction scores, we used the samples in the first and third quartile to represent low and high leukocyte infiltration. Thus, using these criteria, the PanCancer dataset was subset into 6 datasets (Low and High Leukocyte Infiltration, Low and High CD4+ and CD8+ T cell infiltration, and Low and High CD8+ T cell infiltration).
Hierarchical clustering of TCGA samples
The 7 datasets (6 subsets and the PanCancer dataset) were transformed using log2(x+2) to remove NA values. Using the R package pheatmap, the datasets were plotted on a heatmap that was subjected to hierarchical clustering [
13]. These heatmaps were used to determine expression levels (low, intermediate and high) of co-inhibitory IC expression. Samples that belonged to each cluster were extrapolated and pooled into its respective groups for subsequent analyses.
Differential Gene Expression Analysis
Differential gene expression analysis was conducted using the R packages edgeR and limma [
13]. TCGA samples within low, intermediate, and high co-inhibitory IC expression were compared in the directions: low vs. intermediate, and low vs. high co-inhibitory IC expression. P-values were adjusted using the Benjamini-Hochberg method. P-value threshold was set at below 0.001 (p<0.001)
Pathway Enrichment Analyses
To assess the pathways the differentially expressed genes (DEGs) belong to we performed enrichment analysis using the tools iLINCS Pathway Analysis [
14]. The input for these tools was either the DEG list with its fold change and adjusted p-values or just the gene list, wherever appropriate.
Transcriptional Regulators Identification
DEG list was applied to STRING DB to generate a gene network. This network was used in Expression2Kinases to enrich transcription factors using known protein interactions to construct a network.
Cell Lines
Cell lines KKU-M213 and RBE were purchased from Japanese Collection of Research Bioresources Cell Bank, and were maintained in RPMI culture medium supplemented with 10% FBS (Gibco, Life technologies, Grand Island, NY, USA) and incubated at 37°C with 5% CO2.
Real-time PCR (qPCR)
Total RNA was extracted using the Geneaid Total RNA extraction kit, in accordance with manufacturer’s protocol. 500 ng RNA was subjected to reverse transcriptase using the Hyperscript RT mastermix kit (Geneaid) using a Bio-Rad Thermal cycler. The cDNA was subjected to qPCR using the Agilent Real-Time PCR thermal cycler.
Western Blot
8x10
5 cells were seeded onto a 60 mm dish for 24 hours and treated with the lipofectamine reagent carrying the siRNA of interest or inhibitor treatment. The cells (after 48 hours) were lysed according to the protocol defined in the publication [
15]. Protein samples of 40 μg was loaded and separated using 12% SDS-PAGE and transferred to a nitrocellulose membrane. The membrane was blocked with 5% bovine serum albumin (BSA) and probed with primary antibodies at 1:1000 dilution. After incubation, the membrane was washed for 10 min in TBS/T for 3 times, incubated with secondary antibodies conjugated with horseradish-peroxidase (HRP), and immunoreactive bands was visualized by ECL Plus Western Blotting Detection system (Bio-Rad Laboratories, Inc., Hercules, CA, USA) using G:Box ChemiXL 1.4 (Syngene; Synoptics, Cambridge, UK). Densitometry analysis was performed using Image Lab
TM software.
Proteomics
To investigate the protein expression profile of cancer cells upon inhibiting the candidate MR-IE, the extracted proteins were prepared according to the protocol listed in a previous investigation [
16]. Cells were lysed using 1% Triton-X buffer supplemented with protease inhibitor cocktail. The resulting proteins extracted were precipitated using acetone stored at -20
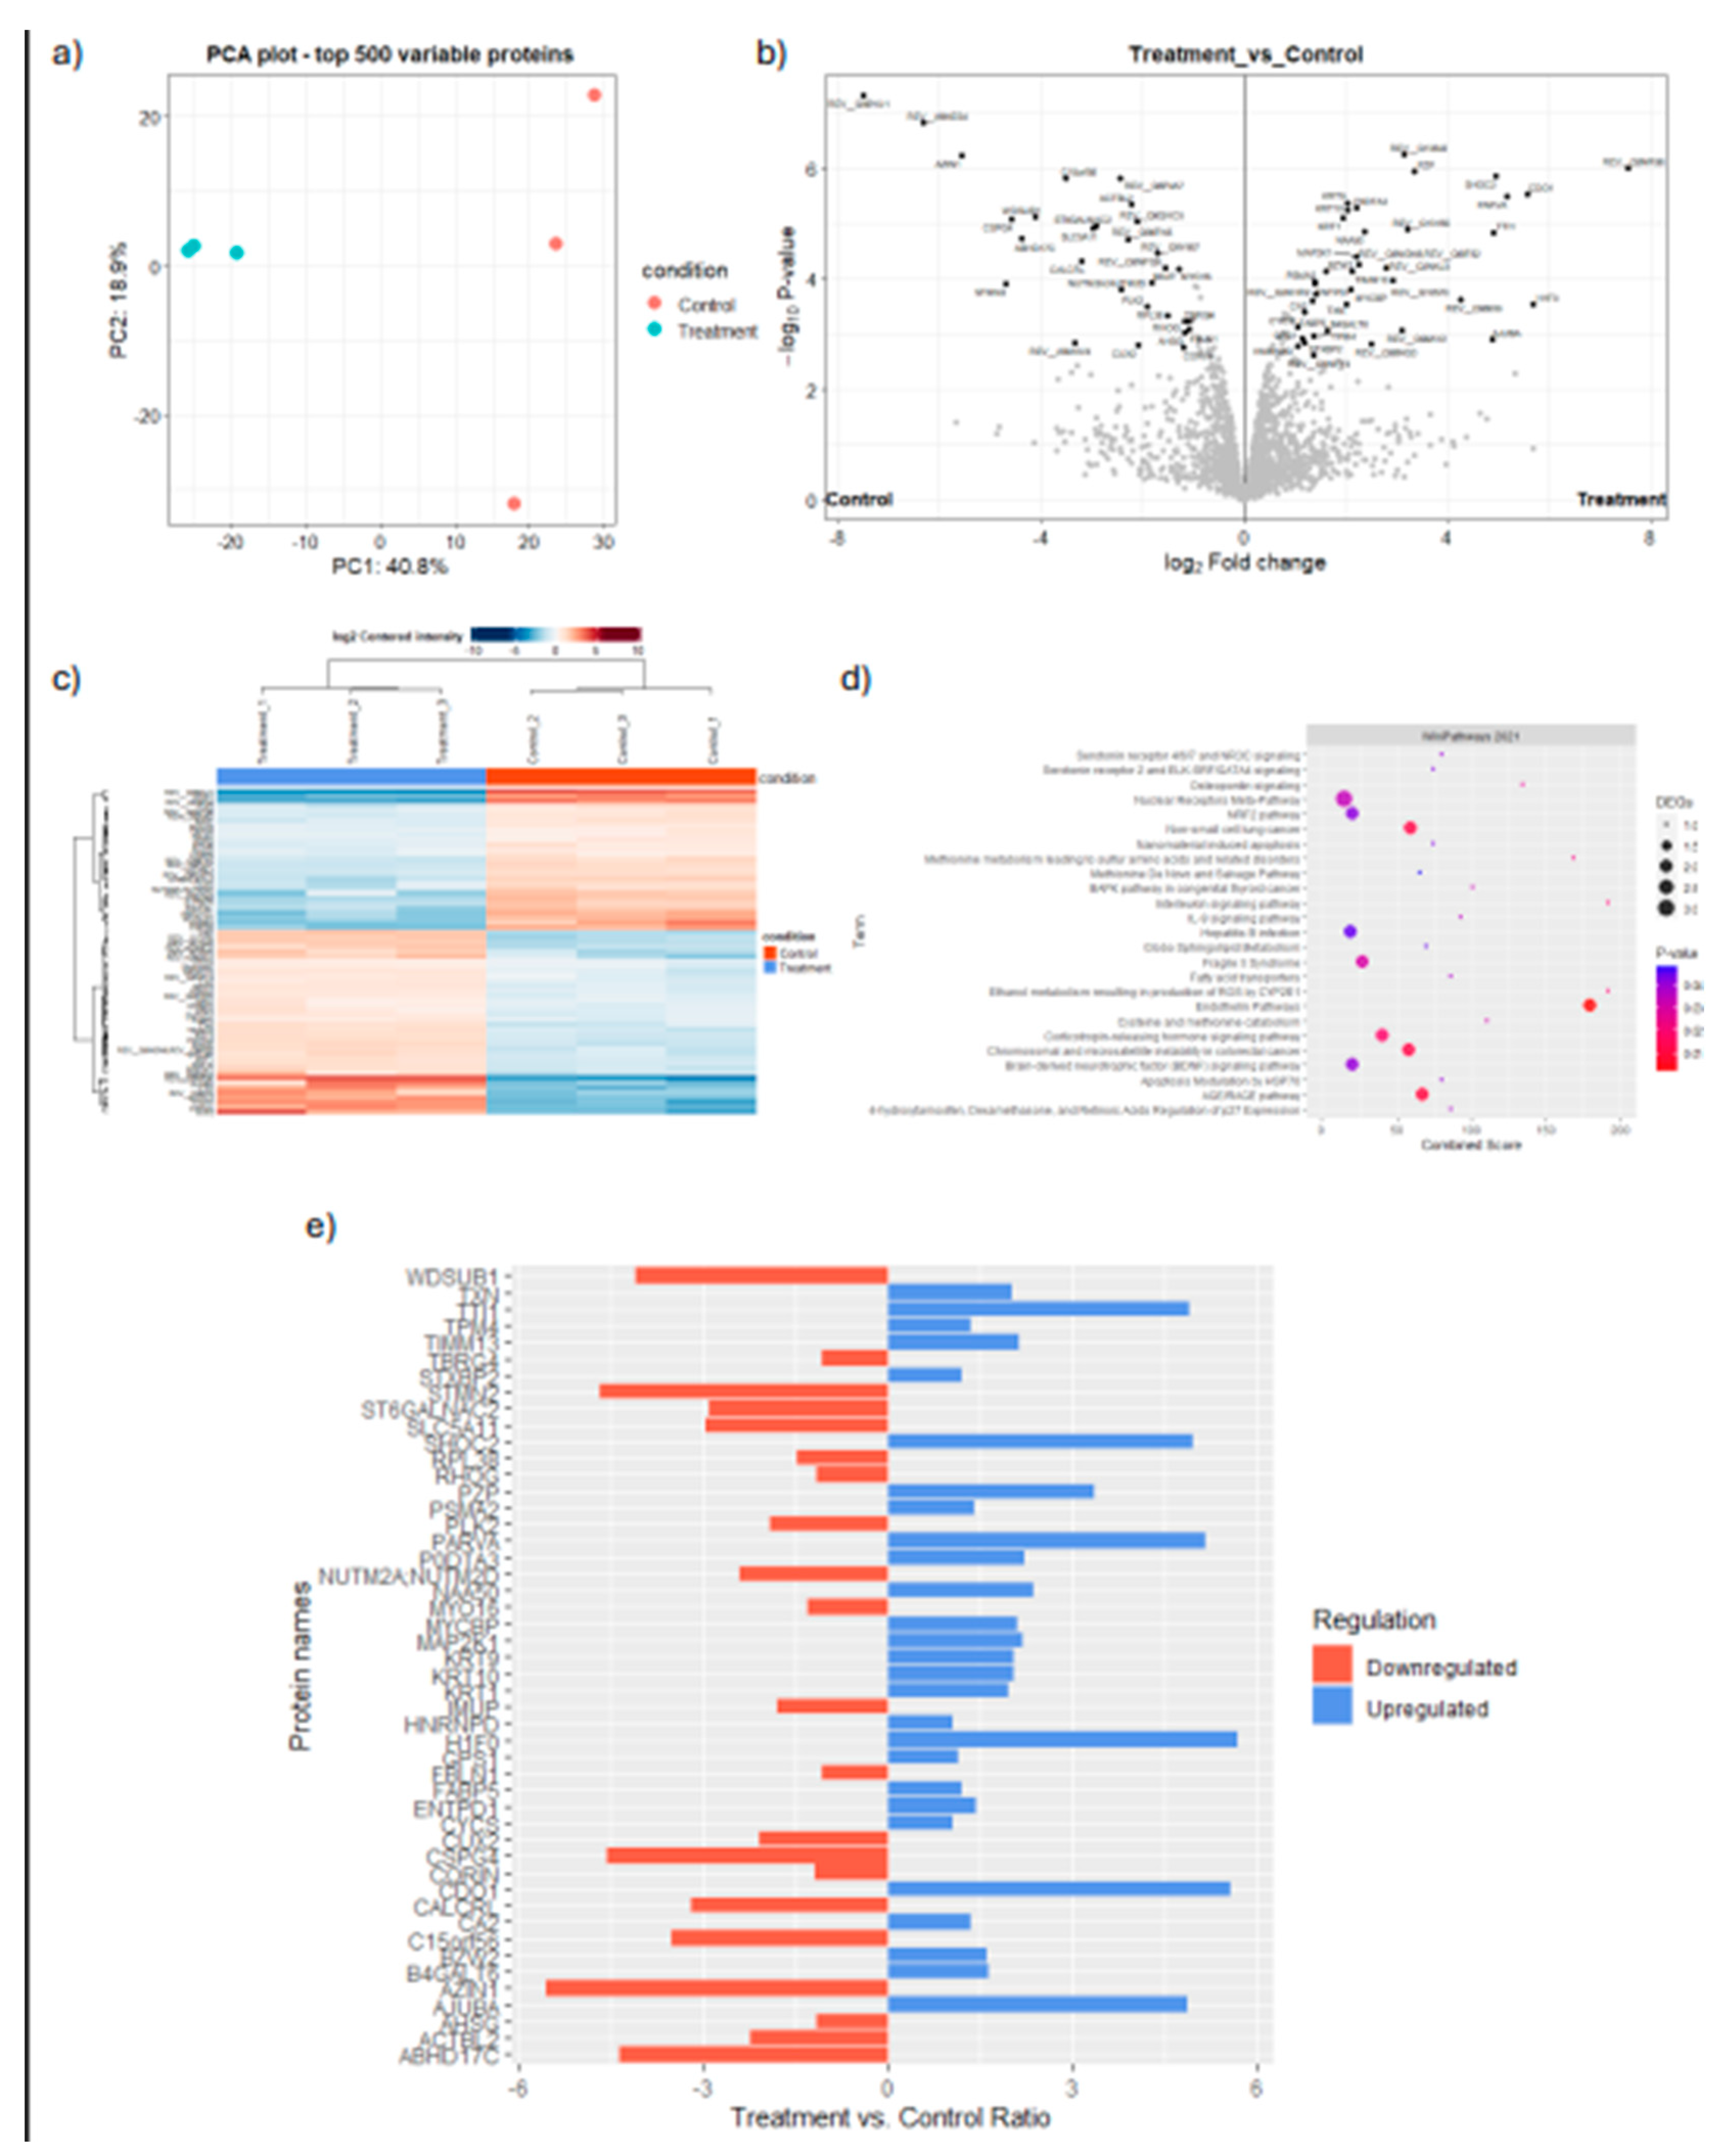
oC for 16 hours. After precipitation, the protein pellet was reconstituted in 0.25% RapidGest SF (Waters, UK) in 10 mM Ammonium bicarbonate. A total of 1.2 mg peptides were subjected to LC-MS/MS. The spectrum data was collected using OrbiTrap HF hybrid mass spectrometer. The raw data files were analyzed using MaxQuant to obtain protein identifications and their respective label-free quantification values using in-house standard parameters. Normalization and differential protein expression analysis was performed on the relative protein abundance matrix conducted using the Bioconductor package ‘DEP’ in R. The cutoff for candidates considered as significantly differentially expressed was LFC of log2(2) at a p-value < 0.05. Results were visualized using ‘Enhanced Volcano’ and ‘ggplot2’ packages. Differentially expressed proteins were then analyzed in iLINCS SPIA analysis using the KEGG Pathway analysis database for signaling pathway enrichment.
Cell Viability and Proliferation Assays
5 × 10
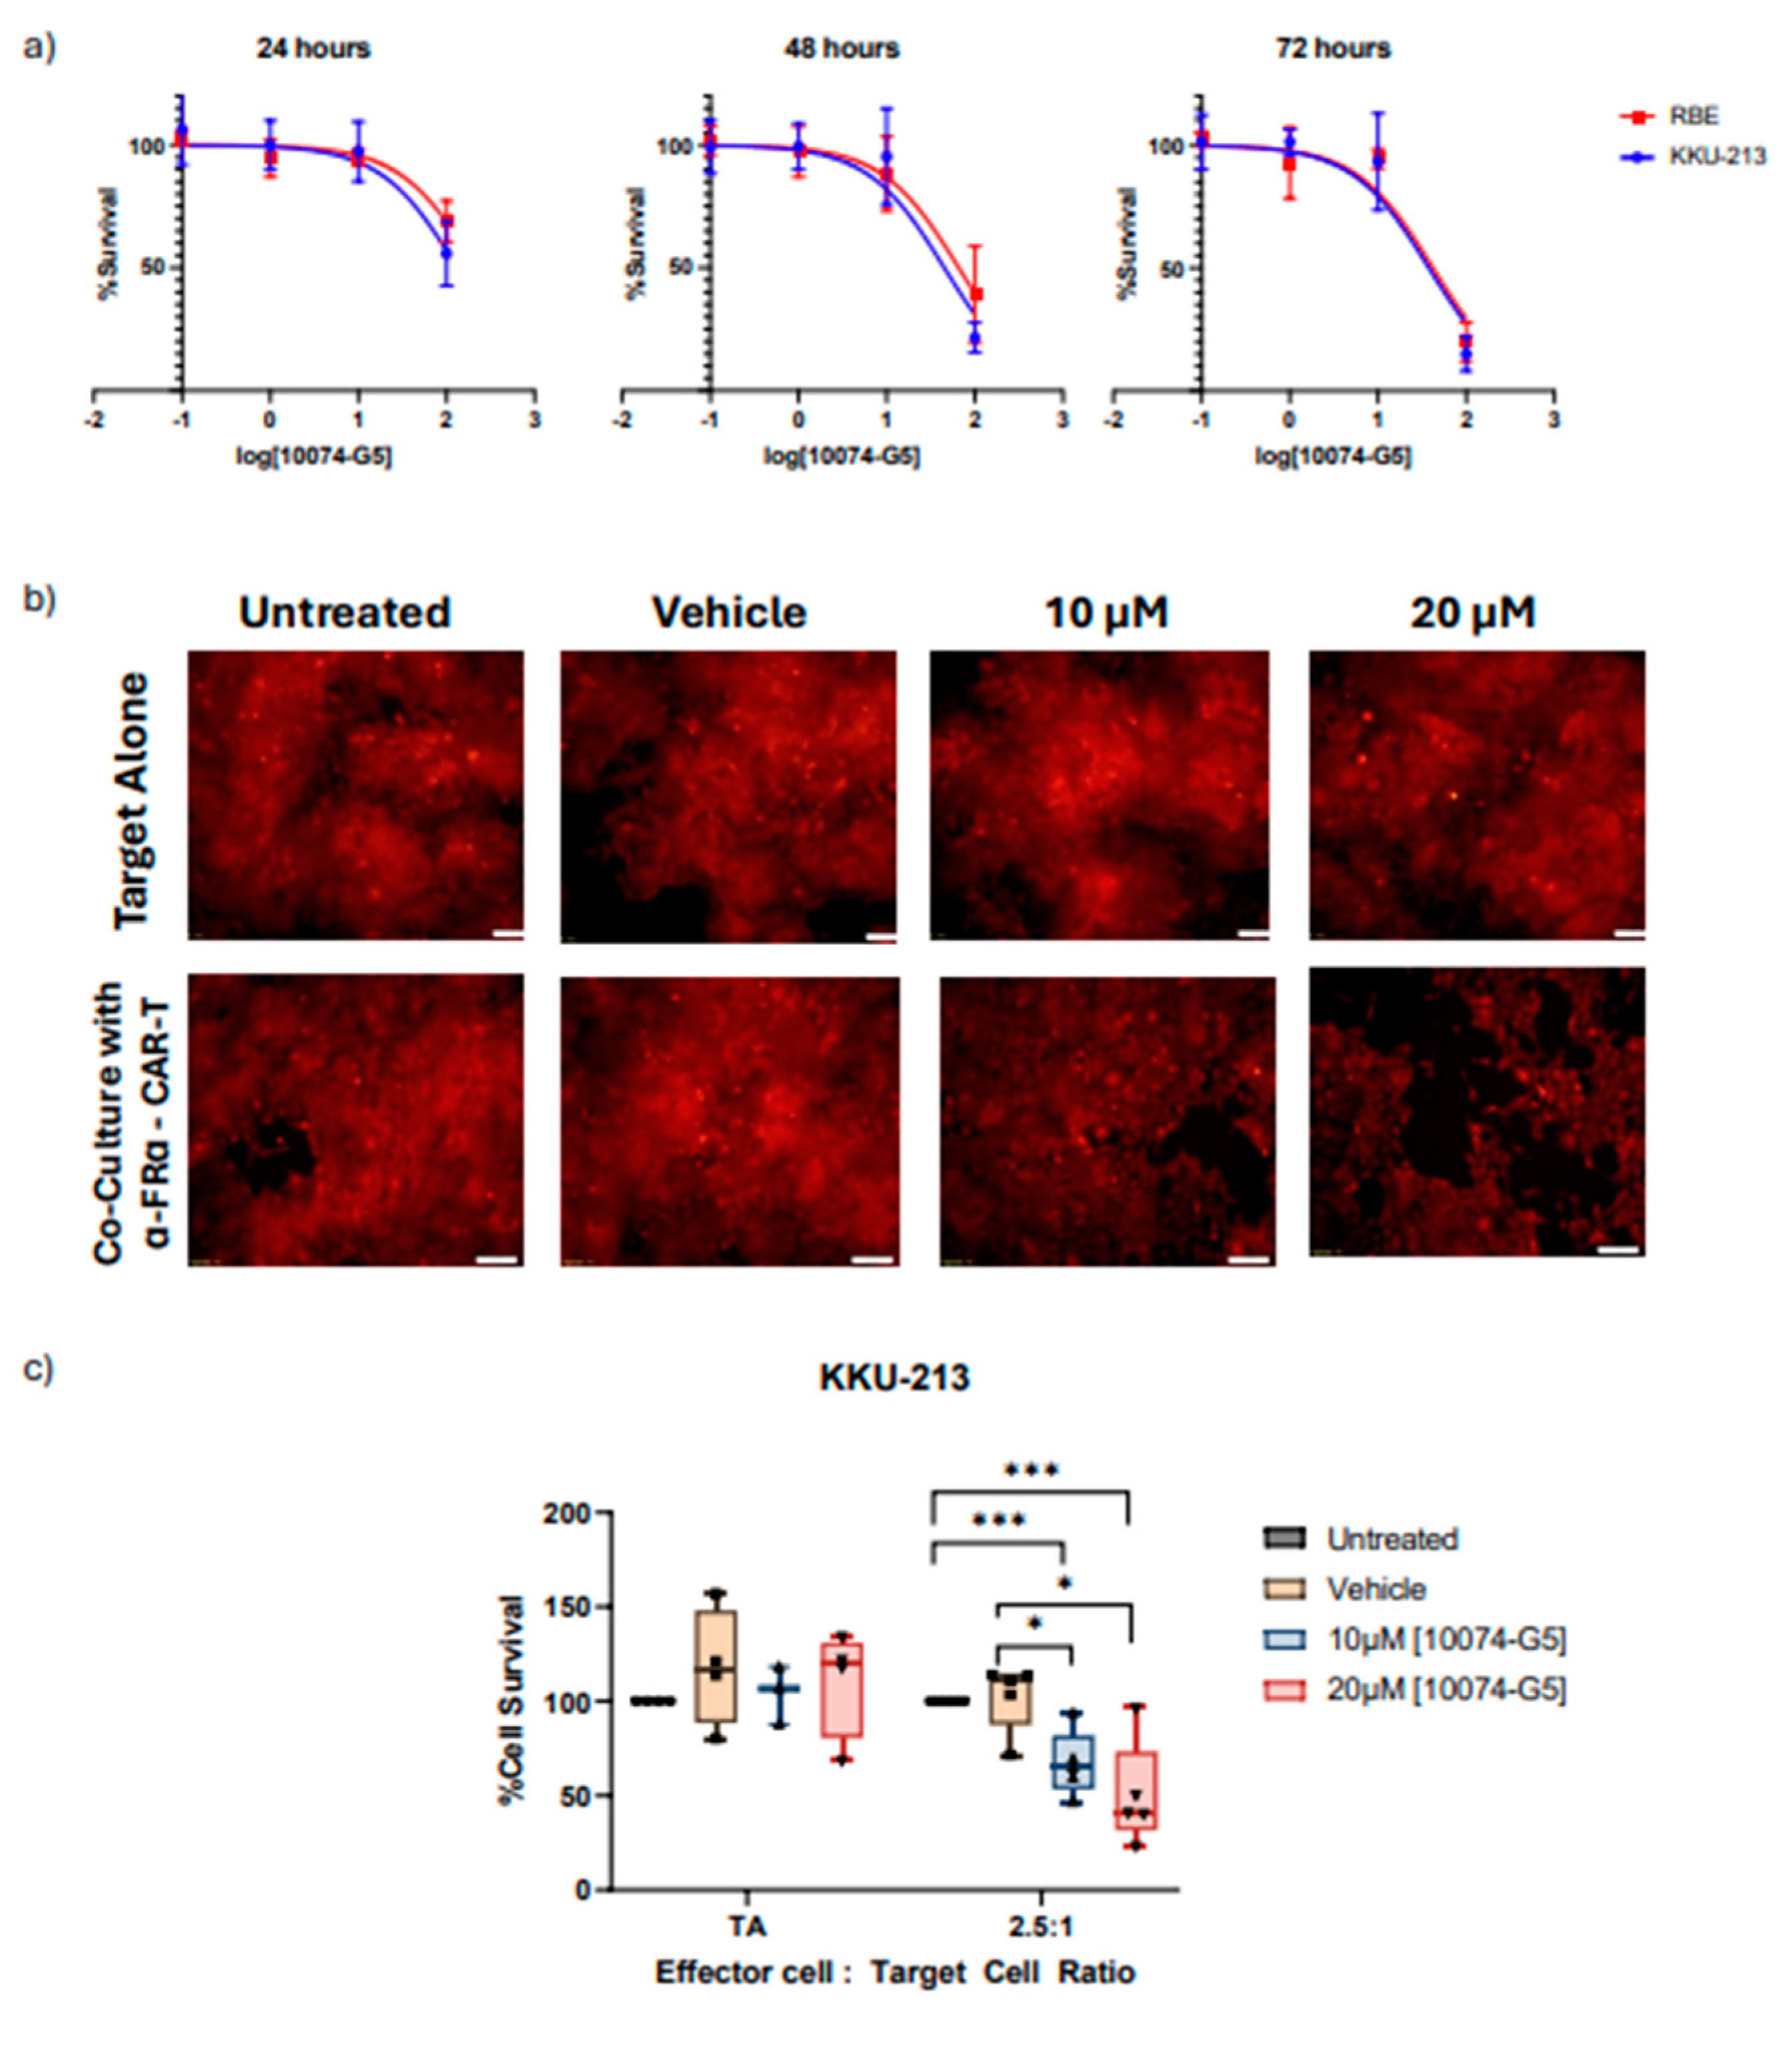
3 cells per well were seeded in a 96-well plate for 24 hours, and treated with either MYC inhibitor (10074-G5). Cell viability was assessed at 24-hour intervals up to 72 hours post-treatment. Vehicle control was 0.1% DMSO-containing complete medium. MTT assay was performed according to standard protocol [
15]. For assays that require 96-hour treatment, 1 x 10
3 cells were seeded in a 96-well plate for 24 hours and then treated.
Isolation of PBMCs and activation of T-cells.
Blood from 50 ml of healthy volunteers was drawn and PBMCs were isolated by lymphocyte separating medium (Corning), centrifuged according to density. A total of 5x10⁶ cells/well was then seeded in a 12-well plate in AIM-V cell culture medium (Gibco) and incubated for 2 hours at 37oC for monocyte cell adhesion. The resultant cell suspension are non-adherent T-cells which are cultured in AIM-V cell culture medium (Gibco) in the presence of phytohemaglutinin and cytokines IL-2 for 3 days.
Production of fourth generation FRα-CAR T-cells.
Isolated T-cells were transduced with FRα-CAR lentiviruses at a multiplicity of infection (MOI) of 50 using a reported method [
17]. T-cells were cultured in AIM-V cell culture medium containing 5% human AB serum, IL-2, IL-7 and IL-15 for 4 days. Expression of FRα-CAR T-cells was assayed by flow cytometry (BD Biosciences) technique after cells stained with mouse anti-FRα antibody (1:100 in 1% BSA/PBS, Thermo Fisher Scientific), goat anti-mouse IgG (1:100, Thermo Fisher Scientific), and Alexa Fluor®488 (1:500, Thermo Fisher Scientific).
Statistics and Data Analysis
Data was collected in triplicates and three independent rounds, wherever applicable. Student t-test or the One-way ANOVA with Tukey's post-hoc test was conducted to assess statistical significance at p < 0.05 (*).
Results
Analytical Pipeline
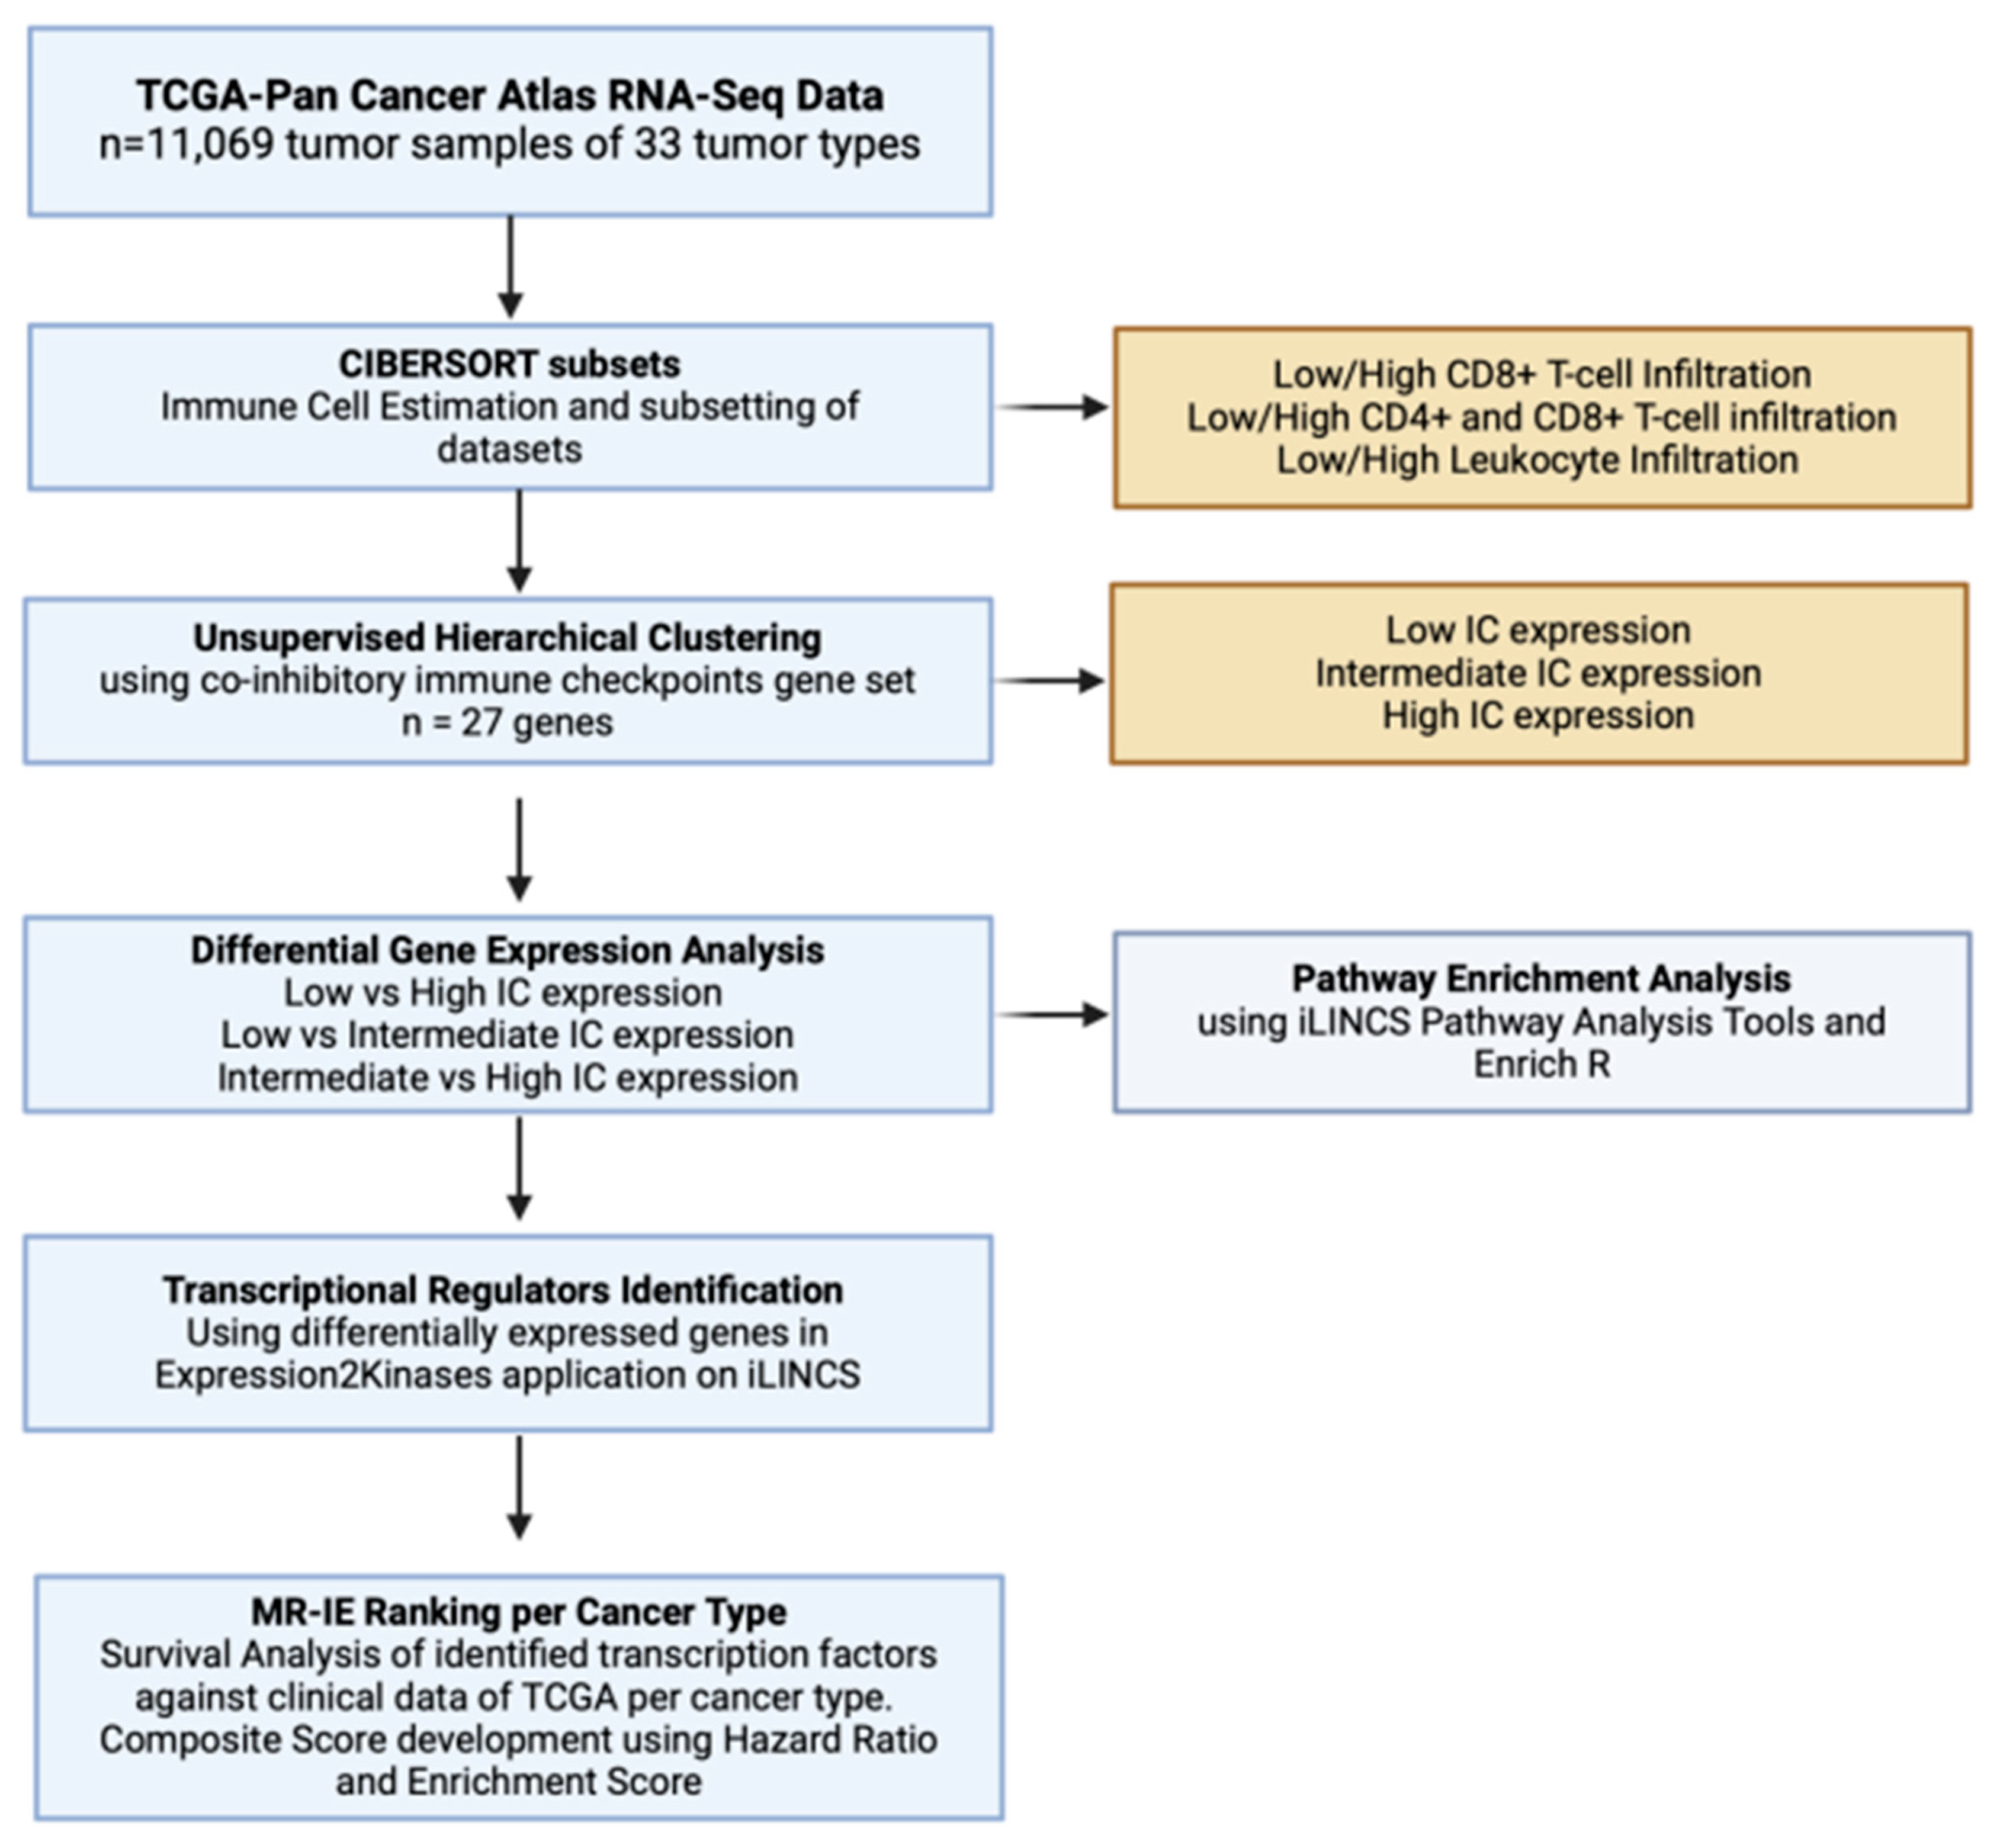
Immune evasion occurs through the synchronous process of immune cell infiltration, co-inhibitory IC expression and modulation of immune related markers. To identify transcriptional regulators that controls these processes, the PanCancer TCGA samples must be subset according to varying degrees of estimated infiltration and then stratified into varying degrees of co-inhibitory IC expression. The transcriptome of these data subsets and clusters are then compared with each other to unravel the different signaling pathways associated with the immune evasion process. The DEGs from these comparisons are then used as an input for transcription factor enrichment to identify MR-IE from varying degrees of leukocyte estimates and IC expression across cancers. These candidates are then ranked according to a composite score. This accounts for the effect of transcription factor gene expression on patient overall survival as well as statistical enrichment scores. This workflow is summarized in
Figure 1.
TCGA samples can be stratified based on estimated immune cell infiltration and IC expression
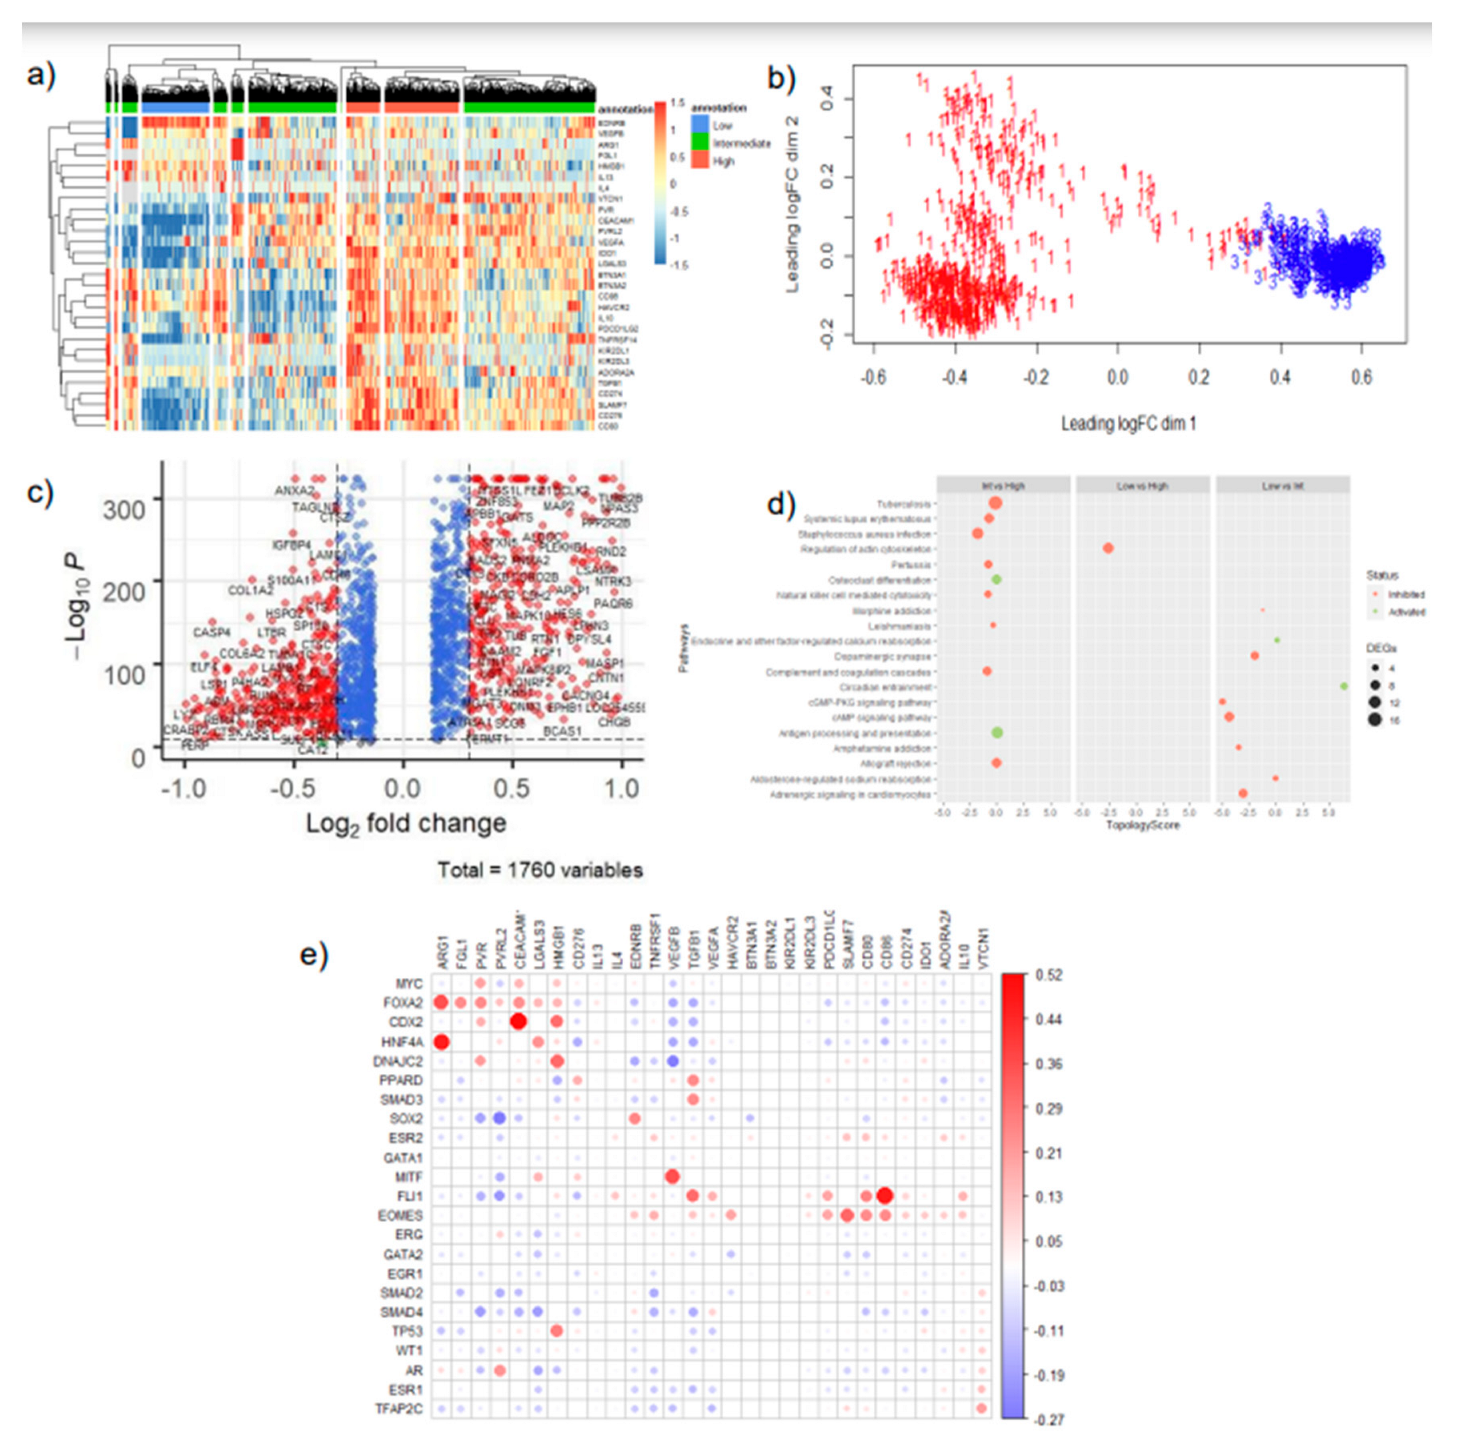
In our investigation, we employed a deconvolution algorithm, CIBERSORT, to estimate the proportion of immune cells in TCGA bulk-tissue transcriptomic data. Subsequently, we utilized unsupervised hierarchical clustering to further stratify the samples in clusters of low, intermediate and high IC expression (Table 1,
Figure 2,
Supplementary Figures S1–S4). Interestingly, varying degrees of leukocyte estimation resulted in the formation of different clusters of samples of low, intermediate, and high IC gene expression levels (
Supplementary Figure S1). Particularly, CD4+ and CD8+ T-cell estimates, resulted in more distinct clusters of mainly low and high co-inhibitory IC expression, with a few samples having intermediate expression of IC molecules (
Figure 2a,b). Thus, the presence of these cell types, in particular, may influence the expression of co-inhibitory ICs in cancer cells.
Immune evasion is driven by various signaling cascades depending on different levels of IC expression and leukocyte estimation
When looking at transcriptome level changes between low and high IC expression across the varying subsets of leukocyte estimates, we unravel the signaling pathway changes that are associated with the immune evasion phenomenon. High or Intermediate IC expressing samples represent an immunologically cold (anti-tumoral immune cells do not surveil) tumor, whereas Low IC expressing samples represent an immunologically hot (anti-tumoral immune cells recognize and eliminate cancer cells) tumors.
Accordingly, our differential gene expression analysis between the differing levels of IC expression reveals an inhibition of NK-cell mediated cytotoxicity pathway and T-cell receptor signaling pathway amongst clusters of intermediate and high IC expression (
Figure 2d, Supplementary
Figure S8a,d–g). Notably, in subsets of data that is highly estimated with leukocytes (
Supplementary Figure S8b) antigen processing and presentation pathway is seen to be inhibited, between clusters with intermediate to high IC expression. Moreover, cytokine-cytokine receptor signaling pathways are activated, and interestingly chemokine signaling pathways are inhibited in these highly CD4+ and CD8+ T-cell estimated subsets (
Supplementary Figure S8d, 8f). This suggests that the levels of IC expression, and particular infiltration of CD4+ and CD8+ T-cells may trigger the secretion of cytokines to promote an immunosuppressive environment. Interestingly, amongst the low immune-cell estimated subsets (
Figure 2d, Supplementary
Figure S8c,e,g) the inhibition of NK-cell mediated cytotoxicity and T-cell receptor signaling pathways are maintained. However, several cancer-specific pathways are seen to be inhibited such as cAMP signaling and cGMP-PKG signaling.
Collectively, our robust workflow incorporating estimated immune infiltration of tumors and IC expression stratification of tumors confirmed and unraveled pathways related to immune evasion. This provides confidence that the DEGs would be able to identify a transcriptional regulator central to these pathways.
EGR1 and MYC are identified as top-ranking MR-IE in multiple cancers
The transcription factor enrichment analysis conducted resulted in 21 significant candidate MR-IE across the various subsets and IC expression clusters. To assess the likelihood of these candidate MR-IEs in regulating the expression of ICs, we assessed the co-expression between the transcription factors and ICs across all cancers. This revealed groups of candidate MR-IEs that are positively-correlated with specific ICs and negatively-correlated with other ICs (
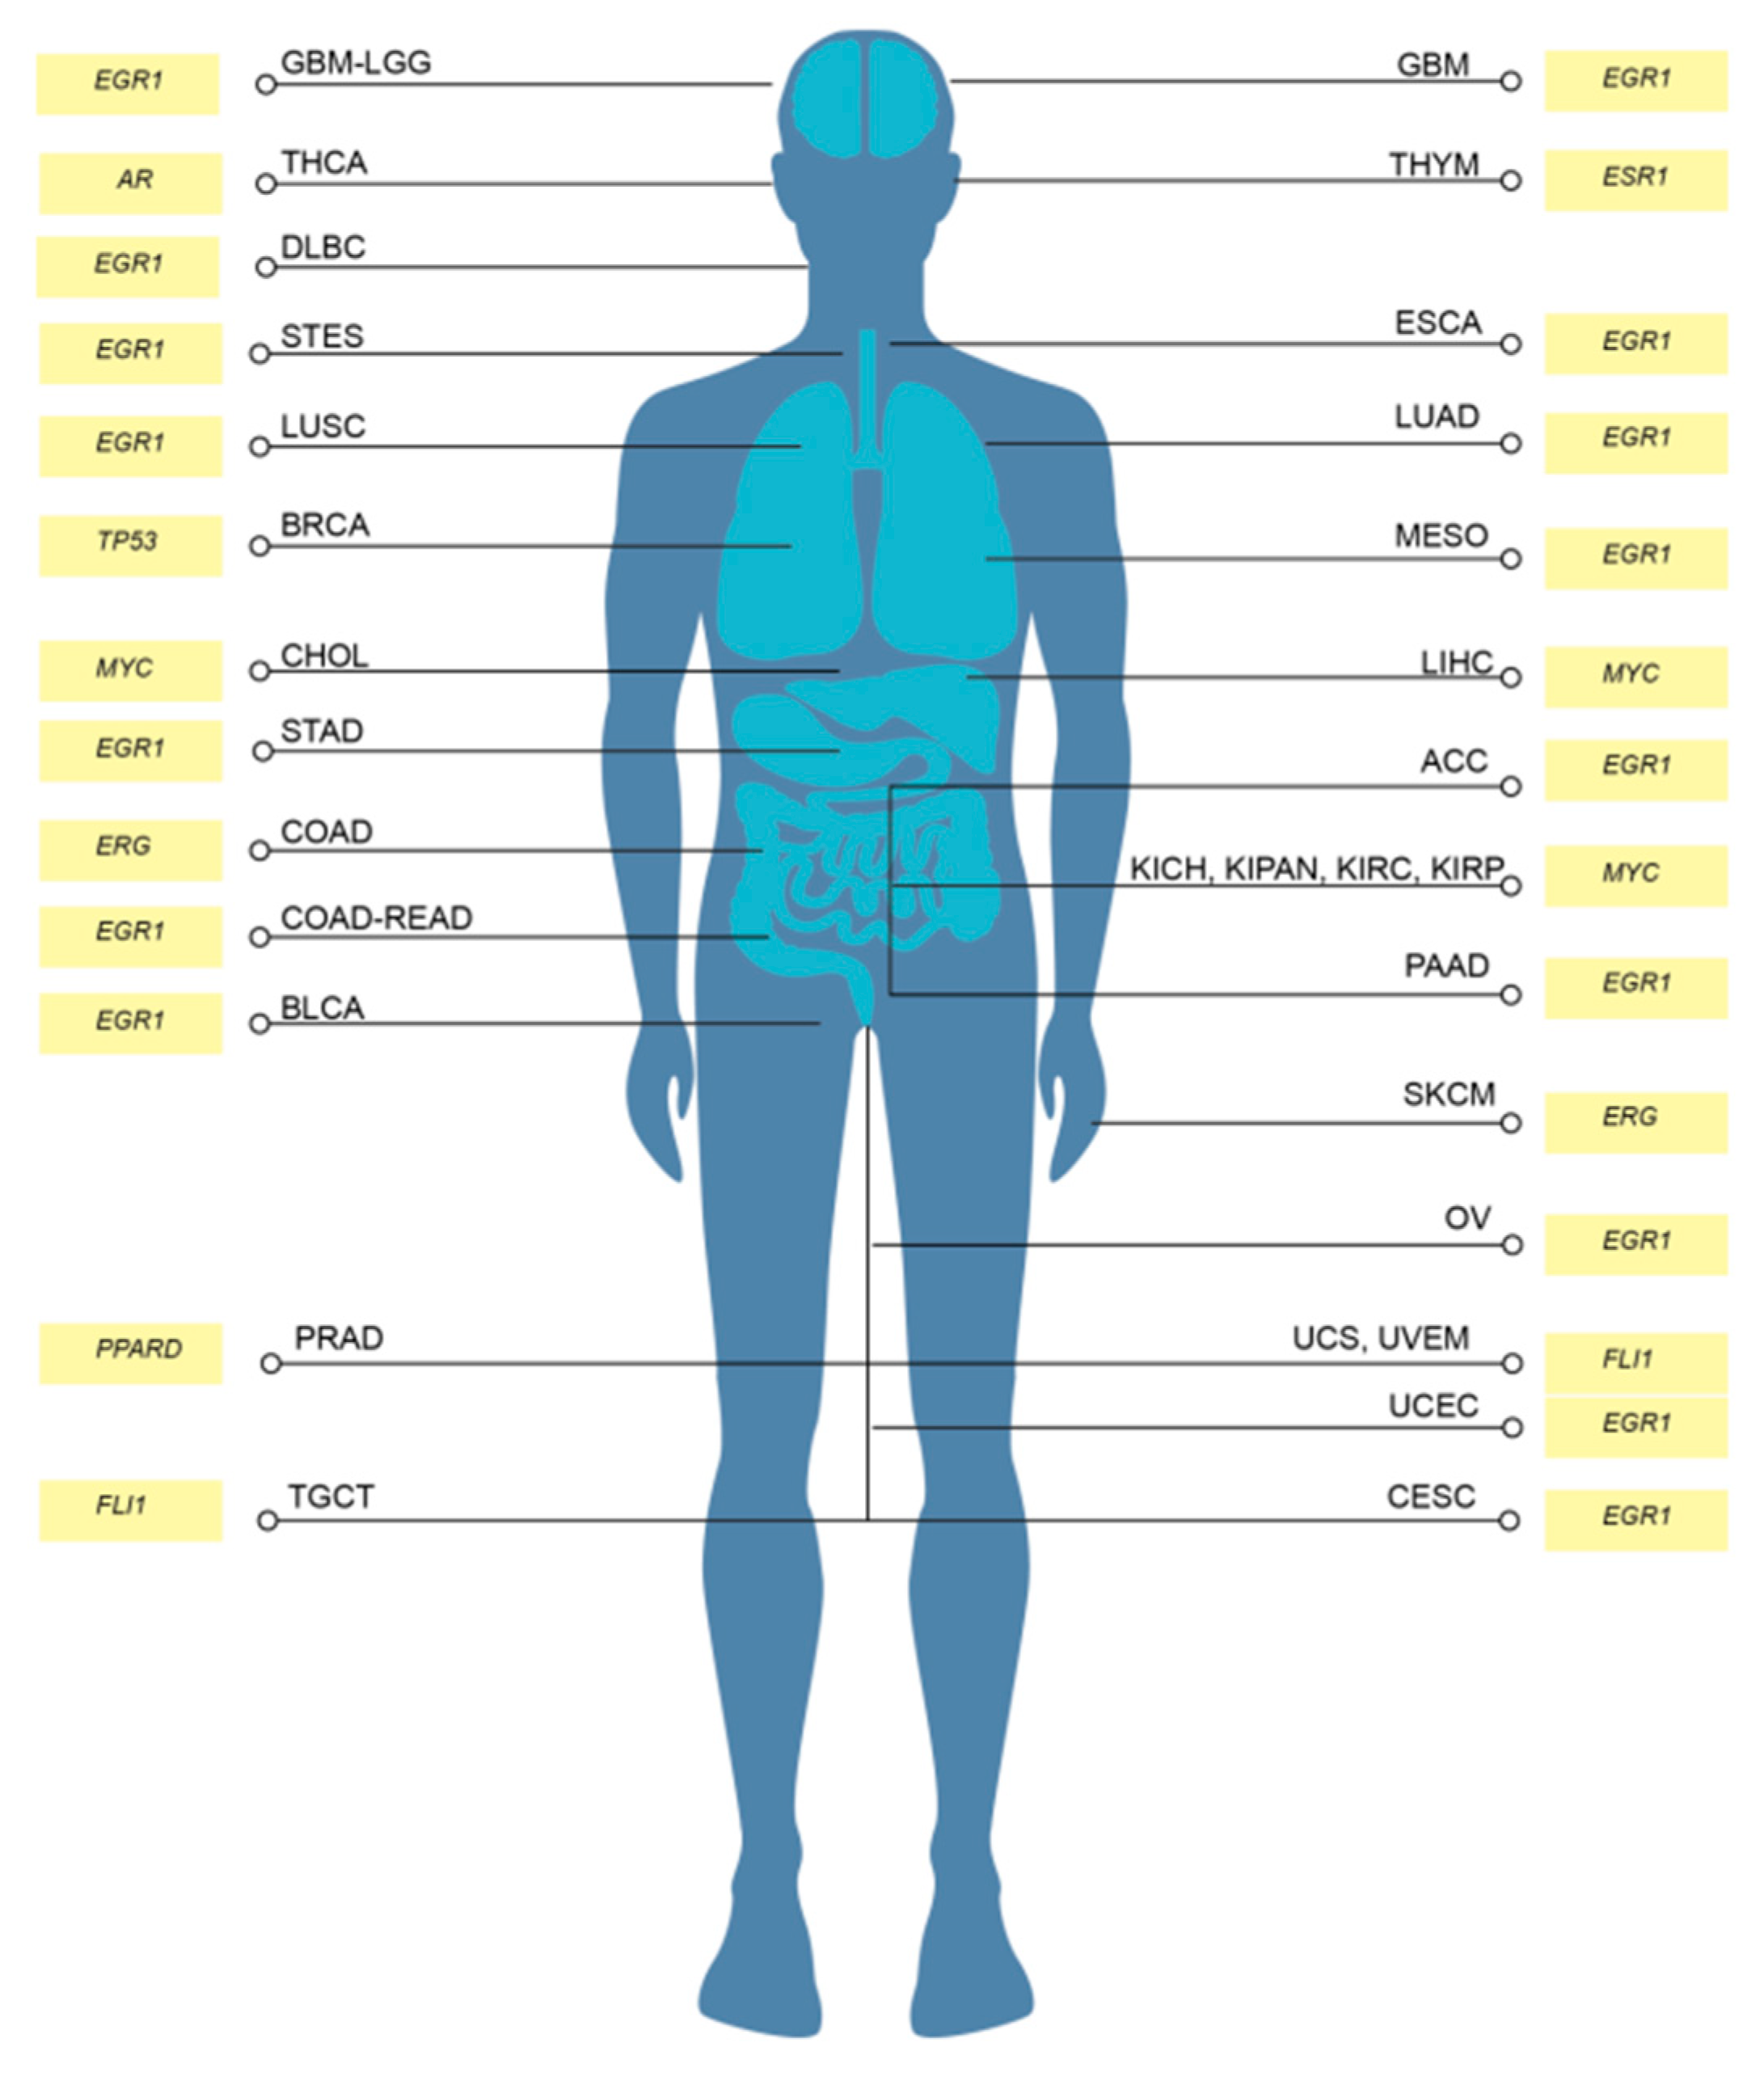
Figure 2e). For example, the candidate MR-IE, FOXA2, is significantly positively-correlated with the expression of ARG1, FGL1, PVR, PVRL2, CEACAM, LGALS3, HMGB1, and PD-L1 (CD276). However, it is negatively-correlated with the expression of VEGFB and TGFB1. This provides insights into the potential positive or negative regulation of these candidate MR-IE of the ICs. Nevertheless, there may be lineage-specific co-expression patterns that is not accounted for in this analysis. Thus, to rank the ideal candidate MR-IE per cancer type, we employed a cox proportional univariate analysis of each transcription factor against overall survival of each of the 33 TCGA cancer types. The hazard ratio and enrichment scores of candidate MR-IE per cancer type are tabulated in Table 2. A composite score comprising of enrichment scores, statistical significance and hazard ratios was devised to rank candidate MR-IE for each cancer type (Table 2 and Table 3). The top-ranking candidate MR-IE per cancer type is depicted in
Figure 3. The cancer types are listed as per TCGA study abbreviations.
Notably, EGR1 appeared as the top-ranking candidate MR-IE in multiple cancer types, such as GBM, DLBC, ESCA, LUAD, LUSC, MESO, ACC, STAD, COAD-READ, BLCA, PAAD, OV, UCEC, and CESC, Whereas MYC appears to be the top-ranking candidate in particularly liver and renal associated cancers (i.e. LIHC, CHOL, KICH, KIPAN, KIRC, and KIRP). Nevertheless, MYC was frequently ranked second in cancer types with EGR1 as the top-ranking candidate. Thus, these two candidate MR-IE ranked based on mortality-association and statistical significance would make ideal immunotherapeutic targets. Other candidate MR-IEs include TP53 for BRCA, AR for THCA, FLI1 for TCGT, UCS and UVEM, and PPARD for PRAD.
Our investigation focuses on providing therapeutic solutions for a pressing issue in Thailand, cholangiocarcinoma (CCA; CHOL). CCA is a prevalent malignancy with a complex tumor microenvironment. Unfortunately, current therapeutic options are incapable of treating complex heterogenous patient populations,. Thus, this investigation assesses MYC as an immunotherapeutic target for CCA.
MYC perturbation in CCA results in downregulation of PD-L1
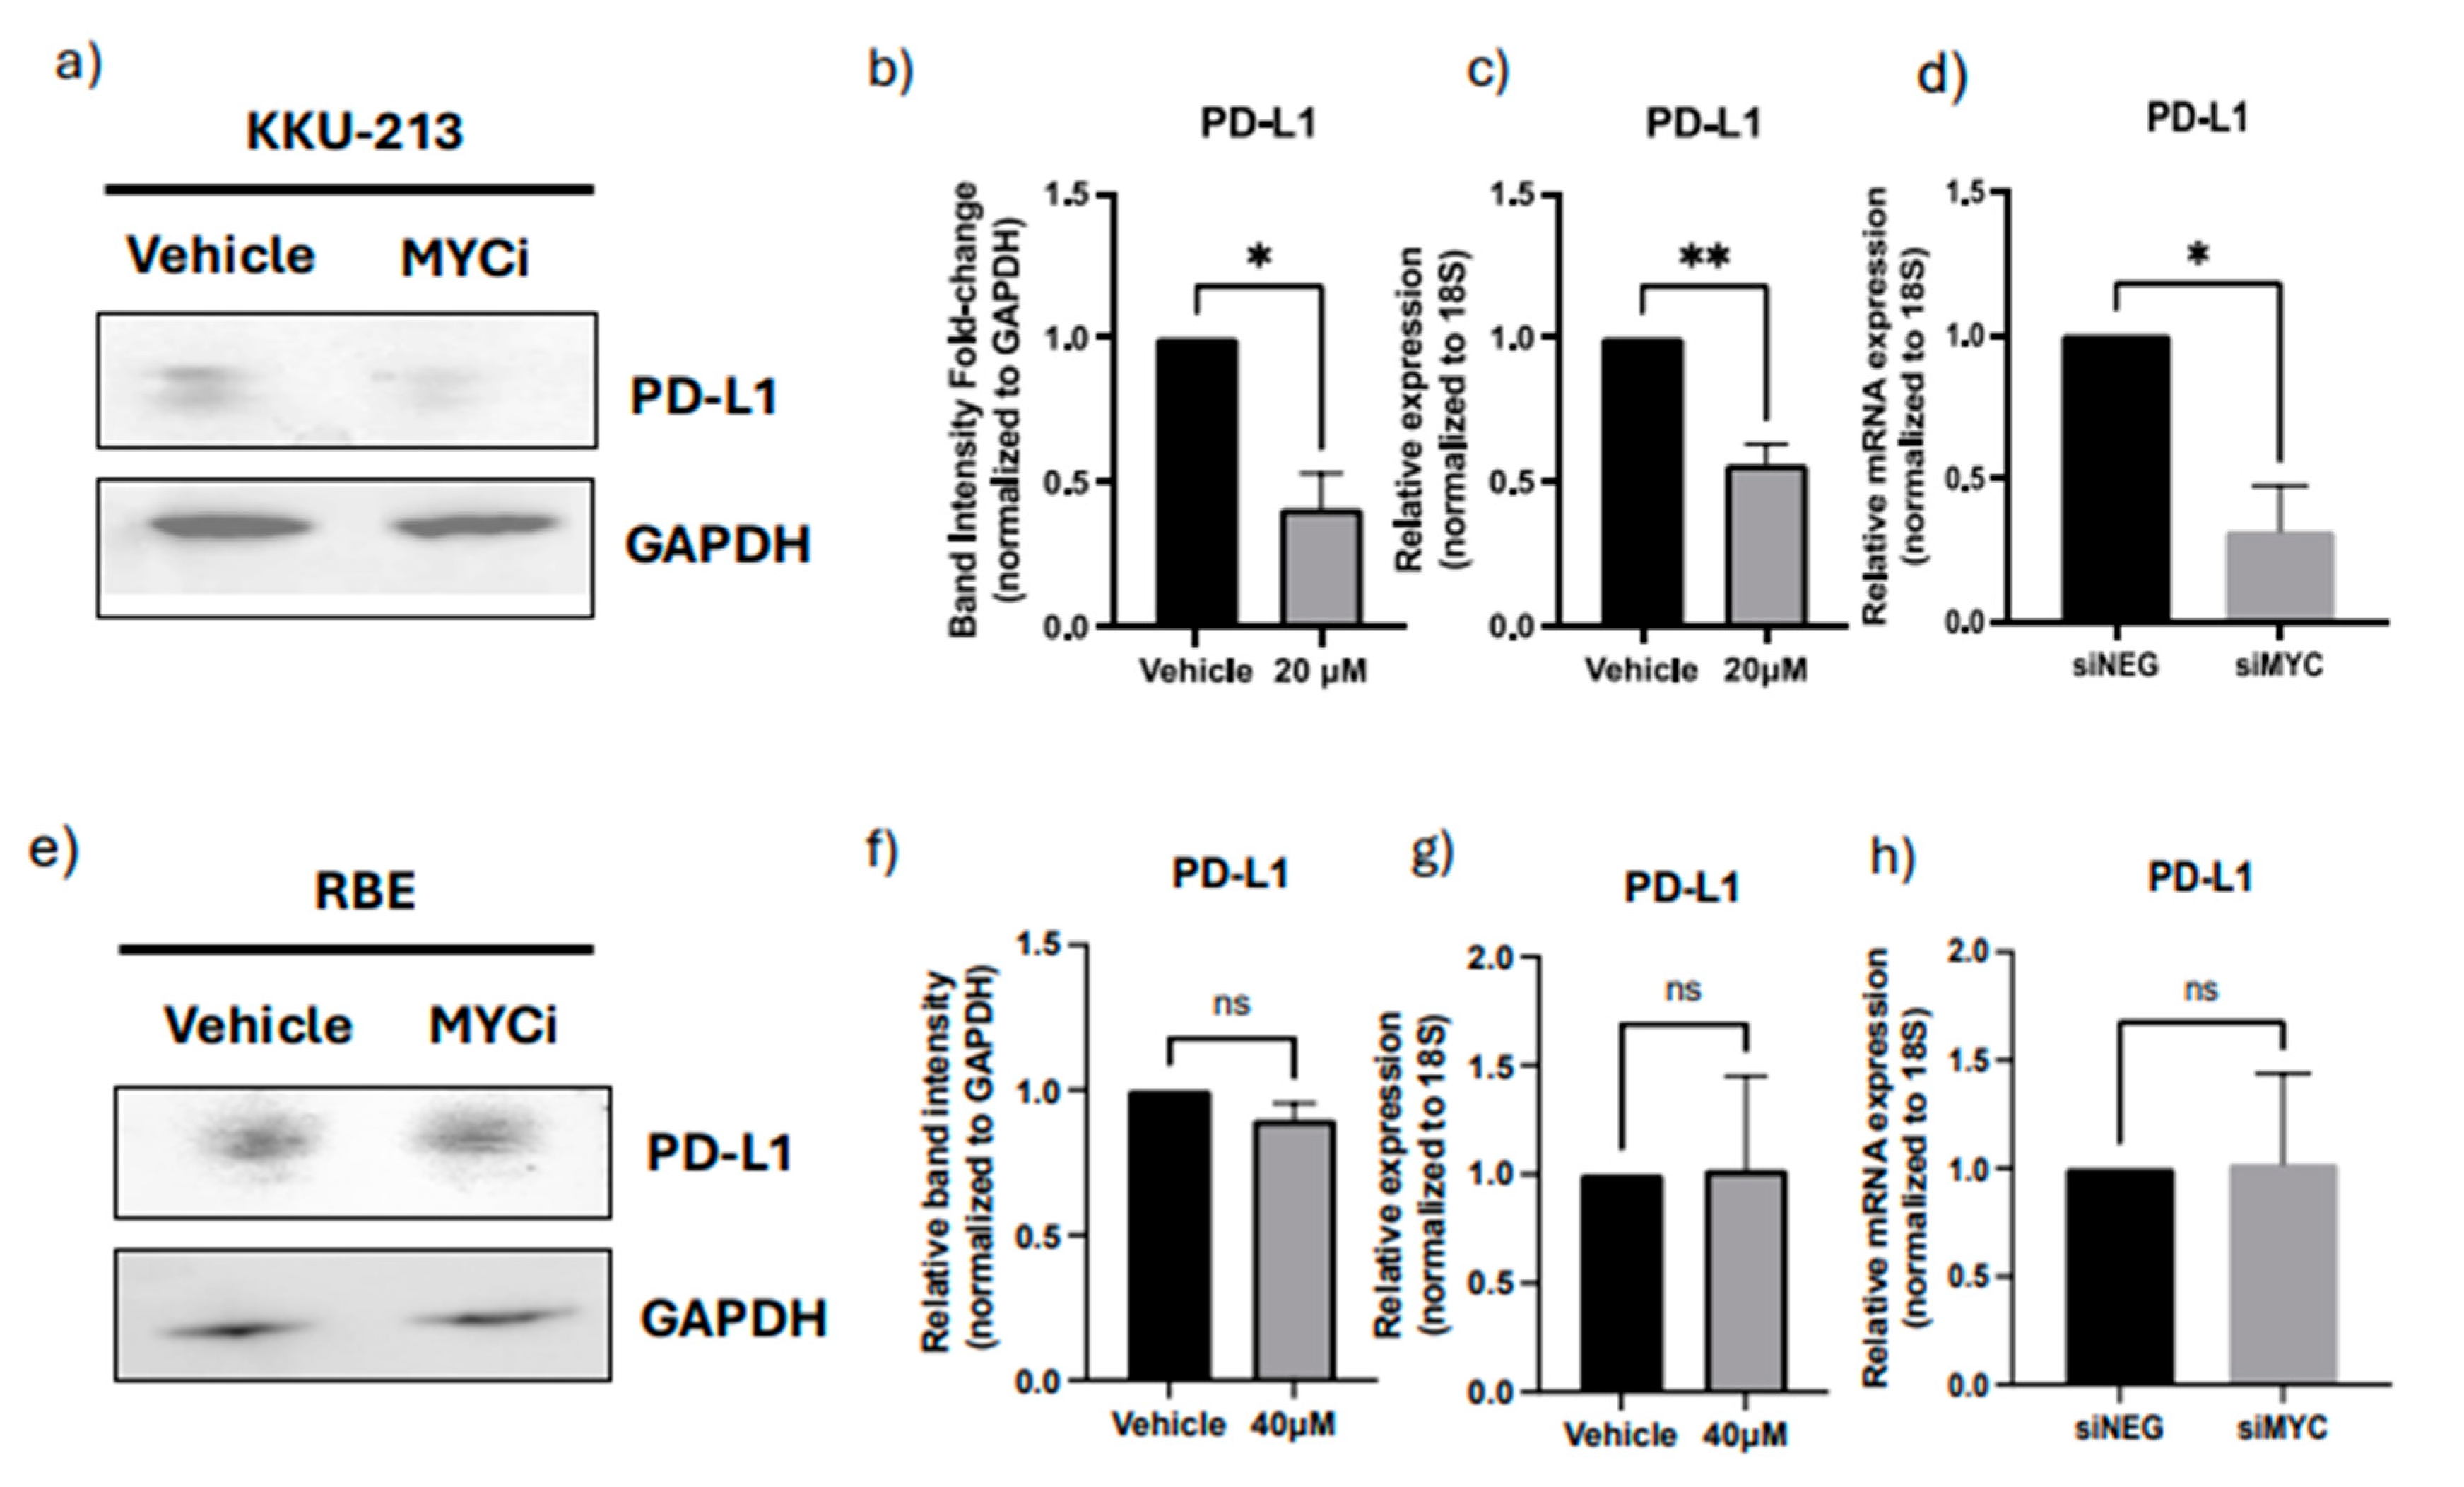
To validate MYC as an MR-IE for CCA, we assessed its role in regulating the expression of a representative IC molecule, PD-L1. In KKU-M213 cells, we observe that a therapeutic inhibition of MYC using a MYC inhibitor (10074-G5) (Supplementary
Figure S9a,b) resulted in a significant downregulation of protein and gene expression of PD-L1 (
Figure 4a,b). These results are maintained when the MYC gene was knocked down using siRNA interference (
Figure 4d, Supplementary
Figure S9e,f). Contrastingly, the RBE cells displayed a modest decrease in protein expression but no significant difference in gene expression (
Figure 4e–h). Several factors could contribute towards the discrepancy in the molecular regulation of PD-L1 between these cell lines, including heterogeneity within CCA and unexplored compensatory mechanisms. Thus, in this investigation, we further explored KKU-M213 as the hypothesized ‘responsive’ cell line, and the representative cell line for a patient population with similar molecular profiles for which this novel immunotherapeutic strategy is surmised to benefit.
Discussion
Immune evasion is a meticulous process that synchronizes several signaling cascades within tumor cells and its surrounding stromal cells to facilitate the proliferation and invasion of tumors to secondary sites [
18]. These include the expression of co-inhibitory IC molecules on tumor cells and immune cells, infiltration of pro-tumoral immune cells, downregulated self-antigen presentation, and the secretion of immunosuppressive cytokines [
19]. Thus, impeding any one pathway leaves room for several mechanisms to compensate for the inhibition. Existing cancer immunotherapies improved patient outcomes using ICB in lung [
20], renal [
21], bladder [
22] and head-and-neck cancer [
23]. However, only 30-40% of patients are either eligible or respond to these treatments [
6]. Hence, this warrants the need for more potent and context-specific therapeutic strategies to cater to different patient populations. The present investigation offers a novel and potentially more effective therapeutic strategy by exploiting the multifunctional and multitargeted roles of transcriptional regulators of immune evasion. Our investigation identified MR-IE for each cancer type by integrating deconvolution algorithms, hierarchical clustering, transcription factor enrichment analyses, and survival analyses (
Figure 1,
Figure 2 and
Figure 3). Therefore, this investigation provides a high-confidence list of MR-IEs as candidate immunotherapeutic biomarkers for each cancer type (Table 2,
Figure 3), to encourage the development of small-molecule inhibitors against these targets.
Tumors possess a complex architecture comprising of various stromal cells, cancer associated fibroblast, and various immune cells. The infiltration of these cells is closely associated with clinical implications [
24]. Hence, it is imperative to address the infiltration of immune cells in the tumors of the TCGA cohort, to fulfill our quest for the MR-IE. One caveat of using the TCGA PanCancer dataset is the information loss of tumor-infiltrated and surrounding cells due to bulk-tumor sequencing. To circumvent this issue, computational methods have been developed to estimate the proportion of various immune cells by assessing similarity of gene signatures of samples to the gene signatures of immune cells [
25]. In our investigation we adopted the CIBERSORTx algorithm to estimate immune cell infiltration. Consistent with prior reviews, our investigation shows that high infiltration of CD8+ and CD4+ T-cells in the tumors influences inhibitory IC expression, and is associated with cytokine-receptor signaling pathways across cancers (
Supplementary Figures S1 and S8).
CCA is a heterogenous lethal malignancy of the bile duct, with its peak incidence and mortality rate in Northeastern Thailand, and a growing incidence rate worldwide [
26]. The lack of early-stage symptoms, diagnostic markers, and rapid progression contributes toward rising mortality rates. This trickles down to a lack of effective therapeutic strategies for advanced stage patients [
10,
27]. Recently immunotherapy including ICB, agonist antibodies and CAR-T cell therapy, has gained traction in the treatment of CCA. However, as with other cancer types, a minority of CCA patients qualify for immunotherapy based on biomarker expression and tumor mutational burden [
28]. The current objective response rate for clinical trials of ICBs such as pembrolizumab (KEYNOTE-158; KEYNOTE-028), nivolumab and ipilimumab (NCT02923934) ranges between 5-20%. Thus, to amplify therapeutic options for CCA patients, this investigation proposes the therapeutic inhibition of MYC (the top-ranking MR-IE of CCA;
Figure 3). Towards this, we showed that MYC inhibition potentiated immune-mediated cell death when co-cultured with anti-FRɑ CAR-T cells. Thus, this investigation highlights the potential of combining MR-IE inhibition with CAR-T cell therapy for a more potent treatment outcome (
Figure 6).
Our investigation reports, for the first time, that EGR1 is the most frequently high-ranked and clinically-relevant, MR-IE in the multiple cancer types. This was followed by MYC being the second-most frequently top-ranked MR-IE (
Figure 3). Currently, little is known of the role of EGR1 in anti-cancer immunity, which presents an opportunity for us to explore this as an immunotherapeutic target in the stipulated cancer types. This is supported by several investigations that report EGR1 as a “master regulator” of inflammatory enhancers in macrophages, by regulating the differentiation of monocytes to macrophages, and a myriad of inflammatory genes [
29,
30]. This shows merit in our workflow being able to aptly identify MR-IE in the right context. Moreover, since seldom reports thoroughly explore the therapeutic potential of targeting EGR1, prospects of the current investigation should explore this phenomenon.
MYC, on the other hand, is a well-established oncogene known to regulate several tumor-cell intrinsic mechanisms, to promote survival, growth, and proliferation of tumor cells. Recent reviews highlight the association of MYC with the expression of PD-L1 and CD-47 [
19], the regulation of T-cell activation and function, and polarization of macrophages [
31]. Consequently, MYC has become an ideal therapeutic target as an oncogene and as an immunotherapeutic target. However, the role of MYC is context-dependent, as the function of MYC is dependent on post-translational modifications and mutational burden of its gene targets, and the interaction of the cancer cells with tumor microenvironment [
32]. For instance, MYC inactivation induced proliferative arrest in hematological cancers [
33], whereas MYC inactivation in osteosarcoma resulted in terminal differentiation into bone [
34]. Thus, the role of MYC and its association with patient-mortality is dependent on the cancer lineage [
32]. Our workflow acknowledges the context-dependent roles of transcriptional regulators by accounting for its effect on patient overall survival when ranking the candidate MR-IEs (Table 2,
Figure 3). Therefore, this ranking system yields potential MR-IEs whose higher expression results in lower patient survival, thereby making them ideal therapeutic targets in the specified cancer type. We hypothesized that targeting of MR-IEs would reinstate immune recognition and elimination of cancer cells by downregulation of inhibitory ICs and upregulation of stimulatory immune-related markers. Accordingly, our validation assays confirm the role of MYC in regulating the expression of a co-inhibitory IC molecule, PD-L1 (
Figure 4). Moreover, anti-tumoral inflammatory markers such as IL-18, IL-10, and MAP2K1 were upregulated after MYC inhibition (
Figure 5), in CCA cells. The modulation of these markers is associated with reinstatement of immune recognition of cancer cells. Taken together, this provides confidence in our workflow to identify and rank candidate MR-IE per cancer type, that can be developed as immunotherapeutic targets.
While our robust workflow accounted for multiple aspects of immune evasion, there are limitations to our findings. Firstly, a caveat of the TCGA PanCancer Atlas is varied sample size per cancer type, resulting in biases in clinical significance of predicted MR-IE in each cancer type. Moreover, we used bulk-tissue transcriptomics to infer immune cell estimates. Alternatively, the incorporation of single-cell RNA sequencing data may provide better resolution into the interaction between highly and lowly infiltrated tumors, context-specifically. Additionally, this data does not account for heterogeneity within cancer subtypes. This was evidenced in the discrepancy in response to MR-IE inhibition between KKU-M213 and RBE cell lines. This may be due to differences in post-translational modifications of MYC’s gene targets, or varying genetic alterations between the two chosen cell lines. Thus, our workflow may need to be revised to account for these variables. Lastly, further investigation within CCA is required to confirm the therapeutic efficacy of MR-IE inhibition, in more complex tumor models.
Conclusively, we aimed to provide insight into the regulation of immune evasion as an alternative immunotherapeutic strategy. Towards this aim, this study developed a unique workflow that identifies and ranks candidate MR-IE as novel immunotherapeutic targets for each cancer type. As a result, MYC was identified to be the candidate MR-IE for CCA, and so we encourage the development of several small-molecule inhibitors against MYC for the treatment of CCA. We hope the findings of this investigation inspires further development of these MR-IEs as therapeutic targets to benefit a wider patient population.
Author Contributions
Conceptualization: S.V., S.C., Data Curation: S.V., S.C., Visualization: S.V., S.C., B.B., Methodology: S.V., P.K., S.Y., S.T., B.B., N.C. S.K., M.S., S.J., C.T.,, Writing (first draft): S.V., Writing (review and revision): B.B, P.K., S.Y., N.C., S.K., S.T., M.S., K.M., S.J., C.T., J.M., S.C., R.T., T.J., Resources: S.S., R.T., C.T., S.J., Funding: S.S., R.T,, Supervision: T.J., R.T., S.C., J.M., C.T., S.J.
Ethics Approval and Consent to Participate: The use of samples and data collection protocol was approved by the Mahidol University- Institution Review Board for human ethics standard (MU-MOA COA 2022/052.1105).
Consent for Publication: All authors approve of this manuscript and have provided their consent for publication.
Availability of Data and Material: The dataset used in this investigation can be obtained from the Genomic Data Commons Portal of The Cancer Genome Atlas (TCGA) in the Pancancer Atlas publication page (
https://gdc.cancer.gov/about-data/publications/pancanatlas). Software used is listed in the Key Resources Table.

