1. Introduction
"RoboTaxi" is the first commercial operation of Baidu's autonomous driving platform. Since its launch in various places, it has attracted widespread user attention due to its convenience and innovation.
Sentiment analysis technology originated in the field of text classification, with early research mainly relying on dictionary matching and simple machine learning methods. The early dictionary matching method classifies the words in the text by predefined emotional vocabulary and polarity dictionaries. Tools such as SentiWordNet assign positive or negative sentiment scores to each word, thereby calculating the overall sentiment tendency of the text [
1]. This method has a certain effect when dealing with regularized texts, but due to the freedom and complexity of social media comments, the performance of the dictionary method has obvious limitations. With the development of machine learning technology, sentiment analysis models based on statistics and feature engineering have gradually become mainstream. These methods use classification algorithms such as support vector machines and naive Bayes to learn emotional features in the text through training data, thereby improving the accuracy of sentiment classification [
2,
3]. However, these models based on shallow features still find it difficult to deal with deep semantics and long-distance dependencies in the text. In recent years, the rise of deep learning has brought revolutionary progress to sentiment analysis. Models based on long short-term memory networks [
4] and convolutional neural networks [
5] automatically learn deep semantic features in the text, greatly improving the accuracy of sentiment classification. In addition, the introduction of the Transformer model, especially the BERT model, has further promoted the progress of natural language processing. BERT captures contextual information through a bidirectional encoder, allowing the model to better understand complex sentence structures and emotional expressions [
6]. Based on BERT, RoBERTa optimizes the pre-training process, including a larger dataset, longer training time, and the removal of the Next Sentence Prediction task, significantly enhancing the expressiveness of text processing [
7]. RoBERTa has significant advantages in sentiment analysis of social media data, being able to more accurately identify subtle emotional changes in comments. This study uses the RoBERTa model, combined with BERTopic topic modeling technology, to analyze comment data on the Douyin platform about "RoboTaxi". This method not only captures users' emotional tendencies but also extracts the core topics of user concerns [
8].
The main focus of this study is to conduct sentiment analysis on comment data related to the "RoboTaxi" on the Douyin platform, using RoBERTa and BERTopic combined technology for the first time to fully analyze user comment data on the Douyin platform and deeply understand users' emotional responses. This is not only of guiding significance for the promotion of autonomous driving technology but also provides data support for future public opinion management. Through sentiment analysis, the platform can better understand user needs and concerns, thereby making corresponding technical improvements and operational adjustments to enhance user satisfaction and trust.
2. Data Collection Method
The Douyin platform, with its vast user base and high level of user activity, provides a broad sample for obtaining real user emotional responses about the "RoboTaxi" autonomous driving platform. Compared to traditional questionnaire surveys, Douyin comment data, due to their immediacy and authenticity, have higher representativeness and can directly reflect the public's attitude and experience towards emerging technologies. By analyzing the unstructured comments spontaneously generated by Douyin users, this study can capture the public's emotional tendencies and potential concerns, providing a reference for the promotion and optimization of the autonomous driving platform technology.
This study utilized Python-based automated web crawling technology, in conjunction with the DrissionPage library and the ChromiumPage browser, to achieve large-scale, stable, and continuous crawling of Douyin comment data. This method not only flexibly acquires data from dynamically loaded pages but also enhances the efficiency and completeness of data collection through automated operations. Ensuring that the crawled 9,235 comments are highly accurate and timely, it provides a solid foundation for subsequent data analysis.
Table 1 shows some examples of the crawled data.
3. Related Work
3.1. Data Preprocessing
Data preprocessing is a crucial step in natural language processing. Initially, we conducted basic cleaning of the text content, which included the removal of meaningless symbols, emoticons, URL links, and repeated whitespace characters. This step significantly reduced redundant information in the data, ensuring the efficiency of subsequent processing. After the initial cleaning, we further applied stop-word filtering technology. We utilized a word list containing 9702 common stop words to pre-filter the crawled comment data, eliminating high-frequency but low-information words such as prepositions and conjunctions.
Table 2 shows some examples of the data after cleaning.
After the text cleaning and stop-word filtering were completed, we performed word segmentation on the remaining text. This study used a word segmentation algorithm based on the jieba library, converting the cleaned comment text into individual words, which provided a foundation for subsequent sentiment analysis and topic modeling. After word segmentation, we generated a word cloud to visually display the most frequently occurring words in the comments and used statistical analysis to determine the top ten high-frequency words, including "unmanned driving," "RoboTaxi," "taxi," "driver," and so on. These high-frequency words have significant reference value when analyzing users' emotions and experiences with the RoboTaxi unmanned driving service. According to the statistics, the top ten high-frequency words and their occurrence counts and proportions are as follows: these words provided a solid data foundation for subsequent sentiment analysis and topic modeling and also revealed the core concerns of users regarding unmanned driving technology.
Table 3.
Top Ten High-Frequency Words Proportion.
Table 3.
Top Ten High-Frequency Words Proportion.
| Keyword |
Count |
Proportion |
| Unmanned Driving |
487 |
0.019624 |
| RoboTaxi |
458 |
0.01845 |
| Taxi |
292 |
0.011766 |
| Driver |
232 |
0.009348 |
| Unmanned |
228 |
0.009187 |
| Steering Wheel |
208 |
0.008381 |
| On the Road |
178 |
0.007173 |
| Human |
176 |
0.007092 |
| Cheap |
175 |
0.007052 |
| Technology |
160 |
0.006447 |
3.2. Topic Modeling Analysis
Topic modeling is an unsupervised machine learning method used to discover hidden themes within textual data [
10]. It helps researchers understand the core ideas of large-scale texts by grouping word patterns in documents into a set of topics. In this study, we conducted topic modeling on textual data using the RoBERTa (Robustly Optimized BERT Pretraining Approach) and BERTopic methods. This combination not only effectively captures emotions and viewpoints in comments but also extracts core topics from the text, providing in-depth insights into user sentiments towards the autonomous driving platform.
3.2.1. Model Framework
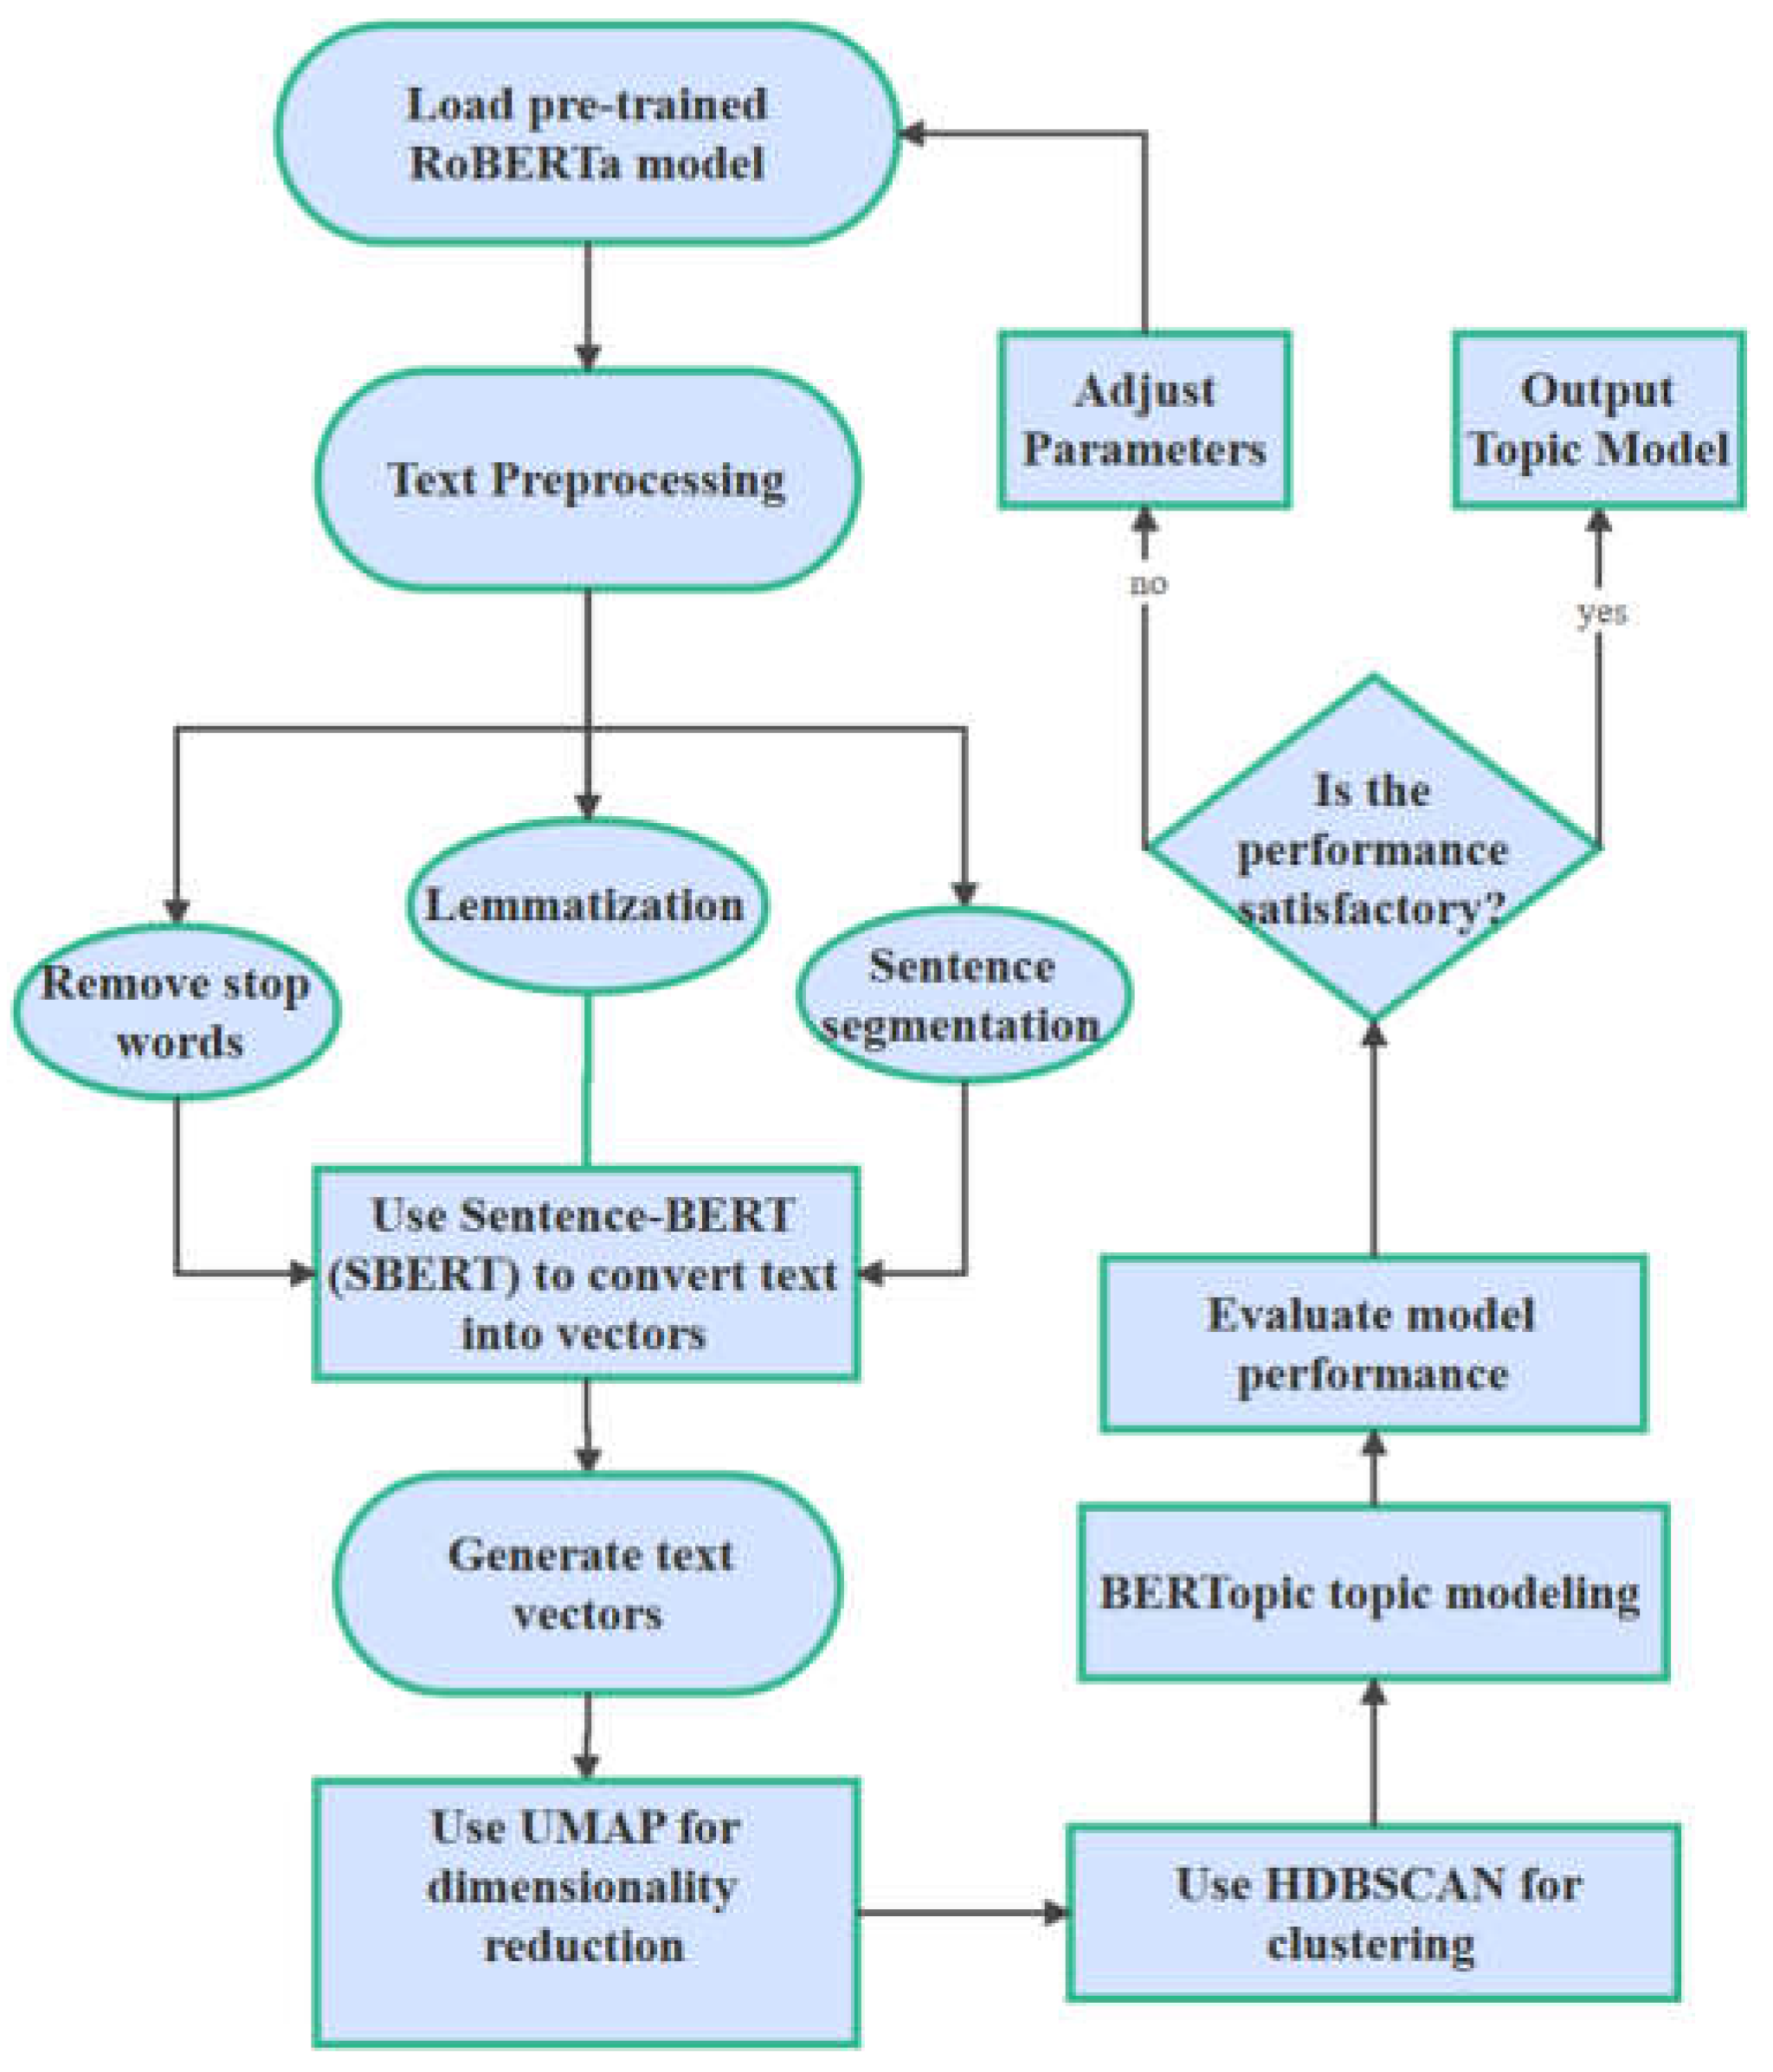
RoBERTa is an optimized version of the BERT (Bidirectional Encoder Representations from Transformers) model, which improves the performance of pre-trained language models through the use of larger datasets and extended training times. RoBERTa retains BERT's bidirectional Transformer architecture but enhances model performance by removing the Next Sentence Prediction (NSP) task, dynamically adjusting batch size, and extending training duration. In this study, we employed a pre-trained RoBERTa model to transform text into vectors using Sentence-BERT (SBERT) for use in topic modeling. SBERT generates semantically relevant sentence embeddings through pre-training on sentences, making it particularly suited for text similarity, clustering, and topic modeling tasks.
Figure 1.
Topic Modeling Algorithm Flowchart.
Figure 1.
Topic Modeling Algorithm Flowchart.
BERTopic is a topic modeling method based on word embeddings, differing from traditional LDA (Latent Dirichlet Allocation) models by relying on text embedding vectors generated through deep learning. These embeddings are dimension-reduced using UMAP (Uniform Manifold Approximation and Projection) and then clustered using HDBSCAN (Hierarchical Density-Based Spatial Clustering of Applications with Noise). UMAP is a powerful non-linear dimensionality reduction technique that effectively reduces vector dimensions while preserving local structures and semantic distances between texts. HDBSCAN is an unsupervised clustering algorithm that automatically determines the optimal number of clusters and detects noise data. The combination of this framework gives BERTopic excellent performance in handling complex, high-dimensional textual data, especially highly unstructured data like social media comments.
3.2.2. Self-Attention Mechanism
The core of the RoBERTa model is the self-attention mechanism within the Transformer architecture. During text processing, the self-attention mechanism calculates the correlation between each word in the input sequence and other words, allowing the model to understand contextual relationships. The calculation formula for self-attention is as follows:
where Q represents the query matrix, K is the key matrix, V is the value matrix, and dk is the dimension of the key vector. In each layer's computation, the model calculates the relationships between each word in the input and other words, generating word vectors with contextual information. These vectors, after multiple layers of encoding, produce high-dimensional semantic representations.
3.2.3. Word Embeddings and Dimensionality Reduction
In the BERTopic topic modeling process, textual data is first embedded using the RoBERTa model. The high-dimensional vectors generated by word embeddings represent the semantics of each text. Building on this, UMAP (Uniform Manifold Approximation and Projection) is applied for dimensionality reduction [
9], which preserves the structure of local neighborhoods, reduces vector dimensions, and retains semantic distances between texts. The goal of UMAP is to preserve the neighborhood structure in high-dimensional space by optimizing the following loss function:
where
represents the distance in high-dimensional space,
represents the distance in low-dimensional space, and ϵ is a weight term used to adjust the similarity between data points. This dimensionality reduction process significantly reduces data complexity while retaining important semantic information.
3.2.4. Clustering and Topic Extraction
After UMAP dimensionality reduction, BERTopic uses HDBSCAN (Hierarchical Density-Based Spatial Clustering of Applications with Noise) for density-based clustering. HDBSCAN is a density-based clustering algorithm[
10] that groups semantically similar texts together by analyzing the local density of data points. The core formula for clustering is as follows:
where λ represents the density level, and core_distance(p) is the core distance of point p, which is the minimum distance to its neighboring points. HDBSCAN automatically identifies the optimal number of clusters by analyzing the density gradient of data points and clusters semantically related comments together.
Through this framework, BERTopic can extract the keywords that best represent the topics and generate corresponding topics. Ultimately, combining the semantic representations of RoBERTa and the clustering results of BERTopic, we can accurately extract the potential topics in user comments and conduct an in-depth analysis of user sentiments towards the "RoboTaxi" platform.
3.3. Sentiment Analysis Modeling
Sentiment analysis modeling is the core part of this study, aiming to automatically identify the emotional tendencies in user comments through machine learning models, determining whether they are positive, negative, or neutral. To this end, this paper conducts sentiment classification based on the RoBERTa model, and combines the results of the previous topic modeling to provide a comprehensive framework for analyzing user feedback on the "RoboTaxi" autonomous driving platform.
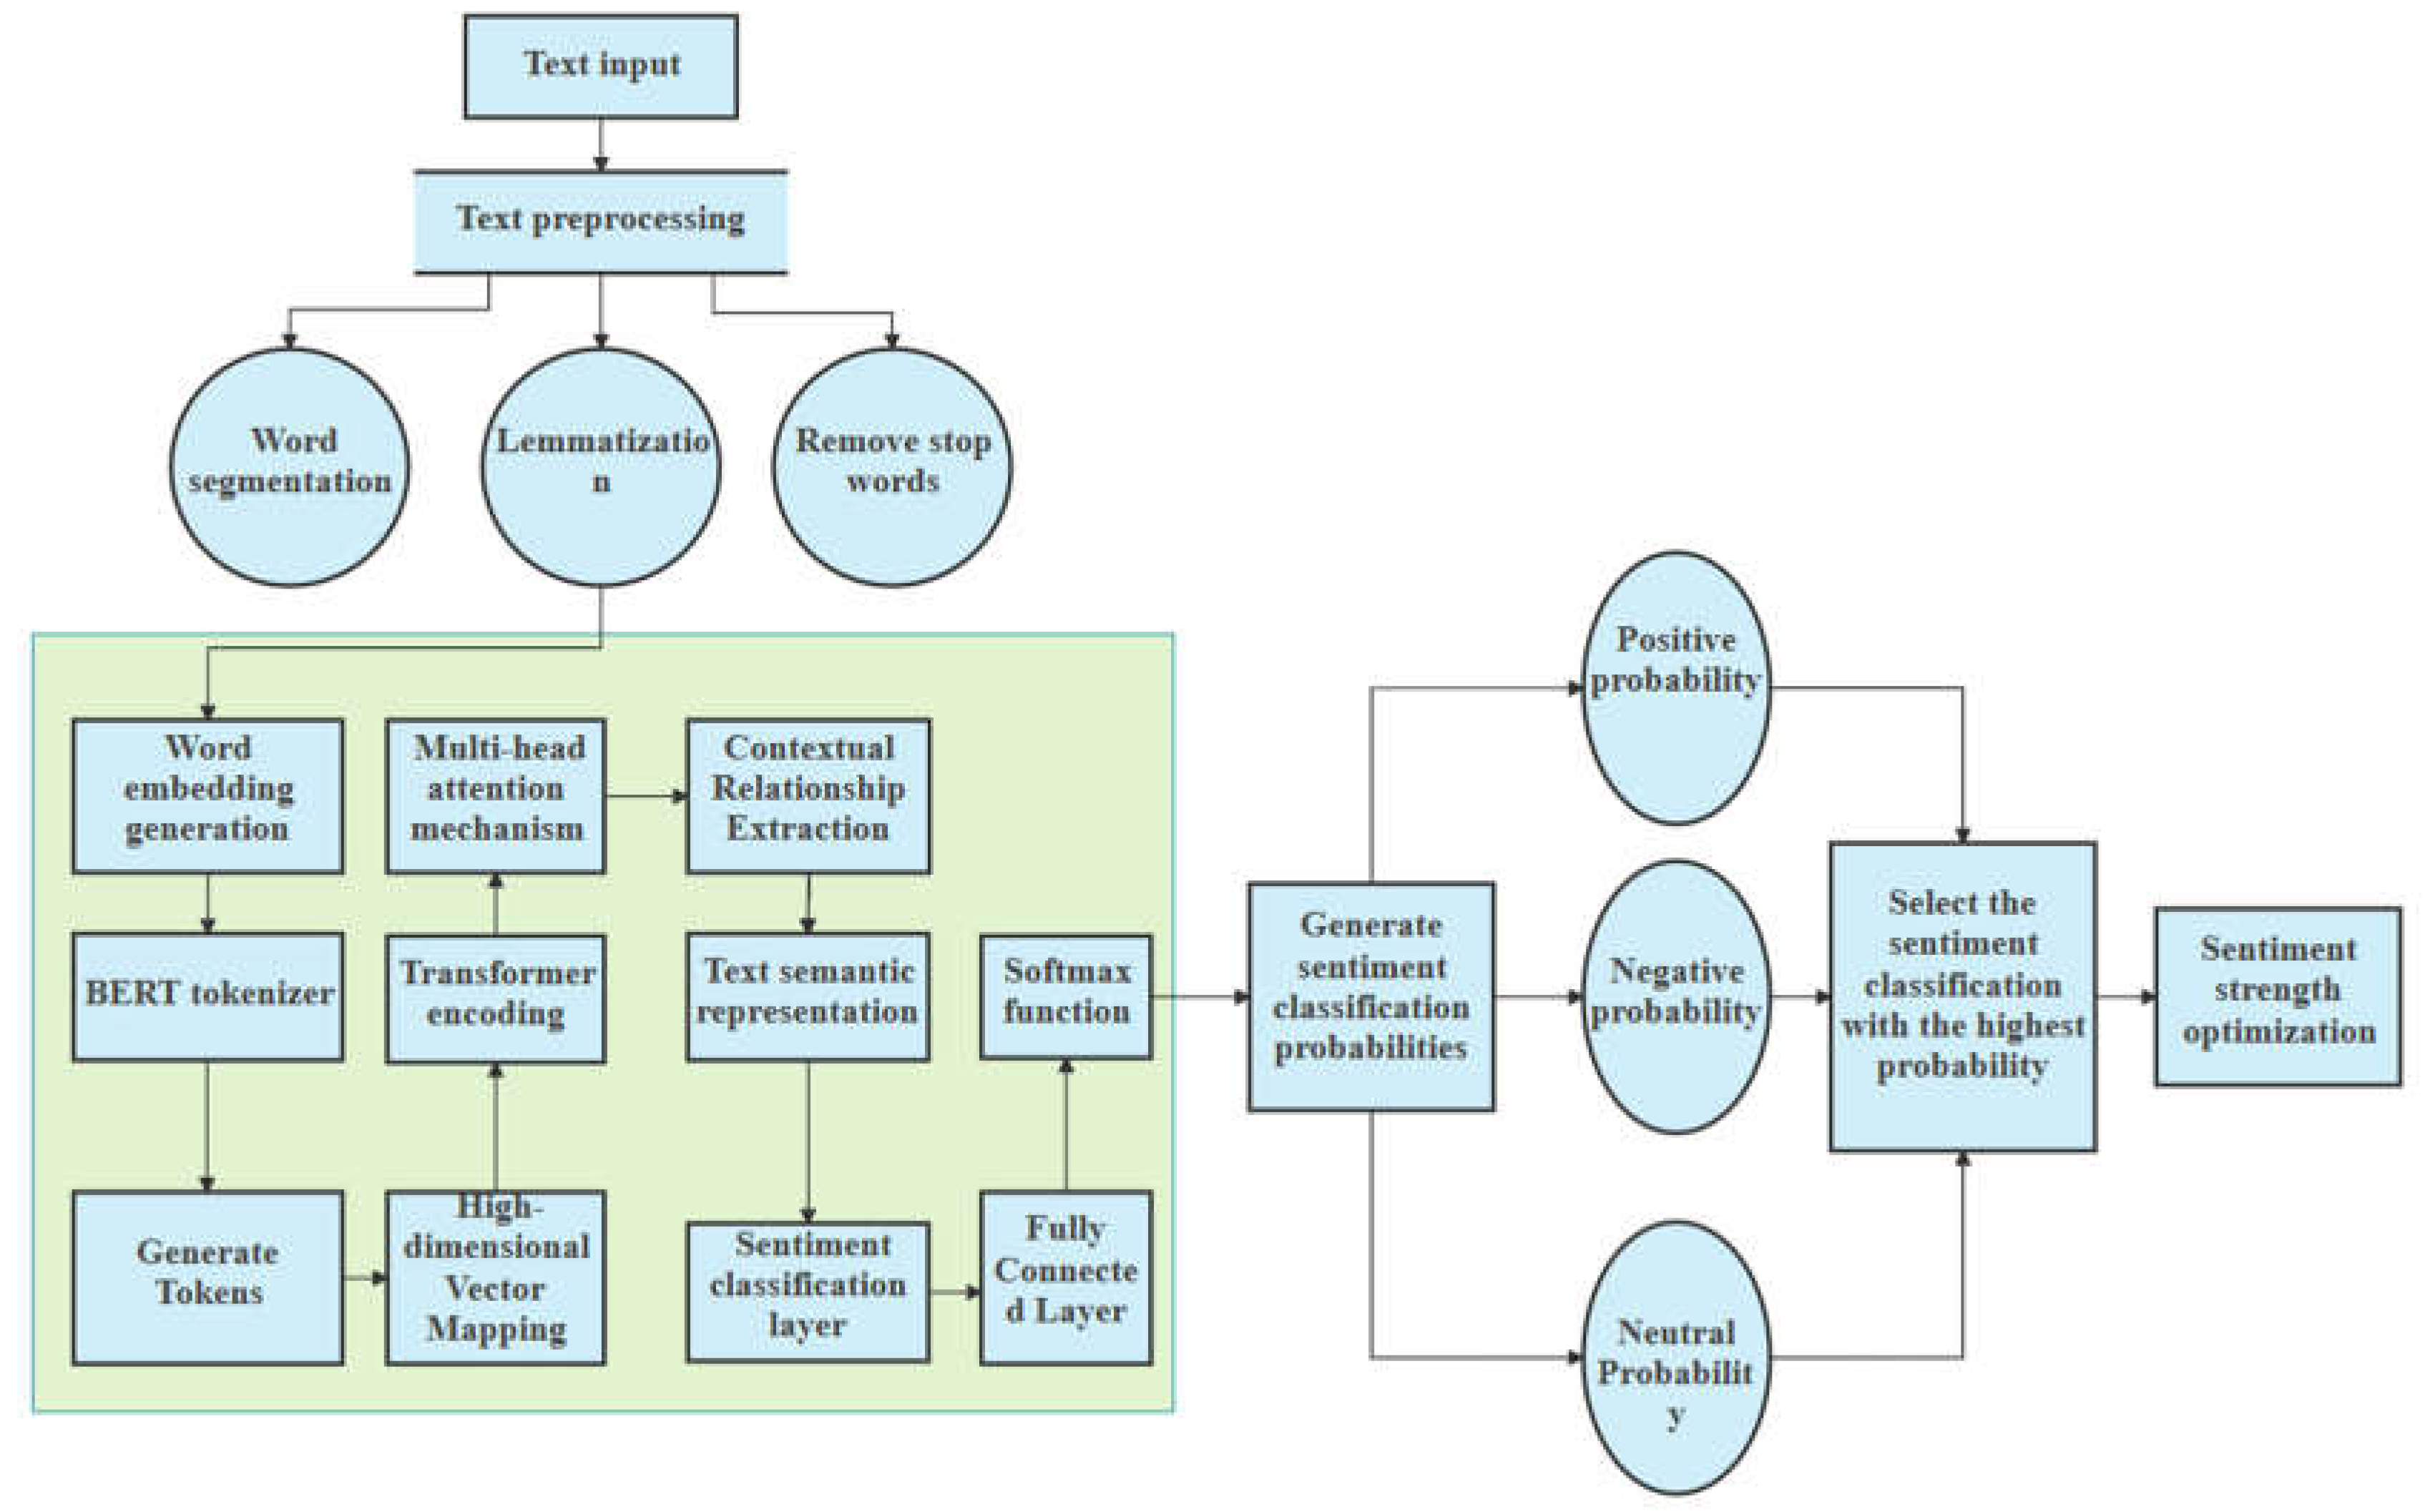
In the specific implementation of the sentiment classification model, we rely on the Transformer architecture of RoBERTa, achieving sentiment classification of text through a series of deep learning steps. This process mainly includes text preprocessing, model inference, classification output, and loss optimization, with each step precisely controlled by mathematical models to ensure the stability and efficiency of the model in processing complex textual data.
Figure 2.
Sentiment Modeling Algorithm Flowchart.
Figure 2.
Sentiment Modeling Algorithm Flowchart.
3.3.1. Vectorized Representation of Input Text
Firstly, we perform word segmentation on the input user comments, using the BERT tokenizer to convert natural language text into word fragments (tokens). Each word fragment is mapped into a high-dimensional vector space, generating a word embedding matrix, where n is the number of words in the text, and d is the embedding dimension of each word. At this stage, the semantic information of the text begins to be expressed through the mapping of the embedding layer, laying the foundation for subsequent context understanding and sentiment classification.
where X is the input of word fragments, and E is the embedding representation matrix of the word fragments.
Next, the Transformer architecture of RoBERTa processes the input word embeddings, with the key step being to capture the correlation between words through multi-layer self-attention mechanisms. The principle of the formula is as shown in formula (1).
3.3.2. Classification Layer and Loss Function
The word vectors encoded by the Transformer are passed to the sentiment classification layer. In the classification layer, the model uses a fully connected layer and a softmax function to output the probability distribution of sentiment categories:
where
and
are the weight matrix and bias term of the classification layer, and
is the text representation processed by the Transformer. The softmax function ensures that the sum of the probabilities for each category is 1, thus outputting the corresponding sentiment category of the text.
During training, the model optimizes the parameters using the cross-entropy loss function to maximize the probability of the correct sentiment category. The cross-entropy loss function is defined as:
where C is the number of sentiment categories,
is the true label, and
is the predicted probability by the model. The loss function optimizes the model parameters through backpropagation, gradually improving classification accuracy.
3.3.3. Calculation of Sentiment Polarity Score
The model makes predictions on the comments' sentiment based on the text after passing the input comments through layers. Each input comment's hidden layers are passed through the transformer encoder and finally mapped into three sentiment categories at the output of the RoBERTa model. The output from RoBERTa for each input comment will be mapped into a three-dimensional sentiment space, corresponding to positive, negative, and neutral sentiment. Each category will be calculated using the softmax function as follows:
where
represents the score for the i-th category in the model, and c is the number of sentiment categories (in this case 3, meaning positive, negative, and neutral). The softmax function will normalize the predicted score into a probability for each category, ensuring the total probability of all categories sums to 1.
3.3.4. Sentiment Prediction
After the model processes the input text, it will output the predicted probability distribution for each sentiment category corresponding to the input text. Specifically, for a given input text, the RoBERTa model will predict the probability distribution for each sentiment category, as follows:
where
represent the probabilities of the text being classified as positive, negative, and neutral sentiment, respectively.
The model will then select the category with the highest probability as the sentiment label of the text:
Through this method, the model can effectively predict the sentiment of the text by evaluating its features and determining its most likely sentiment category. If the predicted probability for , this means the model's prediction for this text being classified as positive sentiment is very strong, while the emotional strength is relatively high. Conversely, if the predicted probability for , the model's confidence in the positive sentiment prediction would be relatively weak. Through the sentiment probabilities, the strength of the sentiment can be further analyzed.
In sentiment analysis, positive sentiment usually corresponds to users' positive feedback on autonomous driving technology or the "RoboTaxi" platform, such as satisfaction and technological recognition; negative sentiment reflects users' dissatisfaction with the service or concerns about the technology, such as safety issues or poor user experience; neutral sentiment is the neutral attitude expressed by users in their comments, which may contain information without emotional tendency.
Ultimately, through this classification and quantification, the model can not only determine the sentiment tendency of the text but also reflect the intensity and complexity of emotional expression. This quantification provides a more nuanced analytical tool for studying and understanding users' emotional attitudes towards the autonomous driving platform.
4. Results Analysis
4.1. Topic Modeling Results Analysis
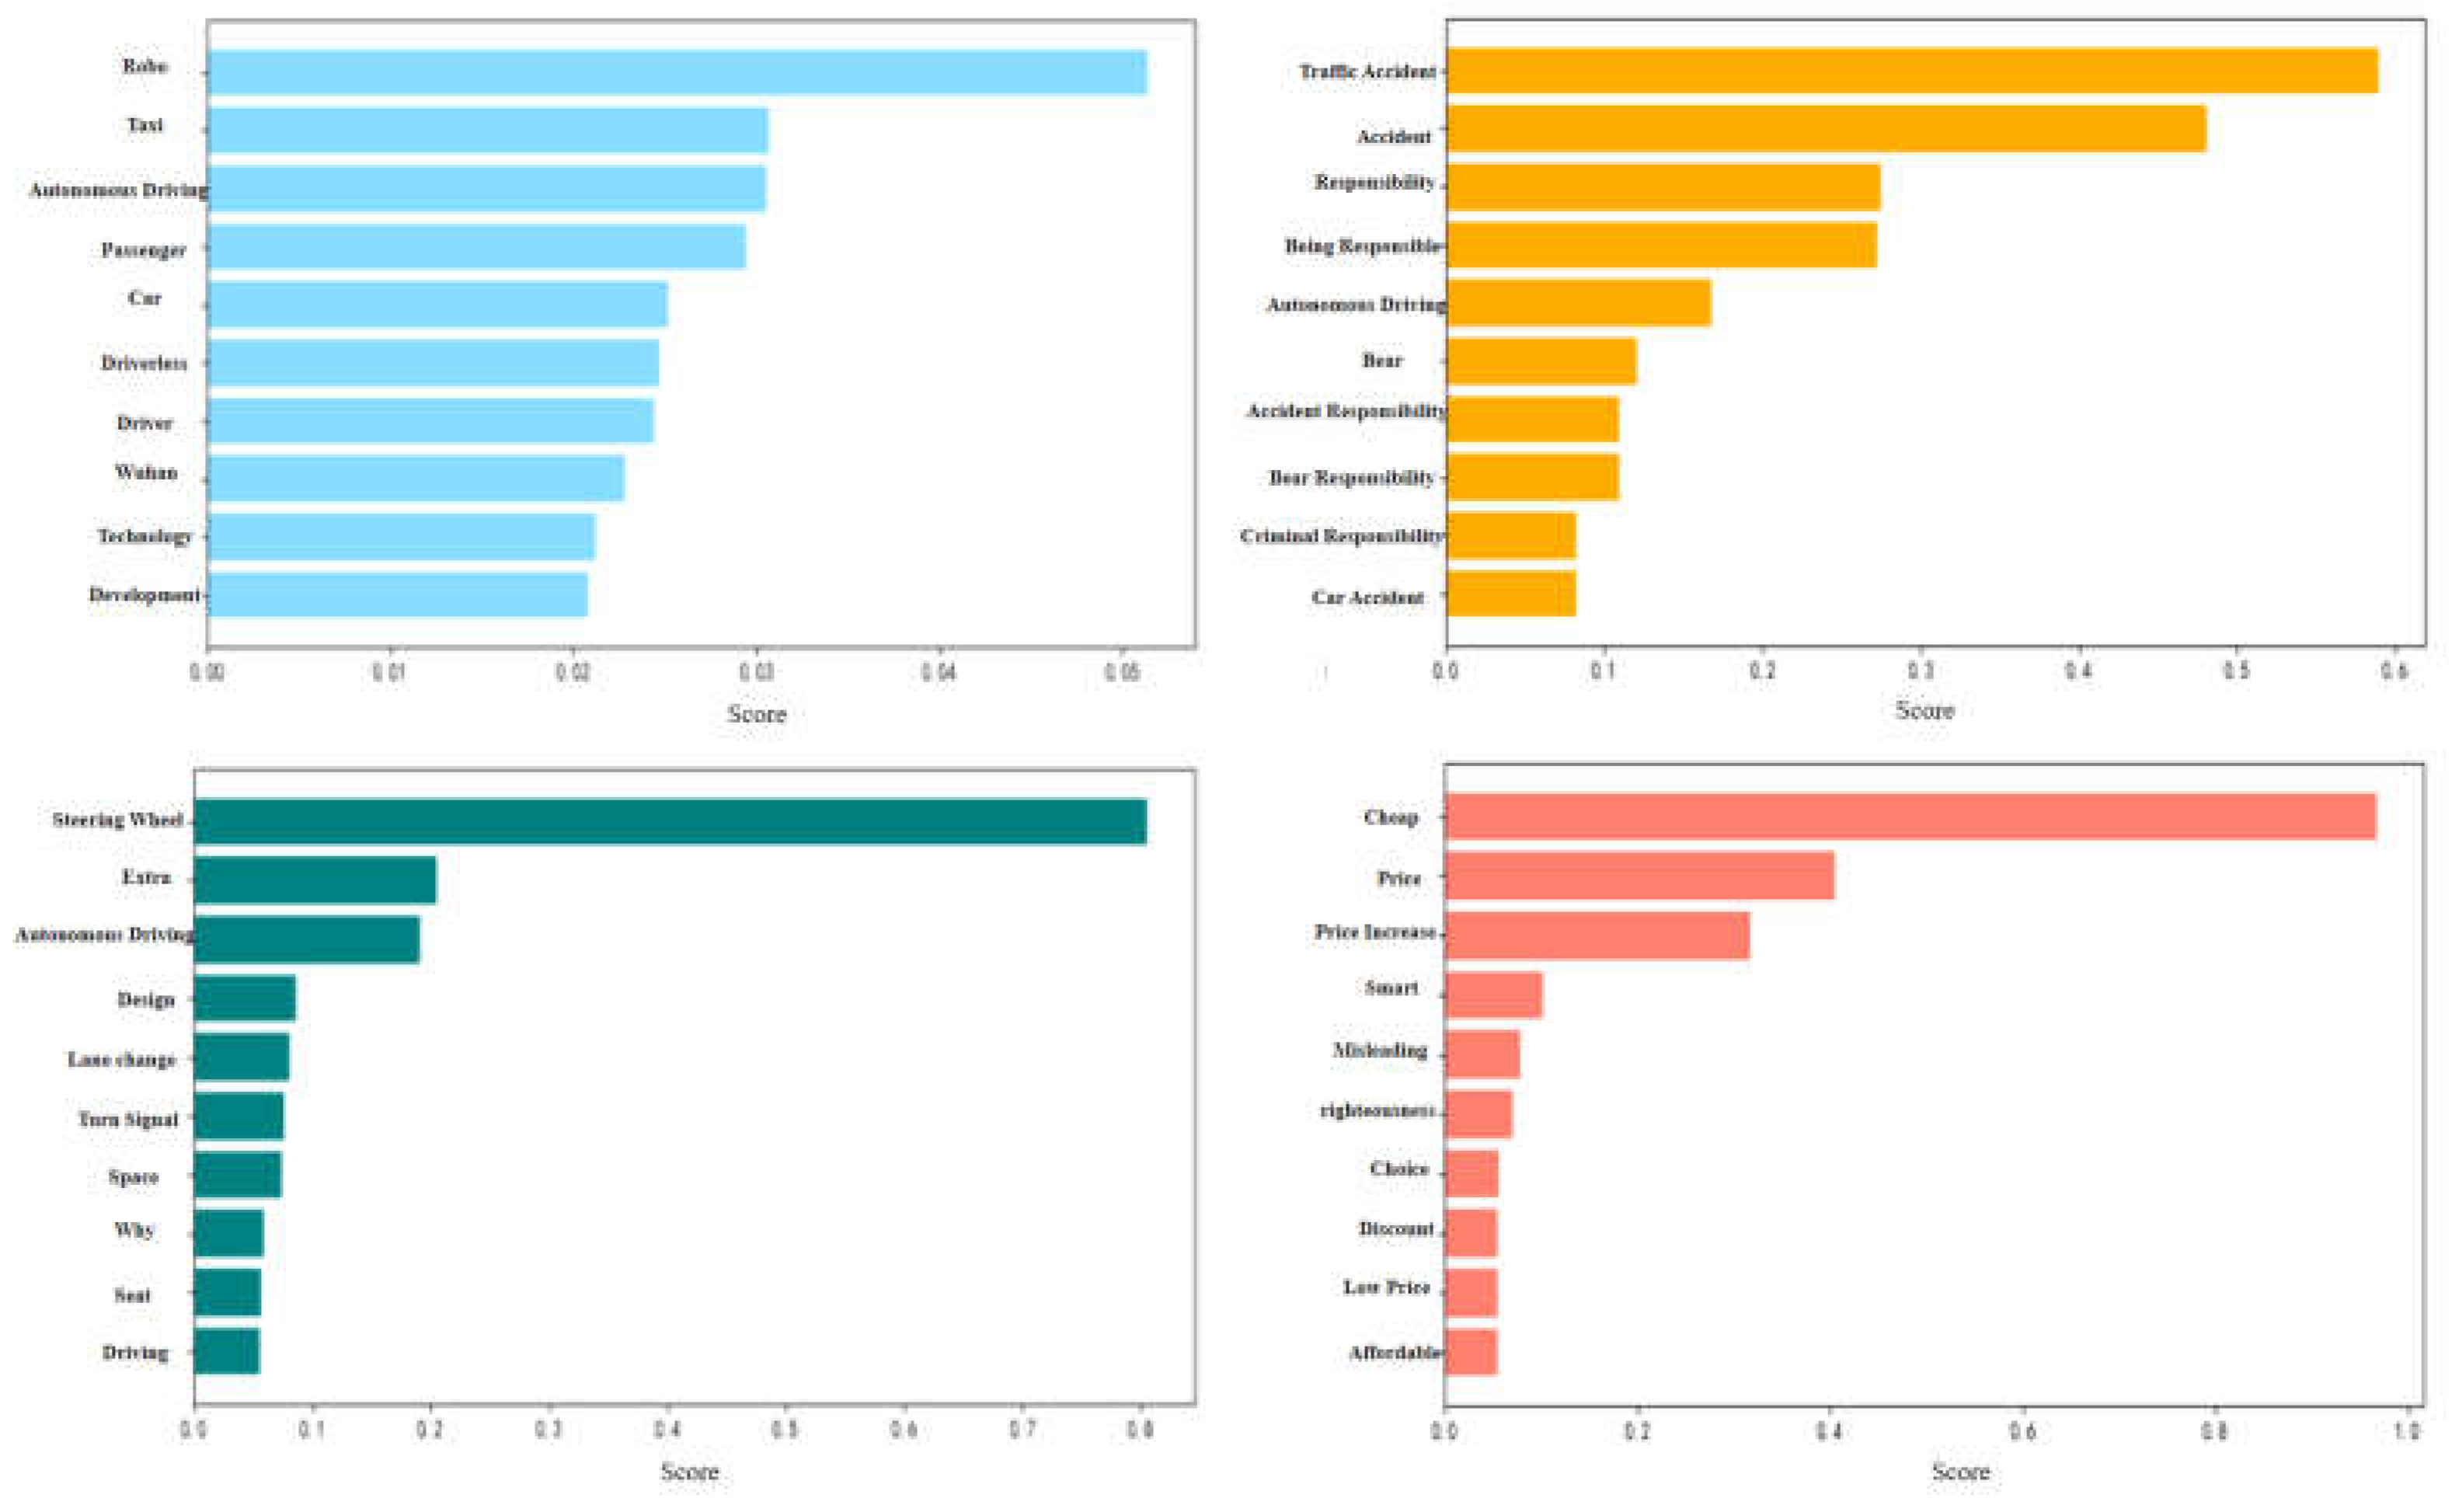
Following the application of topic modeling on user comments regarding the "RoboTaxi" autonomous driving platform on the Douyin platform, four major themes were extracted. Each theme not only reveals the concerns and emotions of users at different levels but also provides a reference for the future development direction of the platform. Combined with the intuitive representation of images, the following is a detailed analysis of the four themes:
Figure 3.
Topic modeling classification results.
Figure 3.
Topic modeling classification results.
(1) Theme One: Societal Perspective. User comments surrounding the "RoboTaxi" autonomous driving platform mainly focus on its profound impact on the socio-economic structure and labor market. High-frequency words such as "robo", "taxi" and "passenger" reflect the public's concern that unmanned driving technology may replace the traditional role of drivers, especially in terms of potential impacts on job positions and career security. In addition, keywords like "technology" indicate users' concerns about the safety, operational reliability, and economic benefits of the technology. Specifically, users hope that unmanned driving can bring a lower-cost mode of transportation while also questioning its technological maturity and safety in practical applications.
(2) Theme Two: Safety and Responsibility. Keywords such as "traffic accidents", "responsibility", and "burden" show that the public is particularly concerned about the safety and responsibility division of unmanned driving technology. User discussions mainly focus on the ambiguity of responsibility attribution after accidents involving unmanned platforms, especially when the technology cannot prevent accidents, how to define the relevant responsibilities becomes a focal point. The high frequency of keywords like "accident" and "responsibility" reveals the public's questioning of the unmanned system's ability to deal with complex road conditions and emergencies, and reflects the uncertainty about who should bear responsibility after an accident, especially when the legal framework is not yet clear. At the same time, words like "passenger responsibility" and "bear responsibility" further reflect users' confusion and concerns about whether they should bear some responsibility for accidents when using unmanned driving services. This involves not only technical discussions but also deeply touches on societal discussions about the division of rights and responsibilities triggered by new technologies.
(3) Theme Three: Practicality and Design. Keywords such as "steering wheel"and"design" reflect the widespread concern of users about the actual operability and design details of unmanned vehicles. The steering wheel, as the most frequently mentioned keyword, reveals the public's expectations and doubts about the integration of traditional driving control methods with unmanned driving technology. Although unmanned driving technology aims to completely replace human operation, the frequent mention of the "steering wheel" by users indicates that before fully trusting the technology, the public may still hope to retain some manual control rights to deal with technical failures or emergencies. Users hope that unmanned vehicles can provide smarter design and functional experiences than traditional vehicles. These discussions reveal the complexity of actual user experience in the application process of the technology, that is, based on high technology, users still value comfort, convenience, and security in daily use.
(4) Theme Four: Economic Benefits and Services. User comments are highly concentrated on keywords such as "cheap", "price" revealing the public's significant concern about the economic benefits and time management of the unmanned travel platform. The two high-frequency words "cheap" and "price" reflect user sensitivity to service pricing, indicating that price reasonableness is an important factor affecting their choices. Especially in the context of fierce competition in the travel market, cost advantage is obviously one of the key elements for the unmanned platform to attract users. In addition, words like "low price" and "experience" imply users' expectations for more flexible and preferential pricing strategies and overall service experiences. This provides insights for the market expansion of the unmanned platform: by optimizing pricing models and improving service cost-performance, it is expected to further enhance user stickiness and market competitiveness.
4.2. Emotional Modeling Results Analysis
4.2.1. Emotional Score Distribution
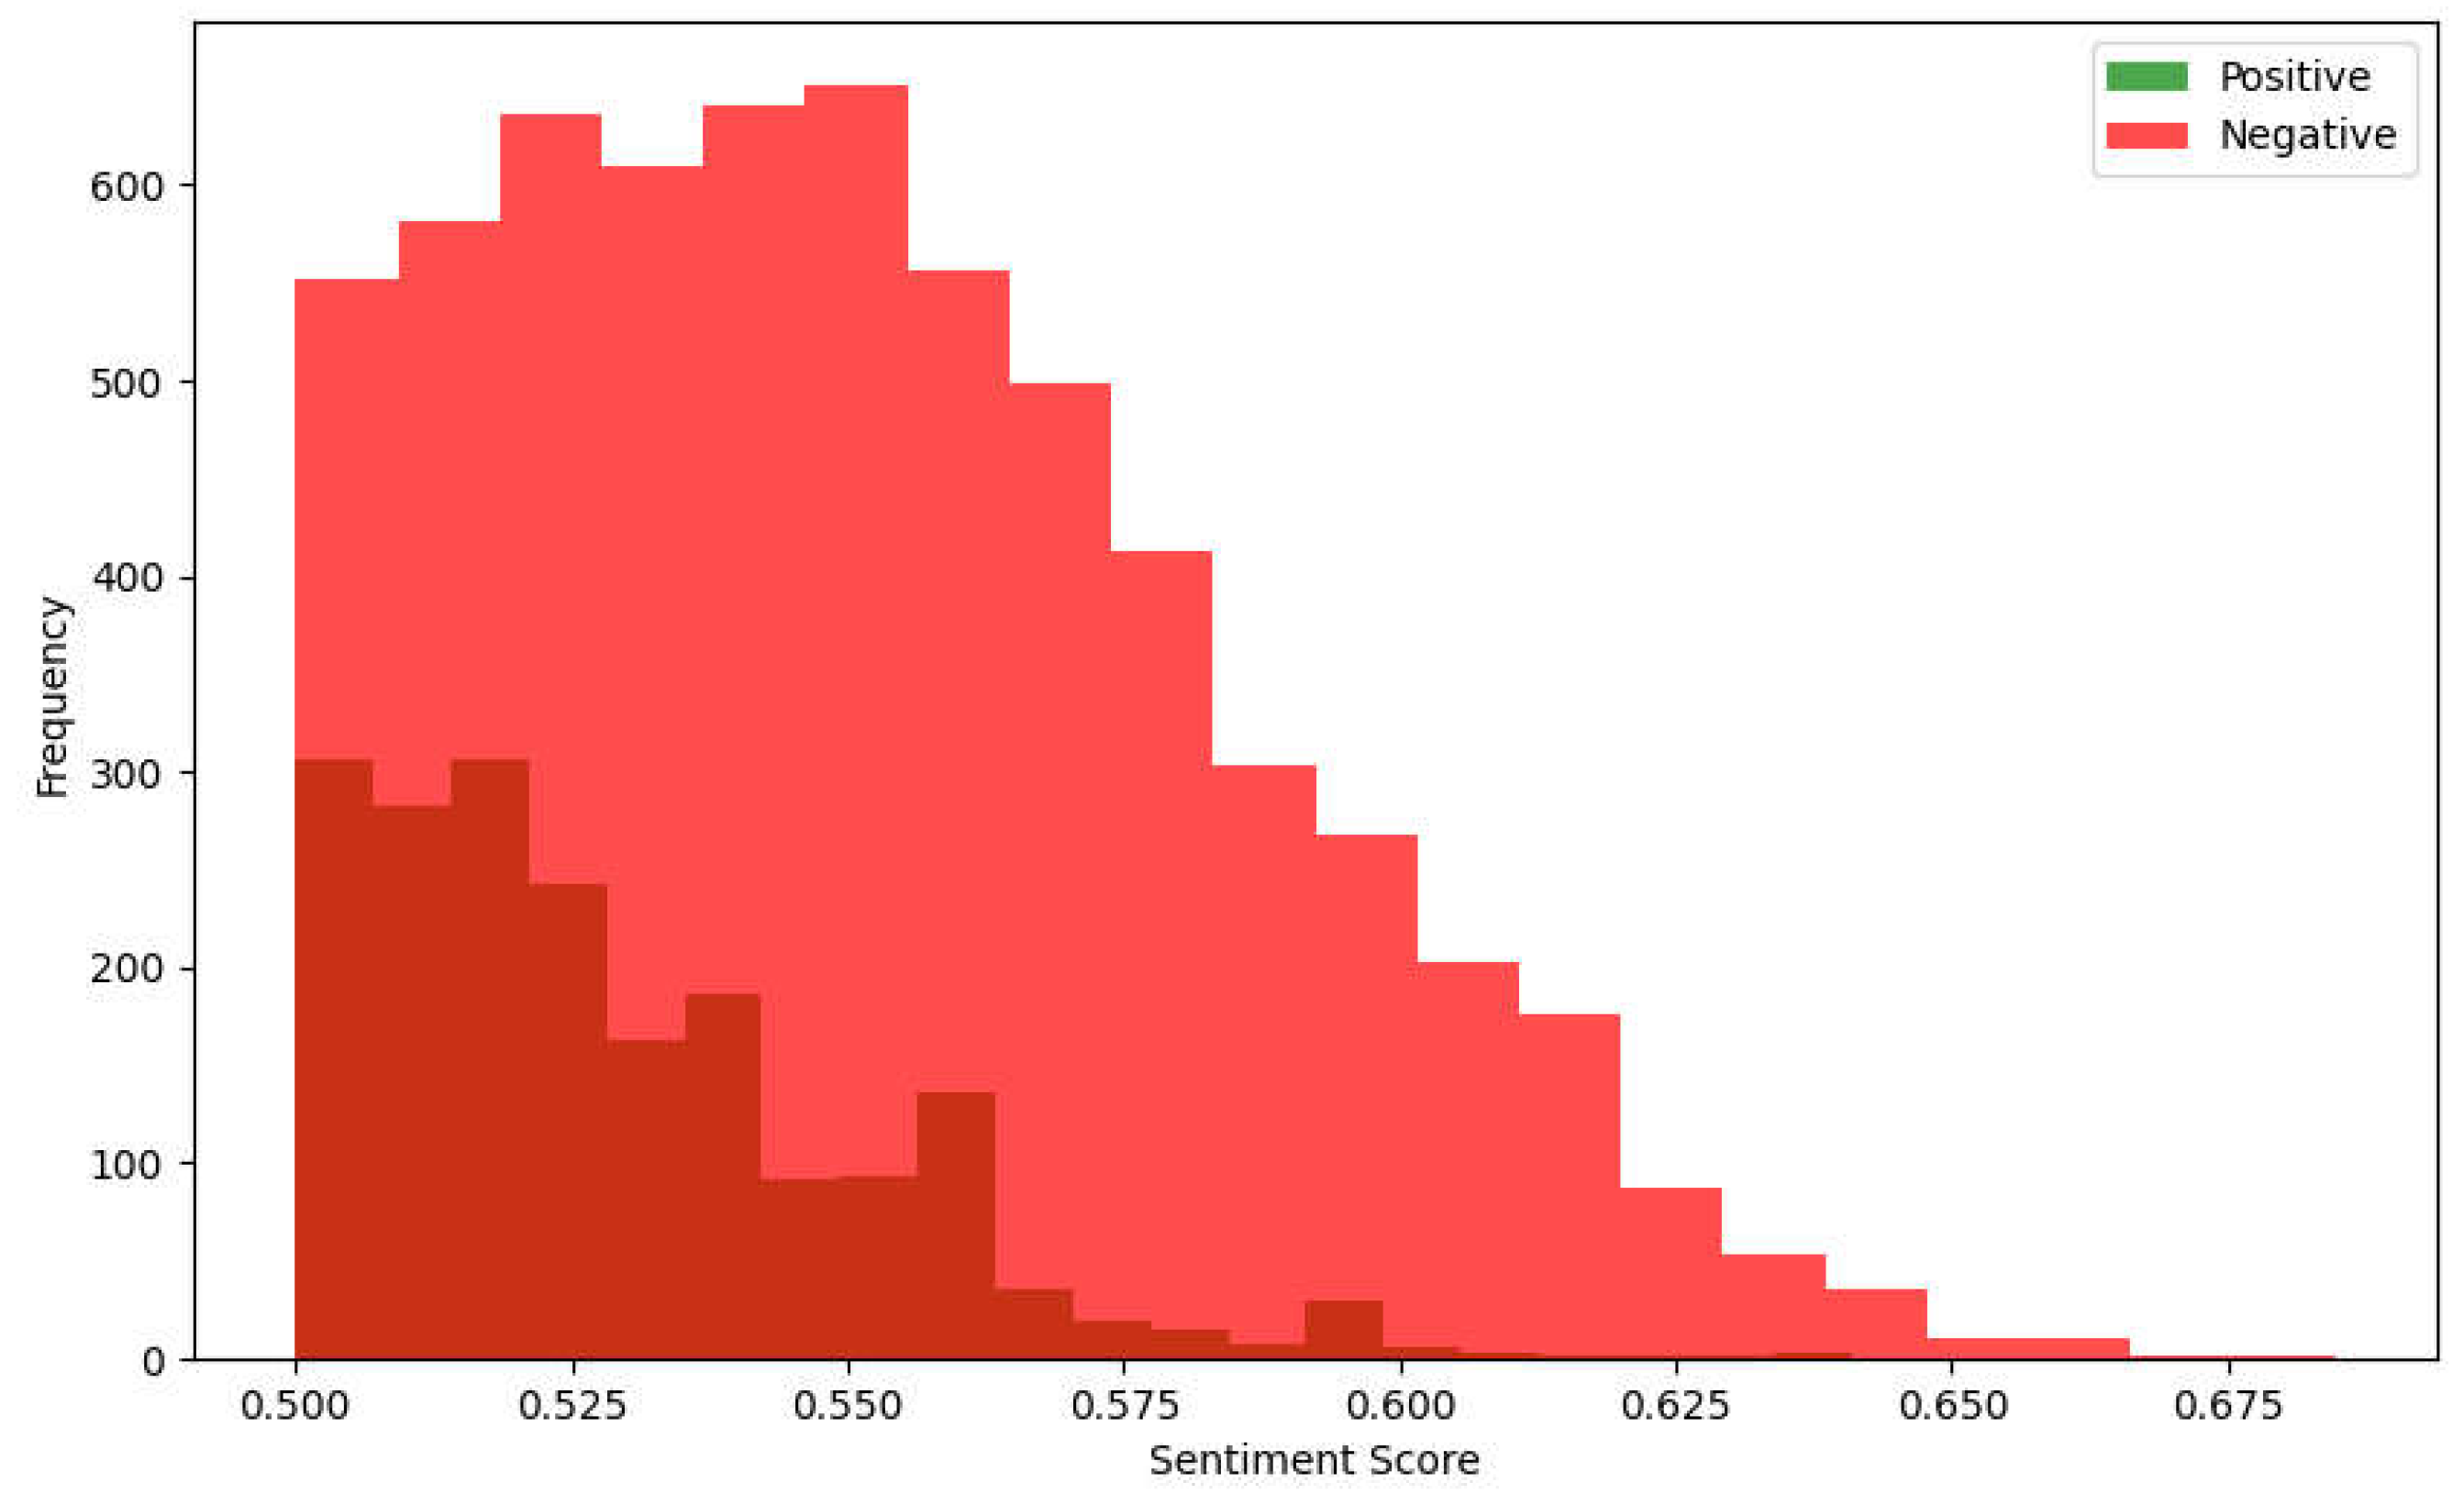
The overlapping parts of positive and negative emotions in the emotional score distribution graph, especially the scores concentrated between 0.50 and 0.55, reveal the complexity and diversity of user emotions. This phenomenon can be understood from a social psychology perspective as users showing a typical "emotional ambiguity" phenomenon when facing emerging technology (unmanned driving). This emotional ambiguity stems from uncertainty about the technology: on the one hand, users have certain expectations for the potential of the technology and show a certain positive emotion; on the other hand, due to concerns about the risks of unknown technology, especially issues of safety and responsibility attribution, users' negative emotions also gradually emerge. Behavioral studies have shown that when facing complex and uncertain technologies, the public is often in a state of "cognitive dissonance", that is, their attitudes and emotions show contradictions and conflicts under different information inputs. Therefore, the concentration of emotional scores in a slightly negative range means that the public's emotions are more in a state of hesitation, observation, and exploration when facing the unmanned driving travel platform.
Figure 4.
Sentiment score distribution.
Figure 4.
Sentiment score distribution.
In addition, the concentration of negative emotions reflects the public's "risk aversion tendency" when facing new technologies. When the risks of technology have not been fully understood or clarified, people tend to show conservative or even negative emotional responses, which is the risk-averse behavior in the classic "Prospect Theory". The concentration of users' emotional scores between 0.525 and 0.550 implies that most people, even if they do not completely deny the potential of the technology, are still inclined to express cautious negative evaluations. This is in line with the typical "negative bias effect": people usually remember negative experiences more easily and express them in comments. For the unmanned platform, this emotional distribution means that the platform should gradually eliminate public concerns through effective risk communication strategies and transparent technology improvement plans, reducing this slight negative emotional accumulation, and ultimately transforming it into more positive emotional feedback.
4.2.2. Overall Emotional Distribution
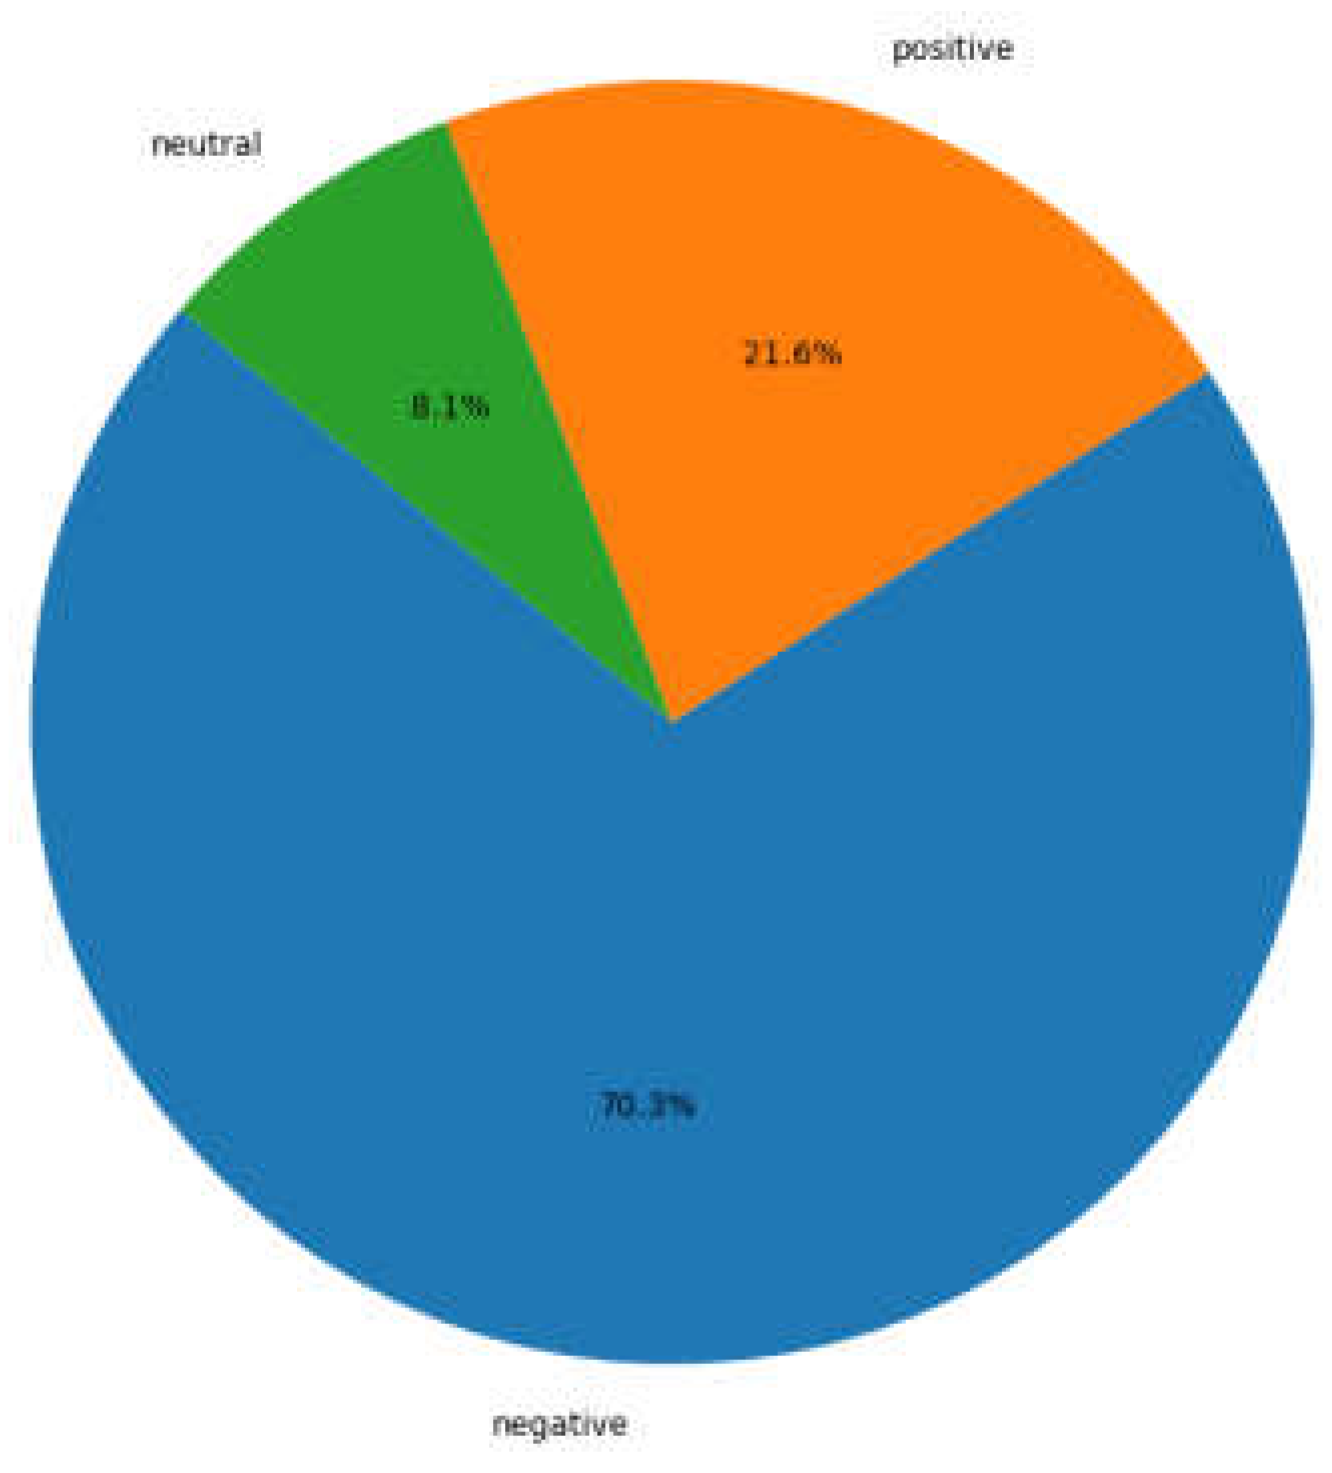
From the emotional analysis pie chart, it can be seen that negative emotions account for the vast majority (70.3%), indicating that the overall evaluation of the "RoboTaxi" platform in users' minds tends to be negative. From a statistical perspective, this extremely skewed emotional distribution not only reflects the individual experiences of users in specific situations but is also closely related to the "negative bias effect" of emotions. The negative bias effect refers to the human tendency to naturally focus on and express negative emotions, especially when facing new technologies or potential risks, negative emotions are more likely to be amplified. This emotional expression is not only a simple feedback on products or services but also hides deep psychological reactions to technological uncertainty, risk aversion, and lack of trust. Especially in the cutting-edge field of unmanned driving technology, users' doubts about safety, responsibility attribution, and technological maturity obviously drive this significant accumulation of negative emotions.
Figure 5.
Overall distribution of sentiment.
Figure 5.
Overall distribution of sentiment.
From a sociological perspective, this emotional distribution can also be understood as the "collective fear" phenomenon in group behavior, that is, when a new technology is widely discussed and spread, the negative emotions between individuals will infect and reinforce each other, thus forming a significant fear or resistance emotion in the overall group. The low proportion of neutral emotions (8.1%) indicates that users' attitudes towards this platform are rarely neutral, and the emotional polarization is very obvious, which further verifies the "polarization effect" in the emotional model, that is, users' emotional tendencies are more likely to concentrate on extreme positive or extreme negative. Although the positive emotions (21.6%) exist, their proportion is significantly low, reflecting that the platform's technological advantages or innovative highlights have not fully met users' core needs. This phenomenon indicates that the platform still needs to make greater efforts to enhance users' sense of trust and emotional resonance, especially in meeting users' sense of security, technological transparency, and service reliability.
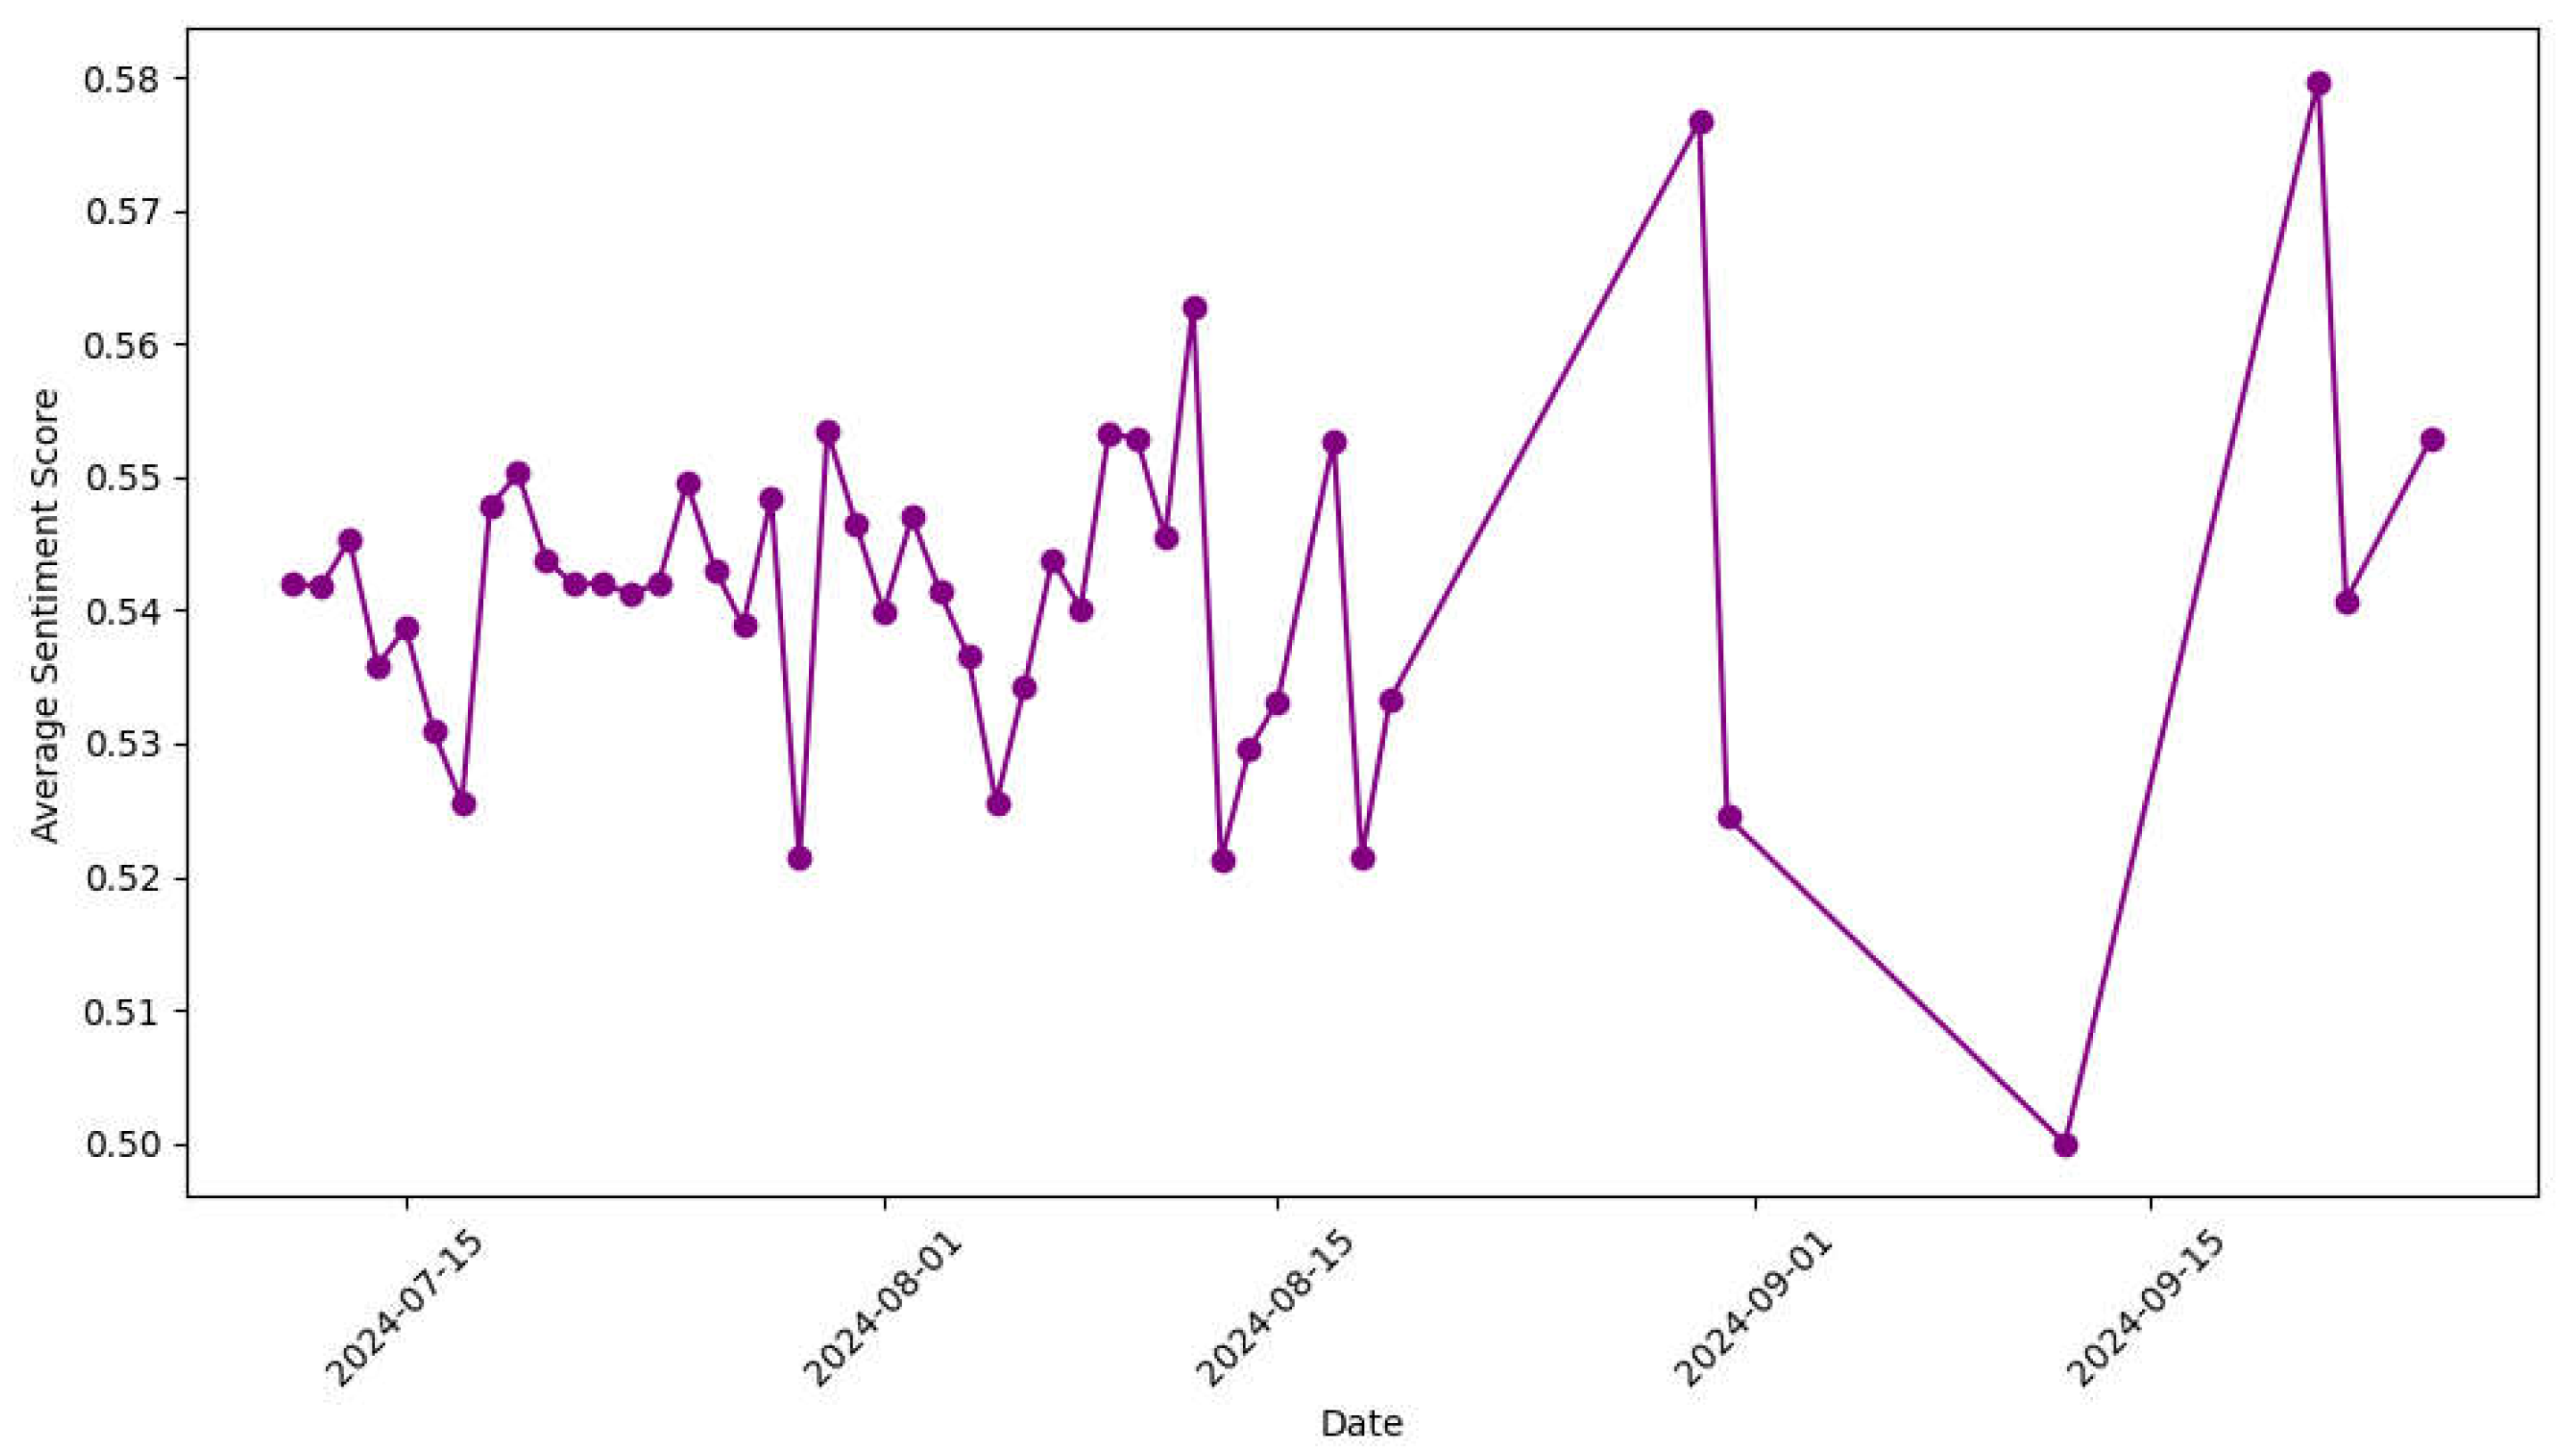
4.2.3. Emotional Score Changes Over Time
From the chart of emotional scores changing over time, it can be observed that user emotions have experienced significant fluctuations, reflecting the emotional evolution process of the "RoboTaxi" unmanned driving technology from its initial launch to a period of operation. Firstly, when the technology just appeared, users showed a "novelty" to this emerging unmanned driving service, and the emotional fluctuations were small and the scores were relatively average (about 0.53 to 0.54). This is a typical "early effect of technology innovation": users have high expectations but are also cautious and uneasy. This stage of relatively small emotional fluctuations reflects that users are in a psychological state of exploration and observation.
Figure 6.
Graph of sentiment scores over time.
Figure 6.
Graph of sentiment scores over time.
With the gradual operation of the technology, emotional fluctuations began to intensify. There were two significant declines in emotional scores (such as in early September 2024), related to several unmanned driving accidents, which were widely spread on social media. For example, several pedestrian collisions caused by unmanned vehicles in Wuhan triggered strong public doubts about the safety of the technology, leadingto a significant drop in emotional scores. However, whenever Baidu released technical improvements or took responsive measures, the emotional scores often rebounded quickly, indicating that users would regain confidence after experiencing technical improvements, proper accident handling, or positive media coverage. This fluctuation reflects the "trust repair process" of users in the immature stage of technology, a typical psychological phenomenon as technology moves from "distrust" to "limited trust".
5. Conclusion and Outlook
Through the large-scale analysis of user comments on the Douyin platform, this study has revealed the multi-dimensional characteristics of public emotional responses to the "RoboTaxi" autonomous driving platform. From a technical perspective, this study has successfully achieved efficient analysis of large-scale unstructured data by adopting the combination of RoBERTa and BERTopic natural language processing technologies. However, the limitations of this method are also undeniable. The emotional and immediate nature of social media comment data, while providing extremely rich user feedback, presents challenges in analyzing public emotions over the long term due to its highly fragmented and arbitrary nature. At the same time, although the BERTopic model can automatically extract some potential themes, its limited ability to handle complex contextual text prevents it from fully revealing the deep emotional motivations of users. Therefore, future research will attempt to combine multi-source data and adopt interdisciplinary research methods to further enhance the accuracy and breadth of sentiment analysis.
Funding
(1) The Fundamental Research Funds for the Universities of Henan Province. ”Research on the Design and Operation Mechanism of Rural Shared Logistics Network in the Central and Western Regions”, Project No. NSFRF230425. (2) Soft Science Research Project of Henan Provincial Department of Science and Technology: Research on Spatial Layout Planning of Emergency Logistics Network in the Central Plains Region, Project No. 242400410292.
References
- Baccianella, Stefano, Andrea Esuli and Fabrizio Sebastiani. “SentiWordNet 3.0: An Enhanced Lexical Resource for Sentiment Analysis and Opinion Mining.” International Conference on Language Resources and Evaluation (2010).
- Ahmad, Munir, Shabib Aftab, Muhammad Salman Bashir and Naoureen Hameed. “Sentiment Analysis using SVM: A Systematic Literature Review.” International Journal of Advanced Computer Science and Applications 9 (2018): n. pag.
- Sumathi, N. and Dr. T. Sheela. “AN EFFICIENT SENTIMENT ANALYSIS BY USING HYBRID NAIVE BAYES AND SVM APPROACH IN BANKING INSTITUTIONS.” (2017).
- Hongjie Deng, Daji Ergu, Fangyao Liu, Ying Cai, Bo Ma,Text sentiment analysis of fusion model based on attention mechanism,Procedia Computer Science,Volume 199,2022,Pages 741-748.
- dos Santos, C.N., Gatti, M.: Deep convolutional neural networks for sentiment analysis of short texts. In: Proceedings of the 25th International Conference on Computational Linguistics (COLING), Dublin, Ireland (2014). P: In.
- Devlin, Jacob, Ming-Wei Chang, Kenton Lee and Kristina Toutanova. “BERT: Pre-training of Deep Bidirectional Transformers for Language Understanding.” North American Chapter of the Association for Computational Linguistics (2019).
- Krzysztof Fiok, Waldemar Karwowski, Edgar Gutierrez, Maciej Wilamowski,Analysis of sentiment in tweets addressed to a single domain-specific Twitter account: Comparison of model performance and explainability of predictions,Expert Systems with Applications,Volume 186,2021.
- Grootendorst, Maarten R.. “BERTopic: Neural topic modeling with a class-based TF-IDF procedure.” ArXiv abs/2203.05794 (2022): n. pag.
- Wang, Y., Huang; et al. Un-derstanding How Dimension Reduction Tools Work: An Empirical Approach to Deciphering t-SNE, UMAP, TriMAP, and PaCMAP for Data Visualization. Journal of Machine Learning Research 2021, 22, 1–73. [Google Scholar]
- ROUCHDY Y,COHEN LD. Geodesic voting for the auto-matic extraction of tree structures. Methods and applications. Computer Vision and Image Understanding 2013, 117, 1453–1467. [CrossRef]
|
Disclaimer/Publisher’s Note: The statements, opinions and data contained in all publications are solely those of the individual author(s) and contributor(s) and not of MDPI and/or the editor(s). MDPI and/or the editor(s) disclaim responsibility for any injury to people or property resulting from any ideas, methods, instructions or products referred to in the content. |
© 2024 by the authors. Licensee MDPI, Basel, Switzerland. This article is an open access article distributed under the terms and conditions of the Creative Commons Attribution (CC BY) license (http://creativecommons.org/licenses/by/4.0/).
