Submitted:
15 October 2024
Posted:
18 October 2024
You are already at the latest version
Abstract
Keywords:
1. Introduction
2. Wave Dissipation by Natural Habitats
2.1. State of the Art
2.2. Theoretical Formulation of Wave Dissipation
3. Material and Methods
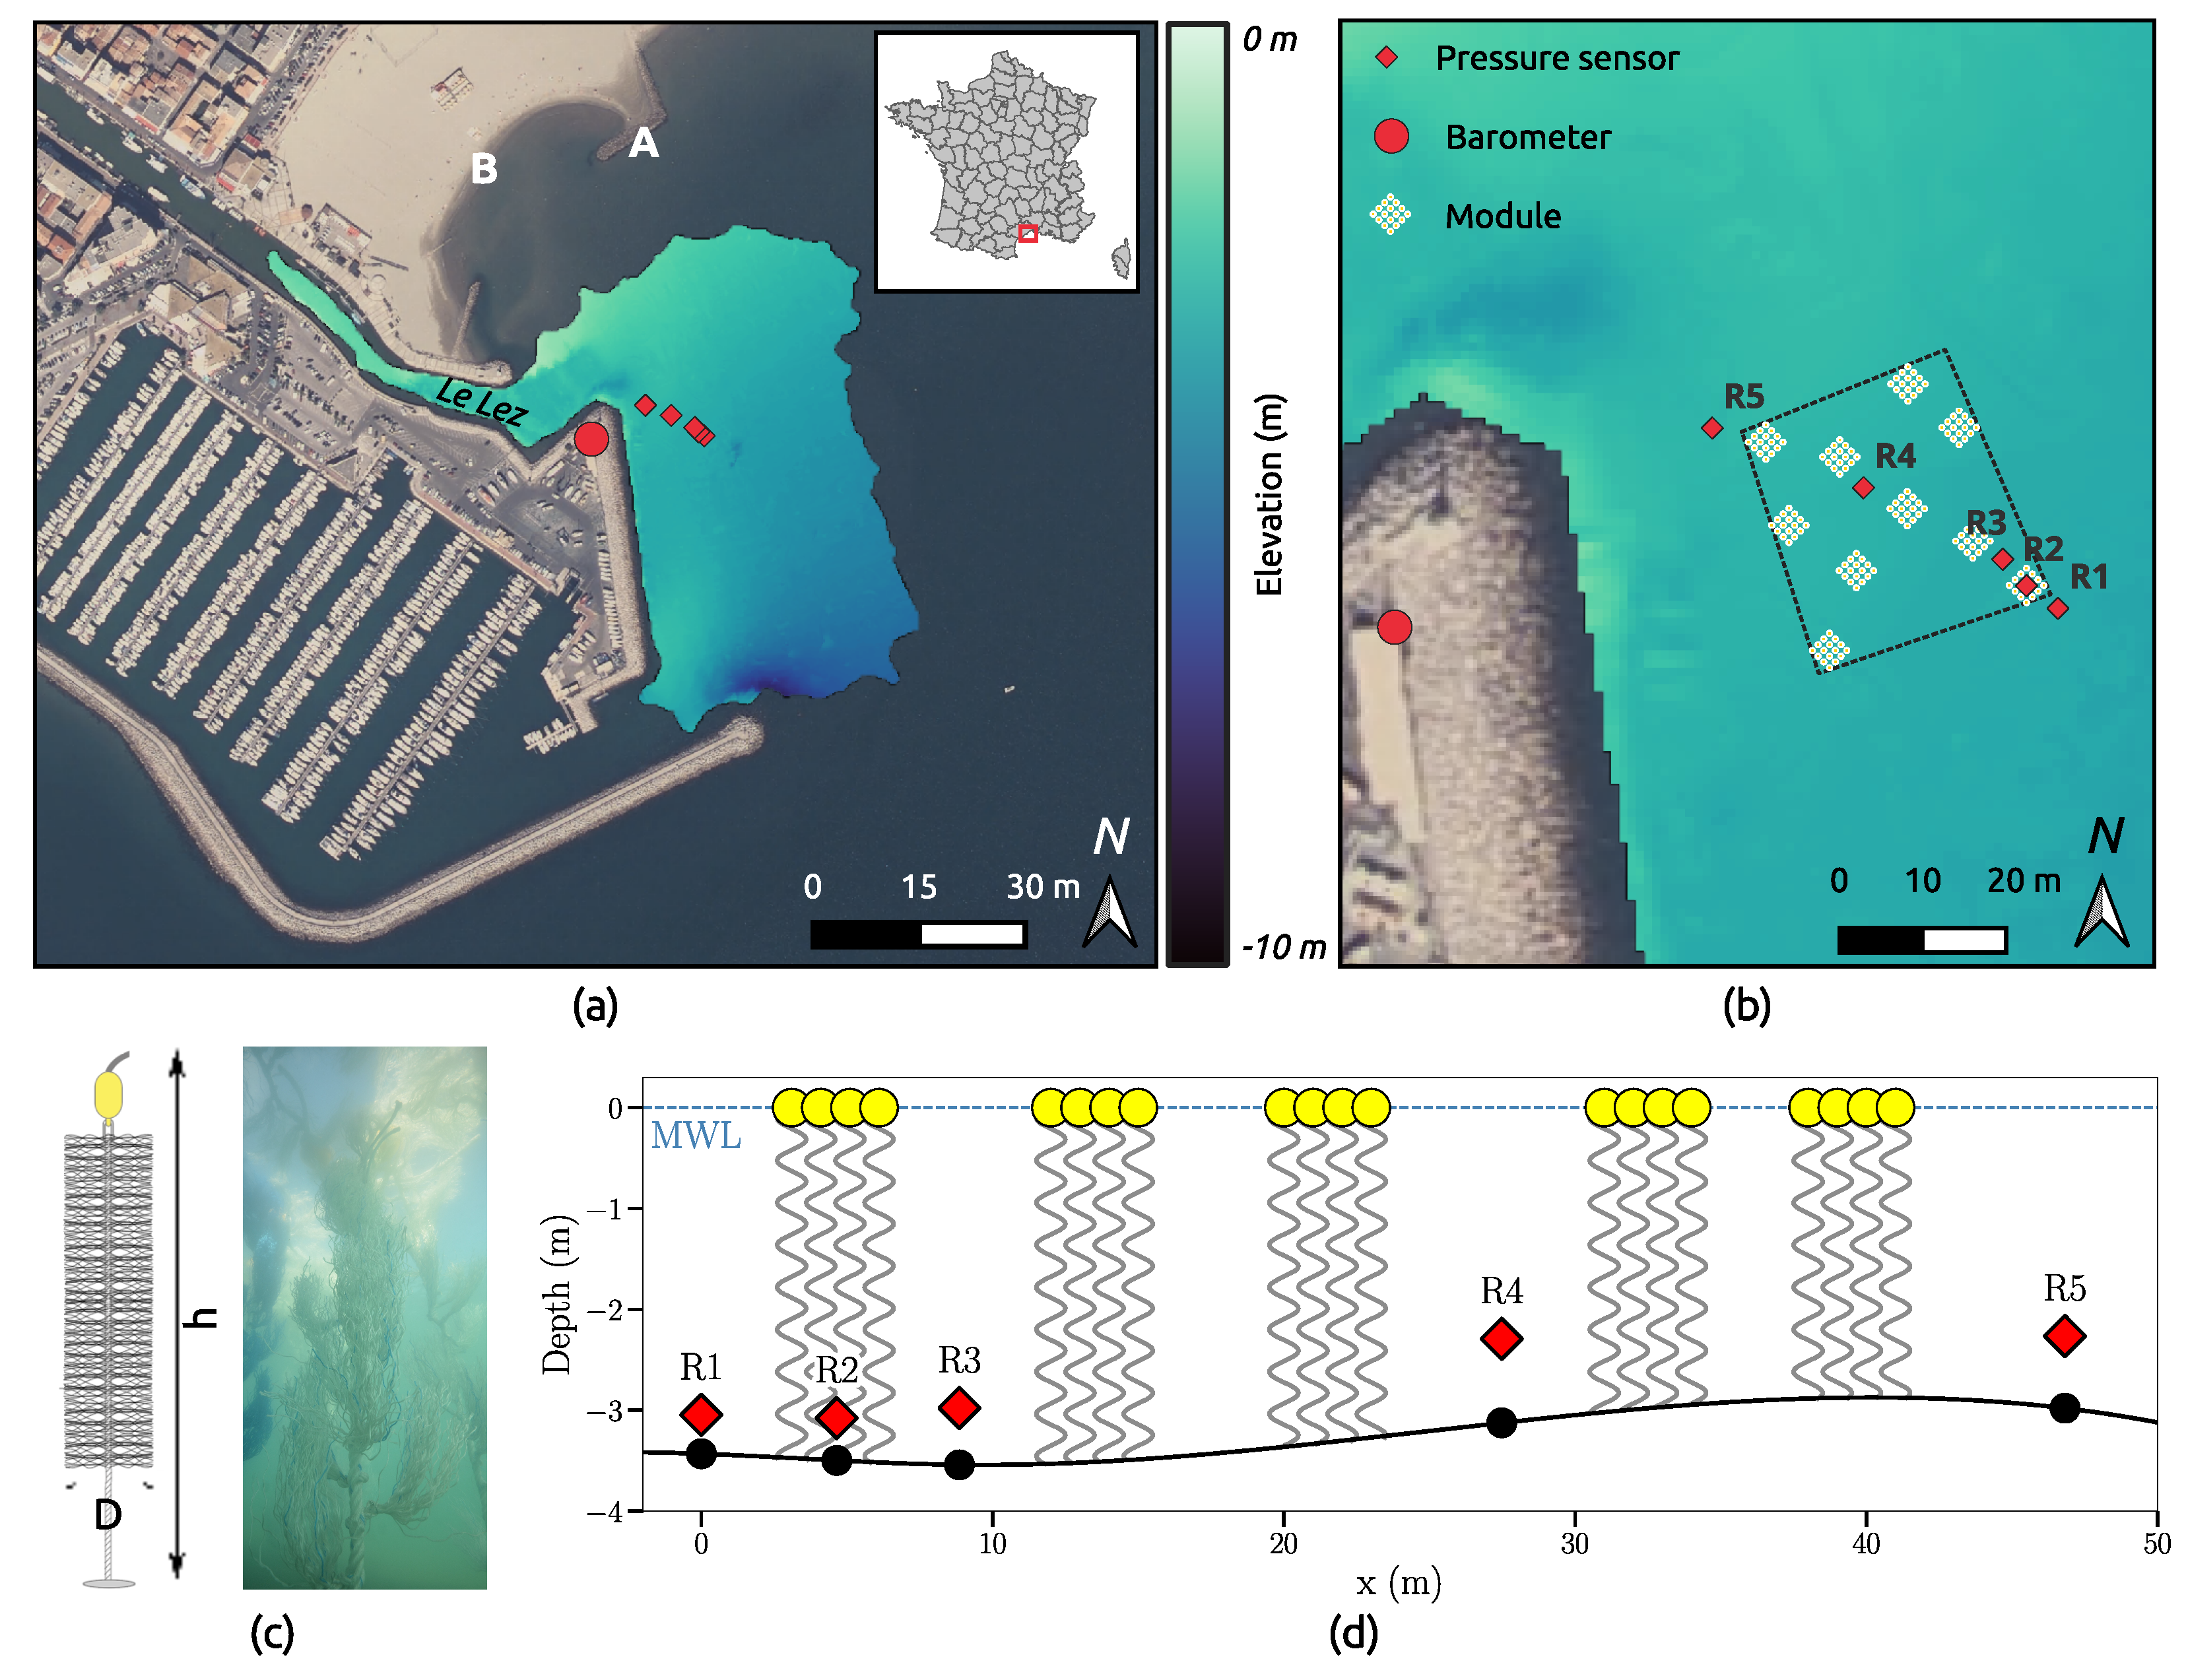
3.1. Study Area
3.2. The Biomimetic Structure
3.3. Field Data Collection
3.4. Field Data Analysis
4. Results
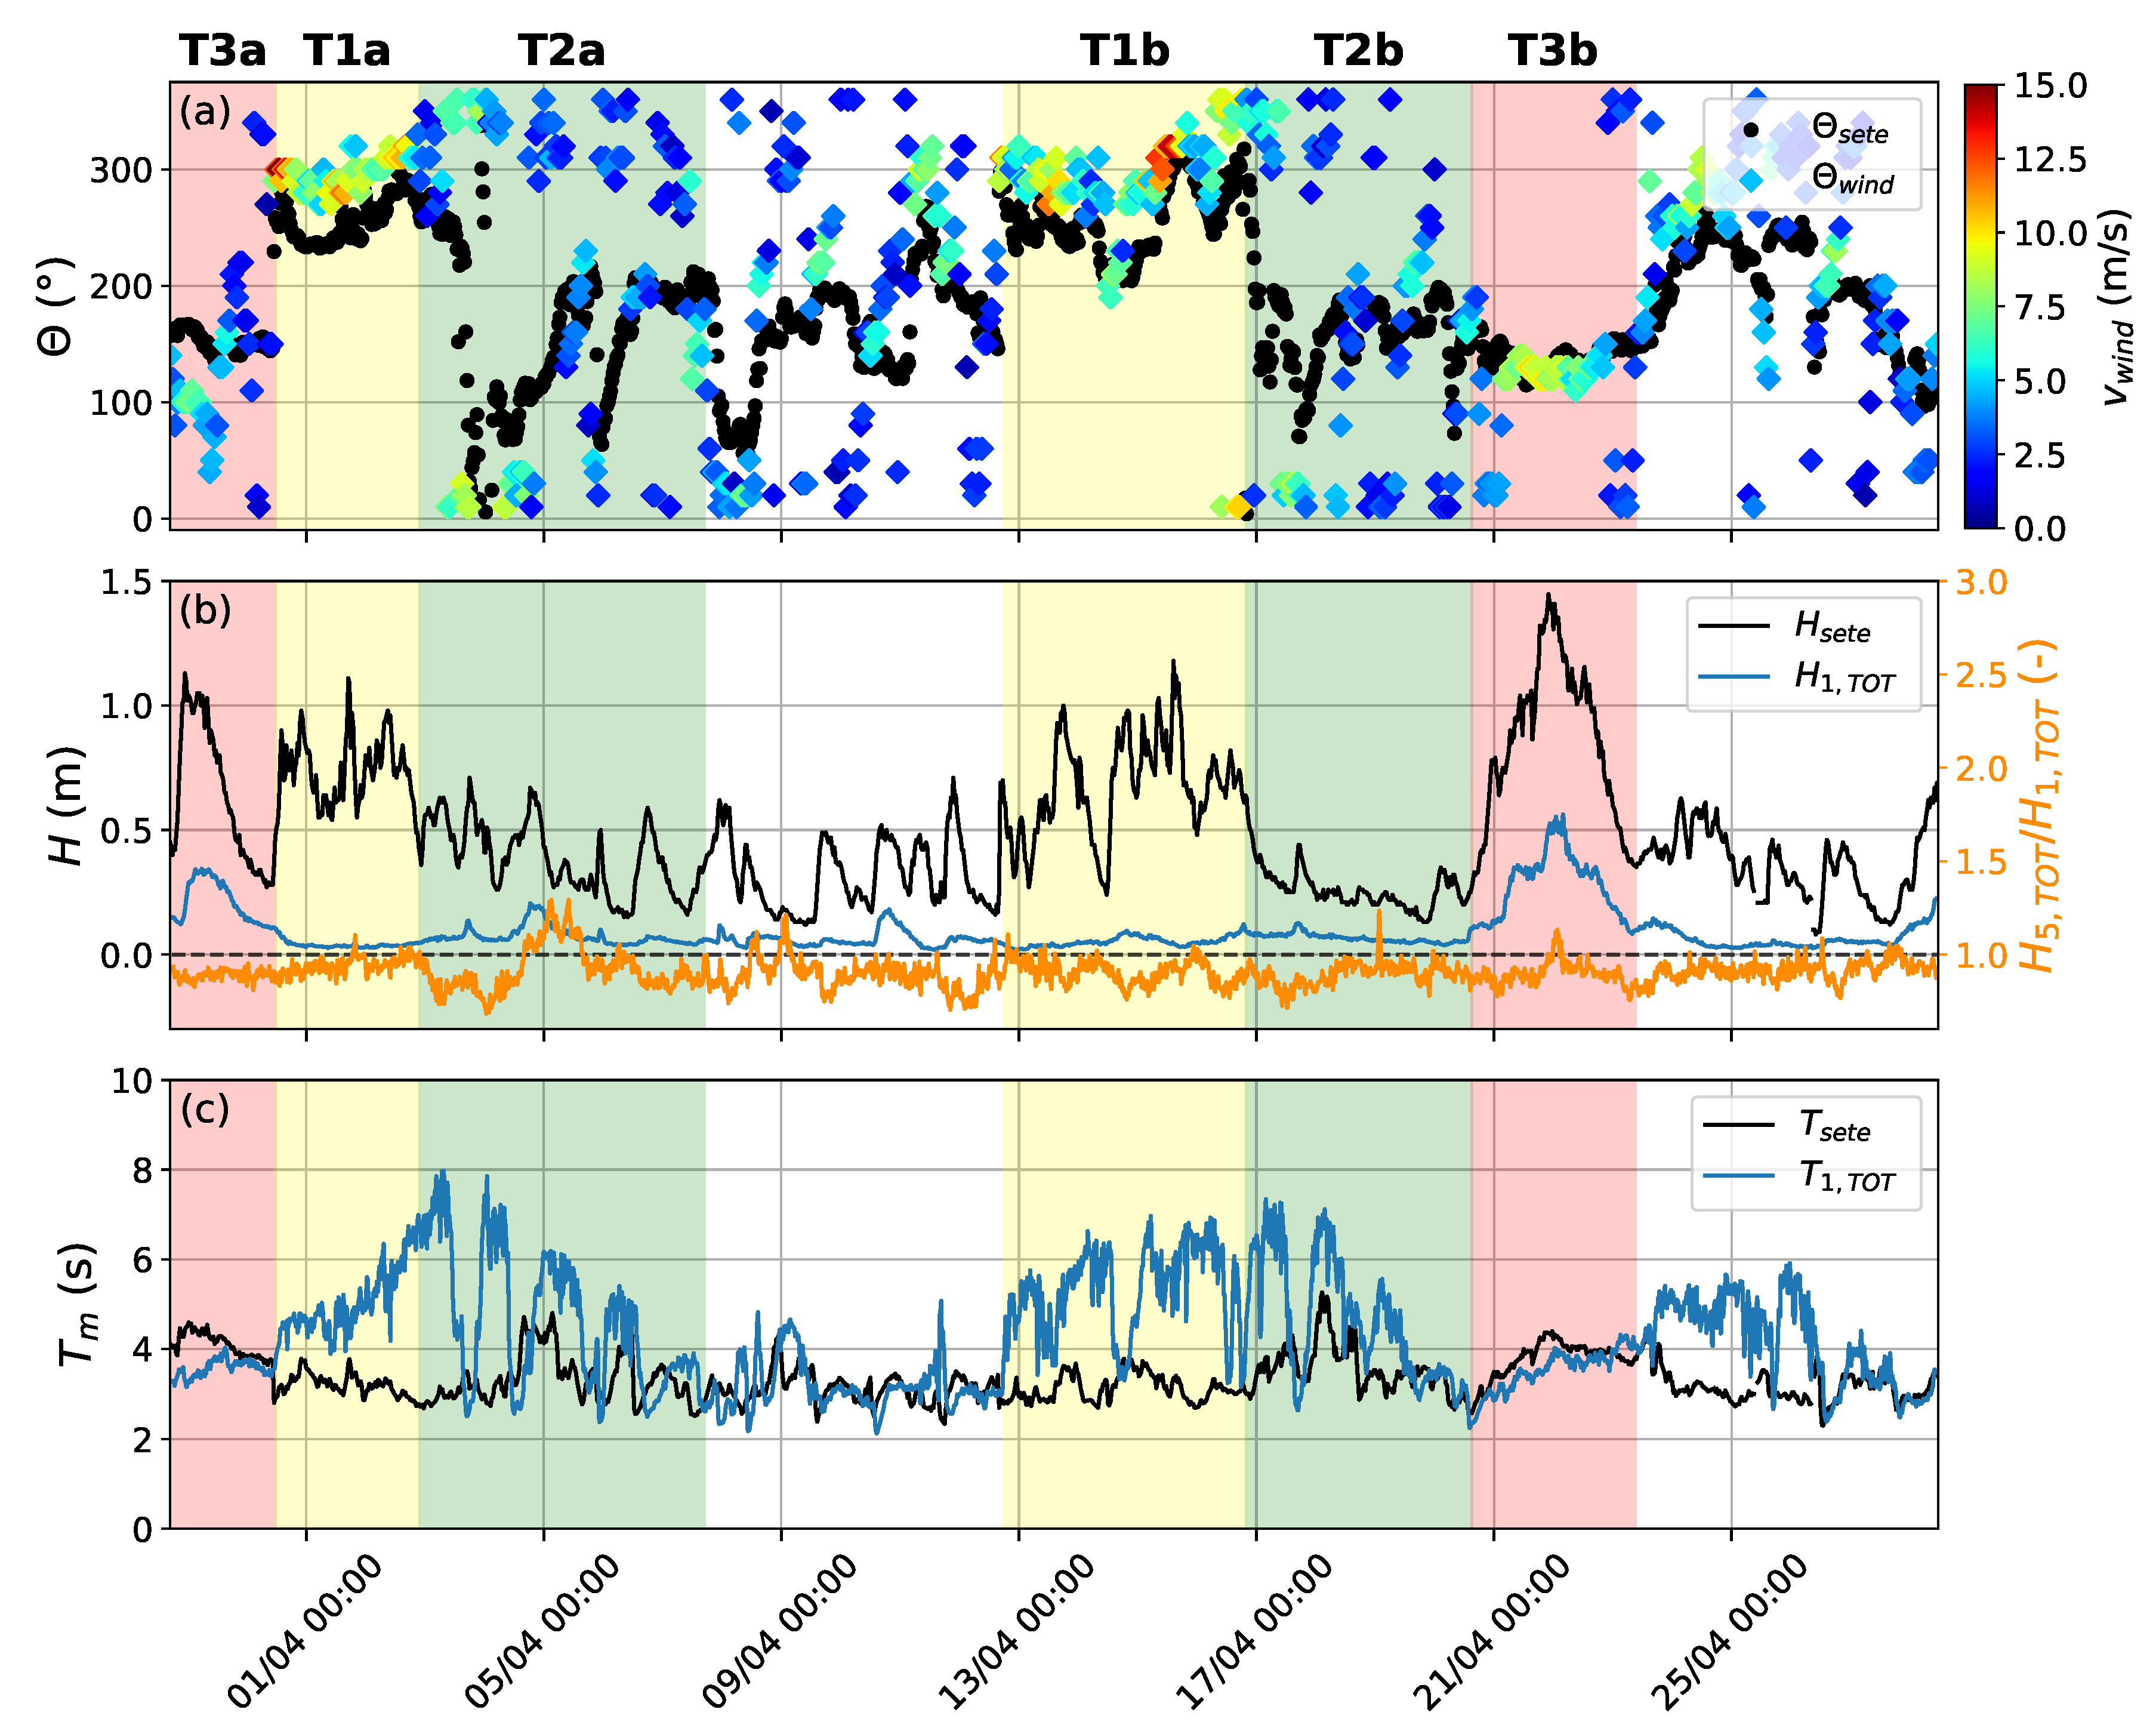
4.1. Forcing Conditions Offshore and at R1 Station
4.2. Conditions over the First Module of the Biomimetic Solution
4.3. Mean Wave Dissipation by the Biomimetic Solution
4.4. Variability in Wave Dissipation Driven by Meteo-Marine Conditions
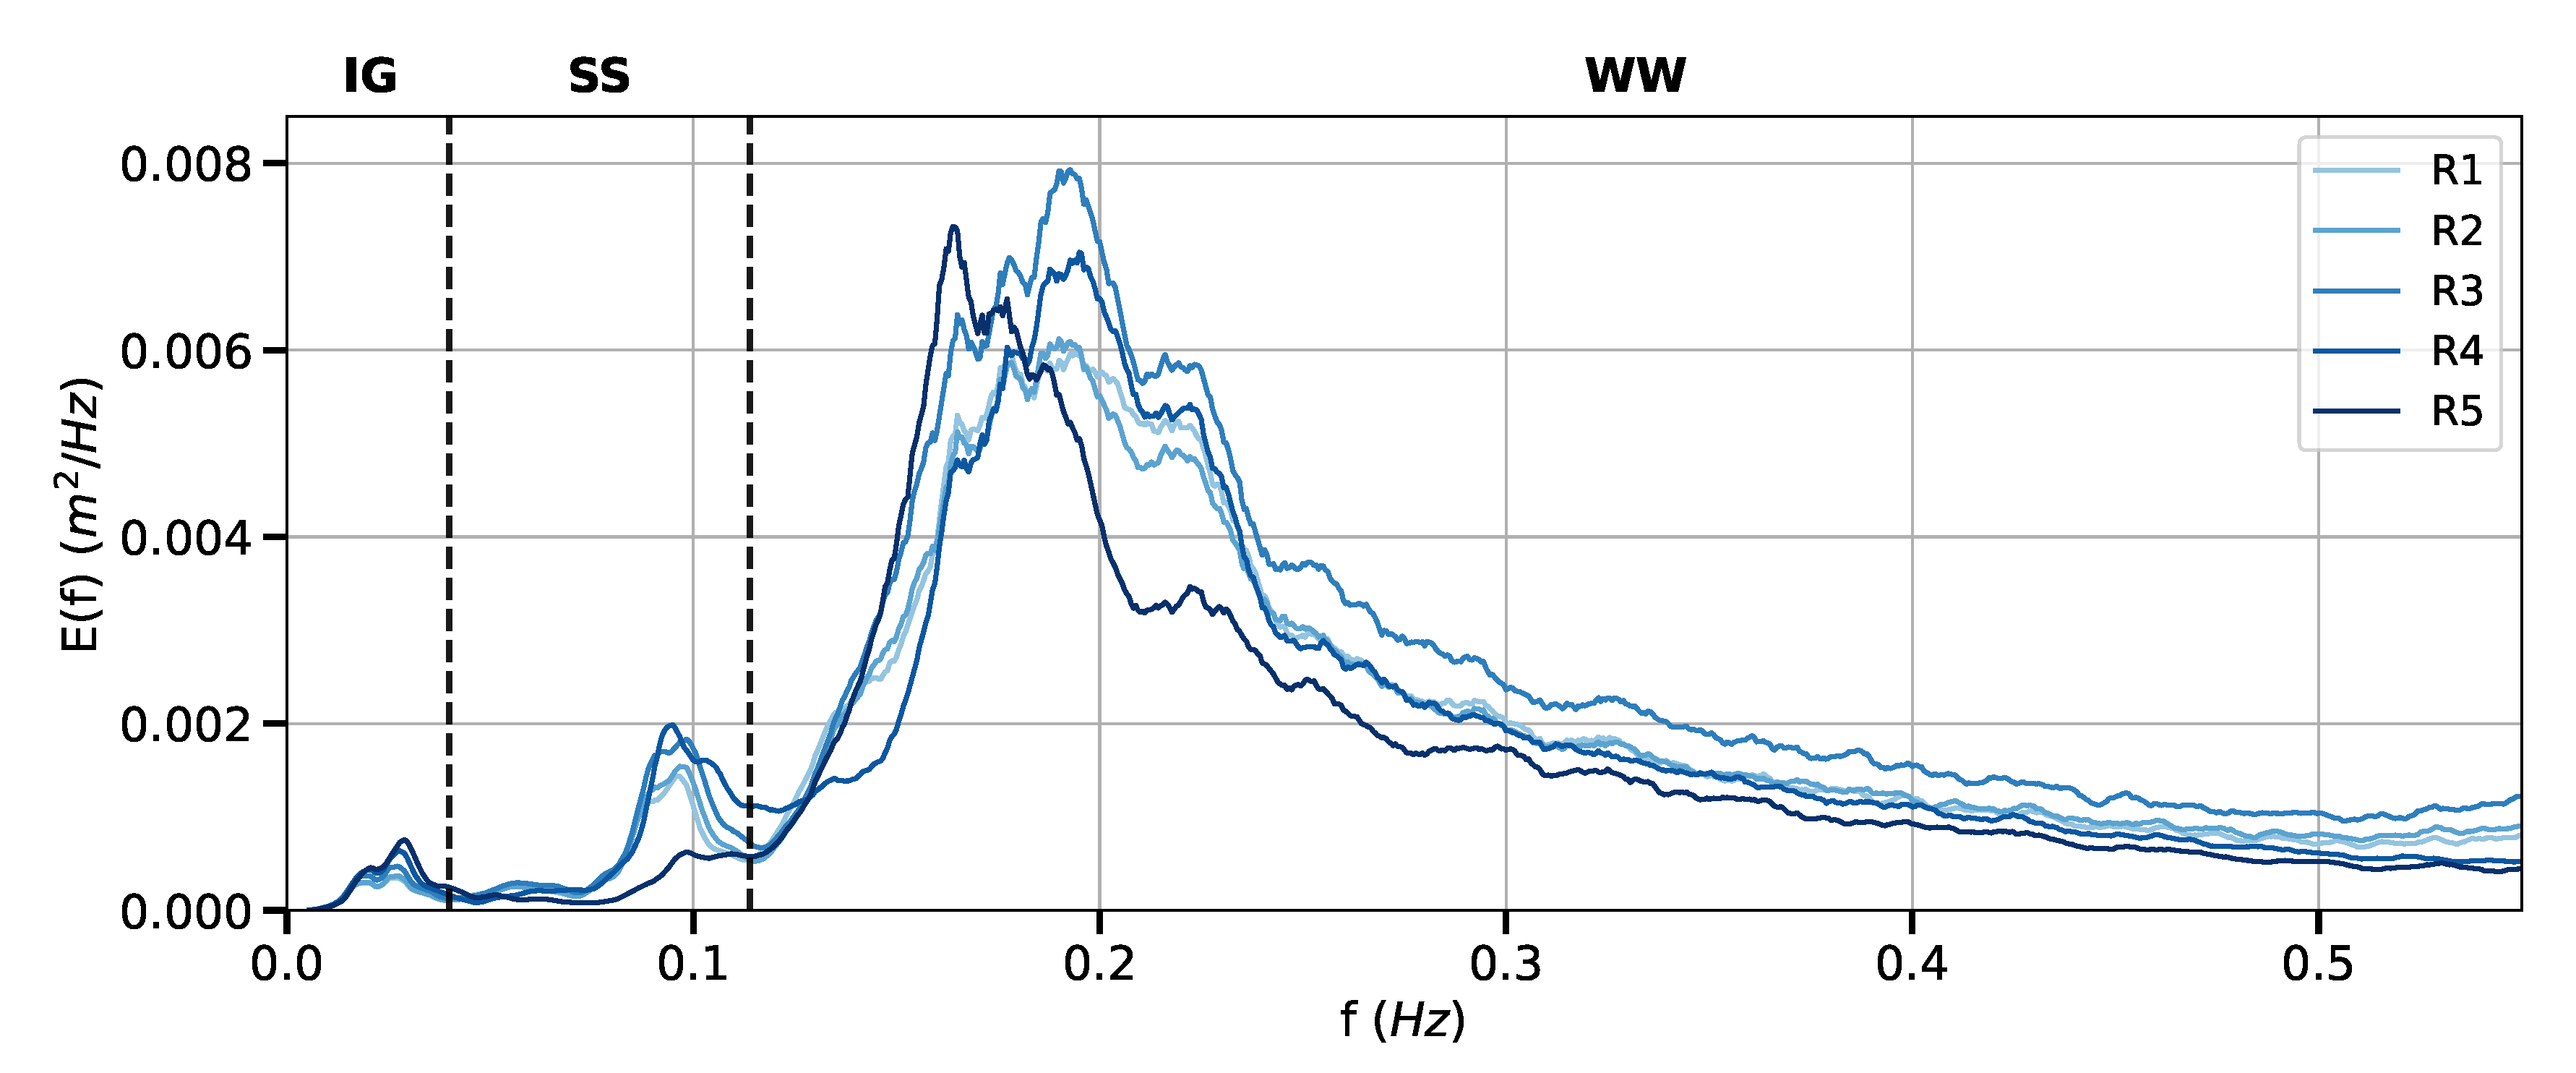
4.5. Spectral Wave Dissipation
5. Discussion
5.1. Control of Stationary Wave Inferred by the Biomimetic Solution on Wave Dissipation
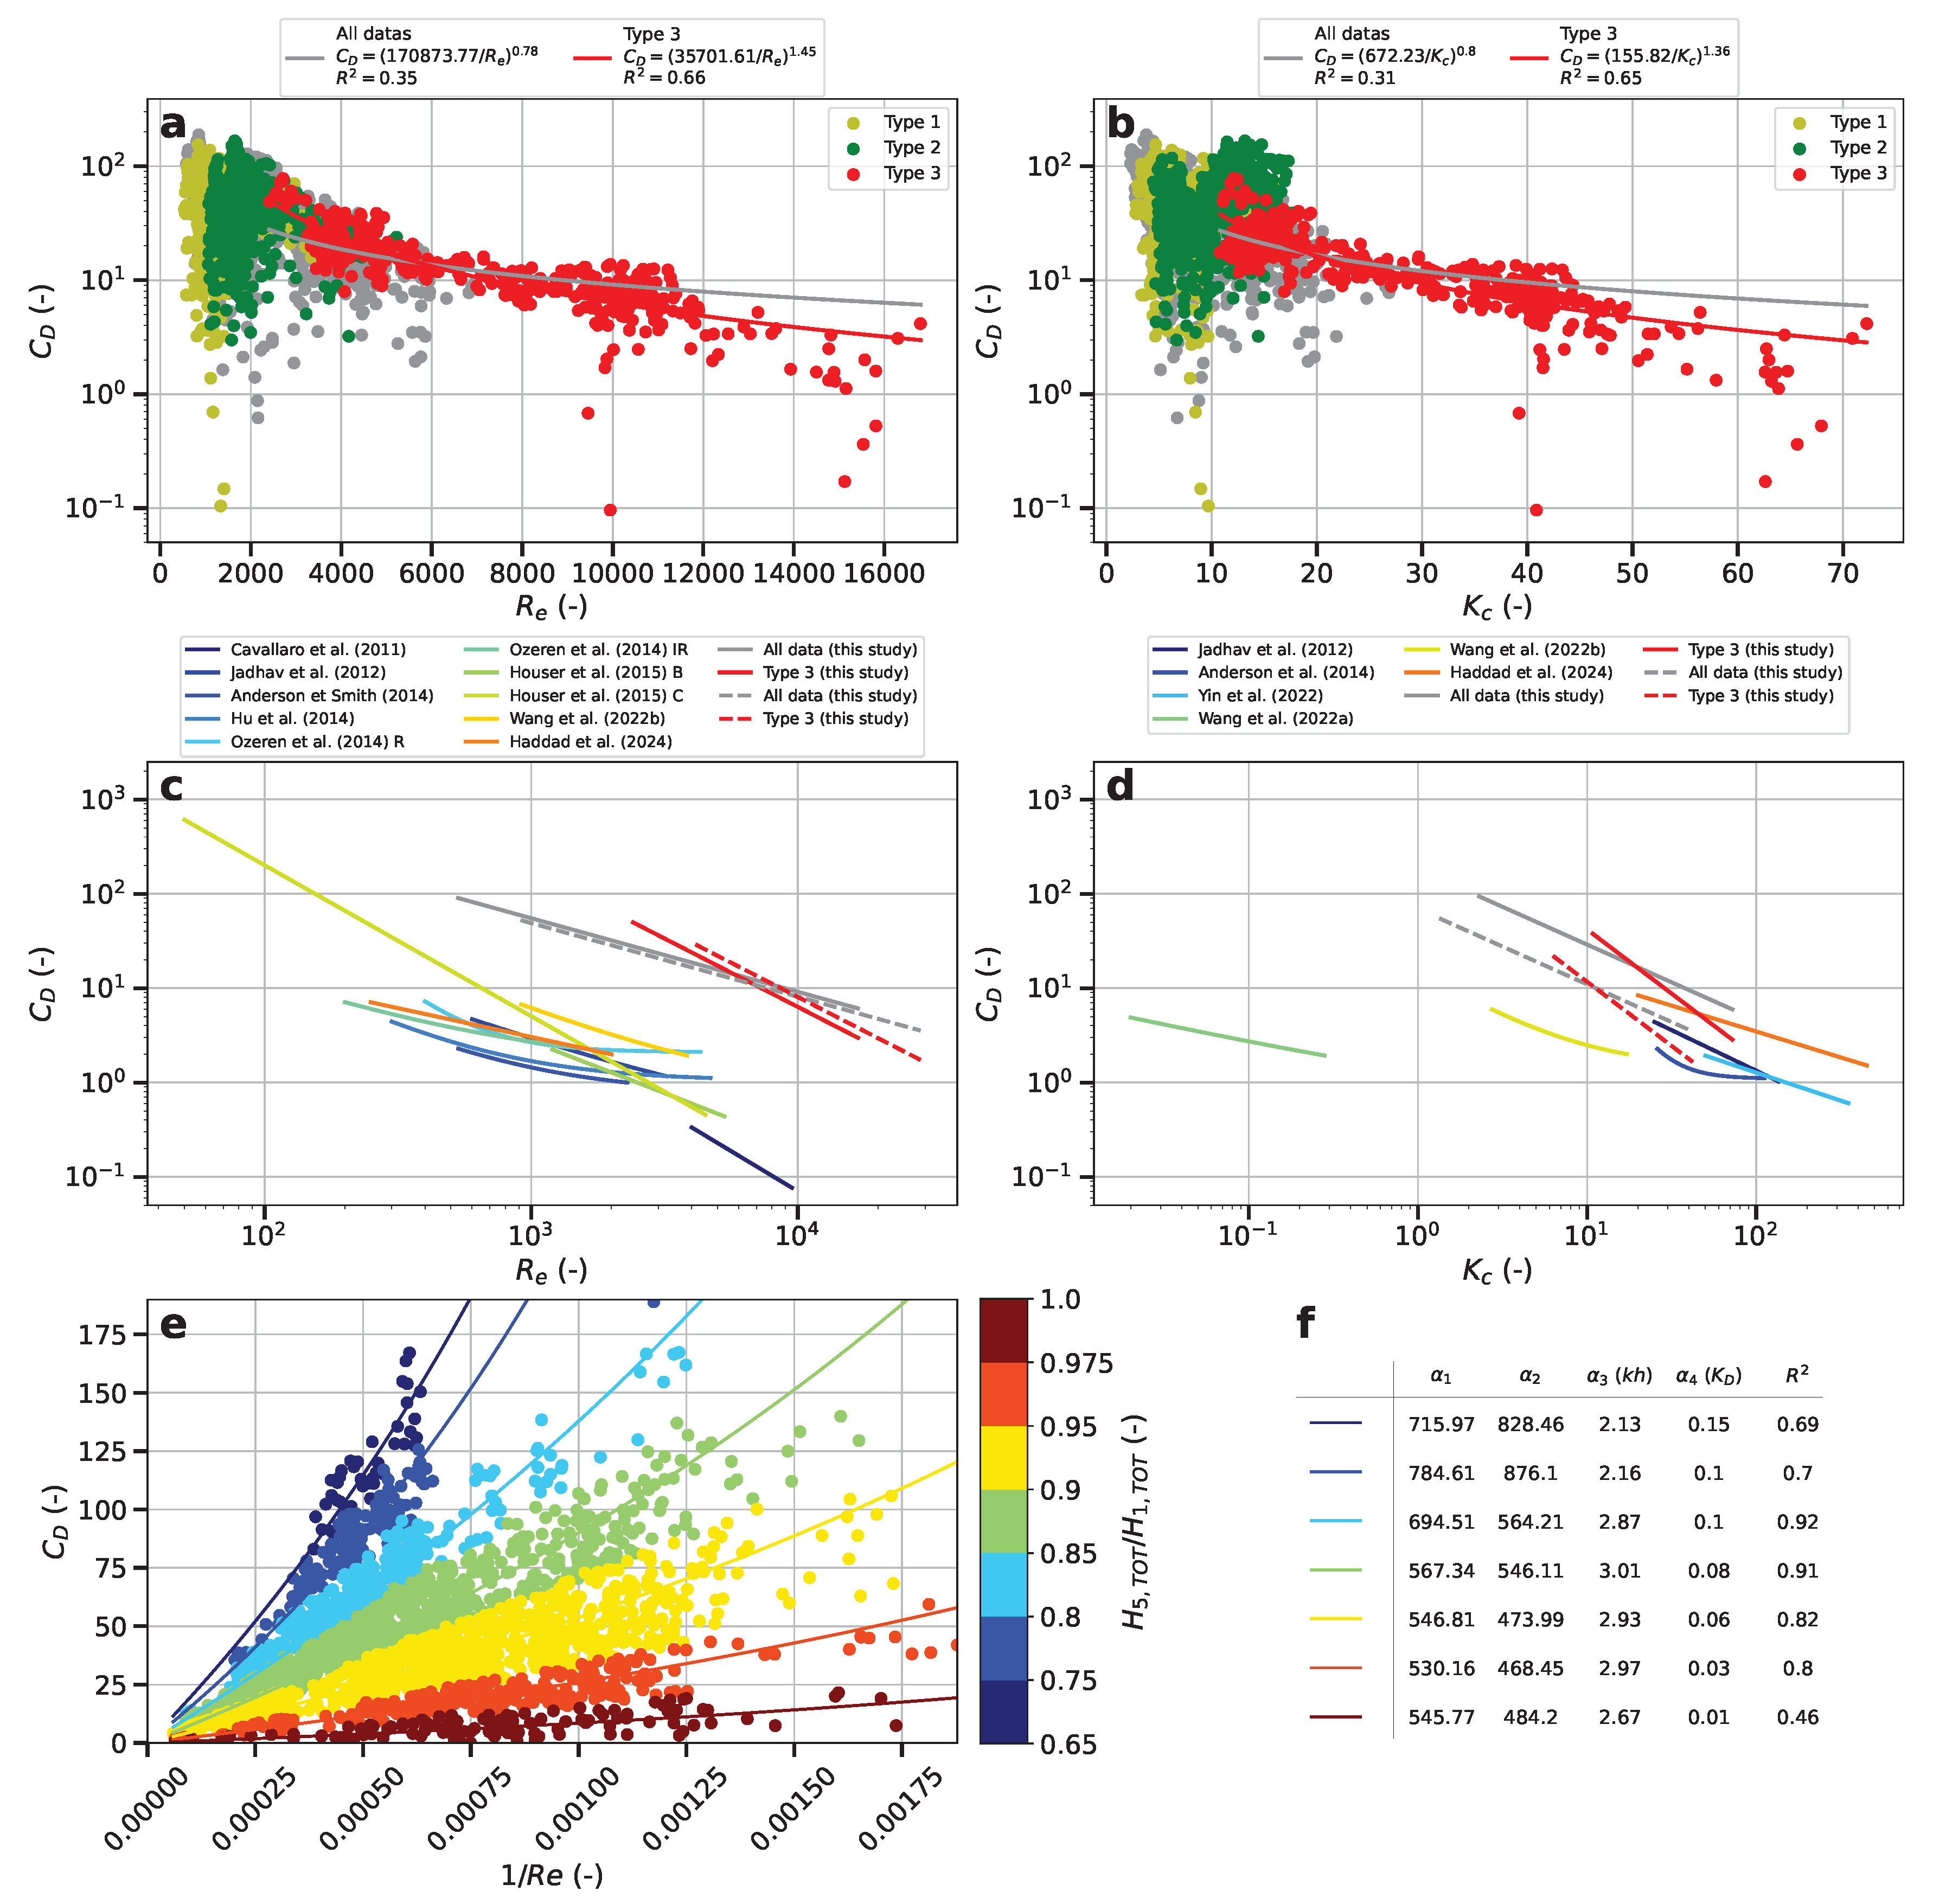
5.2. Defining an Empirical Drag Coefficient for the Biomimetic Solution
6. Conclusion and Perspectives
Author Contributions
Funding
Data Availability Statement
Acknowledgments
Conflicts of Interest
References
- Bruun, P. The history and philosophy of coastal protection. In Coastal Engineering 1972; 1972; pp. 33–74. [CrossRef]
- Caulk, A.D.; Gannon, J.E.; Shaw, J.R.; Hartig, J.H. Best management practices for soft engineering of shorelines. Greater Detroit American Heritage River Initiative 2000.
- Hartig, J.; Zarull, M.; Cook, A. Soft shoreline engineering survey of ecological effectiveness. Ecol. Eng. 2011, 37, 1231–1238. [CrossRef]
- Douglass, S.L.; Pickel, B.H. The Tide Doesn’t Go Out Anymore- The Effect of Bulkheads on Urban Bay Shorelines. Shore & Beach 1999, 67, 19–25.
- Govarets, A.; Lauwerts, B. Assessment of the impact of coastal defence structures. Biodiversity series: OSPAR Commission 2009.
- Sutton-Grier, A.E.; Wowk, K.; Bamford, H. Future of our coasts: The potential for natural and hybrid infrastructure to enhance the resilience of our coastal communities, economies and ecosystems. Environmental Science & Policy 2015, 51, 137–148. [CrossRef]
- Morris, R.L.; Konlechner, T.M.; Ghisalberti, M.; Swearer, S.E. From grey to green: Efficacy of eco-engineering solutions for nature-based coastal defence. Glob. Change Biol. 2018, 24, 1827–1842. [CrossRef]
- Silva, R.; Mendoza, E.; Mariño-Tapia, I.; Martínez, M.L.; Escalante, E. An artificial reef improves coastal protection and provides a base for coral recovery. J. Coast. Res. 2016, pp. 467–471. Publisher: Coastal Education and Research Foundation.
- Perricone, V.; Mutalipassi, M.; Mele, A.; Buono, M.; Vicinanza, D.; Contestabile, P. Nature-based and bioinspired solutions for coastal protection: an overview among key ecosystems and a promising pathway for new functional and sustainable designs. ICES J. Mar. Sci. 2023, p. fsad080. Publisher: Oxford University Press. [CrossRef]
- Narayan, S.; Beck, M.W.; Reguero, B.G.; Losada, I.J.; Van Wesenbeeck, B.; Pontee, N.; Sanchirico, J.N.; Ingram, J.C.; Lange, G.M.; Burks-Copes, K.A. The effectiveness, costs and coastal protection benefits of natural and nature-based defences. PloS one 2016, 11, e0154735. Publisher: Public Library of Science San Francisco, CA USA. [CrossRef]
- Mullarney, J.C.; Henderson, S.M. Flows within marine vegetation canopies. Advances in coastal hydraulics 2018, pp. 1–46. Publisher: World Scientific Publishing Ltd. Singapore.
- Katiyar, N.K.; Goel, G.; Hawi, S.; Goel, S. Nature-inspired materials: Emerging trends and prospects. NPG Asia Mater 2021, 13, 56. [CrossRef]
- Nowacki, D.J.; Beudin, A.; Ganju, N.K. Spectral wave dissipation by submerged aquatic vegetation in a back-barrier estuary: Wave dissipation by vegetation. Limnol. Oceanogr. 2017, 62, 736–753. [CrossRef]
- Tuya, F.; Vila, F.; Bergasa, O.; Zarranz, M.; Espino, F.; Robaina, R.R. Artificial seagrass leaves shield transplanted seagrass seedlings and increase their survivorship. Aquat. Bot. 2017, 136, 31–34. [CrossRef]
- Ghisalberti, M.; Nepf, H.M. Mixing layers and coherent structures in vegetated aquatic flows. J. Geophys. Res.: Oceans 2002, 107, 3–1. Publisher: Wiley Online Library. [CrossRef]
- Luhar, M.; Coutu, S.; Infantes, E.; Fox, S.; Nepf, H. Wave-induced velocities inside a model seagrass bed. J. Geophys. Res.: Oceans 2010, 115. Publisher: Wiley Online Library. [CrossRef]
- Tang, C.; Yi, Y.; Zhang, S. Flow and turbulence in unevenly obstructed channels with rigid and flexible vegetation. J. Environ. Manag. 2023, 326, 116736. [CrossRef]
- Pujol, D.; Nepf, H. Breaker-generated turbulence in and above a seagrass meadow. Cont. Shelf Res. 2012, 49, 1–9. Publisher: Elsevier. [CrossRef]
- Tinoco, R.O.; Coco, G. Turbulence as the Main Driver of Resuspension in Oscillatory Flow Through Vegetation. J. Geophys. Res. Earth Surf. 2018, 123, 891–904. [CrossRef]
- Wu, C.; Wu, S.; Wu, X.; Zhang, Y.; Feng, K.; Zhang, W.; Zhao, Y. Hydrodynamics affected by submerged vegetation with different flexibility under unidirectional flow. Front. Mar. Sci. 2023, 9, 1041351. [CrossRef]
- Mendez, F.J.; Losada, I.J. An empirical model to estimate the propagation of random breaking and nonbreaking waves over vegetation fields. Coast Eng. 2004, 51, 103–118. [CrossRef]
- Houser, C.; Trimble, S.; Morales, B. Influence of Blade Flexibility on the Drag Coefficient of Aquatic Vegetation. Estuar. Coast 2015, 38, 569–577. [CrossRef]
- van Veelen, T.J.; Fairchild, T.P.; Reeve, D.E.; Karunarathna, H. Experimental study on vegetation flexibility as control parameter for wave damping and velocity structure. Coast Eng. 2020, 157, 103648. [CrossRef]
- Chen, S.N.; Sanford, L.P.; Koch, E.W.; Shi, F.; North, E.W. A nearshore model to investigate the effects of seagrass bed geometry on wave attenuation and suspended sediment transport. Estuar. Coast 2007, 30, 296–310. Publisher: Springer. [CrossRef]
- Hansen, J.C.; Reidenbach, M.A. Wave and tidally driven flows in eelgrass beds and their effect on sediment suspension. Mar. Ecol. Prog. Ser. 2012, 448, 271–287. [CrossRef]
- Ganthy, F.; Soissons, L.; Sauriau, P.G.; Verney, R.; Sottolichio, A. Effects of short flexible seagrass Zostera noltei on flow, erosion and deposition processes determined using flume experiments. Sedimentology 2015, 62, 997–1023. Publisher: Wiley Online Library. [CrossRef]
- Liu, C.; Shan, Y.; Nepf, H. Impact of Stem Size on Turbulence and Sediment Resuspension Under Unidirectional Flow. Water Resour. Res. 2021, 57. [CrossRef]
- Reguero, B.G.; Beck, M.W.; Agostini, V.N.; Kramer, P.; Hancock, B. Coral reefs for coastal protection: A new methodological approach and engineering case study in Grenada. J. Environ. Manag. 2018, 210, 146–161. [CrossRef]
- Ghiasian, M.; Carrick, J.; Rhode-Barbarigos, L.; Haus, B.; Baker, A.C.; Lirman, D. Dissipation of wave energy by a hybrid artificial reef in a wave simulator: implications for coastal resilience and shoreline protection. Limnol. Oceanogr. Methods 2021, 19, 1–7. [CrossRef]
- Jadhav, R.S.; Chen, Q. Field investigation of wave dissipation over salt marsh vegetation during tropical cyclone. Int. Conf. Coastal. Eng. 2012, 1, 41. [CrossRef]
- Anderson, M.; Smith, J. Wave attenuation by flexible, idealized salt marsh vegetation. Coast Eng. 2014, 83, 82–92. [CrossRef]
- Zhang, X.; Lin, P.; Nepf, H. A simple-wave damping model for flexible marsh plants. Limnol. Oceanogr. 2021, 66, 4182–4196. Publisher: Wiley Online Library. [CrossRef]
- Zhang, X.; Nepf, H. Reconfiguration of and drag on marsh plants in combined waves and current. J. Fluids Struct. 2022, 110, 103539. Publisher: Elsevier. [CrossRef]
- Kobayashi, N.; Raichle, A.W.; Asano, T. Wave Attenuation by Vegetation. J. Waterway, Port, Coastal, Ocean Eng. 1993, 119, 30–48. [CrossRef]
- Dubi, A.; Tørum, A. Wave damping by kelp vegetation. In Coast Eng. 1994; 1995; pp. 142–156. [CrossRef]
- Bradley, K.; Houser, C. Relative velocity of seagrass blades: Implications for wave attenuation in low-energy environments. J. Geophys. Res. 2009, 114, F01004. [CrossRef]
- Paul, M.; Amos, C.L. Spatial and seasonal variation in wave attenuation over Zostera noltii. J. Geophys. Res. 2011, 116, C08019. [CrossRef]
- Lei, J.; Nepf, H. Wave damping by flexible vegetation: Connecting individual blade dynamics to the meadow scale. Coast Eng. 2019, 147, 138–148. [CrossRef]
- Zhu, L.; Huguenard, K.; Fredriksson, D.W.; Lei, J. Wave attenuation by flexible vegetation (and suspended kelp) with blade motion: Analytical solutions. Adv. Water Resour. 2022, 162, 104148. [CrossRef]
- Wang, Y.; Yin, Z.; Liu, Y. Experimental investigation of wave attenuation and bulk drag coefficient in mangrove forest with complex root morphology. Appl. Ocean Res. 2022, 118, 102974. [CrossRef]
- Wang, Y.; Yin, Z.; Liu, Y. Laboratory study on the drag coefficient for mangrove forests in regular waves. Ocean Eng. 2022, 255, 111522. [CrossRef]
- van Veelen, T.J.; Karunarathna, H.; Reeve, D.E. Modelling wave attenuation by quasi-flexible coastal vegetation. Coast Eng. 2021, 164, 103820. [CrossRef]
- Yin, K.; Xu, S.; Huang, W.; Liu, S.; Li, M. Numerical investigation of wave attenuation by coupled flexible vegetation dynamic model and XBeach wave model. Ocean Eng. 2021, 235, 109357. [CrossRef]
- Beth Schaefer, R.; Nepf, H. Wave damping by seagrass meadows in combined wave-current conditions. Limnol. Oceanogr. 2022, 67, 1554–1565. [CrossRef]
- Méndez, F.J.; Losada, I.J.; Losada, M.A. Hydrodynamics induced by wind waves in a vegetation field. J. Geophys. Res. 1999, 104, 18383–18396. [CrossRef]
- Maza, M.; Lara, J.L.; Losada, I.J. A coupled model of submerged vegetation under oscillatory flow using Navier–Stokes equations. Coast Eng. 2013, 80, 16–34. [CrossRef]
- Henderson, S.M. Motion of buoyant, flexible aquatic vegetation under waves: Simple theoretical models and parameterization of wave dissipation. Coast Eng. 2019, 152, 103497. [CrossRef]
- Lindhart, M.; Daly, M.; Walker, H.; Arzeno-Soltero, I.B.; Yin, J.; Bell, T.W.; Monismith, S.G.; Pawlak, G.; Leichter, J. Short wave attenuation by a kelp forest canopy. Limnol. Oceanogr. Letters 2024. Publisher: Wiley Online Library.
- Elwany, M.H.S.; O’Reilly, W.C.; Guza, R.T.; Flick, R.E. Effects of Southern California Kelp Beds on Waves. J. Waterway, Port, Coastal, Ocean Eng. 1995, 121, 143–150. [CrossRef]
- Rosman, J.H.; Koseff, J.R.; Monismith, S.G.; Grover, J. A field investigation into the effects of a kelp forest (Macrocystis pyrifera) on coastal hydrodynamics and transport. J. Geophys. Res.: Oceans 2007, 112. Publisher: Wiley Online Library.
- Elsmore, K.; Nickols, K.J.; Miller, L.P.; Ford, T.; Denny, M.W.; Gaylord, B. Wave damping by giant kelp, Macrocystis pyrifera. Ann. Bot. 2024, 133, 29–40. Publisher: Oxford University Press US.
- Dalrymple, R.A.; Kirby, J.T.; Hwang, P.A. Wave Diffraction Due to Areas of Energy Dissipation. J. Waterway, Port, Coastal, Ocean Eng. 1984, 110, 67–79. [CrossRef]
- Morison, J.; Johnson, J.W.; Schaaf, S.A. The force exerted by surface waves on piles. J. Pet. Technol. 1950, 2, 149–154. Publisher: SPE. [CrossRef]
- Luhar, M.; Infantes, E.; Nepf, H. Seagrass blade motion under waves and its impact on wave decay. J. Geophys. Res.: Oceans 2017, 122, 3736–3752. [CrossRef]
- Keulegan, G.; Carpenter, L. Forces on cylinders and plates in an oscillating fluid. J. Res. Natl. Bur. Stand. 1958, 60, 423. [CrossRef]
- Cavallaro, L.; Re, C.L.; Paratore, G.; Viviano, A.; Foti, E. Response of posidonia oceanica to wave motion in shallow-waters-preliminary experimental results. Coast Eng. Proc. 2011, pp. 49–49.
- Cavallaro, L.; Viviano, A.; Paratore, G.; Foti, E. Experiments on Surface Waves Interacting with Flexible Aquatic Vegetation. Ocean Sci. J. 2018, 53, 461–474. [CrossRef]
- Haddad, J.; Rosman, J.H.; Luettich, R.A.; Voss, C.M. Canopy drag parameterization from field observations for modeling wave transformation across salt marshes. Coast Eng. 2023, p. 104407. Publisher: Elsevier. [CrossRef]
- Luhar, M.; Nepf, H. Wave-induced dynamics of flexible blades. J. Fluids Struct. 2016, 61, 20–41. [CrossRef]
- Luhar, M.; Nepf, H.M. Flow-induced reconfiguration of buoyant and flexible aquatic vegetation. Limnol. Oceanogr. 2011, 56, 2003–2017. [CrossRef]
- Suzuki, T.; Zijlema, M.; Burger, B.; Meijer, M.C.; Narayan, S. Wave dissipation by vegetation with layer schematization in SWAN. Coast Eng. 2012, 59, 64–71. [CrossRef]
- Jacobsen, N.; McFall, B.; van der A, D. A frequency distributed dissipation model for canopies. Coast Eng. 2019, 150, 135–146. [CrossRef]
- Ascencio, J.A.; Jacobsen, N.G.; McFall, B.C.; Groeneweg, J.; Vuik, V.; Reniers, A.J. Evaluation of Implicit and Explicit Wave Dissipation Models for Submerged and Emergent Aquatic Vegetation. J. Coast. Res. 2022, 38. [CrossRef]
- Horikawa, K. Nearshore Dynamics and Coastal Processes: Theory. Measurement, and Predictive Models: University of Tokyo Press, Tokyo 1988.
- Bertin, X.; de Bakker, A.; Van Dongeren, A.; Coco, G.; André, G.; Ardhuin, F.; Bonneton, P.; Bouchette, F.; Castelle, B.; Crawford, W.C.; others. Infragravity waves: From driving mechanisms to impacts. Earth-Sci. Rev. 2018, 177, 774–799. Publisher: Elsevier.
- Massel, S.R. Ocean surface waves: their physics and prediction; Vol. 11, World scientific, 1996.
- Munk, W.H. The solitary wave theory and its application to surf problems. Annals of the New York Academy of Sciences 1949, 51, 376–424. Publisher: Wiley Online Library. [CrossRef]
- Nelson, R. Height limits in top down and bottom up wave environments. Coast Eng. 1997, 32, 247–254. Publisher: Elsevier. [CrossRef]
- Hedges, T.; Ursell. Regions of validity of analytical wave theories. Proceedings of the Institution of Civil Engineers-Water Maritime and Energy 1995, 112, 111–114. Publisher: Thomas Telford-ICE Virtual Library.
- Mayençon, R. Météorologie Marine in Ed. Maritimes et d’Outre-Mer 1992.
- Phillips, O. The Dynamics of the Upper Ocean. Cambridge monographs on mechanics and applied mathematics 1966, pp. 244–255. Publisher: Cambridge University Press.
- Guo, J. Simple and explicit solution of wave dispersion equation. Coast Eng. 2002, 45, 71–74. Publisher: Elsevier. [CrossRef]
- Rabinovich, A.B. Seiches and harbor oscillations; World Scientific, 2010. Publication Title: Handbook of coastal and ocean engineering. [CrossRef]
- Zhu, L.; Lei, J.; Huguenard, K.; Fredriksson, D.W. Wave attenuation by suspended canopies with cultivated kelp (Saccharina latissima). Coast Eng. 2021, 168, 103947. [CrossRef]
- Hu, Z.; Suzuki, T.; Zitman, T.; Uittewaal, W.; Stive, M. Laboratory study on wave dissipation by vegetation in combined current–wave flow. Coast Eng. 2014, 88, 131–142. [CrossRef]
- Ozeren, Y.; Wren, D.G.; Wu, W. Experimental Investigation of Wave Attenuation through Model and Live Vegetation. J. Waterway, Port, Coastal, Ocean Eng. 2014, 140, 04014019. [CrossRef]
- Yin, K.; Xu, S.; Gong, S.; Chen, J.; Wang, Y.; Li, M. Modeling wave attenuation by submerged flexible vegetation with XBeach phase-averaged model. Ocean Eng. 2022, 257, 111646. [CrossRef]
| Station | R1 | R2 | R3 | R4 | R5 |
|---|---|---|---|---|---|
| Distance (m) | 0 | 4.65 | 8.86 | 27.48 | 46.82 |
| Depth (m) | 2.45 | 3.07 | 2.97 | 2.29 | 2.26 |
| (m) | 0.99 | 0.42 | 0.56 | 0.83 | 0.71 |
| R1 | R2 | R3 | R4 | R5 | ||
|---|---|---|---|---|---|---|
| 5.77 | 5.99 | 7.10 | 9.05 | 10.03 | ||
| Type 1 | 42.72 | 46.05 | 56.38 | 63.62 | 22.39 | |
| 110.93 | 106.70 | 123.54 | 94.50 | 94.19 | ||
| 4.81 | 4.94 | 5.87 | 7.40 | 8.41 | ||
| Type 2 | 82.28 | 88.62 | 108.45 | 111.42 | 36.41 | |
| 283.36 | 285.97 | 344.05 | 252.35 | 295.85 | ||
| 26.09 | 25.78 | 33.49 | 40.02 | 46.80 | ||
| Type 3 | 38.68 | 38.42 | 49.68 | 46.70 | 31.95 | |
| 4861.36 | 4832.46 | 6044.96 | 4802.65 | 4153.89 |
| Reference | Type | Structure | Formulas | Ranges | Wave | |
|---|---|---|---|---|---|---|
| Cavallaro et al. [56] | L | Artificial Posidonia Oceanica | T | R | ||
| Jadhav and Chen [30] | I | Spartina Alterniflora | B | I | ||
| B | I | |||||
| Anderson and Smith [31] | L | Artificial Spartina Alterniflora | T | I | ||
| T | I | |||||
| Hu et al. [75] | L | Wooden rods | T | R | ||
| Ozeren et al. [76] | L | Birch dowels | T | R | ||
| T | I | |||||
| Houser et al. [22] | L | Semi-flexible balsa wood | T | R | ||
| Semi-flexible cable tie | T | R | ||||
| Yin et al. [77] | A | Polyurethane cylinders | T | R | ||
| Wang et al. [40] | L | PVC cylinder | T | R | ||
| Wang et al. [41] | L | PVC cylinder | T | R | ||
| T | R | |||||
| Haddad et al. [58] | I | Spartina Alterniflora | T | I | ||
| T | I | |||||
| Present study | I | Artificial kelp | T | I | ||
| T | I | |||||
| T | I | |||||
| T | I |
Disclaimer/Publisher’s Note: The statements, opinions and data contained in all publications are solely those of the individual author(s) and contributor(s) and not of MDPI and/or the editor(s). MDPI and/or the editor(s) disclaim responsibility for any injury to people or property resulting from any ideas, methods, instructions or products referred to in the content. |
© 2024 by the authors. Licensee MDPI, Basel, Switzerland. This article is an open access article distributed under the terms and conditions of the Creative Commons Attribution (CC BY) license (http://creativecommons.org/licenses/by/4.0/).


