Introduction
The main goal of the structural compatibility analysing is to reduce the risk of building failure by determining the land requirement for better bearing capacity.
Digital soil mapping is one of the best way for soil analysis because of the development of technology. Geographic Information System (GIS) and Remote Sensing (RS) techniques are very useful for preparing these digital maps. We can gather and analyse data from various database that use remote sensing technologies. In recent studies, researches use GIS and RS technologies in their recent studies.( (Adhikary et al., 2008; Ali & Kotb, 2010; Chen et al., 2022; Ghazali et al., 2020; Gorji et al., 2015; Hossain et al., 2023; Labib & Nashed, 2013; Li et al., 2024; Mashalaba et al., 2020; Oldak et al., 2002; Peng et al., 2016; Psomiadis et al., 2020; Radočaj et al., 2023; Savin et al., 2019; Si et al., 2024; Tazin et al., 2024; Topp et al., 2020; Velmurugan et al., 2009; Yalcin & Bulut, 2007; Yilmaz, 2009; Zhang et al., 2007)
In this study, we also use satellite image which is the hyperspectral image that can indicate due to rapid growth of population there is a high demand of land that is prepared for construction. In different countries various investigations and search is carried out for appropriate site for construction mainly for residential building. One of the most important parameters that should be taken seriously is the environmental impact for the structural development.
The scope of this paper is to examine the various factors for structural development and define their relationship with various soil properties. The goal was to create a digital soil map using GIS and satellite image to identify the soil quality of that area whether the soil is suitable for construction or not additionally we also try to evaluate the environmental impact for that.
We used soilgrid database to analyse various soil property such as percentage of sand, silt, clay, bulk density, coarse fragment, organic carbon, cation exchange capacity(at Ph-7), nitrogen, soil organic carbon, PH water, volume of water content at-10 Kpa, volume of water content at-33 Kpa, volume of water content at-1500 Kpa for our selected study area. The SoilGrids database is a convenient online resource that offers global assessments of soil quality at different depths. It is managed by ISRIC (International Soil Reference and Information Center) and provides detailed soil information.
Methodology
In this study,we obtained the location map from simplemaps.com and digital soil map which we collected from Food and Agriculture Organization [FAO]-UNESCO Soil Map of the World. We made our study area maps through ArcGIS 10.7.1 version. The satellite image was collected from USGS.gov website. The four points that is used to identify the soil type are selected from the satellite image and Global Positioning System (GPS). Hyperspectral photos are used to evaluate the land formation and land type. The soil property data such as percentage of sand, silt, clay, bulk density, coarse fragment, organic carbon, cation exchange capacity(at Ph-7), nitrogen, soil organic carbon, PH water, volume of water content at-10 Kpa, volume of water content at-33 Kpa, volume of water content at-1500 Kpa are obtained from soil gride database.
Selecting and Making Maps of Study Location
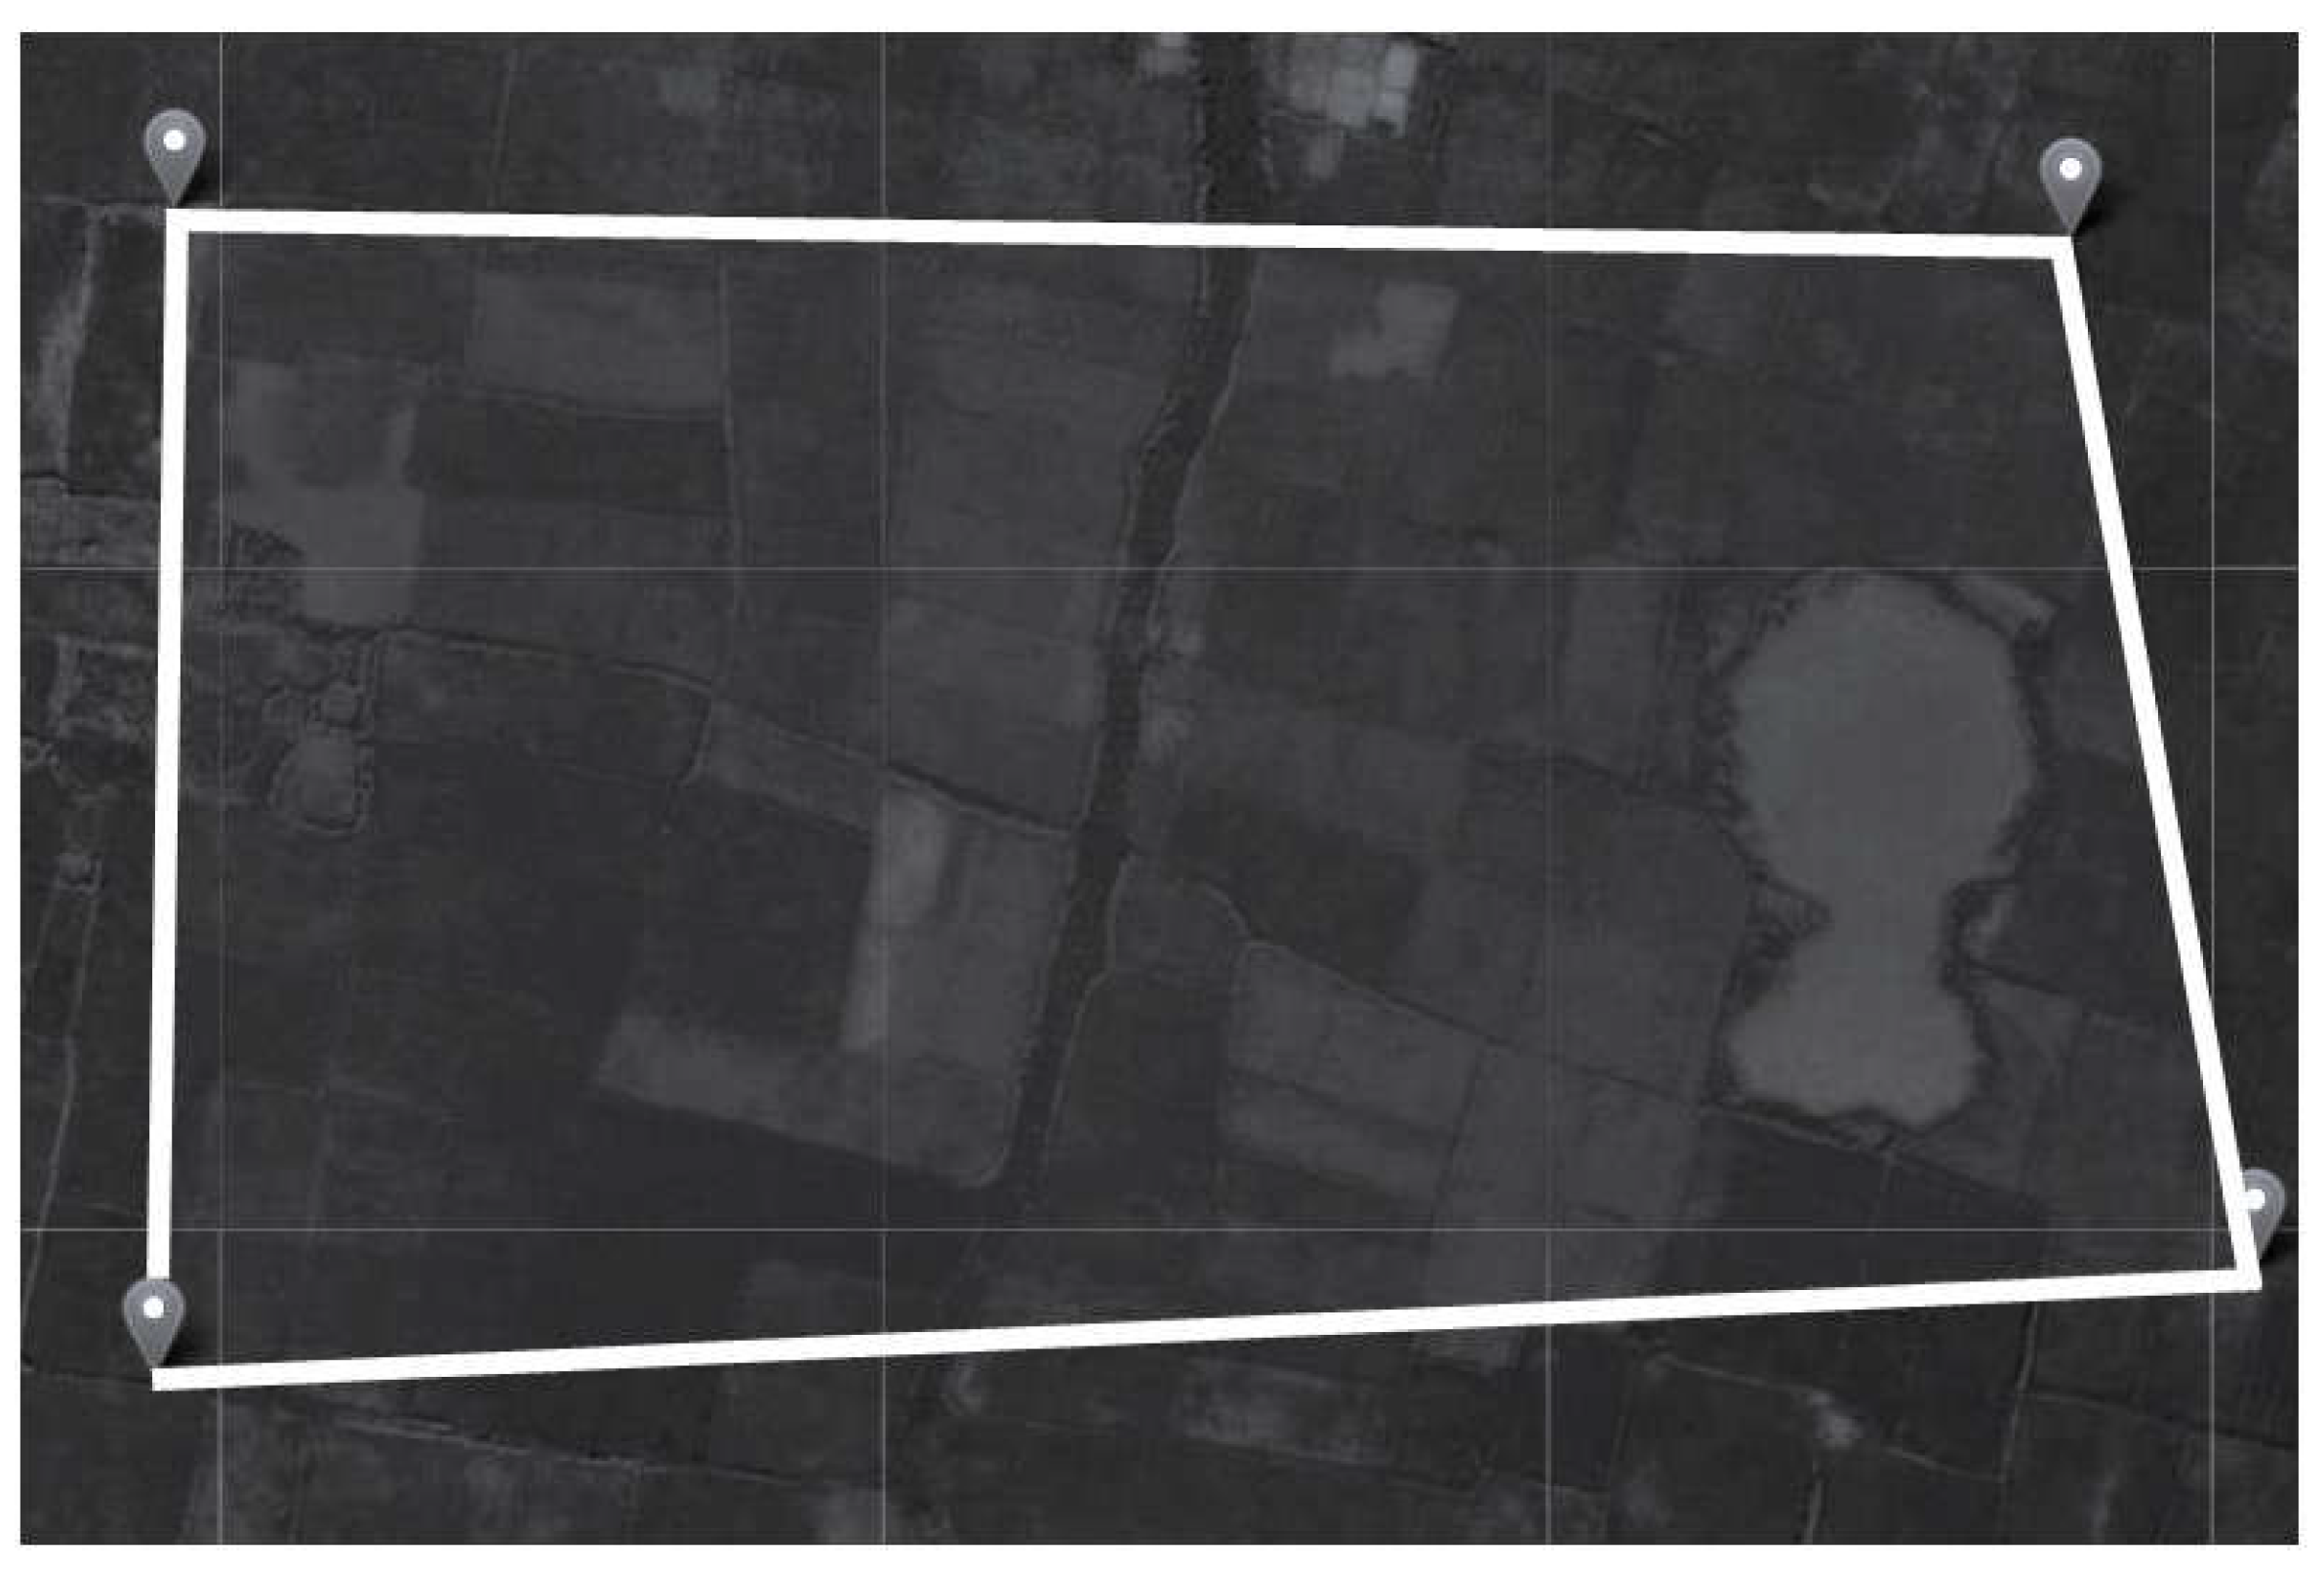
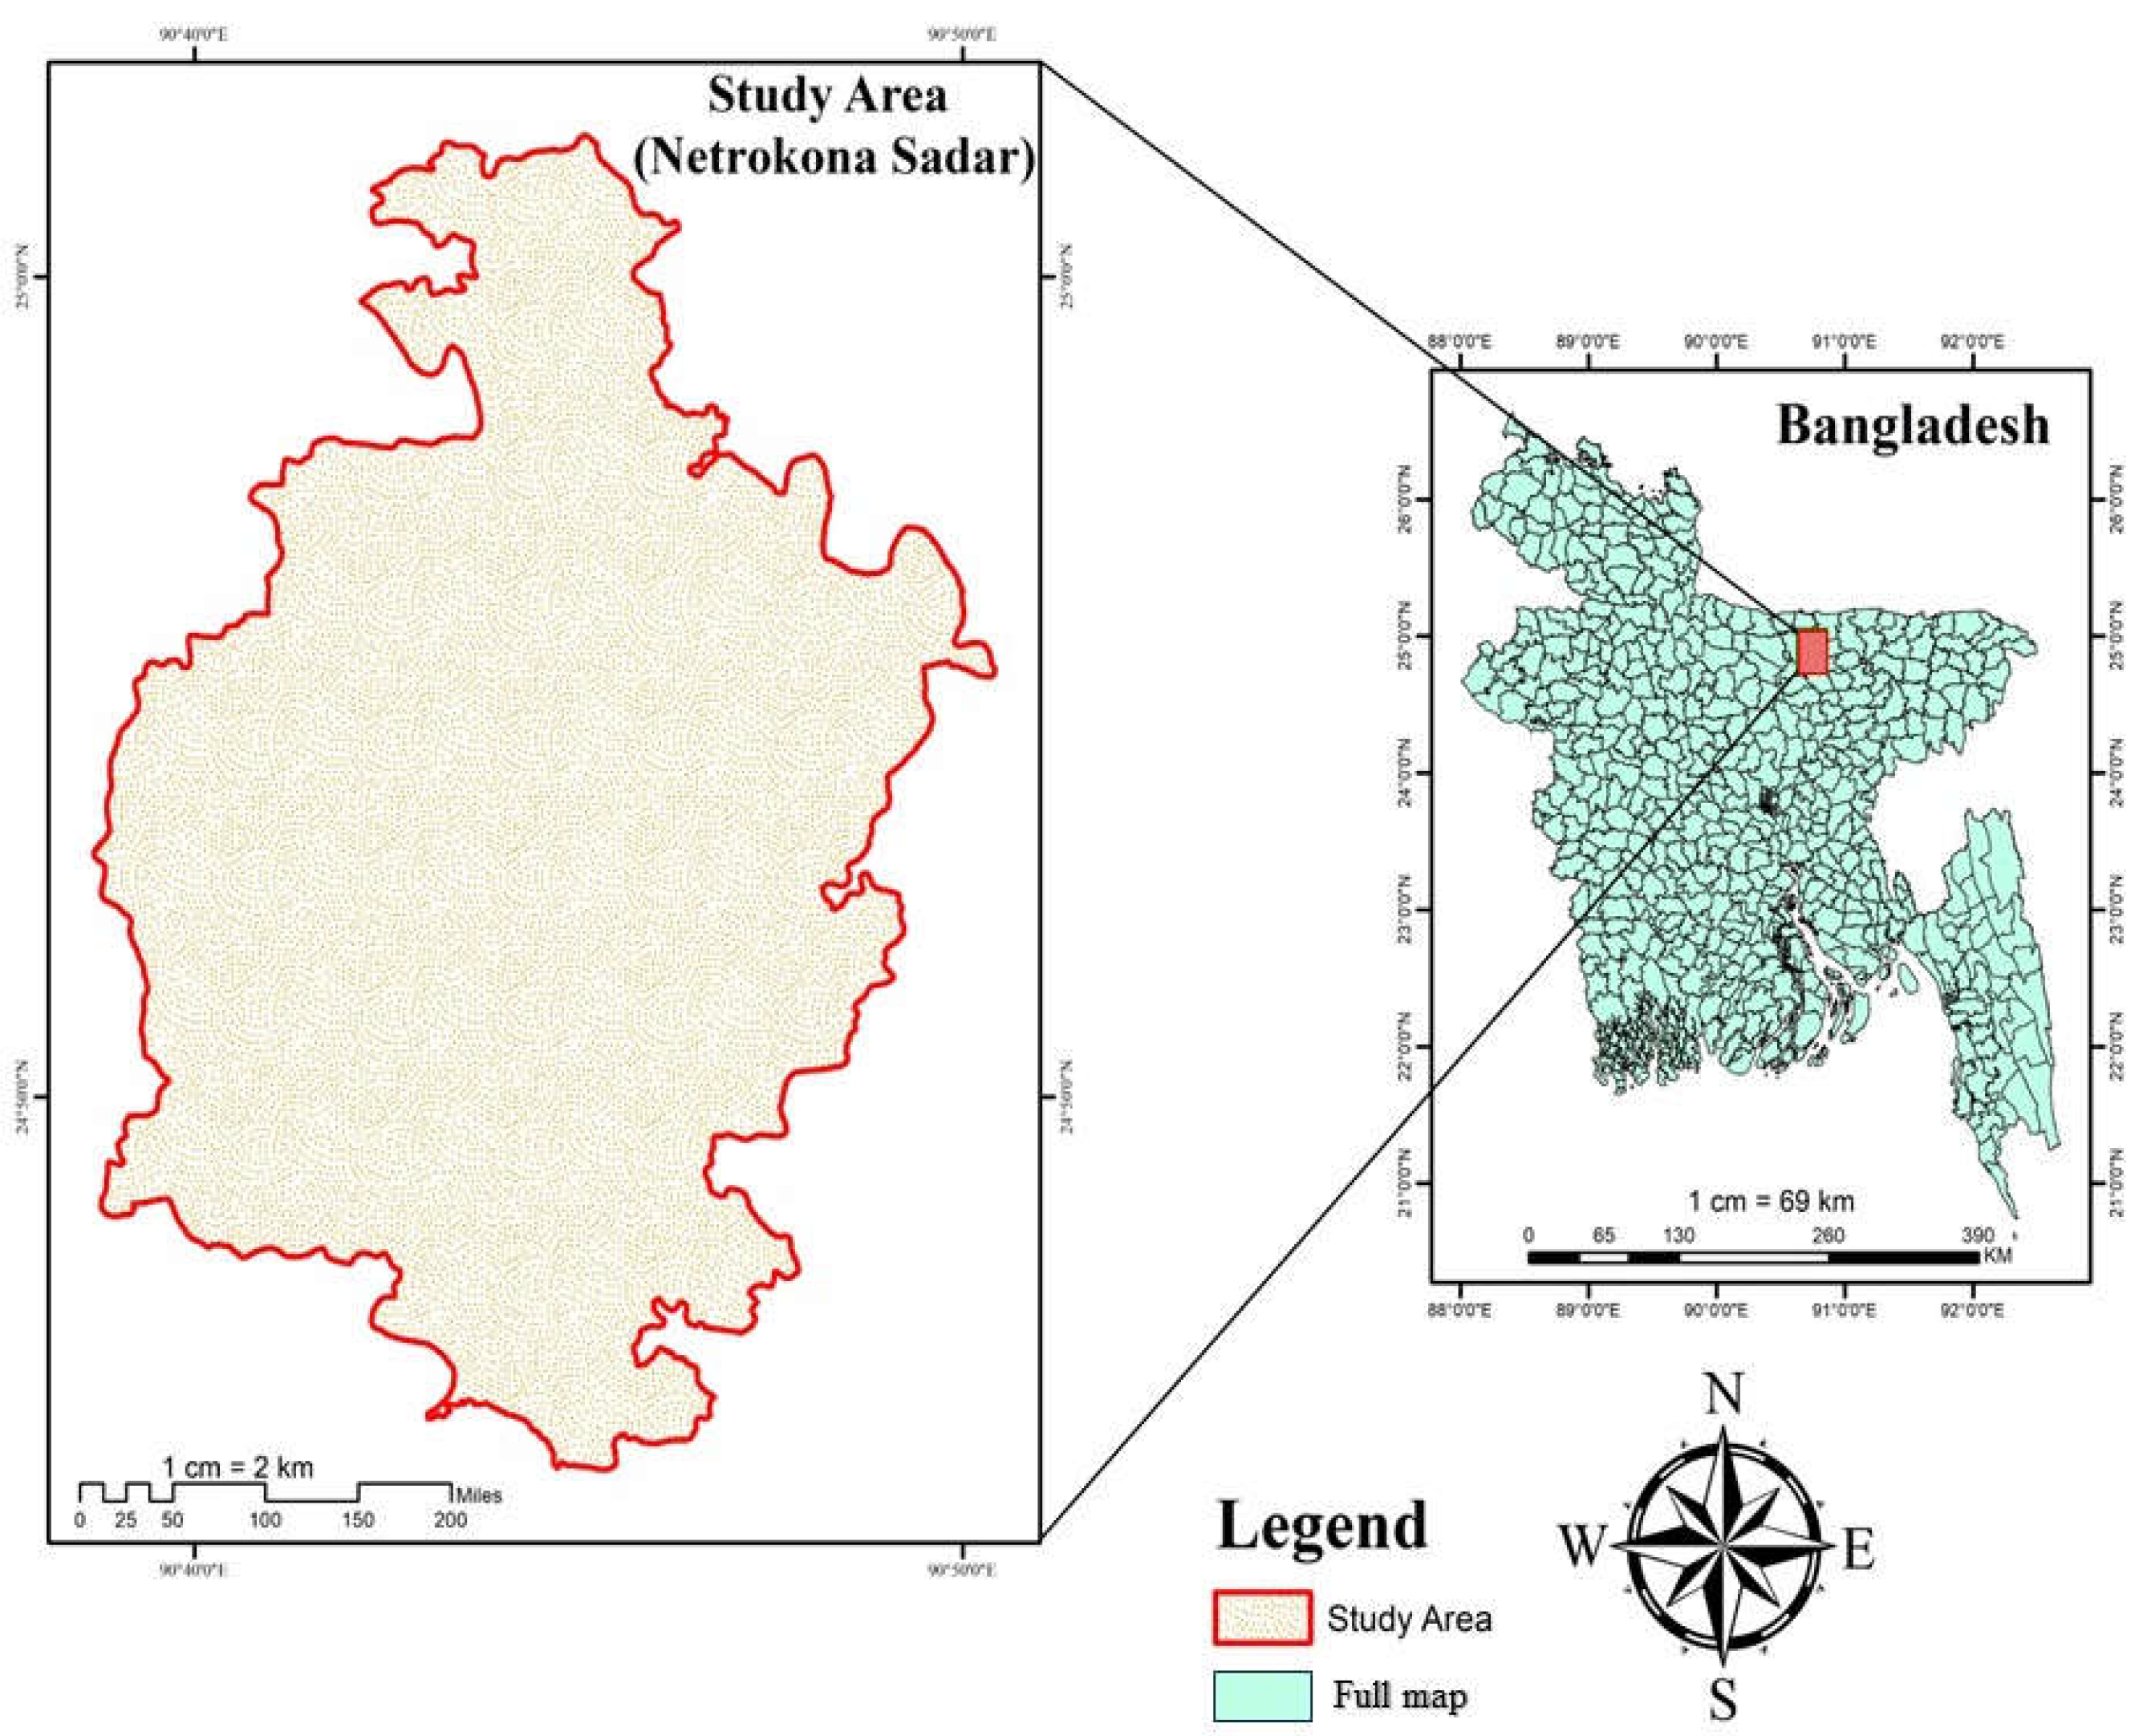
Our study area was Netrokona Sadar which is a sub-district (upazila) situated in the Netrokona District, part of the Mymensingh Division in Bangladesh. The area of the Netrokona Sadar is 340.4 km².We took four location points to analyse soil properties of this area.[
Figure 1]
For making the location map we used GIS based software named as ArcGIS [10.7.1].[
Figure 2]
Making Soil Map
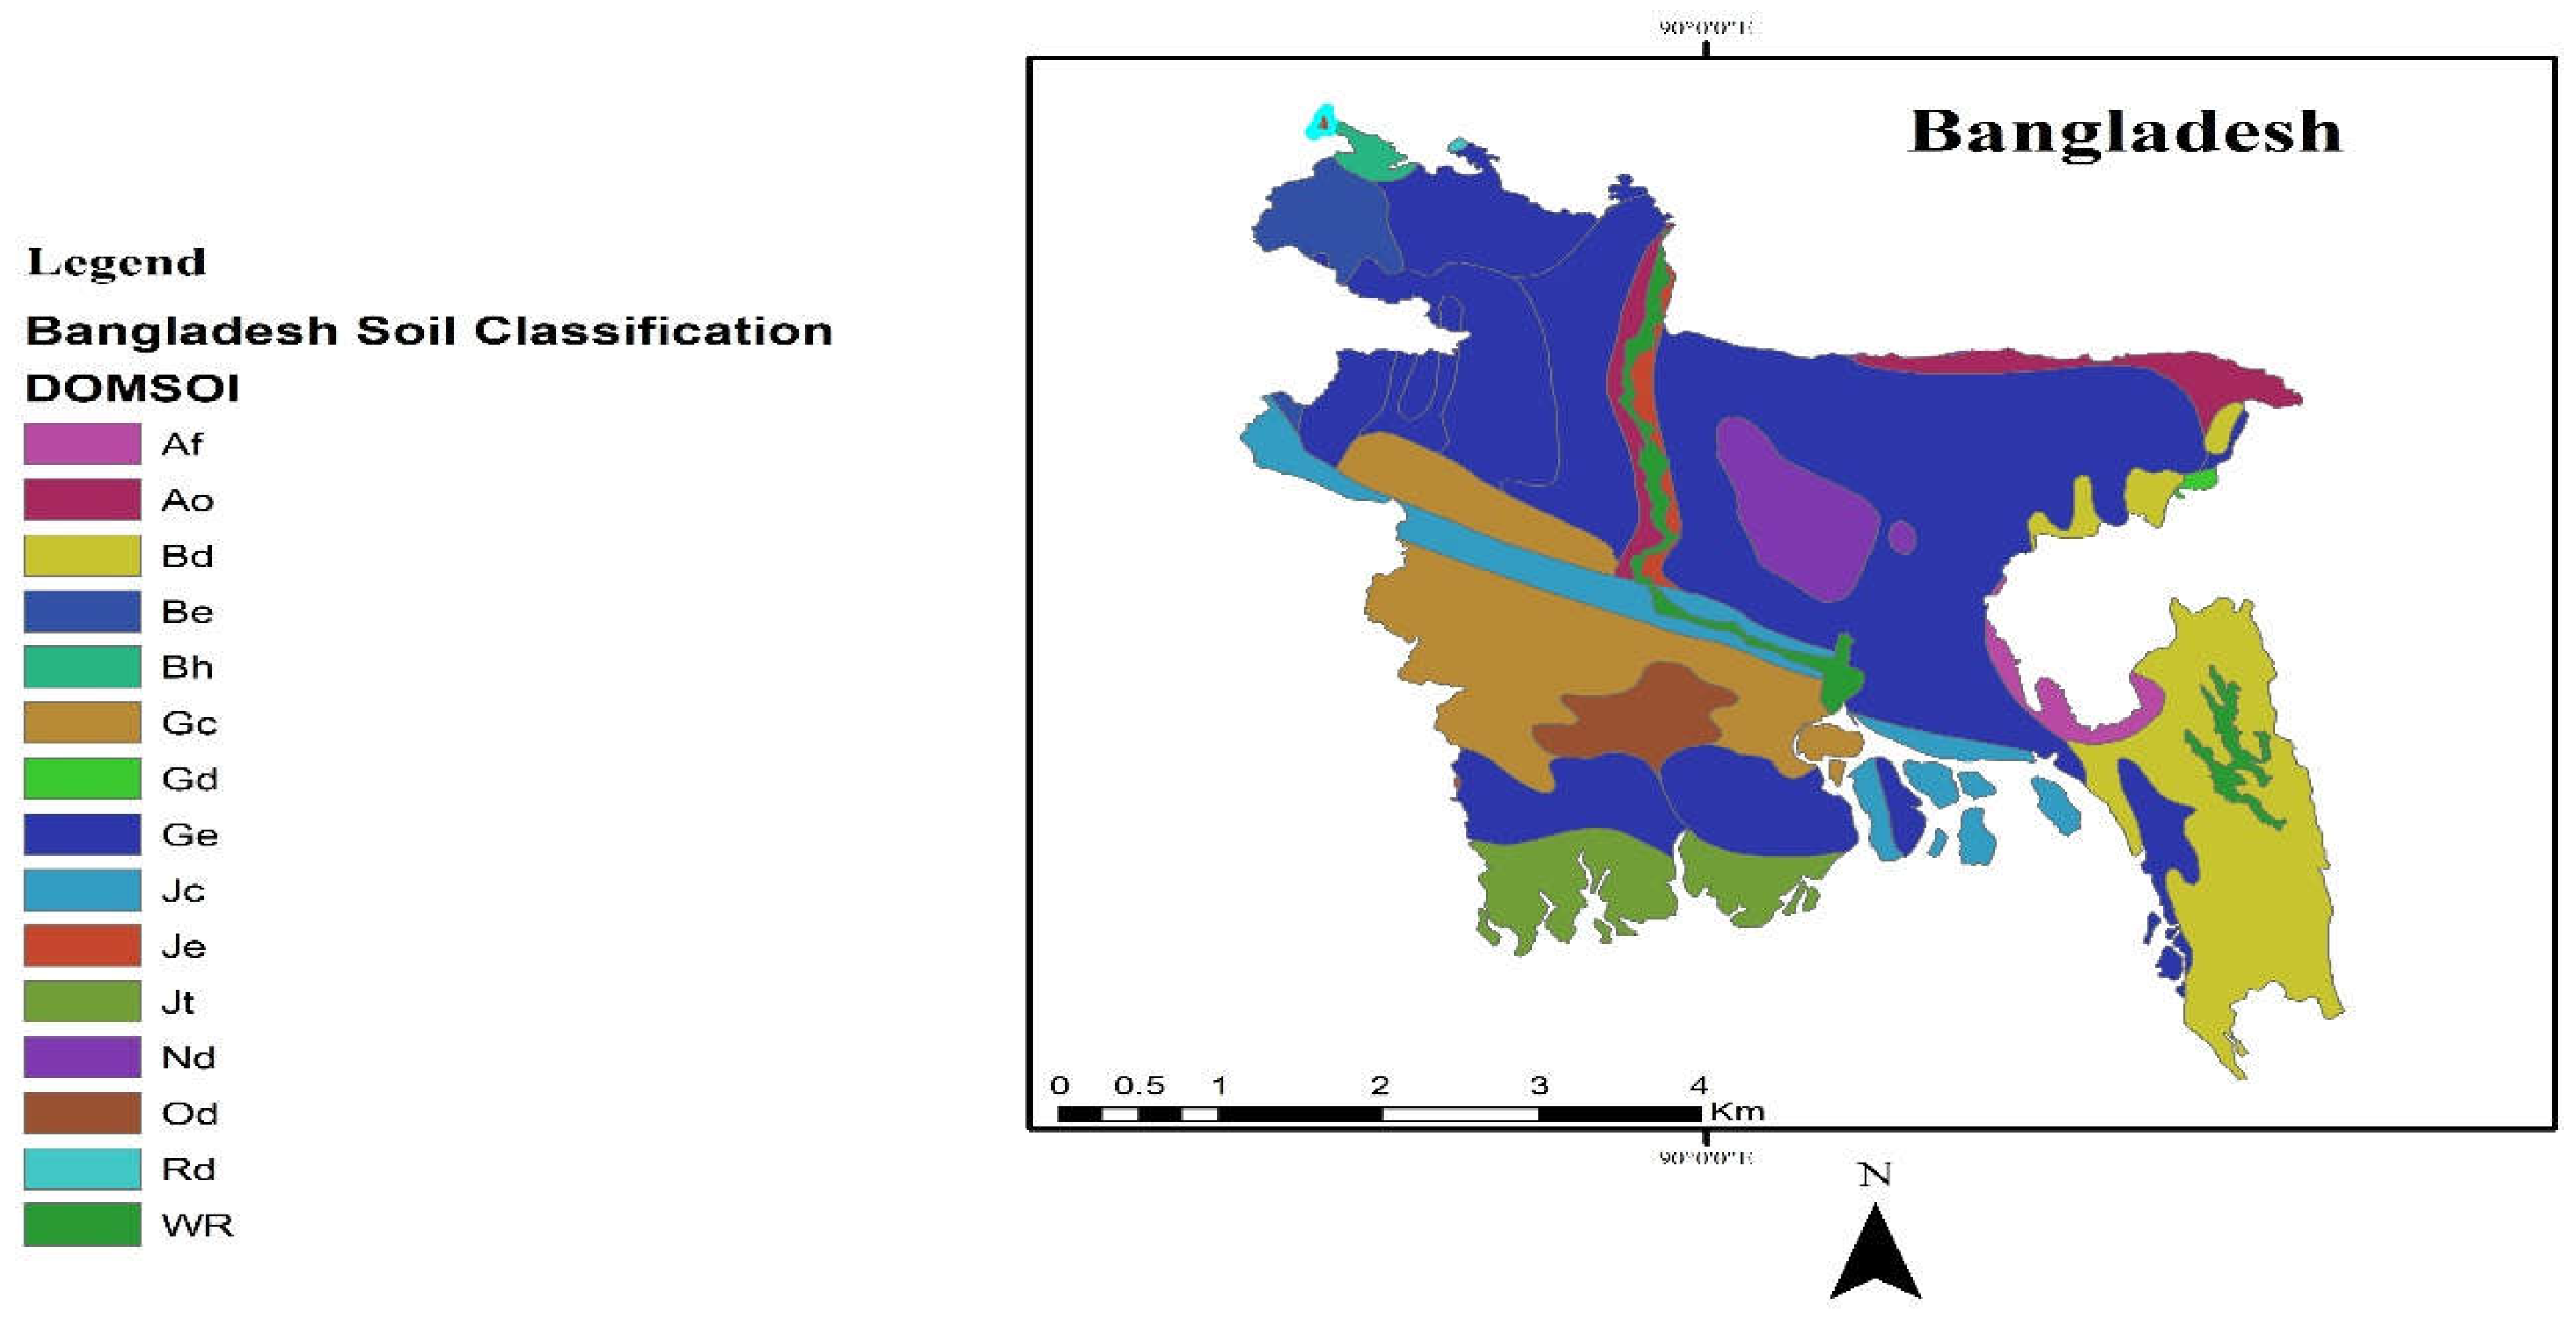
We obtained world digital soil map from FAO website. After that we extracted only Bangladeshi soil part from world soil map. We predicted our study area Netrokona Sadar and it was marked with blue color. According to FAO soil classification we found that the type of the soil is Eutric Gleysols [Ge] [
Figure 3]
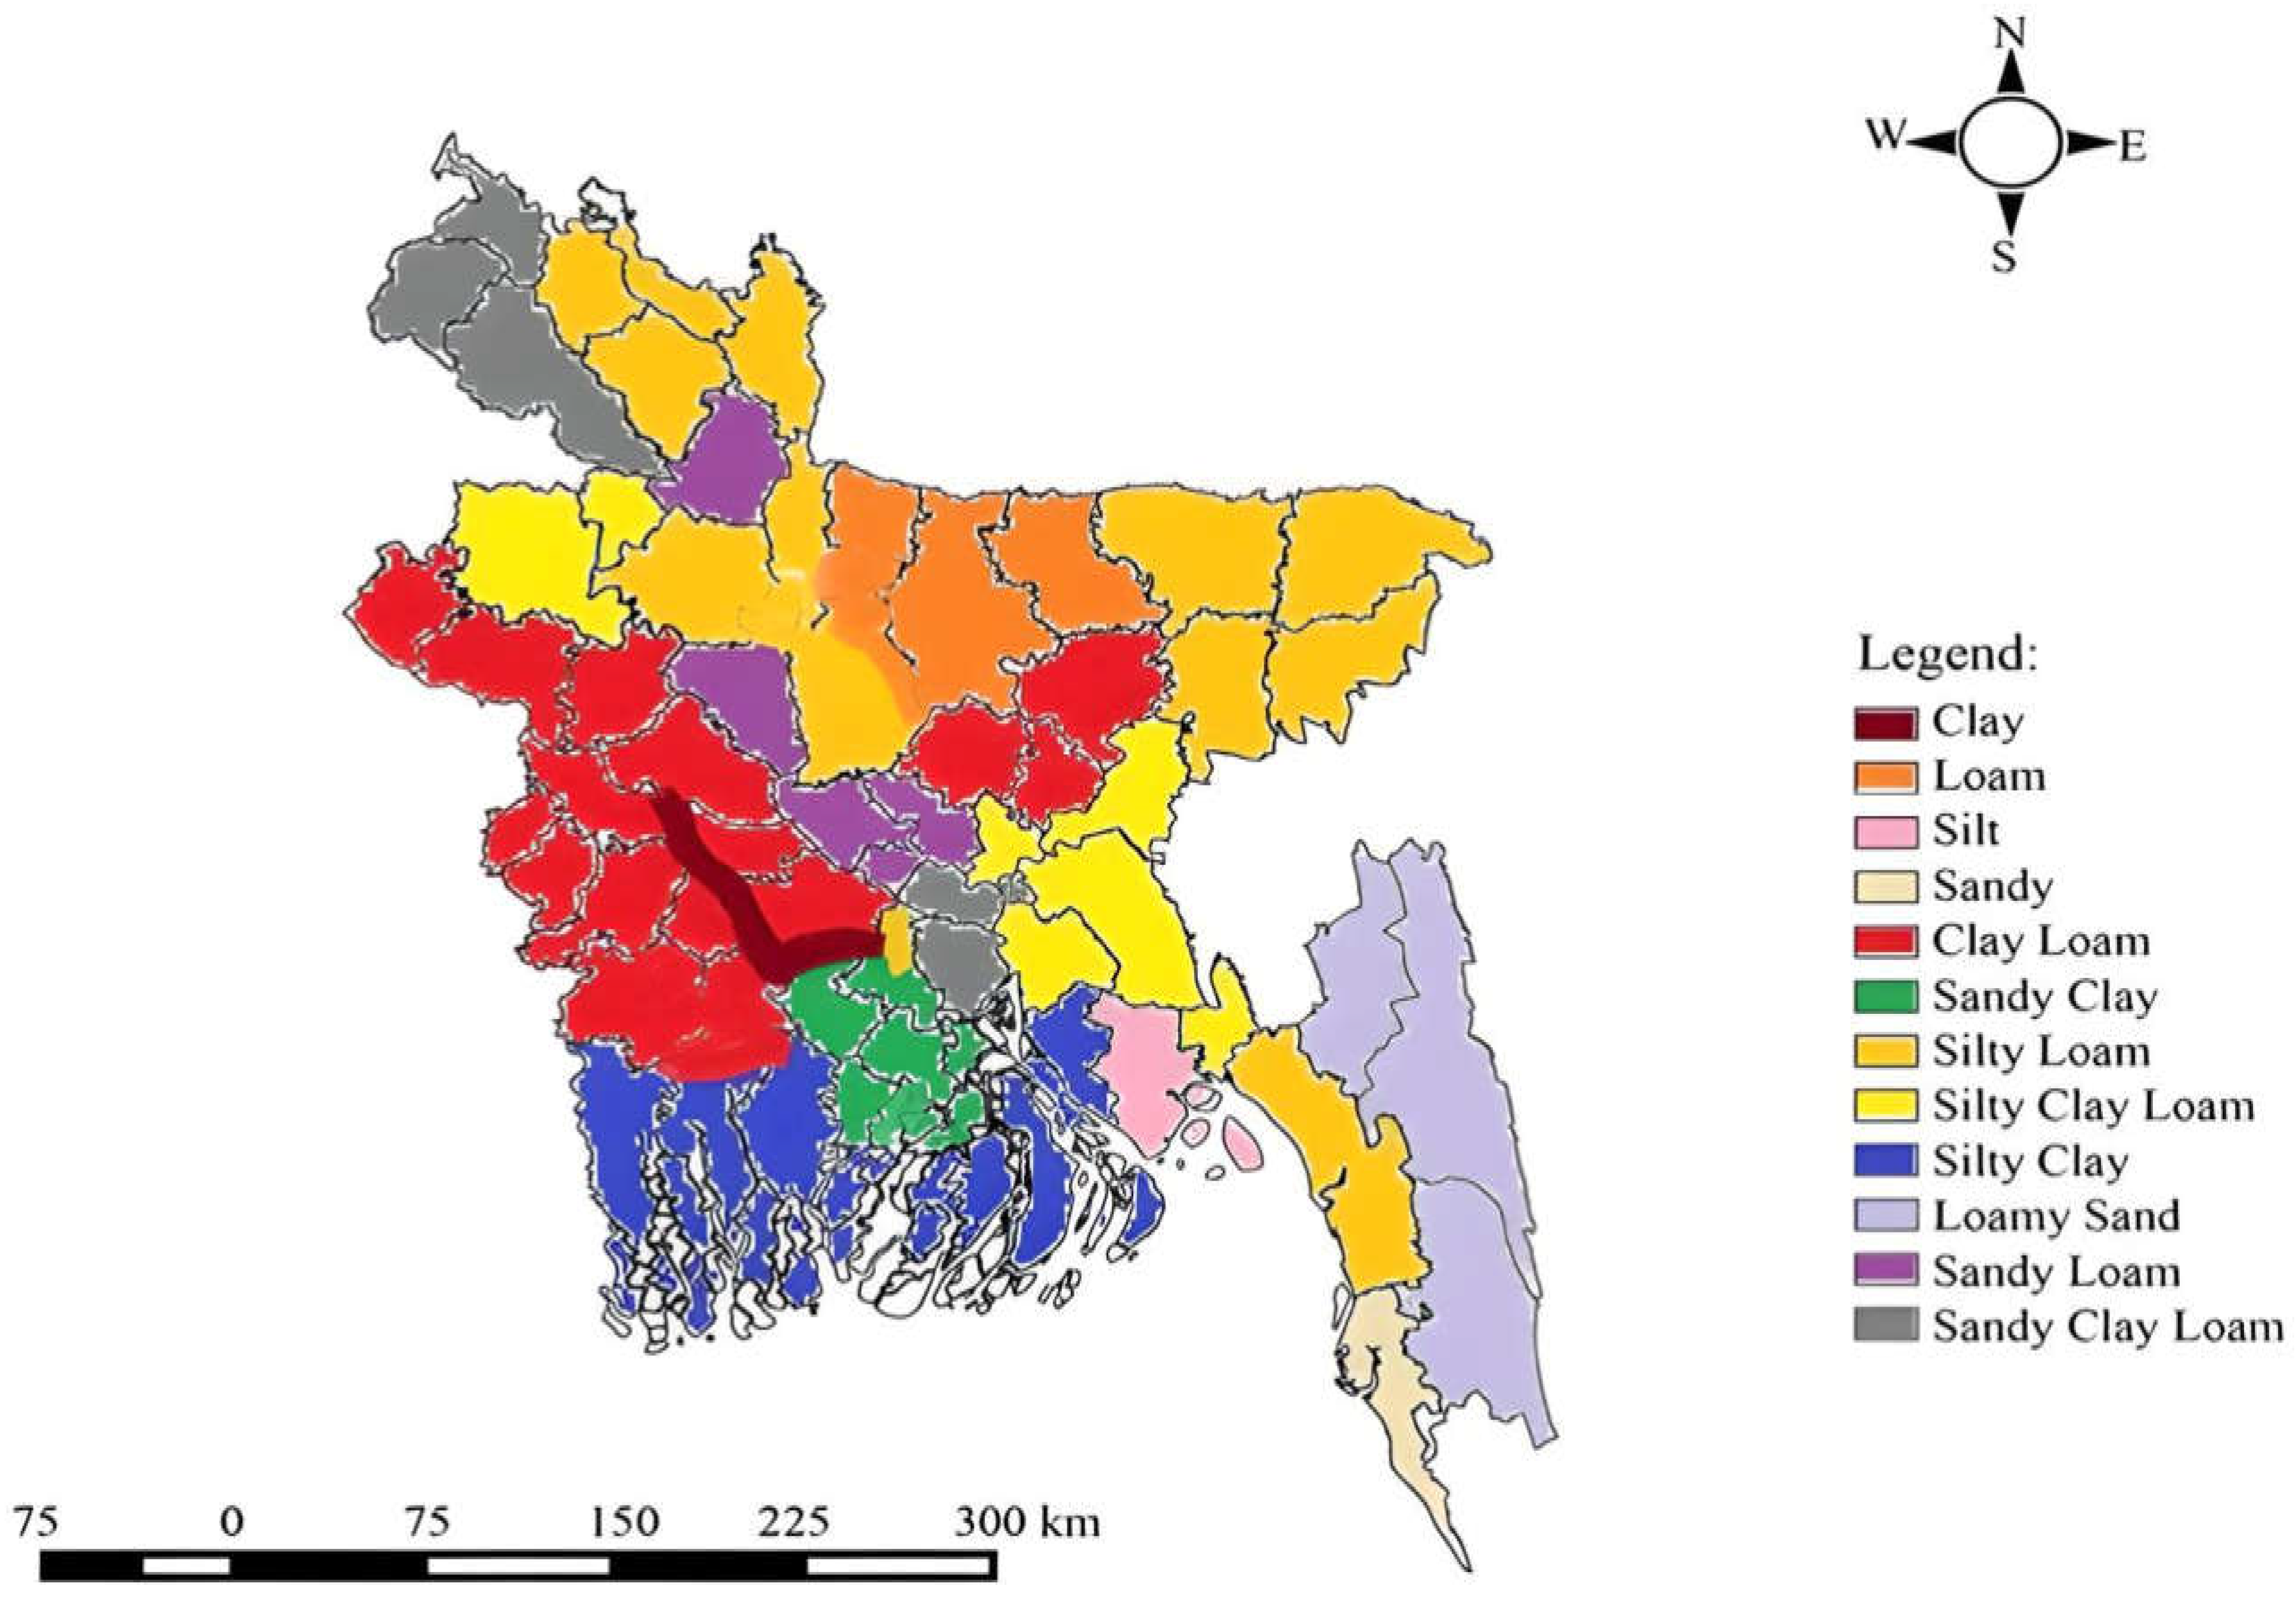
Another figure also classify the type of soil in our selected area.[
Figure 4]
Analysing Soil Properties
We took 4 location points which were 1st [Lat: 24°53′17′′N, Lon:90°44′43′′E], 2nd [Lat: 24°53′18′′N, Lon:90°44′29′′E], 3rd [Lat: 24°53′10′′N, Lon:90°44′29′′E], 4th [Lat: 24°53′11′′N, Lon:90°44′44′′E].
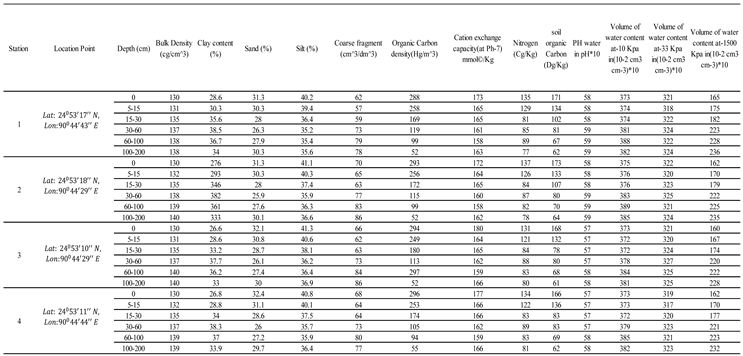
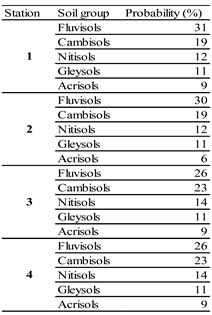
We took soil properties data from soilgrid and analyse it for structural compatibility also environmental impact for this area. [
Table 1 and
Table 2]
Results and Discussion
In this paper we exposed the soil properties data of Netrokona Sadar as well as analyse it with the help of soil mapping and satellite image and GIS technique which was done for agricultural purpose but not for structural purpose previously. Our details analyse and result is given below:
Structural Compatibility
This research has four stations. By these, we define the soil compatibility of soil for the structure in this area. Loam soil is very good and balanced soil type for the structure because it has good drainage capability, and it can hold moisture another advantage of that soil is nutrient retention capability. The approximate proportion for this type of soil is 40-50% sand, 20-30% silt, and 20-30% clay ( Das, 2006). In the first station point the proportion is 28.6 to 38.5% clay, 27.9 to 31.3% sand and 35.2 to 40.2% silt in different depth of soil. It is a clay loam( Das, 2006) which has good moisture and nutrients retaining capability. It also has a decent drainage capability. In the 2nd station point there is 27.6 to 38.2% clay, 28 to 31.3% sand and 35.9 to 41.1% silt, that is considered as clay loam ( Das, 2006). In the 3rd point there is 26.6 to 37.7% clay, 26.1 to 32.1% sand and 36.2 to 41.3% silt are found so this is clay loam ( Das, 2006). In the 4th station point 26.8 to 38.3% clay, 28.6 to 32.45% soil and 35.7 to 40.8% silt are found so this is clayey loam which has a good moisture and nutrient retention capability and moderate drainage capability( Das, 2006). All the four soil sample has good moisture and nutrient retention ability and around a decent drainage capability which is good for constructing structure. As we observed from satellite image this block of land is cultivated land. So there is no possibility of landsliding. As the soil is clay loam that means the soil is stable and the value of bulk density is around 140cg/cm3 which is decent for the construction (Mukhopadhyay et al., 2019)
The water content data At -10 kPa: Ranges from 372 to 389 At -33 kPa: Ranges from 317 to 327 At -1500 kPa: Ranges from 160 to 236 which shows that the soil has moisture but it is not overly saturated and reasonable for construction (According to google 20-40%). Coarse fragment improves soil stability. 15-30% of total soil is recommended (Chow et al. n.d) but the four station point soil has 5.7% to 8.6%. The soil need management and adding coarse material and ensuring good drainage is required for soil stability for construction.
Environmental Impact Assessment
The clay loam has good nutrient retention capability but over excavation can affect the fertility of soil and local ecosystem. The clay content of this soil can make hard for drainage, and it can be cause of erosion and sedimentation. Management of the drainage should be done carefully. Compaction of soil is done for stability of soil, but it can decrease land porosity and water infiltration capability which affect plant growth and increase runoff. Soil that is disturbed for construction can release its stored carbon that can increase the greenhouse gas emission.
Limitation and Future Aspect
There are some limitations with this work such as soilgrid database doesn’t provide 100% accurate data and the data was not compared with field data. Future researcher should work on the soil mapping and accuracy on collected data.
Conclusions
Soil mapping allows us to readily obtain data on soil parameters and soil types. Aerial photos and satellite photography may provide precise information on land formations. This study entails generating soil maps and analyzing soil property data for structural compatibility and environmental effect in our elected area. It describes the types of data and procedures that may be used to create soil categorization maps. Soilgrid provided most of the data needed to create these maps. GIS and digital photogrammetric methods were utilized to evaluate this data. The hyperspectral satellite picture is evaluated to obtain the essential data for soil mapping and land creation.
Central and local government policymakers, planners, and engineers should use current geo-environmental studies when determining the best location for residential building. One of the purposes of soil mapping is to offer some reliable and useful data for planning the safe location of residential areas. GIS technique also contributes by altering data and executing relevant analyses in a short period of time at a low cost, as well as by enabling the construction of various scenarios that may be shown visually.
Acknowledgments
We are very greatful to the researchers whose works help us to do this research smoothly.
References
- Adhikary, P. P., Chakraborty, D., Kalra, N., Sachdev, C. B., Patra, A. K., Kumar, S., Tomar, R. K., Chandna, P., Raghav, D., Agrawal, K., & Sehgal, M. (2008). Pedotransfer functions for predicting the hydraulic properties of Indian soils. Australian Journal of Soil Research, 46(5), 476–484. [CrossRef]
- Ali, R. R., & Kotb, M. M. (2010). Use of Satellite Data and GIS for Soil Mapping and Capability Assessment. In Nature and Science (Vol. 8, Issue 8). http://www.sciencepub.net/nature.
- Chen, J., Chen, S., Fu, R., Li, D., Jiang, H., Wang, C., Peng, Y., Jia, K., & Hicks, B. J. (2022). Remote Sensing Big Data for Water Environment Monitoring: Current Status, Challenges, and Future Prospects. In Earth’s Future (Vol. 10, Issue 2). John Wiley and Sons Inc. [CrossRef]
- Chow, T. L., Rees, H. W., Monteith, J. O., Toner, P., Lavoie, J., & And Lavoie, P. (n.d.). Effects of coarse fragment content on soil physical properties, soil erosion and potato production.
- Das, B. M. (2006). Principles of Geotechnical Engineering FIFTH EDITION. www.thomsonrights.com.
- Ghazali, M. F., Wikantika, K., Harto, A. B., & Kondoh, A. (2020). Generating soil salinity, soil moisture, soil pH from satellite imagery and its analysis. Information Processing in Agriculture, 7(2), 294–306. [CrossRef]
- Gorji, T., Tanik, A., & Sertel, E. (2015). Soil Salinity Prediction, Monitoring and Mapping Using Modern Technologies. Procedia Earth and Planetary Science, 15, 507–512. [CrossRef]
- Hossain, M. M., Hassan, R., & Miah, M. A. (2023). GIS-based Spatial Mapping of the Atmospheric Particulate Pollutant (PM2.5 and PM10) at Mymensingh City Corporation Areas of Bangladesh. J. Mater. Environ. Sci, 14(9), 1037–1036. http://www.jmaterenvironsci.com.
- Islam, Md. A., Hasan, Md. A., & Farukh, M. A. (2017). Application of GIS in General Soil Mapping of Bangladesh. Journal of Geographic Information System, 09(05), 604–621. [CrossRef]
- Labib, M., & Nashed, A. (2013). GIS and geotechnical mapping of expansive soil in Toshka region. Ain Shams Engineering Journal, 4(3), 423–433. [CrossRef]
- Li, J., Zeng, J., Huang, G., & Chen, W. (2024). Urban Flood Mitigation Strategies with Coupled Gray–Green Measures: A Case Study in Guangzhou City, China. International Journal of Disaster Risk Science, 15(3), 467–479. [CrossRef]
- Mashalaba, L., Galleguillos, M., Seguel, O., & Poblete-Olivares, J. (2020). Predicting spatial variability of selected soil properties using digital soil mapping in a rainfed vineyard of central Chile. Geoderma Regional, 22. [CrossRef]
- Mukhopadhyay, S., Masto, R. E., Tripathi, R. C., & Srivastava, N. K. (2019). Application of Soil Quality Indicators for the Phytorestoration of Mine Spoil Dumps. Phytomanagement of Polluted Sites: Market Opportunities in Sustainable Phytoremediation, 361–388. [CrossRef]
- Oldak, A., Jackson, T. J., & Pachepsky, Y. (2002). Using GIS in passive microwave soil moisture mapping and geostatistical analysis. International Journal of Geographical Information Science, 16(7), 681–698. [CrossRef]
- eng, H., Liu, Y., Wang, H., Gao, X., Chen, Y., & Ma, L. (2016). Urban stormwater forecasting model and drainage optimization based on water environmental capacity. Environmental Earth Sciences, 75(14). [CrossRef]
- Psomiadis, E., Papazachariou, A., Soulis, K. X., Alexiou, D. S., & Charalampopoulos, I. (2020). Landslide mapping and susceptibility assessment using geospatial analysis and earth observation data. Land, 9(5). [CrossRef]
- Radočaj, D., Jurišić, M., Rapčan, I., Domazetović, F., Milošević, R., & Plaščak, I. (2023). An Independent Validation of SoilGrids Accuracy for Soil Texture Components in Croatia. Land, 12(5). [CrossRef]
- Savin, I. Y., Zhogolev, A. V., & Prudnikova, E. Y. (2019). Modern Trends and Problems of Soil Mapping. Eurasian Soil Science, 52(5), 471–480. [CrossRef]
- Si, Q., Brito, H. C., Alves, P. B. R., Pavao-Zuckerman, M. A., Rufino, I. A. A., & Hendricks, M. D. (2024). GIS-based spatial approaches to refining urban catchment delineation that integrate stormwater network infrastructure. Discover Water, 4(1). [CrossRef]
- SoilMap_hires. (n.d.).
- Tazin, J. E., Uddin, M. N., & Mondal, S. (2024). Optimal Locations of Municipal Solid Waste-to-Value-Added Conversion Facilities Using GIS Analysis: A Case Study in Mymensingh Division, Bangladesh. International Journal of Geoinformatics, 20(6), 95–107. [CrossRef]
- Topp, S. N., Pavelsky, T. M., Jensen, D., Simard, M., & Ross, M. R. V. (2020). Research trends in the use of remote sensing for inland water quality science: Moving towards multidisciplinary applications. In Water (Switzerland) (Vol. 12, Issue 1). MDPI AG. [CrossRef]
- Velmurugan, A., Carlos, ( ) G G, Guillen, A. V., & Carlos, G. (2009). Soil Resource Assessment and Mapping using Remote Sensing and GIS. In J. Indian Soc. Remote Sens (Vol. 37).
- Yalcin, A., & Bulut, F. (2007). Landslide susceptibility mapping using GIS and digital photogrammetric techniques: A case study from Ardesen (NE-Turkey). Natural Hazards, 41(1), 201–226. [CrossRef]
- Yilmaz, I. (2009). GIS based statistical and physical approaches to landslide susceptibility mapping (Sebinkarahisar, Turkey). Bulletin of Engineering Geology and the Environment, 68(4), 459–471. [CrossRef]
- Zhang, X., Chen, J., Tan, M., & Sun, Y. (2007). Assessing the impact of urban sprawl on soil resources of Nanjing city using satellite images and digital soil databases. Catena, 69(1), 16–30. [CrossRef]
|
Disclaimer/Publisher’s Note: The statements, opinions and data contained in all publications are solely those of the individual author(s) and contributor(s) and not of MDPI and/or the editor(s). MDPI and/or the editor(s) disclaim responsibility for any injury to people or property resulting from any ideas, methods, instructions or products referred to in the content. |
© 2024 by the authors. Licensee MDPI, Basel, Switzerland. This article is an open access article distributed under the terms and conditions of the Creative Commons Attribution (CC BY) license (http://creativecommons.org/licenses/by/4.0/).
