1. Introduction
Recent advances in wearable sensor technology have significantly enhanced our ability to monitor and analyse infant movement with unprecedented precision in unsupervised environments. These developments offer valuable insights into physical development and motor skills during infancy [
1] and their potential effects on cognitive development [
2]. The integration of accelerometers, gyroscopes, and magnetometers has enabled a detailed examination of physical activities and motor skills, providing a better understanding of developmental changes in movement patterns and body positions.
Pioneering work by Bouten et al. [
3] laid the groundwork by developing a device that combined a triaxial accelerometer with a data processing unit to measure body accelerations. This early work demonstrated the potential of accelerometers for capturing a broad range of physical activities. Najafi et al. [
4] advanced the field by incorporating gyroscopes to monitor postural transitions, which facilitated the use of Inertial Motion Units (IMUs) in various applications, including fall detection [
5,
6], stair activity monitoring [
7,
8], and non-invasive physical movement monitoring using magnetic and inertial measurement units [
9]. Additionally, IMUs have been employed for detailed gait analysis with integrated sensors [
10]. Accelerometers are effective in capturing a range of movements, from walking and running to more subtle activities, while gyroscopes measure rotational movements essential for understanding body dynamics. They offer a comprehensive view of body orientation and movement dynamics when used in conjunction with magnetometers. Recent advancements in sensor technology and classification algorithms have further improved their application in both adult and paediatric research. Studies [
11,
12] have successfully classified different types of movement using accelerometer and gyroscope data. For instance, research by Franchak et al. [
13] demonstrated the classification of multiple body positions in infants, showing that it is viable to identify and categorise them based on sensor data.
In recent years, machine learning techniques have been increasingly applied to classify movement and body positions. Algorithms such as Support Vector Machines (SVMs)[
15], Random Forests [
13,
15], and Convolutional Neural Networks (CNNs) [
16,
17] have shown promise in enhancing classification accuracy. For example, infant studies have used SVMs to achieve classification accuracies above 90% for activities like walking, running, and sitting [
16,
18]. However, these techniques, especially CNNs, often require large datasets and extensive training periods, which can limit their applicability in real-time or unsupervised environments.
Signal segmentation is a crucial stage in the process of classifying body position. Current research limitations include reliance on extended activity windows for classification, which may not accurately reflect real-time changes in body position. The length of activity windows used in position classification varies significantly, ranging from short intervals of approximately 0.1 seconds [
19,
20] to longer windows exceeding 8 seconds [
21,
22], depending on the number and placement of accelerometers and the specific activity being monitored. To capture movement dynamics, data can be partitioned into segments using activity-defined windows [
23], event-defined windows [
24], or sliding windows, which is the most commonly applied technique. While overlapping adjacent windows are sometimes acceptable for specific applications, they are less commonly employed [
13]. Additionally, variations in sensor placement and calibration can introduce noise and affect data consistency.
To address these limitations, our study aimed to develop an automatic system for classifying infants’ body positions using data collected from accelerometers, magnetometers, and gyroscopes during three different brief activity windows. Each infant took part in play activities with the caregiver typical for their age range (book-sharing, playing with toys and rattle-shaking). These activities allowed us to sample different kinds of movements and spontaneous changes in body position under semi-naturalistic conditions. This approach was designed to provide more granular and accurate results than previous studies. Using data from an existing longitudinal study of infants aged 4-12 months [
25], we aimed to offer a more precise and practical method for monitoring and analysing infants’ motor development.
In addition to classifying body position, it is essential to explore the importance of different features within the IMU data and how each contributes to the accuracy of the classification. By utilising the established characteristics of the signal, we can designate feature groups through methods from the time-frequency domain [
26,
27], statistical analyses [
13], or heuristic strategies [
28]. By identifying which feature groups—such as signal variability, movement frequency, or the dependency between sensors—are most influential in distinguishing various positions, we can gain deeper insight into motor development. For instance, variations in signal frequency may be critical for differentiating crawling from walking, as each activity exhibits distinct movement patterns and characteristics. Understanding these differences can help us better interpret the mechanics of motor development in infants.
This analysis of feature importance not only enhances the interpretability of our model but also aids in selecting a tailored subset of features specifically designed for the activities we are focusing on. This optimises both the number and placement of sensors used, thereby improving classification algorithms. Furthermore, by identifying key features, we can extract them from different datasets to better understand how these datasets vary—a point we will explore further in the discussion.
In a recent review [
29], various machine-learning methods were evaluated for their accuracy in position classification. For example, Supine shows accuracy rates between 87–97%, while Prone ranges from 67–98%, and activities such as pivoting and crawling commando show lower accuracies of 62–66% and 60%, respectively. Upright positions, including standing, walking, and running, exhibit a wide accuracy range from 9–100%.
However, these comparisons are problematic due to several factors. Differences in datasets, including variations in sample size, sensor types, and environmental conditions, significantly affect results. Additionally, the models used vary, skewing direct performance comparisons. Inconsistent sets of positions and participant age ranges across studies further complicate the reliability of these comparisons.
To address these challenges, we will explore the implications of dataset variability and model differences in our analysis.
2. Materials and Methods
2.1. Experimental Design
Data were collected from a longitudinal study of infant-caregiver dyads at four time points corresponding to the infants' chronological ages of 4, 6, 9, and 12 months.Families were briefed and provided informed consent upon arrival at the laboratory, where interactions were recorded in a carpeted play area. Infants and caregivers were fitted with motion sensors and head cameras, though their data are not reported here.
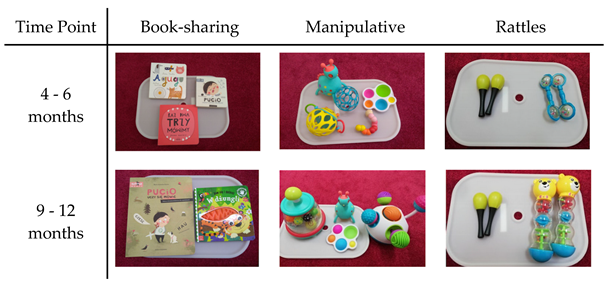
Each visit involved 6-7 activities, conducted in randomised order, with toys differing between younger (4-6 months) and older infants (9-12 months). This analysis focuses on three play activities: book-sharing, rattles, and an object play task (“manipulative task”), each lasting about 5 minutes (see
Table 1).
The toy sets varied between the older and younger age groups to ensure a similar level of interest and alignment with their cognitive and motor skills. The dyads had full autonomy in their use of the toys, moved freely around the room and did not receive any specific instructions with respect to how to structure the activity or which body position to take. Interactions were captured using three remote-controlled HD CCTV (Axis, Inc.) cameras and a high-grade cardioid microphone (Sennheiser e914 [
30]) for synchronised audio-video recording.
2.1.1. Participants
A total of 104 infant-parent dyads participated in the study. Of these, 48 provided data at all four time points, while 83 missed one visit, primarily due to COVID-19 restrictions (see
Table 2). We included in the analysis only 301 visits with manually annotated body positions. The mean ages of each time point were: 4 months (ranges from 3.9 to 5.2 months), 6 months (ranges from 6 to 7.8 months), 9 months (ranges from 8.2 to 10.2 months), and 12 months (ranges from 11 to 14.5 months). For additional details, refer to
Table 2.
2.1.2. Equipment
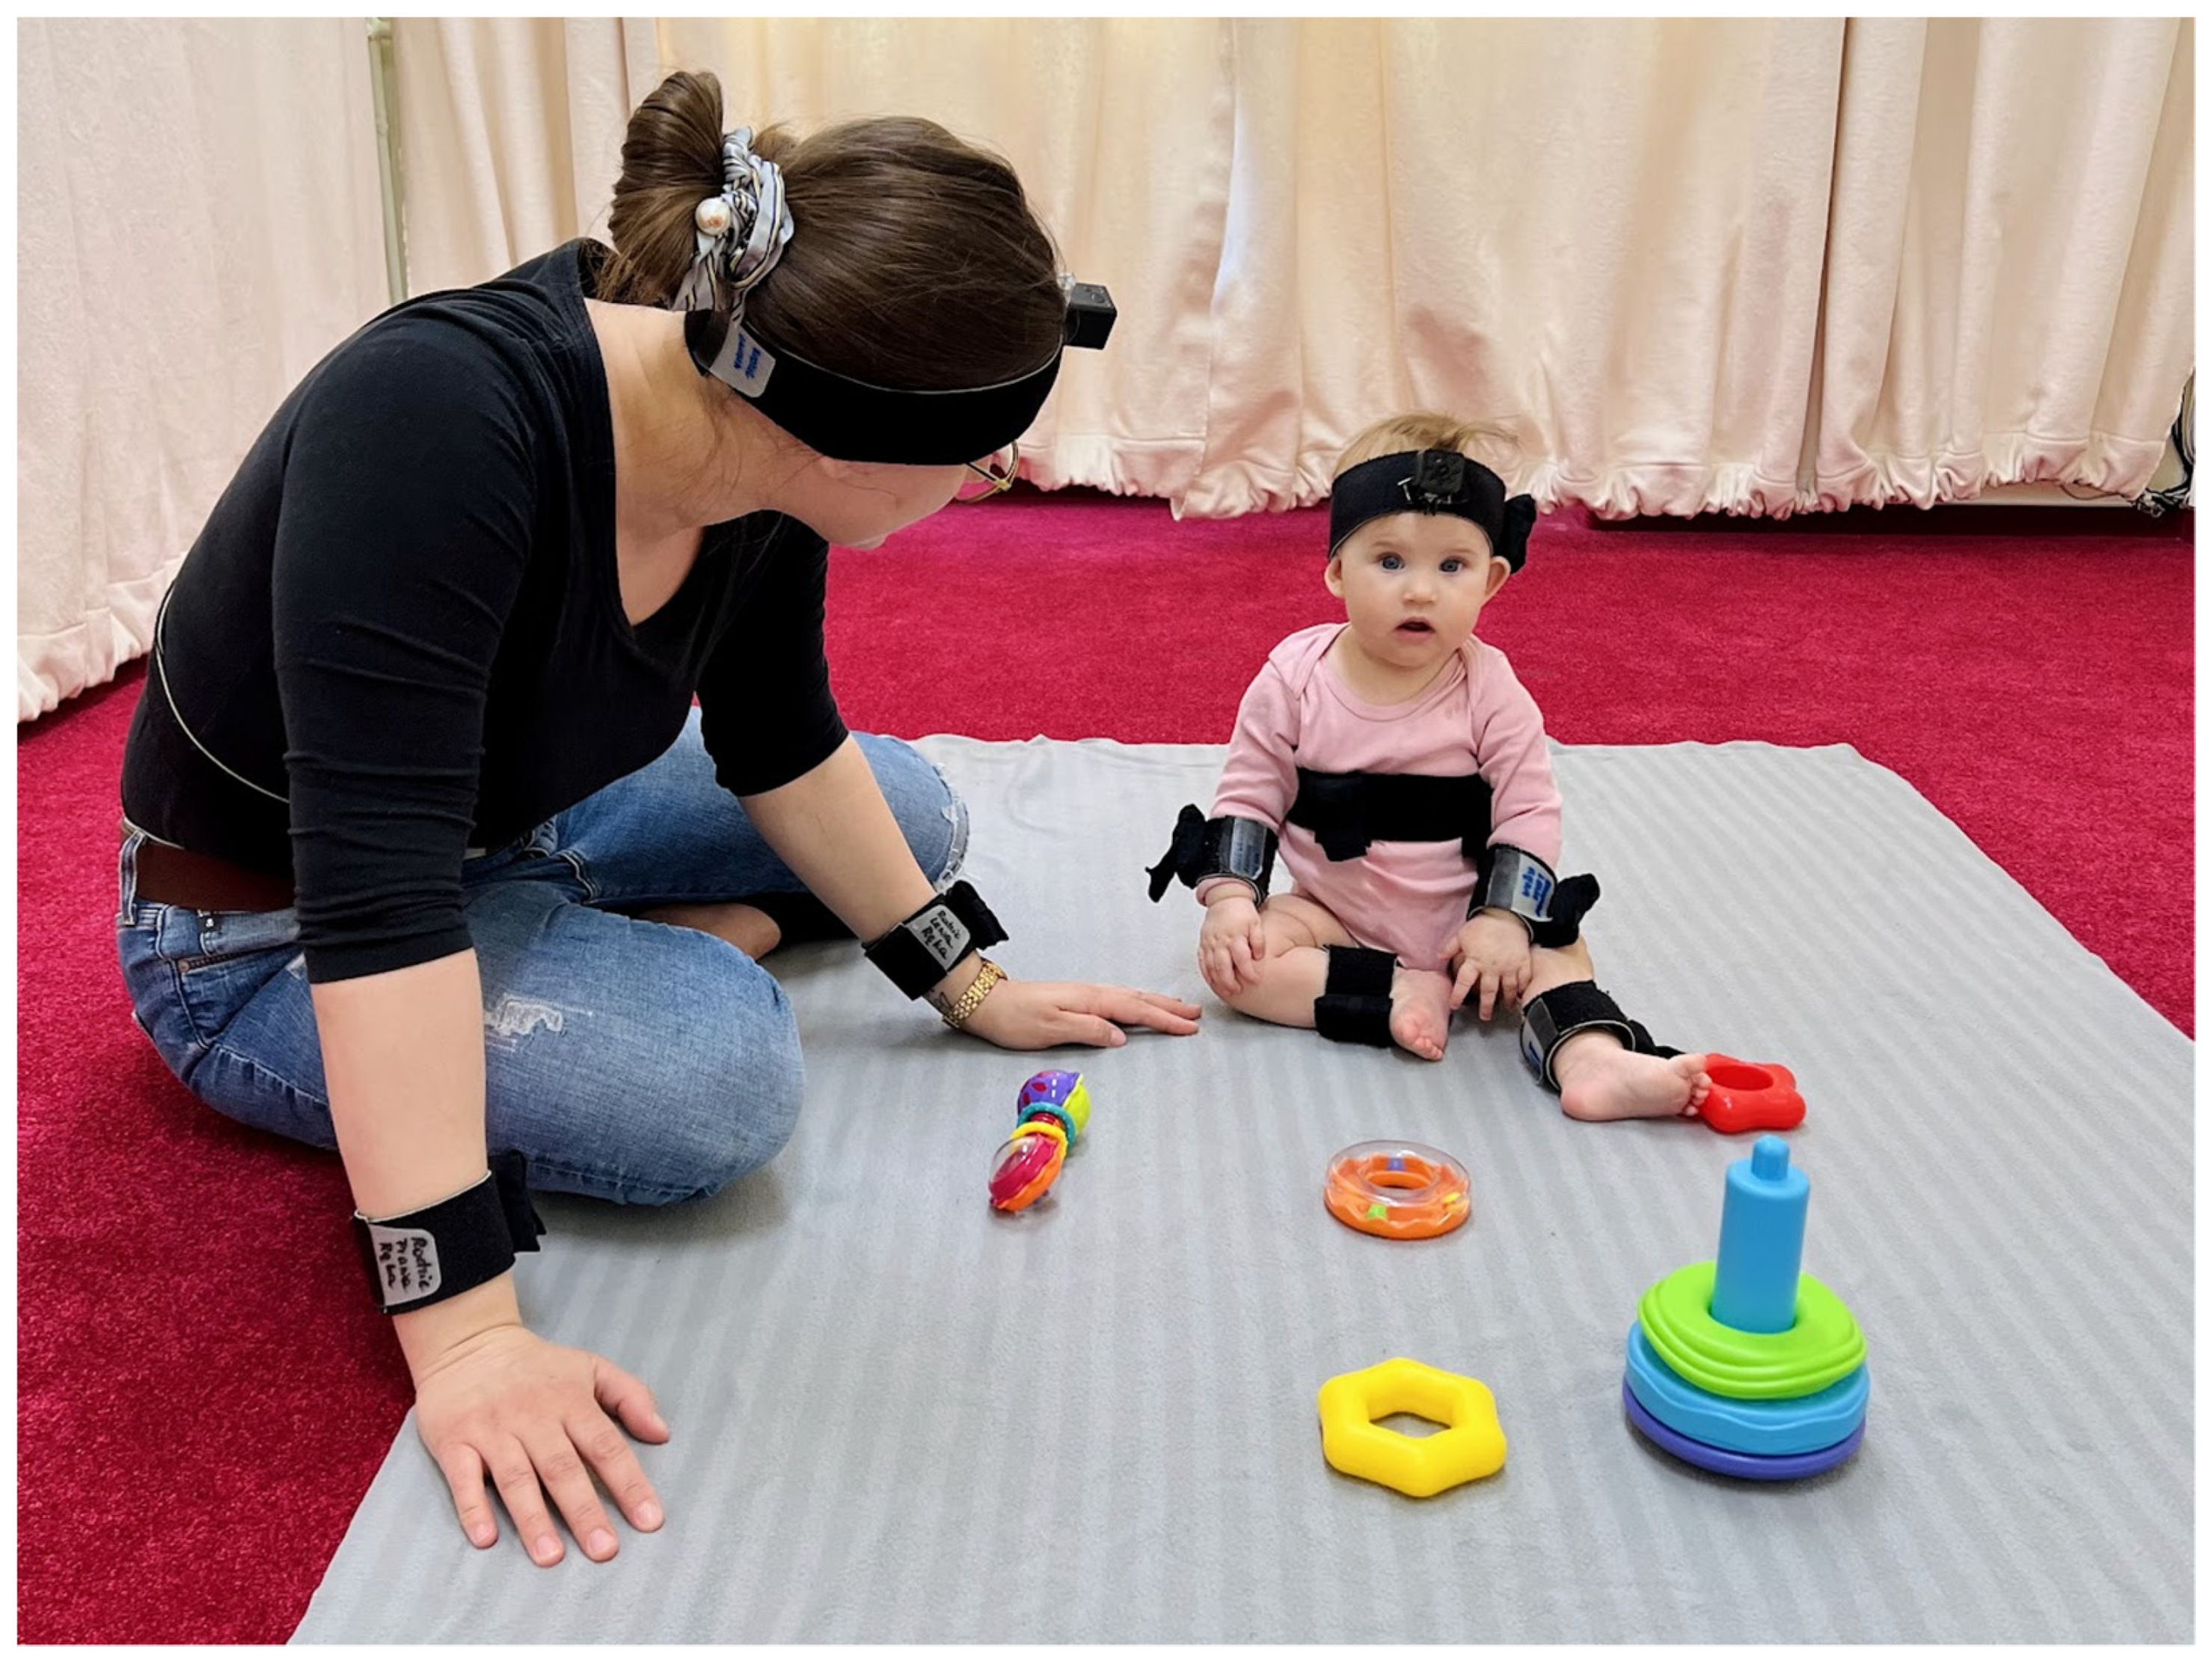
Infants' and caregivers' body movements were recorded at 60 Hz using wearable motion trackers (MTw Awinda, Xsens Technologies B.V. [31, 32]), which were wirelessly connected to an MTw Awinda receiver station (Xsens Technologies B.V.) and synchronised in real-time with MT Manager software (Xsens Technologies B.V.). These are advanced devices that measure acceleration, angular velocity, and magnetic field strength. A total of 12 sensors were used, with two sensors placed on each of the infants' arms, legs, head, and torso, as well as two sensors on the caregivers' arms, head, and torso. However, this paper focuses solely on data from three pairs of sensors placed on the infants' legs, torso and arms (see
Figure 1). The sensor placed on the head of the infant was removed often, resulting in its exclusion from the analysis.
A comprehensive description of the sensors' operation can be found in [
33].
2.1.3. Coding of Infant Position
The infants’ body positions were manually annotated in ELAN 6.3 based on position protocol. Each video was viewed at 1x speed to identify episodes of postural changes, with the precise onset and offset times annotated frame-by-frame. Positions were classified based on the period between the first and last frames in which the infant was observed in that particular position according to definitions (see
Table 3), adapted from Thurman & Corbetta [
34]. Transition periods between positions were not assigned to any specific positions.
In the set of 14 annotated body positions, positions were divided into two categories: dynamic positions (such as walking or crawling) and static positions (such as lying down or standing). The dynamic positions were then mapped to their corresponding static positions, resulting in 5 distinct classes. These five classes were used for training the classifiers. The names of these classes and their corresponding positions are listed in
Table 3.
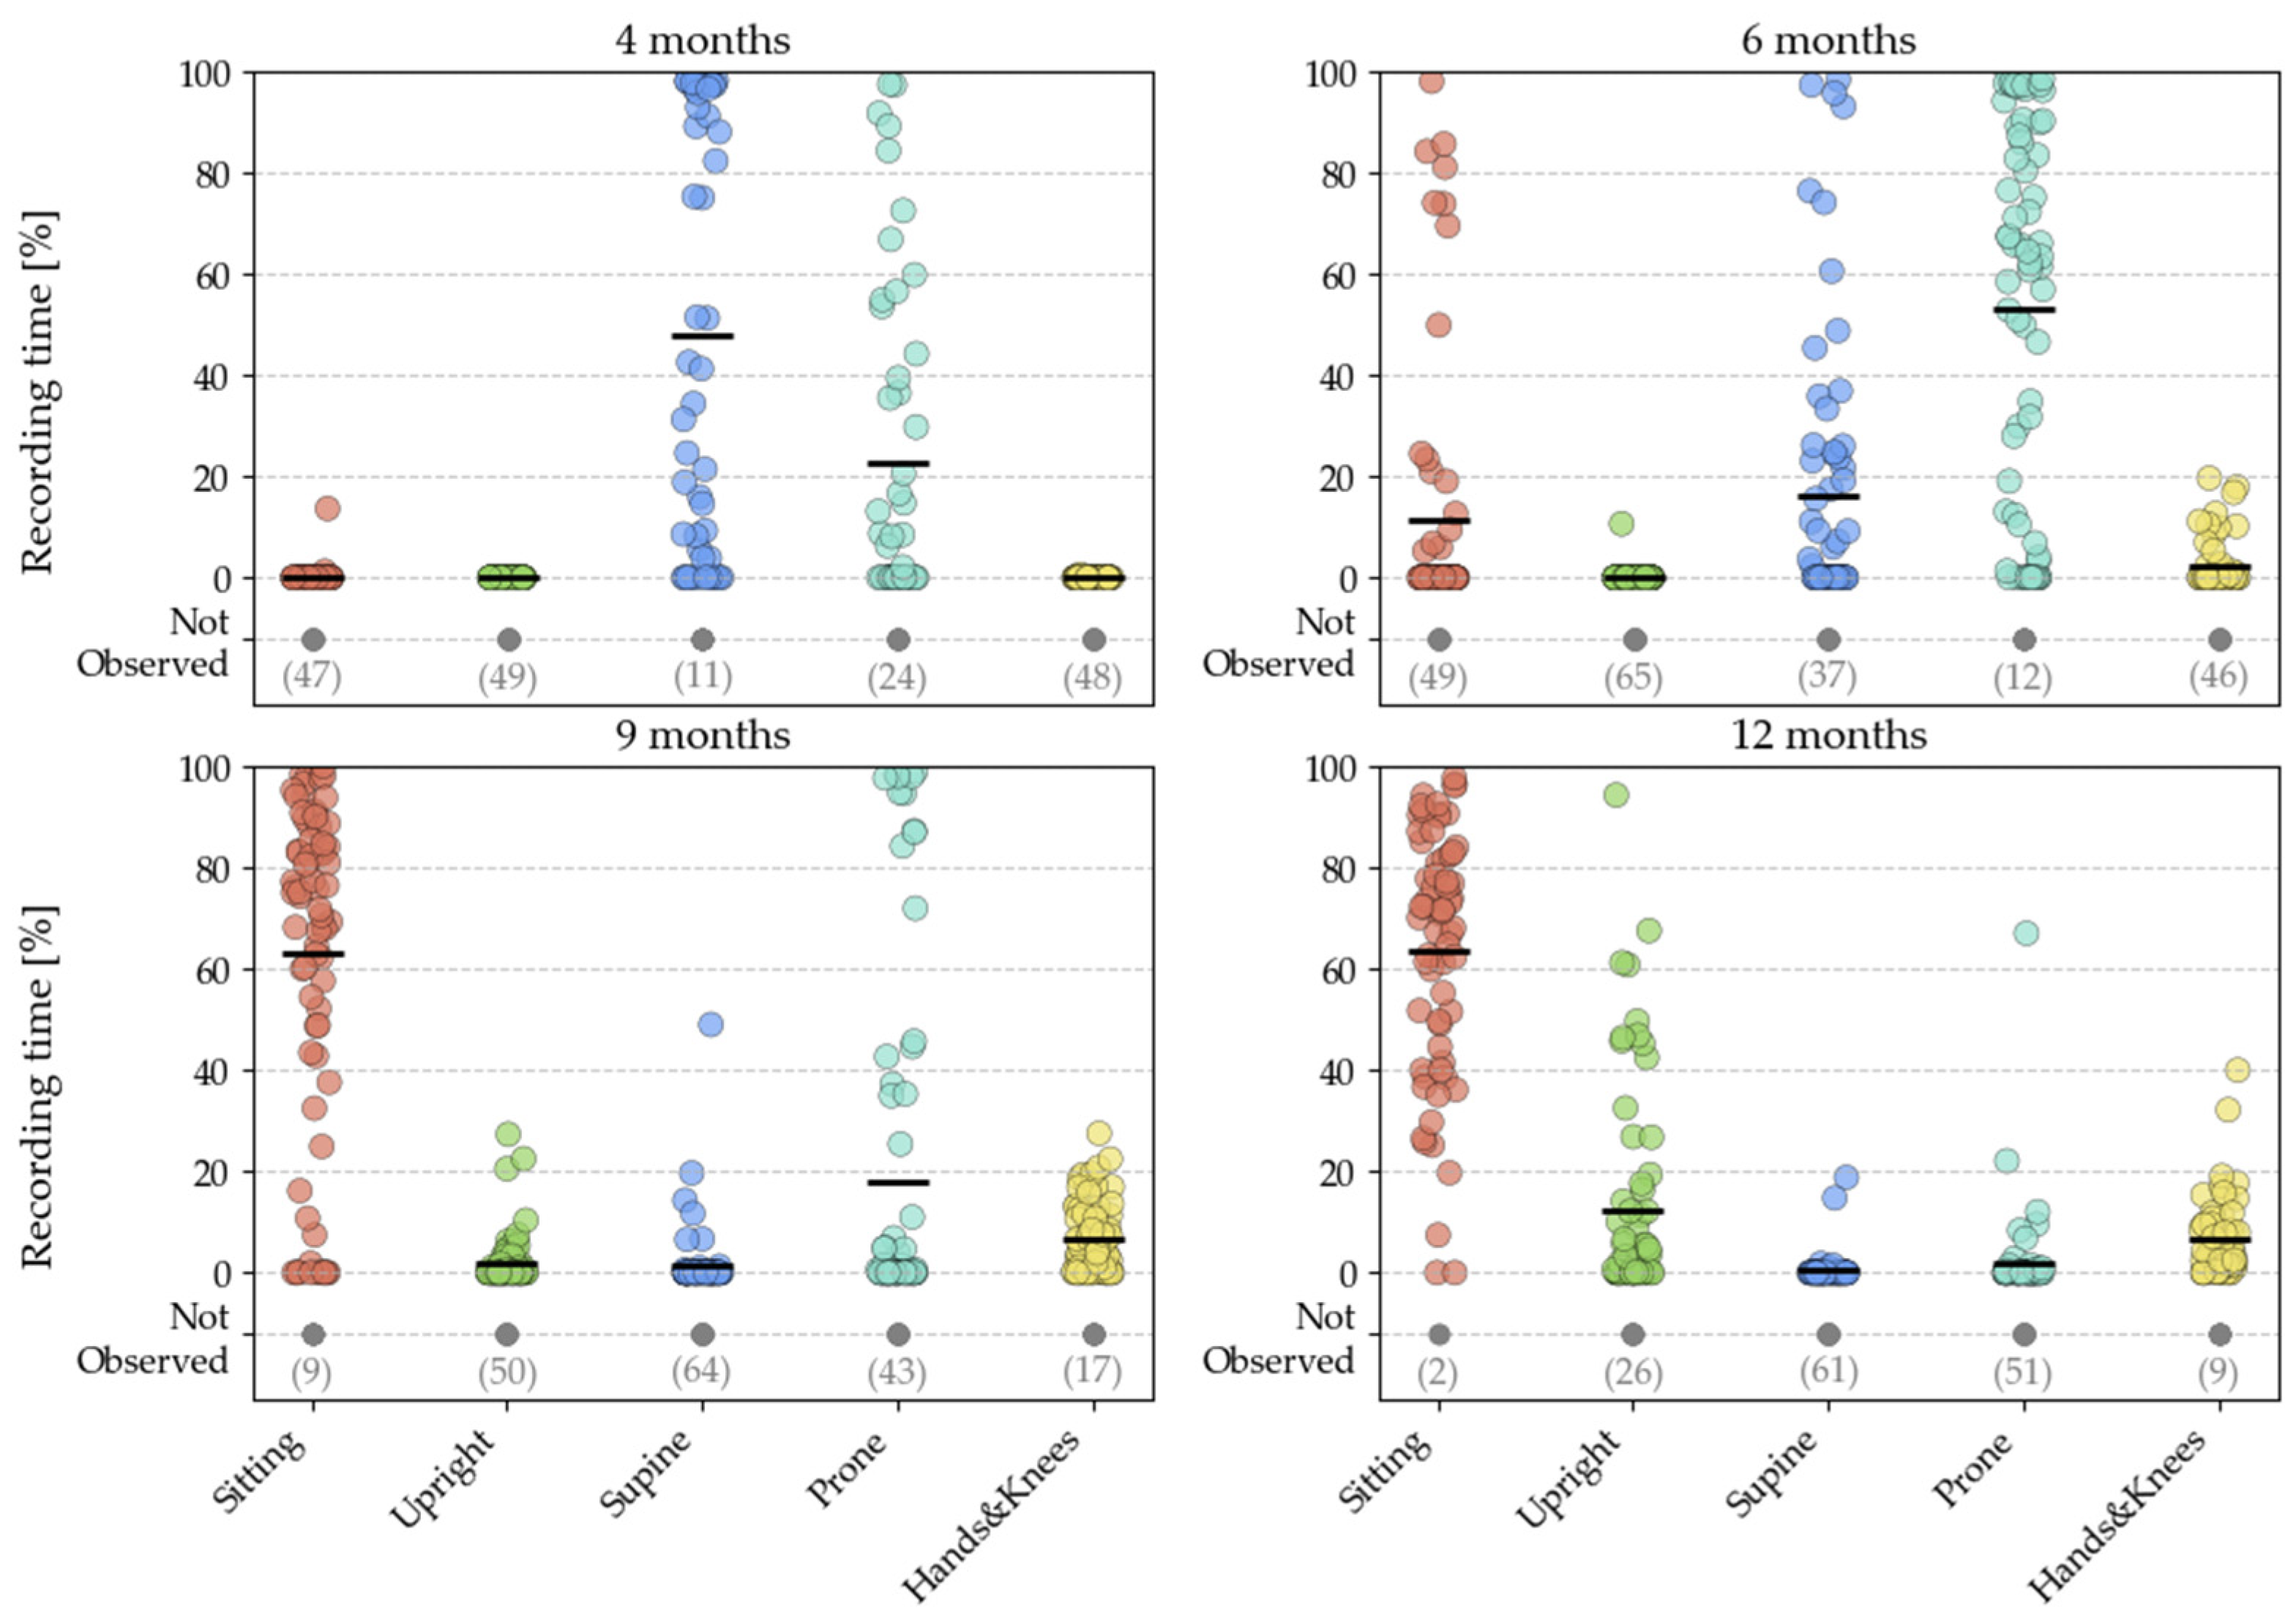
Figure 2 depicts the prevalence of different positions across time points.
2.2. Data Pre-Processing
The IMU sensor data, collected from an infant's arms, torso and ankles, was processed using custom MATLAB scripts (MathWorks, 2019).
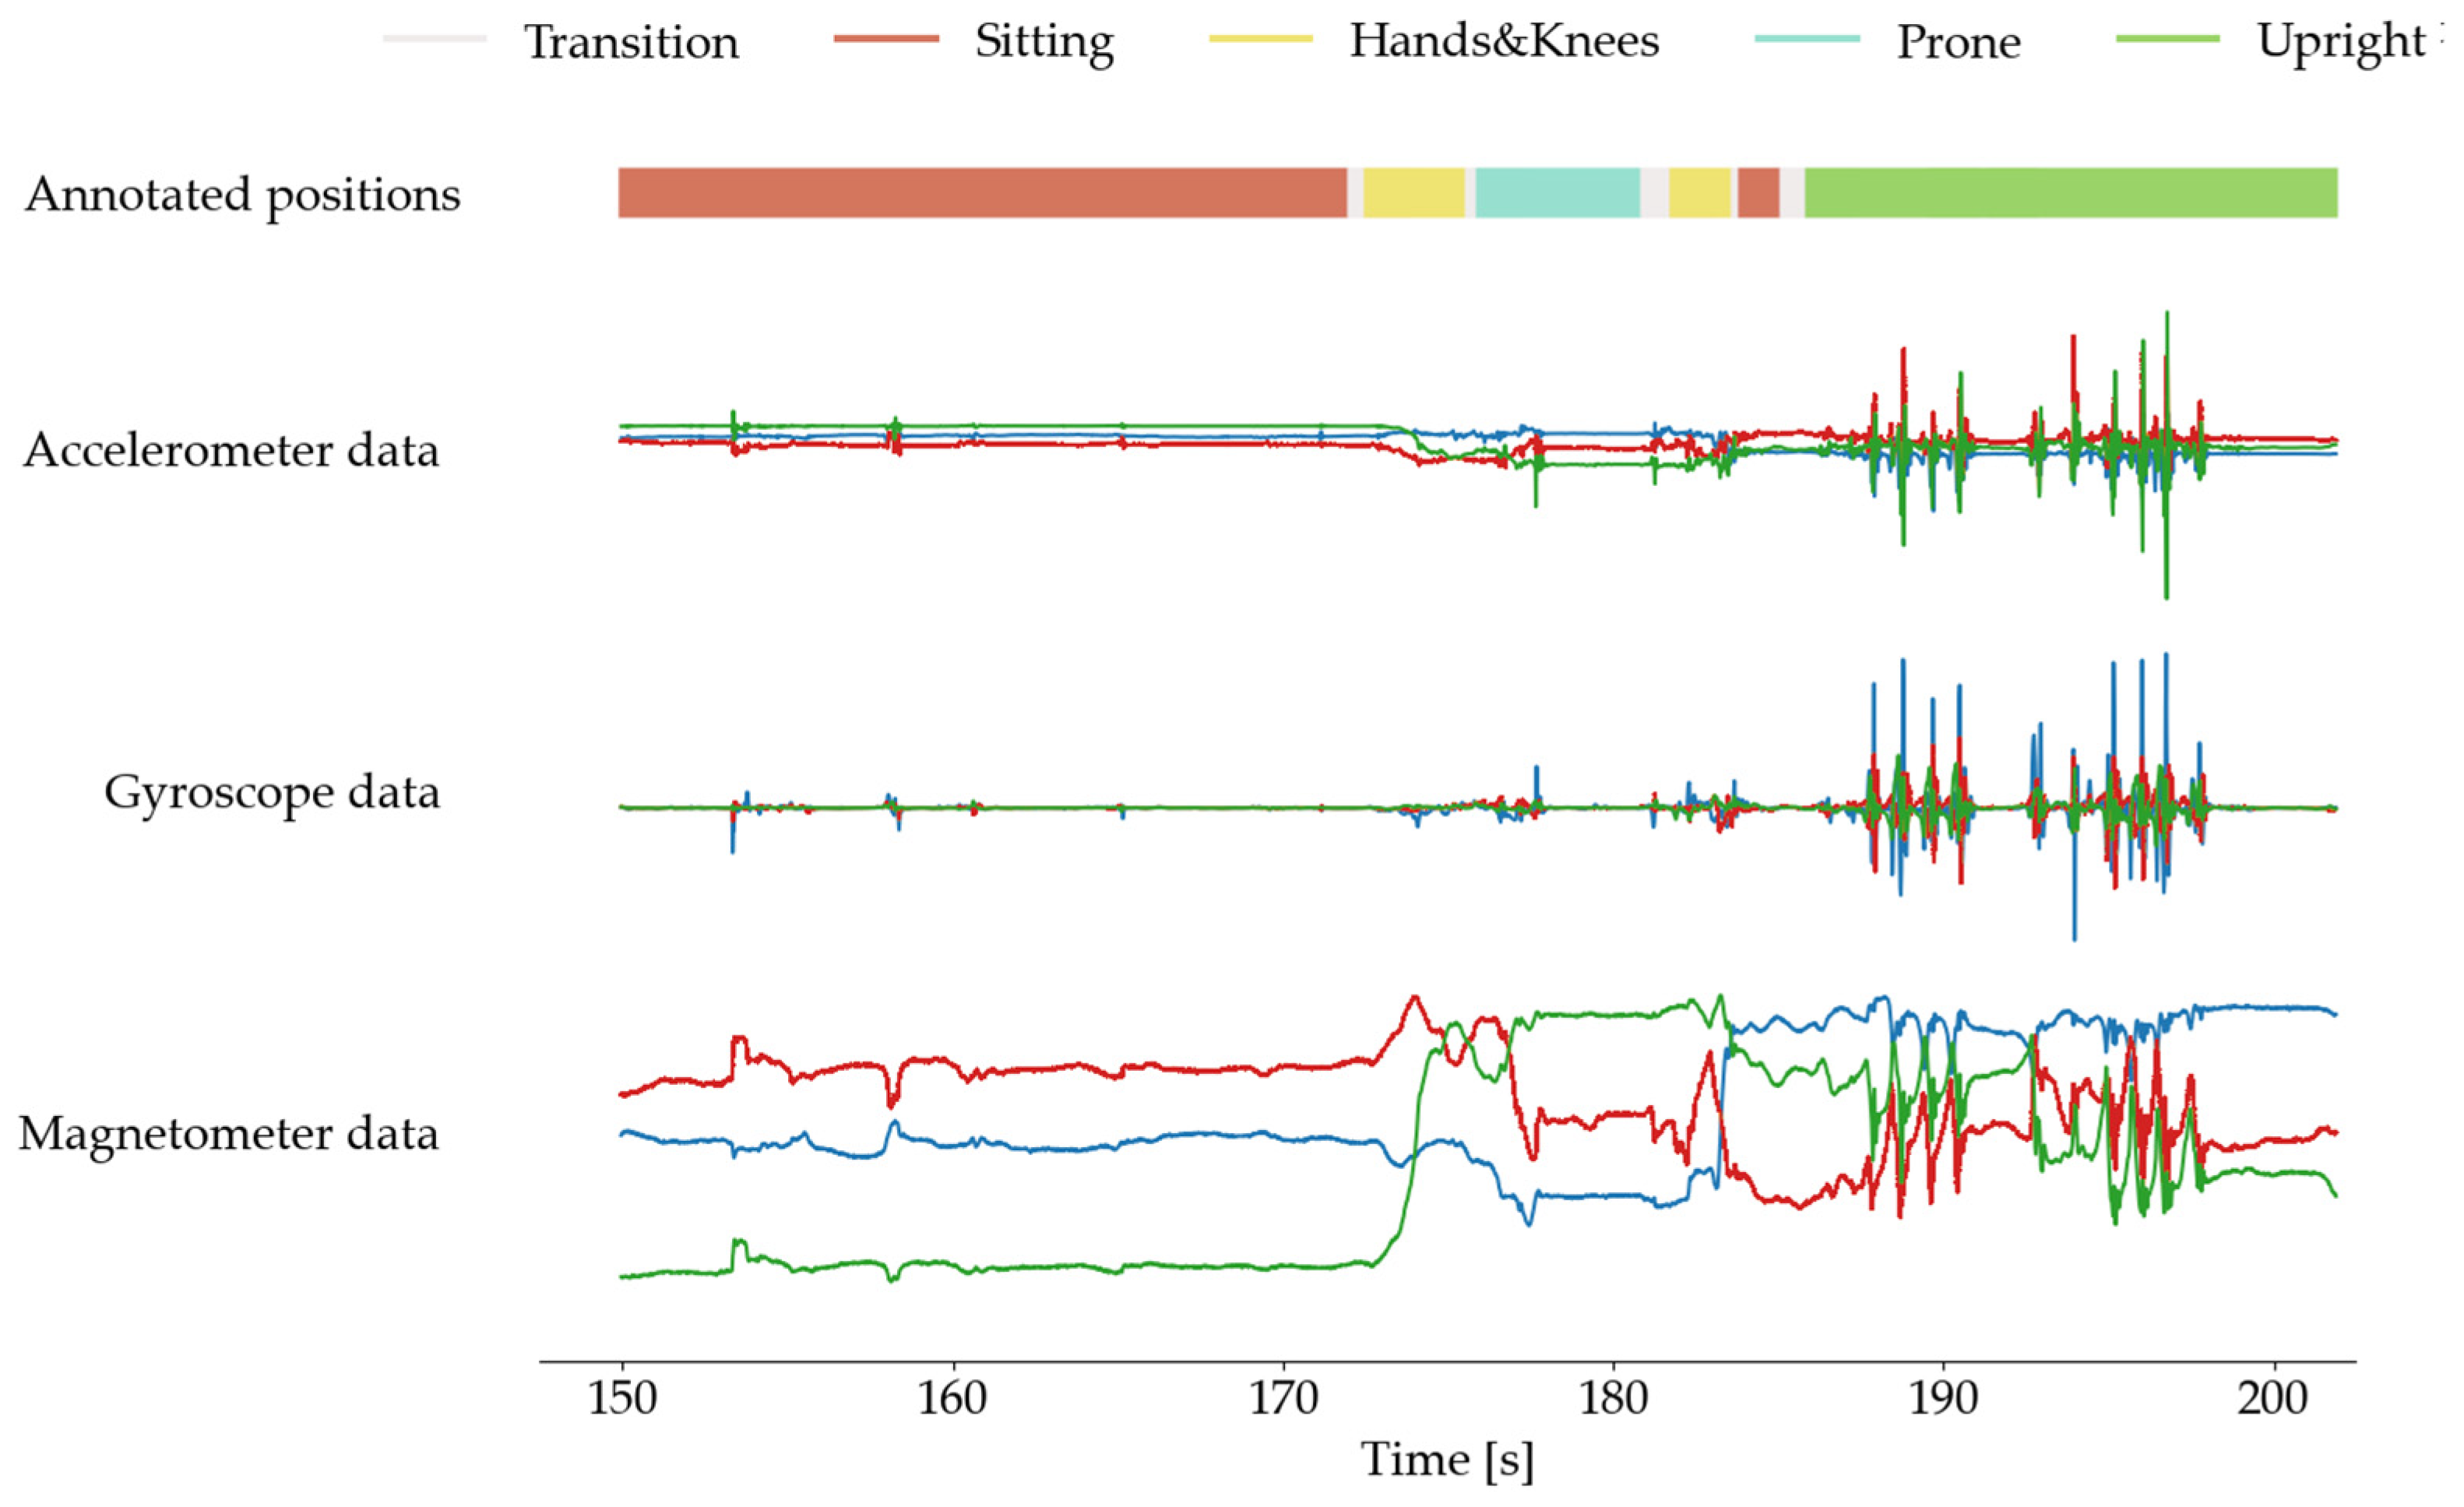
Figure 3 illustrates sensor readings and manually assigned postural positions.
The analysis focused on the accelerometer, gyroscope, and magnetometer signals. The IMU tracking system, which measures user orientation wirelessly via WiFi, occasionally faced connectivity issues that resulted in data gaps. These gaps were primarily due to the IMU sensors' internal characteristics and automatic changes in the sampling rate from 60 Hz to 40 Hz. To ensure the time series data remained consistent, missing values were interpolated using the 'spline' method with MATLAB's interp1 function (MathWorks, 2019). Additionally, when a lower sampling rate of 40 Hz was identified, the signal was resampled to 60 Hz using MATLAB's resample function. To mitigate artifacts stemming from instances where the infant displaced the sensor and was stationary on the ground, the acceleration magnitude variance was computed in 0.1-second windows. Data signals with variance below 1e−6 m/s² were identified as artifacts and subsequently excluded from the analysis. The dataset consisted of sensor readings from accelerometers (Acc), gyroscopes (Gyro), and magnetometers (Mag) (see
Table 4). From accelerometers, the data encompassed primary accelerations for 6 locations and three orthogonal axes. Subsequently, accelerometer data was High- and Low-Pass filtered (HP and LP). The resulting AC and DC acceleration data groups were integrated with the original sensor data. Additionally, the magnitudes (euclidean norms) of both the original and newly derived acceleration sensor data were included in the analysis.
Gyroscopes provided primary angular velocity values, and magnetometers contributed primary magnetic field strength values to the dataset. Initially, signals were selected for further analysis, considering using various toys to engage infants. Despite being in the same body position, movements during play with different toys, both within and across tasks, varied significantly. The hands emerged as a major source of signal variability across tasks, leading to the exclusion of hand sensor data in subsequent analyses. For details on all signals, see
Appendix A,
Section 2.
2.2.1. Synchronisation of Movement and Audio-Video Data
At the beginning of each task, the caregiver was instructed to clap five times to provide an audible synchronisation cue to align annotations with the IMU sensors. Subsequently, all claps were manually annotated using both audio and video data, which had been pre-synchronised. Next, the signal representing the Euclidean norm of the three-dimensional acceleration vector of caregiver’s arm IMUs was calculated using Equation A1. Then, the delay between the signal and audio annotations was calculated based on the caregiver ‘claps’ detected in averaged Acc wearable signals from both hands and applied to synchronise the signals from IMU sensors to the audio-video stream.
2.3. Class Selection and Parameter Extraction
2.3.1. Identifying Relevant Classes
In the dataset comprising 14 classes, as determined by annotators coding video recordings from the study, body positions were categorised into dynamic (e.g., walking, crawling) and static (e.g., lying, standing) subsets. A subsequent mapping process combined dynamic positions with their corresponding static counterparts, resulting in a refined set of 5 classes for classifier training.
2.3.2. Extracting Features and Composition of Feature Groups
To extract parameters, IMU signals were analysed using 2-second sliding windows with a 1-second overlap between consecutive windows. Each window was examined only if at least 75% of its samples were consistently assigned the same position label.
Figure 4 illustrates the process of analysing these overlapping windows using a manually annotated data segment.
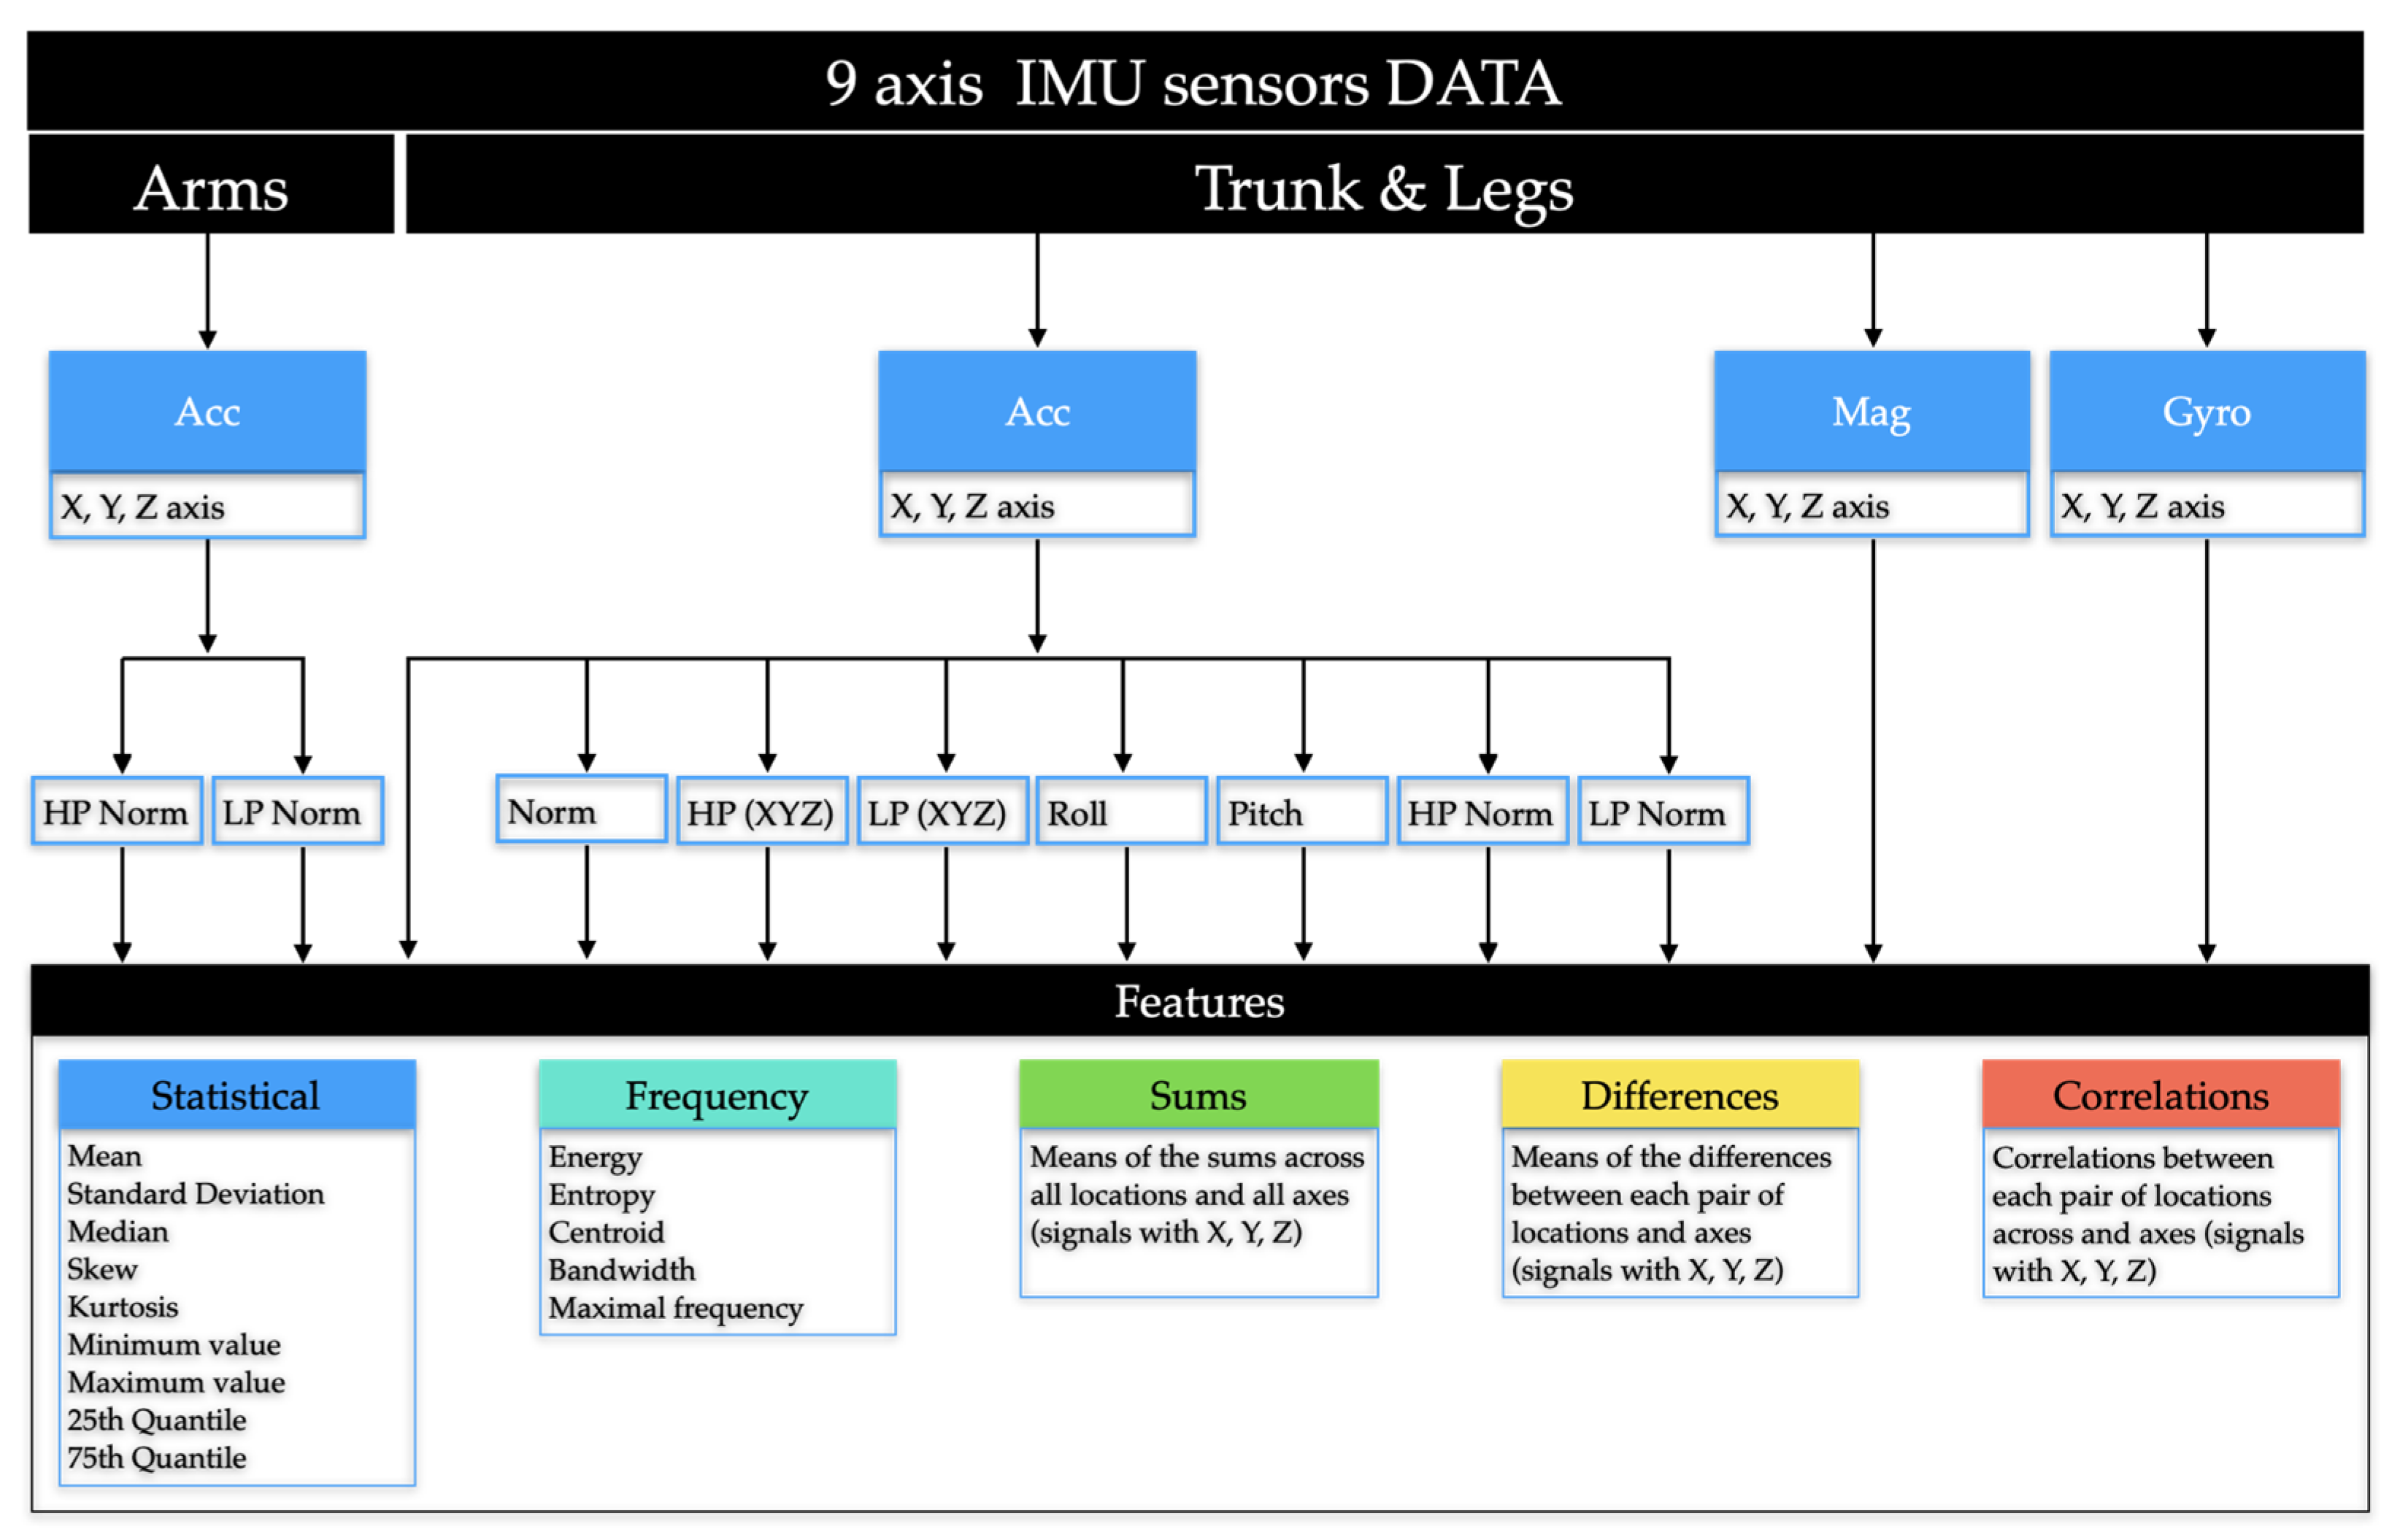
The features extracted from IMU sensors are categorised into five main groups (see
Table 4 for abbreviations used in
Figure 5), each offering unique insights into the data. Frequency-domain Features encompass properties: energy, entropy, centroid, bandwidth, and maximal frequency to capture the fundamental signal properties. The remaining features are calculated in the time domain. Statistical Features describe the data distribution, including metrics: mean, standard deviation, median, skewness, kurtosis, and key quantiles, along with minimum and maximum values. Summary Features provide aggregated information by summing data across axes and locations. Difference Features highlight variations within the data by calculating mean differences between axes and locations. Finally, Correlations examine the relationships between different features to reveal their interactions and dependencies.
To enhance the model's ability to infer orientation, we combined Roll and Pitch features [
35,
36] with the low-pass filtered accelerometer signal. These features provide detailed information on the device's tilt and angular position, significantly influencing position classification. Integrating these specific features allows the model to capture subtle variations in orientation that may be crucial for distinguishing between different positions.
These feature groups collectively offer insights into the relationships and significance of various IMU signal properties in position classification tasks using IMU sensor data. The complete list of features and their formulas can be found in
Appendix A,
Section 3.
2.4. Classifier Selection
In this study, we chose two different types of classifiers for body position classification from IMU sensor data. The first classifier is Random Forest (RF), commonly used in IMU-based position studies (e.g., [
13,
37,
38,
39]) as a standard model and thus serves as a reference. The Random Forest algorithm is an ensemble method that constructs multiple decision trees, where the variability of individual tree predictions is reduced by introducing randomness during the classifier construction. This randomness is achieved through bootstrapping the training set and selecting a random subset of features at each split within the trees. The final prediction of the ensemble is obtained by averaging the predictions of the individual trees. In this work, we utilised the RandomForestClassifier implementation from the scikit-learn library [
40] with the following parameters: [n_estimators=1000, max_depth=6, class_weight='balanced'].
The second classifier we used is a gradient-boosted model, specifically the CatBoostClassifier from the CatBoost library [
41]. This model constructs multiple shallow decision trees, iteratively fitting each tree to the residual errors of the preceding trees. To further reduce the risk of overfitting, the CatBoost algorithm randomly shuffles the features at each tree level. The tree predictions are then aggregated to enhance classification accuracy and improve the model’s generalisation capabilities. Gradient-boosted classifiers like CatBoost have shown superior performance in various datasets, especially in bioinformatics applications, as noted by Olson et al. [
42].
2.5. Classifier Performance Evaluation
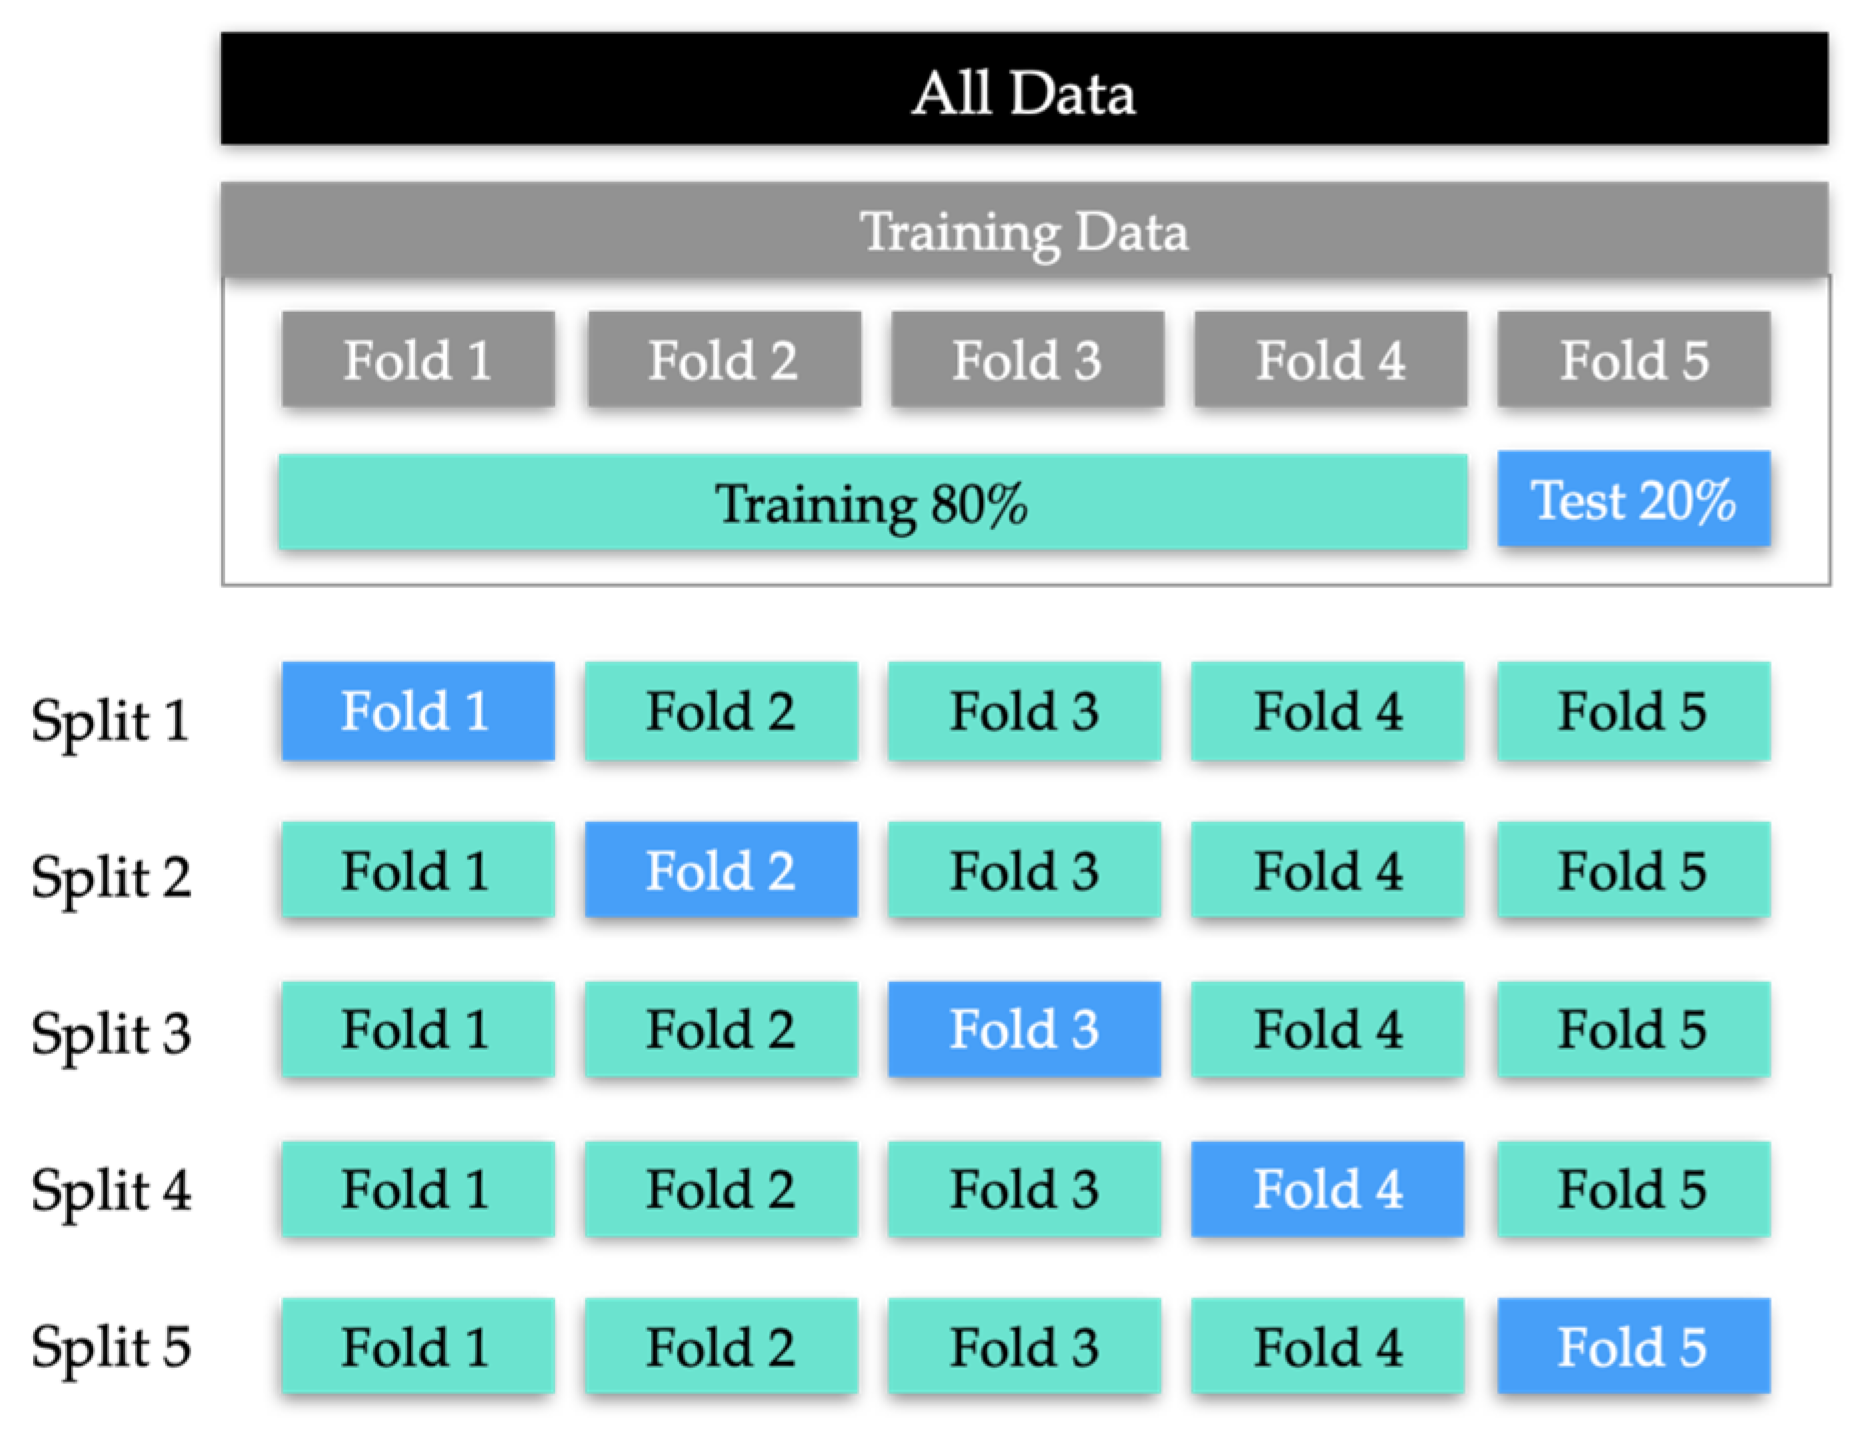
The models were trained in a 5-fold cross-validation procedure (see
Figure 6) to estimate their average performance and standard error. Folds were constructed so that recordings from a given infant are only in one fold to prevent data leakage.
We evaluated our models utilising the F1 score as it is one of the most popular methods and considers both precision and recall as a harmonic mean. F1 score reaches its best value at 1 and worst score at 0. The relative contribution of precision and recall to the F1 score are equal. In the multiclass problem at hand, we evaluated the F1 score, treating our data as a collection of binary problems, one for each position vs other positions.
The confusion matrix displays the counts of correct classification (on the diagonal) and miss-classifications (off-diagonal). Analysing these values allows for a detailed assessment of the model’s performance, revealing its strengths and weaknesses in classifying instances of various classes. This breakdown provides additional insight beyond the F1 score, offering a more transparent and more nuanced understanding of the model’s classification behaviour and biases.
2.6. Importance of Different Features Groups
2.6.1. Ablation Experiments
The importance of feature groups was evaluated using ablation experiments and F1 score analysis. We performed two types of ablation experiments: in the first, individual feature groups were removed, and in the second, models were trained using only one specific feature group at a time. For both experiments, we assessed the impact on model performance by analysing the resulting changes in the F1 score values.
2.6.2. SHAP Values
To assess feature group importance, we utilised SHAP (SHapley Additive exPlanations) values, which offer a game-theoretic approach to explain machine learning model outputs. SHAP values reveal how each feature influences predictions, their relative significance, and the interplay between features.
We used TreeExplainer from the SHAP library [
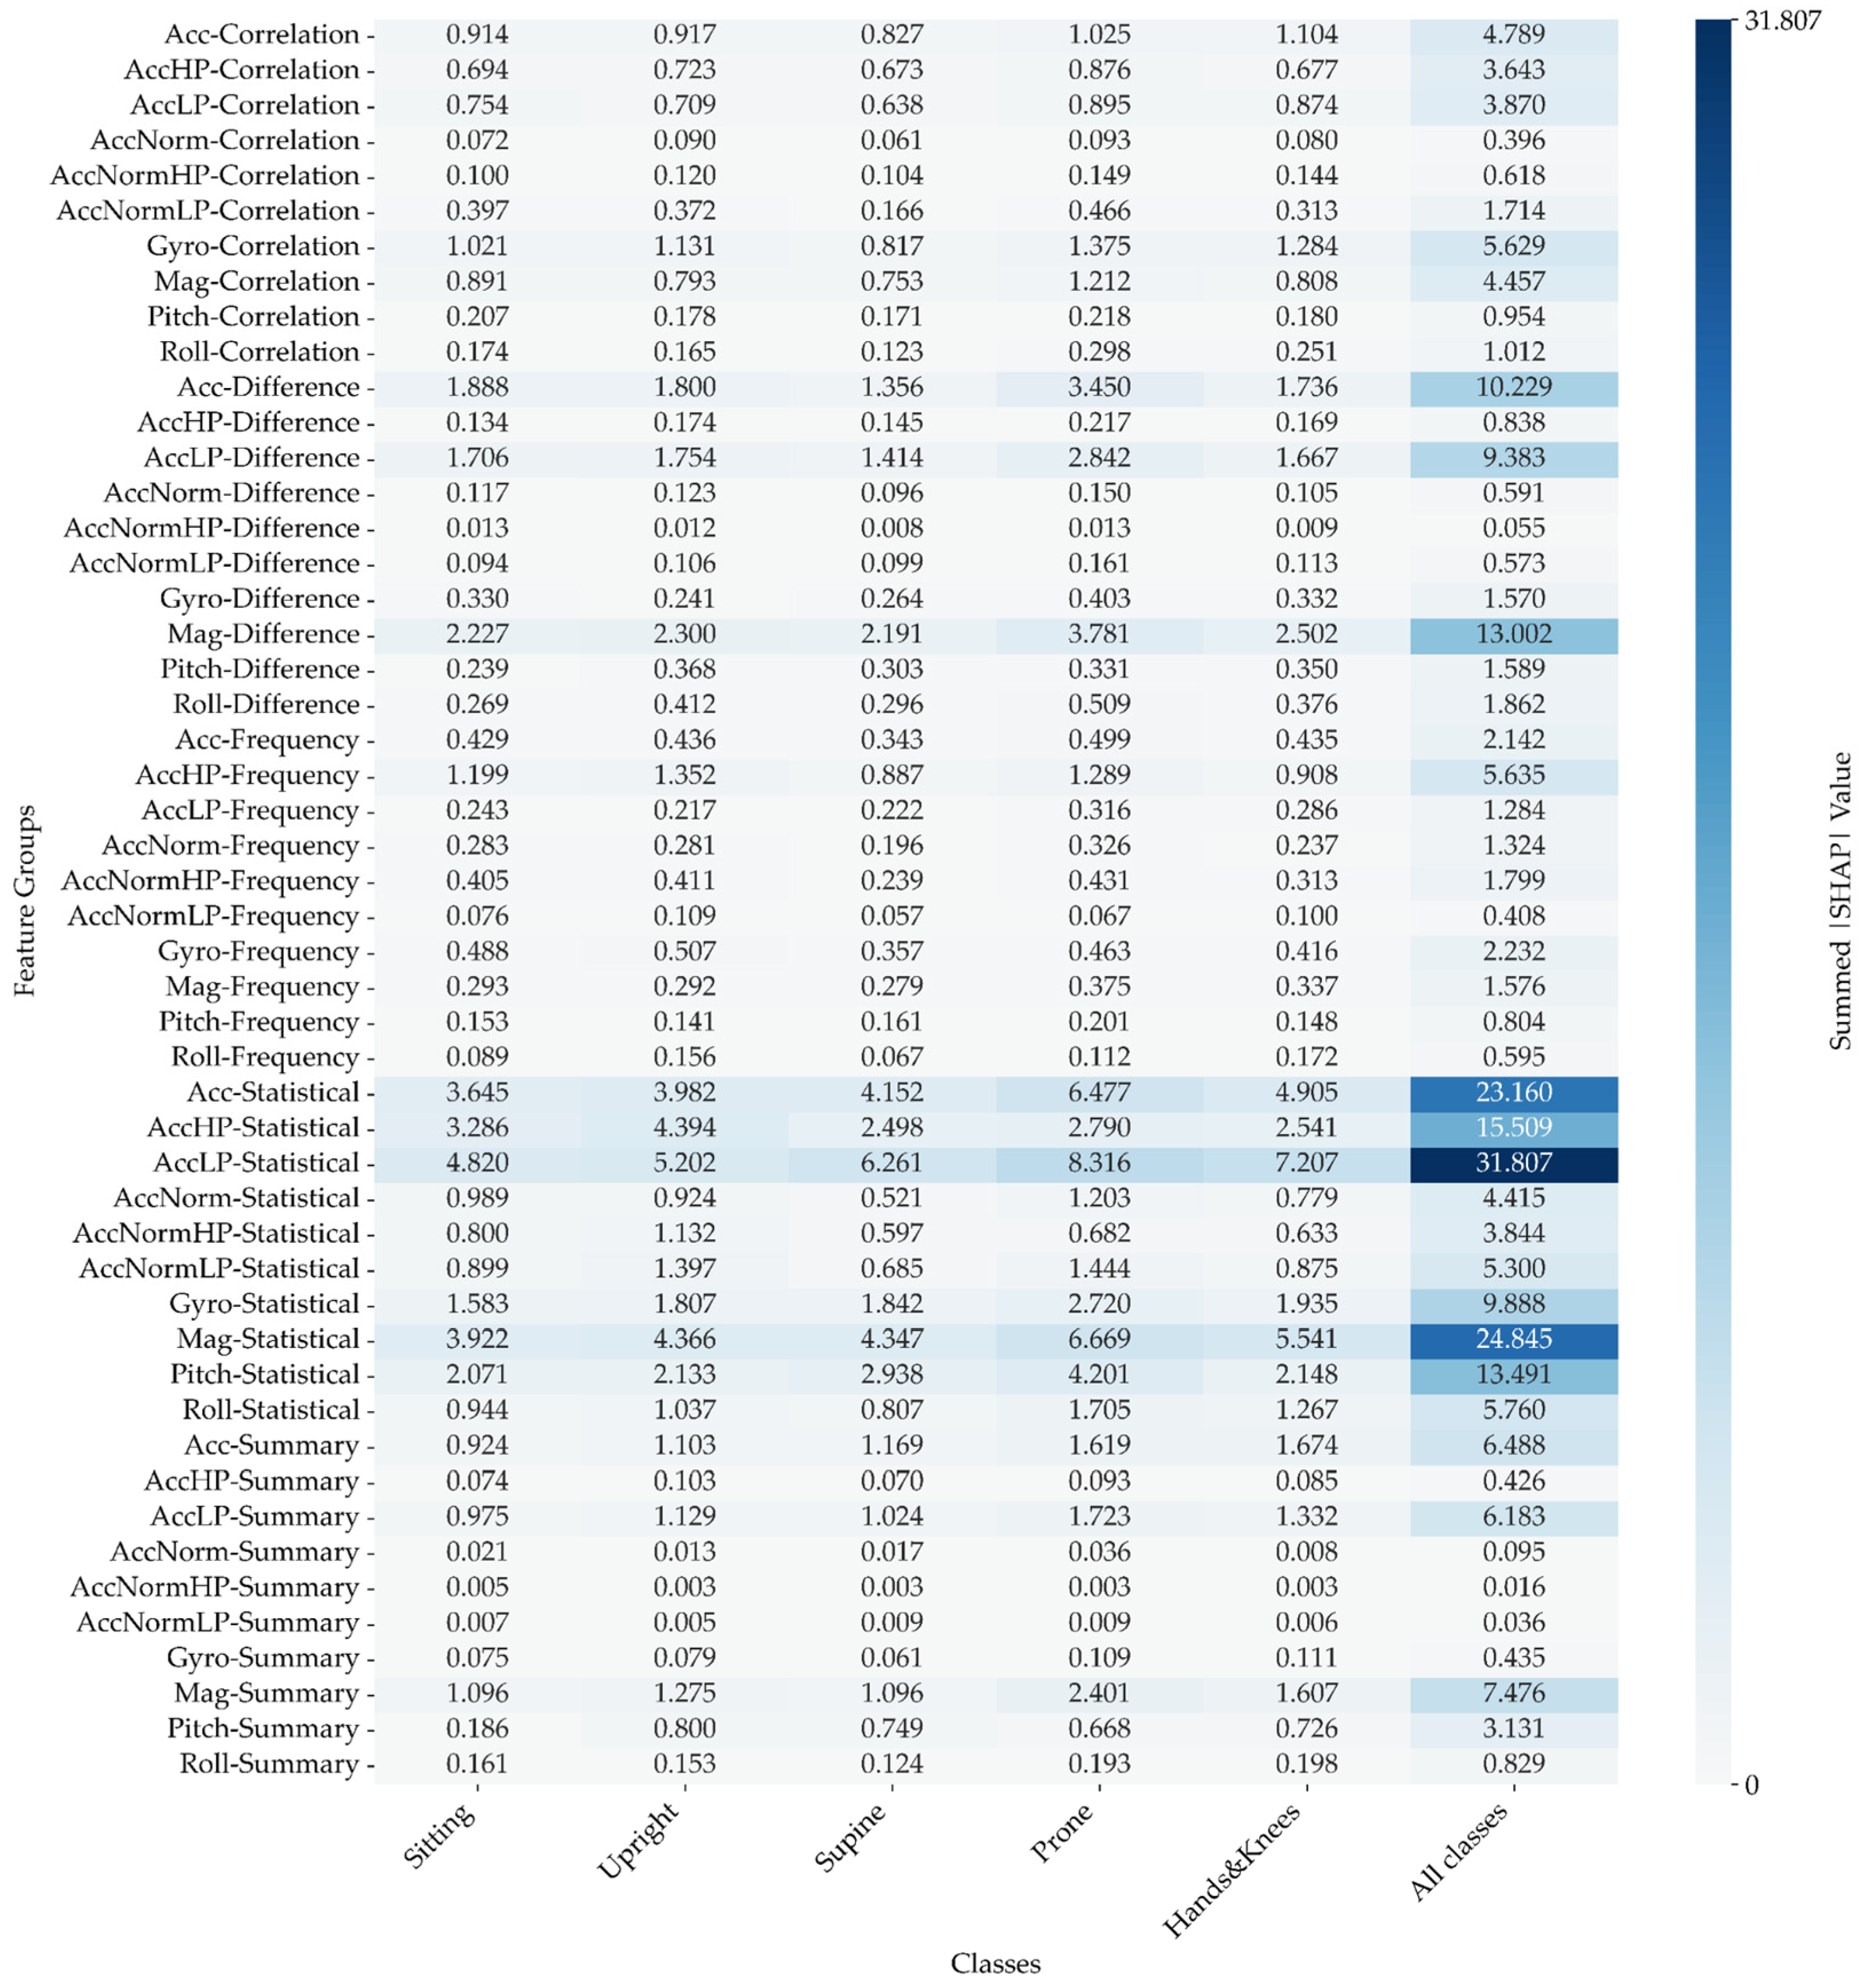
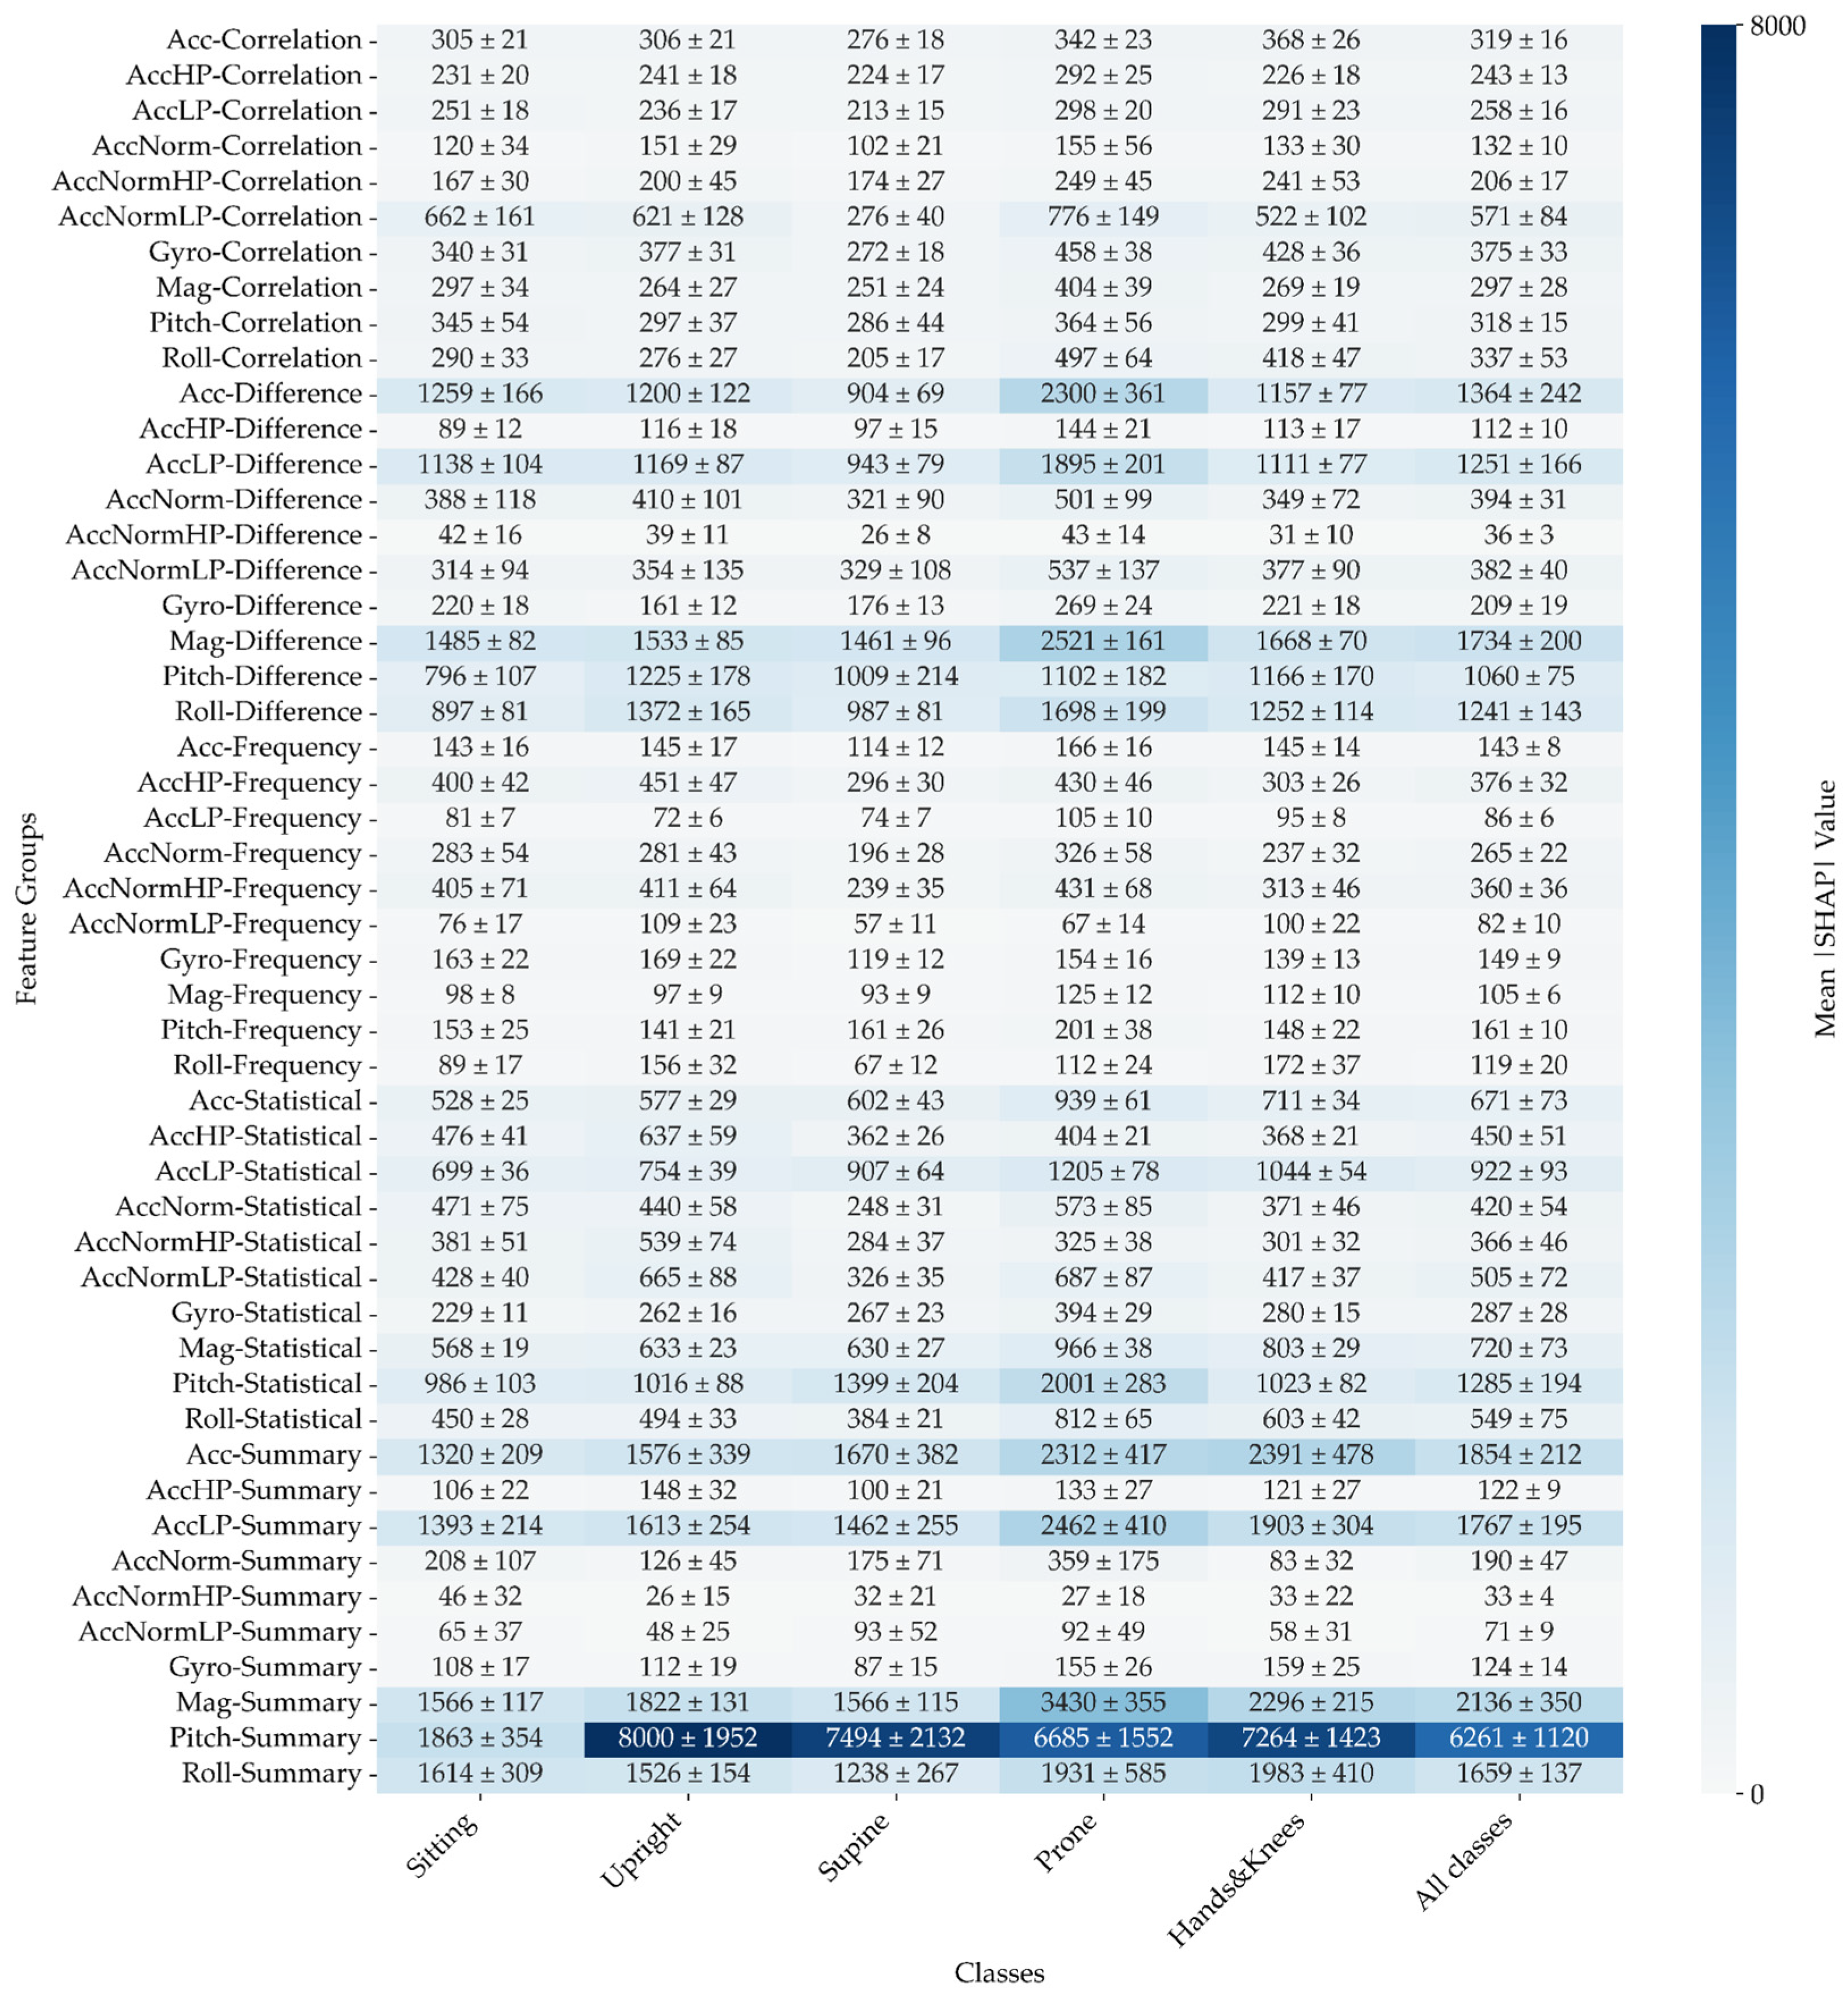
43] and evaluated feature importance through mean and sum of |SHAP| values (of absolute values), where the averaging or summation was performed within feature groups of a given signal (
Figure 1). Mean |SHAP| values show the average contribution of each feature across different folds, helping us understand their general impact and compare their relative importance. This method also highlights feature stability and provides insights into uncertainty through associated error measurements.
On the other hand, the sum of |SHAP| values captures the total contribution of each feature group across all folds, reflecting the aggregate impact of features on model predictions. This approach allows us to assess the cumulative influence of feature groups and compare their overall effects. While it doesn't directly reveal feature interactions, it highlights which feature groups have the most significant total impact.
2.7. Correlation between Annotated and Predicted Time in Position
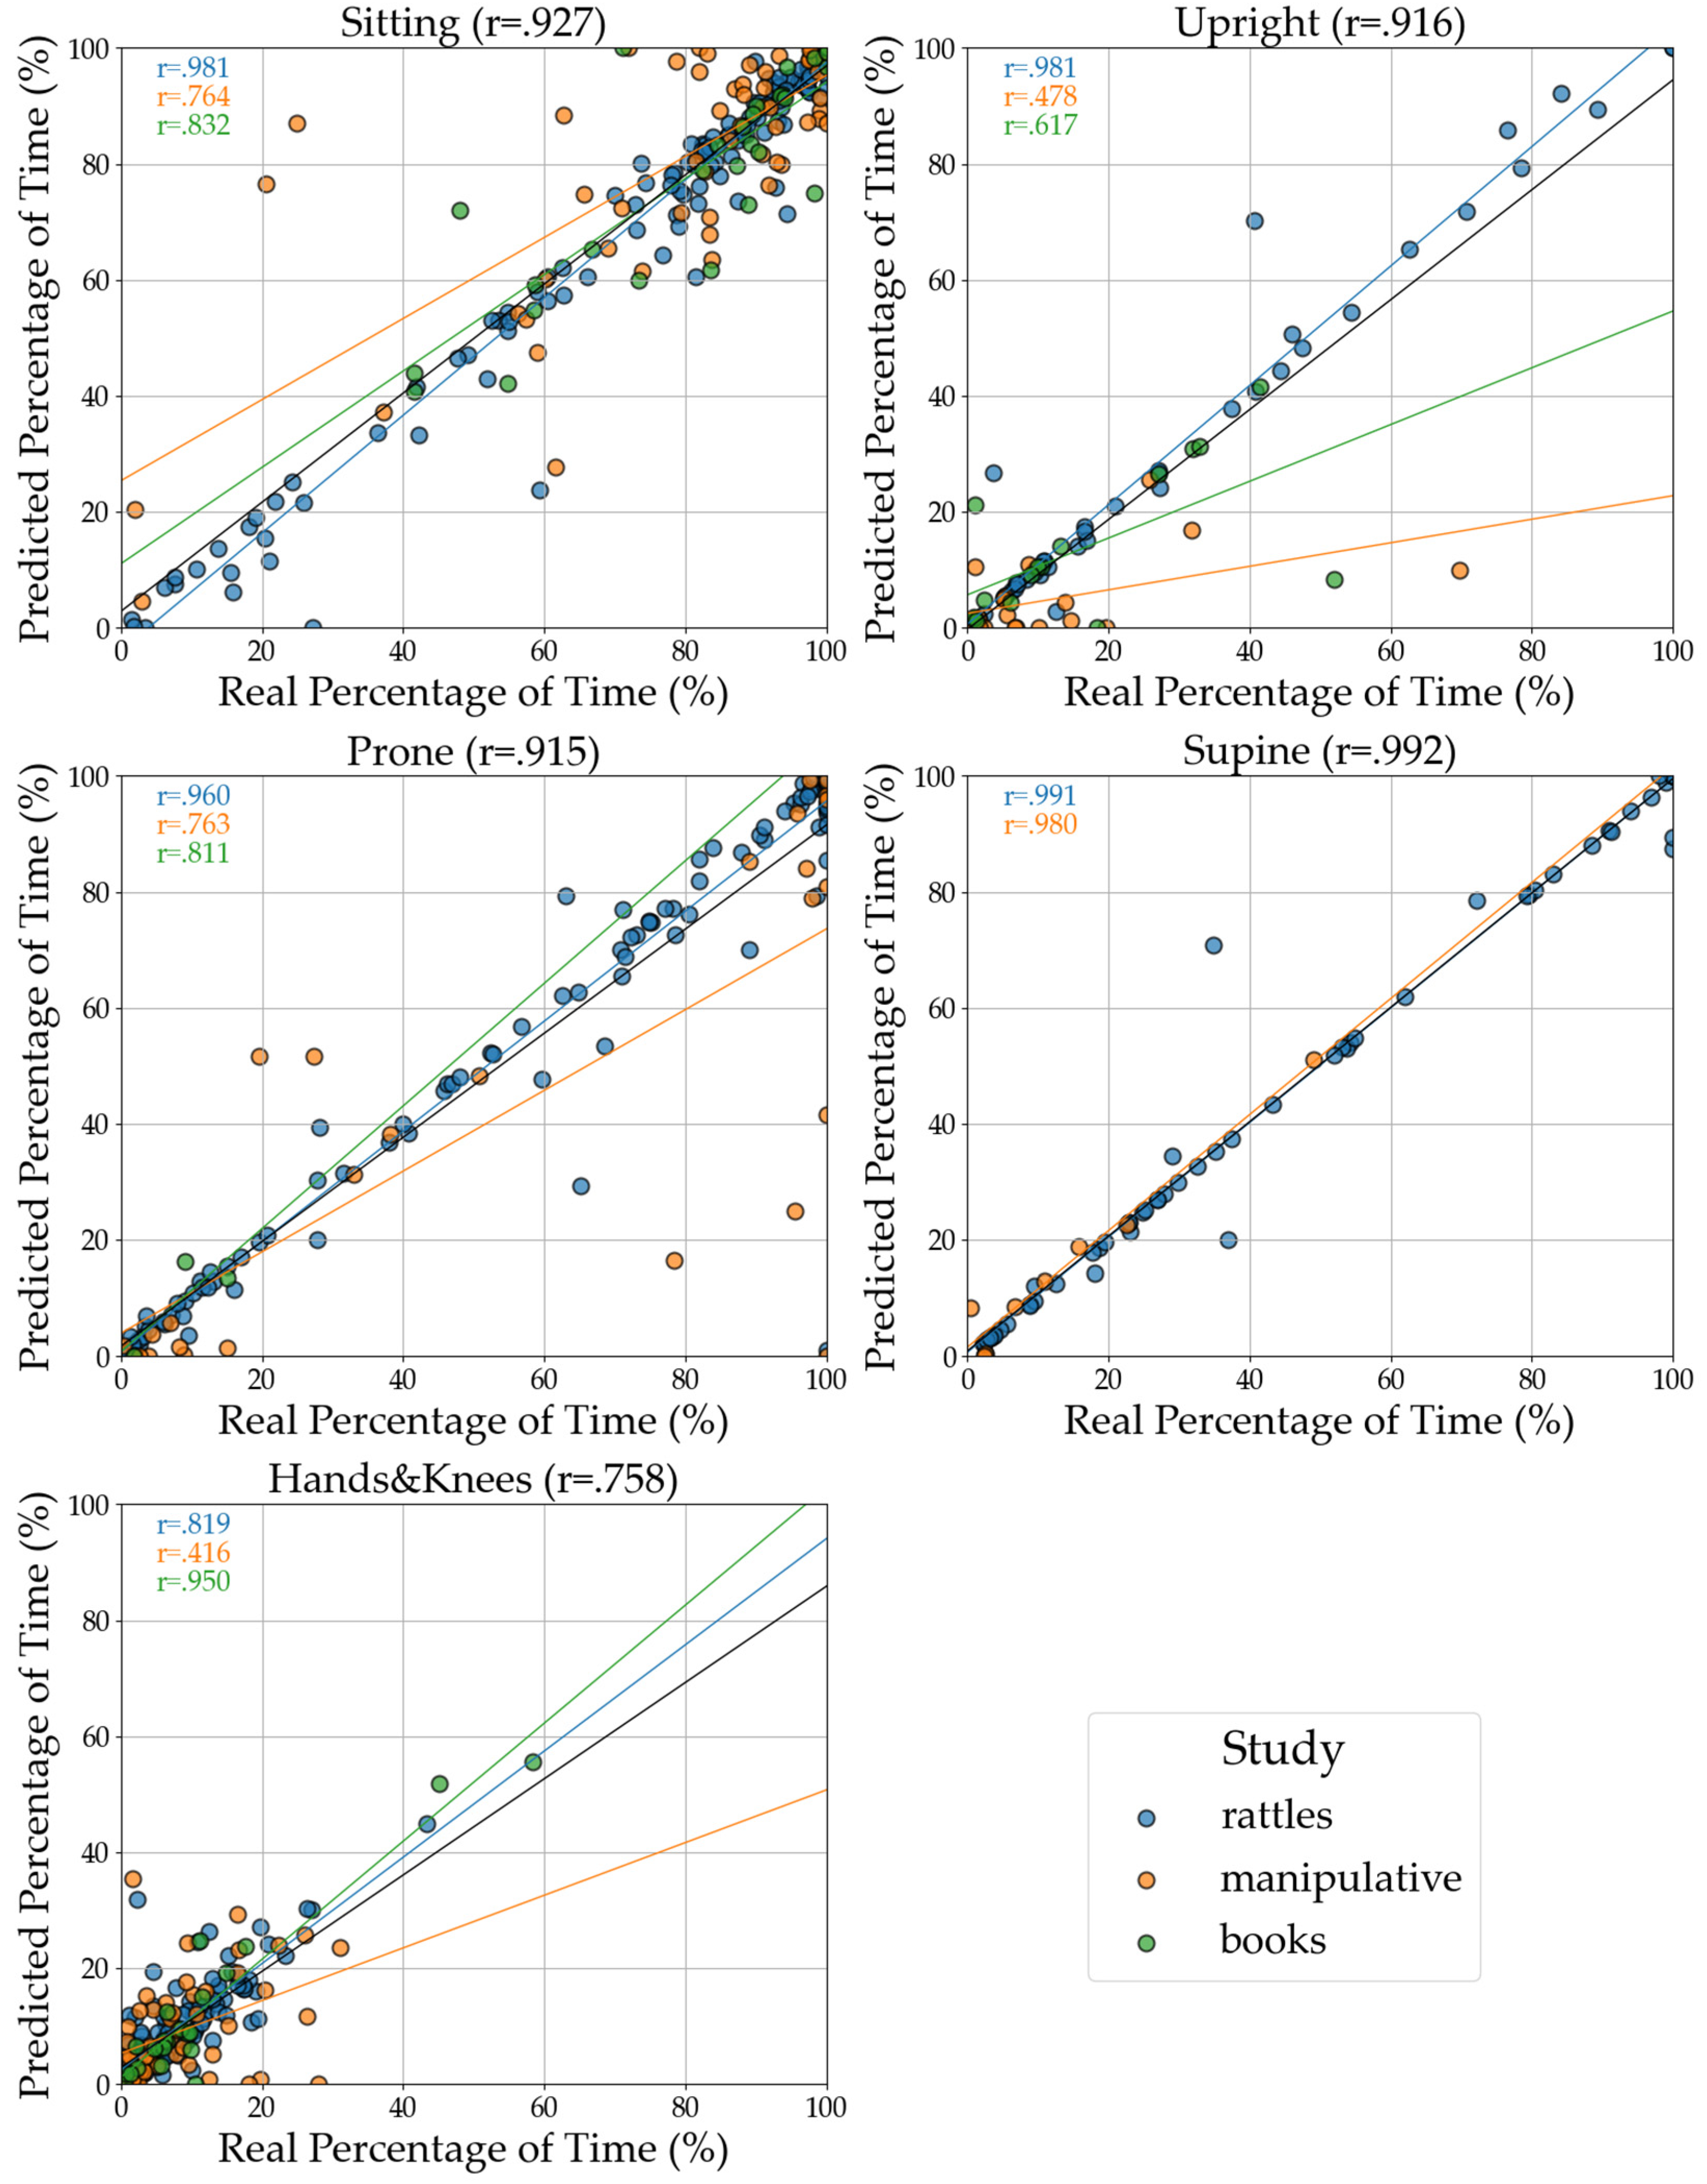
To assess how accurately the model's predictions align with the true annotated data, we examined the correlation between annotated and predicted time for a position. For each position, we calculated the temporal sums of windows labelled and assigned by the classifier to it. Then, they were divided by the overall time of the respective study and multiplied by 100 to obtain the percentage share of a given position in the entire study. A high correlation within position indicates that the model effectively captures the time spent in different positions, which is crucial for tasks such as position monitoring and assessment.
3. Results
3.1. Classifier Comparison
3.1.1. Sensor Placement and Classifier Comparison
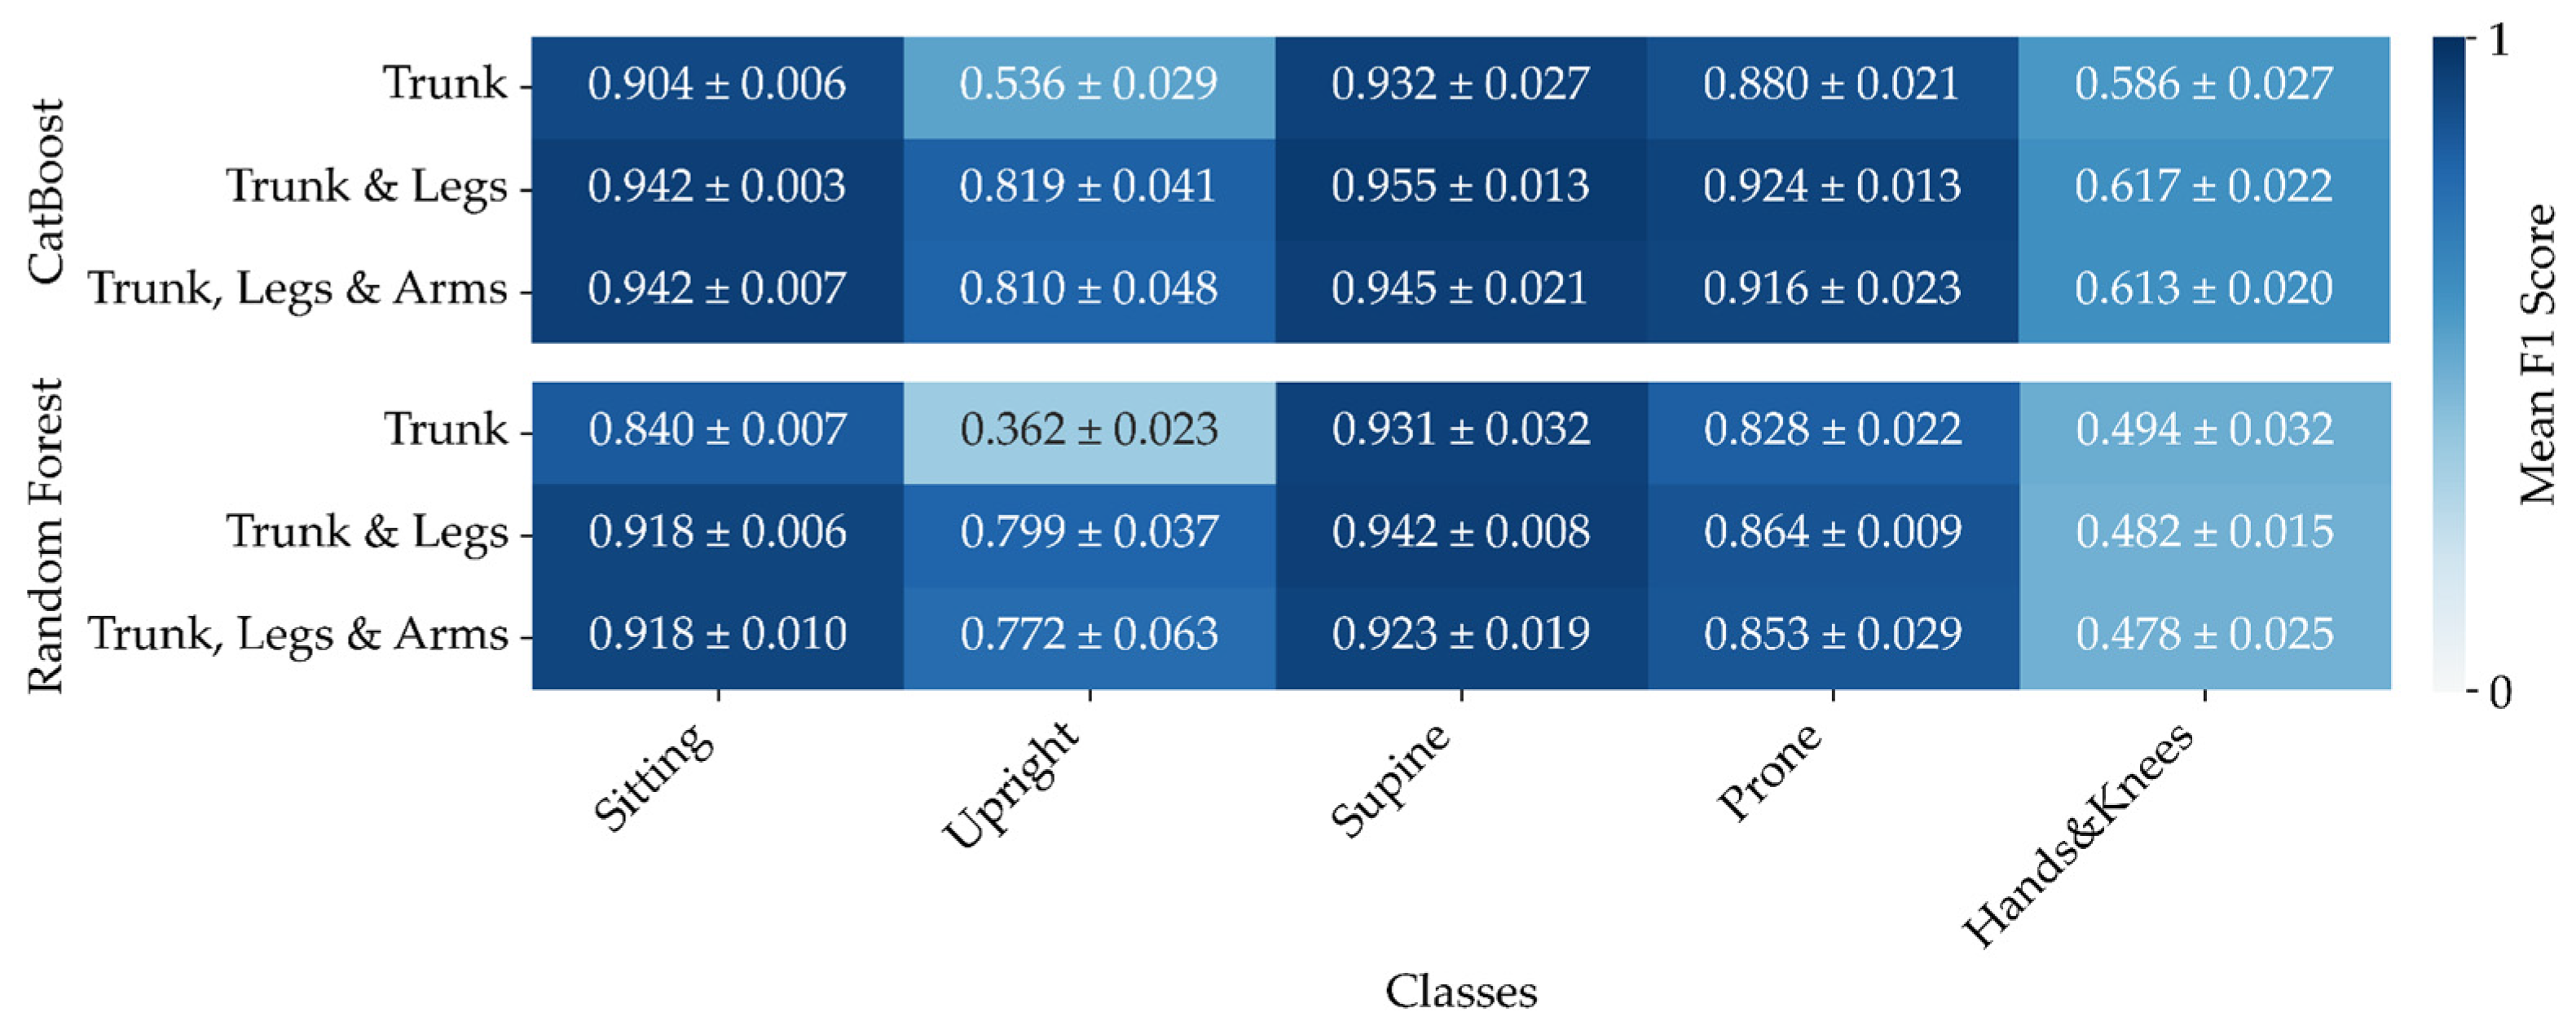
Figure 7 shows the results of a comparison of three CatBoost and Random Forest classifiers, each trained and evaluated at various combinations of sensor data. CatBoost consistently demonstrated superior performance compared to Random Forest across all three models: Trunk, Trunk & Legs, and Trunk, Legs & Arms. The F1 scores, averaged over five folds, clearly indicate that CatBoost outperforms the Random Forest algorithm in every position analysed. This consistent advantage suggests that CatBoost's ability to handle categorical features and its robust gradient-boosting framework contribute significantly to its effectiveness in this context.
Sensor placement is pivotal for effective position classification. Our findings indicate that the optimal configuration involves using sensors on the trunk and legs, which yields the highest F1 scores. This result may be largely attributed to the engagement of the hands in object-related actions. As expected, relying solely on trunk sensors results in reduced F1 scores but still gives acceptable accuracy. Notably, incorporating sensors on the arms does not enhance accuracy when combined with trunk and leg sensors. As illustrated in
Figure 7, the averaged F1 scores across five folds demonstrate that the Trunk and Legs configuration outperforms others, while the addition of arm sensors provides no discernible advantage.
Taking the above results into account further, we will focus on analysing the CatBoost models with Trunk & Legs sensors as input analysis.
3.2. CatBoost Performance Evaluation: Trunk & Legs
3.2.1. Confusion Matrices
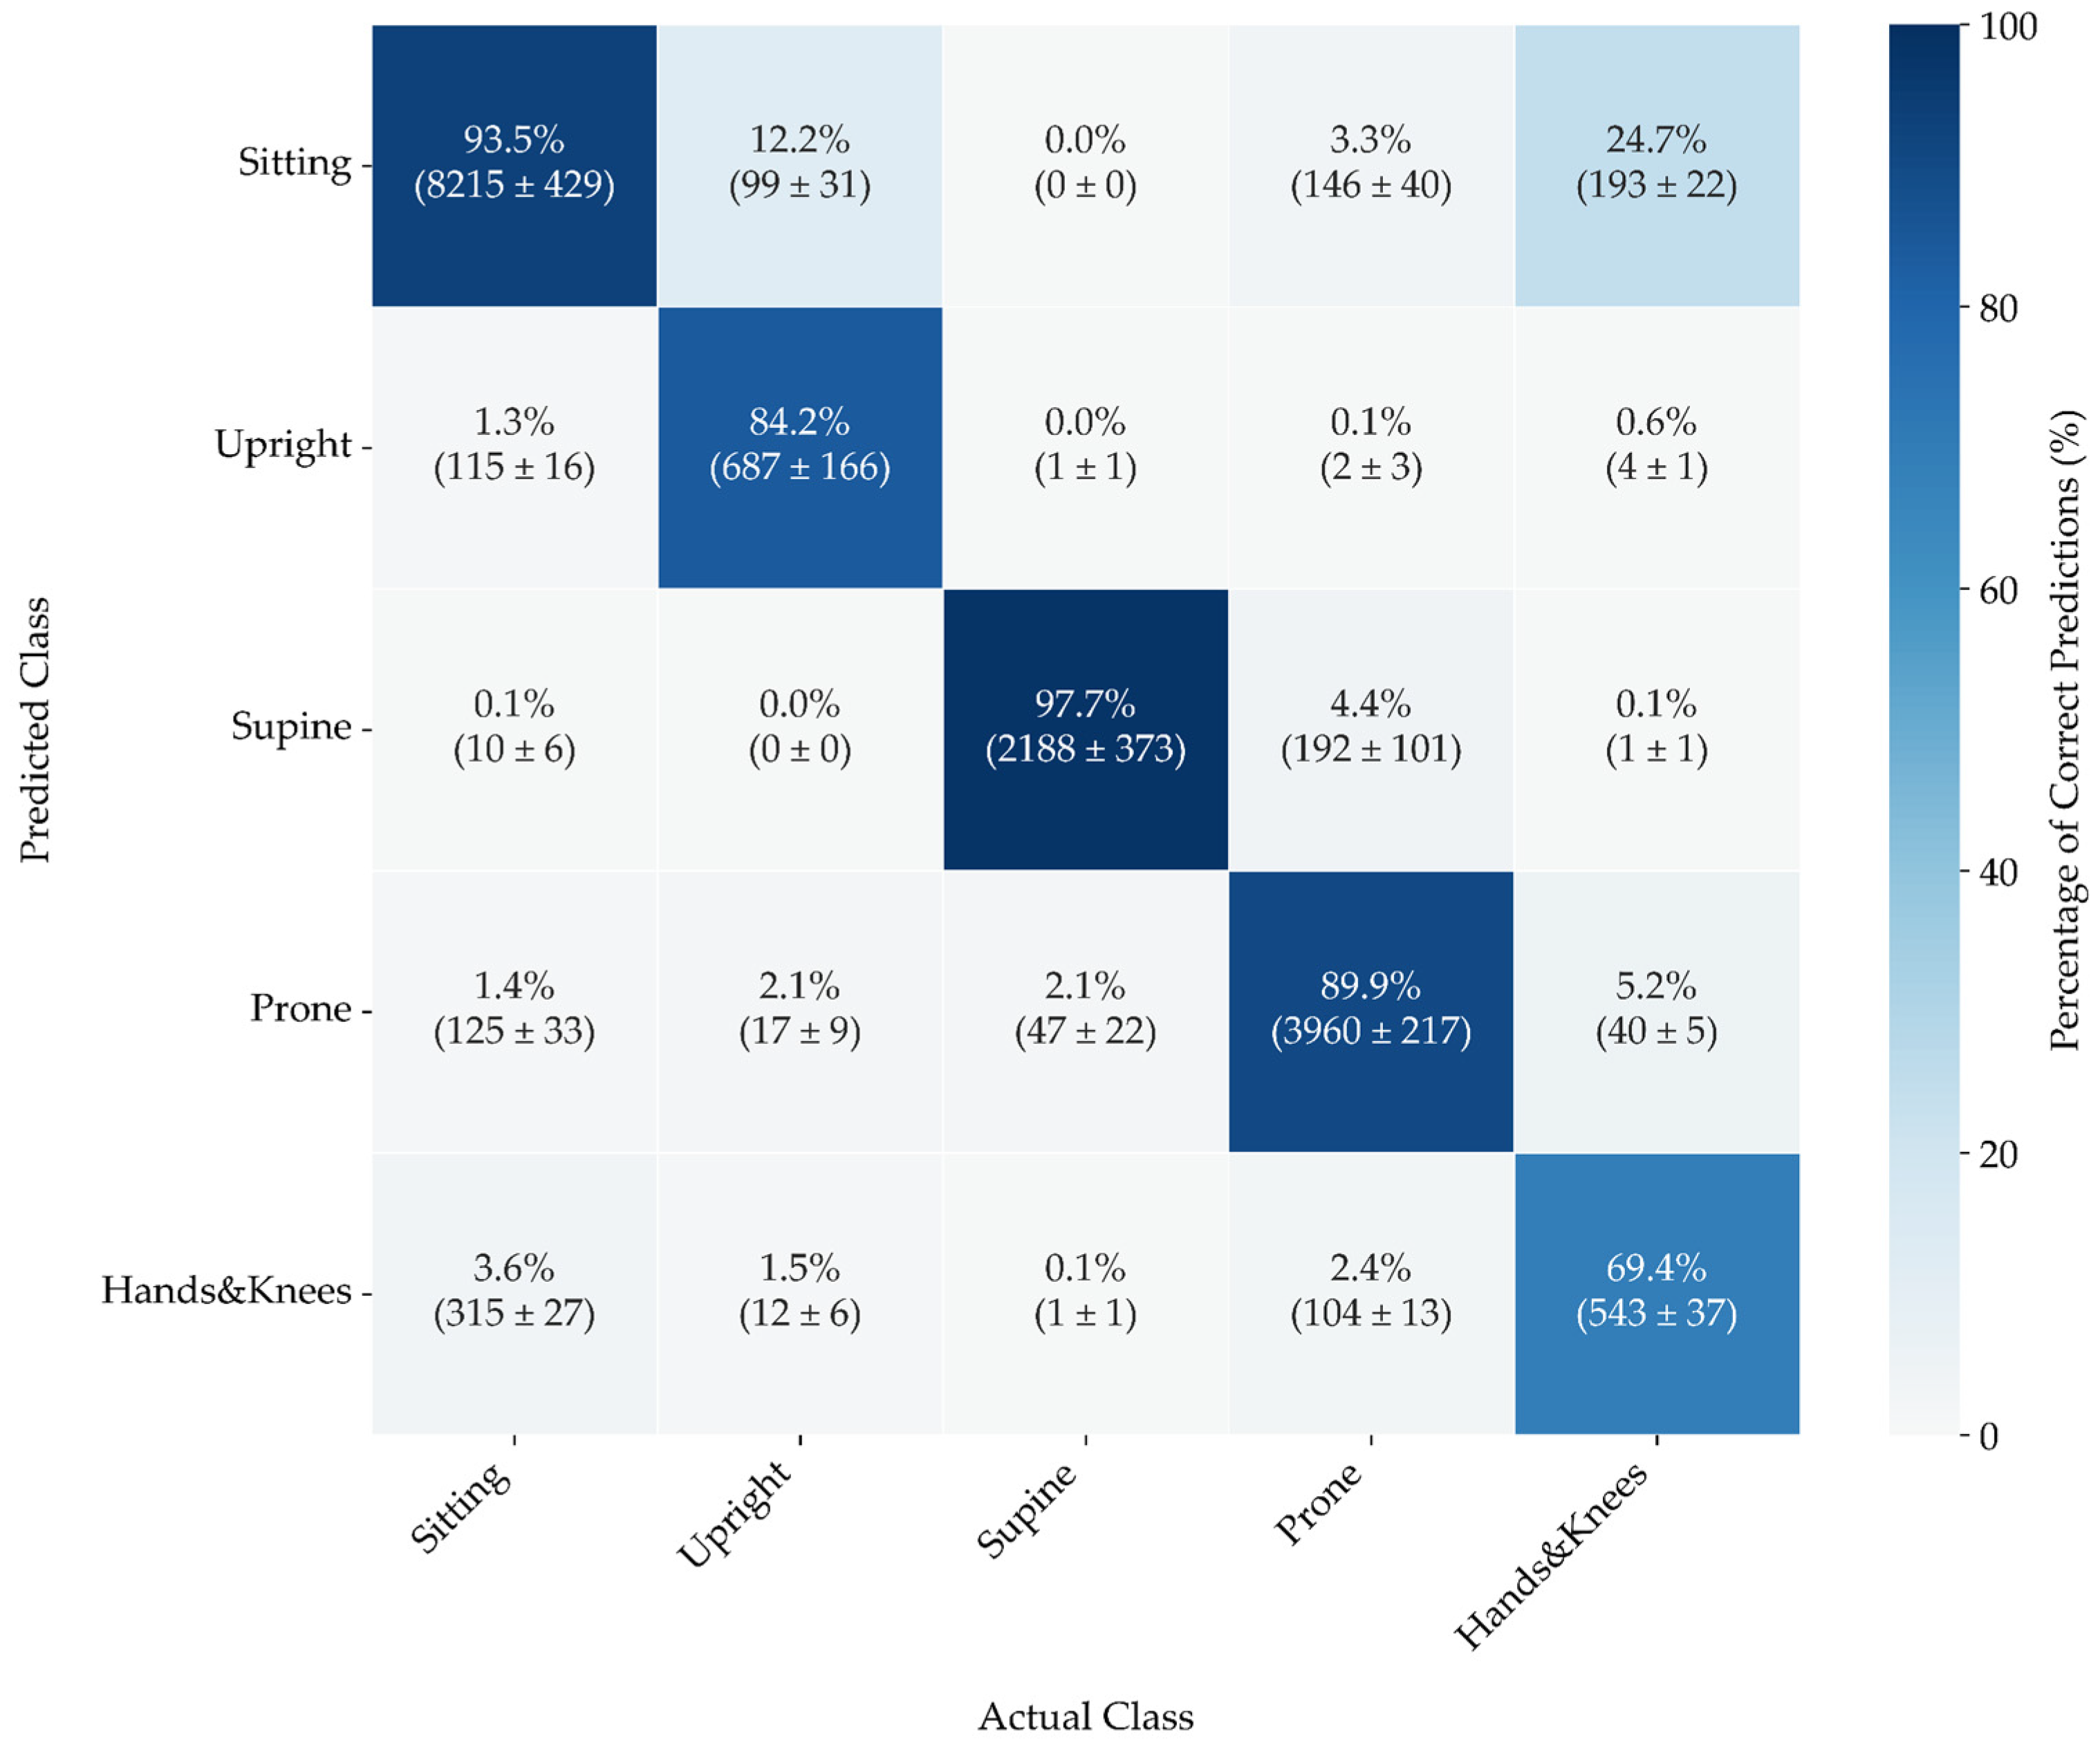
The confusion matrix (
Figure 8) reveals that the model excels at predicting Supine and Sitting positions, with both categories achieving over 90% accuracy—a performance that highlights the model's reliability. Notably, Sitting is identified accurately most frequently, although it occasionally gets misclassified as Hands&Knees and Prone.
Predictions for Upright are also highly accurate, with minimal misclassification into other categories. However, the model demonstrates less accuracy for the Prone position, which is often misclassified as Sitting and Supine.
In contrast, the Hands&Knees position shows moderate accuracy, but it is frequently confused with Sitting and Prone. This trend suggests that the least stable position generates the most errors, which aligns with expectations, as it tends to transition into movement or shift to a more stable position.
3.2.2. Ablation Experiments
The results presented in this section reflect the percentage change in model performance during two types of ablation experiments using CatBoost to observe the effect on classification accuracy for various infant positions: Sitting, Upright, Supine, Prone, and Hands&Knees and with different feature groups, including Statistical, Frequency, Summary, Difference, and Correlation.
One Feature Group at a Time vs All Feature Groups
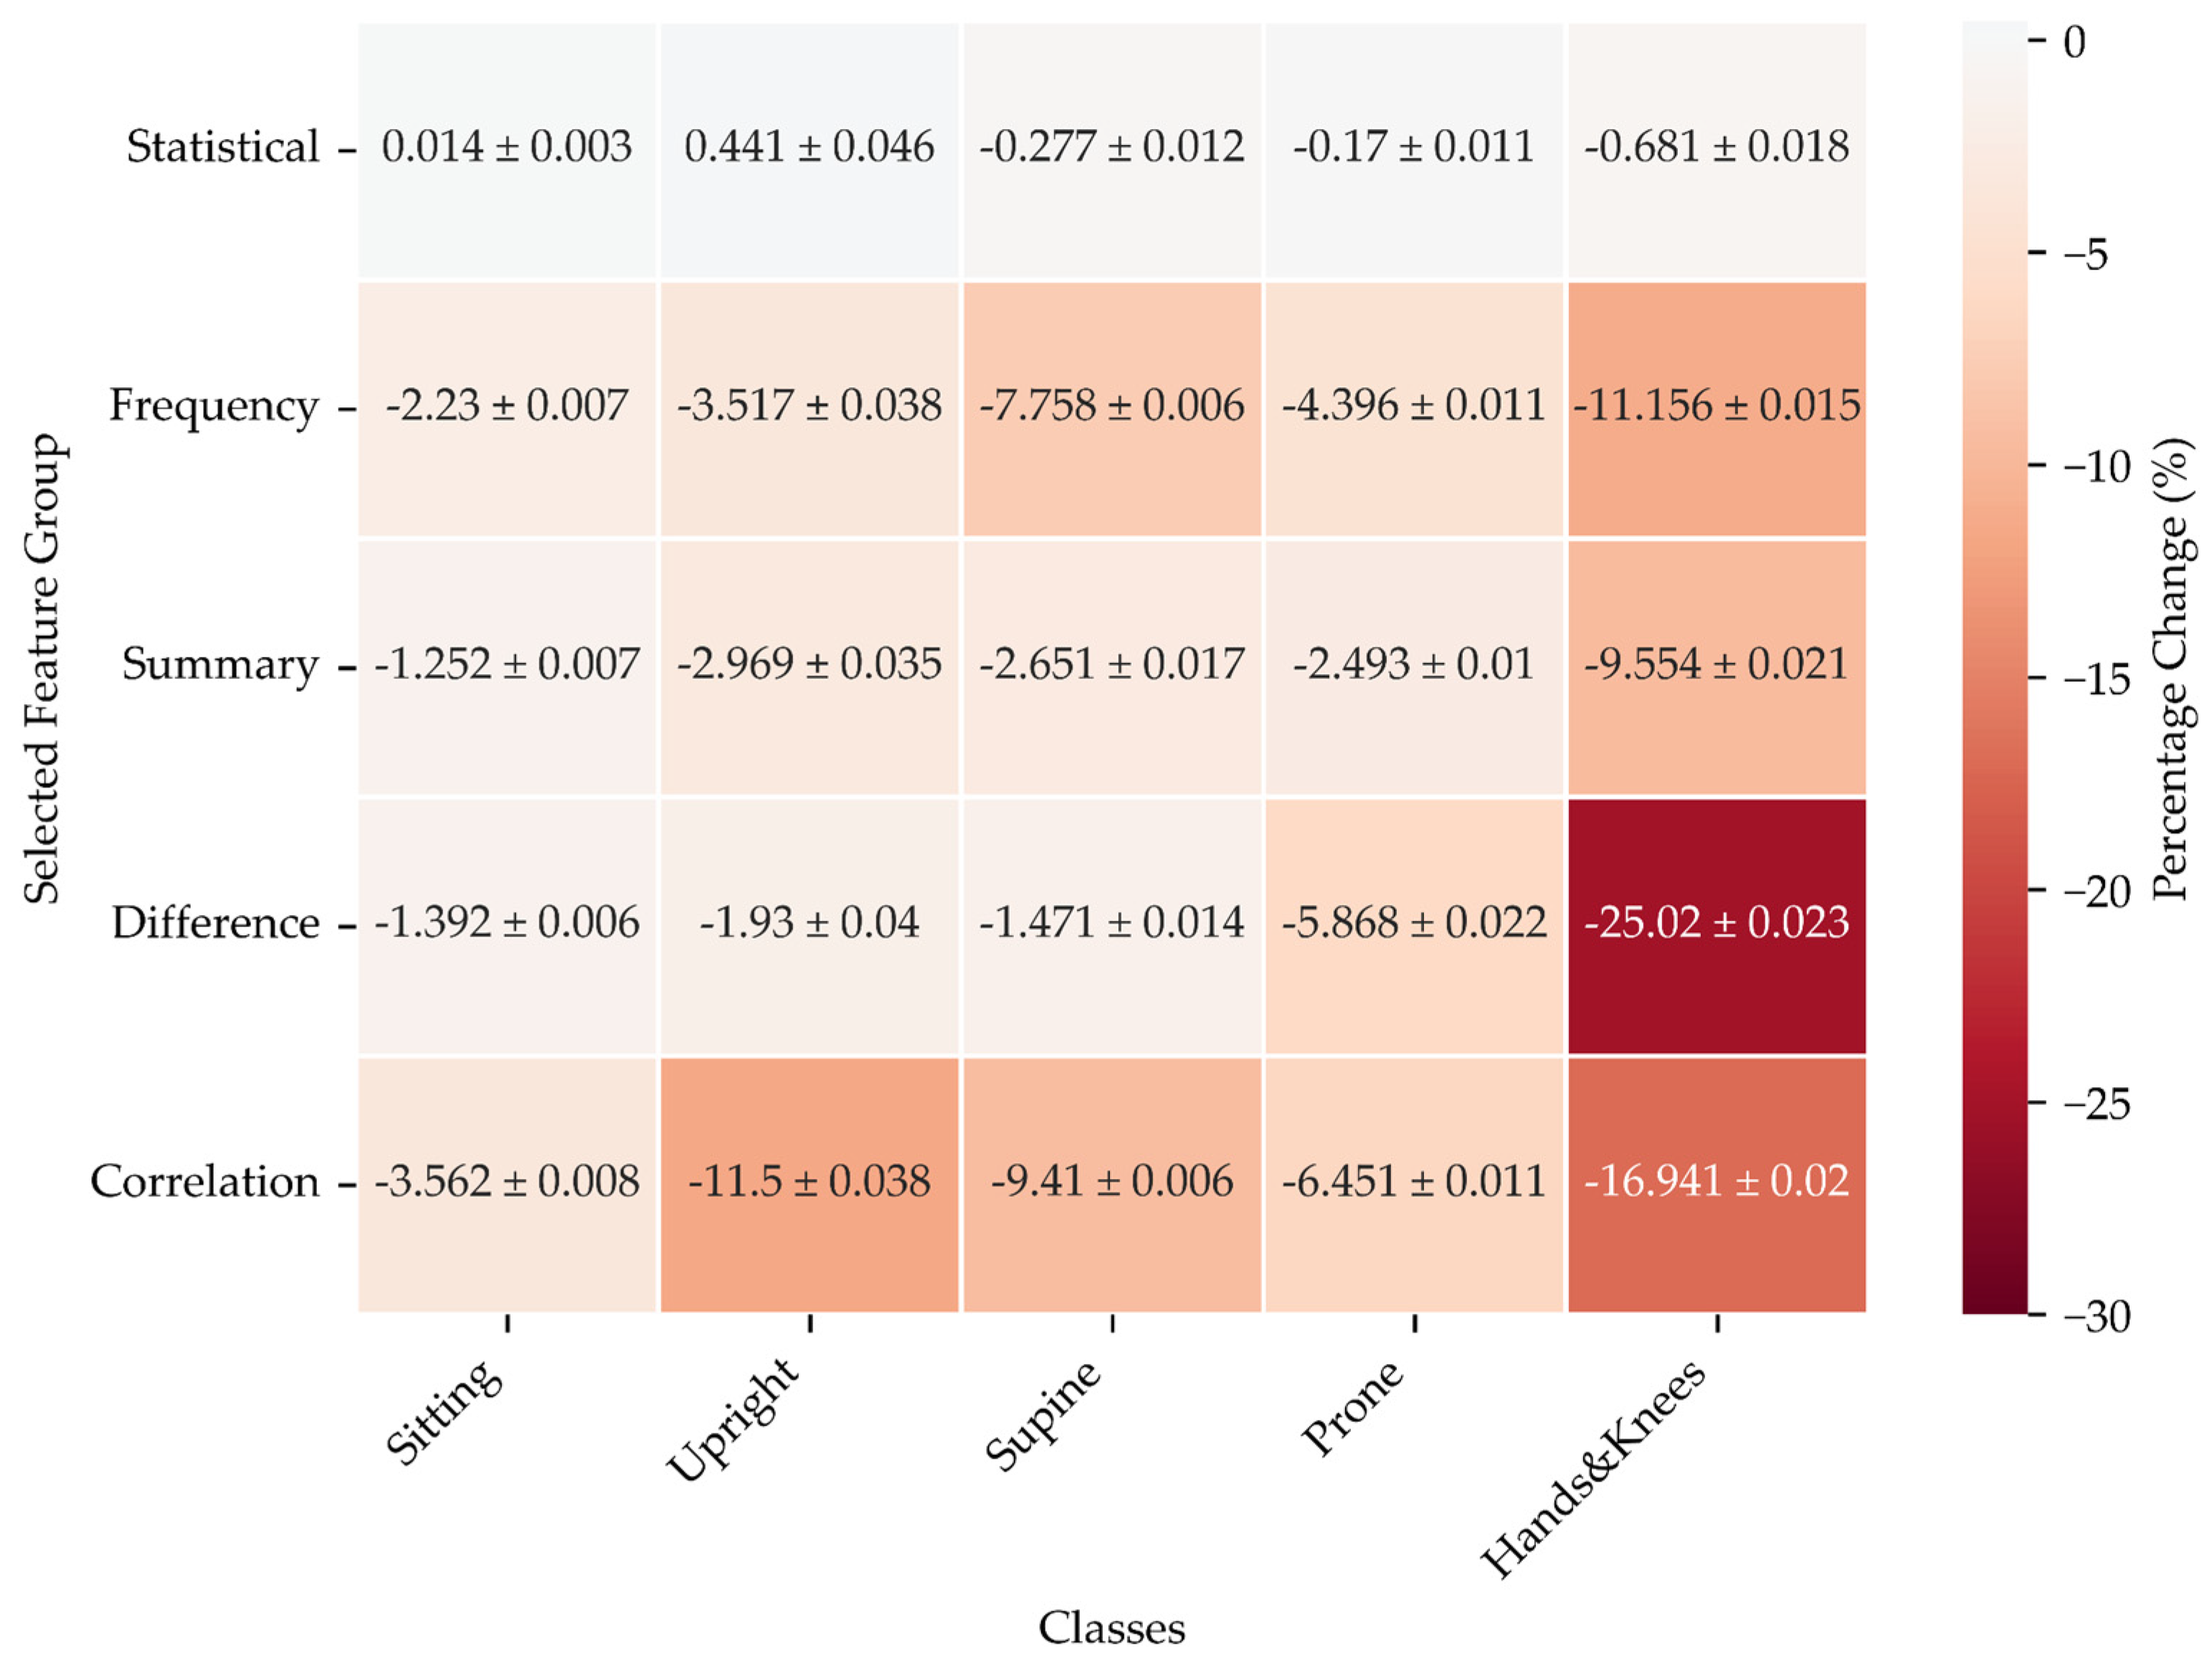
The results depicted in
Figure 9 reveal how the performance of a model, measured through F1 scores, changes when using only one feature group at a time compared to a model using all available features.
For Statistical features, the differences are relatively small, with the model showing slight improvements or declines depending on the position. The upright position, in particular, shows a modest increase, while other positions experience minor decreases or nearly no change.
In contrast, using only Frequency features consistently leads to a drop in F1 scores across all positions. The model performs significantly worse when only frequency-related features are used, particularly for more complex positions like Hands&Knees or Supine. That suggests that frequency information alone cannot capture the full complexity of these positions.
The Summary features follow a similar trend as Frequency features, with a negative impact on performance, though the changes are not as drastic as those seen for Frequency features. Positions like Supine and Prone are particularly affected, where the model struggles to maintain accuracy when relying solely on summary data.
Restricting the input to Difference features produces some of the most significant declines in performance, especially for challenging positions like Hands&Knees. That indicates that the Difference-based features, though valuable in some contexts, may not capture the full scope of the data needed to classify positions accurately.
Finally, limiting the input solely to the Correlation features shows a consistent negative impact across all positions, with Upright and Hands&Knees again standing out as the most affected. The reliance on correlation alone seems insufficient to maintain high performance, suggesting that it plays a supplementary rather than a primary role in body position classification.
Excluding a Single Feature Group
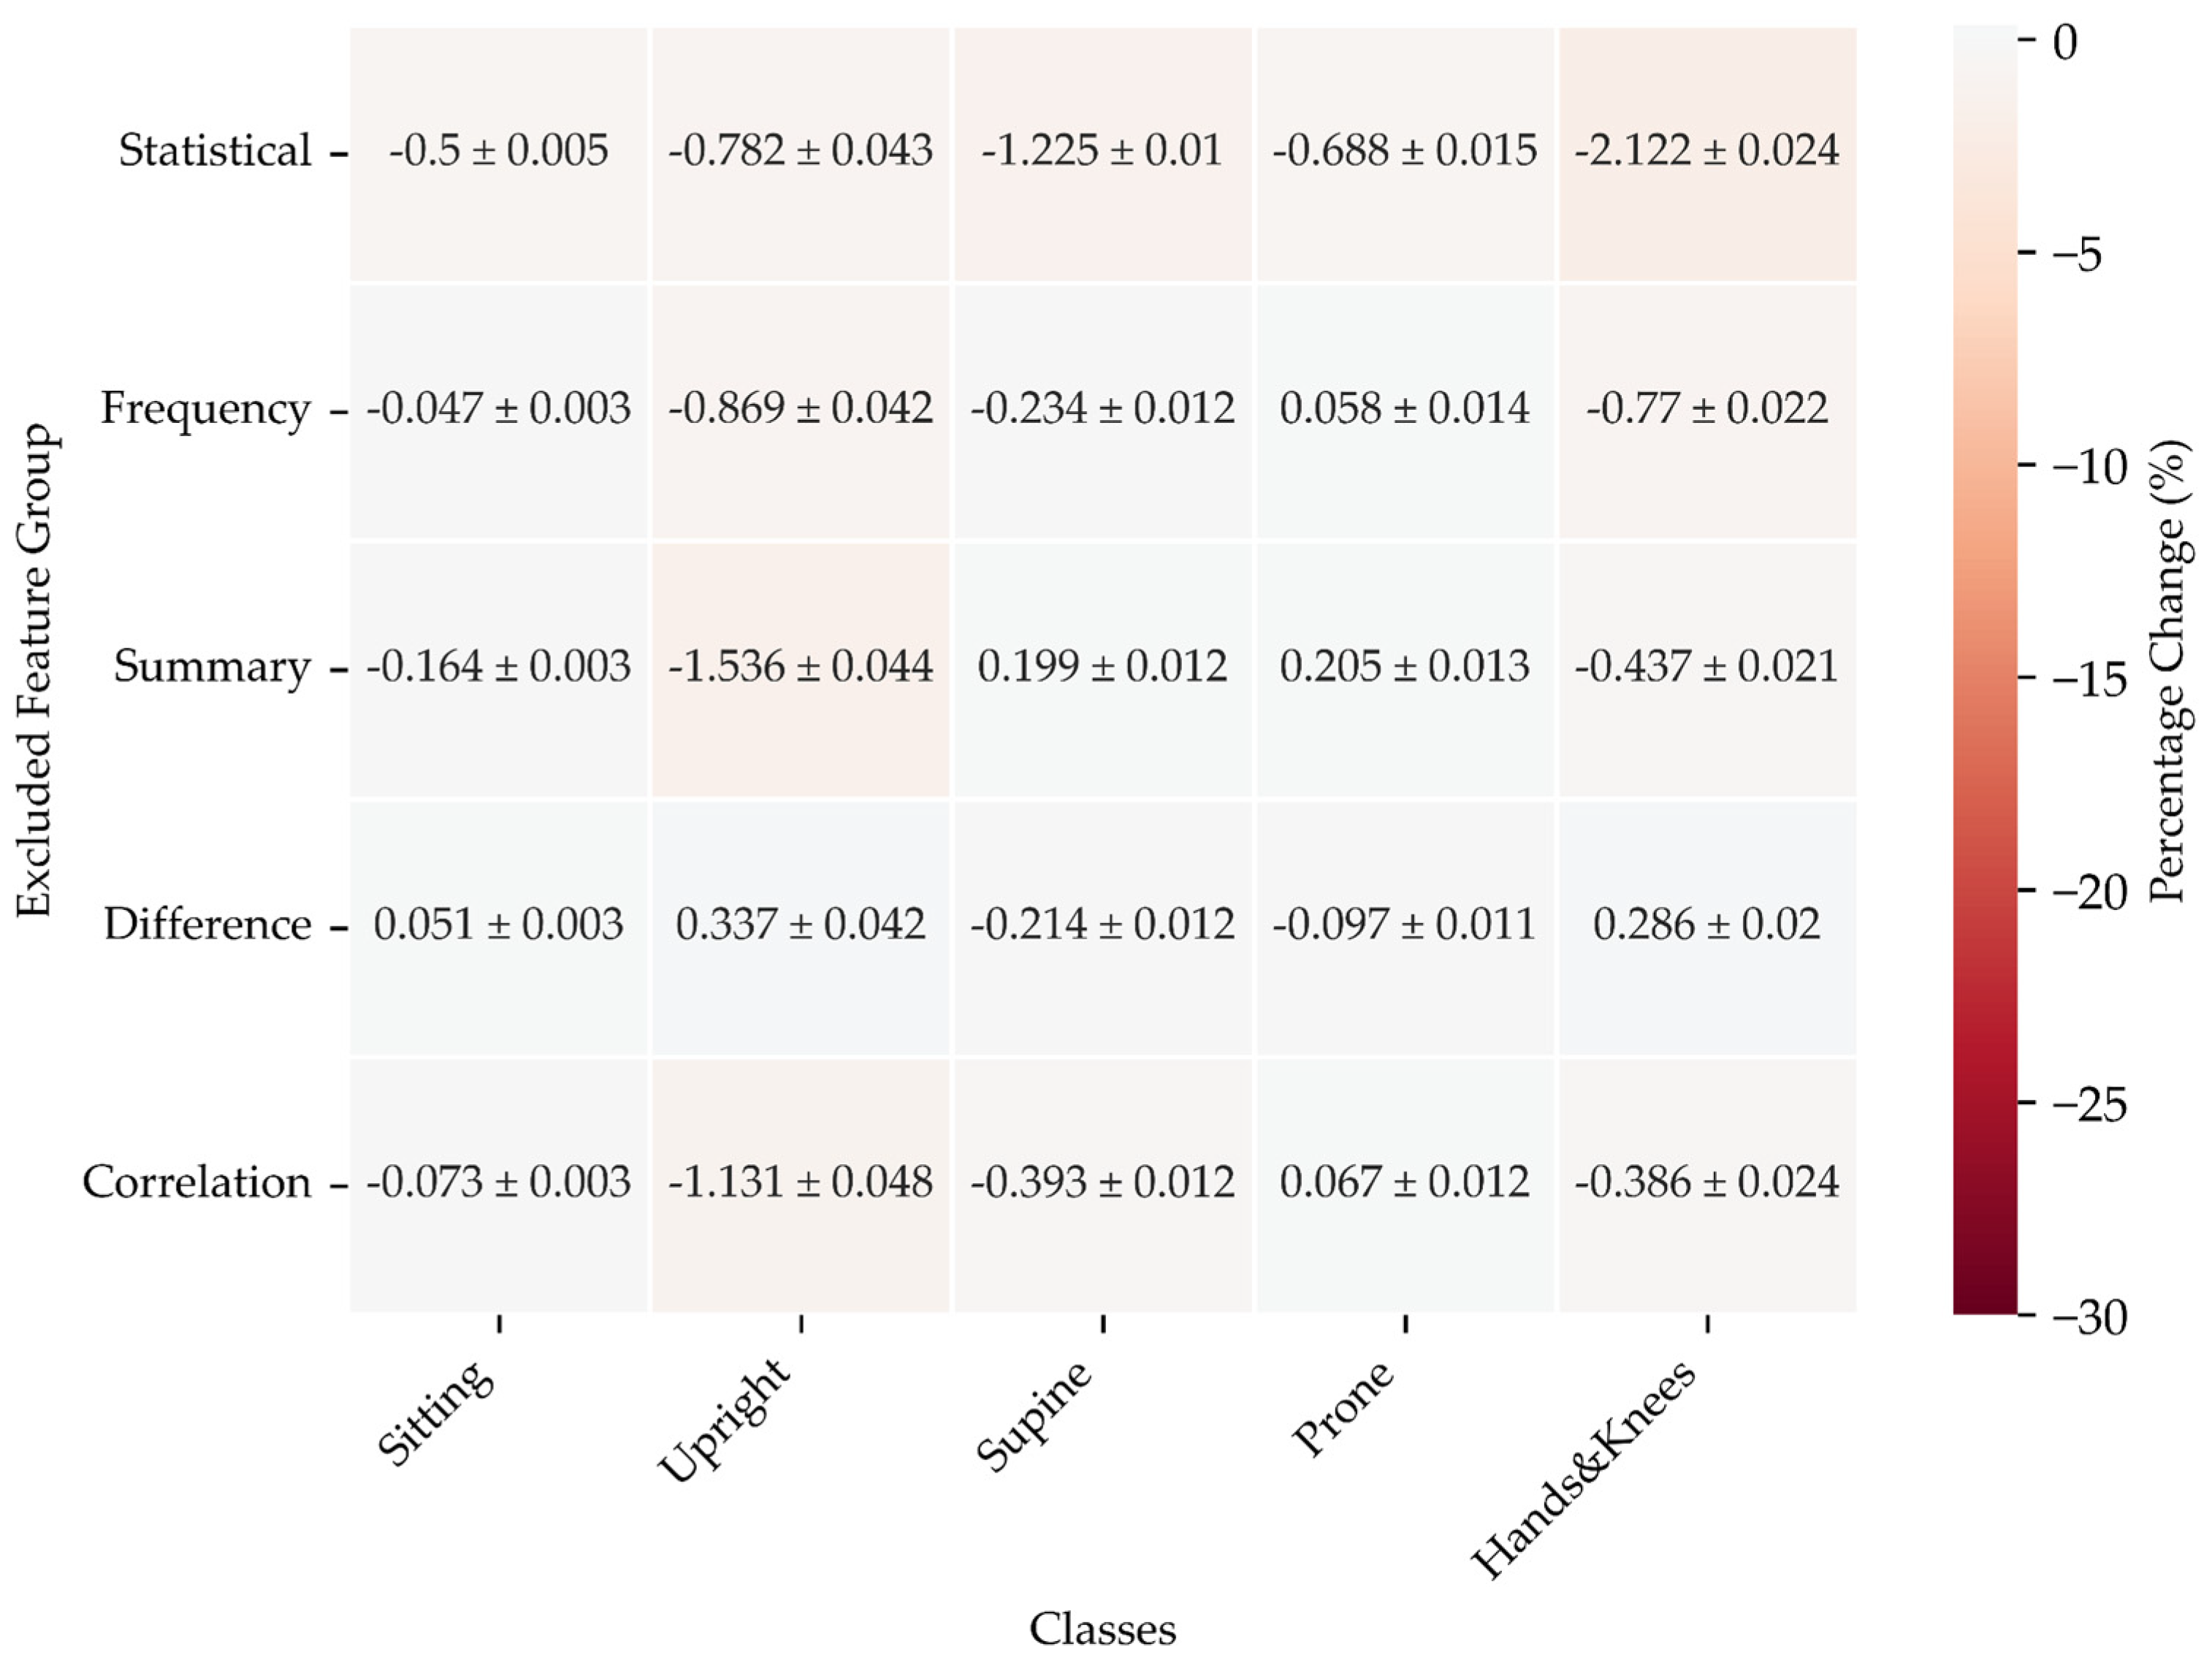
For the Sitting position, omitting Statistical features leads to a slight reduction in the F1 score, while excluding Frequency has minimal impact. Notably, removing the Summary results in a noticeable decline, whereas omitting the Difference yields a marginal improvement.
In the Upright position, excluding Statistical and Frequency features significantly lowers the F1 score, with Summary causing a considerable drop. Conversely, omitting Difference enhances the score.
For the Supine position, excluding Statistical features results in a marked reduction, while removing the Summary leads to an improvement. The impact of omitting other features is minimal.
In the Prone position, excluding Statistical features causes a moderate drop, while the absence of Frequency provides a slight improvement. The Summary removal results in a small gain.
Finally, for the Hands & Knees position, excluding Statistical features leads to a significant drop, with Frequency also causing a considerable decrease. However, omitting Difference slightly enhances the score.
Overall, the most notable impacts arise from the exclusion of Statistical and Summary features across various positions.
3.2.3. SHAP Values
The analysis of SHAP values reveals a compelling hierarchy in the influence of various feature groups on the model's predictions. Statistical features emerge as the most important, commanding the highest total |SHAP| values. This finding underscores their dominant role in shaping model outcomes. Difference features follow closely, contributing significantly, though to a somewhat lesser extent.
Alternatively, the Correlation and Summary features exhibit a more subdued influence, while the Frequency group ranks lowest in impact. When considering sensor contributions, accelerometer signals are the most critical, playing a pivotal role in enhancing model performance, followed closely by the magnetometer signals. On the other hand, gyroscope signals contribute the least to the model's predictive capacity.
The distribution pattern of the most significant sum of |SHAP| values remains consistent across all examined positions. The most pronounced influence is observed in the low-pass filtered data from the accelerometer’s Statistical features. For further details, refer to
Figure 11.
Mean |SHAP| values (see
Figure 12) serve as a valuable tool for comparing the typical effects of features, especially given the varying sizes of feature groups. The signals from Pitch and Roll emerge as significant, particularly when combined with Difference, Statistical, and Summary features.
Notably, similar to the pattern observed with summed |SHAP| values, the distribution of the most significant mean |SHAP| values remains consistent across all examined positions. The combination of Pitch and Summary features exhibits the strongest influence, underscoring their critical role in enhancing the model's overall performance.
3.2.4. Correlation between Manually Annotated and Predicted Time in a Given Body Position
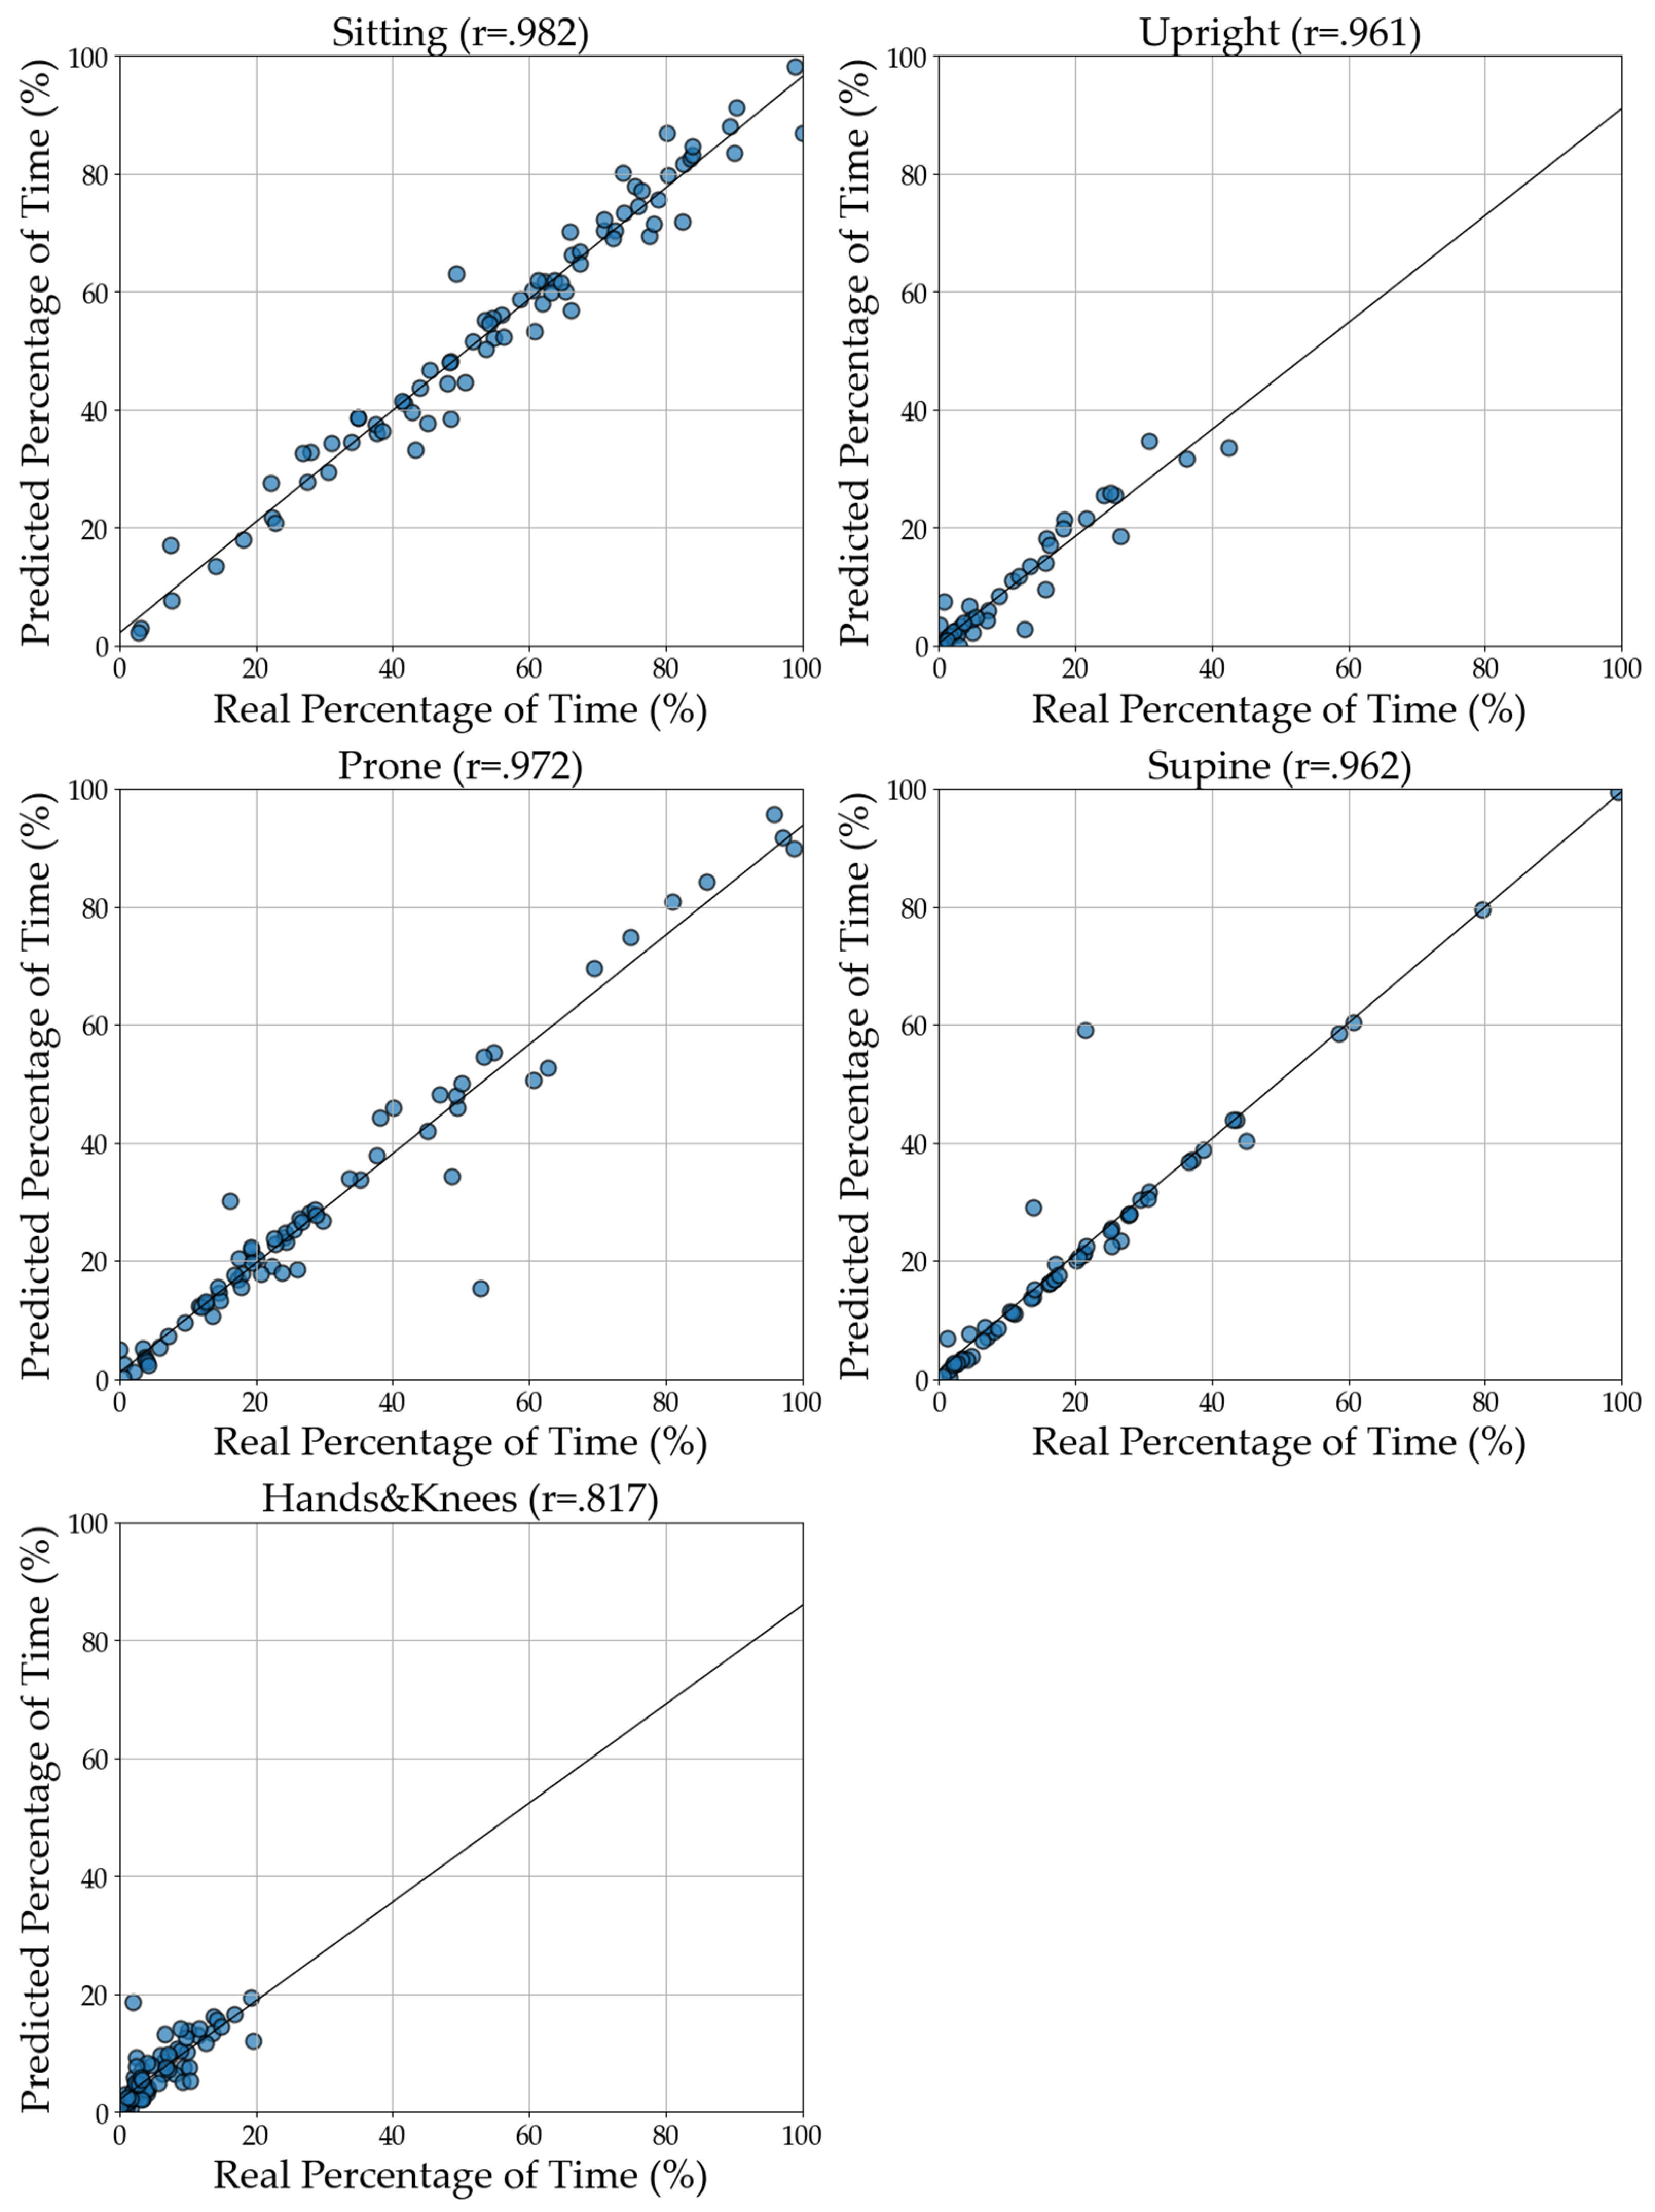
In
Figure 13, we illustrated the correlation between the annotated, actual, and predicted time spent in five distinct positions across study sessions for five positions. The strongest correlations occur for Supine (r = .99) and Sitting (r = .93). Prone and Upright also exhibit very high correlations (both r = .92). The lowest predicted time spent in a single position is for Hands and Knees, with a correlation of r = .76.
Among the three activities (tasks), the weakest correlation is for the Manipulative task, followed by the Book-sharing task. In contrast, the Rattles task (r ranges from .89 to .99) demonstrates the most accurate predictions for time spent in each position using CatBoost. Notably, Rattles is the only task that contributed data from all four time points, providing the most comprehensive dataset to fit correlations between annotated data and machine learning predictions. However, it is essential to note that not all tasks and time points are accompanied by corresponding annotation data.
4. Discussion
In this study, we developed an automatic system for classifying infants’ body positions during naturalistic interactions with caregivers across the first year of life using data collected with Inertial Motion Units consisting of accelerometers, magnetometers, and gyroscopes. The classification was conducted on the basis of manually annotated video recordings. The body position classification from IMU sensor data was conducted using two different types of classifiers: Random Forest Classifier and CatBoost Classifier.
We adopted an approach that employs 2-second activity windows with a 1-second overlap, as recommended by Banos et al. [
44], which is relatively short compared to other studies [
29]. This methodology enhances the accuracy of our results. We evaluated our classifier using three pairs of sensors placed on different body parts: Trunk, Legs, and Arms. Initially, we tested these sensor pairs, and subsequently, we analysed how different configurations of sensor pairs influenced classification accuracy using the following subsets: Trunk, Trunk & Legs, and Trunk, Legs, & Arms. The most promising results came from the Trunk & Legs configuration, likely due to the involvement of arms in task-related activities and object manipulation, regardless of the body position.
Although Random Forest is a well-established classification method, the superior performance of CatBoost in this study highlights the advantages of leveraging advanced algorithms that can better capture complex relationships in the data. CatBoost's ability to handle nonlinear interactions between features made it better suited for this task, especially in capturing subtle distinctions across positions. This comparison highlights the potential of more sophisticated models to improve classification accuracy.
One of our key goals was to understand which parameters or feature groups contribute most to accurate position classification. Our findings indicate that certain feature groups are more effective at capturing specific positions. However, the model performs best when all feature groups are used together, highlighting that combining different types of hand-crafted features is essential for achieving optimal accuracy across various positions. Excluding features such as Difference, Frequency, and Correlation significantly impacts the classification of Prone and Supine. Interestingly, although Hands&Knees is a more dynamic position than Prone and Supine, the removal of these features still negatively affects its classification. Statistical and Summary features have a smaller impact, primarily influencing stable positions like Sitting and Upright. Exclusions of feature groups affect F1 scores differently across positions. The Upright position, which requires the most features, is particularly susceptible to exclusions, showing notable performance drops when omitting Statistical and Frequency features. Removing the Summary feature generally leads to a significant decrease in performance, while excluding Difference features often results in modest improvements. The absence of Correlation features typically causes a slight decline.
The analysis of |SHAP| values reveals a clear hierarchy among feature groups, with statistical features emerging as the most influential in shaping model predictions. Their high total sum |SHAP| values indicate a dominant role in model performance, closely followed by Difference features. In contrast, Correlation and Summary features contribute less, while the Frequency group has the least impact.
Among sensor contributions, accelerometer signals prove to be the most critical for enhancing model accuracy, with magnetometer signals also playing a role. Gyroscope signals, however, contribute minimally to predictive capacity. The distribution pattern of the most significant summed |SHAP| values remains consistent across all examined positions, particularly highlighting the strong influence of low-pass filtered data from the accelerometer's statistical features. Focusing on static position is particularly important in contexts where infants maintain specific positions to manipulate objects effectively in task-oriented experiments. However, when distinguishing between dynamic positions, the gyroscope's role becomes essential, as it provides real-time data on rotational movements and angular velocities, significantly enhancing classification accuracy in various dynamic scenarios.
Moreover, mean |SHAP| values provide valuable insights into the typical effects of features, especially given the uneven sizes of feature groups. In this sense, signals from Pitch and Roll are particularly significant, especially when combined with Difference, Statistical, and Summary features. The combination of Pitch and Summary features demonstrates the strongest influence, further emphasising their essential role in enhancing the model's overall performance.
The Hands&Knees position, characterised by a limited number of instances, primarily functions as a transitional position within infants' movement patterns, resulting in lower classification scores. However, the predicted time in this position still shows a good correlation with the actual time spent in this position. Feature selection plays a crucial role in this process. We incorporated Roll and Pitch angles from the accelerometer as intuitive parameters, significantly enhancing the accuracy of our automatic annotations.
Manual annotation offers frame-by-frame precision, achieving an accuracy of 0.04 seconds per frame at 25 frames per second. In our case, automatic annotation involves analysing signals in windows of up to 2 seconds with a 1-second shift, which can affect accuracy. The length of the time window for analysis directly impacts classification quality. Shorter windows may be more sensitive to positional changes but could result in a loss of contextual information. Conversely, longer windows might better capture context but are likely less precise regarding dynamic changes.
Determining whether to train the classifier using the entire activity window or a portion, such as 75%, is essential for optimising performance. Different activities influence accelerometer signals, leading to varied patterns of acceleration and variability. By adjusting the window length and shift interval, we can enhance the accuracy of automatic classification, facilitating more detailed analysis and statistical evaluation.
For static positions, using the longest window length proved most effective, allowing us to identify Sitting, Prone, and Upright positions with over 90% accuracy.
Our results significantly surpass those reported in a recent review, which indicated wide variability in accuracy across different positions. This underscores the effectiveness of our methodology in achieving reliable position classification in a challenging environment.
It is also worth noting that dynamic positions, such as walking or running, tend to exhibit lower accuracy rates compared to static positions. This variability is expected, given the complexity and range of movements involved in dynamic actions, making consistent and accurate classification more challenging. To further refine our system, developing a classifier that distinguishes between static and dynamic positions would be beneficial. This could improve precision, as different classification strategies might be required for various positions.
Sensor placement also significantly impacts classifier accuracy. For instance, placing sensors on the wrists—typically involved in fine motor activities—can provide data specific to small-scale movements. However, if the classifier does not account for these movements, it may misinterpret the data, affecting overall position classification.
Furthermore, the fact that the classification was conducted jointly on data collected across a wide range of ages (4, 6, 9 and 12 months) and types of play facilitates the application of this methodology to infants with developmental difficulties. By concentrating on more universal patterns of behaviour regardless of age, researchers can more effectively capture diverse postural behaviours and movements of infants, who often do not adhere to typical developmental timelines. This flexibility enhances the relevance of the findings and allows for more tailored interventions that meet individual needs. Infants with motor delay display less mature positions than typically developing infants, which may result in fewer learning opportunities [
45]. However, whether such differences could also be observed on longer time scales and during more naturalistic settings is unknown. Previous research highlighted the potential use of wearable motion tracking in monitoring infants’ physical activity levels [
46], very early assessment of infant neurodevelopmental status in low-resource settings [
47] and developing rehabilitation for infants with cerebral palsy [
48]. Automatic classification of positions based on wearable motion trackers – potentially combined with other types of sensors as demonstrated for general movement assessment by Kulvicius et al.[
49] – can result in more personalised approaches to early diagnosis and intervention.
Our study focuses on classifying infants' positions using a specific dataset and methodology, which may introduce certain biases, even under controlled conditions. While maintaining these conditions is crucial, having clean and well-prepared training datasets may be more advantageous.
Finally, the adequacy and reliability of manual annotation protocol is critical. Different research aims may require more fine-grained categorisation of infant body position and locomotion.
5. Conclusions
Our study has significant scientific and practical implications for monitoring infants' motor development. By employing shorter activity windows and incorporating frequency domain parameters, we have enhanced the accuracy of position classification. The superior performance of advanced algorithms, such as CatBoost, underscores the importance of sophisticated techniques in capturing complex relationships within the data.
Our findings indicate that statistical features, particularly those derived from accelerometer data, are crucial for differentiating body positions. Additionally, magnetometer data has proven to be useful in enhancing the accuracy of this differentiation. This capability facilitates the early detection of developmental delays, enabling timely interventions that can greatly benefit at-risk infants.
Furthermore, the integration of orientation-related data, including Roll and Pitch signals, contributes to improved classification accuracy. The insights garnered from this study support the development of wearable motion-tracking systems, which can enhance monitoring and early diagnosis in both community and clinical settings.
Future research should focus on validating these findings using different datasets collected under varied conditions and exploring additional sensor integrations to refine and expand the capabilities of position classification systems. By doing so, we can further advance our understanding of infant motor development and improve outcomes for those in need of intervention.
Author Contributions
Conceptualization: JD-G, AR, JŻ Methodology: JD-G, AR, JŻ Visualisation: AR, JD-G Software: AR Supervision: JŻ, PT Investigation: ZL Data Curation: JD-G, AR, ZL Writing original draft: JD-G, AR, JŻ Writing review & editing: JD-G, AR, JŻ, PT, ZL Funding acquisition: PTAll authors have read and agreed to the published version of the manuscript. The authors acknowledge the crucial contribution of Agata Kozioł and Oleksandra Mykhailova to developing the body position manual coding scheme. The authors would also like to thank the annotators who worked on this project: Barbara Żygierewicz, Agata Skibińska, Oleksandra Mykhailova, Julia Barud, Julia Kulis, Julia Mórawska, Natalia Stróżyńska, Weronika Araszkiewicz, Marta Stawiska.
Funding
This research has been funded by the Polish National Science Centre (data collection and wearable preprocessing was funded by grant no. 2018/30/E/HS6/00214, PT, while the data analysis was partially supported by grant no. 2022/47/B/HS6/02565, PT).
Institutional Review Board
The study was conducted in accordance with the Declaration of Helsinki and approved by the Ethics Committee of the Institute of Psychology, Polish Academy of Sciences (No. 10IV/2020).
Informed Consent Statement
Written informed consent was obtained from the participant’s legal guardian/next of kin for the publication of any potentially identifiable images or data included in this article.
Data Availability Statement
Acknowledgments
We extend our sincere gratitude to all the infants and their families for their commitment and valuable contributions to this study.
Conflicts of Interest
The authors declare that they have no competing interests.
Appendix B
Figure 1.
Illustration of the correlation between the annotated (actual) and predicted time spent in five distinct positions across study sessions. The x-axis represents the real percentage of time spent in each position, while the y-axis shows the corresponding predicted percentage. Each point in the plot corresponds to a specific infant in a position during one study session, with a line of best fit illustrating the correlation between the real and predicted values. The closer the points align with the line, the more accurate the predictions. Based on the model for two pairs of sensors: Trunk & Legs.
References
- Laudańska, Z.; López Pérez, D.; Radkowska, A.; Babis, K.; Malinowska-Korczak, A.; Wallot, S.; Tomalski, P. Changes in the Complexity of Limb Movements during the First Year of Life across Different Tasks. Entropy 2022, 24(4), 552. [CrossRef]
- Kretch, K. S.; Franchak, J. M.; Adolph, K. E. Crawling and Walking Infants See the World Differently. Child Dev. 2013, 85(4), 1503–1518. [CrossRef]
- Bouten, C. V.; Westerterp, K. R.; Verduin, M.; Janssen, J. Assessment of Energy Expenditure for Physical Activity Using a Triax—AI. Age (Yr) 1994, 23(1.8), 21–27.
- Najafi, B.; Aminian, K.; Loew, F.; Blanc, Y.; Robert, P. A. Measurement of Stand-Sit and Sit-Stand Transitions Using a Miniature Gyroscope and Its Application in Fall Risk Evaluation in the Elderly. IEEE Trans. Biomed. Eng. 2002, 49(8), 843–851. [CrossRef]
- Qiang, L.; Stankovic, J. A.; Hanson, M. A.; Barth, A. T.; Lach, J.; Gang, Z. Accurate, Fast Fall Detection Using Gyroscopes and Accelerometer-Derived Posture Information. In Proc. Sixth Int. Workshop Wearable Implantable Body Sens. Networks; IEEE: Berkeley, CA, USA, 3–5 June 2009; pp. 138–143. [CrossRef]
- Bianchi, F.; Redmond, S. J.; Narayanan, M. R.; Cerutti, S.; Celler, B. G.; Lovell, N. H. Falls Event Detection Using Triaxial Accelerometry and Barometric Pressure Measurement. In Proc. Annu. Int. Conf. IEEE Eng. Med. Biol. Soc.; IEEE: Minneapolis, MN, USA, 3–6 September 2009; pp. 6111–6114. [CrossRef]
- Ohtaki, Y.; Susumago, M.; Suzuki, A.; Sagawa, K.; Nagatomi, R.; Inooka, H. Automatic Classification of Ambulatory Movements and Evaluation of Energy Consumptions Utilising Accelerometers and a Barometer. Microsyst. Technol. 2005, 11, 1034–1040. [CrossRef]
- Wang, J.; Redmond, S. J.; Voleno, M.; Narayanan, M. R.; Wang, N.; Cerutti, S.; Lovell, N. H. Energy Expenditure Estimation During Normal Ambulation Using Triaxial Accelerometry and Barometric Pressure. Physiol. Meas. 2012, 33(11), 1811–1830. [CrossRef]
- Altun, K.; Barshan, B. Human Activity Recognition Using Inertial/Magnetic Sensor Units. In Hum. Behav. Unders; Salah, A. A., Gevers, T., Sebe, N., Vinciarelli, A., Eds.; Springer: 2010; Vol. 6219, pp. 38–51. [CrossRef]
- Bamberg, S. J. M.; Benbasat, A. Y.; Scarborough, D. M.; Krebs, D. E.; Paradiso, J. A. Gait Analysis Using a Shoe-Integrated Wireless Sensor System. IEEE Trans. Inf. Technol. Biomed. 2008, 12(4), 413–423. [CrossRef]
- Preece, S. J.; Goulermas, J. Y.; Kenney, L. P. J.; Howard, D. A Comparison of Feature Extraction Methods for the Classification of Dynamic Activities from Accelerometer Data. IEEE Trans. Biomed. Eng. 2009, 56(3), 871–879. [CrossRef]
- Ferrari, A.; Micucci, D.; Mobilio, M.; Napoletano, P. Human Activities Recognition Using Accelerometer and Gyroscope. In Proc. 2019; Springer Int. Publ.: Cham, Switzerland, 2019; pp. 357–362. [CrossRef]
- Franchak, J. M.; Scott, V.; Luo, C. A Contactless Method for Measuring Full-Day, Naturalistic Motor Behavior Using Wearable Inertial Sensors. Front. Psychol. 2021, 12, 701343. [CrossRef]
- Zhao, W.; Adolph, A. L.; Puyau, M. R.; Vohra, F. A.; Butte, N. F.; Zakeri, I. F. Support Vector Machines Classifiers of Physical Activities in Preschoolers. Physiol. Rep. 2013, 1(3), e00006. [CrossRef]
- Gjoreski, H.; Gams, M. Accelerometer Data Preparation for Activity Recognition. In Proc. Int. Multiconf. Inf. Soc.; Ljubljana, Slovenia, 10–14 October 2011.
- Airaksinen, M.; Gallen, A.; Kivi, A.; Vijayakrishnan, P.; Häyrinen, T.; Ilén, E.; Räsänen, O.; Haataja, L. M.; Vanhatalo, S. Intelligent Wearable Allows Out-of-the-Lab Tracking of Developing Motor Abilities in Infants. Commun. Med. 2022, 2(1), 69. [CrossRef]
- Airaksinen, M.; Räsänen, O.; Ilén, E.; Häyrinen, T.; Kivi, A.; Marchi, V.; Gallen, A.; Blom, S.; Varhe, A.; Kaartinen, N.; Haataja, L.; Vanhatalo, S. Automatic Posture and Movement Tracking of Infants with Wearable Movement Sensors. Sci. Rep. 2020, 10(1), 1–12. [CrossRef]
- Taylor, E.; Airaksinen, M.; Gallen, A.; Immonen, T.; Ilén, E.; Palsa, T.; Haataja, L.; Vanhatalo, S. Quantified Assessment of Infant's Gross Motor Abilities Using a Multisensor Wearable. J. Vis. Exp. 2024, 207, e65949. [CrossRef]
- Pirttikangas, S.; Fujinami, K.; Seppanen, T. Feature Selection and Activity Recognition from Wearable Sensors. In Proc. Third Int. Symp. Ubiquitous Comput. Syst.; Springer: Seoul, Korea, 11–13 October 2006; Vol. 4239, pp. 516–527. [CrossRef]
- Wang, J. H.; Ding, J. J.; Chen, Y.; Chen, H. H. Real-Time Accelerometer-Based Gait Recognition Using Adaptive Windowed Wavelet Transforms. In Proc. IEEE Asia Pac. Conf. Circuits Syst.; Kaohsiung, Taiwan, 2–5 December 2012; pp. 591–594. [CrossRef]
- Mannini, A.; Intille, S.S.; Rosenberger, M.; Sabatini, A.M.; Haskell, W. Activity Recognition Using a Single Accelerometer Placed at the Wrist or Ankle. Med. Sci. Sports Exerc. 2013, 45(11), 2193–2203. [CrossRef]
- Stikic, M.; Huynh, T.; van Laerhoven, K.; Schiele, B. ADL Recognition Based on the Combination of RFID and Accelerometer Sensing. In Proc. Second Int. Conf. Pervasive Comput. Technol. Healthc.; Tampere, Finland, 30 January–1 February 2008; pp. 258–263. [CrossRef]
- Figo, D.; Diniz, P.C.; Ferreira, D.R.; Cardoso, J.M. Preprocessing techniques for context recognition from accelerometer data. Pers. Ubiquitous Comput. 2010, 14, 645–662. [CrossRef]
- Jasiewicz, J. M.; Allum, J. H. J.; Middleton, J. W.; Barriskill, A.; Condie, P.; Purcell, B.; Li, R. C. T. Gait Event Detection Using Linear Accelerometers or Angular Velocity Transducers in Able-Bodied and Spinal-Cord Injured Individuals. Gait Posture 2006, 24, 502–509. [CrossRef]
- Laudańska, Z.; López Pérez, D.; Kozioł, A.; Radkowska, A.; Babis, K.; Malinowska-Korczak, A.; Tomalski, P. Longitudinal Changes in Infants’ Rhythmic Arm Movements during Rattle-Shaking Play with Mothers. Front. Psychol. 2022, 13. [CrossRef]
- Maurer, U.; Smailagic, A.; Siewiorek, D.; Deisher, M. Activity Recognition and Monitoring Using Multiple Sensors on Different Body Positions. In Proc. Int. Workshop Wearable Implantable Body Sensor Networks; Cambridge, MA, USA, 3–5 April 2006; pp 113–116. [CrossRef]
- Parkka, J.; Ermes, M.; Korpipaa, P.; Mantyjarvi, J.; Peltola, J.; Korhonen, I. Activity classification using realistic data from wearable sensors. IEEE Trans. Inf. Technol. Biomed. 2006, 10, 119–128. [CrossRef]
- Chakravarthi, B.; Prabhu Prasad, B. M.; Chethana, B.; Kumar, B. N. P. Real-Time Human Motion Tracking and Reconstruction Using IMU Sensors. In Proc. 2022 Int. Conf. Electr. Comput. Energy Technol. (ICECET); Prague, Czech Republic, 2022; pp 1–5. [CrossRef]
- Hendry, D.; Rohl, A. L.; Rasmussen, C. L.; Zabatiero, J.; Cliff, D. P.; Smith, S. S.; ...; Campbell, A. Objective Measurement of Posture and Movement in Young Children Using Wearable Sensors and Customized Mathematical Approaches: A Systematic Review. Sensors 2023, 23(24), 9661. [CrossRef]
- Sennheiser. e 914. Sennheiser. https://en-us.sennheiser.com/instrument-microphone-studio-recording-music-e-914.
- Chow, J. C.; Hol, J. D.; Luinge, H. Tightly-Coupled Joint User Self-Calibration of Accelerometers, Gyroscopes, and Magnetometers. Drones 2018, 2(1), 6. [CrossRef]
- Xsens Technologies B.V. MTw Awinda. Xsens Technologies B.V. https://www.xsens.com/products/awinda.
- Paulich, M.; Schepers, M.; Rudigkeit, N.; Bellusci, G. Xsens MTw Awinda: Miniature Wireless Inertial-Magnetic Motion Tracker for Highly Accurate 3D Kinematic Applications. In Proc. IEEE/ASME Int. Conf. Adv. Intell. Mechatronics (AIM); Auckland, New Zealand, 9–12 July 2018.
- Thurman, S.L.; Corbetta, D. Spatial exploration and changes in infant-mother dyads around transitions in infant locomotion. Dev. Psychol. 2017, 53(7), 1207. [CrossRef]
- Yumang, A. N.; Rupido, C. S.; Panelo, F. V. Analyzing Effects of Daily Activities on Sitting Posture Using Sensor Fusion with Mahony Filter. In Proc. 2023 IEEE 15th Int. Conf. Humanoid, Nanotechnology, Inf. Technol., Commun. Control, Environ. Manag. (HNICEM); Coron, Palawan, Philippines, 2023; pp 1–6. [CrossRef]
- Xu, M.; Goldfain, A.; Chowdhury, A. R.; DelloStritto, J. Towards Accelerometry Based Static Posture Identification. In Proc. 2011 IEEE Consumer Commun. Networking Conf. (CCNC); IEEE: Las Vegas, NV, USA, 2011; pp 29–33. [CrossRef]
- Franchak, J.M.; Tang, M.; Rousey, H.; Luo, C. Long-form recording of infant body position in the home using wearable inertial sensors. Behav. Res. Methods 2023, 1-20. [CrossRef]
- Trost, S.G.; Cliff, D.P.; Ahmadi, M.N.; Tuc, N.V.; Hagenbuchner, M. Sensor-enabled activity class recognition in preschoolers: Hip versus wrist data. Med. Sci. Sports Exerc. 2018, 50, 634–641. [CrossRef]
- Ahmadi, M.N.; Pavey, T.G.; Trost, S.G. Machine learning models for classifying physical activity in free-living preschool children. Sensors 2020, 20, 5. [CrossRef]
- Pedregosa, F.; Varoquaux, G.; Gramfort, A.; Michel, V.; Thirion, B.; Grisel, O.; Blondel, M.; Prettenhofer, P.; Weiss, R.; Dubourg, V.; Vanderplas, J.; Passos, A.; Cournapeau, D.; Brucher, M.; Perrot, M.; Duchesnay, E. Scikit-learn: Machine Learning in Python. J. Mach. Learn. Res. 2011, 12, 2825–2830.
- Prokhorenkova, L.; Gusev, G.; Vorobev, A.; Dorogush, A. V.; Gulin, A. CatBoost: Unbiased Boosting with Categorical Features. In Proc. 32nd Int. Conf. Neural Inf. Process. Syst.; Montréal, Canada, 3–8 December 2018. [CrossRef]
- Olson, R. S.; La Cava, W.; Mustahsan, Z.; Varik, A.; Moore, J. H. Data-Driven Advice for Applying Machine Learning to Bioinformatics Problems. In Proc. Biocomputing 2018; Kohala Coast, Hawaii, USA, 3–7 January 2018; pp 192–203. [CrossRef]
- Scott, M.; Su-In, L. A Unified Approach to Interpreting Model Predictions. Adv. Neural Inf. Process. Syst. 2017, 30, 4765–4774.
- Banos, O.; Galvez, J.-M.; Damas, M.; Pomares, H.; Rojas, I. Window size impact in human activity recognition. Sensors 2014, 14, 6474–6499. [CrossRef]
- Kretch, K. S.; Koziol, N. A.; Marcinowski, E. C.; Kane, A. E.; Inamdar, K.; Brown, E. D.; Bovaird, J. A.; Harbourne, R. T.; Hsu, L.-Y.; Lobo, M. A.; Dusing, S. C. Infant Posture and Caregiver-Provided Cognitive Opportunities in Typically Developing Infants and Infants with Motor Delay. Dev. Psychobiol. 2022, 64(1), Article e22233. [CrossRef]
- Ghazi, M. A.; Zhou, J.; Havens, K. L.; Smith, B. A. Accelerometer Thresholds for Estimating Physical Activity Intensity Levels in Infants: A Preliminary Study. Sensors 2024, 24(14), 4436. [CrossRef]
- Oh, J.; Ordoñez, E. L. T.; Velasquez, E.; Mejía, M.; Grazioso, M. D. P.; Rohloff, P.; Smith, B. A. Early Full-Day Leg Movement Kinematics and Swaddling Patterns in Infants in Rural Guatemala: A Pilot Study. PLoS One 2024, 19(2), e0298652. [CrossRef]
- Ghazi, M.; Prosser, L.; Kolobe, T.; Fagg, A.; Skorup, J.; Pierce, S.; Smith, B. Measuring Spontaneous Leg Movement of Infants At-Risk for Cerebral Palsy: Preliminary Findings. Arch. Phys. Med. Rehabil. 2024, 105(4), e13–e14. [CrossRef]
- Kulvicius, T.; Zhang, D.; Poustka, L.; Bölte, S.; Jahn, L.; Flügge, S.; Kraft, M.; Zweckstetter, M.; Nielsen-Saines, K.; Wörgötter, F.; Marschik, P. B. Deep Learning Empowered Sensor Fusion Boosts Infant Movement Classification. arXiv, 2024. [CrossRef]
Figure 1.
Placement of all sensors on the infant and caregiver. The Developmental Neurocognition Laboratory Babylab provided the photos at the Institute of Psychology, Polish Academy of Sciences, with written consent from the caregiver for publication.
Figure 1.
Placement of all sensors on the infant and caregiver. The Developmental Neurocognition Laboratory Babylab provided the photos at the Institute of Psychology, Polish Academy of Sciences, with written consent from the caregiver for publication.
Figure 2.
Percentage of total visit duration spent in various positions for each infant at the 4, 6, 9 and 12-month time points. The numbers in brackets at the bottom of each plot indicate the number of infants that did not show a given position at a given time point. These plots illustrate changes in the distribution of postural behaviours as infants develop their gross motor skills over time.
Figure 3.
Illustration of sensor readings from tri-axial accelerometer, gyroscope, and magnetometer positioned on the left leg of a 12-month-old infant. The data is displayed across three axes (X, Y, Z) for each sensor type, showing variations in movement patterns associated with different body positions.
Figure 4.
Sliding windows of 2 seconds with a 1-second overlap, showing assigned position fragments. Blue windows represent the Supine class, and teal windows indicate the Prone class. Windows, where less than 75% of samples are consistently assigned the same position label, were not assigned to any class.
Figure 5.
Composition of feature groups. Five distinct feature groups were extracted from each type of signal, including XYZ signals.
Figure 5.
Composition of feature groups. Five distinct feature groups were extracted from each type of signal, including XYZ signals.
Figure 6.
Visual representation of train-test splitting and 5-fold cross-validation techniques for assessing model performance and optimising hyperparameters.
Figure 6.
Visual representation of train-test splitting and 5-fold cross-validation techniques for assessing model performance and optimising hyperparameters.
Figure 7.
Comparison of F1 values averaged across five folds for pairs of sensors placed on Trunk, Trunk & Legs, and Trunk, Legs & Arms for CatBoost and Random Forest.
Figure 7.
Comparison of F1 values averaged across five folds for pairs of sensors placed on Trunk, Trunk & Legs, and Trunk, Legs & Arms for CatBoost and Random Forest.
Figure 8.
A confusion matrix was obtained based on the predictions of CatBoost classifiers trained on the combined set of parameters for two pairs of sensors: Trunk & Legs. The percentage of actual classifications is displayed at the top, with average counts across the five folds and their standard error included in parentheses. The colour scale corresponds to the percentage of the actual position, providing a visual representation of classification accuracy.
Figure 9.
F1 score change for Catboost models using only one feature group at a time relative to models using all feature groups for two pairs of sensors: Trunk & Legs.
Figure 9.
F1 score change for Catboost models using only one feature group at a time relative to models using all feature groups for two pairs of sensors: Trunk & Legs.
Figure 10.
F1 score change for models excluding one feature group at a time relative to the CatBoost model using all feature groups for two pairs of sensors: Trunk & Legs.
Figure 10.
F1 score change for models excluding one feature group at a time relative to the CatBoost model using all feature groups for two pairs of sensors: Trunk & Legs.
Figure 11.
The sum of |SHAP| values across five folds illustrates the features with the highest total impact on the model, categorised by different signals and features. This figure highlights the most influential features in the model’s predictions, with larger sum |SHAP| values indicating a more significant impact.
Figure 12.
Mean |SHAP| values across five folds illustrate the features with the highest impact on the model, categorised by different signals and features. Presented values are multiplied by 1e5 for clarity. This figure highlights the most influential features in the model’s predictions, with elevated SHAP values indicating a more significant impact.
Figure 13.
Illustration of the correlation between the annotated (actual) and predicted time spent in five distinct positions across study sessions. The x-axis represents the real percentage of time spent in each position, while the y-axis shows the corresponding predicted percentage. Each point in the plot corresponds to a specific infant in a position during one study session, with a line of best fit illustrating the correlation between the real and predicted values. The closer the points align with the line, the more accurate the predictions. Based on the CatBoost model for two pairs of sensors, Trunk & Legs.
Table 1.
Toy sets in three activities (tasks) used in this study. The first row shows toys for infants aged 4 and 6 months, and the second row for infants aged 9 and 12 months. Photos are provided courtesy of the Neurocognitive Development Lab (Babylab) at the Institute of Psychology, Polish Academy of Sciences.
Table 2.
The number of visits from infants participating at each age point during the selected task. Each infant could only contribute data once at each specific age and activity. The unique contribution of each infant at a given age prevents any overlap or duplication in the data.
Table 2.
The number of visits from infants participating at each age point during the selected task. Each infant could only contribute data once at each specific age and activity. The unique contribution of each infant at a given age prevents any overlap or duplication in the data.
Time Point |
Rattles |
Book-sharing |
Manipulative |
| Mean age [months] |
SE
[months] |
No. visits |
Mean age [months] |
SE
[months] |
No. visits |
Mean age [months] |
SE
[months] |
No. visits |
| 4 months |
4.36 |
0.29 |
61 |
4.36 |
0.28 |
63 |
4.35 |
0.28 |
65 |
| 6 months |
6.59 |
0.40 |
74 |
6.61 |
0.39 |
76 |
6.61 |
0.40 |
72 |
| 9 months |
9.06 |
0.35 |
71 |
9.08 |
0.35 |
70 |
9.06 |
0.35 |
72 |
| 12 months |
12.14 |
0.52 |
73 |
12.16 |
0.51 |
72 |
12.13 |
0.53 |
69 |
Table 3.
Manually annotated static body positions, including their corresponding annotations and formal definitions.
Table 3.
Manually annotated static body positions, including their corresponding annotations and formal definitions.
| Static Position |
Annotated Position |
Definition |
| Hands&Knees |
hands and knees |
The infant is on their hands and knees or feet with their stomach lifted off the ground and is not moving. Alternately, the infant is on two knees or feet and one hand, with the other hand used to interact with an object. |
| crawling |
The infant moves on their hands and knees with their stomach off the ground. |
| Prone |
pivoting |
The infant is lying prone and rotating or turning in a small area on the floor without moving forward or backwards. |
| prone |
The infant is lying flat on their stomach. |
| side lying |
The infant is lying on their side with their torso oriented sideways. |
| belly crawling |
The infant moves forward by sliding their belly along the ground. |
| Sitting |
supported sitting
by the caregiver |
The infant sits upright on their bottom with their back supported by the caregiver, and their legs either extended in front or folded beneath them. |
supported sitting
using own hands as support |
The infant is sitting on their bottom, leaning to one side with the support of their arm, and their legs extended in front or to the side. |
| independent sitting |
The infant sits Upright on their bottom with their legs in front or folded beneath them, without leaning on any external support. |
| Supine |
supine |
The infant is lying flat on their back. |
| Upright |
supported stand |
The infant is standing upright with straight legs and feet on the floor while being supported by the caregiver and not moving. |
| standing upright |
The infant is standing upright with straight legs and feet on the floor but is not moving. |
| walking |
The infant is moving upright with legs straight and feet on the floor. |
| supported walking |
The infant walks upright with legs straight and feet on the floor, supported by the caregiver’s hands. |
Table 4.
List of abbreviations used for signals and features.
Table 4.
List of abbreviations used for signals and features.
| Signal |
|
Abbr. |
| Accelerometer |
|
Acc |
| Magnetometer |
|
Mag |
| Gyroscope |
|
Gyro |
| Euclidean Norm |
|
Norm |
| High-Pass Filtered |
|
HP |
| Low-Pass Filtered |
|
LP |
| 3 separate signals from the X, Y, and Z axis of the chosen device/modality Mag, Gyro or Acc |
|
X, Y, Z |
|
Disclaimer/Publisher’s Note: The statements, opinions and data contained in all publications are solely those of the individual author(s) and contributor(s) and not of MDPI and/or the editor(s). MDPI and/or the editor(s) disclaim responsibility for any injury to people or property resulting from any ideas, methods, instructions or products referred to in the content. |
© 2024 by the authors. Licensee MDPI, Basel, Switzerland. This article is an open access article distributed under the terms and conditions of the Creative Commons Attribution (CC BY) license (http://creativecommons.org/licenses/by/4.0/).
