
Submitted:
17 October 2024
Posted:
18 October 2024
You are already at the latest version
Abstract
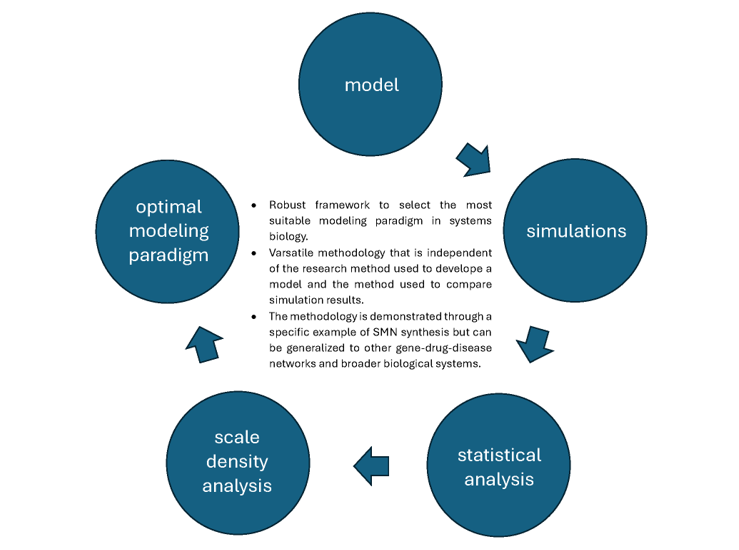
Since 1990s, Petri nets have been used in systems biology for quantitative modeling. Despite the increasing number of models developed during this period, doubts remain about their biological relevance. Although biological systems predominantly exhibit intracellular or cellular structures, the models rely largely on deterministic predictions, failing to capture the inherent randomness and uncertainties of such systems. The question arises whether these models accurately describe the dynamic behavior of biological systems. This paper introduces a methodology for selecting the appropriate modeling paradigms in systems biology. Initially, we construct a Petri net model and perform deterministic, stochastic, and fuzzy stochastic simulations. Then we perform various statistical tests to measure the discrepancies between the simulation results. Based on scale-density analysis, we determine the modeling approach that best approximates the biological system. Finally, we compare the results of the statistical tests and the scale-density analysis to identify the optimal modeling approach. We applied the proposed methodology to the synthesis of spinal motor neuron protein from the spinal motor neuron-2 gene. Analysis revealed significant discrepancies between the simulation results of different modeling paradigms. Due to the sparse nature of the underlying drug-disease network, we conclude that the fuzzy stochastic paradigm provides the most biologically relevant results. We predict drug combinations that could lead to an up to 149-fold increase in spinal motor neuron protein levels, indicating a promising treatment for the disease. This methodology has potential for application to other gene-drug-disease networks and broader biological systems.
Keywords:
systems biology
; quantitative modeling
; Petri nets
; descriptive statistics
; spinal muscular atrophy
1. Introduction
Currently, there is no universally accepted standard for modeling as it must be highly customized to the specific biological problem at hand. Each model can only offer an approximate representation of nature, and a key challenge is to apply or develop modeling techniques that best address the questions posed while balancing effort and accuracy. Deterministic and stochastic methods are commonly employed in modeling biological systems, leading to the question of what is the most suitable modeling framework for a given biological system. A straightforward analysis reveals the complexity of this decision. A single molecule behaves in a completely stochastic manner, but as the number of molecules increases, stochastic effects diminish due to balancing interactions. The level of stochasticity, represented by the function of the number of components n in the biological system, decreases as n increases. In the thermodynamic limit, , a stochastic formulation effectively reduces to the deterministic one [1]. We know that sparse biological systems primarily exhibit stochastic behavior, whereas systems with a high density of components tend to follow deterministic patterns. Determining whether a particular biological system is sparse or dense can be challenging. In the following discussion, we will focus on the scale and density characterization of biological systems to determine if a given system is predominantly sparse or dense.
Biological organization spans various spatial scales, with the most notable being intracellular, cellular, intercellular, and population-wide. Intracellular processes occur within the cell and involve interactions at the molecular level such as gene regulatory, metabolic, and signal transduction pathways. Intracellular processes take place at the microscopic level. Cellular processes occur at the mesoscopic level but are not limited to a single cell. Cell biology as a whole is fundamentally mesoscopic biology. For example, cell communication involves multiple cells, but takes place at the cellular level. Cellular processes involve interconnected physiological systems that regulate cell function, including biochemical cascades both within and between cells. Intercellular biology focuses on the various structures that cells use to communicate with each other, either directly or through the surrounding biological environment, typically at the tissue level, contributing to organ functionality. Finally, population-wide processes study how populations interact with their environment, such as the spread of epidemiological diseases such as COVID-19 in specific geographical regions [2]. Intercellular and population-wide processes both occur at the macroscopic level.
Intracellular and cellular processes form microscopic and mesoscopic systems, respectively, that consist of a relatively low number of biological components and can therefore be described as sparse biological systems. Due to their inherent randomness, these processes are best investigated using stochastic methods. In contrast, intercellular and population-wide processes are macroscopic systems represented by a crowd of biological components, and, therefore, are characterized by high density. Deterministic models are most suitable for modeling these macroscopic systems.
It is common for a biological phenomenon to take place at varying rates. The reaction rates are typically vague and rather uncertain. This vagueness affects the stoichiometry of the reactions and the quantitative relationships between substances in biochemical reactions. As a result, quantitative kinetic models inherently possess some degree of uncertainty. Fuzzy logic [3] is often used to manage the uncertainty inherent in biological systems.
In line with the preceding discussion, it is clear that deterministic, purely stochastic, and fuzzy stochastic paradigms represent three principal possibilities for modeling in systems biology. The choice of modeling paradigm should be based on model’s scope and specific characteristics. In deterministic models, the outcome remains constant regardless of how many times the model is run, making them straightforward to analyze since they only need to be executed once. However, stochastic models yield different results with each run, requiring thousands or even tens of thousands of replications to obtain reliable averages. This complexity makes stochastic models more challenging to analyze compared to deterministic ones. The fuzzy stochastic approach adds another layer of complexity by running the model for each fuzzy number, making the analysis even more difficult.
This study proposes a methodology to identify the optimal modeling paradigm by combining insights from the analysis of differences between simulations across three paradigms with the scale density analysis of biological systems. If the data sets from any two or all three paradigms are sufficiently similar, the simplest paradigm should be preferred. Otherwise, the most appropriate approach is recommended for each biological system. The authors are unaware of any other work that addresses this methodological issue in the given context, although there are studies that compare various aspects of deterministic, stochastic, and fuzzy methods [4]. In [5], we demonstrated how to select relevant modeling framework for the p16-mediated pathway.
The applicability of this methodology is demonstrated for the synthesis of spinal motor neuron (SMN) protein from spinal motor neuron 2 gene (SMN2) [6]. We used the tests of descriptive statistics to measure the similarity among data sets: Shapiro-Wilk test to assess normality, Friedman test to compare all three data sets, and Dunn-Bonferroni test to pairwise compare of data sets. For the synthesis of SMN, Shapiro-Wilk test indicated a non-normal distribution of the data sets, while Friedman and Dunn-Bonferroni tests revealed significant differences between the data sets. Due to the fact that SMN synthesis network operates at the cellular scale, the fuzzy stochastic approach is concluded to provide the most relevant results.
The remainder of the paper is structured as follows: In the next section, we outline the research method, material, and background behind the present work. More specifically, we outline Petri nets, succinctly describe fuzzy logic, review statistical tests to measure similarities among data sets, and introduce associating biological context. Following this, we develop the model, validate the model with known biological data, describe simulations, introduce the clustering algorithm to classify the combinations of drugs into effective and noneffective classes, provide data analysis of simulations, and interpret the statistical tests. The paper concludes with our findings.
2. Materials and Methods
2.1. Petri Nets
We explore Petri net technologies to develop model of the drug-disease network for synthesis of SMN protein from SMN2 gene. This model incorporates Petri nets, continuous Petri nets (CPNs), hybrid Petri nets (HPNs), and stochastic Petri nets (SPNs). In what follows, we formally define the Petri net, CPN, HPN, and SPN, and for further elaboration on the Petri nets and corresponding extensions, we direct the readers to [7,8].
A Petri net is a 5-tuple such as , , , , where and are the sets of places, transitions, input arcs, output arcs, and initial marking, respectively, and .
A CPN is a 5-tuple , such as P and T are same to those in the definition of Petri net, and is a function from to , is a function from to , and is from P to where and are weight functions, which associate a positive rational number with the arcs and , respectively, and is a vector of non-negative real numbers.
An HPN is a 6-tuple , where P, the set of places, is composed of subset of D places, , and subset of C places, , and , , ; T, the set of transitions, consists of subset of D transitions, , and subset of C transitions, , and , , ; h, hybrid function that discriminates between D and C components, is a rule from to , is a function from to ; is a function from to ; and is same to that in the definition of CPN, and , the weight functions, set the weight of the arc and , respectively, to a positive rational number if , and to a natural number if .
In the above definitions, , , are the sets of natural, positive rational, and non-negative real numbers, respectively.
An SPN is a 6-tuple where and are the same as those in the definition of the classical untimed Petri net, and is a vector of real numbers, where represents the firing rate of , . We apply SPNs to model the association between random time delays and the occurrence of transitions. Within an SPN framework, the time interval between the enabling of a transition and its subsequent occurrence is characterized by a random variable following a negative exponential probability distribution function as follows:
2.2. Fuzzy Logic
Fuzzy logic, first introduced by Zadeh [3], provides a systematic approach to handle uncertainty, imprecision, and vagueness. In this framework, a fuzzy set on a universal set of real numbers is defined by its membership function which maps to . This function assigns to each element a real number in the interval . To enable the use of fuzzy rules, Petri nets with various extensions have been integrated with fuzzy logic. In [8,9], the initial applications of SPNs with fuzzy parameters, the authors demonstrated how continuous stochastic Petri nets with fuzzy parameters can be applied in systems biology, and discrete stochastic Petri nets with fuzzy parameters can model a flexible manufacturing cell, respectively.
There are different types of fuzzy numbers: triangular, trapezoidal, pentagonal, hexagonal, heptagonal, etc. In our work, we use the triangular fuzzy number (TFN) to represent reaction rates and concentrations. An TFN is described by three values , where forms the base of the triangle and b represents its peak.
Here is an explanation of how we determine a TFN for the reaction rates which is also illustrated in Figure 1. We always have qualitative knowledge on reaction rates at our disposal, such as translation being almost ten times slower than transcription. First, based on existing qualitative knowledge, we normalize the crisp value of a reaction rate b relative to the transcription rate, which is set to 1. During the validation stage of the model, we fine-tune the reaction rates by adjusting those of the corresponding transcriptions. Once these two stages are completed, the reaction rate is considered acceptable yieldings ; otherwise, . Next, we define the TFN, , of "acceptable rates" for each reaction by assigning a degree of membership to each rate value x, where . Notably, increases with x in the interval and decreases in the interval . In this research and .
Figure 1(b) illustrates application of the above principle for the phenomenon of transcription. The TFN is implemented with two cuts: and , yielding the crisp subsets and , respectively. Finally, the set of fuzzy rates for the transcription phenomenon is defined using these cuts as .
2.3. Statistical Tests
There are various methods available for assessing the similarities between simulation results, such as descriptive statistics, correlation analysis, cluster analysis, and machine learning techniques. In this study, we utilize the methods of descriptive statistics, which are increasingly significant in biomedical research. Following the proposed methodology, we first conduct a normality test, a critical stage in determining the appropriate statistical methods. If the data are normally distributed, we use parametric tests; otherwise, we apply nonparametric methods for comparing the data sets. To evaluate similarities among a group of data sets, we perform two types of independent test: pairwise comparisons of data sets and simultaneous comparisons of all data sets.
We used Shapiro-Wilk test to check if the data sets align with a normal distribution. If we observe that the data are normally distributed, we can employ a parametric test to determine significant differences between the data sets; otherwise, we recommend using non-parametric tests: Friedman test to identify significant differences among data sets in a group, and Dunn-Bonferroni posthoc test for pairwise comparisons. The latest test is designed to pinpoint which specific pairs of means within a data set are significantly different from each other.
2.4. Case Study - Synthesis of Spinal Motor Neuron Protein from Spinal Motor Neuron 2 Gene
A mutation in SMN1 gene leads to the insufficient production or complete absence of SMN protein, causing spinal muscular atrophy (SMA), a debilitating motor neuron disease. Humans have a second gene copy, SMN2, which possesses the necessary genetic information to mitigate the effects of SMA. However, SMN2 cannot fully compensate for the loss of SMN1 because it only produces 10% - 15% of the full functional SMN protein, the remaining 85% - 90% being the truncated and dysfunctional SMN7 protein. To address this, various candidate drugs have been proposed to treat SMA or reduce its severity by increasing the production of functional SMN protein from SMN2.
As of now, there is no complete cure for SMA. The most effective therapies include Zolgensma [10], a gene replacement therapy, and two medications: nusinersen (marketed as Spinraza) and risdiplam (known as Evrysdi) [11]. Although these treatments represent major advances in SMA therapy, they are focused primarily on alleviating symptoms and preventing complications, rather than offering a complete cure. However, understanding the genetic basis of SMA has allowed the development of targeted treatment options that fall into four main categories:
- A.
- Inhibition of the inhibitor: Targeting pathways that suppress SMN2 expression.
- B.
- Regulation of pre-mRNA splicing: Enhancing the correct splicing of the SMN2 transcript.
- C.
- Upregulation of promoter activity: Boost promoter activity to increase SMN2 expression.
- D.
- Targeting DNA methylation: Modifying DNA methylation patterns to enhance SMN2 activity.
In the present study, we combine various treatment options to evaluate the comprehensive effectiveness of different drug combinations using existing qPCR data. One possible SMA treatment strategy, referred to as strategy A, focuses on inhibiting histone deacetylase (HDAC) activity, which suppresses SMN2 gene expression. Our research has identified Valproic Acid (VPA) [12], Trichostatin A (TSA) [13], Dacinostat, and Resveratrol as the only HDAC inhibitors documented in the biological literature that present qPCR and protein data indicating an increase in SMN protein levels derived from SMN2. According to [12], treating fibroblast cultures from SMA patients with 0.5-500 µM of VPA led to a boost in SMN levels up to four times. In [13], it was observed that the application of TSA to an SMA mouse model resulted in a twofold increase in SMN levels in the brain, liver and spinal cord. Furthermore, in [14], a 1.3-fold increase in SMN levels was reported in cell cultures treated with 100 resveratrol, compared to the untreated control.
In [15], it was demonstrated that in a type III SMA mouse model, treatment with the tetracycline derivative PTMK-SMA1 significantly increases the inclusion of exon 7 in SMN2 mRNA during splicing. This is in accordance with strategy B. This leads to a nearly five-fold increase in SMN protein levels compared to untreated mice. Notably, PTMK-SMA1 is the only compound identified so far that directly alters the splicing process to favor the inclusion of exon 7, promoting the production of functional SMN protein.
In [16], according to strategy C, the authors suggest enhancing SMN transcription from SMN2 by targeting modulation of the SMN2 promoter’s activity. The research demonstrated that Indole treatment in patient-derived cells significantly impacts SMN2 promoter activity, leading to a three-fold increase in SMN transcription compared to untreated controls.
In line with strategy D, it was discovered that the SMN2 gene is subject to silencing through DNA methylation [17]. Consequently, inhibiting this methylation process to prevent SMN2 gene silencing has emerged as a promising strategy for the pharmacologic treatment of SMA. A potential drug, 5-Azacytidine (AZA), works by blocking the methylation of transcription factors associated with the SMN2 gene, thereby increasing SMN protein production. Their study reported a twofold increase in SMN protein levels in SMA patients treated with AZA.
3. Results
3.1. Creating the Model
We used the Snoopy tool [18] and the biological context detailed in subsection 2.4 to develop a Petri net-based model of a drug-disease network for the synthesis of SMN protein from SMN2. A Petri net model incorporates discrete, continuous, hybrid, stochastic, and fuzzy parameters and aspects. This model captures all the essential interactions among biological components within the framework of mass action kinetics [19]. We meticulously defined the reaction rates by anchoring them to a baseline transcription rate of 1, and then expressing the rates of other processes relative to this transcription rate. The kinetic rates applied in our study are consistent with those reported in [5].
The Petri net model is shown in Figure 2. This model integrates features from discrete, continuous, hybrid, and stochastic Petri nets. Discrete places represent the inclusion or exclusion of various candidate drugs, while continuous components ensure the flow of marks, expressed in real numbers, across the Petri net. The treatment of each candidate drug is simulated using an inhibitory arc directed from a discrete place to a transition. This setup allows a treatment to be active when the corresponding discrete place is empty and inactive otherwise. For simulating treatment with multiple candidate drugs, we ensure that the relevant discrete places remain empty. For stochastic replications of the model, stochastic rates are used as stochastic delays for stochastic transitions.
A Boolean variable tracks the presence or absence of each drug treatment. To initiate a simulation, we configure the drug composition by placing tokens in the respective discrete places. In the model, continuous places represent the concentrations of biological components as real numbers, while continuous transitions correspond to biological phenomena.
3.2. Validation with Existing Biological Data
We employed a two-stage simulative validation of the model using biological knowledge detailed in subsection 2.4. In the first stage, we reached the target ratio of protein types produced from SMN2, specifically 85% SMN7 and 15% SMN. This is achieved by fine-tuning the rates of transitions , , , , , , and until the desired proportion between SMN7 and SMN is obtained. In the second stage, for each of the seven candidate drugs, we individually calibrate the transition rate to known qPCR data [12,13,14,15,16,17]. The rates of mRNA and protein degradation transitions are aligned with those used in previous studies [5]. Finally, we fine-tune the reaction rates through stochastic simulations, averaging the results to ensure accuracy.
3.3. Conducting the Simulations
We run the model for each of the 127 drugs and drug combinations up to 1000 Petri time units (pt), a measure of time in the Petri net model, to ensure that the concentration of SMN reached a steady state. For stochastic simulations, we performed 38,000 replications of the model, averaging the results for each drug or combination of drugs to reliably estimate the behavior of the SMN synthesis network. This approach provides a 95% confidence level and an accuracy of .
In the fuzzy stochastic simulations, we replaced the crisp kinetic parameter b in the hazard function of each transition with a fuzzy number , where and . The fuzziness of the model is represented by the rates and , which correspond to specific -cuts and are treated according to stochastic rules. We limited the number of -cuts to two in this study, as increasing the number of cuts would significantly raise the number of replications required for the stochastic simulations. For both deterministic and stochastic simulations, the process rates were set to , the middle component .
3.4. Clustering
In this study, we employ equivalence relation-based clustering to classify drug combinations based on their efficacy. The Drug_Clustering algorithm divides the set of combinations of n drugs into clusters of effective and non-effective combinations for . The key characteristic of this algorithm is that the lowest effectiveness (fold over control) of any effective combination of n drugs is higher than the highest effectiveness of any non-effective combination of n drugs. This yielded two clusters: (i) one cluster of 35 effective drug combinations that are likely to be beneficial, and (ii) a larger cluster of 92 non-effective drug combinations. All effective combinations of drugs are represented in Figure 3, Figure 4, Figure 5, Figure 6, Figure 7 and Figure 8.
3.5. Data Analysis of Simulation Results
Based on the simulation results, combining all seven candidate drugs results in the most significant increase in SMN levels obtained from SMN2, achieving a 149.9-fold increase in SMN levels. This is a substantial breakthrough compared to the 5-fold increase in the case of PTK-SMA1 [15]. However, despite their compatibility, using all seven drugs together can lead to severe side effects. Even if some combinations result in unavoidable side effects, there might still be many effective combinations worth testing. Figure 3 to Figure 8 show that the worst result achieved with an effective combination of two drugs leads to a 9.926-fold increase in protein levels (see Figure 4). This is almost twice as high as reported in [15] for the best drug candidate.
Our observations indicate that adding more drugs does not always lead to higher levels of SMN. There are many such examples where fewer drugs achieve better results. For example, a three-drug combination of PTK-SMA1, Indole, and VPA results in up to a 46-fold increase in SMN levels (see Figure 5), which exceeds that of some four- or even five-drug combinations (see Figure 6 and Figure 7). Similarly, a four-drug combination of PTK-SMA1, Dacinostat, AZA, and Indole results in up to an 88.9-fold increase in SMN levels (see Figure 6), which exceeds that of most five- and even some six-drug combinations (see Figure 7 and Figure 8). Furthermore, combinations involving PTK-SMA1 often outperform larger combinations that do not include it.
3.5.1. Interpretation of Statistical Tests
To precisely assess the level of agreement or discrepancy among the data sets obtained from simulations for the best effective combinations of drugs, we utilized the SPSS Statistics Software Package for a detailed analysis. Initially, we conducted normality tests across all data sets, which revealed that none of the data sets followed a normal distribution. Consequently, we applied nonparametric statistical tests to make pairwise comparisons between the data sets derived from the different models.
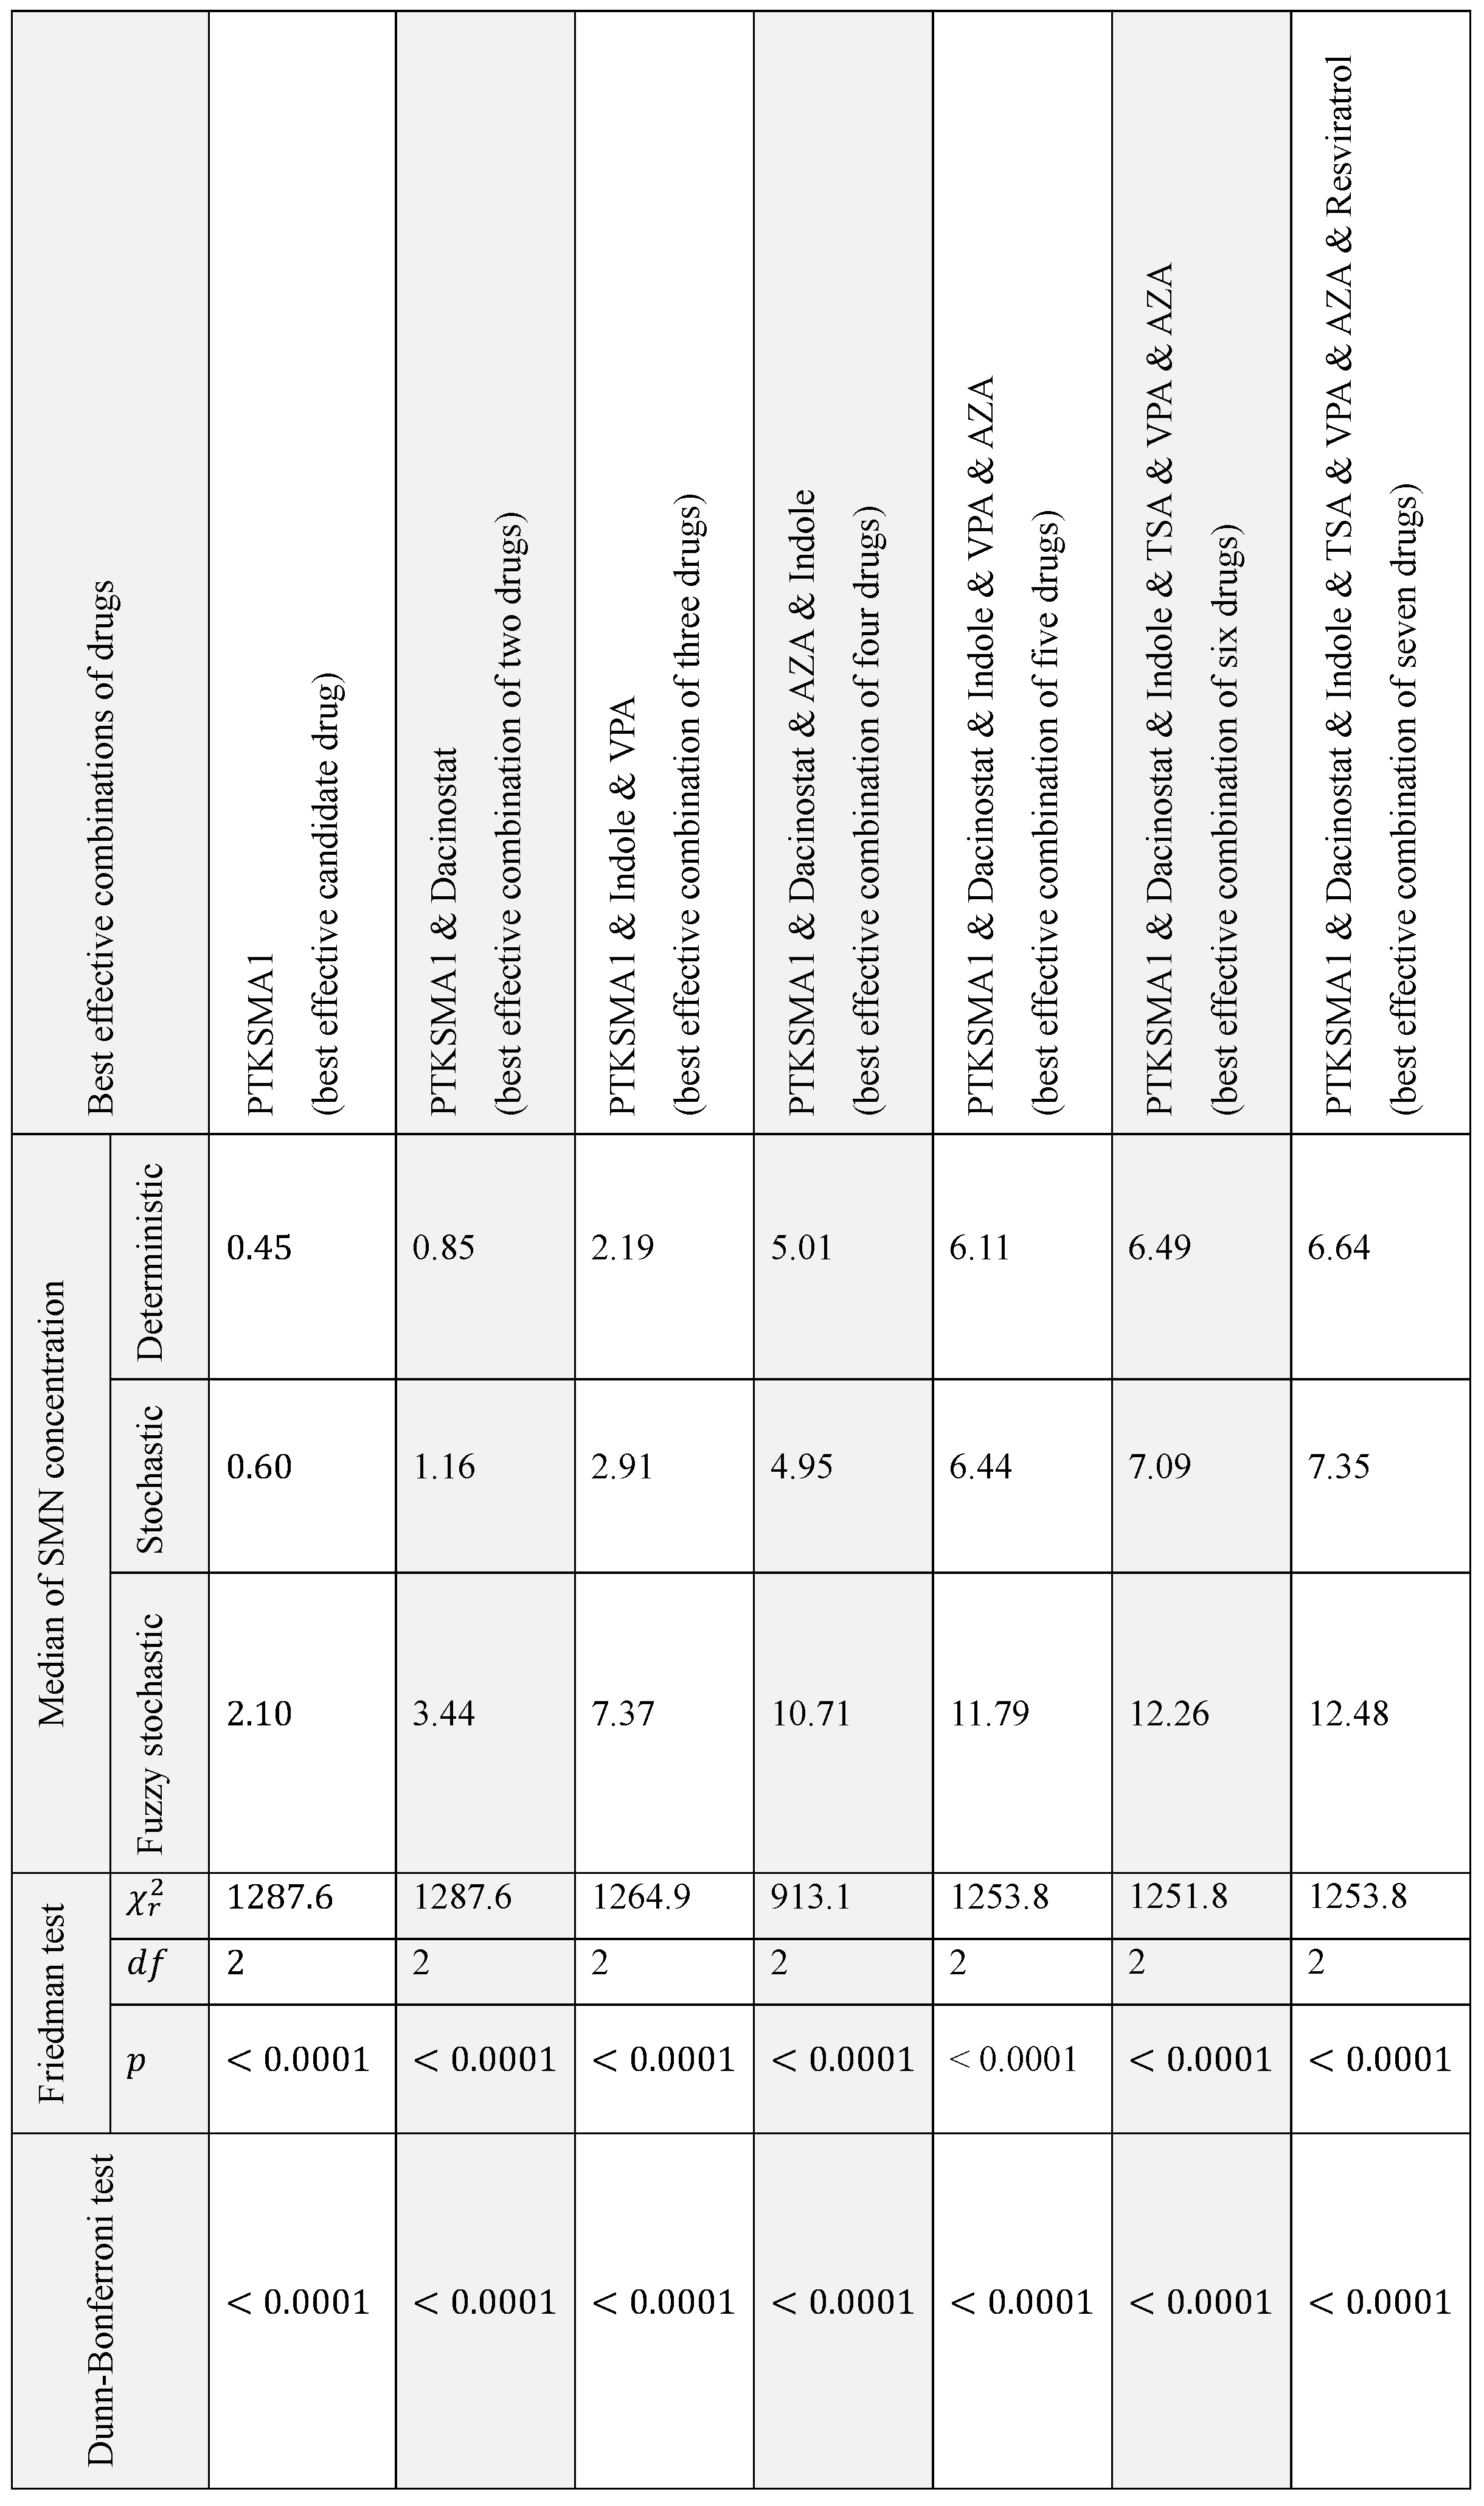
First, we conducted the Friedman test. The probability of obtaining the observed results by chance, referred to as p-value, of less than 0.05 is typically considered statistically significant, indicating that the hypothesis that there are no differences between the groups is rejected. For the case study of SMN synthesis this value was . Direct implication of this observation is that for the seven best effective combinations of drugs and their combinations shown in Table 1 there is a significant difference between the medians of the simulation results from three paradigms.
Then we performed Dunn-Bonferroni test to compares pair of related data sets on a single sample to assess whether the data sets have the same distribution. The pairwise comparison of data sets yielded . Hence we concluded that there is an substantial difference between distribution of related values in deterministic, stochastic, and fuzzy stochastic simulations. Moreover, statistical analysis reveals that values in stochastic case are significantly higher than corresponding values in deterministic case, and that values in fuzzy stochastic model are substantially higher compared to related values in stochastic model. The results of the comparison of the simulation results in line with three paradigms are summarized in Table 1.
4. Conclusion
In conclusion, this study demonstrates the critical importance of selecting the appropriate modeling paradigm to accurately approximate biological systems. By integrating comparison of simulation results and spatial scale - density analysis of a biological system, the proposed methodology offers a robust framework for selecting the most suitable modeling paradigm, thereby enhancing the reliability and biological relevance of computational models in systems biology. This methodology is versatile and independent of the research methods used for developing a model and simulations, and comparison of simulation results. While we use Petri net technologies for model development and simulation, the methodology is compatible with other approaches such as differential equations. Similarly, although we employ descriptive statistics to compare simulation results, other techniques such as machine learning and cluster analysis are equally applicable. This methodology is demonstrated through a specific example of SMN synthesis but can be generalized to other gene-drug-disease networks and broader biological systems.
Using deterministic, purely stochastic, and fuzzy stochastic simulations, we evaluated their performance in modeling the synthesis of SMN from SMN2, a key factor in the treatment of SMA. Statistical analyzes confirmed significant discrepancies between the results obtained from these modeling frameworks, highlighting that the choice of paradigm significantly affects the precision of the biological representation.
Our results indicate that the fuzzy stochastic paradigm provides the most biologically relevant and accurate quantitative results for the drug-disease network under study due to its ability to capture the inherent uncertainties and randomness of a biological system, which is characterized by being at the cellular scale and sparse in density. Specifically, fuzzy stochastic modeling predicted combinations of drug candidates that could lead to a 149.9-fold increase in SMN levels, which itself has promising therapeutic implications.
Data Availability Statement
The data from this study can be obtained upon request from the corresponding author. The data sets and the clustering algorithm are not publicly accessible at this time because their adoption is a key aspect of the innovation in this paper. Initially, the data sets and the clustering algorithm will not be open-sourced, as further possibilities will be explored in ongoing experimental research. Once this exploration is complete, the data sets and the clustering algorithm, along with the relevant code, will be made publicly available.
References
- Gillespie, D.T. A general method for numerically simulating the stochastic time evolution of coupled chemical reactions. Journal of Computational Physics 1976, 22, 403–434. [Google Scholar] [CrossRef]
- Bashirov, R. Prediction of COVID-19 pandemic spreading in North Cyprus. Journal of Modern Technology and Engineering 2023, 8(2), 73–83. [Google Scholar]
- Zadeh, L.A. Fuzzy sets. Information and Control 1965, 8, 338–353. [Google Scholar] [CrossRef]
- Simoni, G. , Vo, H.T., Priami, C. et al. A comparison of deterministic and stochastic approaches for sensitivity analysis in computational systems biology. Briefings in Bioinformatics 2020, 21(2), 527–540. [Google Scholar] [CrossRef] [PubMed]
- Akçay, Nİ., Bashirov, R. Comparison of modeling approaches demonstrated for the p16-mediated signaling pathway in higher eukaryotes. BioSystems 2021, 210, 104562.
- Bashirov, R. , Duranay, R., Şeytanoğlu, A. et al. Exploiting stochastic Petri nets with fuzzy parameters to predict efficient drug components for Spinal Muscular Atrophy. Turkish Journal of Electrical Engineering & Computer Sciences 2019, 27, 4009–4022. [Google Scholar]
- David, R., Alla, H. Discrete, Continuous, and Hybrid Petri Nets. Springer: Berlin, Heidelberg, Germany, 2005.
- Liu, F. , Heiner, M., Yang, Y. Fuzzy stochastic Petri nets for modeling biological systems with uncertain kinetic parameters. PLoS ONE 2016, 2016 11, e0149674. [Google Scholar]
- Tüysüz, F. , Kahraman, C. Modeling a flexible manufacturing cell using stochastic Petri nets with fuzzy parameters. Expert Systems with Applications 2009, 37, 3910–3920. [Google Scholar] [CrossRef]
- Blair, H.A. Onasemnogene abeparvovec: A review in Spinal Muscular Atrophy. CNS Drugs 2022, 36, 995–1005. [Google Scholar] [CrossRef] [PubMed]
- Kakazu, J. , Walker, N.L., Babin, K.C. et al. Risdiplam for the use of Spinal Muscular Atrophy. Orthopaedic review 2021, 13(1), 1–11. [Google Scholar]
- Brichta, L. , Hofmann, Y., Hahnen, E. et al. Valproic acid increases the SMN2 protein level: a well-known drug as a potential therapy for Spinal muscular atrophy. Human Molecular Genetics, 2003; 12, 2481–2489. [Google Scholar]
- Avila, A.M. , Burnett, B., Taye, A.A. et al. Trichostatin A increases SMN expression and survival in a mouse model of Spinal muscular atrophy. Journal of Clinical Investigations 2007, 117(3), 659–670. [Google Scholar] [CrossRef] [PubMed]
- Dayangac-Erden, D. , Bora, G., Ayhan, P. et al. Histone deacetylase inhibition activity and molecular docking of (E)-Resviratrol: its therapeutic potl in spin DTaluscular atrophy. Chemical Biology & Drug Design 2009, 73, 355–364. [Google Scholar]
- Hastings, M.L. , Berniac, J., Liu, Y.H. et al. Tetracyclines that promote SMN2 exon 7 splicing as therapeutics for Spinal Muscular Atrophy. Science Translational Medicine 2009, 1(5), 5ra12. [Google Scholar] [CrossRef] [PubMed]
- Jarecki, J. , Chen, X., Bernardino, A. et al. Diverse small-molecule modulators of SMN expression found by high-throughput compound screening: early leads towards a therapeutic for Spinal Muscular Atrophy. Human Molecular Genetics 2005, 14, 2003–2018. [Google Scholar] [CrossRef] [PubMed]
- Hauke, J. , Riessland, M., Lunke, S. et al. Survival motor neuron gene 2 silencing by DNA methylation correlates with Spinal muscular atrophy disease severity and can be bypassed by histone deacetylase inhibition. Human Molecular Genetics 2009, 18, 304–317. [Google Scholar] [CrossRef] [PubMed]
- Heiner, M., Herajy, M., Liu, F. et al. Snoopy – a unifying Petri net tool. In: Proceedings of International Conference on Application and Theory of Petri Nets, Berlin, Heidelberg, Springer, LNCS, 2012, 7347, pp. 398–407.
- Ackermann, J. , I. Quantitative analysis. In Modeling in Systems Biology - Petri Net Approach; Koch, I., Reisig, W., Schreiber, F., Eds.; Springer: London, UK, 2011; pp. 153–179. [Google Scholar]
Figure 1.
(a) The definition of a triangular fuzzy number, and (b) its adaptation to the rate of transcription.
Figure 1.
(a) The definition of a triangular fuzzy number, and (b) its adaptation to the rate of transcription.
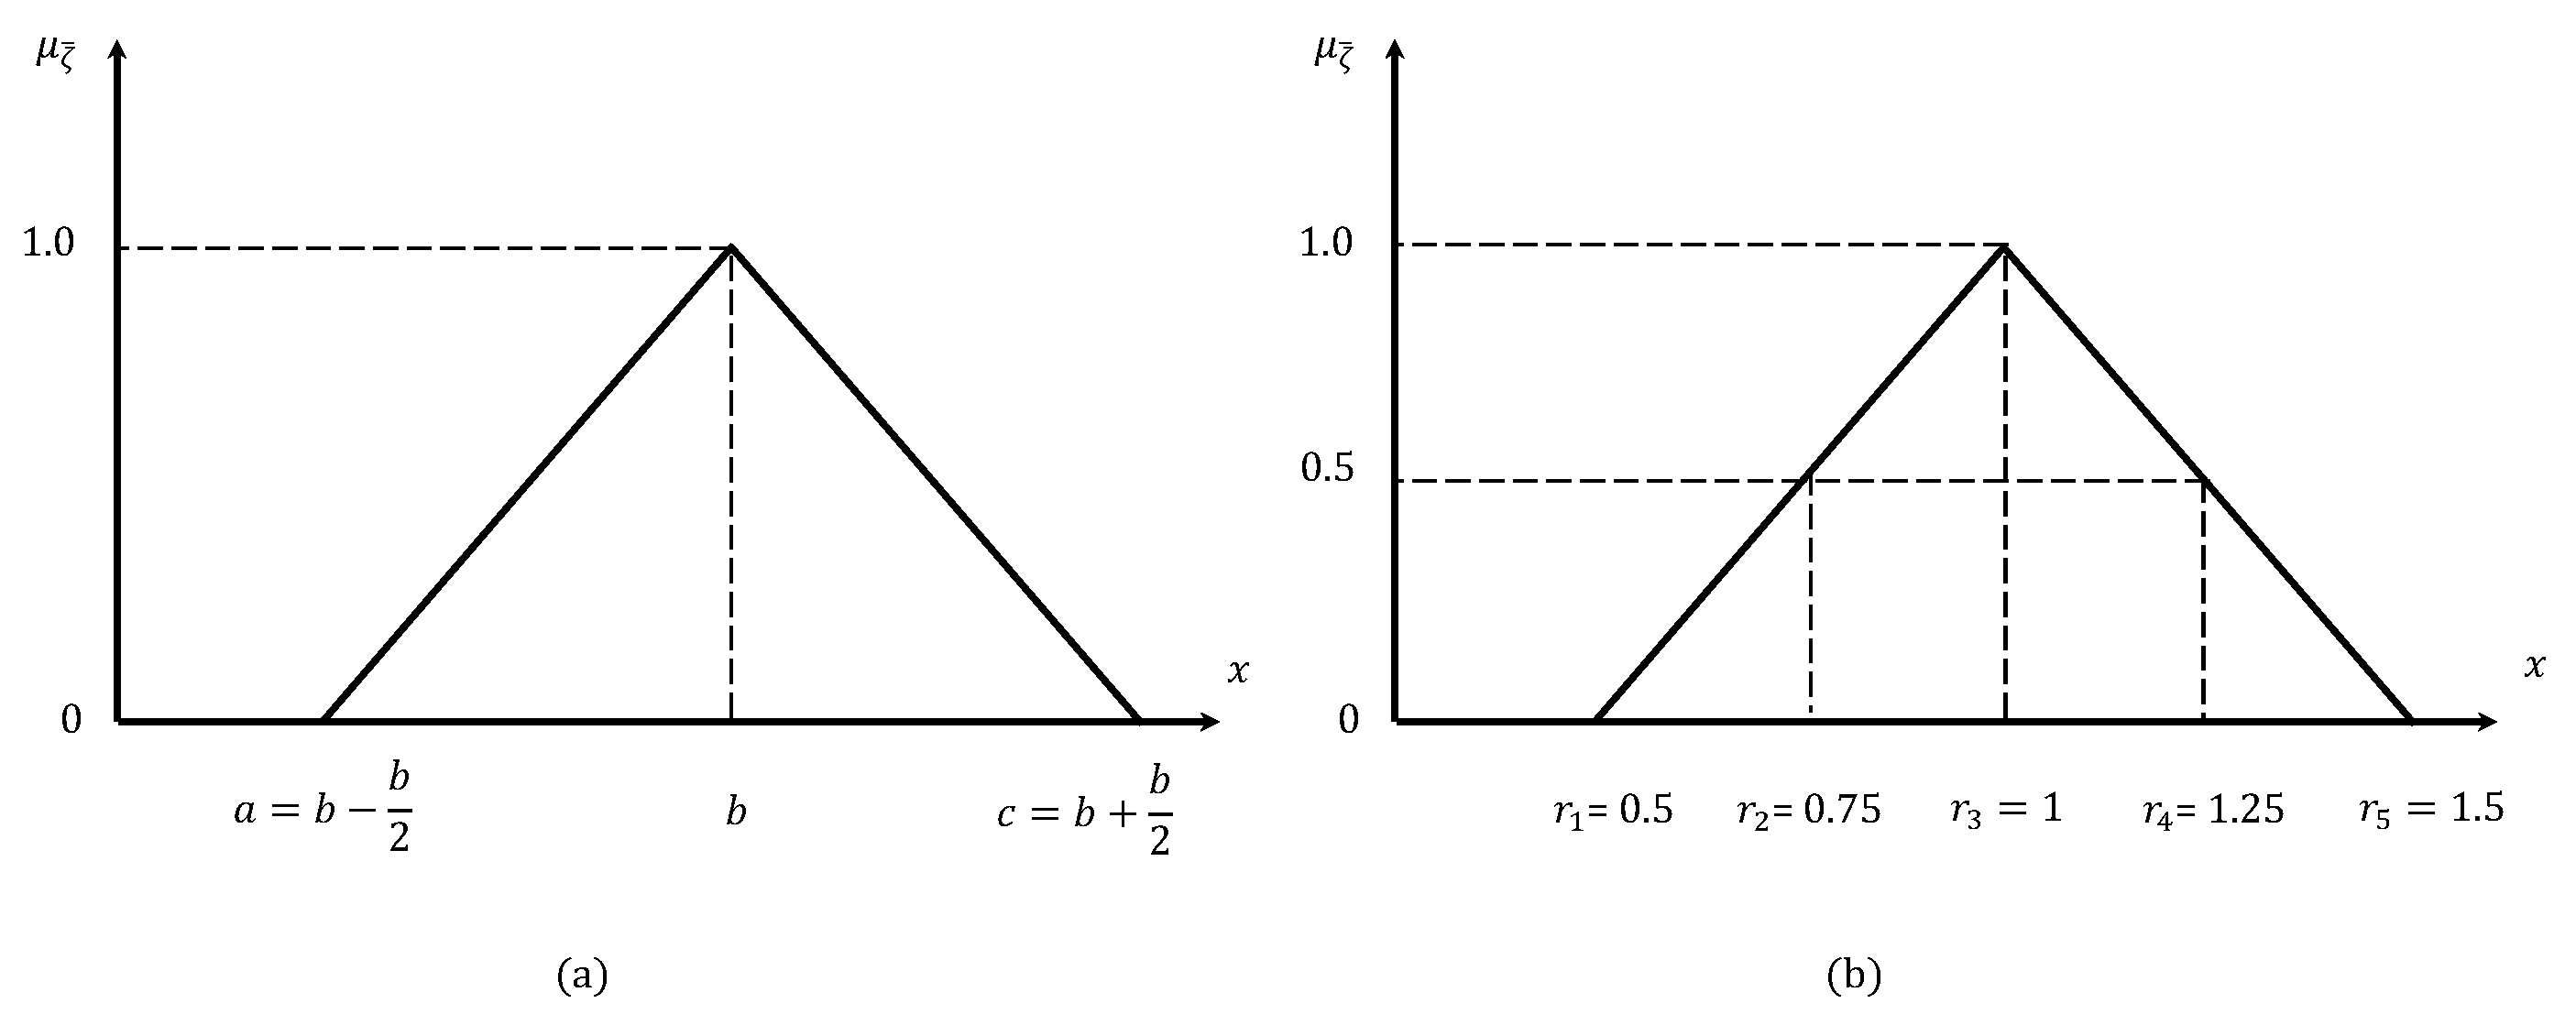
Figure 2.
Petri net model of drug-disease network of SMN synthesis from SMN2.
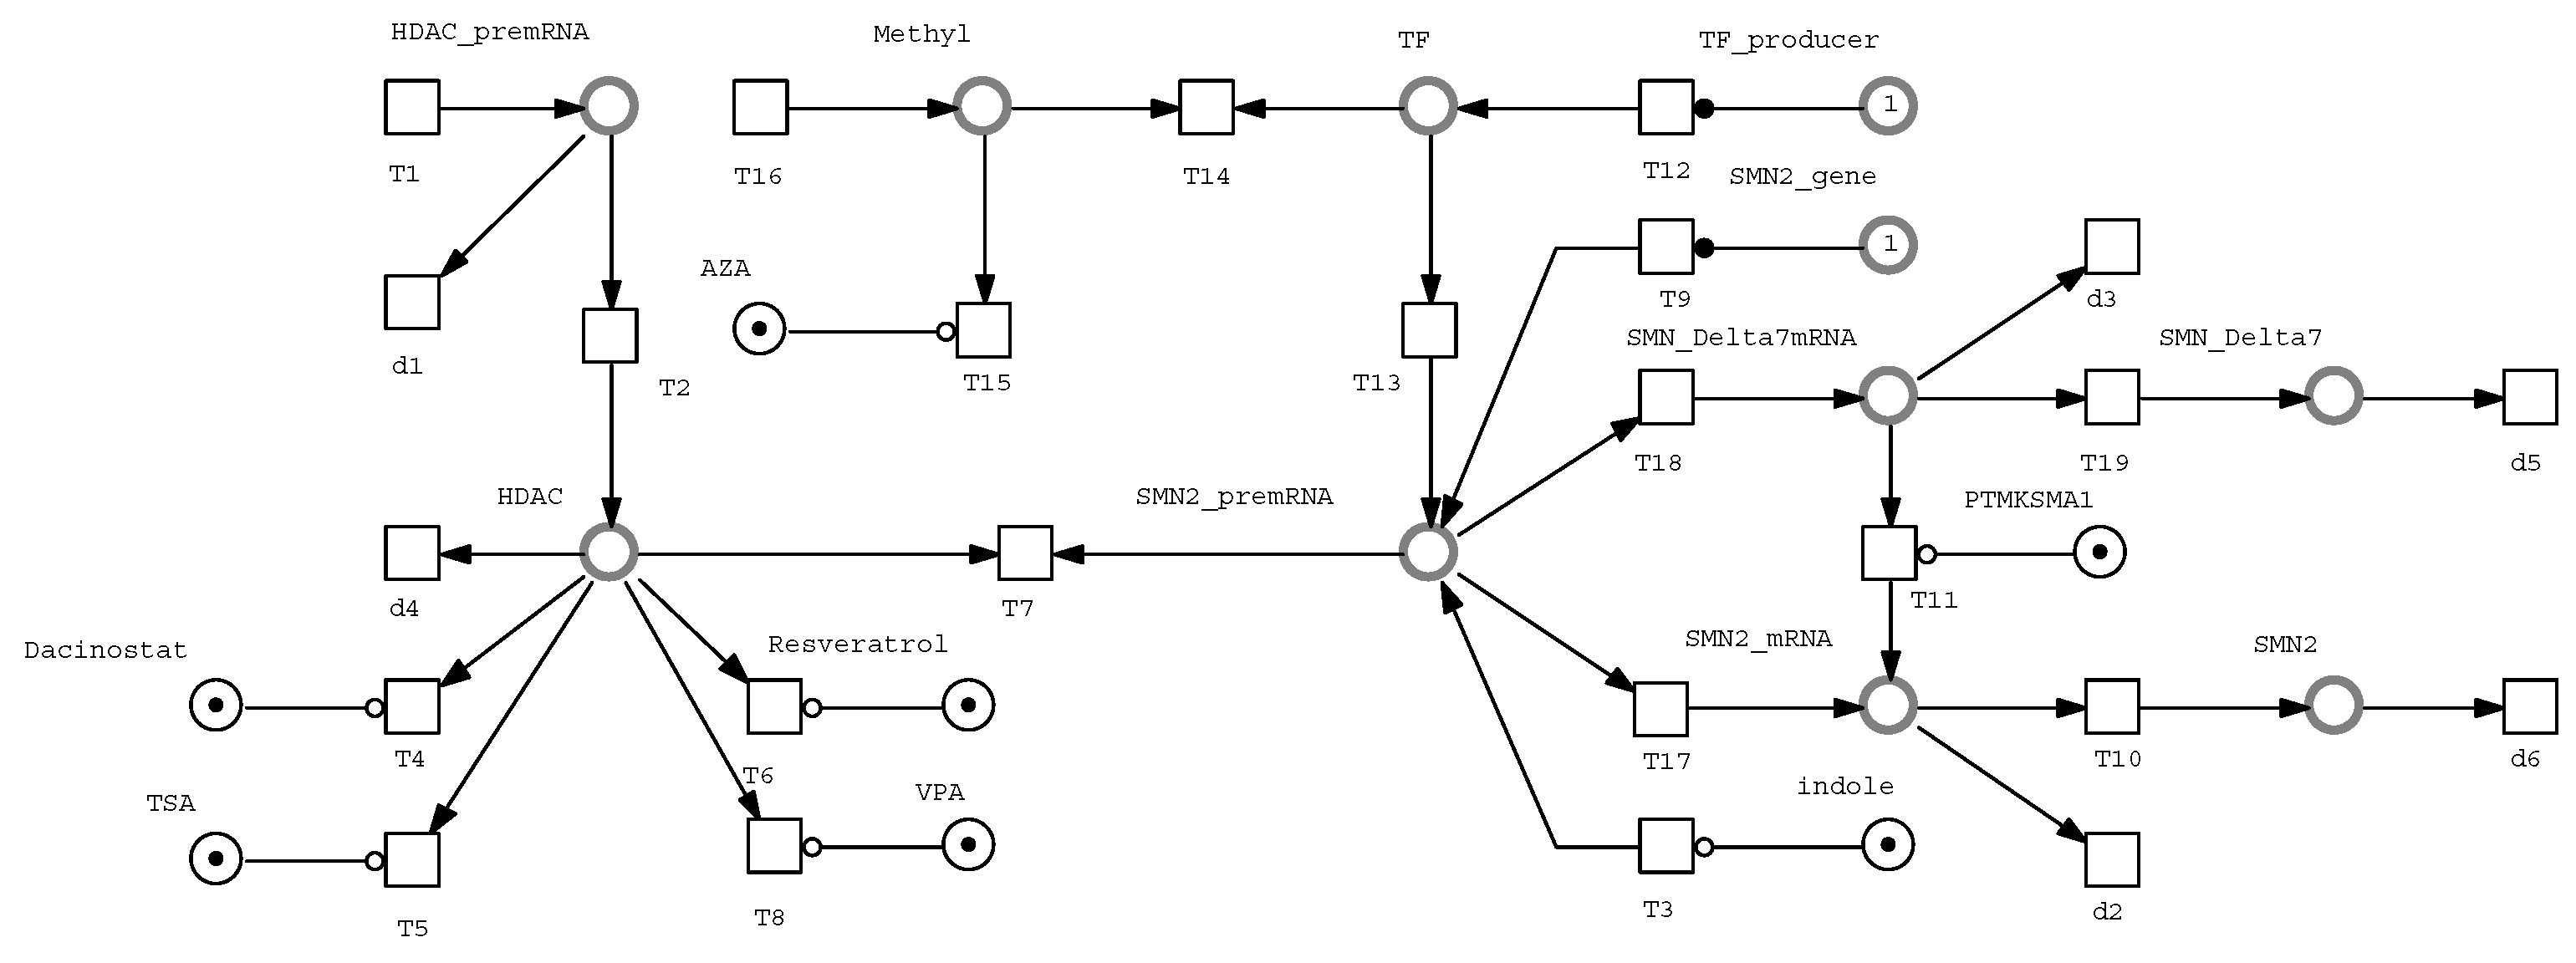
Figure 3.
The impact of effective combinations of drugs on the SMN protein folding (expressed in folds).
Figure 3.
The impact of effective combinations of drugs on the SMN protein folding (expressed in folds).
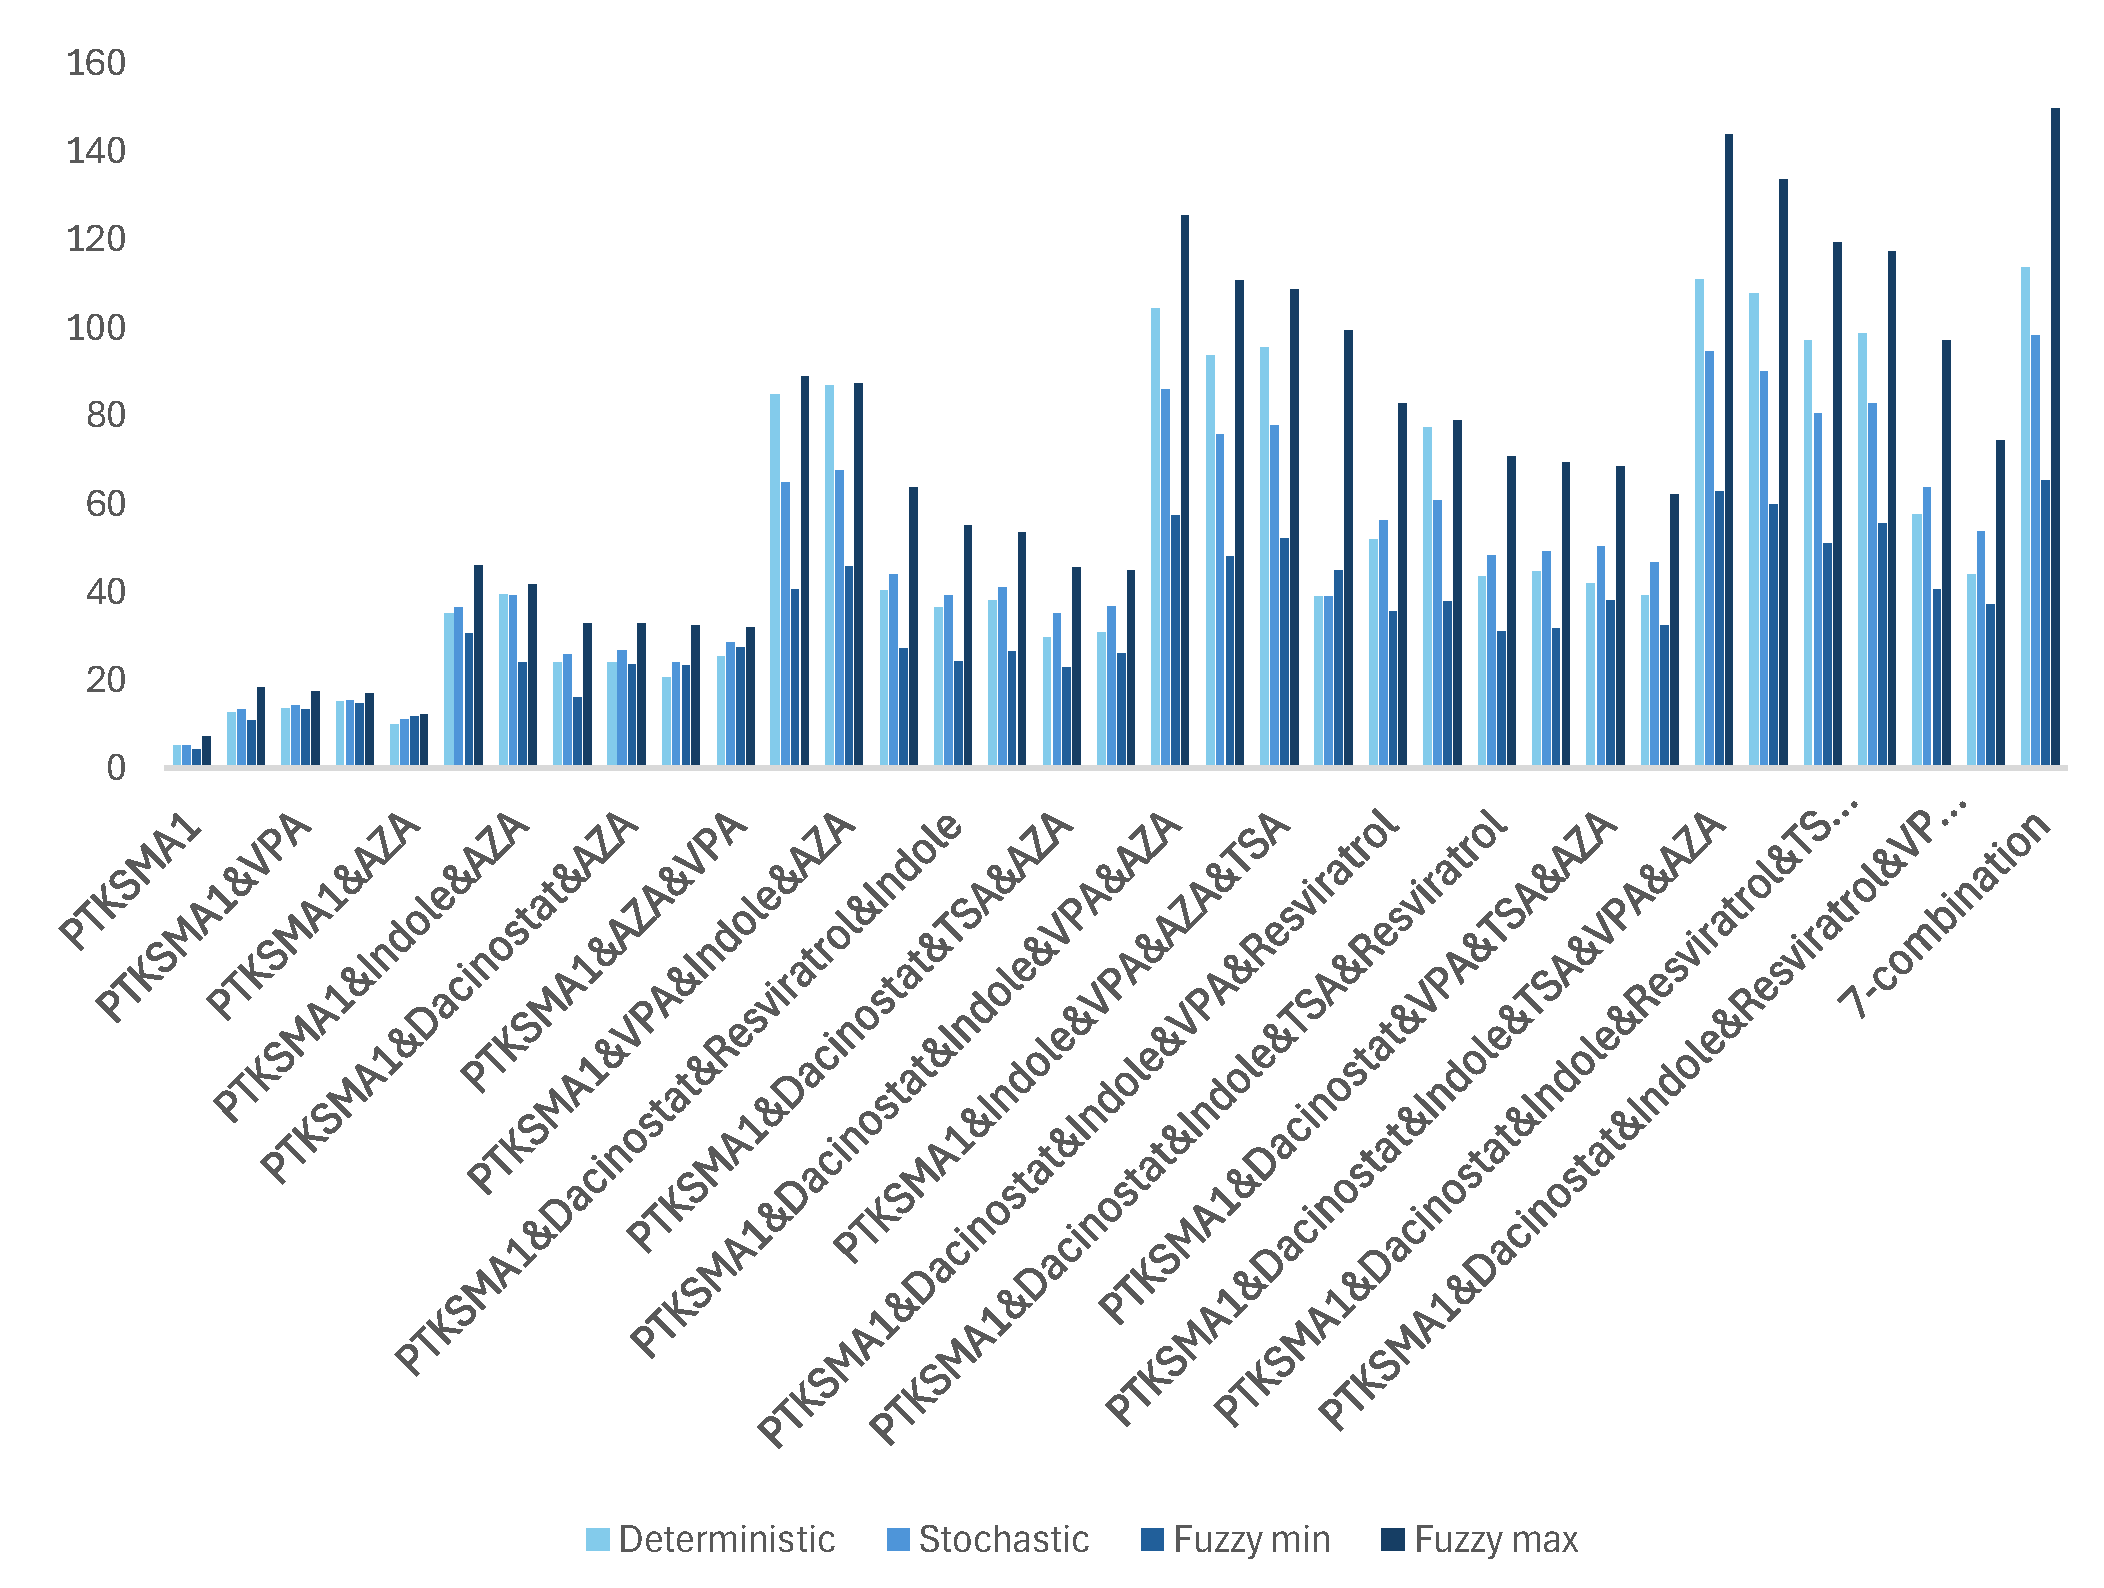
Figure 4.
The impact of effective combinations of two drugs on the SMN protein folding (expressed in folds).
Figure 4.
The impact of effective combinations of two drugs on the SMN protein folding (expressed in folds).
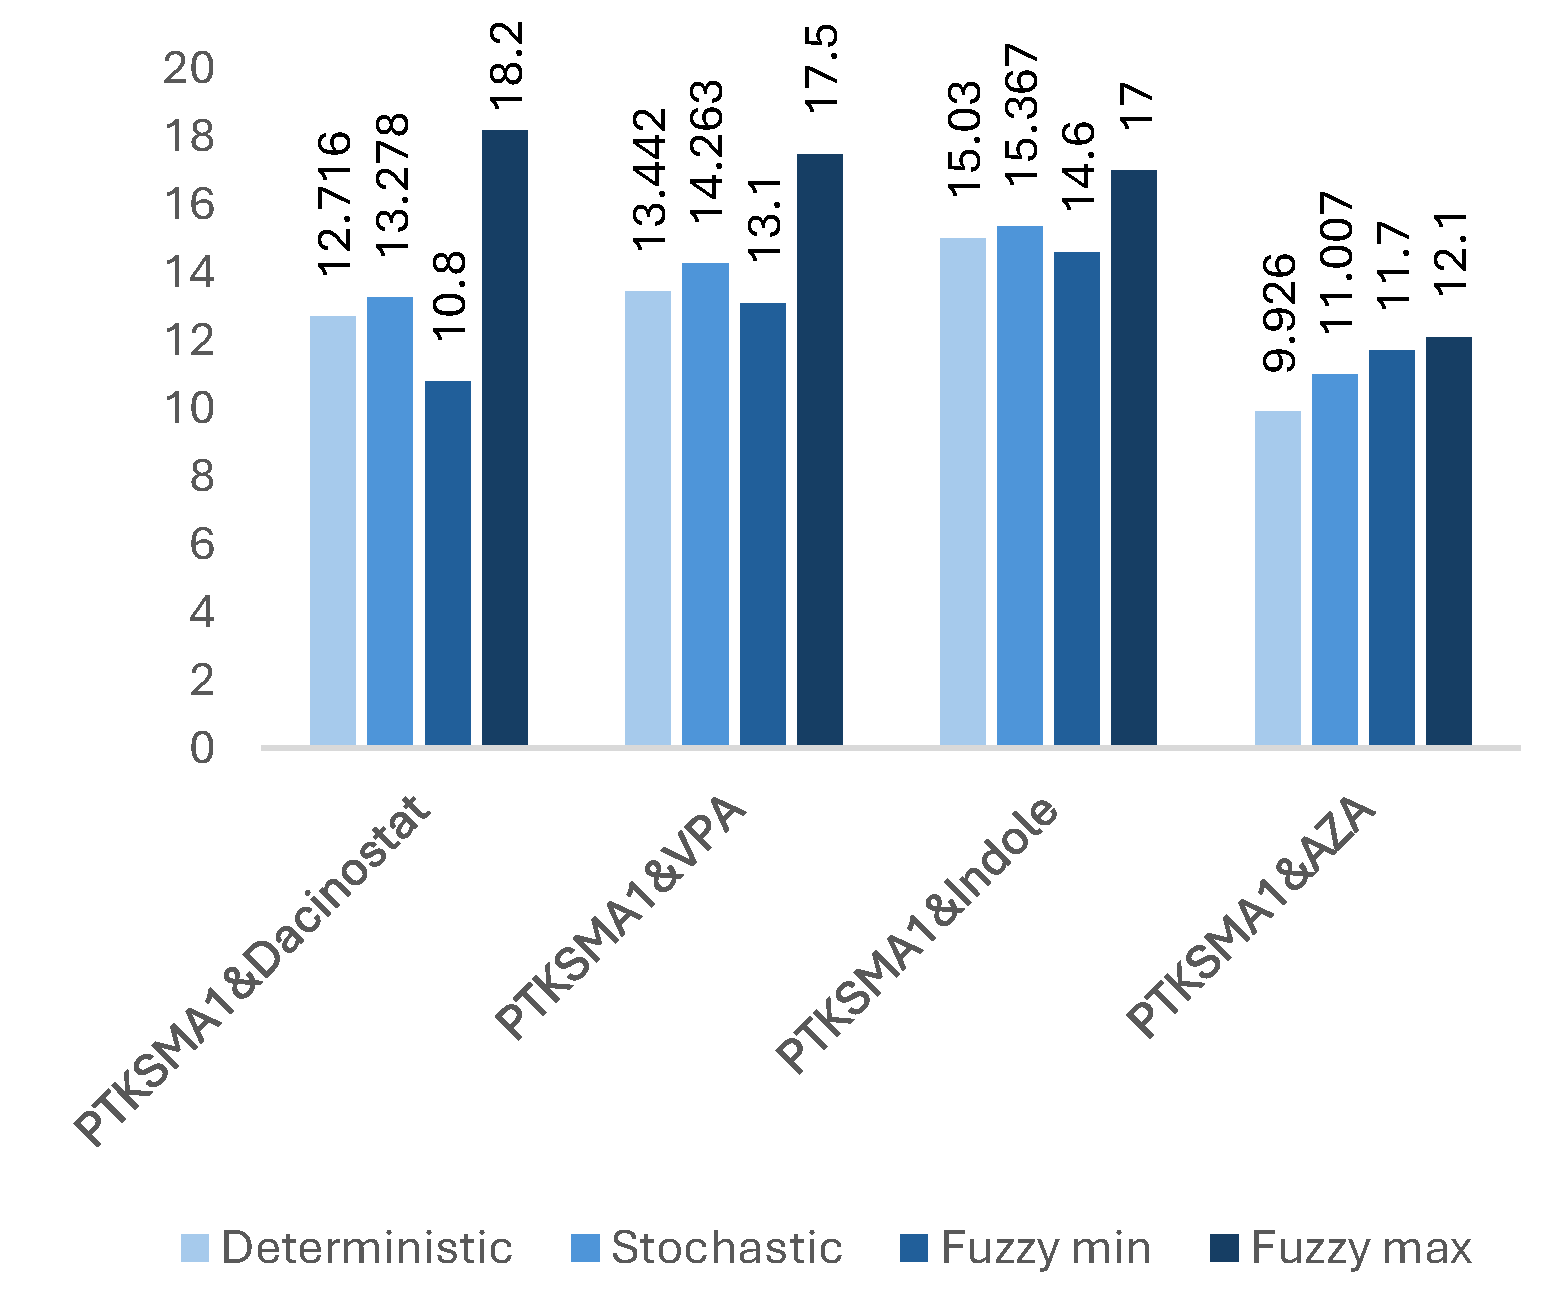
Figure 5.
The impact of effective combinations of three drugs on the SMN protein folding (expressed in folds).
Figure 5.
The impact of effective combinations of three drugs on the SMN protein folding (expressed in folds).
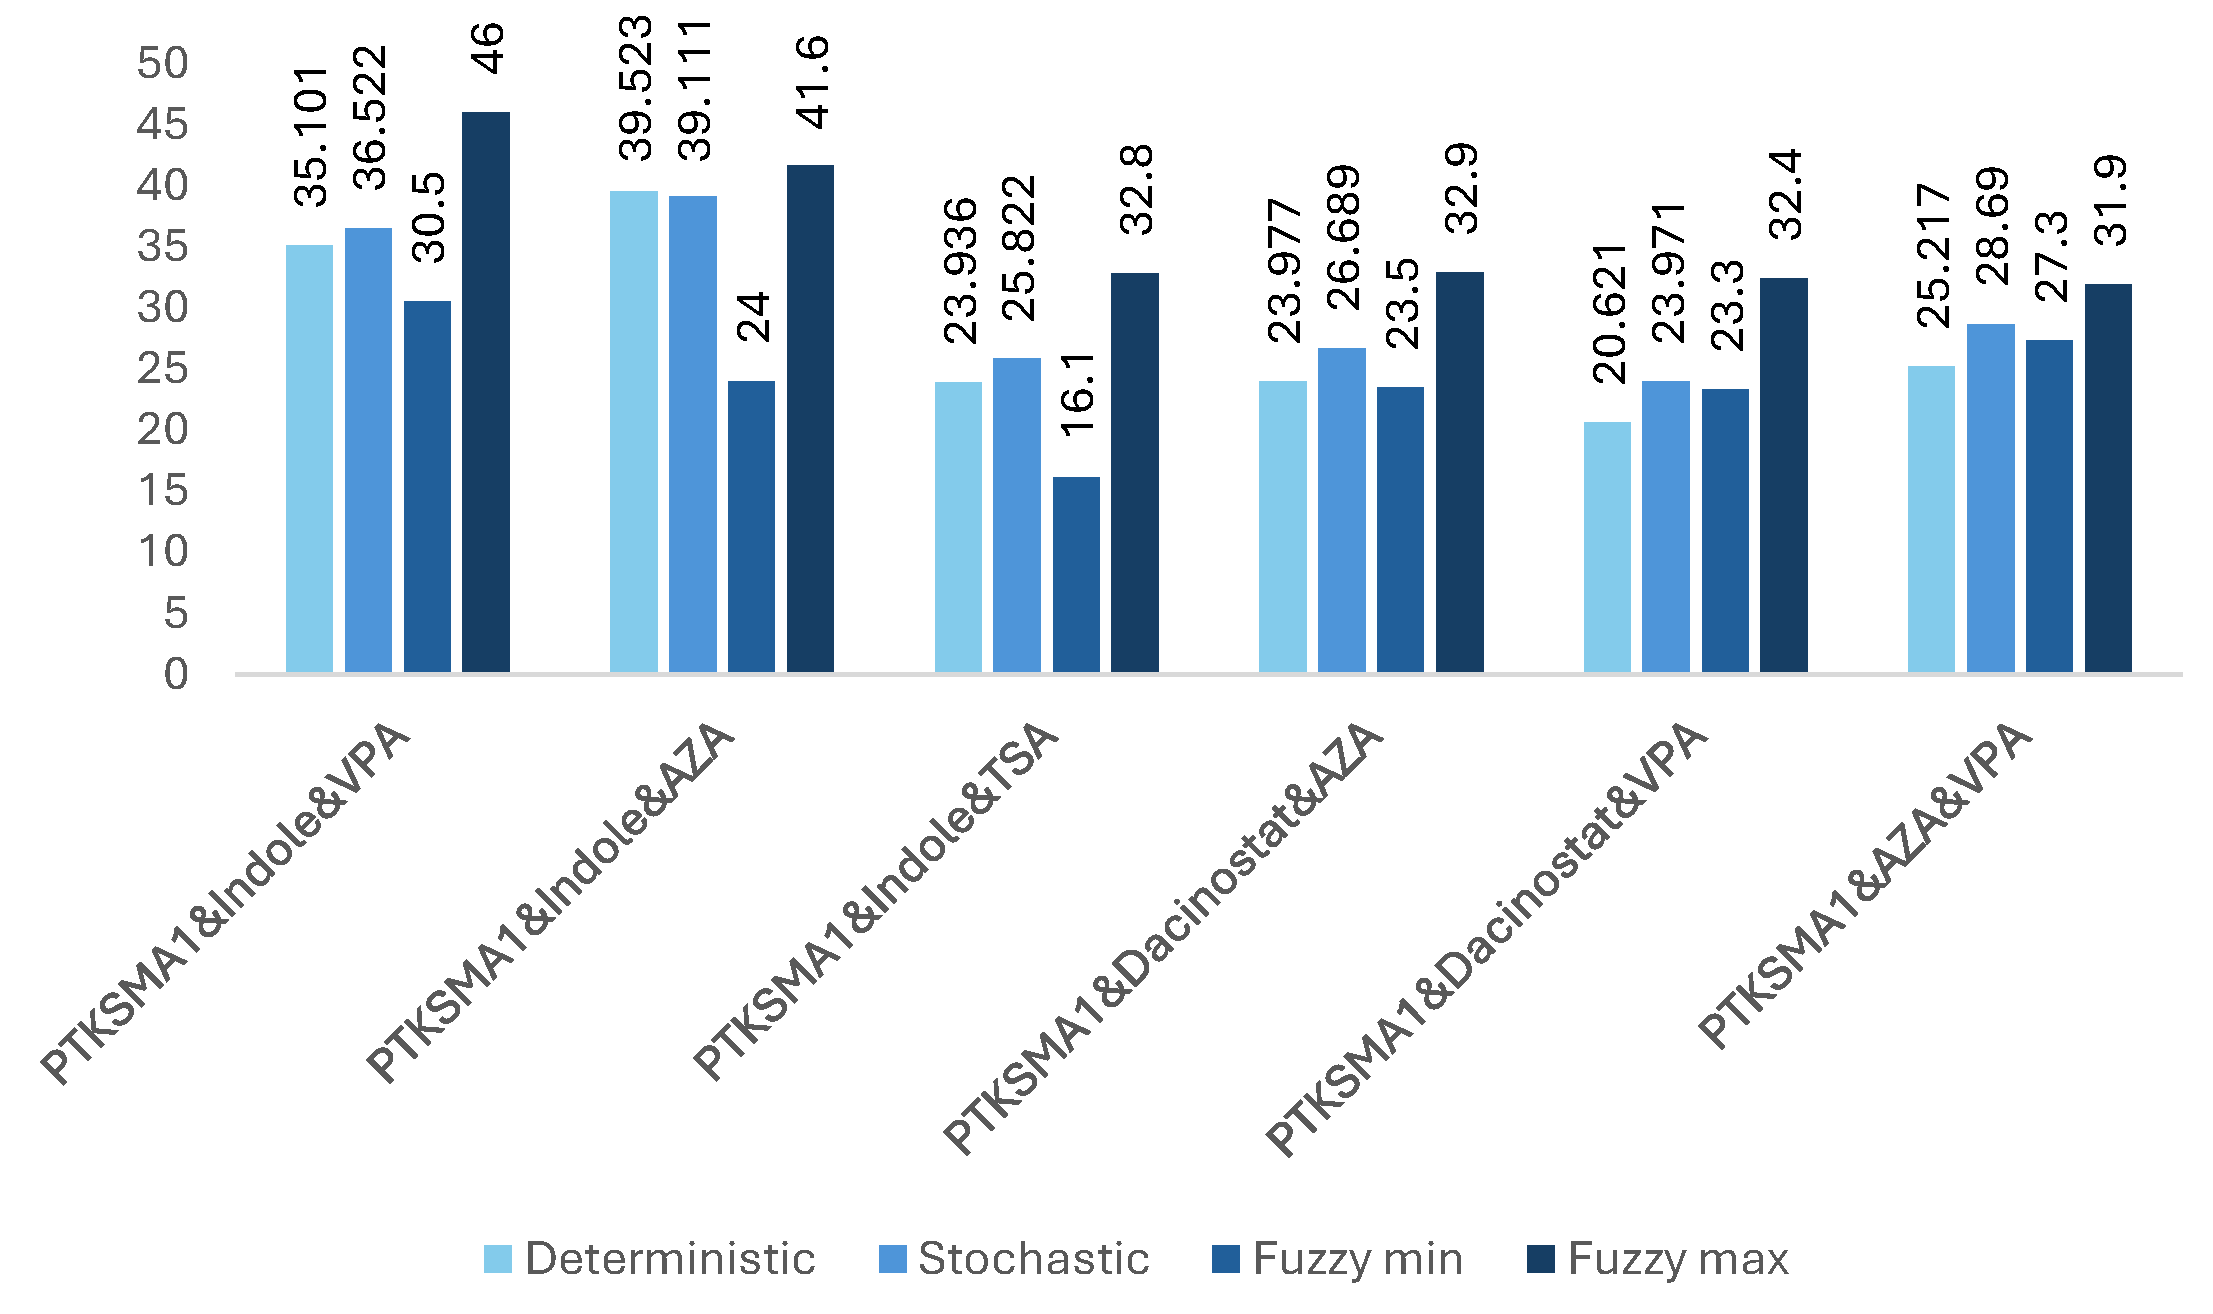
Figure 6.
The impact of effective combinations of four drugs on the SMN protein folding (expressed in folds).
Figure 6.
The impact of effective combinations of four drugs on the SMN protein folding (expressed in folds).
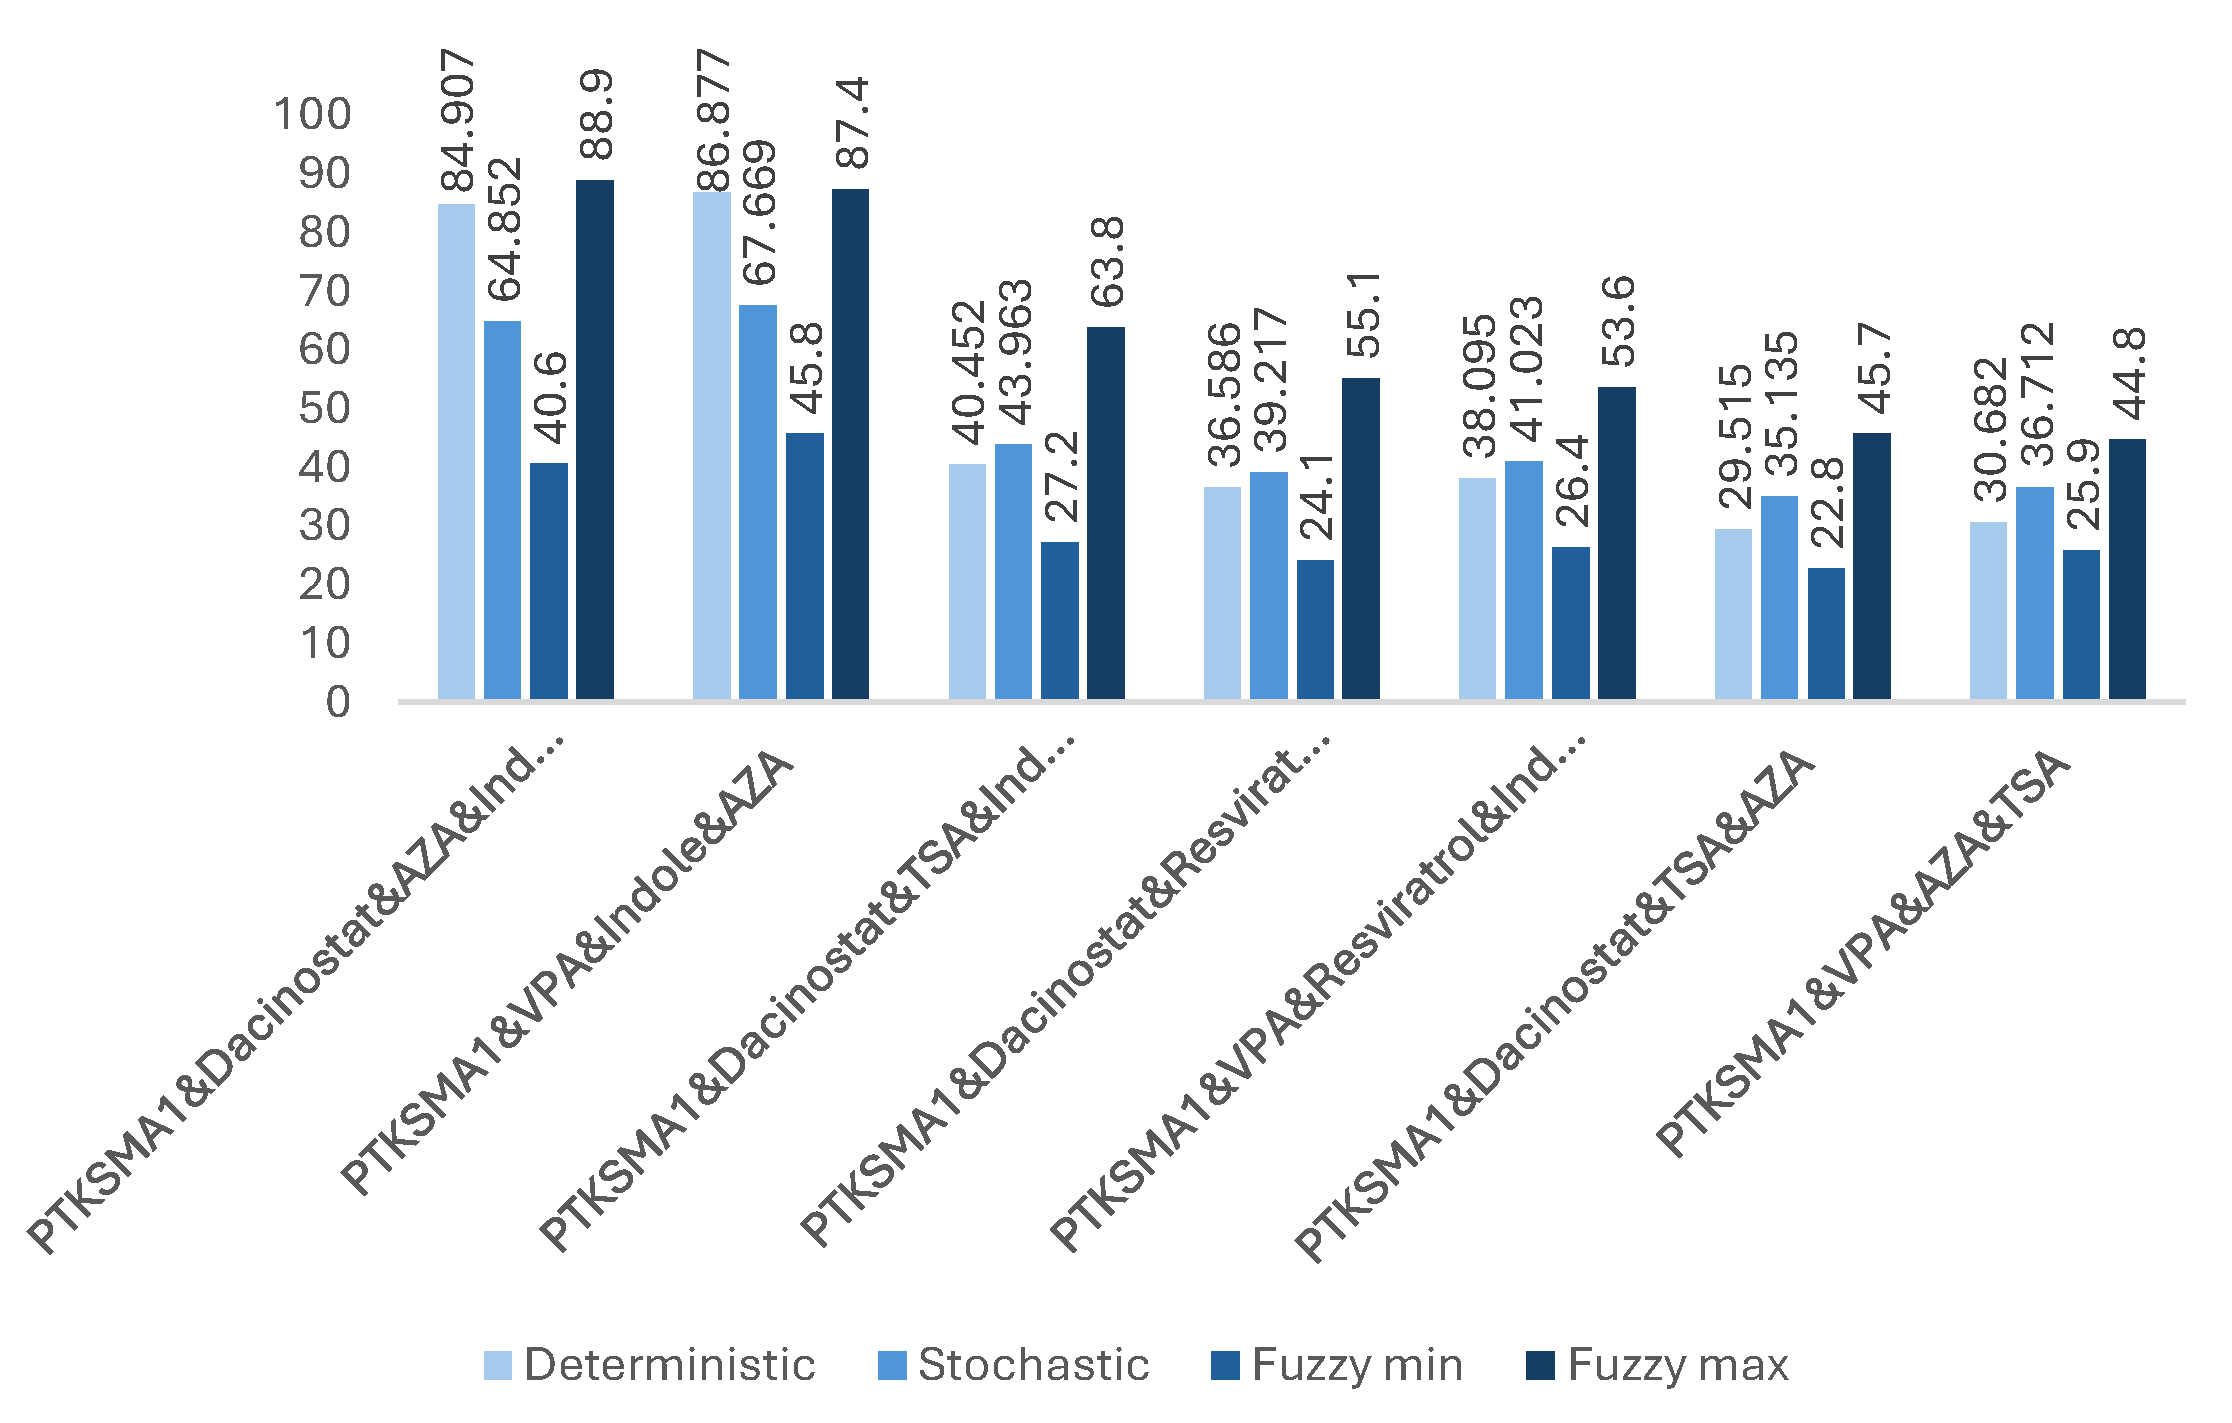
Figure 7.
The impact of effective combinations of five drugs on the SMN protein folding (expressed in folds).
Figure 7.
The impact of effective combinations of five drugs on the SMN protein folding (expressed in folds).
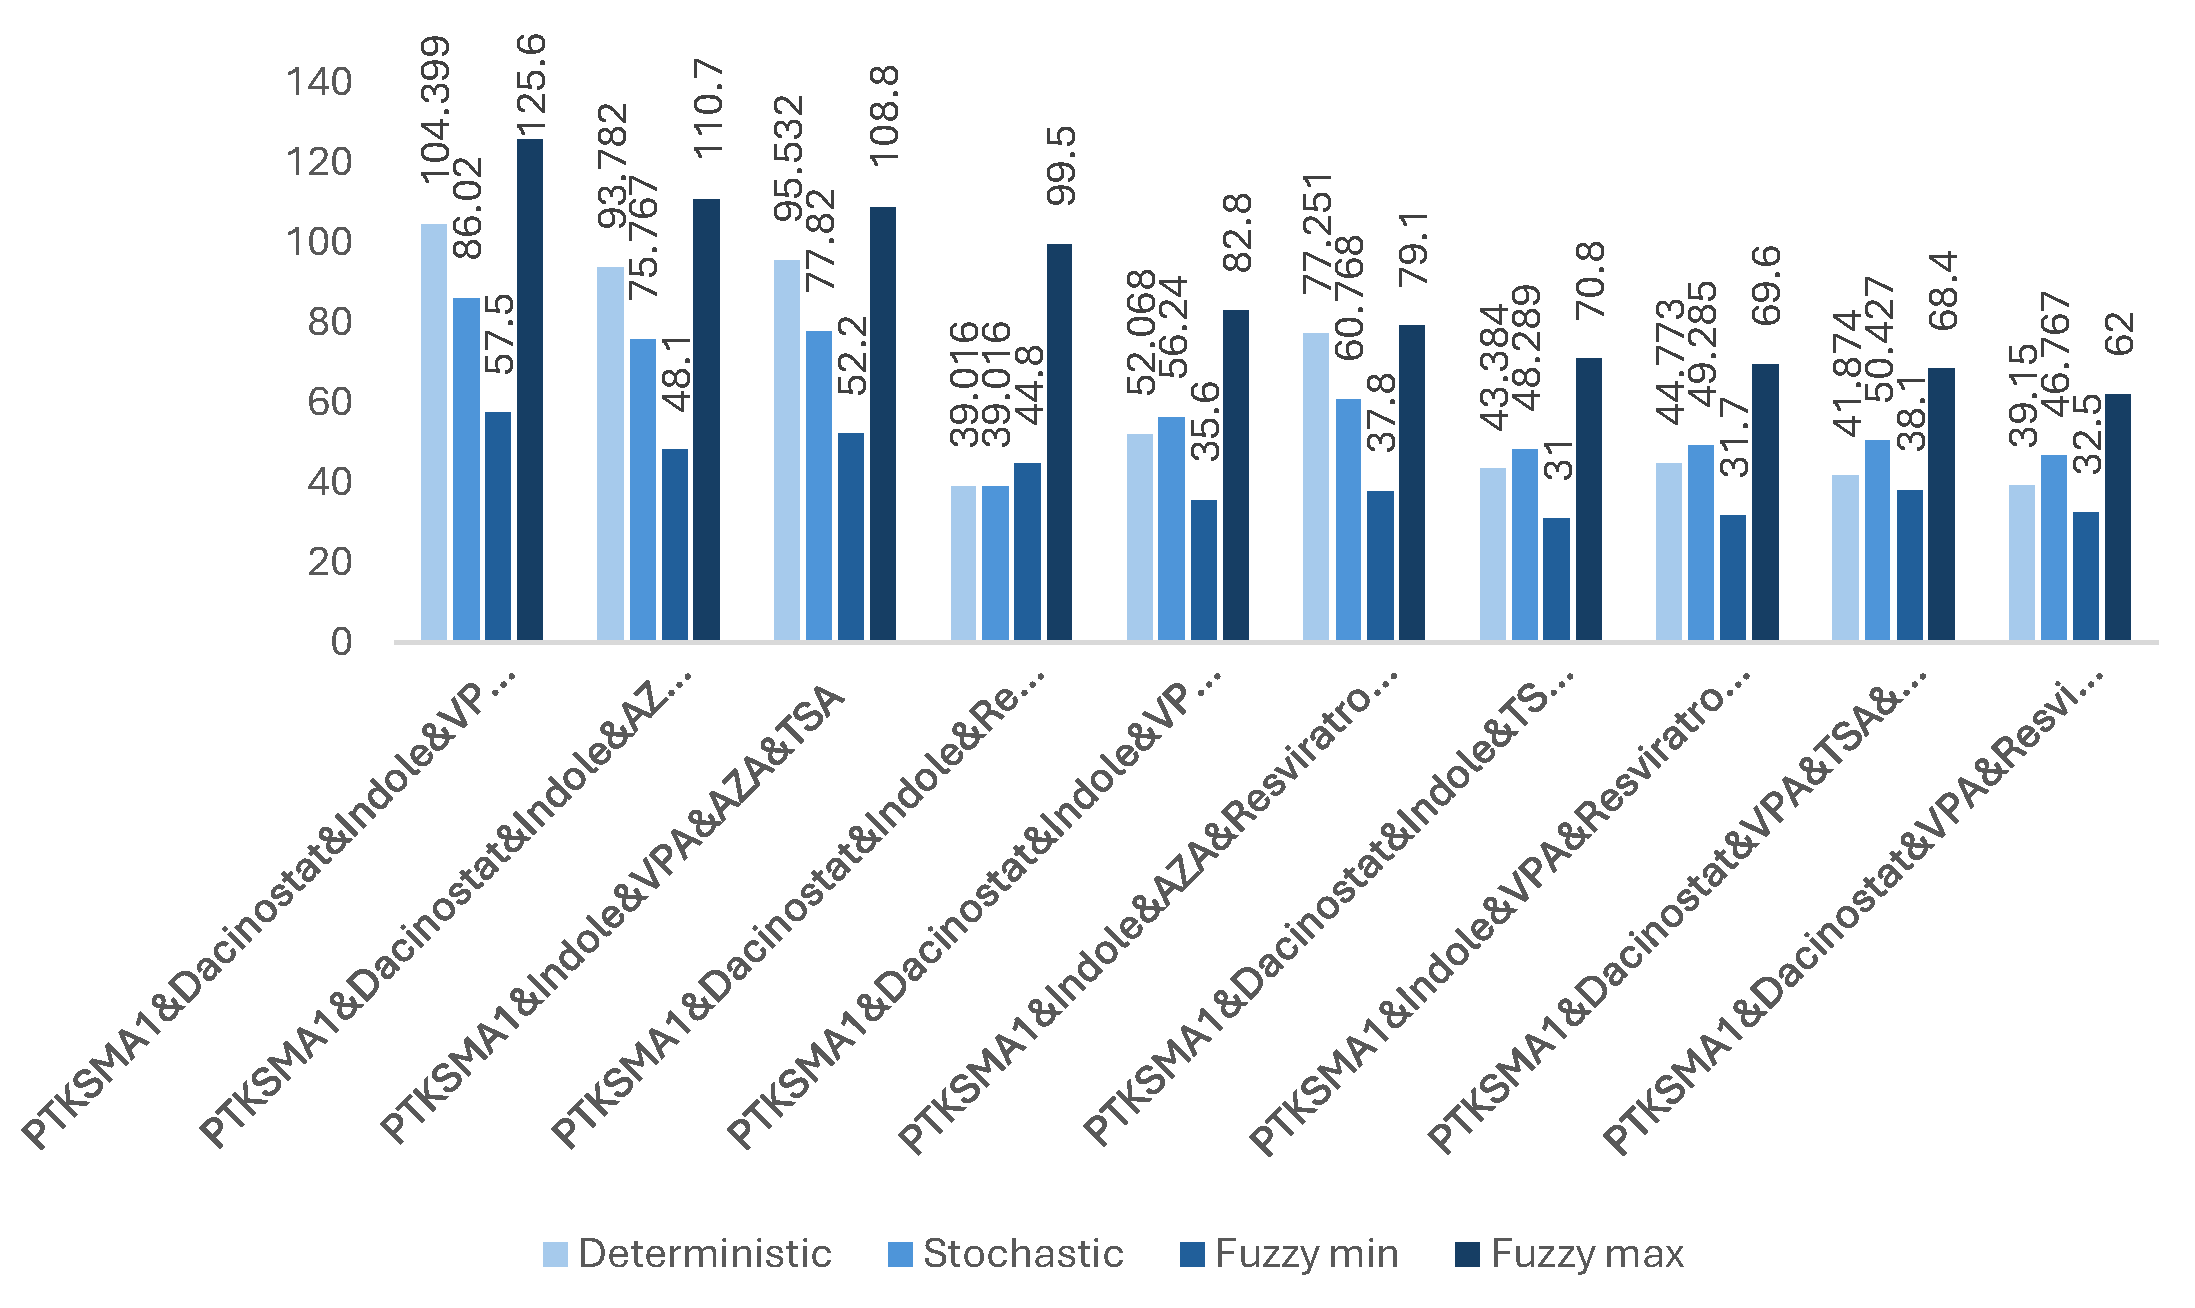
Figure 8.
The impact of effective combinations of six drugs on the SMN protein folding (expressed in folds).
Figure 8.
The impact of effective combinations of six drugs on the SMN protein folding (expressed in folds).
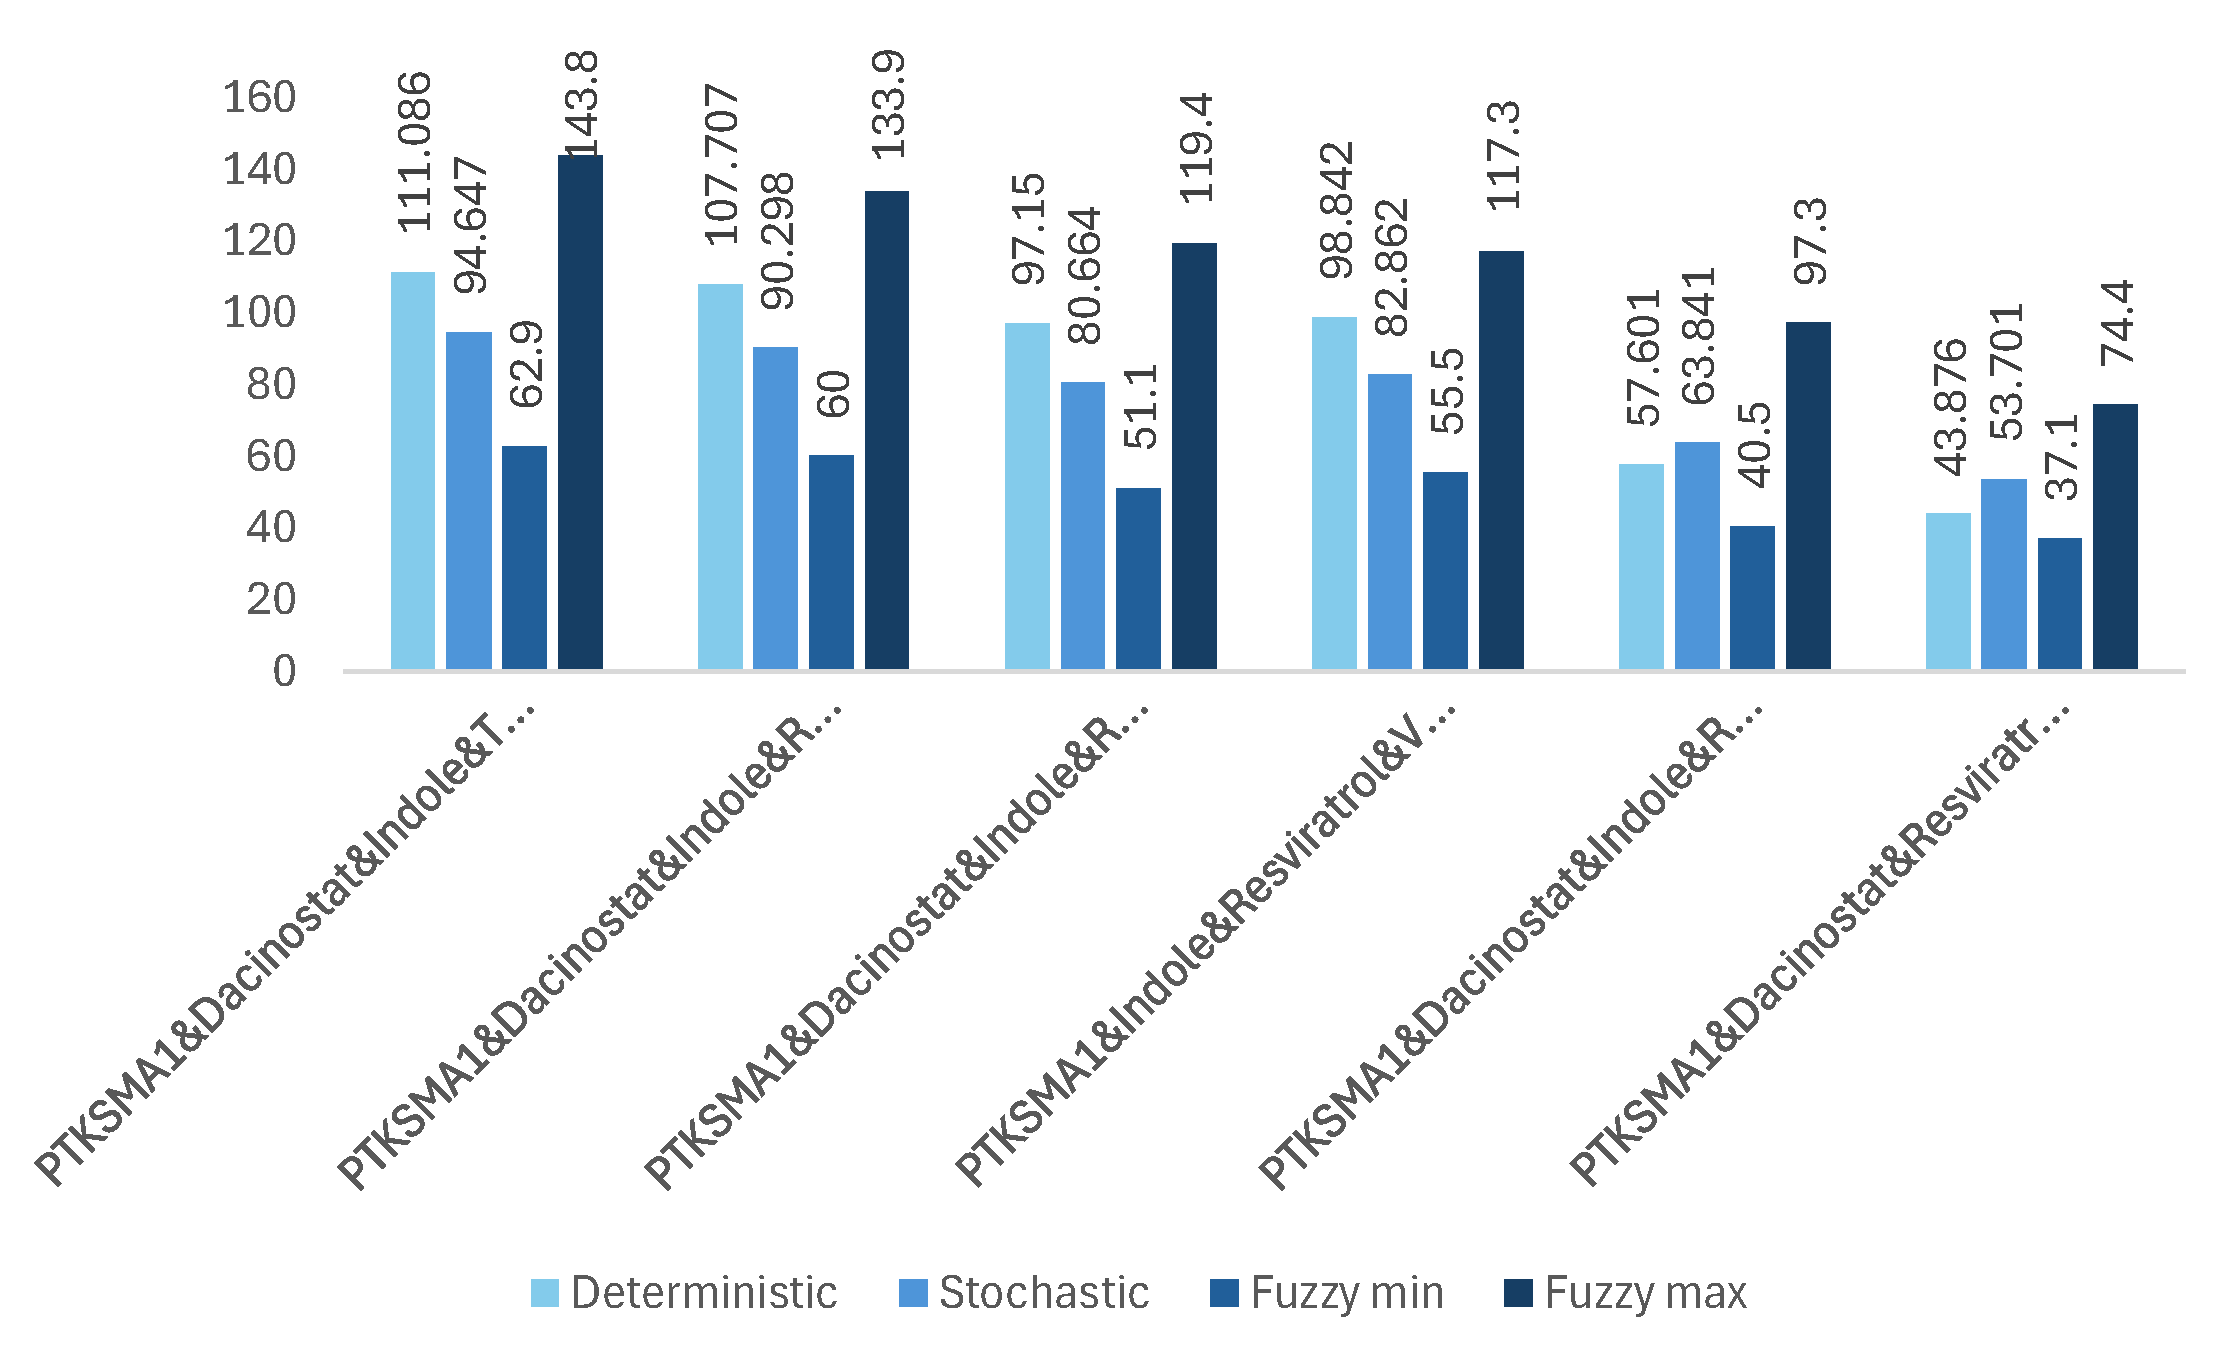

Table 1.
The test statistics collected from Friedman and Dun-Bonferroni tests for best effective combinations of drugs.
Table 1.
The test statistics collected from Friedman and Dun-Bonferroni tests for best effective combinations of drugs.
 |
Disclaimer/Publisher’s Note: The statements, opinions and data contained in all publications are solely those of the individual author(s) and contributor(s) and not of MDPI and/or the editor(s). MDPI and/or the editor(s) disclaim responsibility for any injury to people or property resulting from any ideas, methods, instructions or products referred to in the content. |
© 2024 by the authors. Licensee MDPI, Basel, Switzerland. This article is an open access article distributed under the terms and conditions of the Creative Commons Attribution (CC BY) license (http://creativecommons.org/licenses/by/4.0/).
Copyright: This open access article is published under a Creative Commons CC BY 4.0 license, which permit the free download, distribution, and reuse, provided that the author and preprint are cited in any reuse.


