Submitted:
18 October 2024
Posted:
18 October 2024
You are already at the latest version
Abstract
Keywords:
1. Introduction
2. Materials and Methods
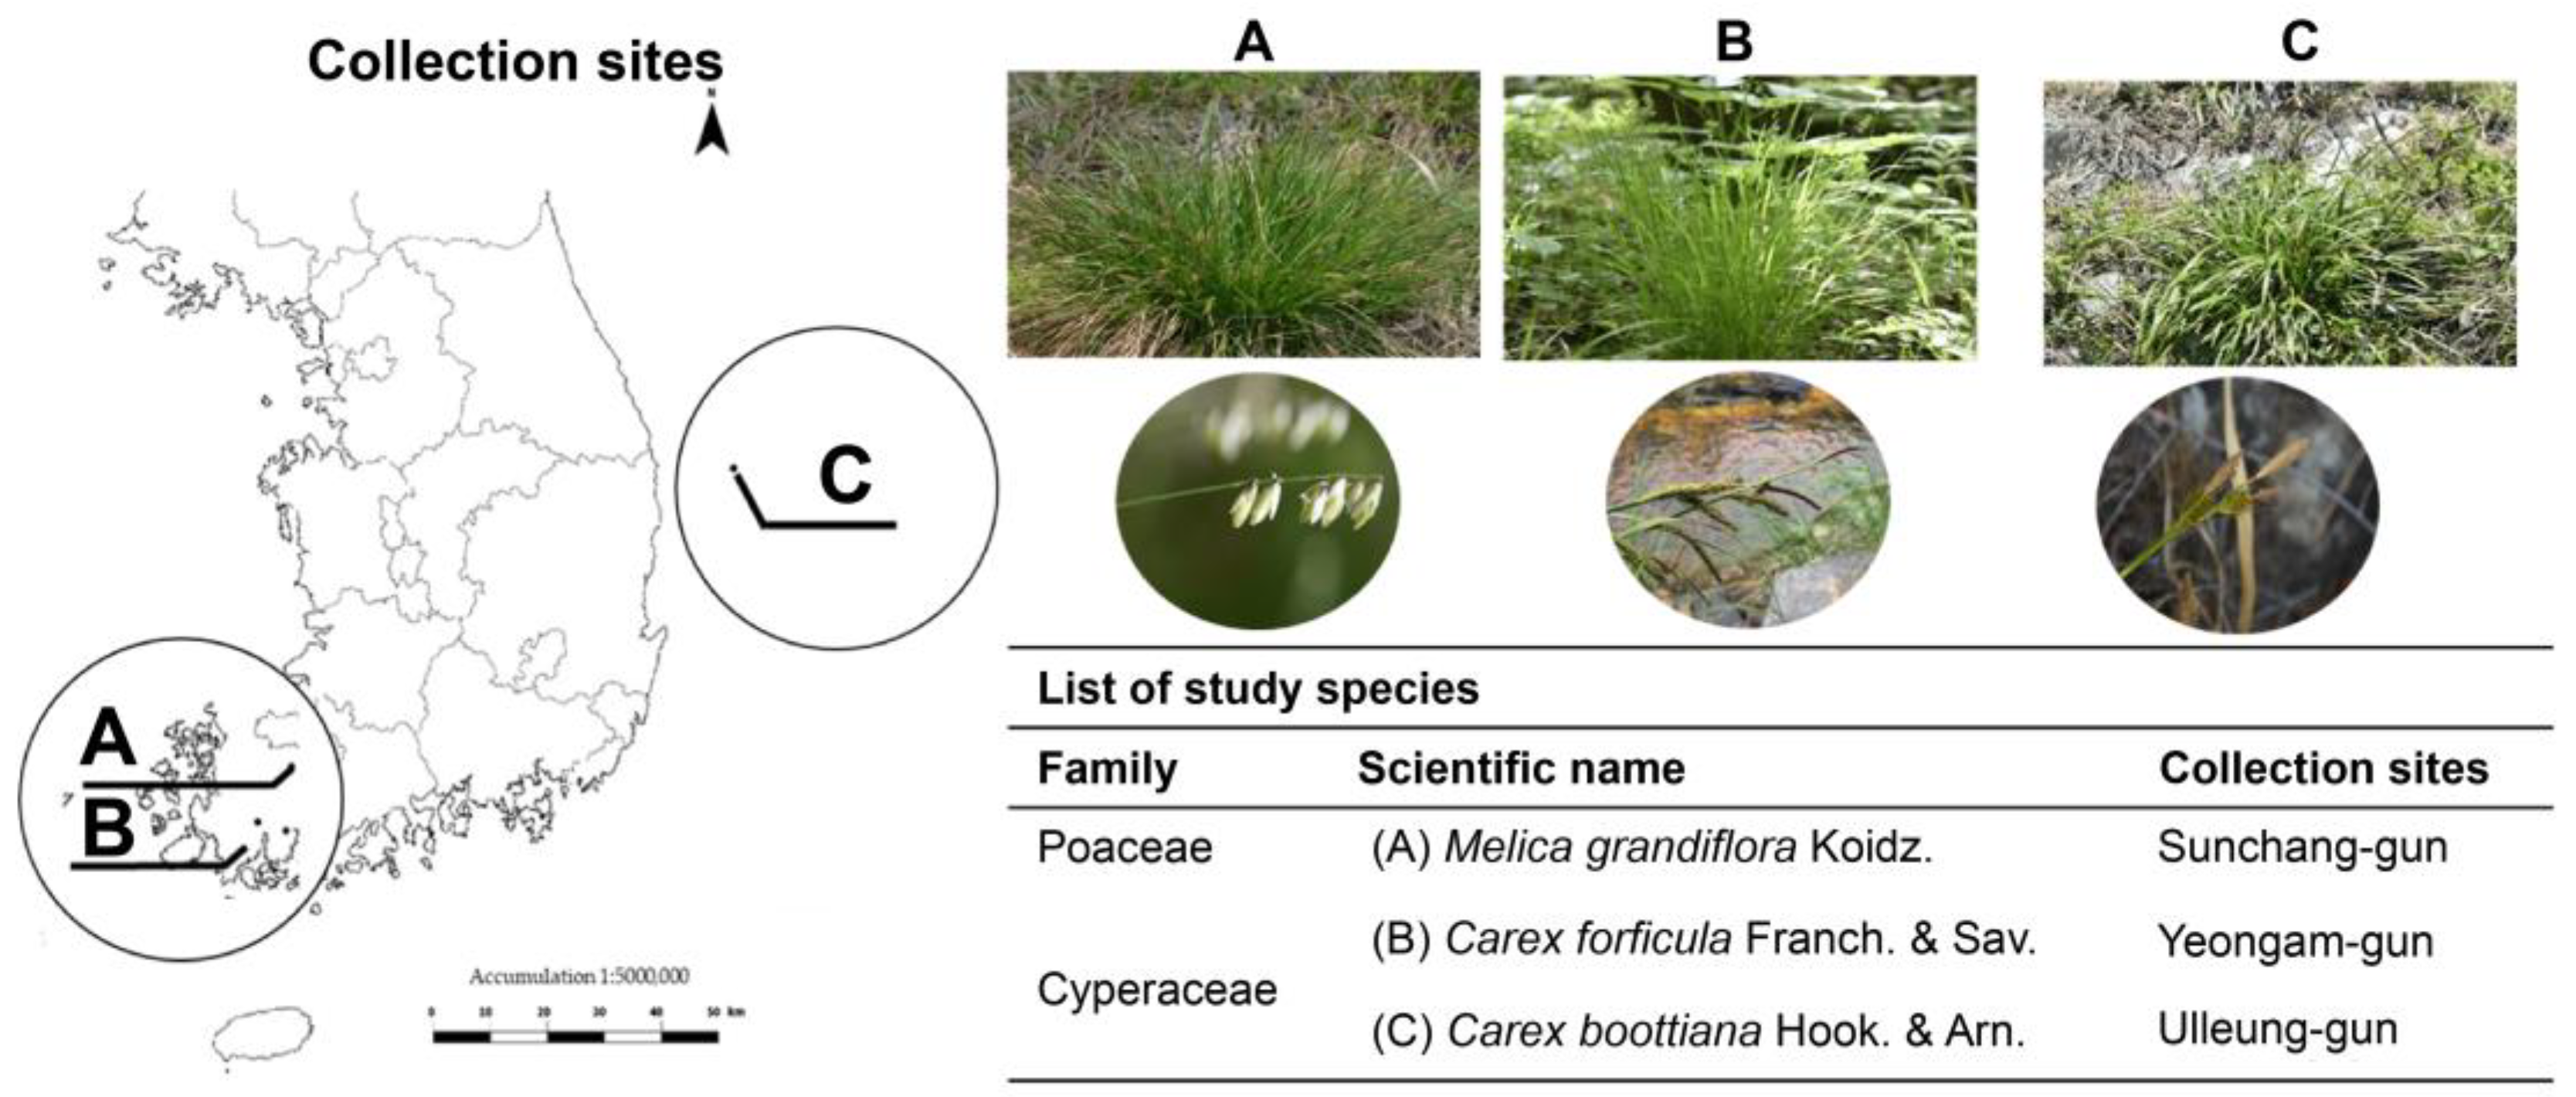
2.1. Plant Materials and Experimental Design for Drought and Salinity Stress
2.2. Photosynthetic Parameters
2.3. Measurements of Chlorophyll Parameters
2.4. Determination of Malondialdehyde Content for Estimating Membrane Damage
2.5. Determination of O2.- and H2O2 Concentration
2.6. Statistical Analysis
3. Results
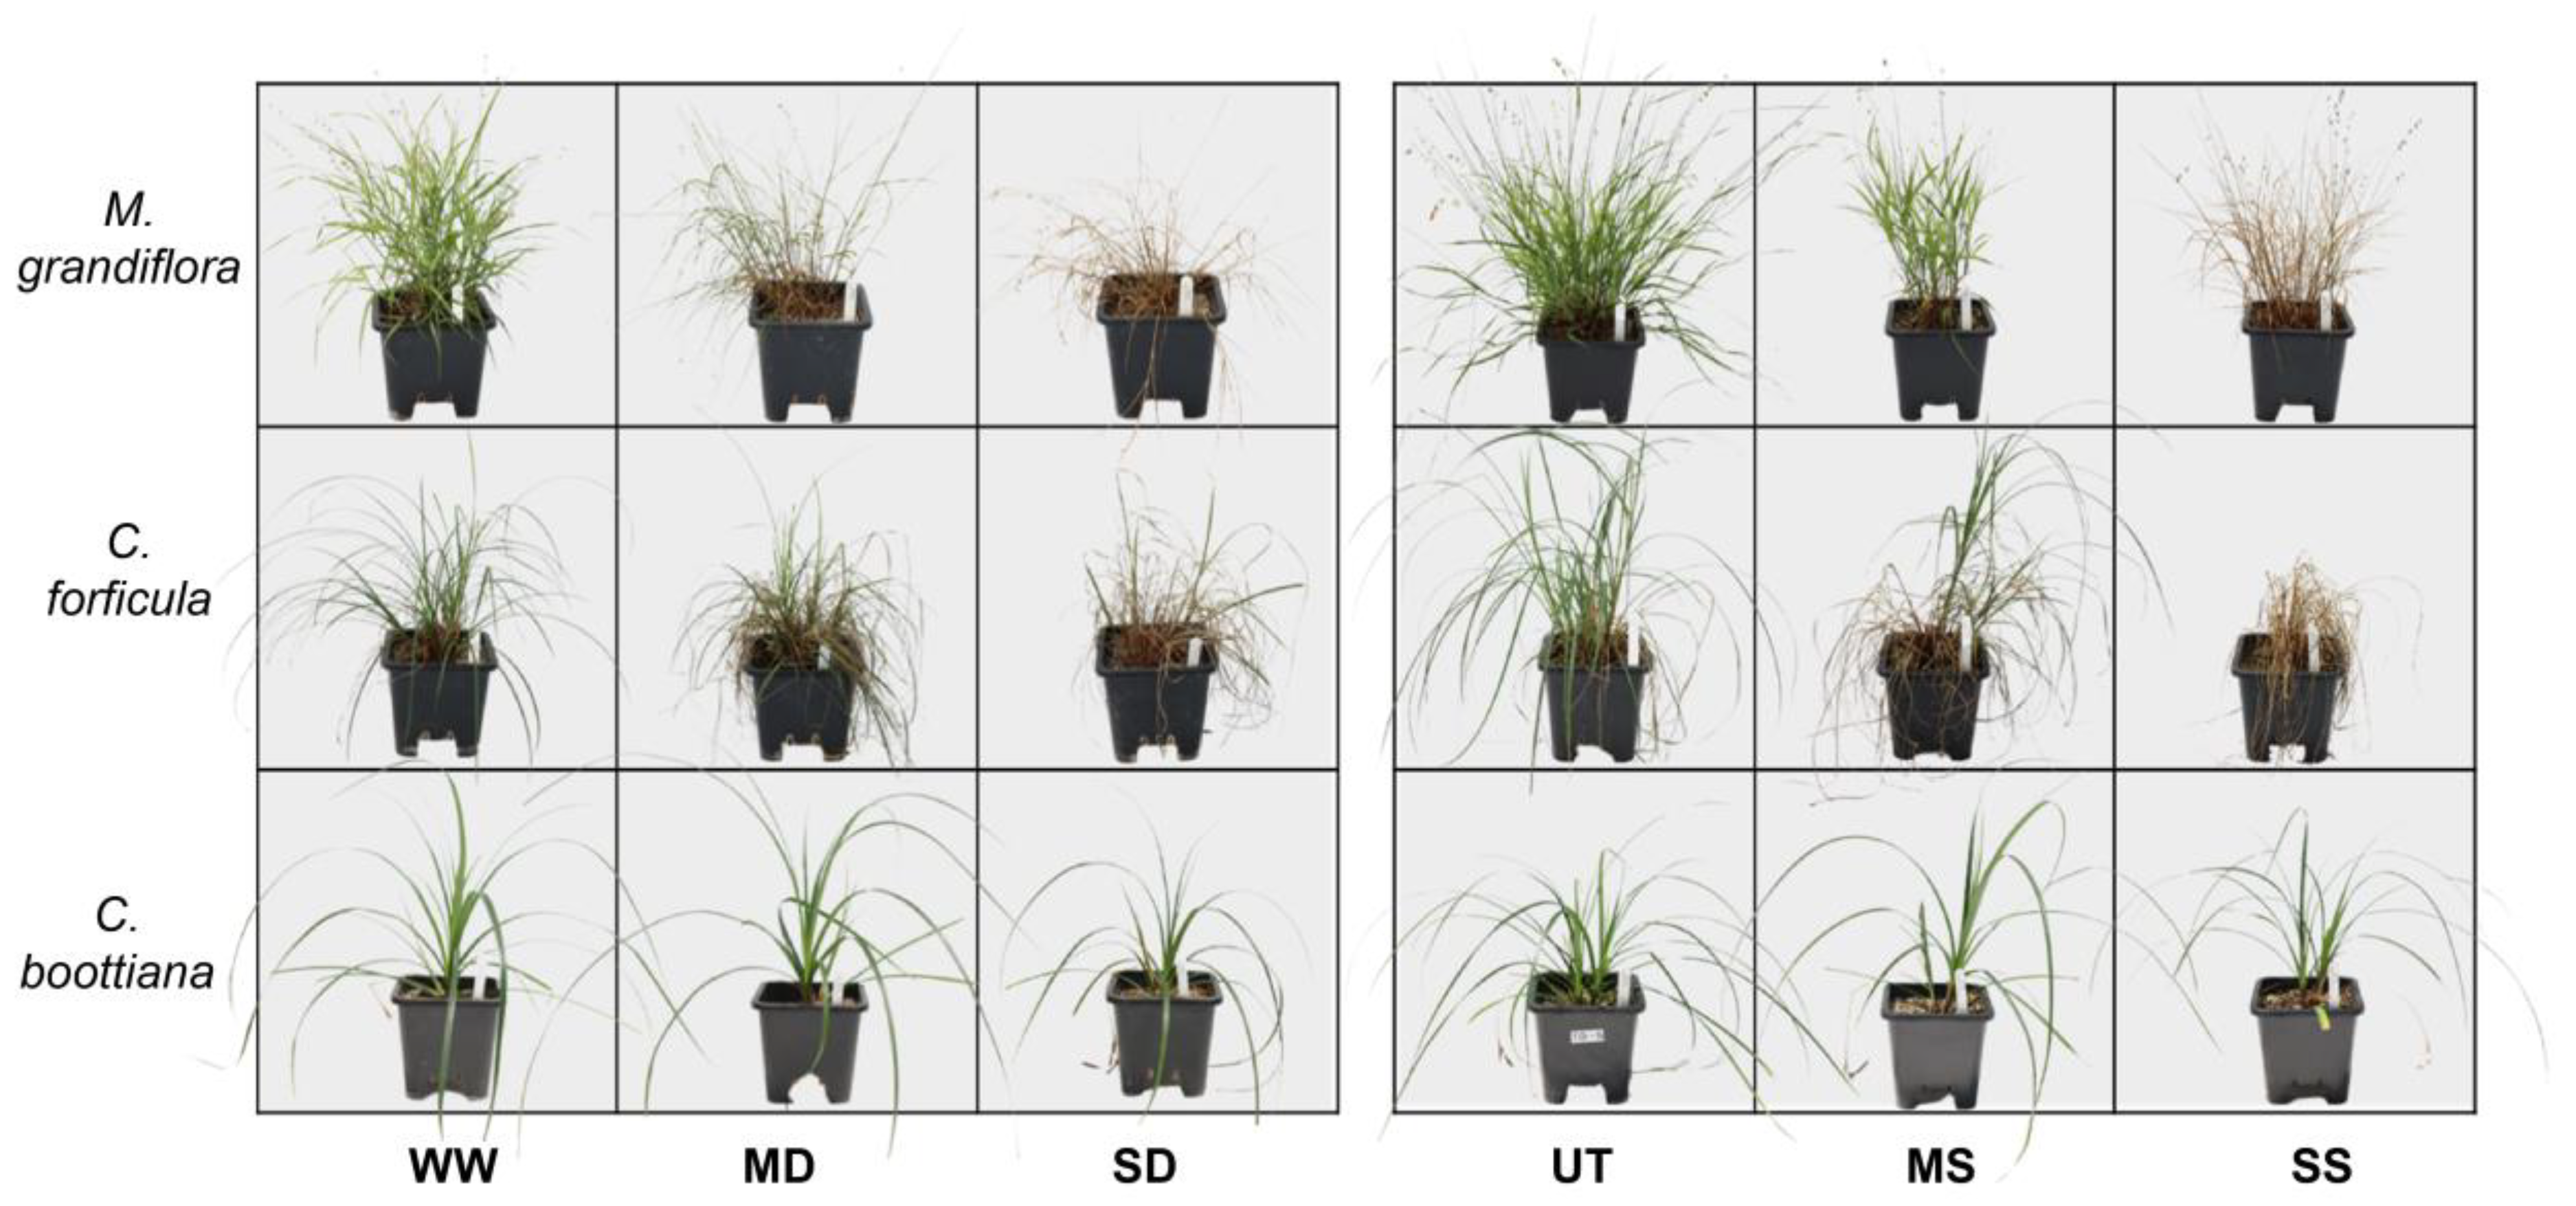
3.1. Changes in Growth and Visible Injuries
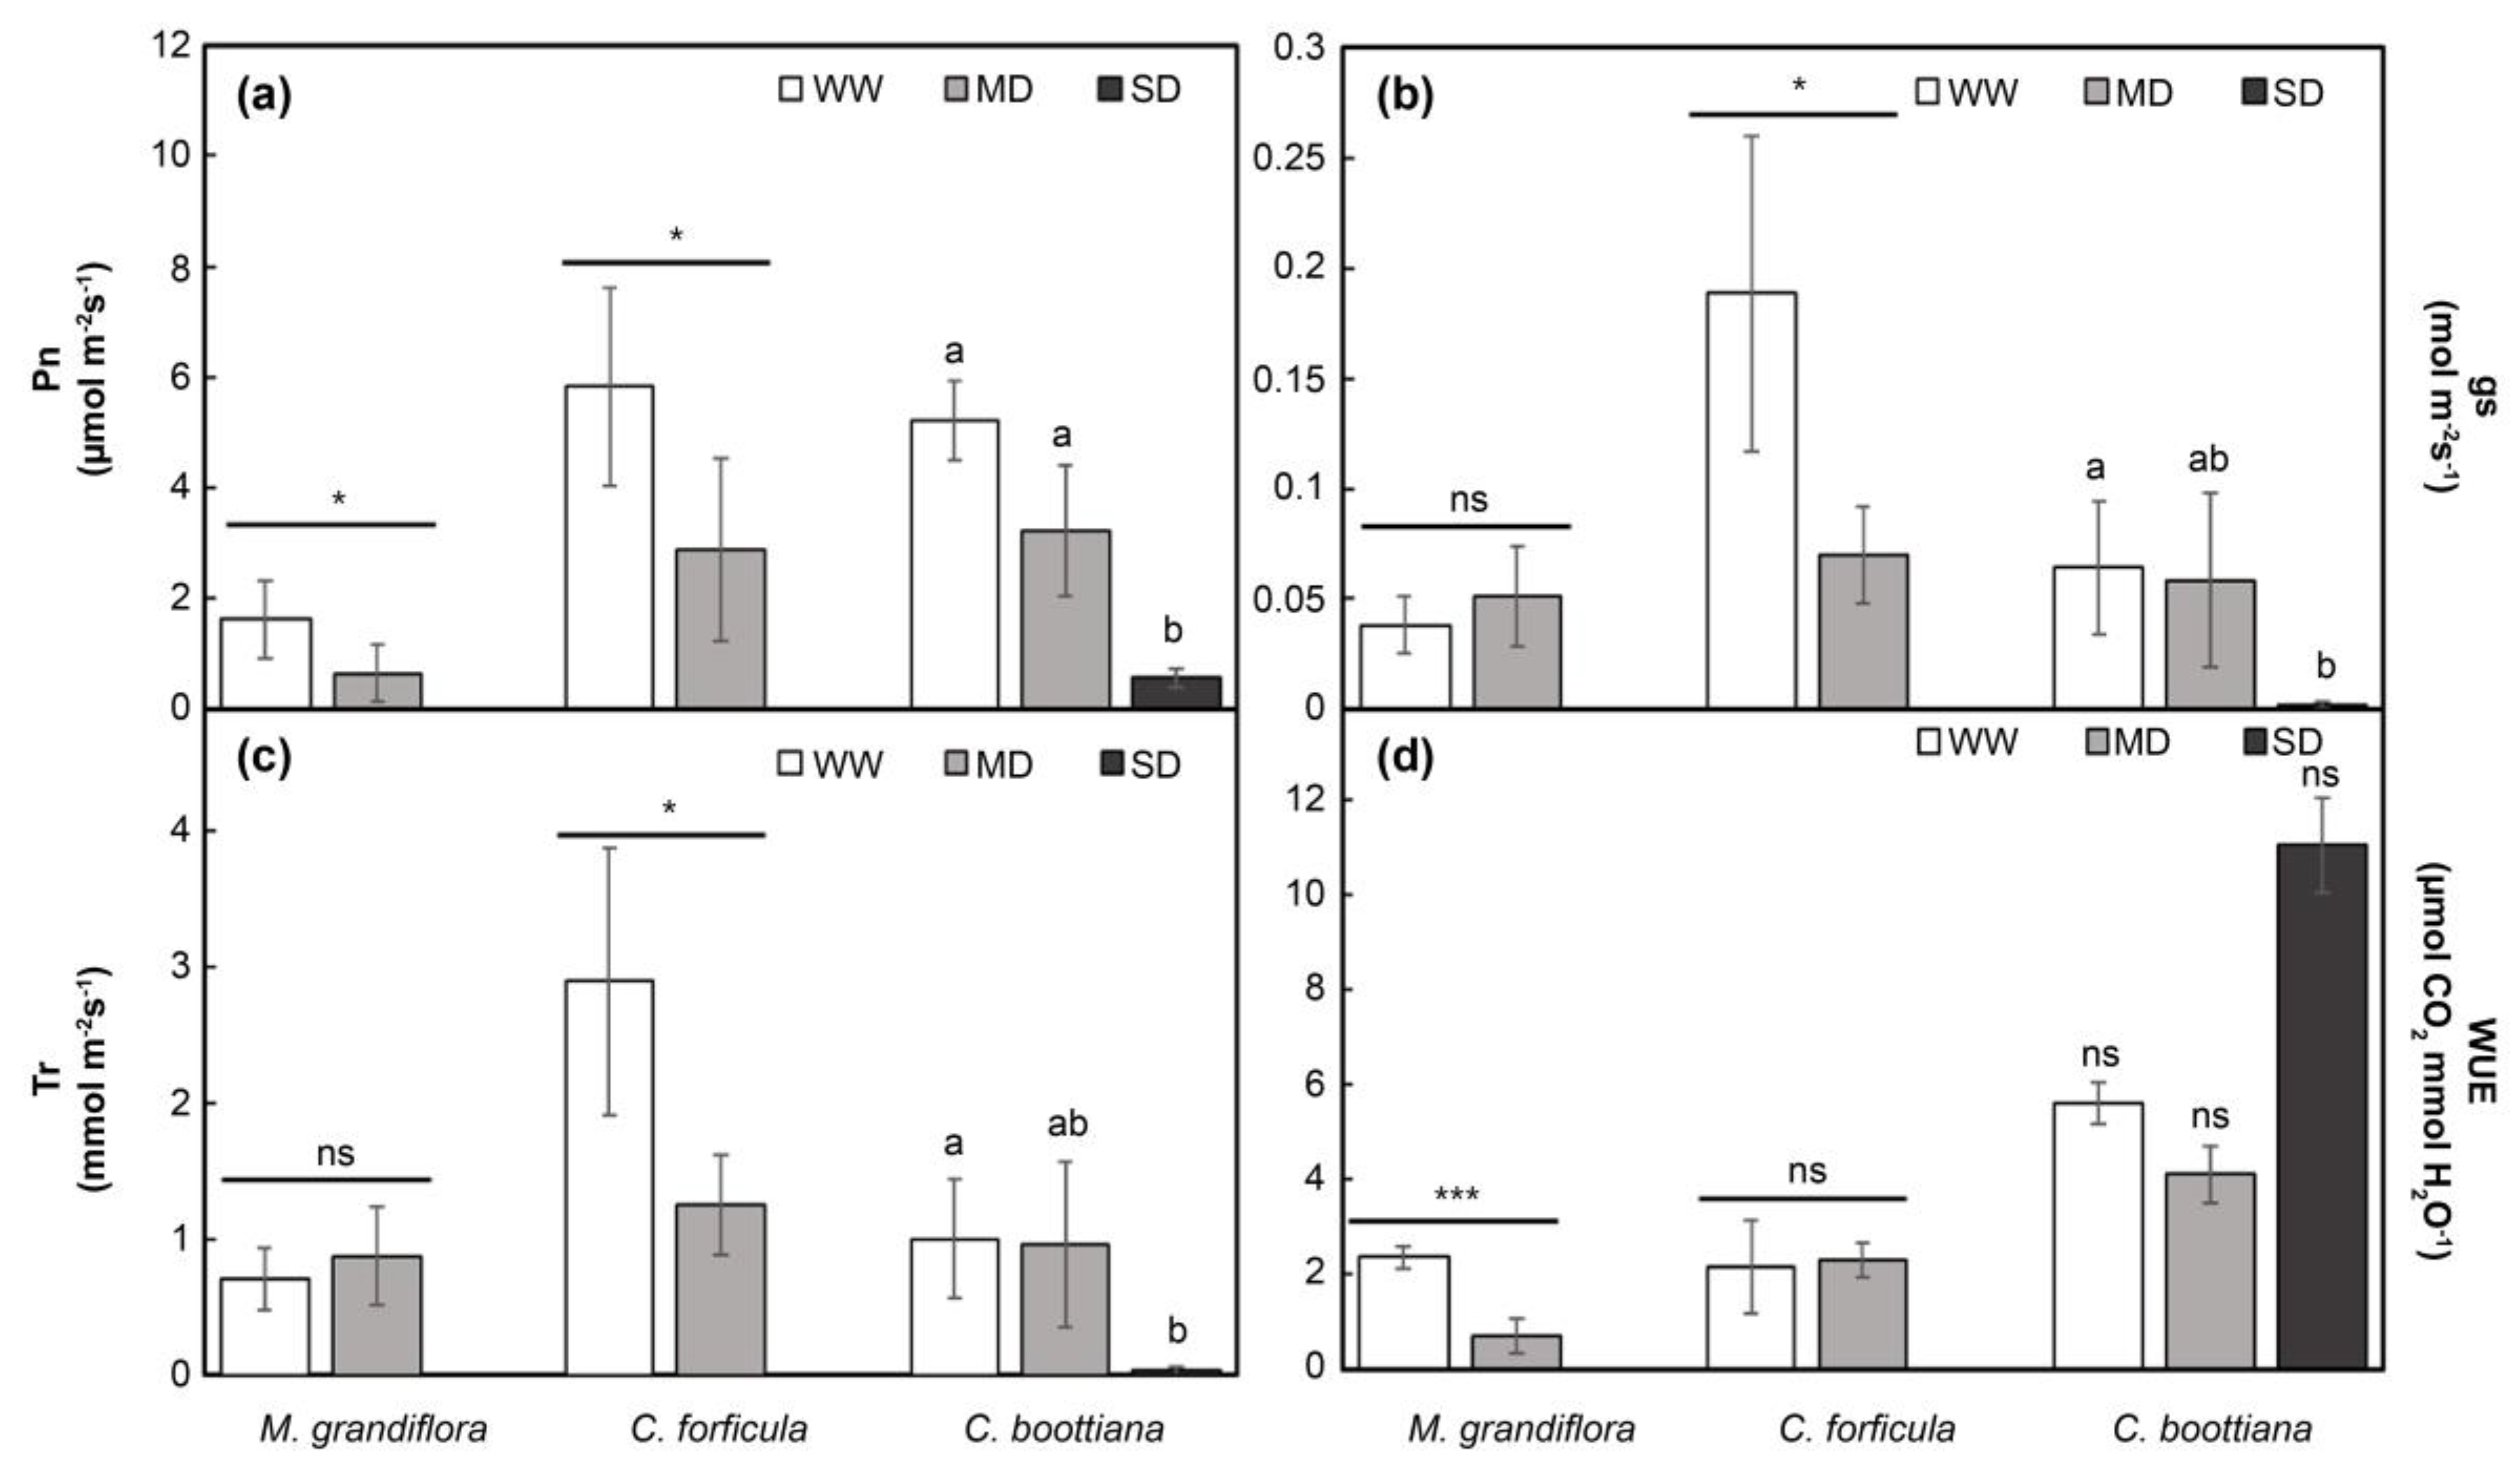
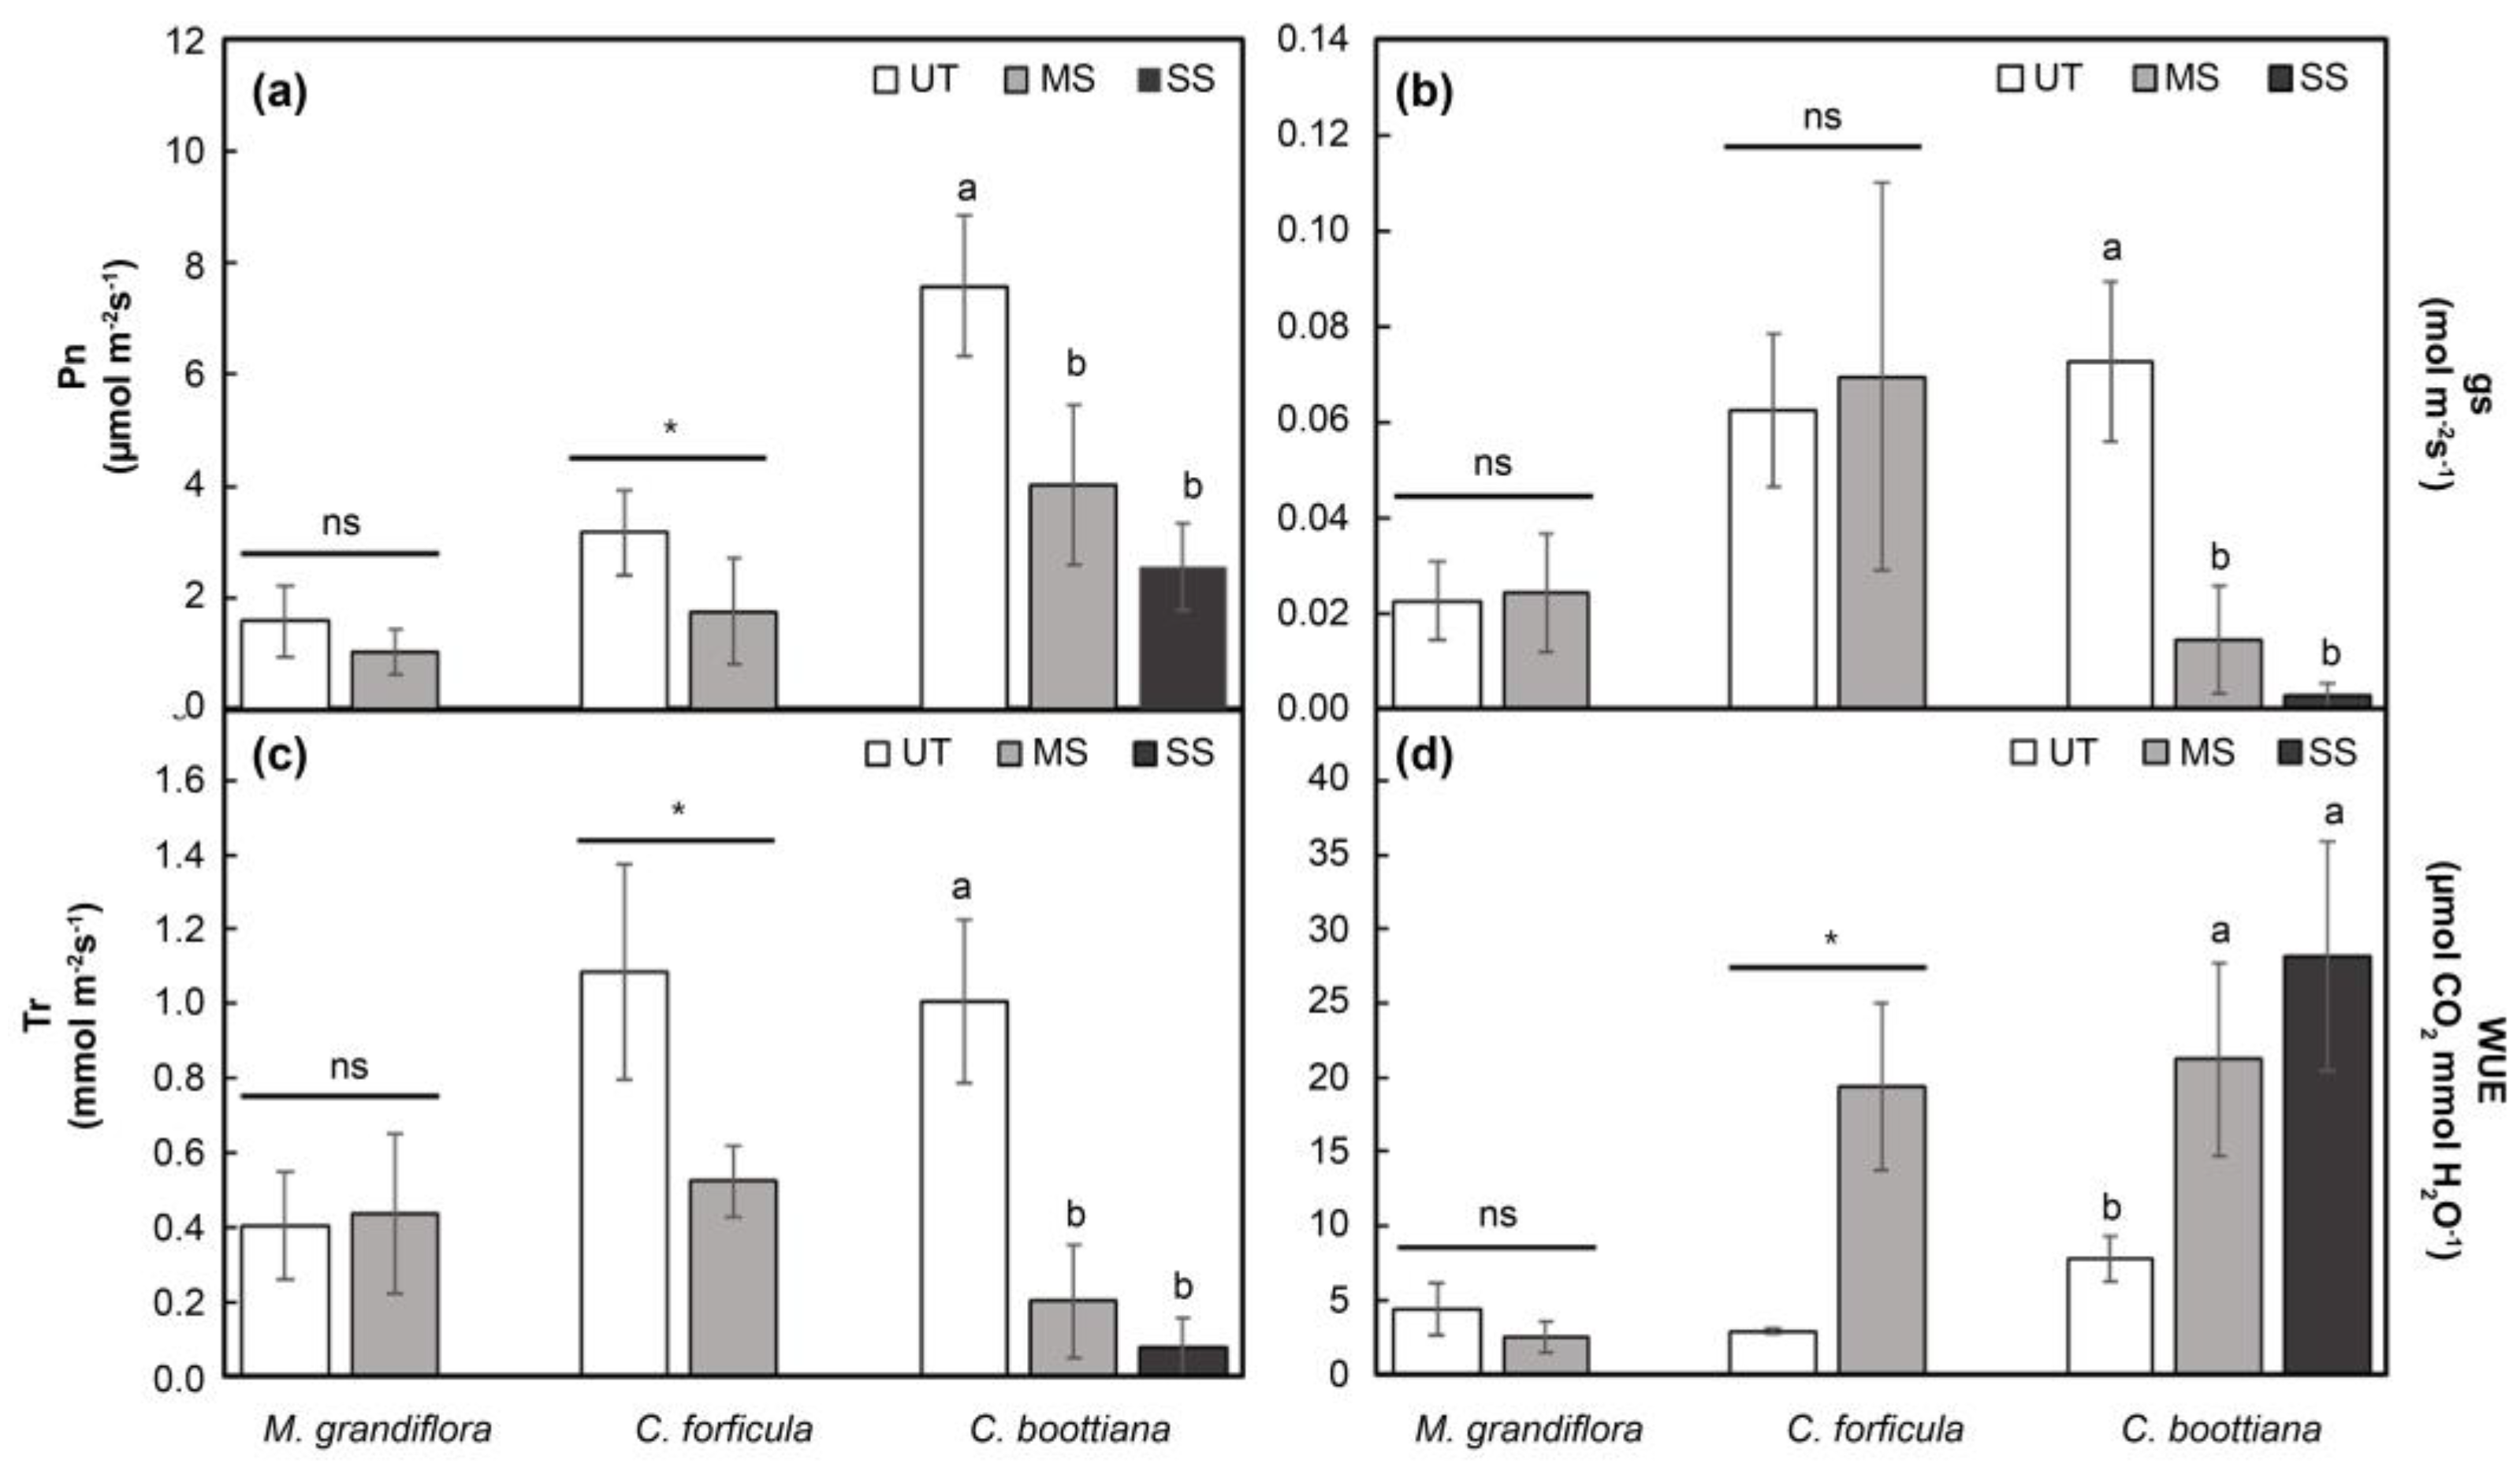
3.2. Photosynthetic Parameters
3.3. Chlorophyll Parameters
3.4. MDA and Reactive Oxygen Species (O2.-, H2O2)
3.5. Principal Component Analysis
4. Discussion
5. Conclusions
Supplementary Materials
Author Contributions
Funding
Data Availability Statement
Acknowledgments
Conflicts of Interest
References
- Wang, D.; Xu, P.Y.; An, B.W.; Guo, Q.P. Urban green infrastructure: Bridging biodiversity conservation and sustainable urban development through adaptive management approach. Front. Ecol. Evol. 2024, 12, 1440477. [Google Scholar] [CrossRef]
- Owen, J. The Ecology of a Garden: the First Fifteen Years; Cambridge University Press: Cambridge, UK, 1991. [Google Scholar]
- Miotk, P. The naturalized garden – A refuge for animals? – first results. Zool. Anz. 1996, 235, 101–116. [Google Scholar]
- Mason, C.F. Thrushes now largely restricted to the built environment in eastern England. Divers. Distrib. 2000, 6, 189–194. [Google Scholar] [CrossRef]
- Bigirimana, J.; Bogaert, J.; De Cannière, C.; Bigendako, M.J.; Parmentier, I. Domestic garden plant diversity in Bujumbura, Burundi: role of the socio-economical status of the neighborhood and alien species invasion risk. Landsc. Urban Plan. 2012, 107, 118–126. [Google Scholar] [CrossRef]
- Available online: https://www.fs.usda.gov/wildflowers/Native_Plant_Materials/Native_Gardening/index.shtml.
- Thompson, K.; Austin, K.C.; Smith, R.M.; Warren, P.H.; Angold, P.G.; Gaston, K.J. Urban domestic gardens (I): putting small-scale plant diversity in context. J. Vegetation Sci. 2003, 14, 71–78. [Google Scholar] [CrossRef]
- Seitz, B.; Buchholz, S.; Kowarik, I.; Herrmann, J.; Neuerburg, L.; Wendler, J.; Wendler, J.; Egerer, M. Land sharing between cultivated and wild plants: urban gardens as hotspots for plant diversity in cities. Urban Ecosyst. 2022, 25, 927–939. [Google Scholar] [CrossRef]
- IUCN publishing division, Cambridge, UK and Gland, Switzerland. IUCN 2000. The world conservation union, gland, switzerland.
- Smith, R.M.; Thompson, K.; Hodgson, J.G.; Warren, P.H.; Gaston, K.J. Urban domestic gardens (IX): composition and richness of the vascular plant flora, and implications for native biodiversity. Biol. Conserv. 2006, 129, 312–322. [Google Scholar] [CrossRef]
- Choi, W.K.; Moon, A.R.; Song, J.H.; Kim, Y.J.; Song, Y.J.; Jeong, J.R.; Jin, H.Y. A study on revitalization strategy of wild-flower industry through status of wildflower farm investigation. Korean. J. Hortic. Sci. 2016, 34, 232–232. [Google Scholar]
- Kim, J. The current state and characteristics of ornamental grasses in South Korea. J. Korean Inst. Landsc. Archit. 2021, 49, 151–162. [Google Scholar] [CrossRef]
- Brown, R.; Green, L. Soil health and the impact of plant root systems. Environ. Sci. [Lett.] 2019, 8, 89–97. [Google Scholar]
- Darke, R. The Encyclopedia of Grasses for Livable Landscapes; Timber Press: Portland, OR, USA, 2007. [Google Scholar]
- Kim, J.W. Korean Plant Ecology Treasure Ⅱ; Seoul, 2016. Eco and nature Publishing.
- Song, K.H.; Kim, Y.J.; Kim, C.G.; Won, C.O.; Lee, J.K. A-Z Korean Garden Plants; Designpost: Goyang, 2018. [Google Scholar]
- Choi, Y.; Kim, H. The ecology of Melica grandiflora in mountainous regions. J. Plant Ecol. 2010, 34, 123–130. [Google Scholar]
- Lee, J.S. Flora of Korea: Grasses Korean National Arboretum, 2015.
- Thompson, R.; Green, P. Sedges in wetland ecosystems: A vital role. J. Wetland Ecol. 2020, 24, 134–142. [Google Scholar]
- Carter, S. The importance of Carex species in biodiversity conservation. Plant Ecol. Rev. 2021, 18, 90–101. [Google Scholar]
- Cregg, B.M. Improving drought tolerance of trees: theoretical and practical considerations. In. Acta Hortic. Acta Hortic. International horticultural congress: Nursery crops; development, evaluation, production and use 630 2004, XXVI, 147–158. [CrossRef]
- Fernàndez, J.A.; Balenzategui, L.; Bañón, S.; Franco, J.A. Induction of drought tolerance by paclobutrazol and irrigation deficit in Phillyrea angustifolia during the nursery period. Scientia Horticulturae 2006, 107, 277–283. [Google Scholar] [CrossRef]
- Rafi, Z.N.; Kazemi, F.; Tehranifar, A. Morpho-physiological and biochemical responses of four ornamental herbaceous species to water stress. Acta Physiol. Plant. 2019, 41. [Google Scholar] [CrossRef]
- Chaves, M.M.; Flexas, J.; Pinheiro, C. Photosynthesis under drought and salt stress: regulation mechanisms from whole plant to cell. Ann. Bot. 2009, 103, 551–560. [Google Scholar] [CrossRef]
- Jaleel, C.A.; Manivannan, P.; Lakshmanan, G.M.A.; Gomathinayagam, M.; Panneerselvam, R. Alterations in morphological parameters and photosynthetic pigment responses of Catharanthus roseus under soil water deficits. Colloids Surf. B Biointerfaces 2008, 61, 298–303. [Google Scholar] [CrossRef]
- Tátrai, Z.A.; Sanoubar, R.; Pluhár, Z.; Mancarella, S.; Orsini, F.; Gianquinto, G. Morphological and physiological plant responses to drought stress in Thymus citriodorus. Int. J. Agro 2016, 2016, 1–8. [Google Scholar] [CrossRef]
- Flowers, T.J. Improving crop salt tolerance. J. Exp. Bot. 2004, 55, 307–319. [Google Scholar] [CrossRef]
- Munns, R. Comparative physiology of salt and water stress. Plant Cell Environ. 2002, 25, 239–250. [Google Scholar] [CrossRef]
- Cramer, G.R.; Nowak, R.S. Supplemental manganese improves the relative growth, net assimilation and photosynthetic rates of salt-stressed barley. Physiol. Plant. 1992, 84, 600–605. [Google Scholar] [CrossRef]
- Parida, A.K.; Das, A.B. Salt tolerance and salinity effects on plants: a review. Ecotoxicol. Environ. Saf. 2005, 60, 324–349. [Google Scholar] [CrossRef] [PubMed]
- Acosta-Motos, J.R.; Ortuño, M.F.; Bernal-Vicente, A.; Diaz-Vivancos, P.; Sanchez-Blanco, M.J.; Hernandez, J.A. Plant responses to salt stress: adaptive mechanisms. Agronomy 2017, 7, 18. [Google Scholar] [CrossRef]
- Flowers, T.J.; Colmer, T.D. Plant salt tolerance: adaptations in halophytes. Ann. Bot. 2015, 115, 327–331. [Google Scholar] [CrossRef]
- Baek, S.G.; Woo, S.Y. Physiological and biochemical responses of two tree species in urban areas to different air pollution levels. Photosynthetica 2010, 48, 23–29. [Google Scholar] [CrossRef]
- Arnon, D.I. Copper enzymes in isolated chloroplasts. Polyphenoloxidase in Beta vulgaris. Plant Physiol. 1949, 24, 1–15. [Google Scholar] [CrossRef]
- Heath, R.L.; Packer, L. Photoperoxidation in isolated chloroplasts. I. Kinetics and stoichiometry of fatty acid peroxidation. Arch. Biochem. Biophys. 1968, 125, 189–198. [Google Scholar] [CrossRef]
- Mai, V.C.; Bednarski, W.; Borowiak-Sobkowiak, B.; Wilkaniec, B.; Samardakiewicz, S.; Morkunas, I. Oxidative stress in pea seedling leaves in response to Acyrthosiphon pisum infestation. Phytochemistry 2013, 93, 49–62. [Google Scholar] [CrossRef]
- Tahjib-ul-Arif, Md.; Roy, P.R.; Al Mamun Sohag, A.A.M.; Afrin, S.; Rady, M.M.; Hossain, M.A. Exogenous calcium supplementation improves salinity tolerance in BRRI dhan28; a salt-susceptible high-yielding Oryza sativa cultivar. J. Crop Sci. Biotechnol. 2018, 21, 383–394. [Google Scholar] [CrossRef]
- Billah, M.; Aktar, S.; Brestic, M.; Zivcak, M.; Khaldun, A.B.M.; Uddin, M.S.; Bagum, S.A.; Yang, X.; Skalicky, M.; Mehari, T.G.; et al. Progressive genomic approaches to explore drought- and salt-induced oxidative stress responses in plants under changing climate. Plants (Basel) 2021, 10, 1910. [Google Scholar] [CrossRef] [PubMed]
- Ma, Y.; Dias, M.C.; Freitas, H. Drought and salinity stress responses and microbe-induced tolerance in plants. Front. Plant Sci. 2020, 11, 591911. [Google Scholar] [CrossRef] [PubMed]
- Singh, S.; Kumar, V.; Chauhan, A.; Datta, S.; Wani, A.B.; Singh, N.; Singh, J. Toxicity, degradation and analysis of the herbicide atrazine. Environ. Chem. Lett. 2018, 16, 211–237. [Google Scholar] [CrossRef]
- Hernández, J.A.; Ferrer, M.A.; Jiménez, A.; Barceló, A.R.; Sevilla, F. Antioxidant systems and O2/H2O2 production in the apoplast of Pisum sativum L. leaves: its relation with NaCl-induced necrotic lesions in minor veins. Plant Physiol. 2001, 127, 817–831. [Google Scholar] [CrossRef] [PubMed]
- Ashraf, M.; Harris, P.J.C. Photosynthesis under stressful environments: an overview. Photosynthetica 2013, 51, 163–190. [Google Scholar] [CrossRef]
- Acosta-Motos, J.R.; Díaz-Vivancos, P.; Álvarez, S.; Fernández-García, N.; Sánchez-Blanco, M.J.; Hernández, J.A. NaCl-induced physiological and biochemical adaptative mechanisms in the ornamental Myrtus communis L. plants. J. Plant Physiol. 2015, 183, 41–51. [Google Scholar] [CrossRef]
- Acosta-Motos, J.R.; Díaz-Vivancos, P.; Álvarez, S.; Fernández-García, N.; Sánchez-Blanco, M.J.; Hernández, J.A. Physiological and biochemical mechanisms of the ornamental Eugenia myrtifolia L. plants for coping with NaCl stress and recovery. Planta 2015, 242, 829–846. [Google Scholar] [CrossRef]
- Acosta-Motos, J.R.; Ortuño, M.F.; Bernal-Vicente, A.; Diaz-Vivancos, P.; Sanchez-Blanco, M.J.; Hernandez, J.A. Plant responses to salt stress: Adaptive mechanisms. Agronomy. 2017, 7, 18. [CrossRef]
- Li, L.; Gu, W.; Li, J.; Li, C.; Xie, T.; Qu, D.; Meng, Y.; Li, C.; Wei, S. Exogenously applied spermidine alleviates photosynthetic inhibition under drought stress in maize (Zea mays L.) seedlings associated with changes in endogenous polyamines and phytohormones. Plant Physiol. Biochem. 2018, 129, 35–55. [Google Scholar] [CrossRef]
- Wang, X.-M.; Wang, X.-K.; Su, Y.-B.; Zhang, H.-X. Land pavement depresses photosynthesis in urban trees especially under drought stress. Sci. Total Environ. 2019, 653, 120–130. [Google Scholar] [CrossRef]
- Bhusal, N.; Han, S.-G.; Yoon, T.-M. Impact of drought stress on photosynthetic response, leaf water potential, and stem sap flow in two cultivars of bi-leader apple trees (Malus × domestica Borkh.). Scientia Horticulturae. 2019, 246, 535–543. [Google Scholar] [CrossRef]
- Bacelar, E.A.; Moutinho-Pereira, J.M.; Gonçalves, B.C.; Ferreira, H.F.; Correia, C.M. Changes in growth, gas exchange, xylem hydraulic properties and water use efficiency of three olive cultivars under contrasting water availability regimes. Environ. Exp. Bot. 2007a, 60, 183–192. [Google Scholar] [CrossRef]
- Moutinho-Pereira, J.M.; Magalhães, N.; Gonçalves, B.; Bacelar, E.; Brito, M.; Correia, C. Gas exchange and water relations of three Vitis vinifera L. cultivars growing under Mediterranean climate. Photosynthetica 2007, 45, 202–207. [Google Scholar] [CrossRef]
- Rivero, R.M.; Kojima, M.; Gepstein, A.; Sakakibara, H.; Mittler, R.; Gepstein, S.; Blumwald, E. Delayed leaf senescence induces extreme drought tolerance in a flowering plant. Proc. Natl Acad. Sci. U. S. A. 2007, 104, 19631–19636. [Google Scholar] [CrossRef] [PubMed]
- Faisal, S.; Mujtaba, S.M.; Asma, M.; Mahboob, W. Polyethylene glycol mediated osmotic stress impacts on growth and biochemical aspects of wheat (Triticum aestivum L.). J. Crop Sci. Biotechnol. 2019, 22, 213–223. [Google Scholar] [CrossRef]
- Nezhadahmadi, A.; Prodhan, Z.H.; Faruq, G. Drought tolerance in wheat. ScientificWorldJournal 2013, 2013, 610721. [Google Scholar] [CrossRef]
- Marques, M.C.; Nascimento, C.W.A.; da Silva, A.J.; da Silva Gouveia-Neto, A. Tolerance of an energy crop (Jatropha curcas L.) to zinc and lead assessed by chlorophyll fluorescence and enzyme activity. S. Afr. J. Bot. 2017, 112, 275–282. [Google Scholar] [CrossRef]
- Knox, J.P.; Dodge, A.D. Singlet oxygen and plants. Phytochemistry 1985, 24, 889–896. [Google Scholar] [CrossRef]
- Munné-Bosch, S.; Alegre, L. Changes in carotenoids, tocopherols and diterpenes during drought and recovery, and the biological significance of chlorophyll loss in Rosmarinus officinalis plants. Planta 2000, 210, 925–931. [Google Scholar] [CrossRef]
- Campos, P.S.; Quartin, V.; Ramalho, J.C.; Nunes, M.A. Electrolyte leakage and lipid degradation account for cold sensitivity in leaves of Coffea sp. plants. J. Plant Physiol. 2003, 160, 283–292. [Google Scholar] [CrossRef]
- Demidchik, V.; Straltsova, D.; Medvedev, S.S.; Pozhvanov, G.A.; Sokolik, A.; Yurin, V. Stress-induced electrolyte leakage: the role of K+-permeable channels and involvement in programmed cell death and metabolic adjustment. J. Exp. Bot. 2014, 65, 1259–1270. [Google Scholar] [CrossRef]
- Sairam, R.K.; Shukla, D.S.; Saxena, D.C. Stress induced injury and antioxidant enzymes in relation to drought tolerance in wheat genotypes. Biologia Plant. 1997, 40, 357–364. [Google Scholar] [CrossRef]
- Jiang, Y.; Huang, B. Drought and heat stress injury to two cool-season turfgrasses in relation to antioxidant metabolism and lipid peroxidation. Crop Sci. 2001, 41, 436–442. [Google Scholar] [CrossRef]
- Munns, R.; Tester, M. Mechanisms of salinity tolerance. Annu. Rev. Plant Biol. 2008, 59, 651–681. [Google Scholar] [CrossRef] [PubMed]
- Gill, S.S.; Tuteja, N. Reactive oxygen species and antioxidant machinery in abiotic stress tolerance in crop plants. Plant Physiol. Biochem. 2010, 48, 909–930. [Google Scholar] [CrossRef]
- Leshem, Y.Y. Plant Membranes: A Biophysical Approach to Structure, Development and Senescence; Kluwer Academic Publishers: Dordrecht, The Netherlands, 1992; p. 266. [Google Scholar]
- He, R.; Liu, Y.; Song, C.; Feng, G.; Song, J. Osmotic regulation beyond nitrate nutrients in plant resistance to stress: a review. Plant Growth Regul. 2024, 103, 1–8. [Google Scholar] [CrossRef]
- Choudhary, S.; Wani, K.I.; Naeem, M.; Khan, M.M.A.; Aftab, T. Cellular responses, osmotic adjustments, and role of osmolytes in providing salt stress resilience in higher plants: polyamines and nitric oxide crosstalk. J. Plant Growth Regul. 2023, 42, 539–553. [Google Scholar] [CrossRef]
- Tewari, R.K.; Yadav, N.; Gupta, R.; Kumar, P. Oxidative stress under macronutrient deficiency in plants. J. Soil Sci. Plant Nutr. 2021, 21, 832–859. [Google Scholar] [CrossRef]
- Hasanuzzaman, M.; Fujita, M. Plant oxidative stress: biology, physiology and mitigation. Plants (Basel) 2022, 11, 1185. [Google Scholar] [CrossRef]
- Da Cruz Ferreira, R.L.; de Mello Prado, R.; de Souza Junior, J.P.; Gratão, P.L.; Tezotto, T.; Cruz, F.J.R. Oxidative stress, nutritional disorders, and gas exchange in lettuce plants subjected to two selenium sources. J. Soil Sci. Plant Nutr. 2020, 20, 1215–1228. [Google Scholar] [CrossRef]
- Koyro, H.W. Effect of salinity on growth, photosynthesis, water relations and solute composition of the potential cash crop halophyte Plantago coronopus (L.). Environ. Exp. Bot. 2006, 56, 136–146. [Google Scholar] [CrossRef]
- Stepien, P.; Johnson, G.N. Contrasting responses of photosynthesis to salt stress in the glycophyte Arabidopsis and the halophyte Thellungiella: role of the plastid terminal oxidase as an alternative electron sink. Plant Physiol. 2009, 149, 1154–1165. [Google Scholar] [CrossRef] [PubMed]
- Tang, X.; Mu, X.; Shao, H.; Wang, H.; Brestic, M. Global plant responding mechanisms to salt stress: Physiological and Molecular Levels and Implications in Biotechnology. Crit. Rev. Biotechnol. 2015, 35, 425–437. [Google Scholar] [CrossRef] [PubMed]
- Munns, R. Genes and salt tolerance: bringing them together. New Phytol. 2005, 167, 645–663. [Google Scholar] [CrossRef] [PubMed]
- Armando Massange-Sánchez, J.; Vanessa Sánchez-Hernández, C.; Mireya Hernández-Herrera, R.; Andrea Palmeros-Suárez, P. The Biochemical mechanisms of salt tolerance in plants. In Plant Stress Physiol. Perspect. Agric, 2021. [CrossRef]
- Iqbal, M.J. Role of osmolytes and antioxidant enzymes for drought tolerance in wheat. In Global Wheat Production, Shah, F., Abdul, B., Muhammad, A., Eds.; IntechOpen, 2021.


| Experimental design | |||
|---|---|---|---|
| Drought stress | Salinity stress | ||
| Well-watered (irrigation once every 72 h) |
WW | Untreated (no NaCl treatment) |
UT |
| Moderate drought treated (irrigation once every 336 h) |
MD | Moderate salinity-treated (250 mM NaCl) |
MS |
| Severe drought treated (no irrigation for 30 days) |
SD | Severe salinity-treated (500 mM NaCl) |
SS |
| Chlorophyll (mg∙g-1 FW) |
Drought level |
M. grandiflora |
C. forficula |
C. boottiana |
| ChlT | WW1 | 4.01±0.90 a | 3.20±0.28 a | 2.94±0.27 b |
| MD2 | 0.73±0.14 b | 1.85±0.16 b | 4.51±0.12 a | |
| SD3 | 0.53±0.04 b | 1.23±0.04 c | 3.22±0.24 b | |
| Carotenoid | WW | 8.13±0.84 a | 6.48±0.50 a | 5.81±0.48 c |
| MD | 1.63±0.28 b | 3.93±0.24 b | 8.85±0.19 a | |
| SD | 1.26±0.06 b | 2.70±0.10 c | 7.86±0.47 b | |
| Chl a/b ratio | WW | 2.38±0.04 a | 2.05±0.04 a | 2.52±0.07 a |
| MD | 1.02±0.11 b | 1.83±0.04 b | 2.31±0.06 b | |
| SD | 0.77±0.03 c | 1.10±0.04 c | 2.29±0.05 b | |
| Car/ChlT ratio | WW | 2.03±0.02 c | 1.58±0.88 c | 1.54±0.86 b |
| MD | 2.24±0.06 b | 1.66±0.93 b | 1.96±0.02 b | |
| SD | 2.39±0.06 a | 2.19±0.02 a | 2.44±0.05 a |
| Chlorophyll (mg∙g-1 FW) |
Salt level |
M. grandiflora |
C. forficula |
C. boottiana |
| ChlT | UT1 | 2.80±0.05 a | 3.37±0.24 a | 7.19±0.10 ns |
| MS2 | 1.42±0.09 b | 1.47±0.28 b | 7.02±0.11 ns | |
| SS3 | 0.42±0.02 c | 0.79±0.04 c | 6.92±0.23 ns | |
| Carotenoid | UT | 5.61±0.38 a | 6.40±0.52 a | 17.75±0.09 a |
| MS | 3.11±0.16 b | 3.20±0.59 b | 17.53±0.13 b | |
| SS | 1.09±0.03 c | 1.53±0.10 c | 17.82±0.09 a | |
| Chl a/b ratio | UT | 2.28±0.05 a | 2.38±0.06 a | 0.73±0.06 ns |
| MS | 1.83±0.07 b | 1.31±0.06 b | 0.81±0.06 ns | |
| SS | 1.06±0.05 c | 1.16±0.06 c | 0.88±0.15 ns | |
| Car/ChlT ratio | UT | 2.00±0.02 c | 1.89±0.03 b | 2.47±0.03 b |
| MS | 2.19±0.03 b | 2.17±0.01 a | 2.50±0.02 ab | |
| SS | 2.56±0.05 a | 1.94±0.06 b | 2.58±0.07 a |
Disclaimer/Publisher’s Note: The statements, opinions and data contained in all publications are solely those of the individual author(s) and contributor(s) and not of MDPI and/or the editor(s). MDPI and/or the editor(s) disclaim responsibility for any injury to people or property resulting from any ideas, methods, instructions or products referred to in the content. |
© 2024 by the authors. Licensee MDPI, Basel, Switzerland. This article is an open access article distributed under the terms and conditions of the Creative Commons Attribution (CC BY) license (http://creativecommons.org/licenses/by/4.0/).


