Submitted:
18 October 2024
Posted:
21 October 2024
You are already at the latest version
Abstract
Keywords:
1. Introduction
2. Materials and Methods
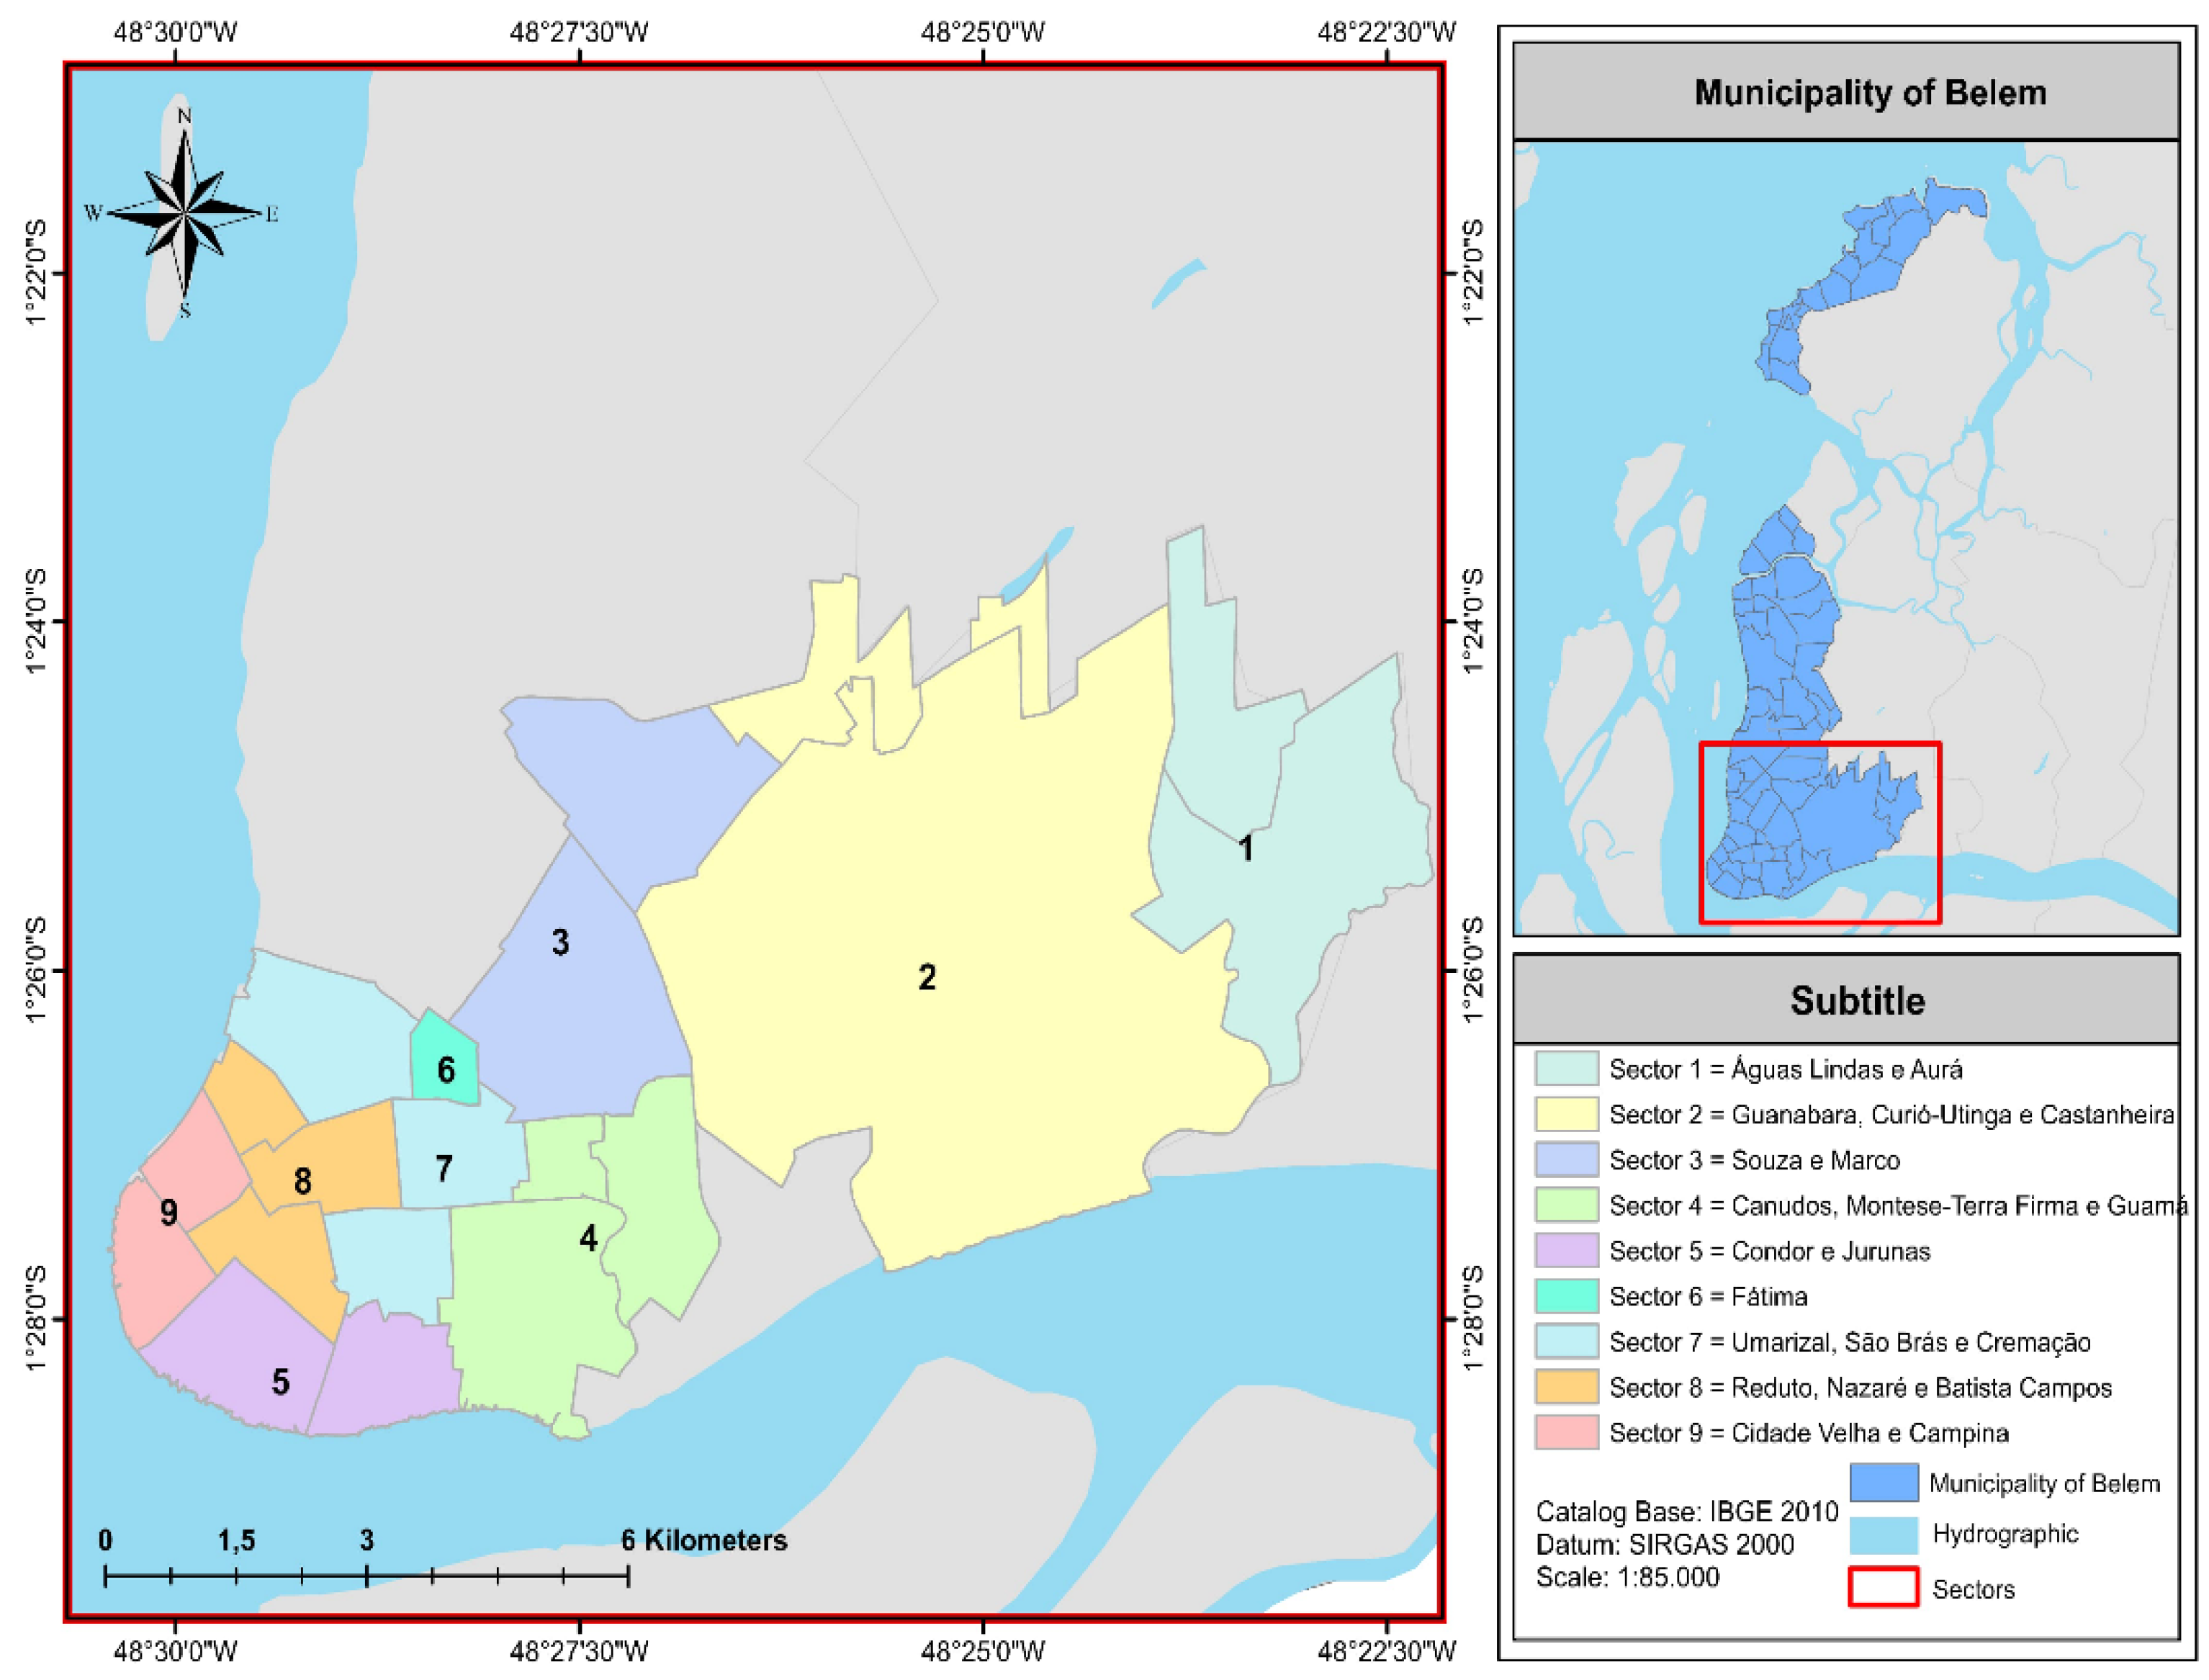
2.1. Gravimetric Composition of Urban Solid Waste
Pré-Tratamento das Amostras e Determinações Laboratoriais
2.2. Experimental Procedure
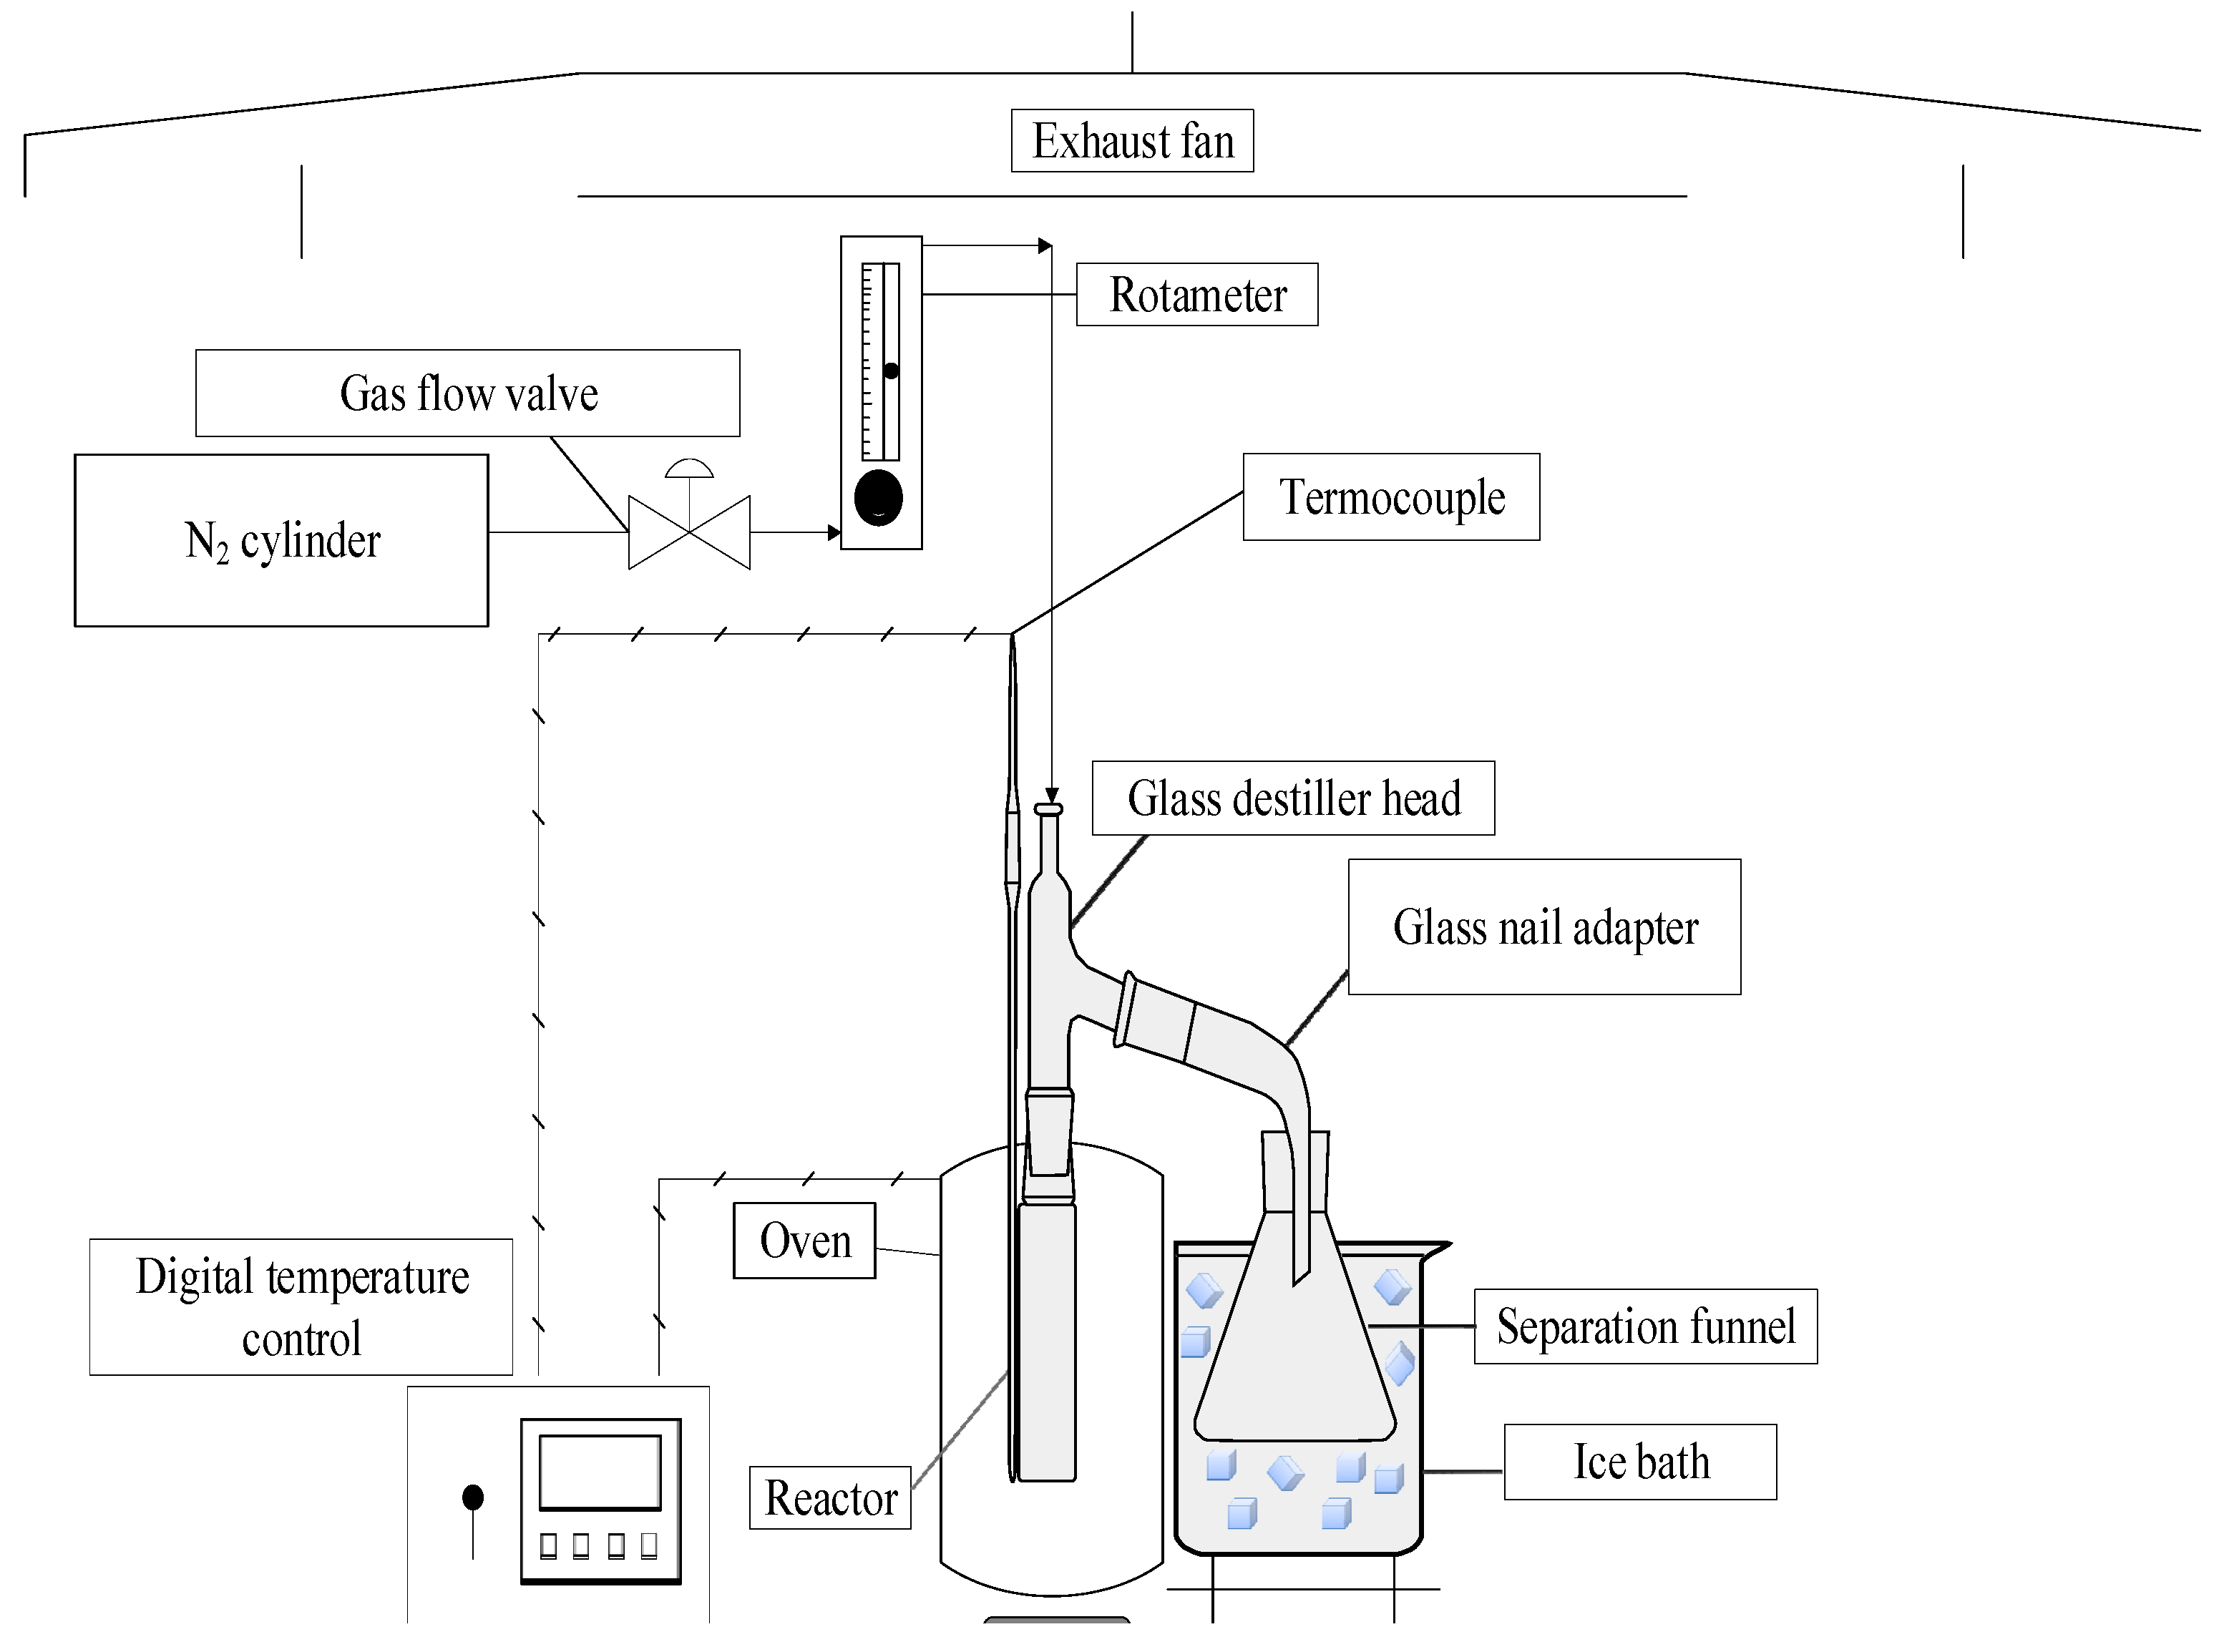
2.2.1. Pyrolysis Process Experimental Apparatus
2.2.2. Experimental procedures
2.5. Physicochemical and Chemical Composition of Bio-Oil
2.5.1. Physicochemical Characterization of Bio-Oil and Aqueous Phase
2.5.2. Chemical Composition of Bio-Oil and Aqueous Phase
2.6. Characterization of Biochar
2.6.1. SEM and EDS Analysis
2.6.2. X-ray Diffraction Analysis (XRD)
2.7. Yields from Bench-Scale Thermal and Catalytic Pyrolysis Experiments
3. Results
3.2. Characterization of Biochar
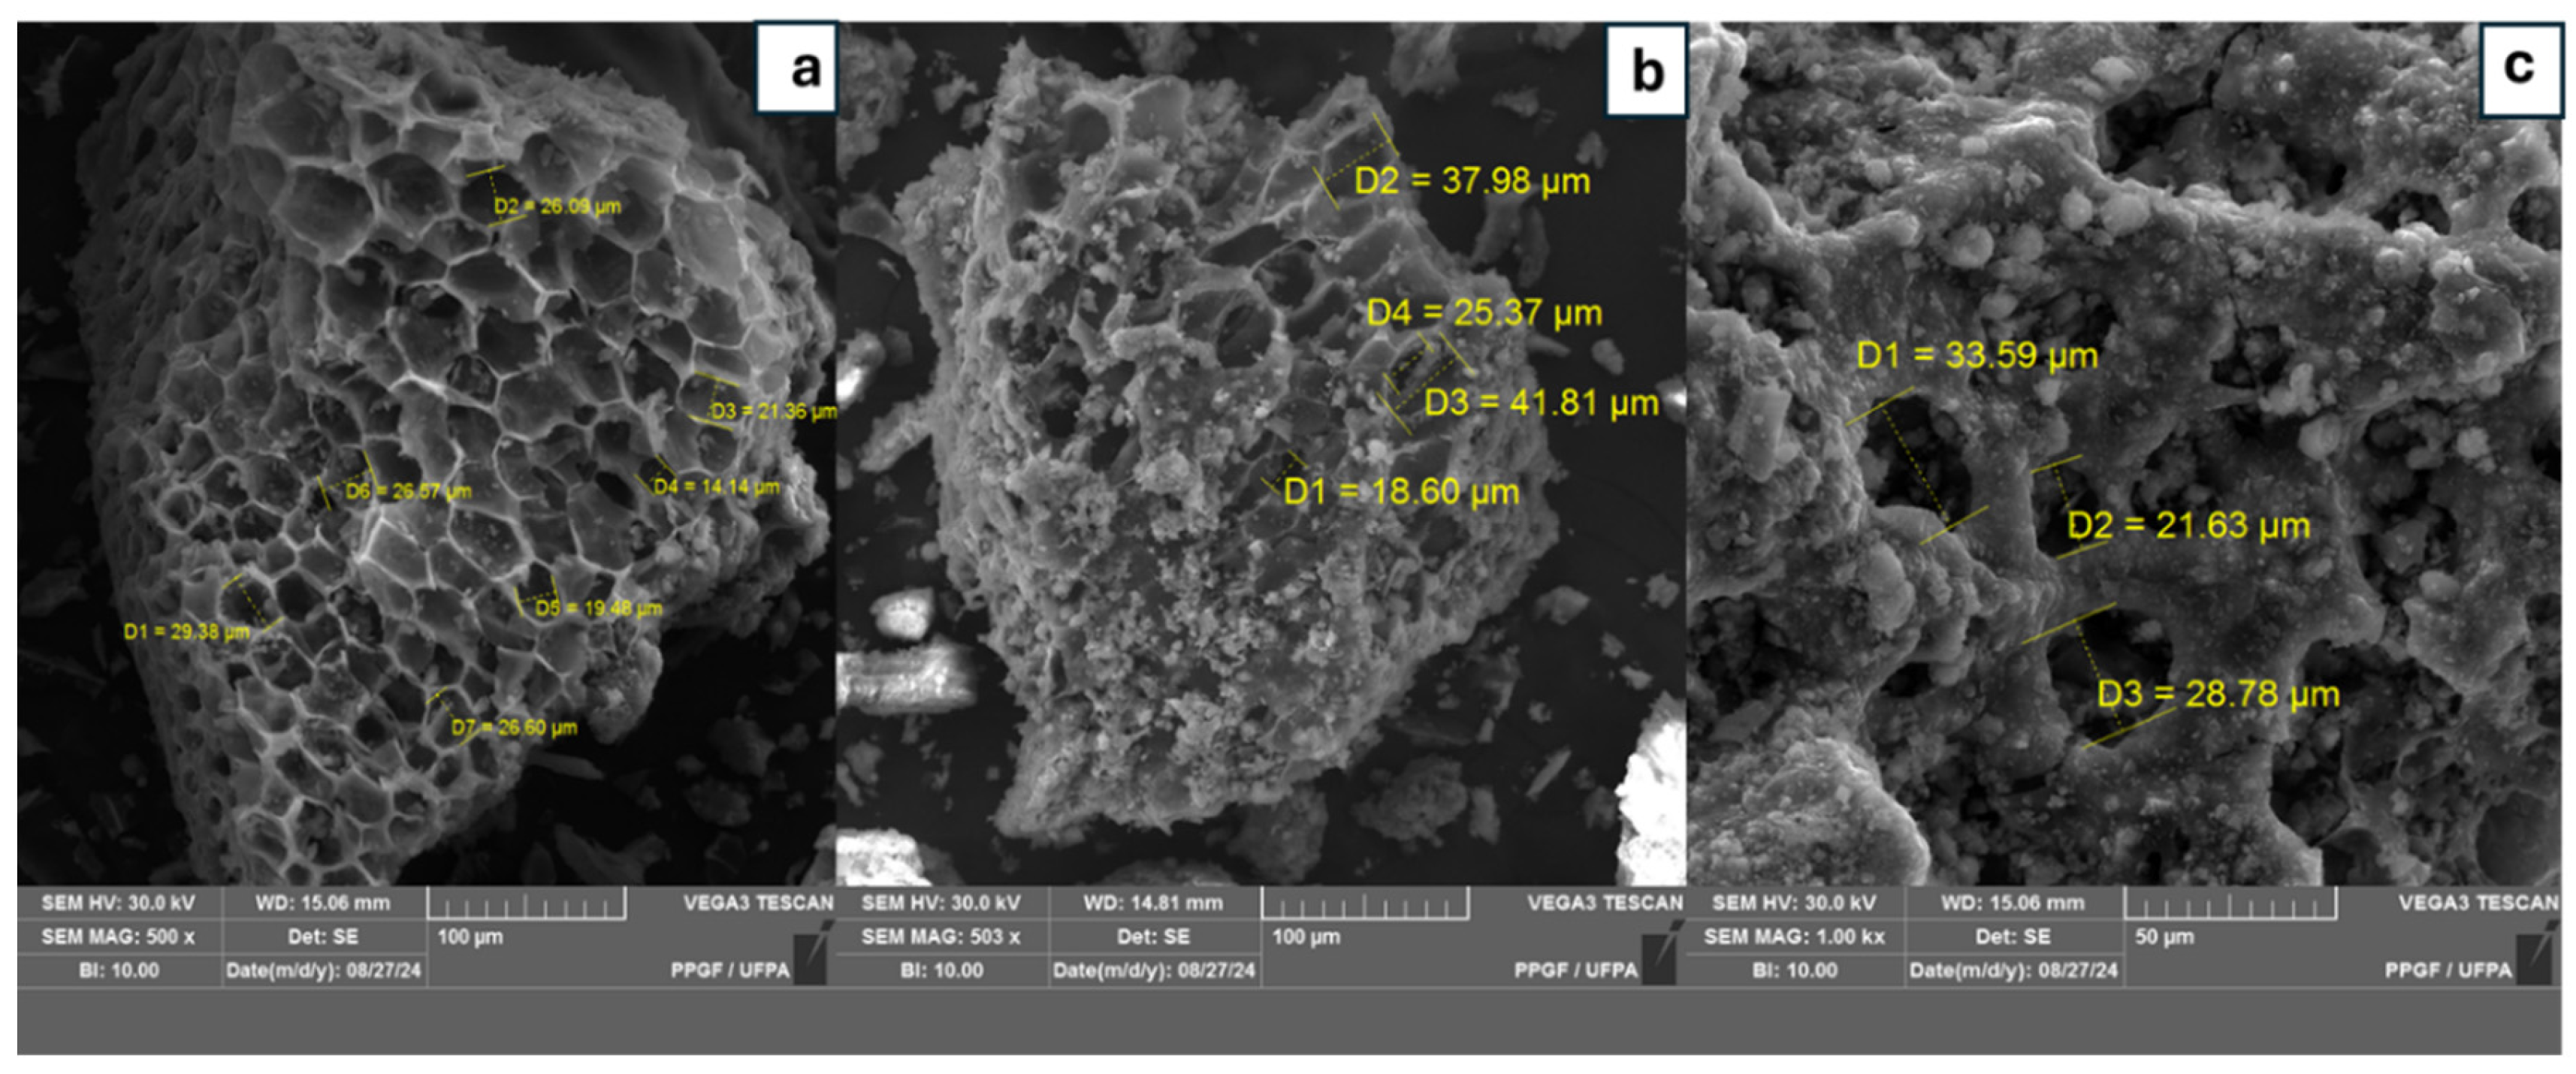
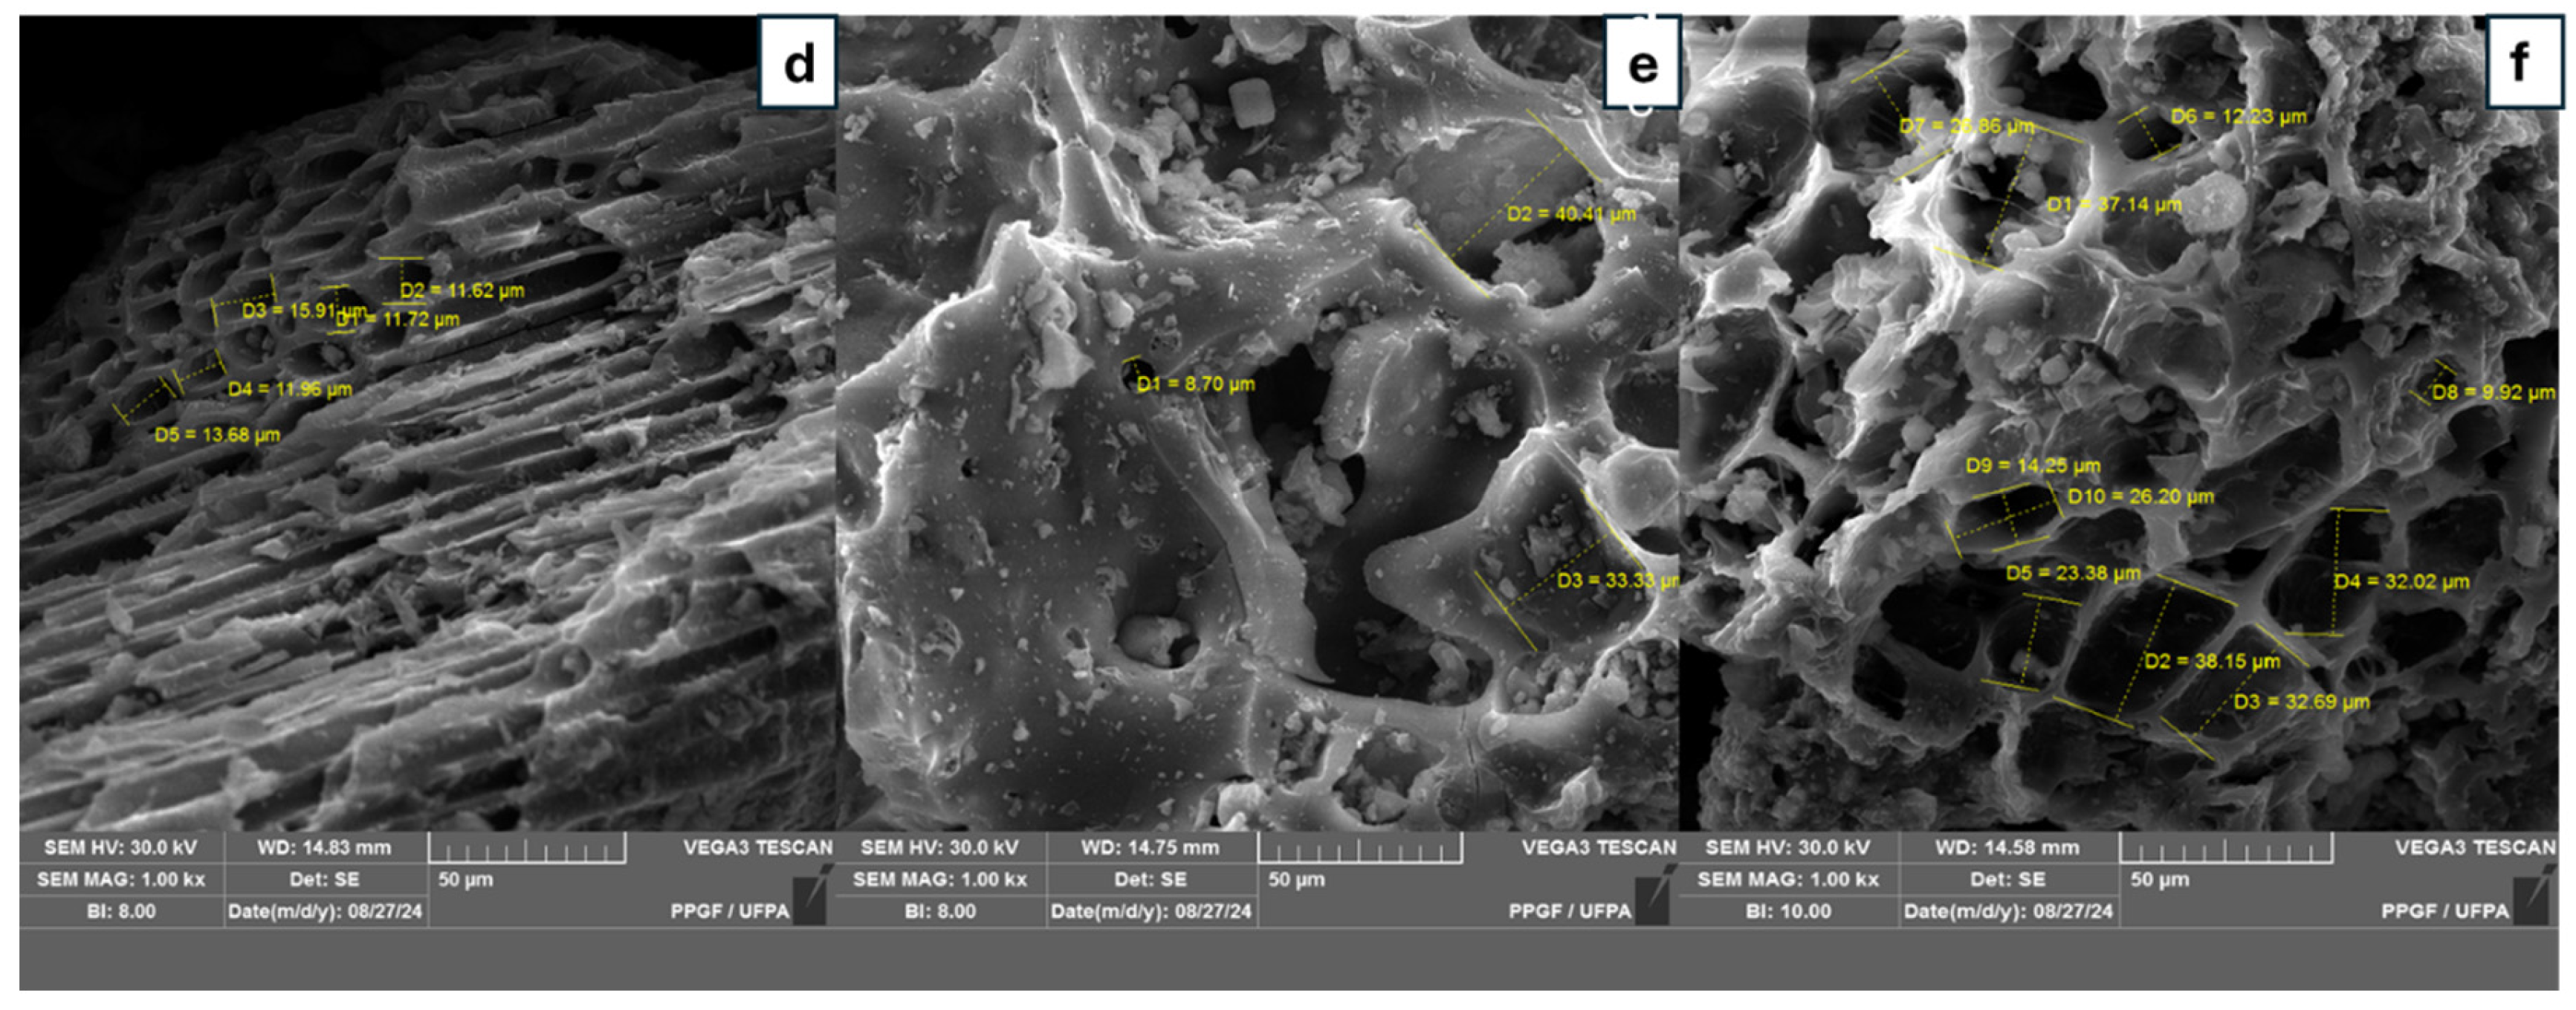
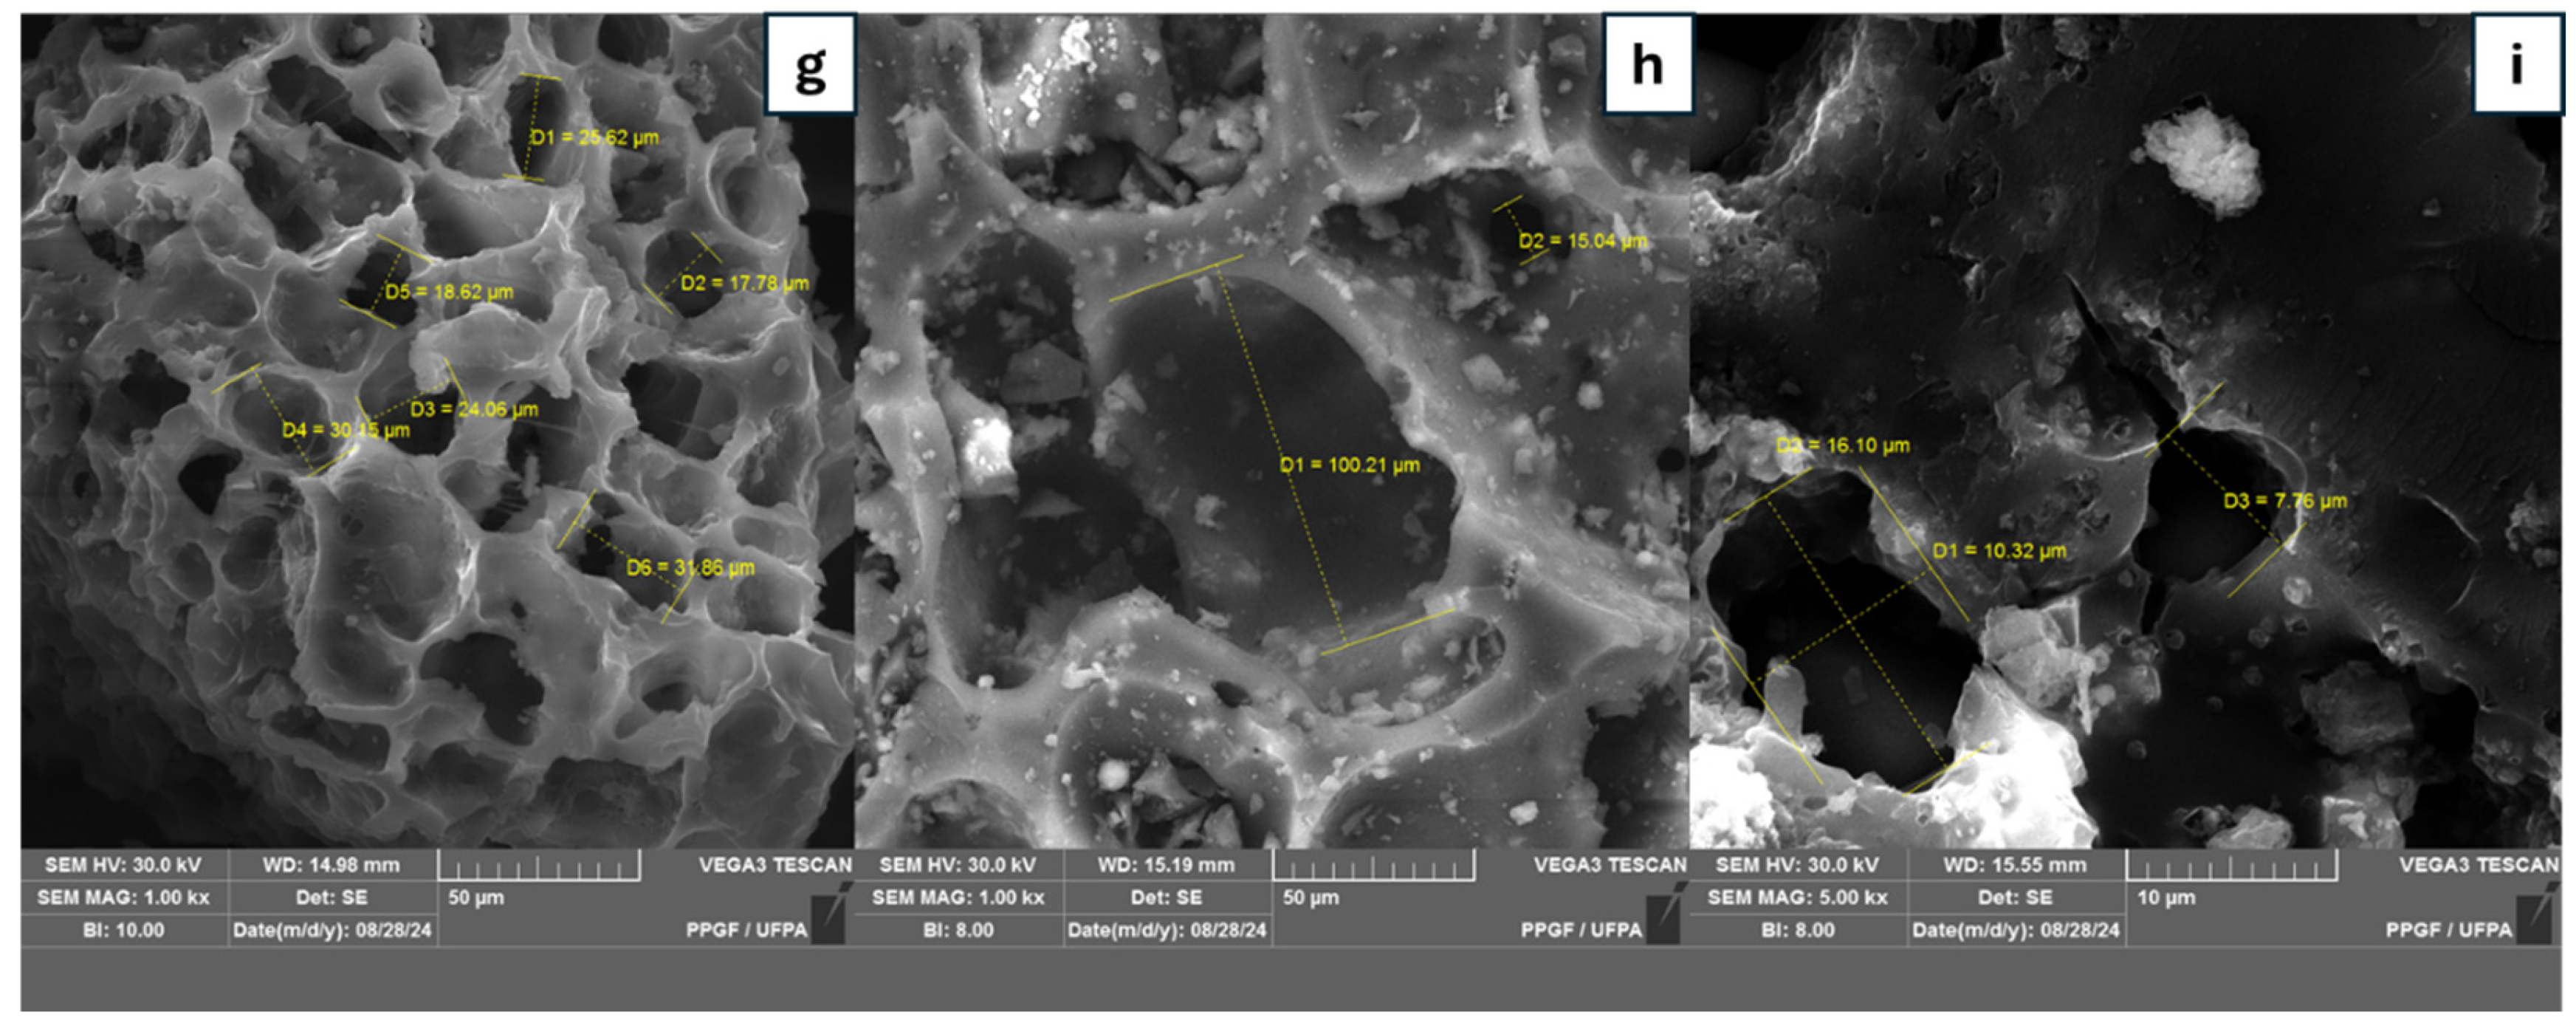
3.2.1. Scanning Electron Microscopy Analysis
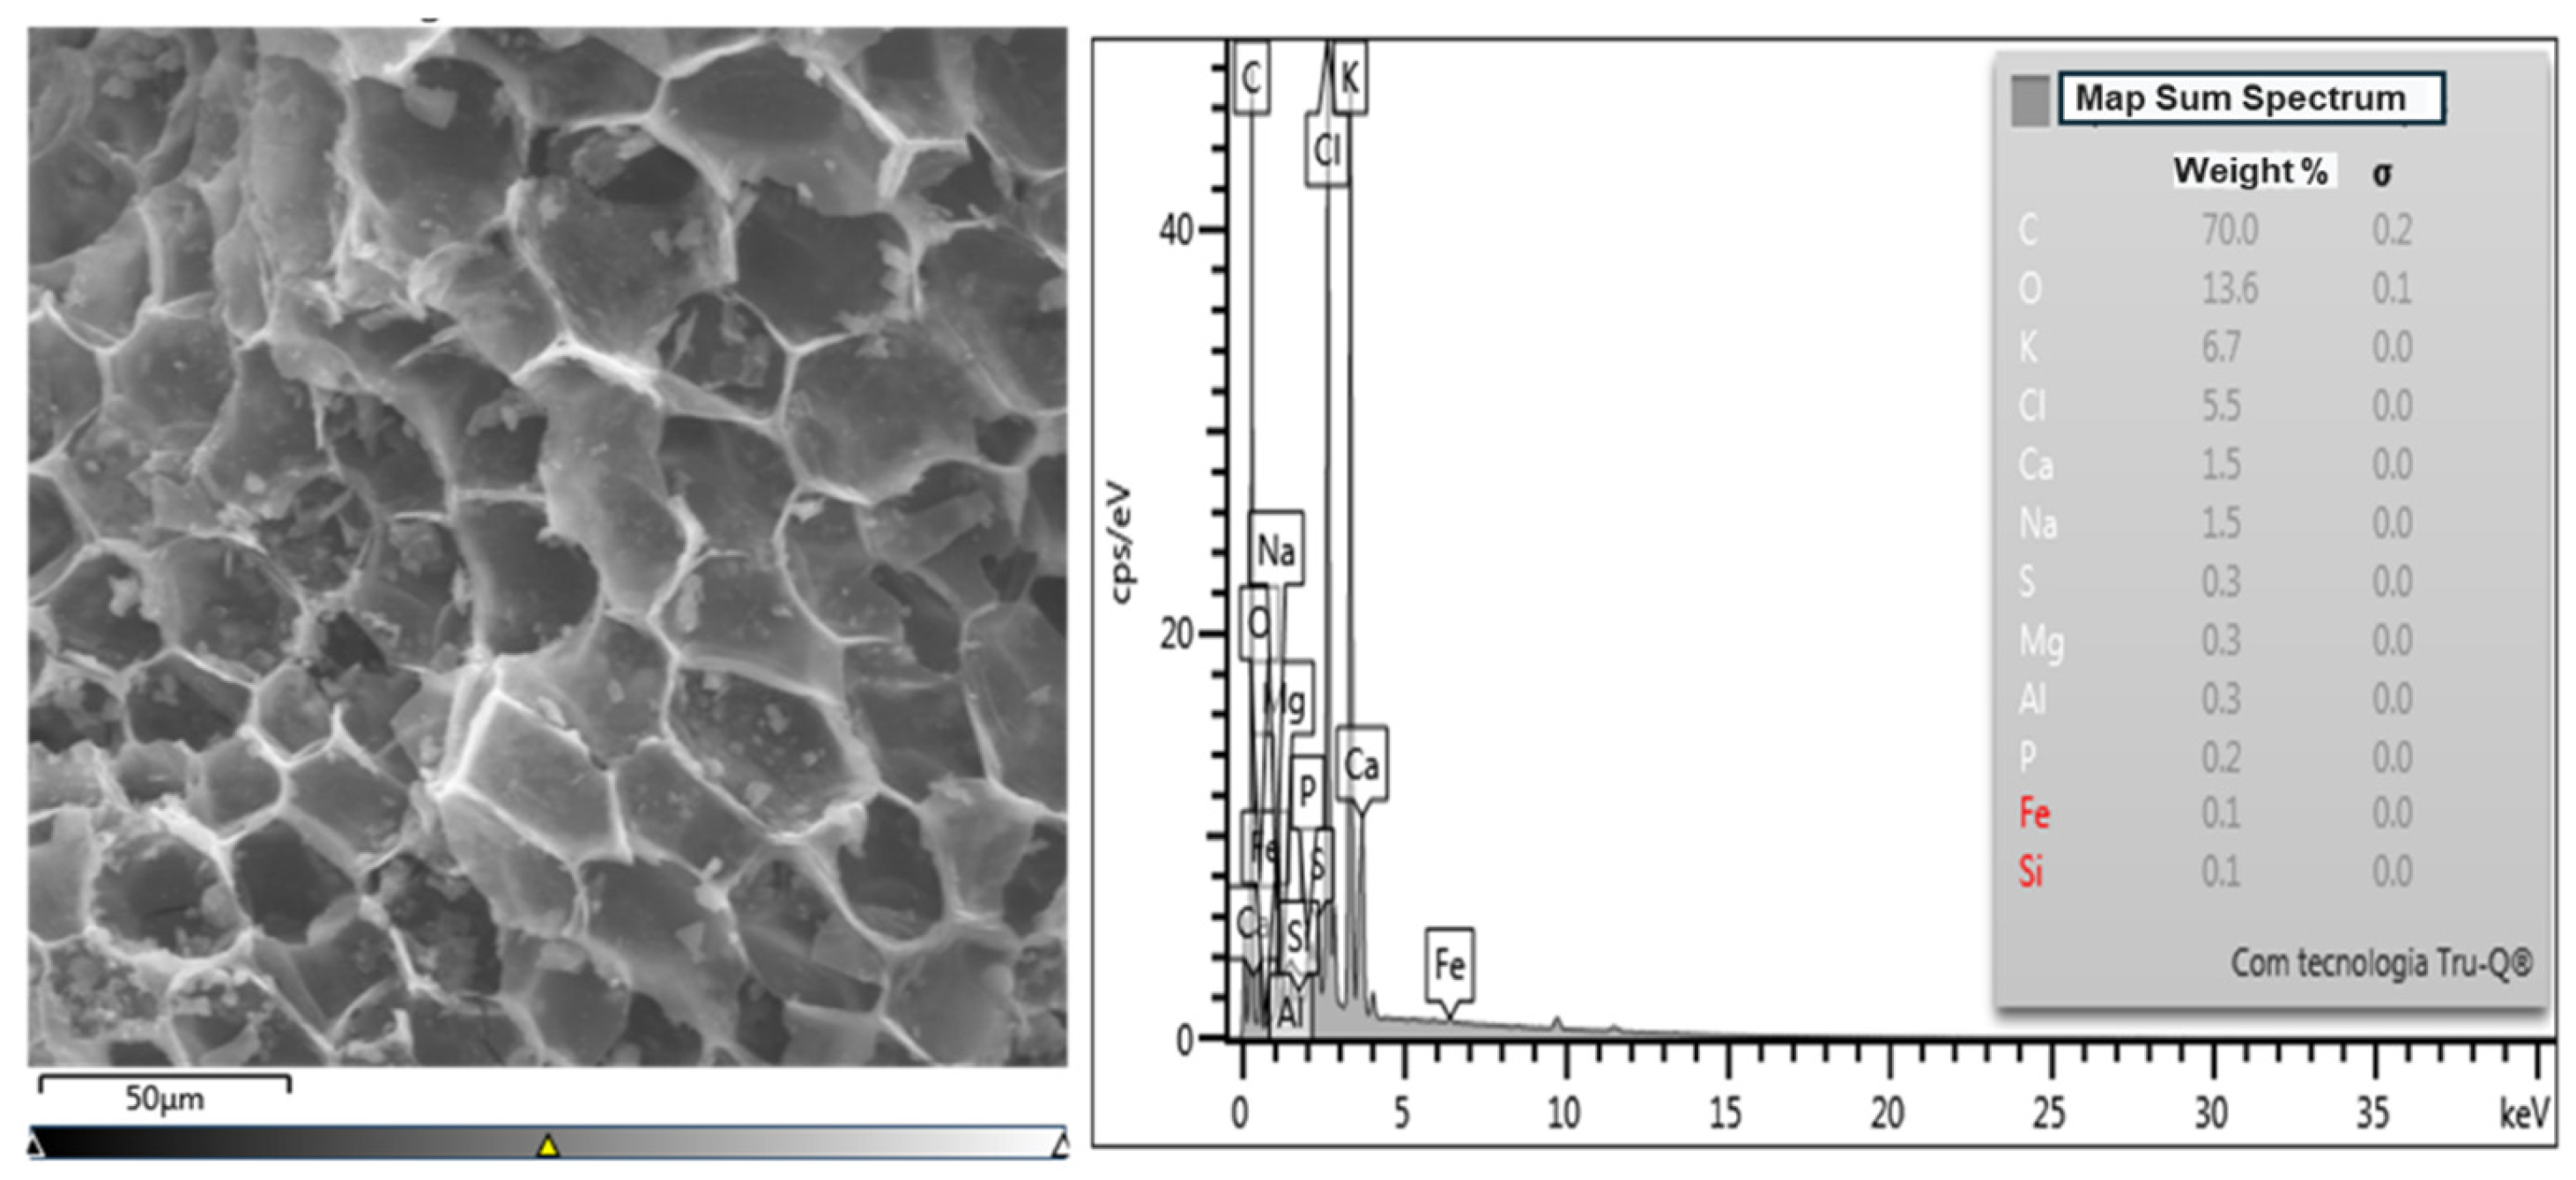
3.2.2. Energy Dispersive Spectroscopy Analysis—EDS
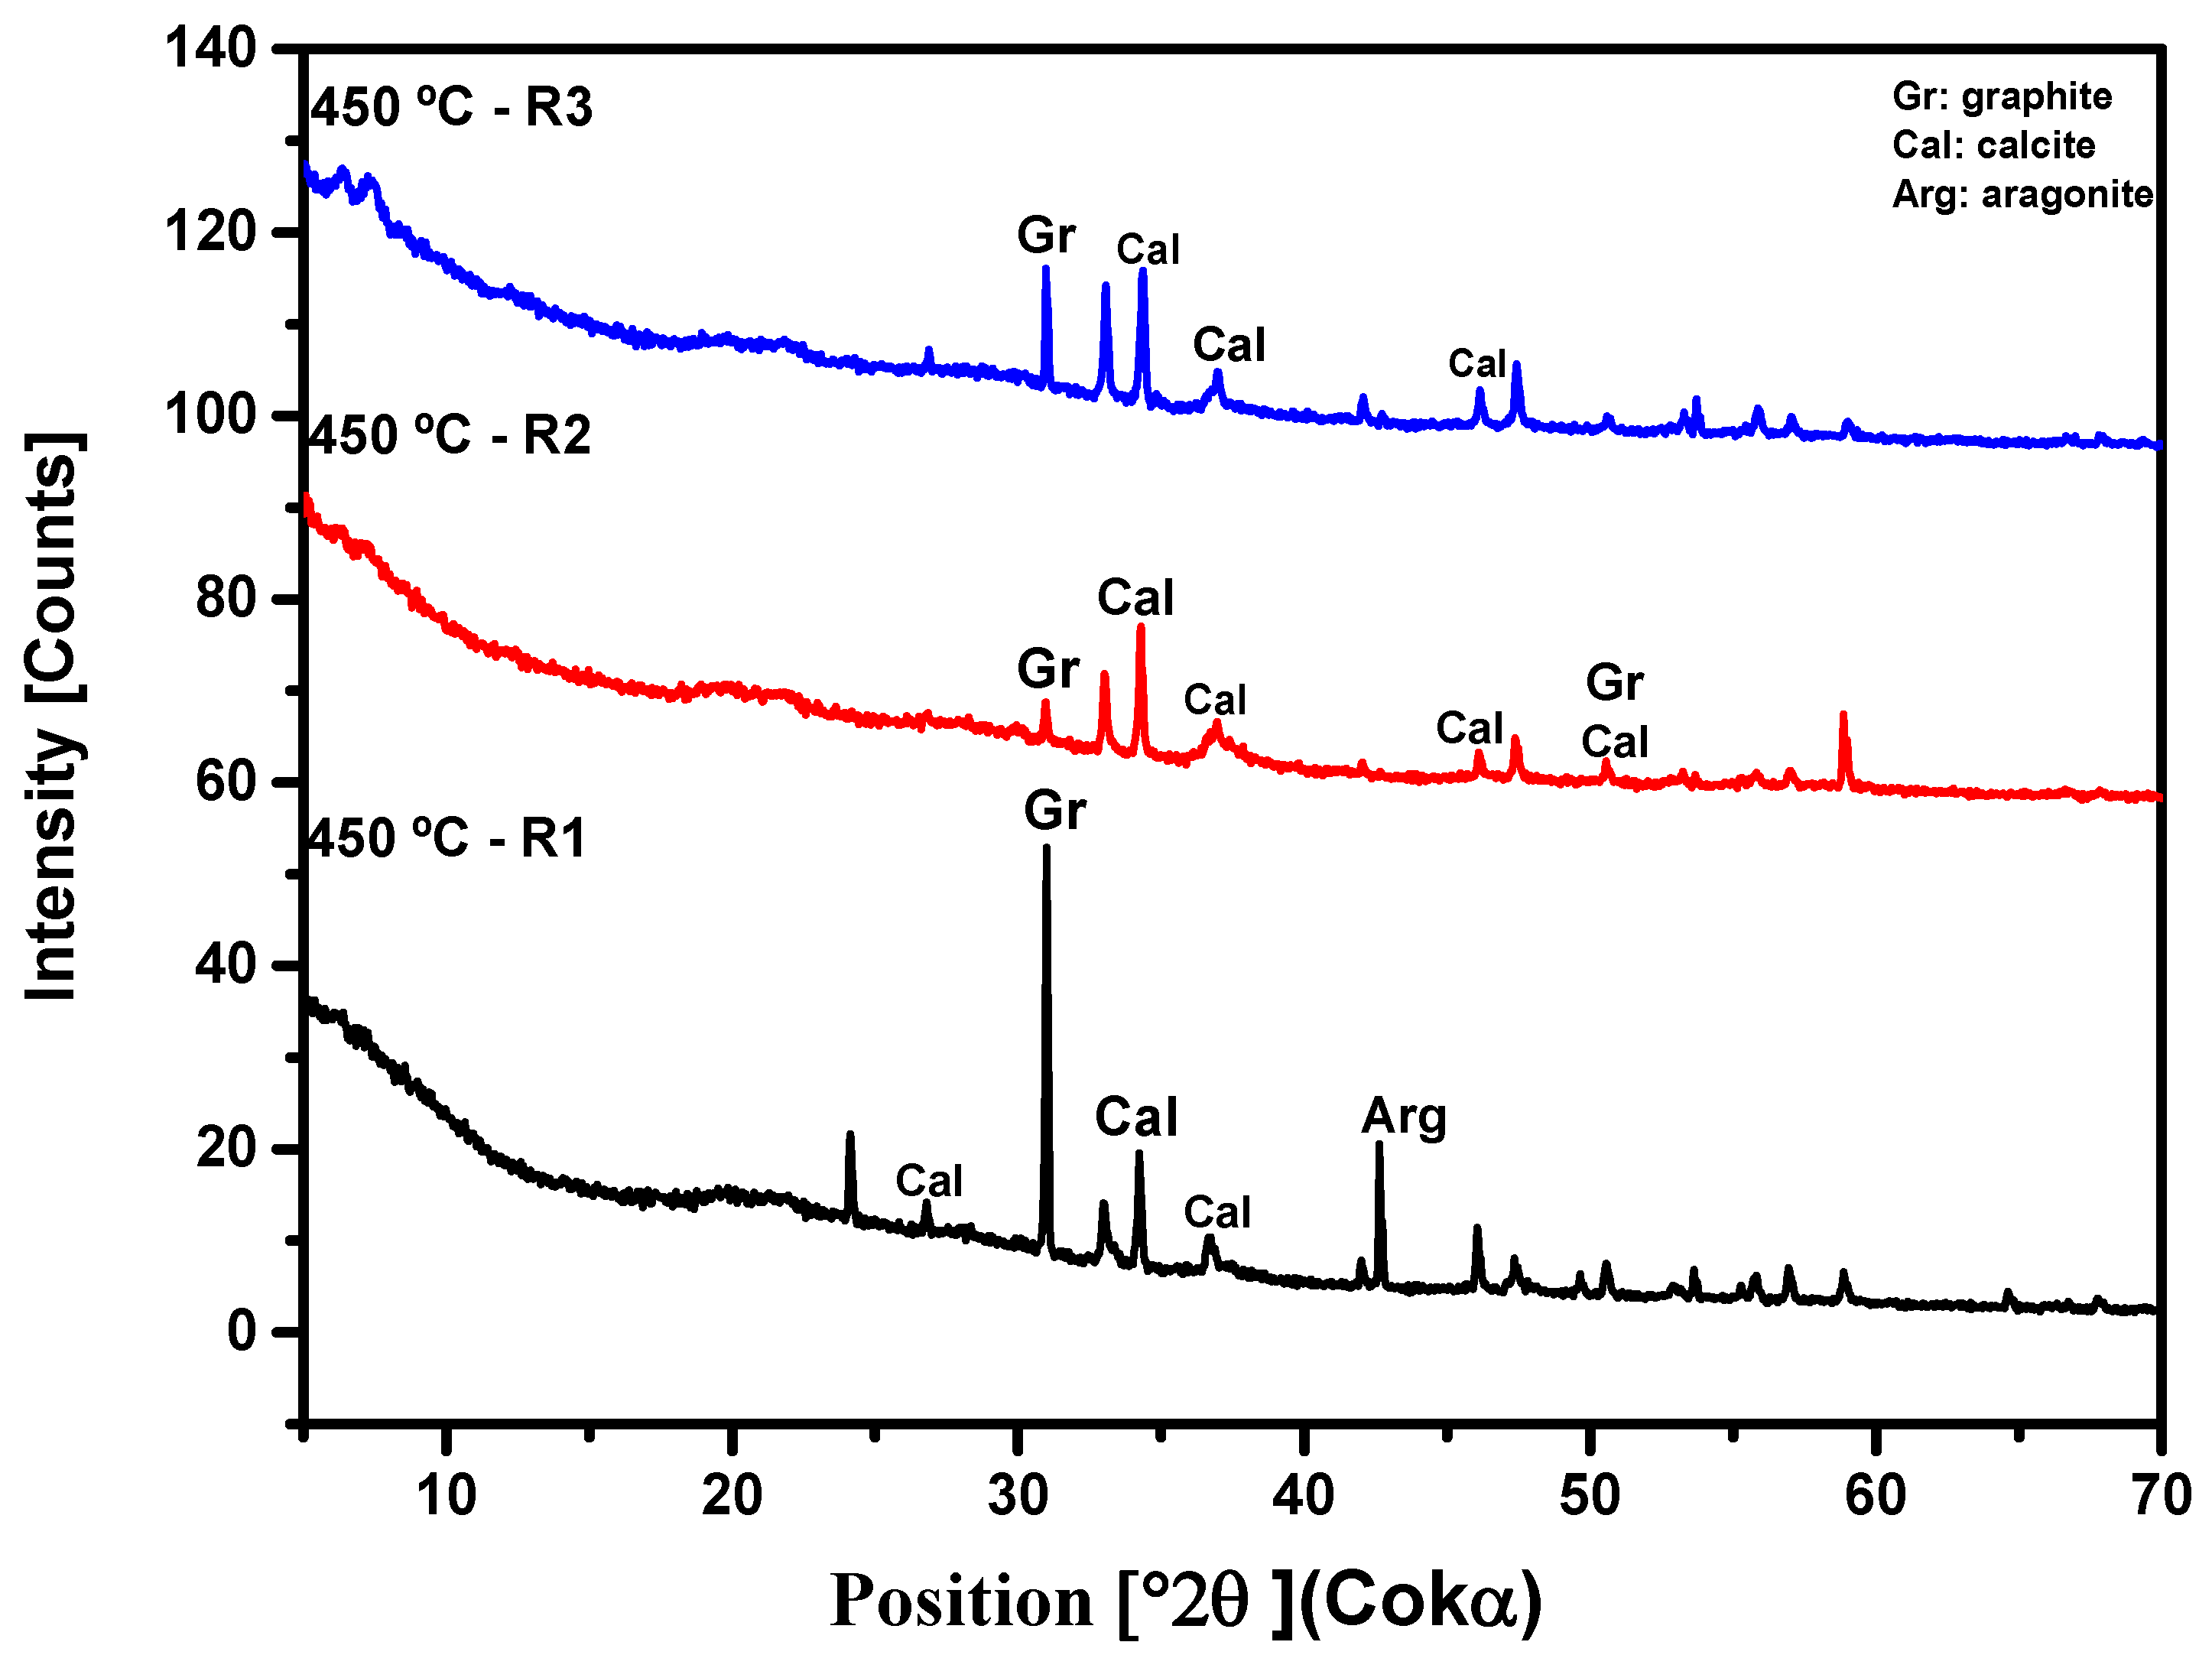
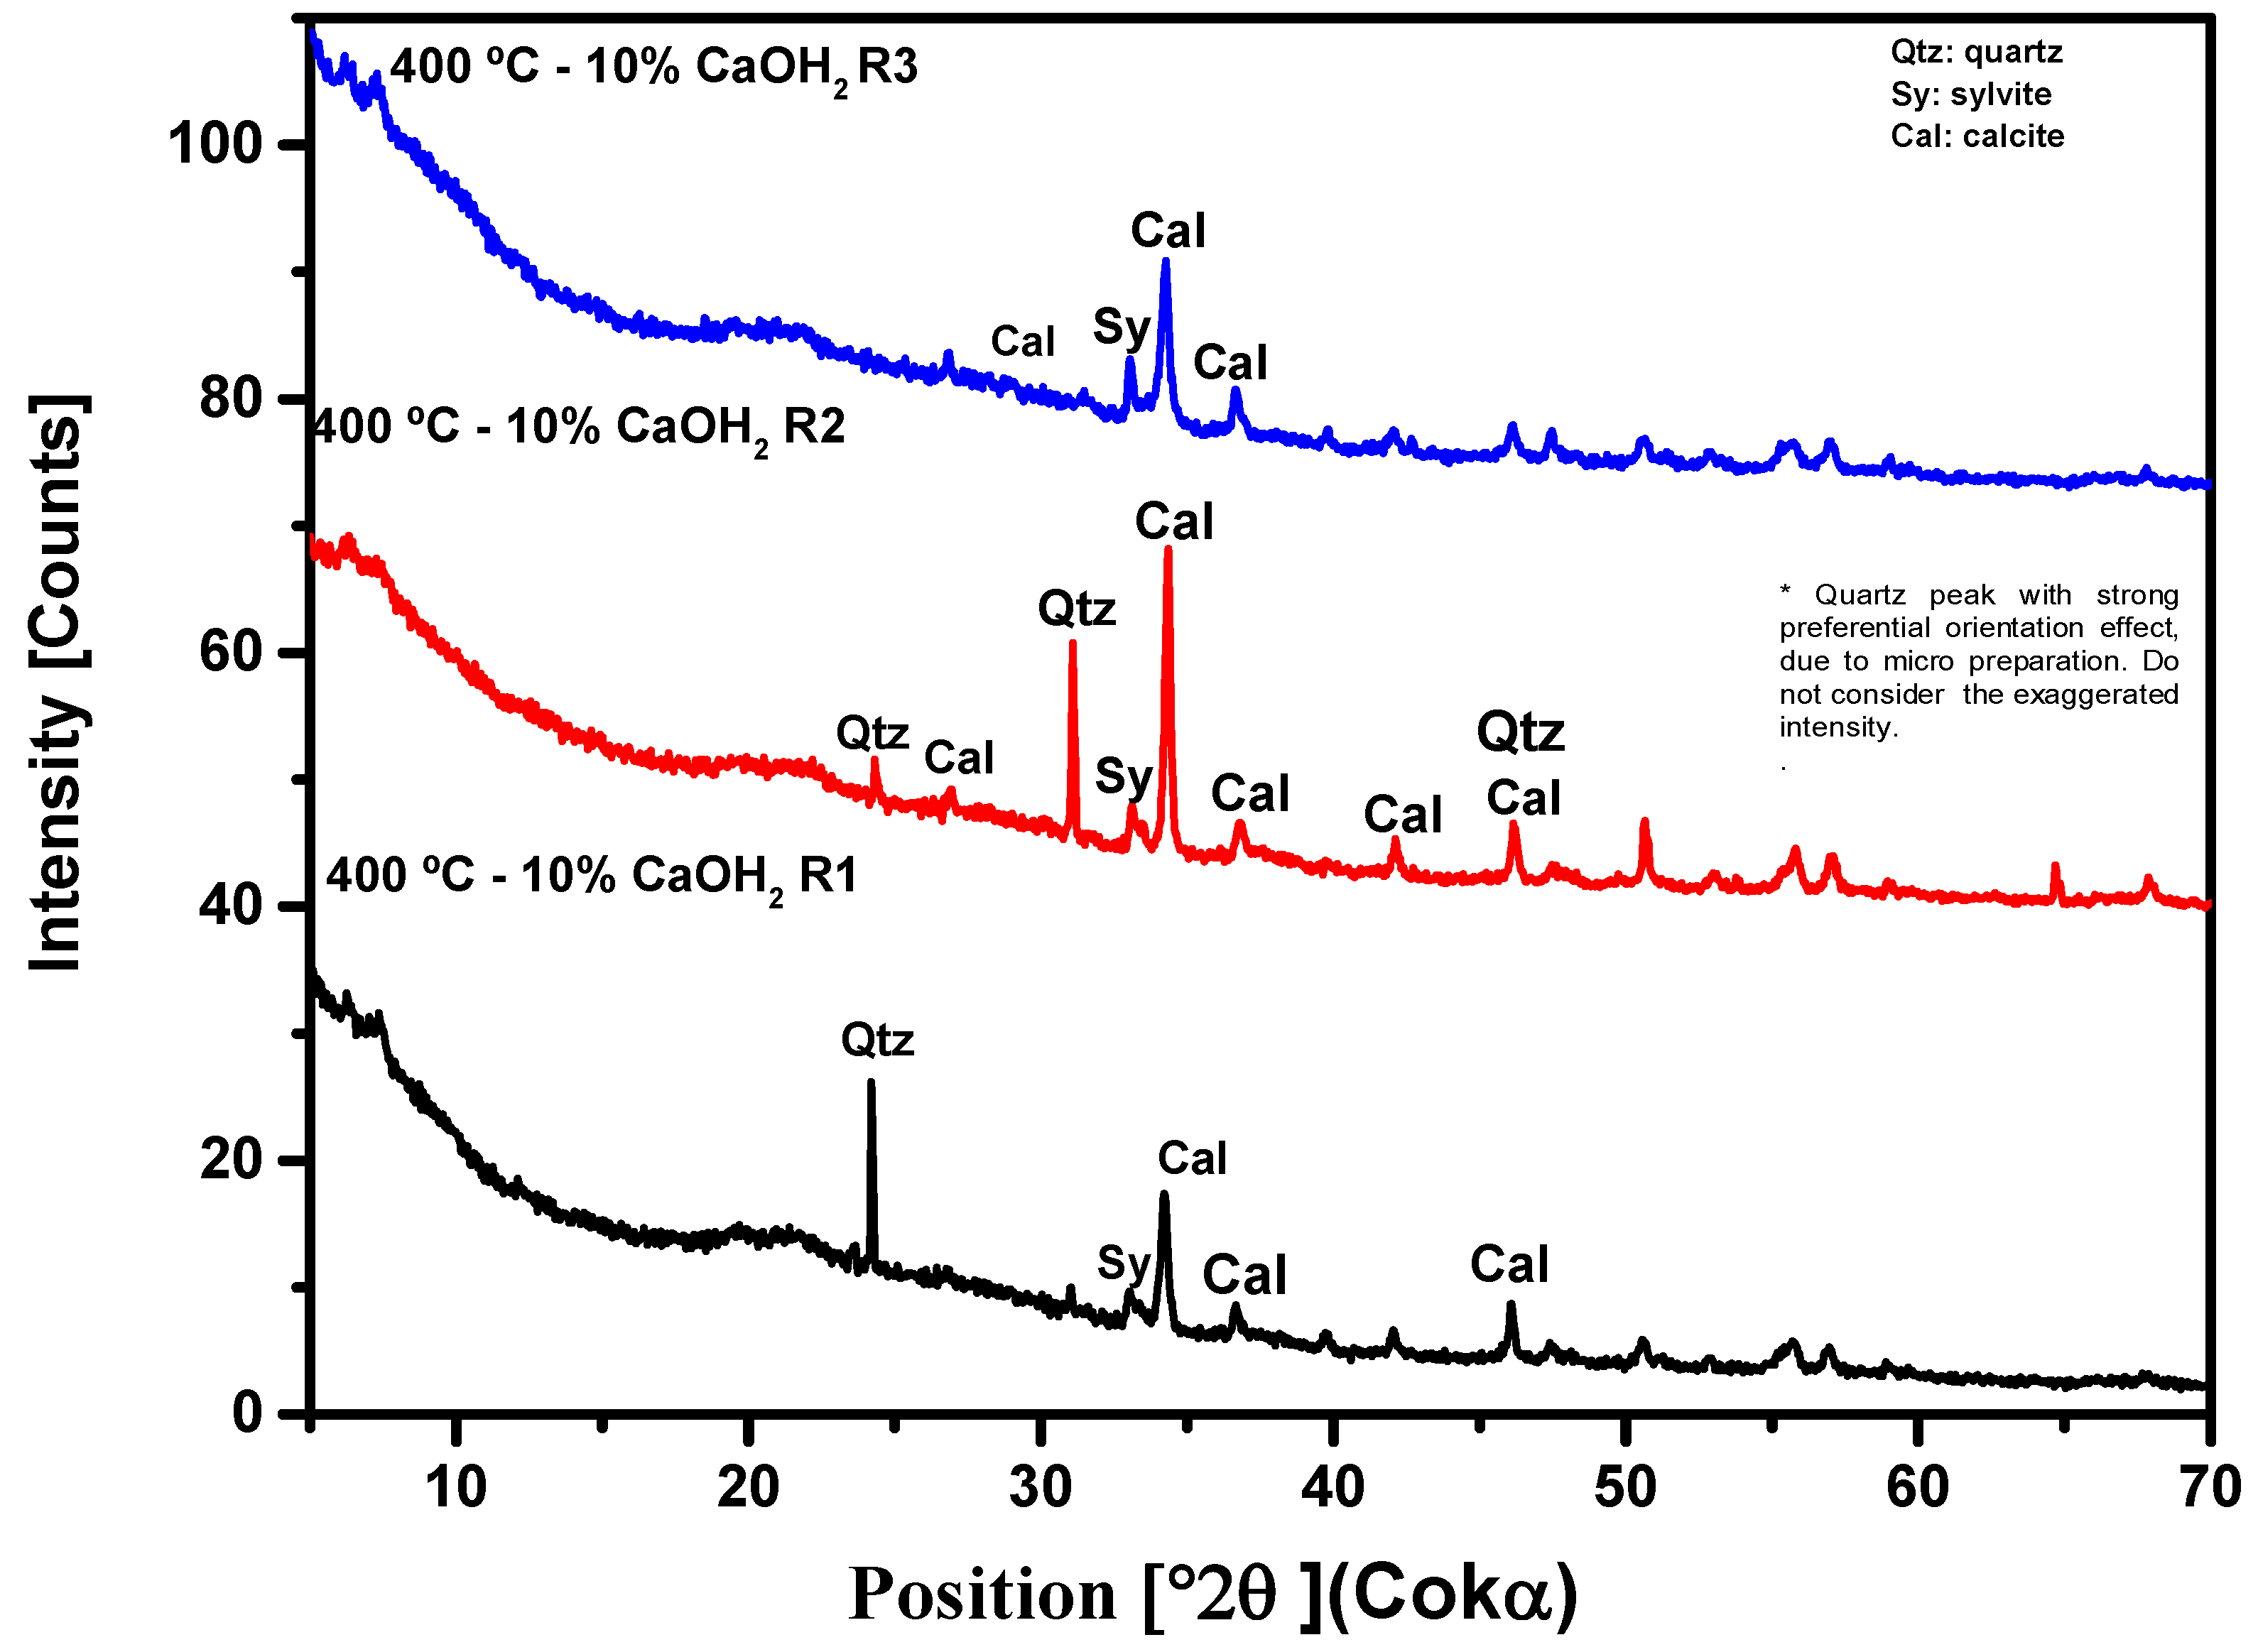
3.2.3. X-ray Diffraction Analysis (XRD)
3.4. Pyrolysis of MSW Fraction (Organic Matter and Paper) in Fixed Bed Reactor
3.4.1. Process Conditions, Mass Balances, and Yields of Reaction Products
3.4.2. Physicochemical and Compositional Characterization of Bio-Oil
3.4.2.1. Acidity of Bio-Oil
3.4.2.2. Fourier Transform in Infrared of Bio-Oil
3.4.2.3. RMN of Bio-Oil
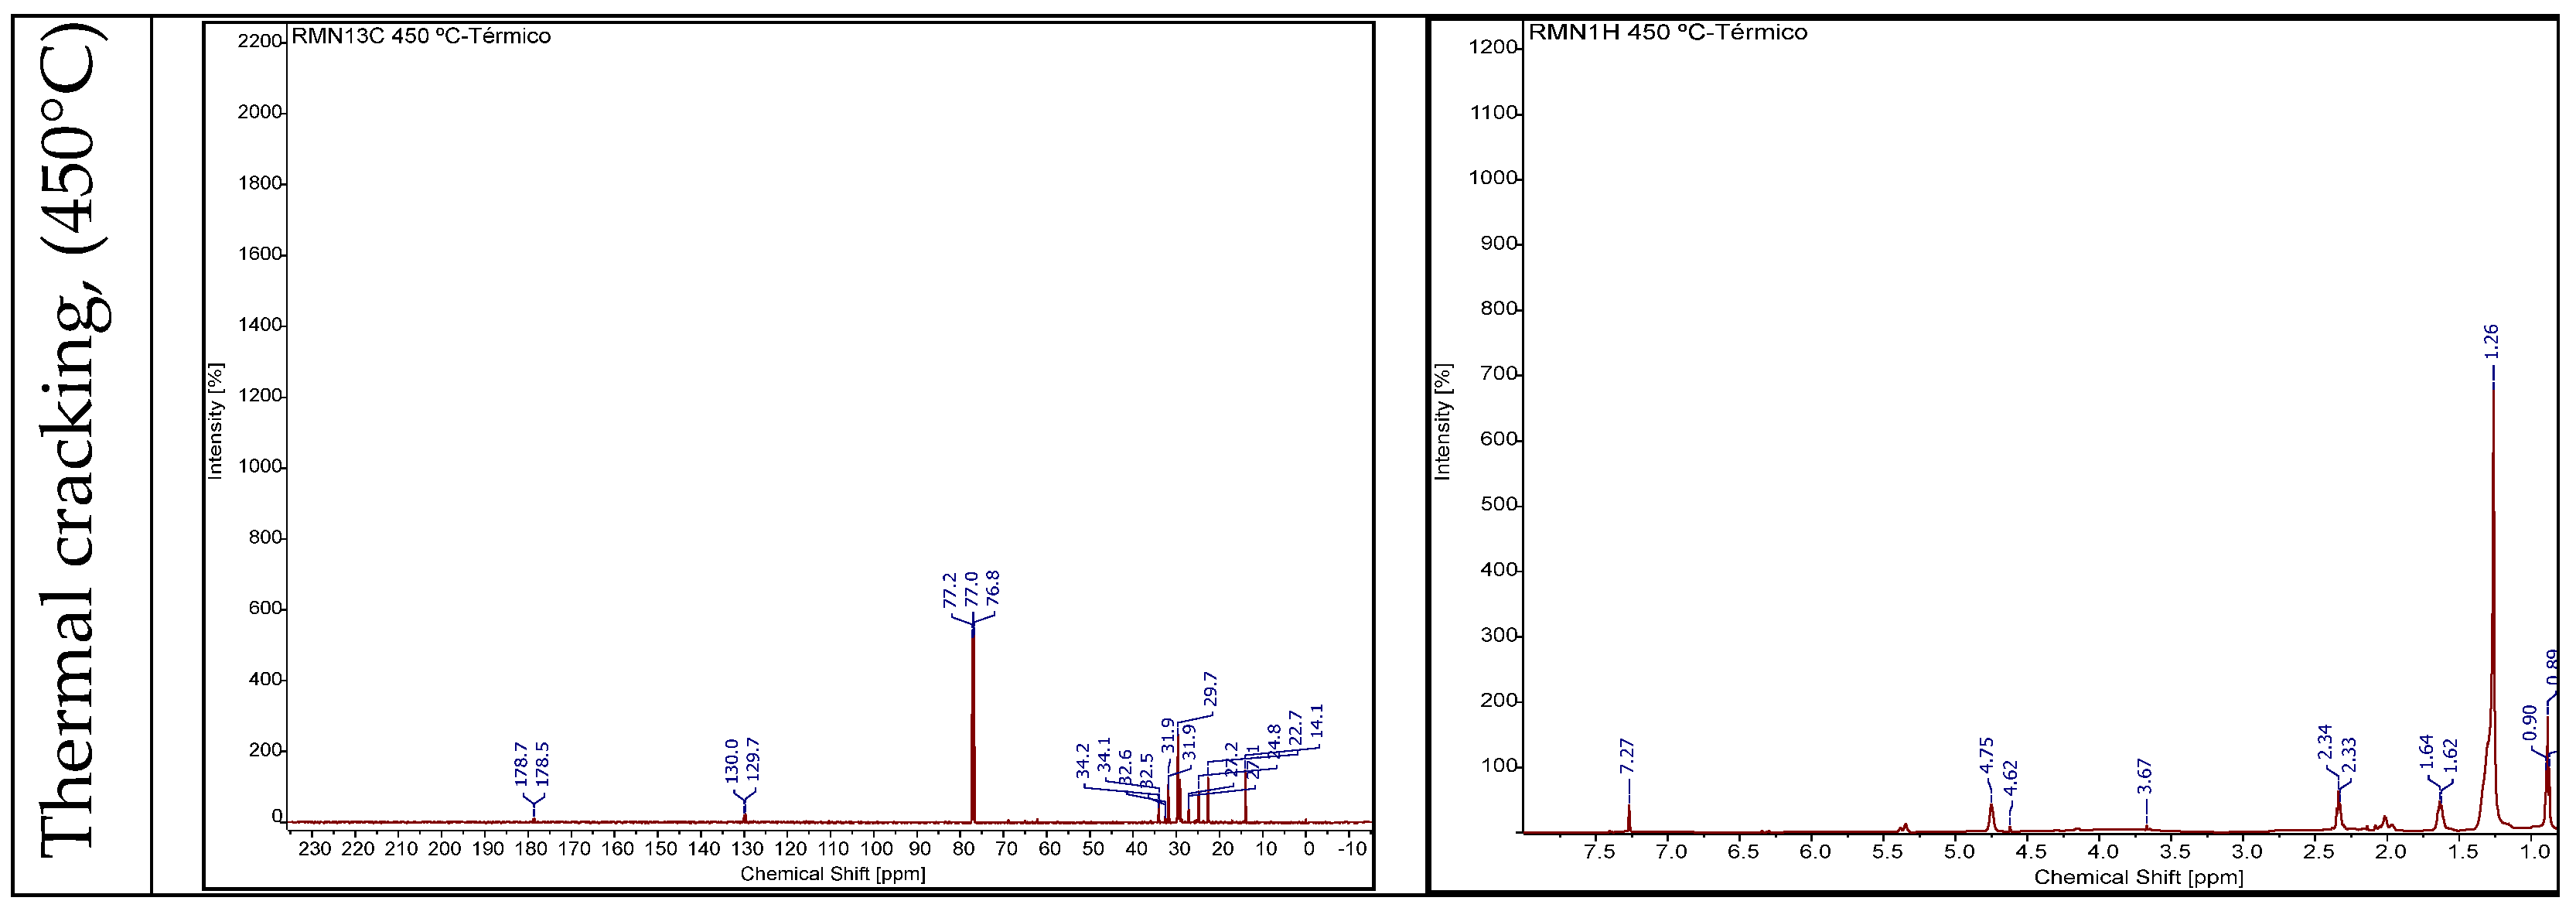
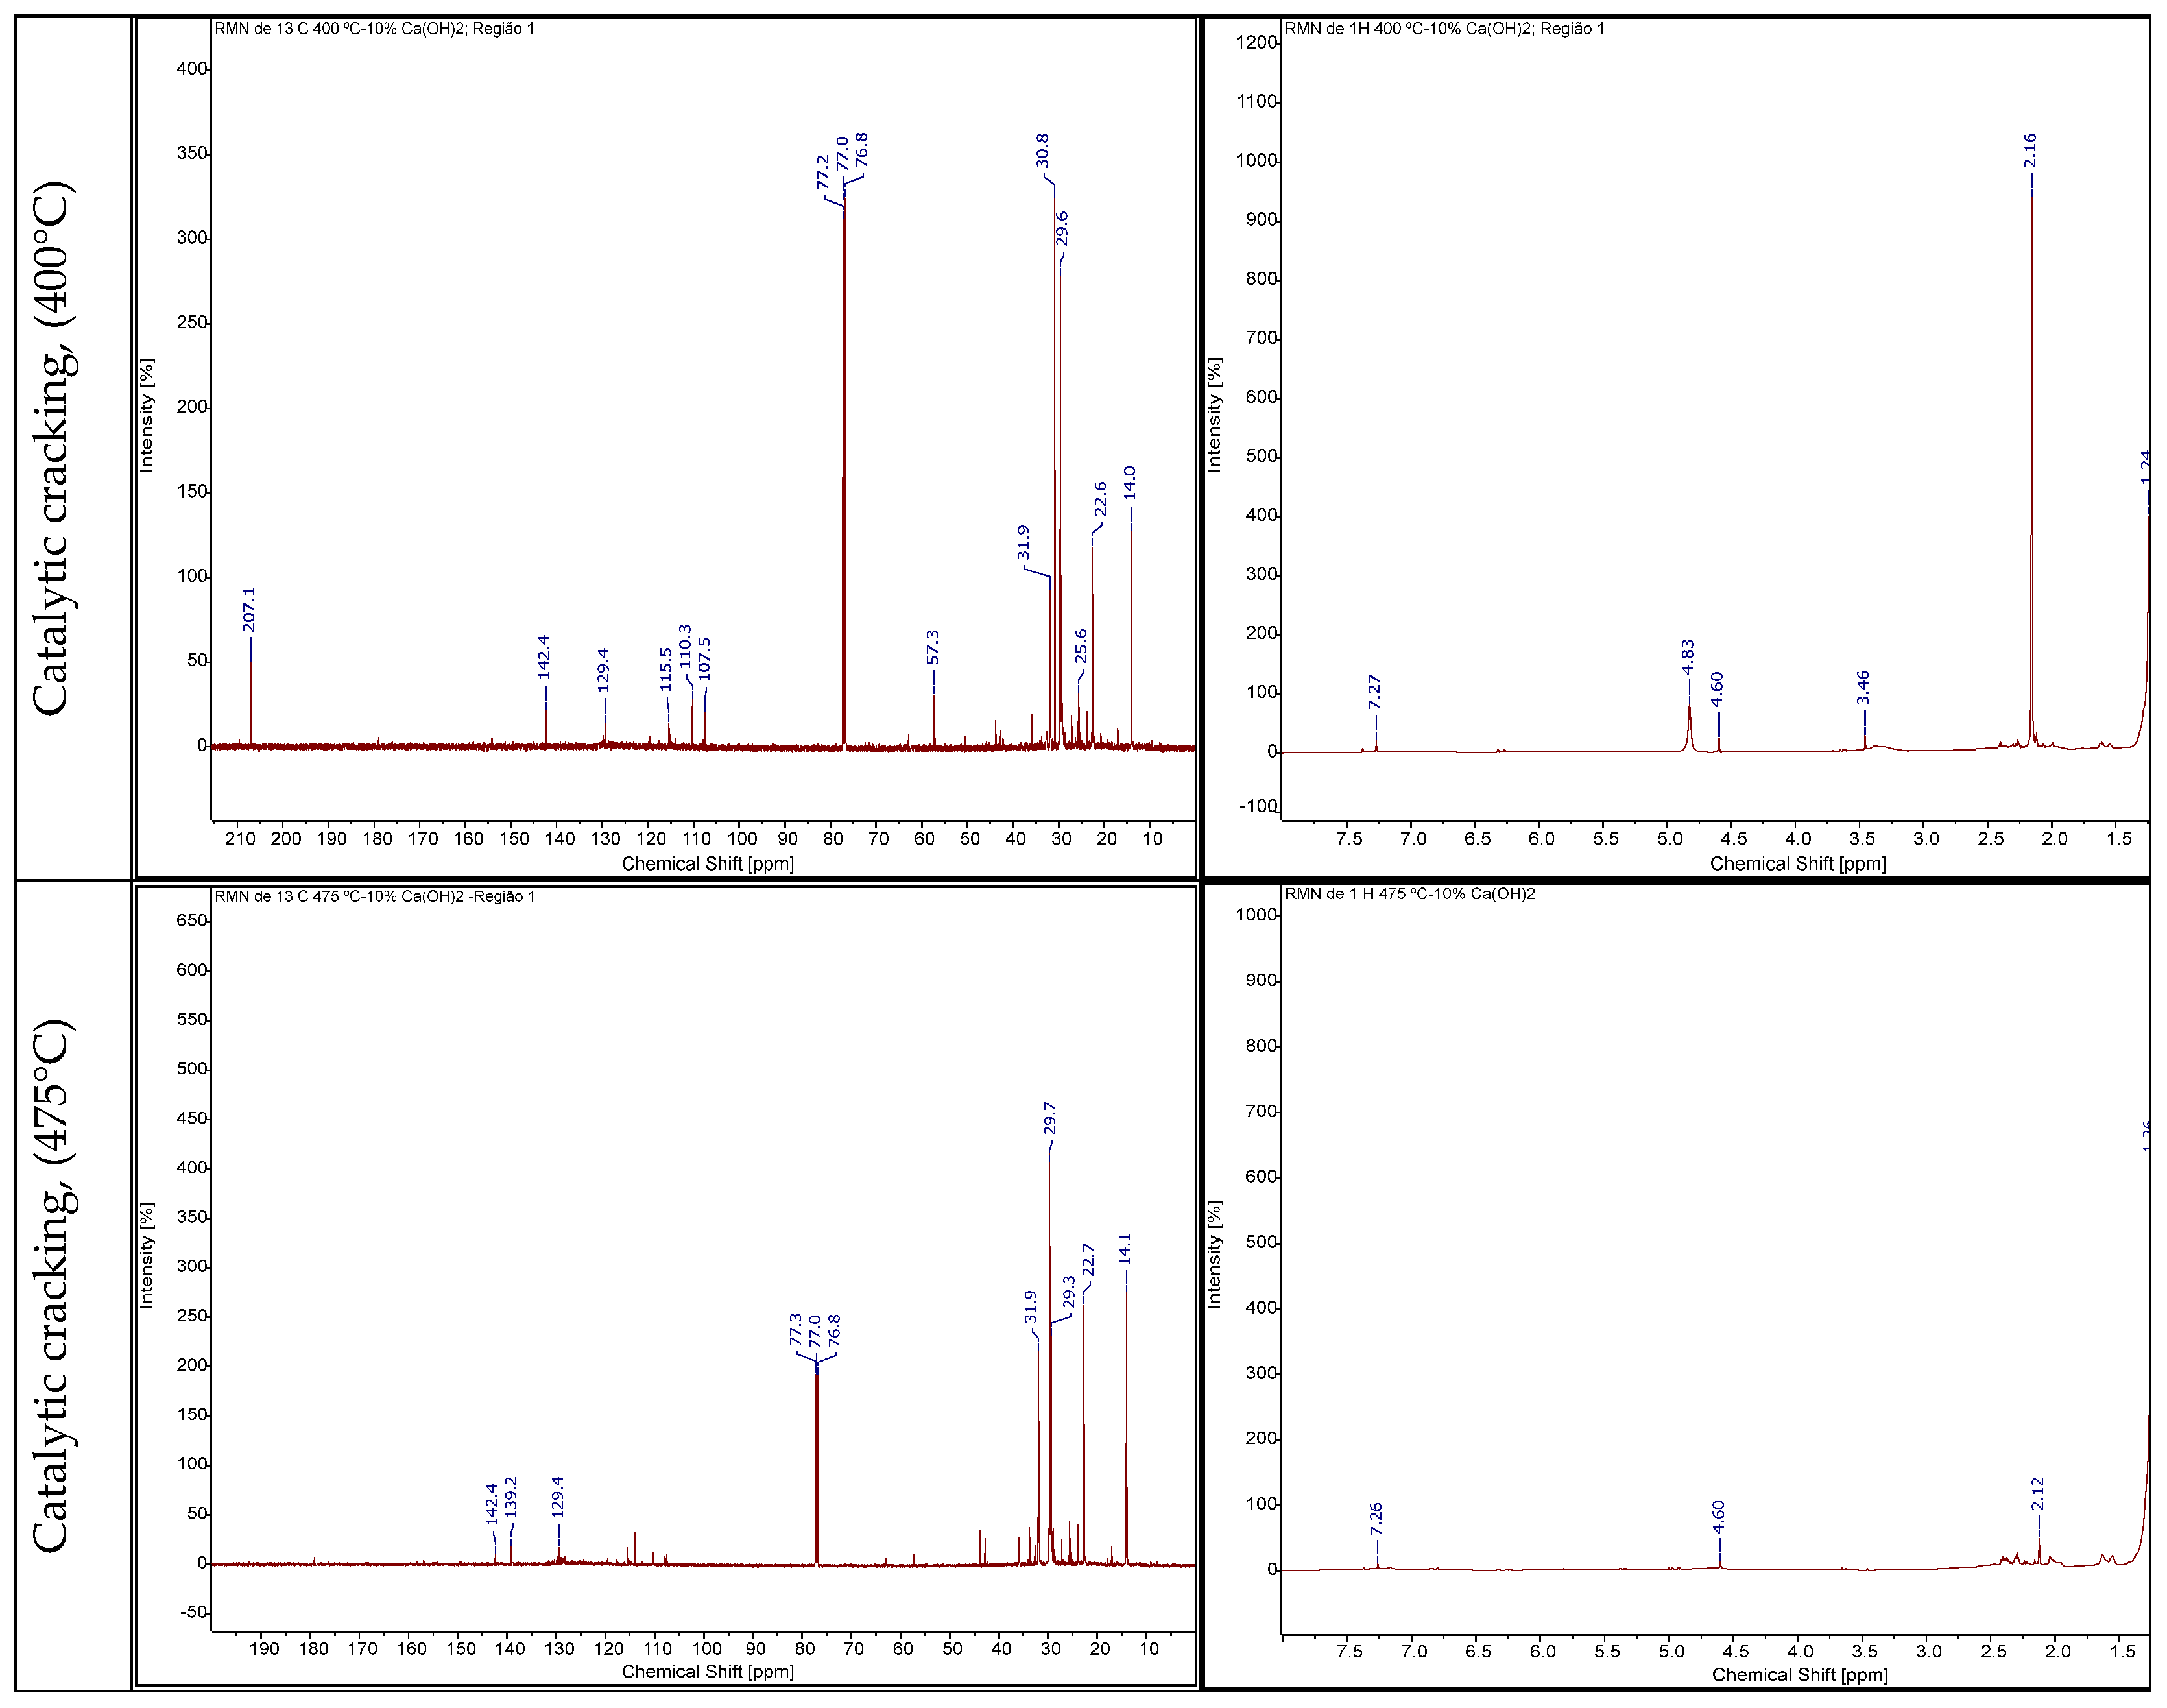
3.4.2.4. Gas Chromatography Analysis of Bio-Oil
5. Conclusions
Supplementary Materials
Author Contributions
Funding
Institutional Review Board Statement
Informed Consent Statement
Acknowledgments
Conflicts of Interest
References
- Hoornweg, D.; Bhada-Tata, P. What a Waste: A Global Review of Solid Waste Management; World Bank: New York, NY, USA, 2012.
- Kaza, S.; Yao, L.; Bhada-Tata, P.; Van Woerden, F. What a Waste 2.0: A Global Snapshot of Solid Waste Management to 2050; The World Bank: Washington, DC, USA, 2018.
- JAMBECK, J. R. et al. Plastic waste inputs from land into the ocean. Science, v. 347, p. 768-771, 2015. [CrossRef]
- BRAZILIAN ASSOCIATION OF PUBLIC CLEANING AND SPECIAL WASTE COMPANIES—ABRELPE. Panora-ma 2020. São Paulo: ABRELPE, 2021;
- SILVA, Diego Rodrigues Borges da; COSTA FILHO, Itair da Silva; SOUZA, Waryson Carlos Silva de; SANTOS, Filip-pe Vilhena dos; MACHADO, Paulo Christian de Freitas; BRANDÃO, Isaque Wilkson de Sousa; PEREIRA, Filipe Castro; ASSUNAÇÃO, Maurilo André da Cunha; SILVA, Rafael Haruo Yoshida; RUSSO, Mario Augusto Tavares; MENDON-ÇA, Neyson Martins. Quantitative and Qualitative Aspects of Urban Solid Waste in the Municipalities of Ananin-deua, Belém and Marituba. In: PEREIRA, Christiane; FRICKE, Klaus (coordination). Intersectoral Cooperation and Innovation: tools for sustainable solid waste management. Braunschweig: Technische Universität Braunschweig, 2022.
- UNITED NATIONS DEVELOPMENT PROGRAM (UNDP). Accompanying the 2030 agenda for sustainable development: initial input from the United Nations System in Brazil on the identification of national indicators relating to sustainable development objectives/United Nations Development Program. Brasília: PNUD, 2015. Available at <http://www.br.undp.org/content/brazil/pt/home/library/ods/acomprando-a-agenda2030.html> Accessed on March 10, 2018.
- S. Alam, K.S. Rahman, M. Rokonuzzaman, P.A. Salam, M.S. Miah, N. Das, S. Chowdhury, S. Channumsin, S. Sreesawet, M. Channumsin. Selection of Waste to Energy Technologies for Municipal Solid Waste Management—Towards Achieving Sustainable Development Goals. Sustainability, 14 (19) (2022), p. 11913; doi. [CrossRef]
- MENEZES, Rosana Oliveira; CASTRO, Samuel Rodrigues; SILVA, Jonathas Batista Gonçalves; TEIXEIRA, Gisele Pereira; SILVA, Marco Aurélio Miguel. Statistical analysis of the gravimetric characterization of household solid waste: case study from the city of Juiz de Fora, Minas Gerais. Sanitary and Environmental Engineering, v. 24, no. 2, p. 271-282. DOI. [CrossRef]
- BRENNAN, R. B. et al. Management of landfill leachate: the legacy of European Union Directives. Waste Management, 2015. [CrossRef]
- SAMADDER, S. R. et al. Analysis of the contaminants released from municipal solid waste landfill site: A case study. Science Total Environmental, [S.l.], 2016. [CrossRef]
- UNEP—Finance Initiative. Financing Circularity: Demystifying Finance for Circular Economies. 2020. Disponível em: https://www.unep.org/resources/report/financing-circularity-demystifying finance-circular-economy. Acesso em: 12 out. 2022.
- Silva, Rodrigo Cândido Passos da; COSTA, Amanda Rodrigues Santos; Eldeir, Soraya Giovanetti; Jucá, José Fernando Thomé. Sectorization of household solid waste collection routes using multivariate techniques: case study from the city of Recife, Brazil. Sanitary and Environmental Engineering, v. 25, no. 6, p. 821-832, 2020. [CrossRef]
- LENZ, S.; BÖHM, K.; OTTNER, R.; HUBER-HUMER, M. (2016) Determination of leachate compounds relevant for landfill aftercare using FT-IR spectroscopy. Waste Management, v. 55, p. 321-329. [CrossRef]
- Alsayed Alsobky, Mostafa Ahmed, Sherien Al Agroudy, Khaled El Araby. A smart framework for municipal solid waste collection management: A case study in Greater Cairo Region. Ain Shams Engineering Journal. Volume 14, Issue 6. 2023. 102183. ISSN 2090-4479. [CrossRef]
- BANAR, M.; ÖZCAN, A. (2008). Characterization of the Municipal Solid Waste in Eskisehir City, Turkey. Enviromental Engineering Science, v. 25, n. 8, p. 1213-1219. [CrossRef]
- MIEZAH, K.; OBIRI-DANSO, K.; KÁDÁR, Z.; FEI-BAFFOE, B.; MENSAH, M. (2015) Municipal solid waste characterization and quantification as a measure towards effective waste management in Ghana, Waste Management, v. 46, p. 15-27. [CrossRef]
- OGWUELEKA, T.C. (2013) Survey of household waste composition and quantities in Abuja, Nigeria. Resources, Conservation and Recycling, v. 77, p. 52-60. [CrossRef]
- COSTA, L.E.B.; COSTA, S.K.; REGO, N.A.C.; SILVA JÚNIOR, M.F. (2012) Gravimetry of household urban solid waste and socioeconomic profile in the municipality of Salinas, Minas Gerais. Ibero-American Journal of Environmental Sciences, v. 3, n. 2, p. 73-90. [CrossRef]
- OZCAN, H.K.; GUVENC, S.Y.; GUVENC, L.; DEMIR, G. (2016) Municipal Solid Waste Characterization according to Different Income Levels: A Case Study. Sustainability, v. 8, n. 10, p. 1044. [CrossRef]
- Carneiro, Paulo Fernando Norat. Characterization and evaluation of the economic potential of selective collection and recycling of household solid waste generated in the municipalities of Belém and Ananindeua—PA. 2006. Dissertation (Master’s in Civil Engineering)—Postgraduate Program in Civil Engineering (PPGEC), Institute of Technology (ITEC), Technological Center, Federal University of Pará, Belém, 2006. Available at: http://www.repositorio.ufpa.br:8080/jspui/handle/2011/1899;
- Frishammar, J., & Parida, V. (2019). Circular Business Model Transformation: A Roadmap for Incumbent Firms. California Management Review, 61(2), 5-29. [CrossRef]
- da Mota, S.; Mancio, A.; Lhamas, D.; de Abreu, D.; da Silva, M.; dos Santos, W.; de Castro, D.; de Oliveira, R.; Araújo, M.; Borges, L.E.; et al. Production of green diesel by thermal catalytic cracking of crude palm oil (Elaeis guineensis Jacq) in a pilot plant. J. Anal. Appl. Pyrolysis 2014, 110, 1–11. [CrossRef]
- LHAMAS, D. E. L. et al. Study of the Thermocatalytic Cracking Process of Palm Oil (Elaeis guineensis) Neutralized on Semi-Pilot Scale and Laboratory Scale. In: 4th National Biofuels Symposium, 2011, Rio de Janeiro.
- SANTOS, M.C. Study of the thermolytic cracking process of palm oil neutralization sludge for biofuel production. 2015. 241 f. Thesis (Doctorate in Amazon Natural Resources Engineering)—Federal University of Pará, Belém, 2011.
- Almeida, H.D.S.; Corrêa, O.; Ferreira, C.; Ribeiro, H.; de Castro, D.; Pereira, M.; Mâncio, A.D.A.; Santos, M.; da Mota, S.; Souza, J.D.S.; et al. Diesel-like hydrocarbon fuels by catalytic cracking of fat, oils, and grease (FOG) from grease traps. J. Energy Inst. 2016, 90, 337–354. DOI. [CrossRef]
- PEREIRA, L. M. Study of the sewage sludge cracking process, at different scales, aiming at alternative uses—Doctoral Thesis, Federal University of Pará. Institute of technology, Postgraduate Program in Natural Resources Engineering of the Amazon. Belém, 2019.
- BRIDGWATER, A.V. Review of fast pyrolysis of biomass and product upgrading, Biomass Bioenergy, 38, 68—94, 2012. [CrossRef]
- Czajczynska D, Anguilano L, Ghazal H, Krzy˙ zy’nska R, Reynolds AJ, Spencer N, et al. Potential of pyrolysis processes in the waste management sector. Thermal Science and Engineering Progress 2017,3:171–97.
- Grycová B, Koutník I, Pryszcz A. Pyrolysis process for the treatment of food waste. Bioresour Technol 2016,218:1203–7. [CrossRef]
- Yang Y, Heaven S, Venetsaneas N, Banks CJ, Bridgwater AV. Slow pyrolysis of organic fraction of municipal solid waste (OFMSW): characterisation of products and screening of the aqueous liquid product for anaerobic digestion. Appl Energy 2018,213:158–68. [CrossRef]
- Opatokun SA, Strezov V, Kan T. Product based evaluation of pyrolysis of food waste and its digestate. Energy 2015,92:349–54. [CrossRef]
- Ben Hassen-Trabelsi A, Kraiem T, Naoui S, Belayouni H. Pyrolysis of waste animal fats in a fixed-bed reactor: production and characterization of bio-oil and bio- char. Waste Manag 2014,34:210–8. [CrossRef]
- González JF, Rom´ an S, Encinar JM, Martínez G. Pyrolysis of various biomass residues and char utilization to produce activated carbons. J Anal Appl Pyrol 2009,85:134–41;
- Liu H, Ma X, Li L, Hu Z, Guo P, Jiang Y. The catalytic pyrolysis of food waste by microwave heating. Bioresour Technol 2014,166:45–50. [CrossRef]
- Serio M, Kroo E, Florczak E, W´ojtowicz M, Wignarajah K, Hogan J, et al. Pyrolysis of mixed solid food, paper, and packaging wastes. SAE International 2008.
- Xu F, Ming X, Jia R, Zhao M, Wang B, Qiao Y, et al. Effects of operating parameters on products yield and volatiles composition during fast pyrolysis of food waste in the presence of hydrogen. Fuel Process Technol 2020,210:106558. [CrossRef]
- Strezov V, Evans TJ. Thermal processing of paper sludge and characterisation of its pyrolysis products. Waste Manag 2009,29:1644–8. [CrossRef]
- Nurul Islam M, Nurul Islam M. Rafiqul Alam Beg M, Rofiqul Islam M. Pyrolytic oil from fixed bed pyrolysis of municipal solid waste and its characterization. Renew Energy 2005,30:413–20.
- Chen C, Jin Y, Chi Y. Effects of moisture content and CaO on municipal solid waste pyrolysis in a fixed bed reactor. J Anal Appl Pyrol 2014,110:108–12. [CrossRef]
- Biswal B, Kumar S, Singh RK. Production of hydrocarbon liquid by thermal pyrolysis of paper cup waste. Journal of Waste Management 2013,2013:7. [CrossRef]
- Li L, Zhang H, Zhuang X. Pyrolysis of waste paper: characterization and composition of pyrolysis oil. Energy Sources 2005,27:867–73. [CrossRef]
- Wu C-H, Chang C-Y, Tseng C-H. Pyrolysis products of uncoated printing and writing paper of MSW. Fuel 2002,81:719–25. [CrossRef]
- Jk M, Namjoshi S, Channiwala S. Kinetics and pyrolysis of glossy paper waste. Int J Eng Res Gen Sci 2012,2:1067–74.
- Sarkar A, Chowdhury R. Co-pyrolysis of paper waste and mustard press cake in a semi-batch pyrolyzer—optimization and bio-oil characterization. Int J Green Energy 2016,13:373–82. [CrossRef]
- Bhuiyan M, Murakami K, Ota M. On thermal stability and chemical kinetics of waste newspaper by thermogravimetric and pyrolysis analysis. J Environ Eng 2008,3:1–12. [CrossRef]
- Wu C-H, Chang C-Y, Tseng C-H, Lin J-P. Pyrolysis product distribution of waste newspaper in MSW. J Anal Appl Pyrol 2003,67:41–53; [CrossRef]
- Veses A, Sanahuja-Parejo O, Call´ en MS, Murillo R, García T. A combined two- stage process of pyrolysis and catalytic cracking of municipal solid waste for the production of syngas and solid refuse-derived fuels. Waste Manag 2020,101:171–9.
- Ding K, Zhong Z, Zhong D, Zhang B, Qian X. Pyrolysis of municipal solid waste in a fluidized bed for producing valuable pyrolytic oils. Clean Technol Environ Policy 2016,18:1111–21. [CrossRef]
- Luo S, Xiao B, Hu Z, Liu S, Guan Y, Cai L. Influence of particle size on pyrolysis and gasification performance of municipal solid waste in a fixed bed reactor. Bioresour Technol 2010,101:6517–20. [CrossRef]
- Mamad Gandidi I, Susila MD, Agung Pambudi N. Production of valuable pyrolytic oils from mixed Municipal Solid Waste (MSW) in Indonesia using non-isothermal and isothermal experimental. Case Studies in Thermal Engineering 2017,10:357–61.
- Zhang A, Xiao L, Wu D. Anaerobic pyrolysis characteristics of municipal solid waste under high temperature heat source. Energy Procedia 2015,66:197–200. [CrossRef]
- Wang N, Qian K, Chen D, Zhao H, Yin L. Upgrading gas and oil products of the municipal solid waste pyrolysis process by exploiting in-situ interactions between the volatile compounds and the char. Waste Manag 2020,102:380–90. [CrossRef]
- Tursunov O. A comparison of catalysts zeolite and calcined dolomite for gas production from pyrolysis of municipal solid waste (MSW). Ecol Eng 2014,69: 237–43. [CrossRef]
- Baggio P, Baratieri M, Gasparella A, Longo GA. Energy and environmental analysis of an innovative system based on municipal solid waste (MSW) pyrolysis and combined cycle. Appl Therm Eng 2008,28:136–44. [CrossRef]
- Fang S, Yu Z, Lin Y, Hu S, Liao Y, Ma X. Thermogravimetric analysis of the co- pyrolysis of paper sludge and municipal solid waste. Energy Convers Manag 2015,101:626–31. [CrossRef]
- Paula, T.P.; Marques, M.F.V.; Marques, M.R.D.C. Influence of mesoporous structure ZSM-5 zeolite on the degradation of Urban plastics waste. J. Therm. Anal. 2019, 138, 3689–3699.
- Vakalis, S.; Sotiropoulos, A.; Moustakas, K.; Malamis, D.; Vekkos, K.; Baratieri, M. Thermochemical valorization and characterization of household biowaste. J. Environ. Manag. 2017, 203, 648–654; [CrossRef]
- Chen,C.; Jin, Y.; Chi, Y. Effects of moisture content and CaO on municipal solid waste pyrolysis in a fixed bed reactor.J. Anal. Appl. Pyrolysis 2014, 110, 108–112; [CrossRef]
- Veses, A.; Sanahuja-Parejo, O.; Callén, M.S.; Murillo, R.; García, T. A combined two-stage process of pyrolysis and catalytic cracking of municipal solid waste for the production of syngas and solid refuse-derived fuels. Waste Manag. 2019, 101, 171–179. [CrossRef]
- Lohri, C.R.; Faraji, A.; Ephata, E.; Rajabu, H.M.; Zurbrügg, C. Urban biowaste for solid fuel production: Waste suitability assessment and experimental carbonization in Dar es Salaam, Tanzania. Waste Manag. Res. J. A Sustain. Circ. Econ. 2015, 33, 175–182; [CrossRef]
- Phan, A.N.; Ryu, C.; Sharifi, V.N.; Swithenbank, J. Characterisation of slow pyrolysis products from segregated wastes for energy production. J. Anal. Appl. Pyrolysis 2008, 81, 65–71; [CrossRef]
- Shi, H.; Mahinpey, N.; Aqsha, A.; Silbermann, R. Characterization, thermochemical conversion studies, and heating value modeling of municipal solid waste. Waste Manag. 2016, 48, 34–47; [CrossRef]
- Miskolczi, N.; Ate¸ s, F.; Borsodi, N. Comparison of real waste (MSW and MPW) pyrolysis in batch reactor over different catalysts. Part II: Contaminants, char and pyrolysis oil properties. Bioresour. Technol. 2013, 144, 370–379.
- AlDayyat, E.; Saidan, M.; Al-Hamamre, Z.; Al-Addous, M.; Alkasrawi, M. Pyrolysis of Solid Waste for Bio-Oil and Char Production in Refugees’ Camp: A Case Study. Energies 2021, 14, 3861. [CrossRef]
- Sørum,L.; Grønli, M.G.; Hustad, J.E. Pyrolysis characteristics and kinetics of municipal solid wastes. Fuel 2001, 80, 1217–1227. [CrossRef]
- Song, Q.; Zhao, H.-Y.; Xing, W.-L.; Song, L.-H.; Yang, L.; Yang, D.; Shu, X. Effects of various additives on the pyrolysis characteristics of municipal solid waste. Waste Manag. 2018, 78, 621–629. [CrossRef]
- Ates, F.; Miskolczi, N.; Borsodi, N. Comparision of real waste (MSW and MPW) pyrolysis in batch reactor over different catalysts. Part I: Product yields, gas and pyrolysis oil properties. Bioresour. Technol. 2013, 133, 443–454. [CrossRef]
- Liu, G.; Liao, Y.; Guo, S.; Ma, X.; Zeng, C.; Wu, J. Thermal behavior and kinetics of municipal solid waste during pyrolysis and combustion process. Appl. Therm. Eng. 2016, 98, 400–408. [CrossRef]
- FOGLER, H.S. Elementos de Engenharia de reações Químicas. Editora LTC, 4 ed.2009.
- CHEW, T. L; BHATIA, S. Effect of catalyst additives on the production of biofuels from palm oil cracking in a transport riser reactor. Bioresource Technology, v. 100, p.2540–2545, 2009. [CrossRef]
- Konwer et al., 1989 D. Konwer, S.E. Taylor, B.E. Gordon, J.W. Otvos, M. Calvin. Liquid fuels from Messua ferra L. seed oil. J. Am. oil Chem. Soc., 66 (1989), pp. 223-226.
- Tursunov, O. A comparison of catalysts zeolite and calcined dolomite for gas production from pyrolysis of municipal solid waste (MSW). Ecol. Eng. 2014, 69, 237–243. [CrossRef]
- Assunção, F.P.d.C.; Pereira, D.O.; da Silva, J.C.C.; Ferreira, J.F.H.; Bezerra, K.C.A.; Bernar, L.P.; Ferreira, C.C.; Costa, A.F.d.F.; Pereira, L.M.; da Paz, S.P.A.; et al. A Systematic Approach to Thermochemical Treatment of Municipal Household Solid Waste into Valuable Products: Analysis of Routes, Gravimetric Analysis, Pre-Treatment of Solid Mixtures, Thermochemical Processes, and Characterization of Bio-Oils and Bio-Adsorbents. Energies 2022, 15, 7971. [CrossRef]
- Pereira, D.O.; da Costa Assunção, F.P.; da Silva, J.C.C.; Ferreira, J.F.H.; Ferreira, R.B.P.; Lola, Á.L.; do Nascimento, Í.C.P.; Chaves, J.P.; do Nascimento, M.S.C.; da Silva Gouvêa, T.; et al. Prediction of Leachate Characteristics via an Analysis of the Solubilized Extract of the Organic Fraction of Domestic Solid Waste from the Municipality of Belém, PA. Sustainability 2023, 15, 15456. [CrossRef]
- BELÉM. Lei Municipal nº 9.656, de 30 de dezembro de 2020. Institui a Política Municipal de Saneamento Básico do Município de Belém, o Plano Municipal de Saneamento Básico (PMSB), e o Plano de Gestão Integrada de Resíduos Sólidos (PGIRS), em Atenção ao Disposto no Art. 9º da Lei Federal nº 11.445/2007, com as Atualizações Trazidas pela Lei nº 14.026/2020, o Novo Marco do Saneamento Básico, e dá Outras Providências. Belém, PA, 30 dez. 2020. Available online: https://arbel.belem.pa.gov.br/wp-content/uploads/2022/05/PMGIRS-INTEGRAL.pdf (accessed on 1 August 2022).
- IBGE. Instituto Brasileiro de Geografia e Estatística. Censo Brasileiro de 2010; IBGE: Rio de Janeiro, Brazil, 2012. Available online: https://censo2010.ibge.gov.br/ (accessed on 1 August 2022).
- NBR10.007. Amostragem de Resíduos Sólidos. ABNT—Associação Brasileira de Normas Técnicas: Rio de Janeiro, Brazil, 2004.
- L. Botti, D. Battini, F. Sgarbossa, C. Mora Door-to-Door Waste Collection : Analysis and Recommendations for Improving Ergonomics in an Italian Case Study. Waste Manag., 109 (2020), pp. 149-160. [CrossRef]
- de Castro, D.R.; Ribeiro, H.D.S.; Guerreiro, L.H.; Bernar, L.P.; Bremer, S.J.; Santo, M.C.; Almeida, H.D.S.; Duvoisin, S.; Borges, L.P.; Machado, N.T. Production of Fuel-Like Fractions by Fractional Distillation of Bio-Oil from Açaí (Euterpe oleracea Mart.) Seeds Pyrolysis. Energies 2021, 14, 3713.
- Trazzi, P. A., Higa, A. R., Dieckow, J., Mangrich, A. S., & Higa, R. C. V. (2018). BIOCARVÃO:REALIDADE E POTENCIAL DE USO NO MEIO FLORESTAL. Ciência Florestal, 28(2), 875–887. [CrossRef]
- Cabrera-Penna, M.; Rodríguez-Páez, J. Calcium oxyhydroxide (CaO/Ca(OH)2) nanoparticles: Synthesis, characterization and evaluation of their capacity to degrade glyphosate-based herbicides (GBH). Adv. Powder Technol. 2020, 32, 237–25. [CrossRef]
- Hassani, E.; Feyzbar-Khalkhali-Nejad, F.; Rashti, A.; Oh, T.-S. Carbonation, Regeneration, and Cycle Stability of the Mechanically Activated Ca(OH)2 Sorbents for CO2 Capture: An In Situ X ray Diffraction Study. Ind. Eng. Chem. Res. 2020, 59, 11402–11411.
- Gopu, C.; Gao, L.; Volpe, M.; Fiori, L.; Goldfarb, J.L. Valorizing municipal solid waste: Waste to energy and activated carbons for water treatment via pyrolysis. J. Anal. Appl. Pyrolysis 2018, 133, 48–58.DOI. [CrossRef]
- Lefebvre, David; Williams, Adrian; Meersmans, Jeroen; Kirk, Guy J. D.; Sohi, Saran; Goglio, Pietro; Smith, Pete (2020): Modelling the potential for soil carbon sequestration using biochar from sugarcane residues in Brazil. In Sci Rep 10 (1), p. 19479. [CrossRef]
- TRANG, P.T.T.; DONG, H.Q.; TOAN, D.Q.; HANH, N.T.X.; THU, N.T. (2017) The Effects of Socio-economic Factors on Household Solid Waste Generation and Composition: A Case Study in Thu Dau Mot, Vietnam. Energy Procedia, v. 107, p. 253-258. [CrossRef]
- Da Silva, G.P.C.; Assunção, F.P.d.C.; Pereira, D.O.; Ferreira, J.F.H.; Mathews, J.C.; Sandim, D.P.R.; Borges, H.R.; do Nascimento, M.S.C.; Mendonça, N.M.; de Sousa Brandão, I.W.; et al. Analysis of the Gravimetric Composition of Urban Solid Waste from the Municipality of Belém/PA. Sustainability 2024, 16, 5438. [CrossRef]
- BUAH, W.K.; CUNLIFFE, A.M.; WILLIAMS, P.T. Characterization of products from the pyrolysis of municipal solid waste. Process safety and Environmental Protection, v. 85 (B5), p. 450-457, 2007; [CrossRef]
- Zhou, H.; Long, Y.; Meng, A.; Li, Q.; Zhang, Y. Classification of municipal solid waste components for thermal conversion in waste-to-energy research. Fuel 2015, 145, 151–157. [CrossRef]
- Mati, A.; Buffi, M.; Dell’Orco, S.; Lombardi, G.; Ramiro, P.M.R.; Kersten, S.R.A.; Chiaramonti, D. Fractional Condensation of Fast Pyrolysis Bio-Oil to Improve Biocrude Quality towards Alternative Fuels Production. Appl. Sci. 2022, 12, 4822; [CrossRef]
- Ghanavati, H.; Nahvi, I.; Karimi, K. Organic fraction of municipal solid waste as a suitable feedstock for the production of lipid by oleaginous yeast Cryptococcus aerius. Waste Manag. 2015, 38, 141–148. [CrossRef]
| Socio-economic Classification | |
|---|---|
| Classes | Family Income (Minimum/Basic Salary) |
| A | over 20 salaries |
| B | from 10 to 20 salaries |
| C | from 10 to 20 salaries |
| D | from 10 to 20 salaries |
| E | up to 02 salaries |
| Region | Sectors | Neighborhoods |
| 1 | 1, 2 e 3 | Aurá, Águas Lindas, Curió-Utinga, Guanabara, Castanheira, Souza e Marco |
| 2 | 4,5 e 6 | Canudos, Terra Firme, Guamá, Condor, Jurunas e Fátima |
| 3 | 7,8 e 9 | Umarizal, São Brás, Cremação, Batista Campos, Nazaré, Reduto, Campina e Cidade Velha |
| Experiments | Material |
Catalyst mass Ca(OH)2 (%) | Temperature (°C) | Retention Time (min.) |
| Region 1 (1) | F.O + Paper | 0 | 450 | 1h 20 |
| Region 1 (2) | F. O+ Paper | 0 | 450 | 1h 20 |
| Region 1 (3) | F.O.+ Paper | 0 | 450 | 1h 20 |
| Region 2 (4) | F.O.+ Paper | 10 | 400 | 1h 20 |
| Region 2 (5) | F.O.+ Paper | 10 | 400 | 1h 20 |
| Region 2 (6) | F.O.+ Paper | 10 | 400 | 1h 20 |
| Region 3 (7) | F.O.+ Paper | 10 | 475 | 1h20 |
| Region 3 (8) | F.O.+ Paper | 10 | 475 | 1h20 |
| Region 3 (9) | F.O.+ Paper | 10 | 475 | 1h20 |
| Pirolysis | ||||||
| Chemical Elements |
(R1) 450°C |
(R2) 450°C |
(R3) 450°C |
|||
| Mass [wt.%] |
SD | Mass [wt.%] |
SD | Mass [wt.%] |
SD | |
| C | 70.0 | 0.2 | 60.4 | 0.1 | 62.0 | 0.2 |
| O | 13.6 | 0.1 | 26.3 | 0.1 | 22.2 | 0.2 |
| K | 6.7 | 0.0 | 1.6 | 0.0 | 2.5 | 0.0 |
| Cl | 5.5 | 0.0 | 1.6 | 0.0 | 3.0 | 0.0 |
| Ca | 1.5 | 0.0 | 8.4 | 0.0 | 7.2 | 0.0 |
| Na | 1.5 | 0.0 | 1.5 | 0.0 | 1.6 | 0.0 |
| S | 0.3 | 0.0 | - | - | - | 0.0 |
| Mg | 0.3 | 0.0 | 0.3 | 0.0 | 0.3 | 0.0 |
| Al | 0.3 | 0.0 | 0.1 | 0.0 | 0.1 | 0.0 |
| P | 0.2 | 0.0 | 0.2 | 0.0 | 0.4 | 0.0 |
| Fe | 0.1 | 0.0 | 0.1 | 0.0 | 0.1 | 0.0 |
| Si | 0.1 | 0.0 | - | - | 0.5 | 0.0 |
| Cu | - | - | - | - | 0.1 | 0.0 |
| Pirolysis | ||||||
| Chemical Elements |
(R1) 400°C |
(R2) 400°C |
(R3) 400°C |
|||
| Mass [wt.%] |
SD | Mass [wt.%] |
SD | Mass [wt.%] |
SD | |
| C | 62.5 | 0.1 | 60.5 | 0.1 | 56.7 | 0.1 |
| O | 18.9 | 0.1 | 24.5 | 0.1 | 28.8 | 0.1 |
| K | 2.9 | 0.0 | 2.4 | 0.0 | 1.1 | 0.0 |
| Cl | 4.1 | 0.0 | 3.4 | 0.0 | 1.1 | 0.0 |
| Ca | 6.8 | 0.0 | 6.2 | 0.0 | 9.5 | 0.0 |
| Na | 2.3 | 0.0 | 2.3 | 0.0 | 1.4 | 0.0 |
| S | 0.2 | 0.0 | - | 0.0 | - | 0.0 |
| Mg | 0.4 | 0.0 | 0.2 | 0.0 | 0.2 | 0.0 |
| Al | 0.2 | 0.0 | - | 0.0 | 0.6 | 0.0 |
| P | 0.6 | 0.0 | - | 0.0 | 0.3 | 0.0 |
| Fe | 0.7 | 0.0 | 0.4 | 0.0 | - | 0.0 |
| Si | 0.4 | 0.0 | - | 0.0 | 0.2 | 0.0 |
| Pirolysis | ||||||
| Chemical Elements |
(R1) 475°C |
(R2) 475°C |
(R3) 475°C |
|||
| Mass [wt.%] |
SD | Mass [wt.%] |
SD | Mass [wt.%] |
SD | |
| C | 77.6 | 0.1 | 70.4 | 0.1 | 45.0 | 0.1 |
| O | 18.2 | 0.1 | 19.6 | 0.1 | 32.4 | 0.1 |
| K | 1.5 | 0.0 | 1.7 | 0.0 | 2.6 | 0.0 |
| Cl | 0.5 | 0.0 | 1.7 | 0.0 | 2.6 | 0.0 |
| Ca | 0.8 | 0.0 | 1.3 | 0.0 | 14.2 | 0.0 |
| Na | 0.9 | 0.0 | 1.2 | 0.0 | 1.5 | 0.0 |
| S | - | - | - | - | 0.1 | 0.0 |
| Mg | 0.4 | 0.0 | 0.1 | 0.0 | 0.4 | 0.0 |
| Al | - | - | - | - | 0.1 | 0.0 |
| P | - | - | 0.2 | 0.0 | 0.5 | 0.0 |
| Fe | 0.1 | 0.0 | - | - | 0.4 | 0.0 |
| Si | - | - | 0.1 | 0.0 | 0.2 | 0.0 |
| Cu | - | - | 0.1 | 0.0 | 0.1 | 0.0 |
| Process parameters | Region 1 | Region 2 | Region 3 |
| 450 [°C] | 450 [°C] | 450 [°C] | |
| 0.0 (wt.) |
0.0 (wt.) |
0.0 (wt.) |
|
| Mass of urban solid wastes [g] | 40.1 | 40.11 | 40.57 |
| Cracking time [min] | 20 | 20 | 20 |
| Initial cracking temperature [°C] | 334 | 363 | 364 |
| Mass of solids (coke) [g] | 16.11 | 16.61 | 19.28 |
| Mass of bio-oil [g] | 9.45 | 9.19 | 6.54 |
| Mass of H2O [g] | 6.54 | 7.42 | 6.68 |
| Mass of gas [g] | 8.00 | 6.89 | 8.07 |
| Yield of bio-oil [%] | 23.57 | 22.91 | 16.12 |
| Yield of H2O [%] | 16.31 | 18.49 | 16.46 |
| Yield of solids [%] | 40.17 | 41.41 | 45.52 |
| Yield of gas [%] | 19.95 | 17.21 | 19.89 |
| Process parameters | Region 1 | Region 2 | Region 3 |
| 400 [°C] | 400 [°C] | 400 [°C] | |
| 10.0 (wt.) |
10.0 (wt.) |
10.0 (wt.) |
|
| Mass of urban solid wastes [g] | 30.0 | 30.0 | 30.03 |
| Mass of Ca(OH)2 [g] | 3.0 | 3.0 | 3.0 |
| Cracking time [min] | 20 | 20 | 20 |
| Initial cracking temperature [°C] | 351 | 327 | 328 |
| Mass of solids (coke) [g] | 15.2 | 15.13 | 14.12 |
| Mass of bio-oil [g] | 7.23 | 4.49 | 3.88 |
| Mass of H2O [g] | 2.90 | 2.33 | 6.39 |
| Mass of gas [g] | 4.67 | 8.05 | 5.65 |
| Yield of bio-oil [%] | 24.10 | 14.97 | 12.92 |
| Yield of H2O [%] | 9.66 | 7.77 | 21.27 |
| Yield of solids [%] | 50.67 | 50.43 | 47.01 |
| Yield of gas [%] | 15.57 | 26.83 | 18.81 |
| Process parameters | Region 1 | Region 2 | Region 3 |
| 475 [°C] | 475 [°C] | 475 [°C] | |
| 10.0 (wt.) |
10.0 (wt.) |
10.0 (wt.) |
|
| Mass of urban solid wastes [g] | 30.0 | 30.08 | 30.06 |
| Mass of Ca(OH)2 [g] | 3.0 | 3.02 | 3.00 |
| Cracking time [min] | 20 | 20 | 20 |
| Initial cracking temperature [°C] | 364 | 381 | 340 |
| Mass of solids (coke) [g] | 13.87 | 10.66 | 11.18 |
| Mass of bio-oil [g] | 8.48 | 5.68 | 6.45 |
| Mass of H2O [g] | 1.53 | 4.28 | 4.95 |
| Mass of gas [g] | 6.10 | 9.47 | 7.48 |
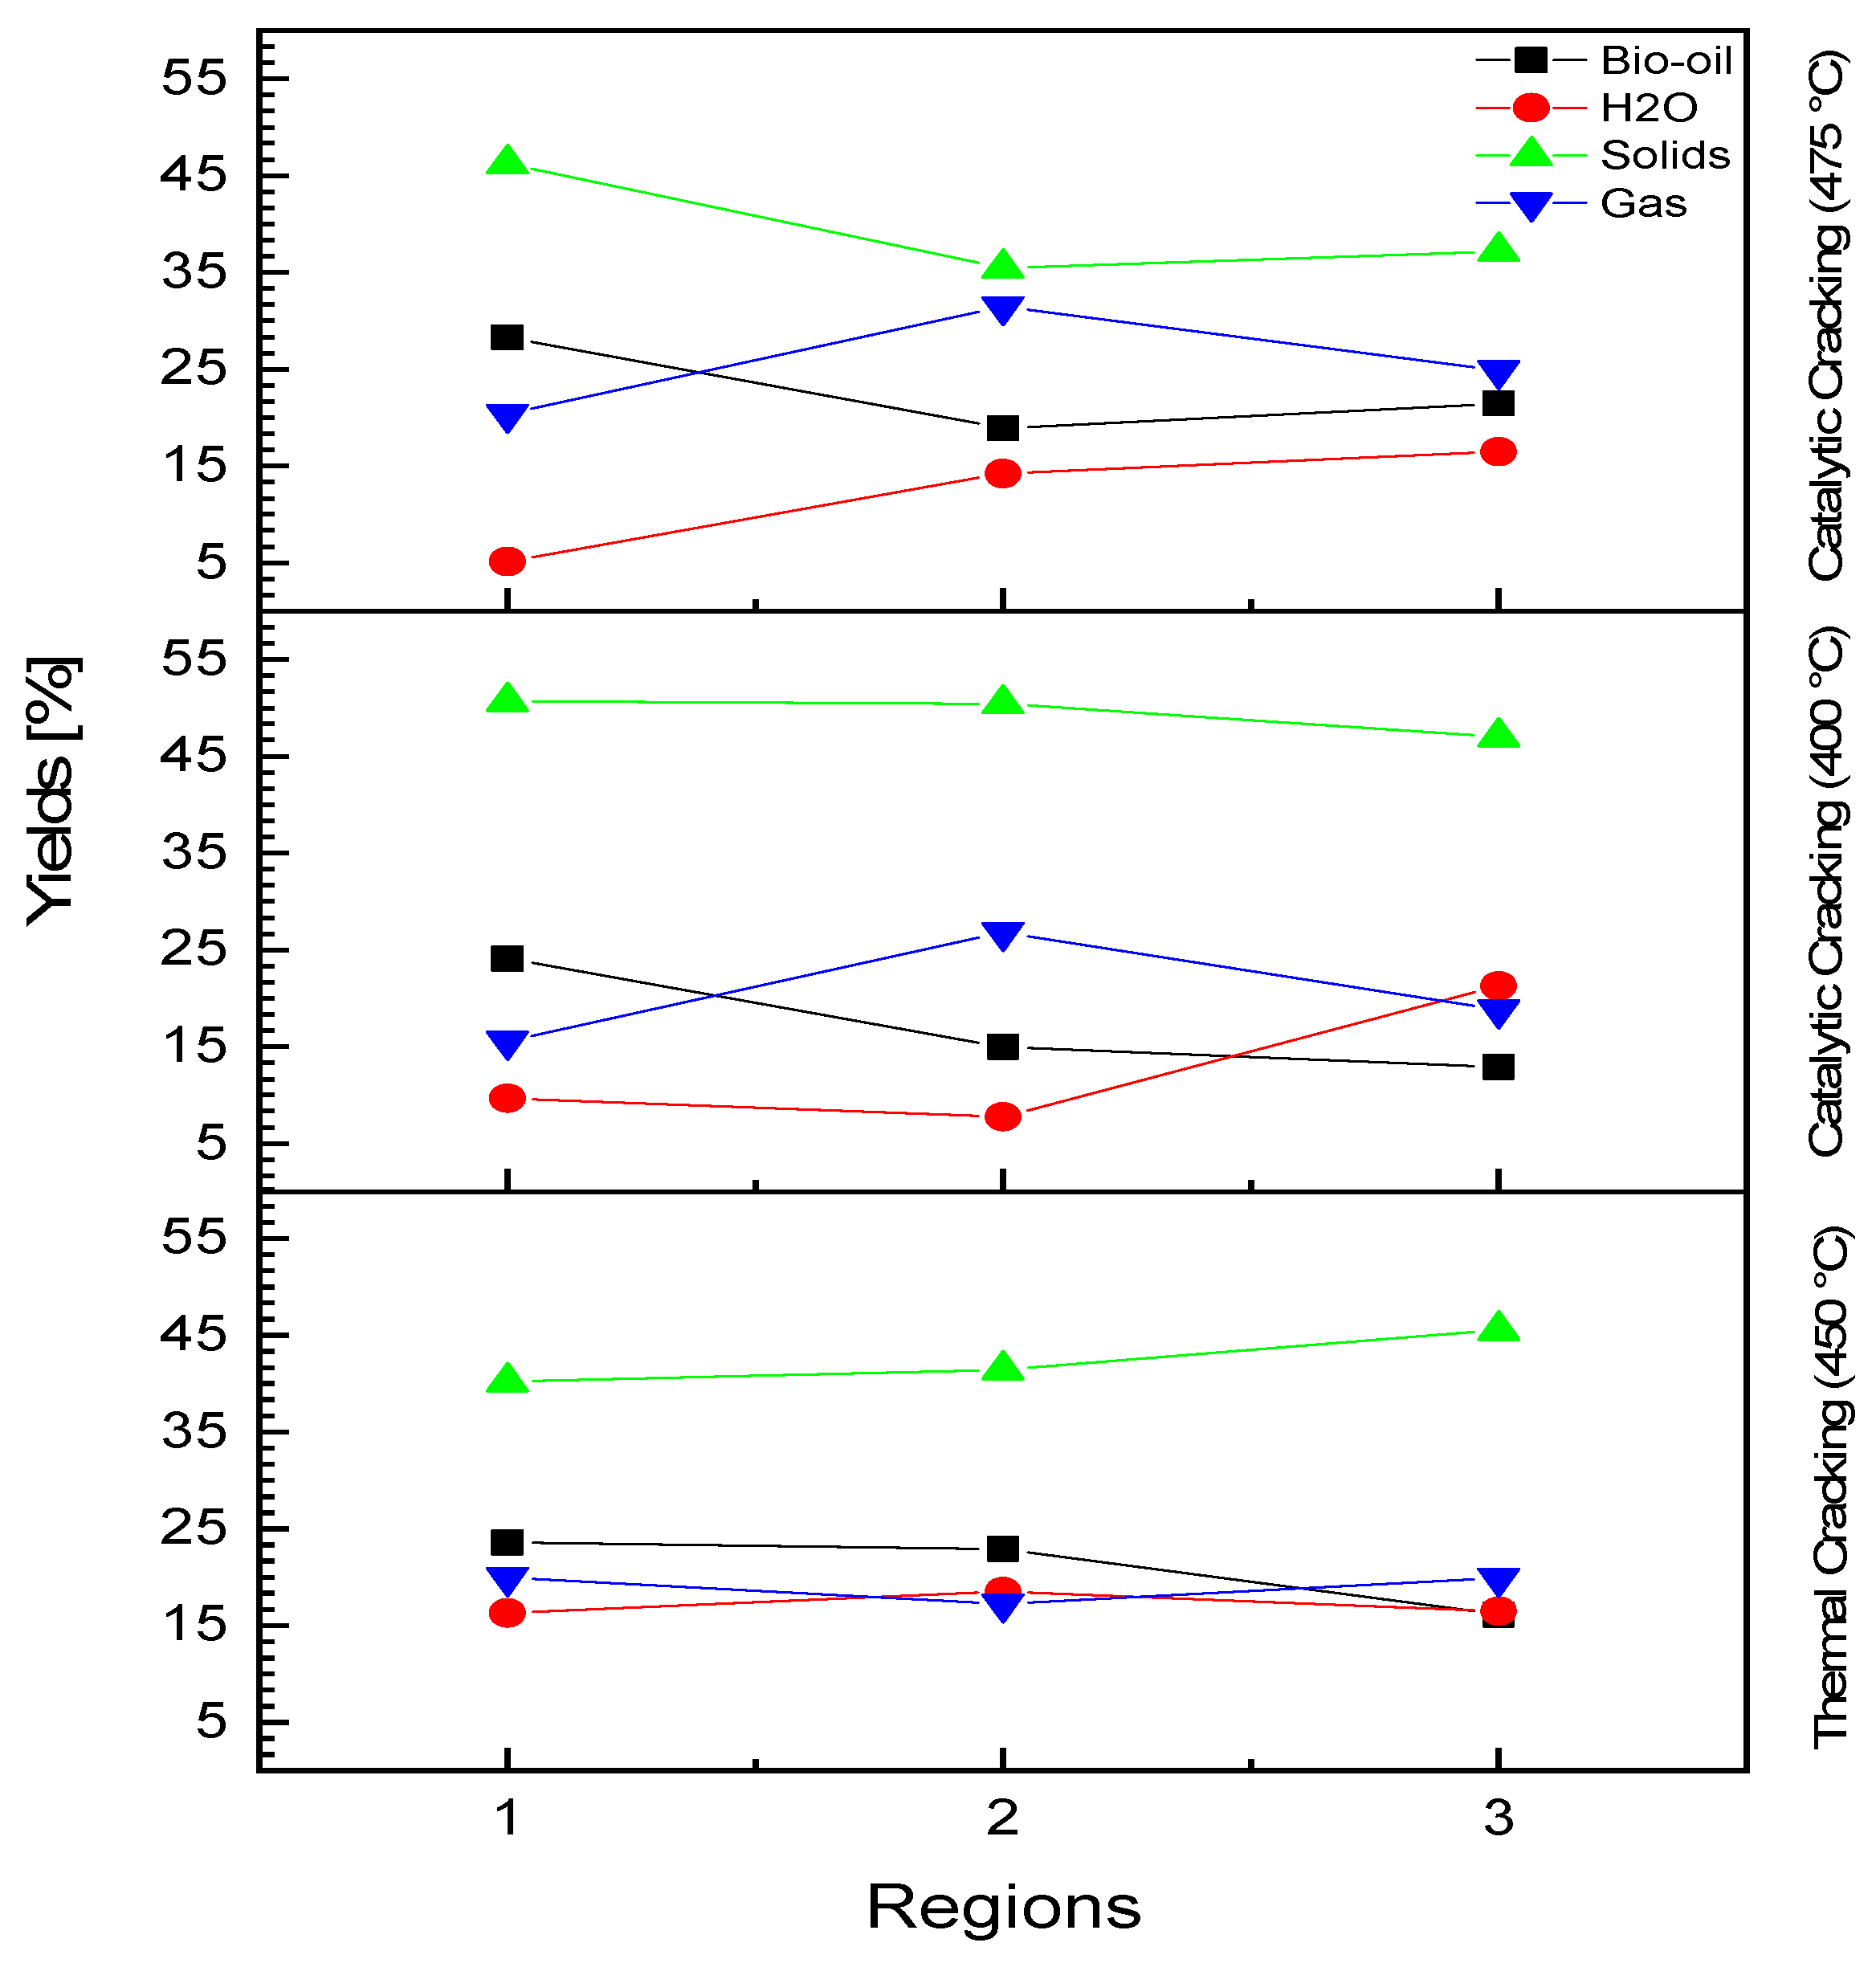
| Yield of bio-oil [%] | 28.28 | 18.88 | 21.45 |
| Yield of H2O [%] | 5.11 | 14.22 | 16.46 |
| Yield of solids [%] | 46.24 | 35.43 | 37.19 |
| Yield of gas [%] | 20.35 | 31.48 | 24.88 |
| Physicochemical Property | Temperature | |||||||||
|---|---|---|---|---|---|---|---|---|---|---|
| R1 | R2 | R3 | R1 | R2 | R3 | R1 | R2 | R3 | ||
| Acid Index | 450 °C | 450 °C | 450 °C | 400°C Ca(OH)2 |
400°C Ca(OH)2 |
400°C Ca(OH)2 | 475°C Ca(OH)2 |
475°C Ca(OH)2 |
475°C Ca(OH)2 |
|
| I.ABio-Oil [mg KOH/g] |
116.8 | 115.1 | 115.3 | 34.45 | 34.41 | 40.0 | 36.36 | 36.31 | 37.20 | |
| I.AAqueous Phase [mg KOH/g] | 69.01 | 65.55 | 76.23 | 42.3 | 42.1 | 42.0 | 43.4 | 4.2 | 40.0 | |
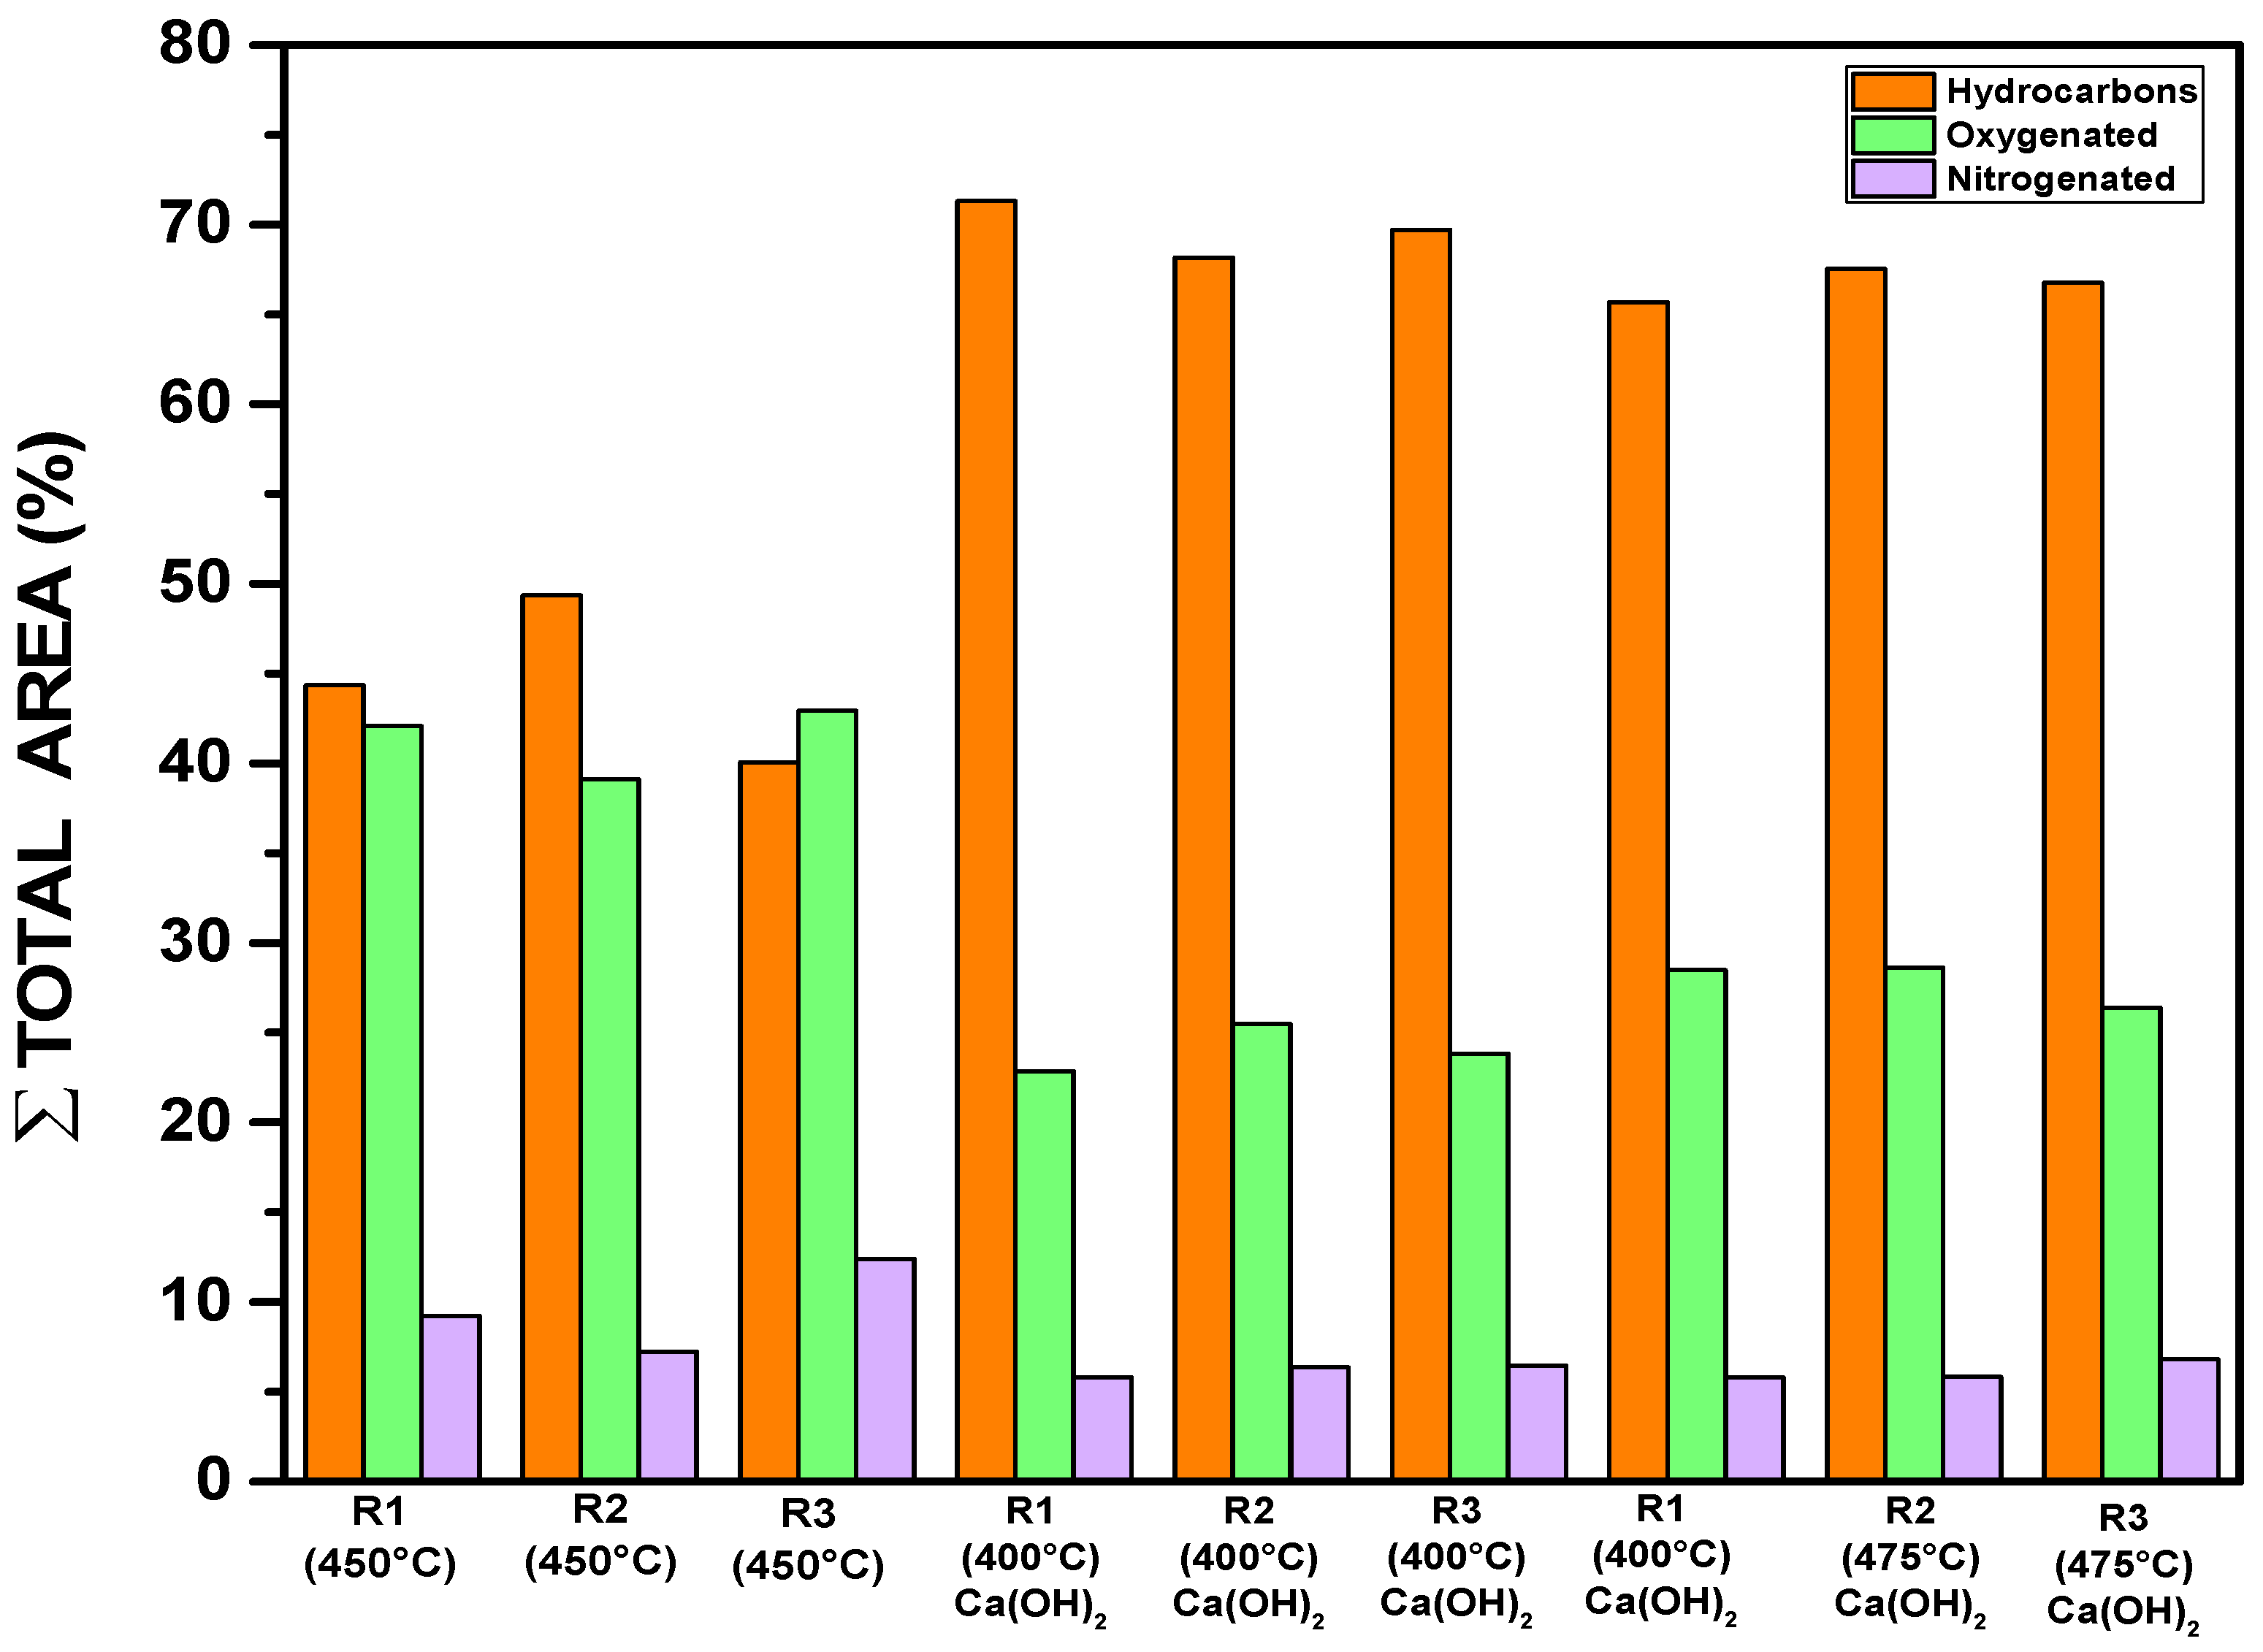
| Temperature [°C] | Concentration [%area.] | |||
|---|---|---|---|---|
| Hydrocarbons | Oxygenated | Nitrogenated | Chlorinated | |
| 450 (R1) | 44.34 | 42.09 | 9.23 | 4.34 |
| 450 (R2) | 49.34 | 39.09 | 7.23 | 4.34 |
| 450 (R3) | 40.07 | 42.91 | 12.40 | 4.34 |
| 400 (R1) | 71.32 | 22.85 | 5.82 | - |
| 400 (R2) | 68.16 | 25.48 | 6.36 | - |
| 400 (R3) | 69.70 | 23.83 | 6.47 | - |
| 475 (R1) | 65.69 | 28.48 | 5.82 | - |
| 475 (R2) | 67.53 | 28.63 | 5.84 | - |
| 475 (R3) | 66.77 | 26.40 | 6.82 | - |
Disclaimer/Publisher’s Note: The statements, opinions and data contained in all publications are solely those of the individual author(s) and contributor(s) and not of MDPI and/or the editor(s). MDPI and/or the editor(s) disclaim responsibility for any injury to people or property resulting from any ideas, methods, instructions or products referred to in the content. |
© 2024 by the authors. Licensee MDPI, Basel, Switzerland. This article is an open access article distributed under the terms and conditions of the Creative Commons Attribution (CC BY) license (http://creativecommons.org/licenses/by/4.0/).


