1. Introduction
In this era of rapid urbanization, wind flow through urban areas is a significant issue for pedestrian safety and comfort. Tall buildings in urban areas generally influence wind patterns within cities.
Several studies have been conducted on the wind and thermal comfort of pedestrians in urban areas. Wind conditions and pedestrian safety have been extensively investigated as critical factors in urban planning and design (Panagiotou et al., 2013). In addition, the wind comfort and safety of the occupants have been explored to some extent (Blocken et al., 2012a). On the other hand, the thermal comfort of the pedestrians was also extensively investigated considering the impacts of the wind flow pattern on the pedestrians (Stathopoulos, 2006; Tamura et al., 2008). Though the wind comfort and safety were seen to be affected by thermal factors, the mechanical impacts of wind on individuals also significantly occurred (Lawson et al., 1975; Willemsen and Wisse, 2007) .
Generally, close to tall buildings, pedestrians often encounter high wind speeds that can feel uncomfortable or hazardous to individuals (Blocken and Carmeliet, 2004). Bluff bodies, such as buildings and other large structures commonly found in urban environments, significantly alter the local wind conditions owing to the wind shear effect they create (Hågbo and Giljarhus, 2022a). Thus, building design should consider not only the structure itself and ensure a pleasant indoor environment but also its impact on outdoor surroundings (Blocken and Carmeliet, 2004). Concerns are growing that climate change may result in more frequent extreme weather events, which could lead to increased occurrences of uncomfortable and dangerous wind conditions in urban areas (National Academies of Sciences et al., 2016). Pedestrian wind comfort and safety were forecasted using the experimental approach. (Liu et al., 2021; Šarkić Glumac et al., 2018).
Generally, experiments on the wind flow pattern and pedestrian comfort at multiple meteorological stations are accompanied by the arrangement of a large apparatus and difficulty in obtaining measurements of highly fluctuating velocity and temperature; thus, information obtained from the experiment is limited. Therefore, the numerical approach of this type of research is a suitable tool for detailed analysis of various conditions. However, in the past few decades, CFD has been seen as an effective tool for analyzing airflow patterns around buildings and in urban settings with complex geometries, assessing factors that influence pedestrian comfort as well as discomfort, such as wind speed, turbulence intensity, and wind pressure(van Druenen et al., 2019; Yoshie et al., 2007). Therefore, CFD is being used to address environmental concerns in urban areas, such as air pollution and design (Yoshie et al., 2007)Therefore, CFD has been used to address environmental concerns in urban areas, such as air pollution and design [
12]. The development of software to generate meshes and tools for computational simulations has increased the effectiveness of numerical approaches (Chen, 2006; Jin et al., 2013; Miroshnichenko and Sheremet, 2018; Ramponi et al., 2015a; Sheremet and Miroshnichenko, 2015).
In the above discussions, the wind flow pattern, structures such as the effect of buildings on wind flow, the effect of wind velocity, TKE, thermal comfort, and mechanical effects on pedestrian comfort and safety were investigated both numerically and experimentally. However, wind flow patterns and their effects on pedestrians in terms of thermal comfort and safety have rarely been explored in urban areas, such as the main campus of DUET, Gazipur. Therefore, an attempt was made to investigate wind flow patterns using computational fluid dynamics (CFD). This study also showed the effects of air velocity and turbulence kinetic energy on pedestrians to develop a suitable wind model for the design of urban areas.
2. Numerical Computation
To accurately analyze the wind flow patterns around the DUET main campus, this study employed computational fluid dynamics (CFD) simulations that accounted for various wind directions.
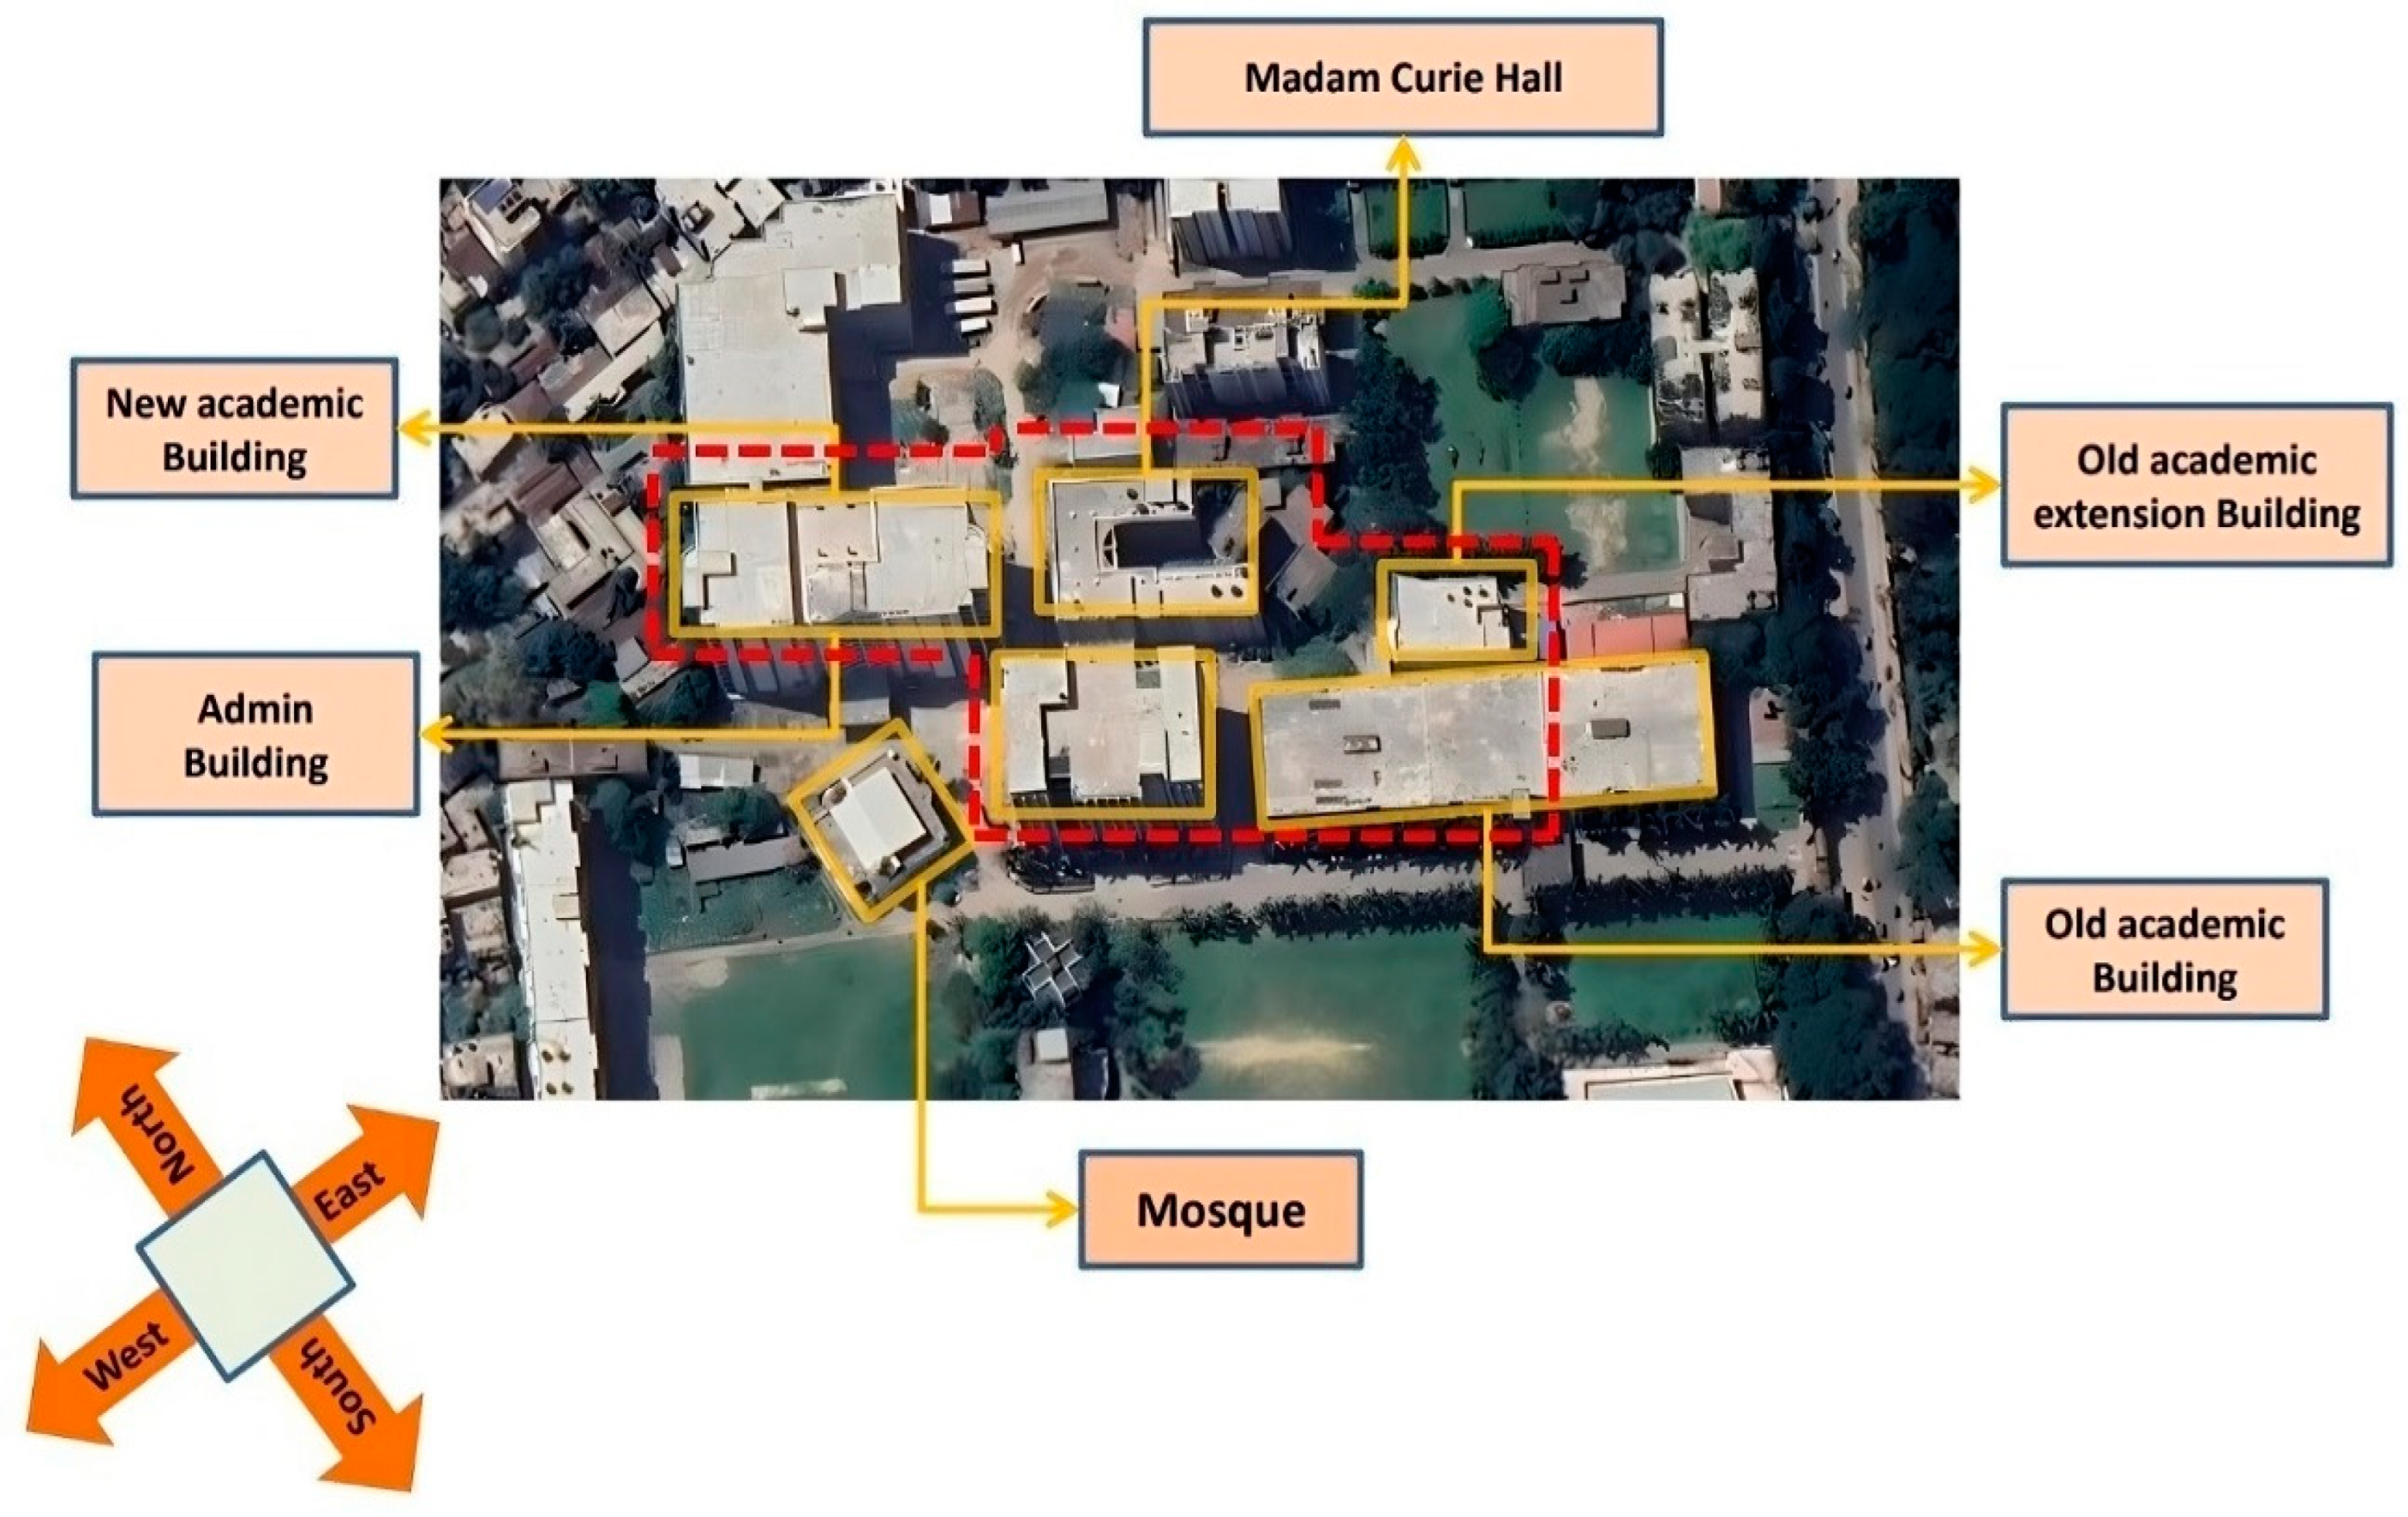
Figure 1 shows an actual view of the study area. A realizable k–ε turbulence model with a scalable wall function was used to minimize errors. Five buildings were considered and drawn using SolidWorks, and the building dimensions were considered according to the architectural design. However, complex geometries were ignored in order to save computational resources. Various wind scenarios were analyzed to explore the velocity distributions and turbulence kinetic energy.
2.1. Model Preparation
The 3D models were created using SolidWorks software. This software accurately designed the building geometry to reflect the actual dimensions obtained from the university’s engineering department. The constructed model was then imported into the ANSYS Fluent software. This software can generate more precise predictions regarding airflow, which is the focus of this study.
To reduce computational resource requirements, complex geometric details were ignored in the building models.
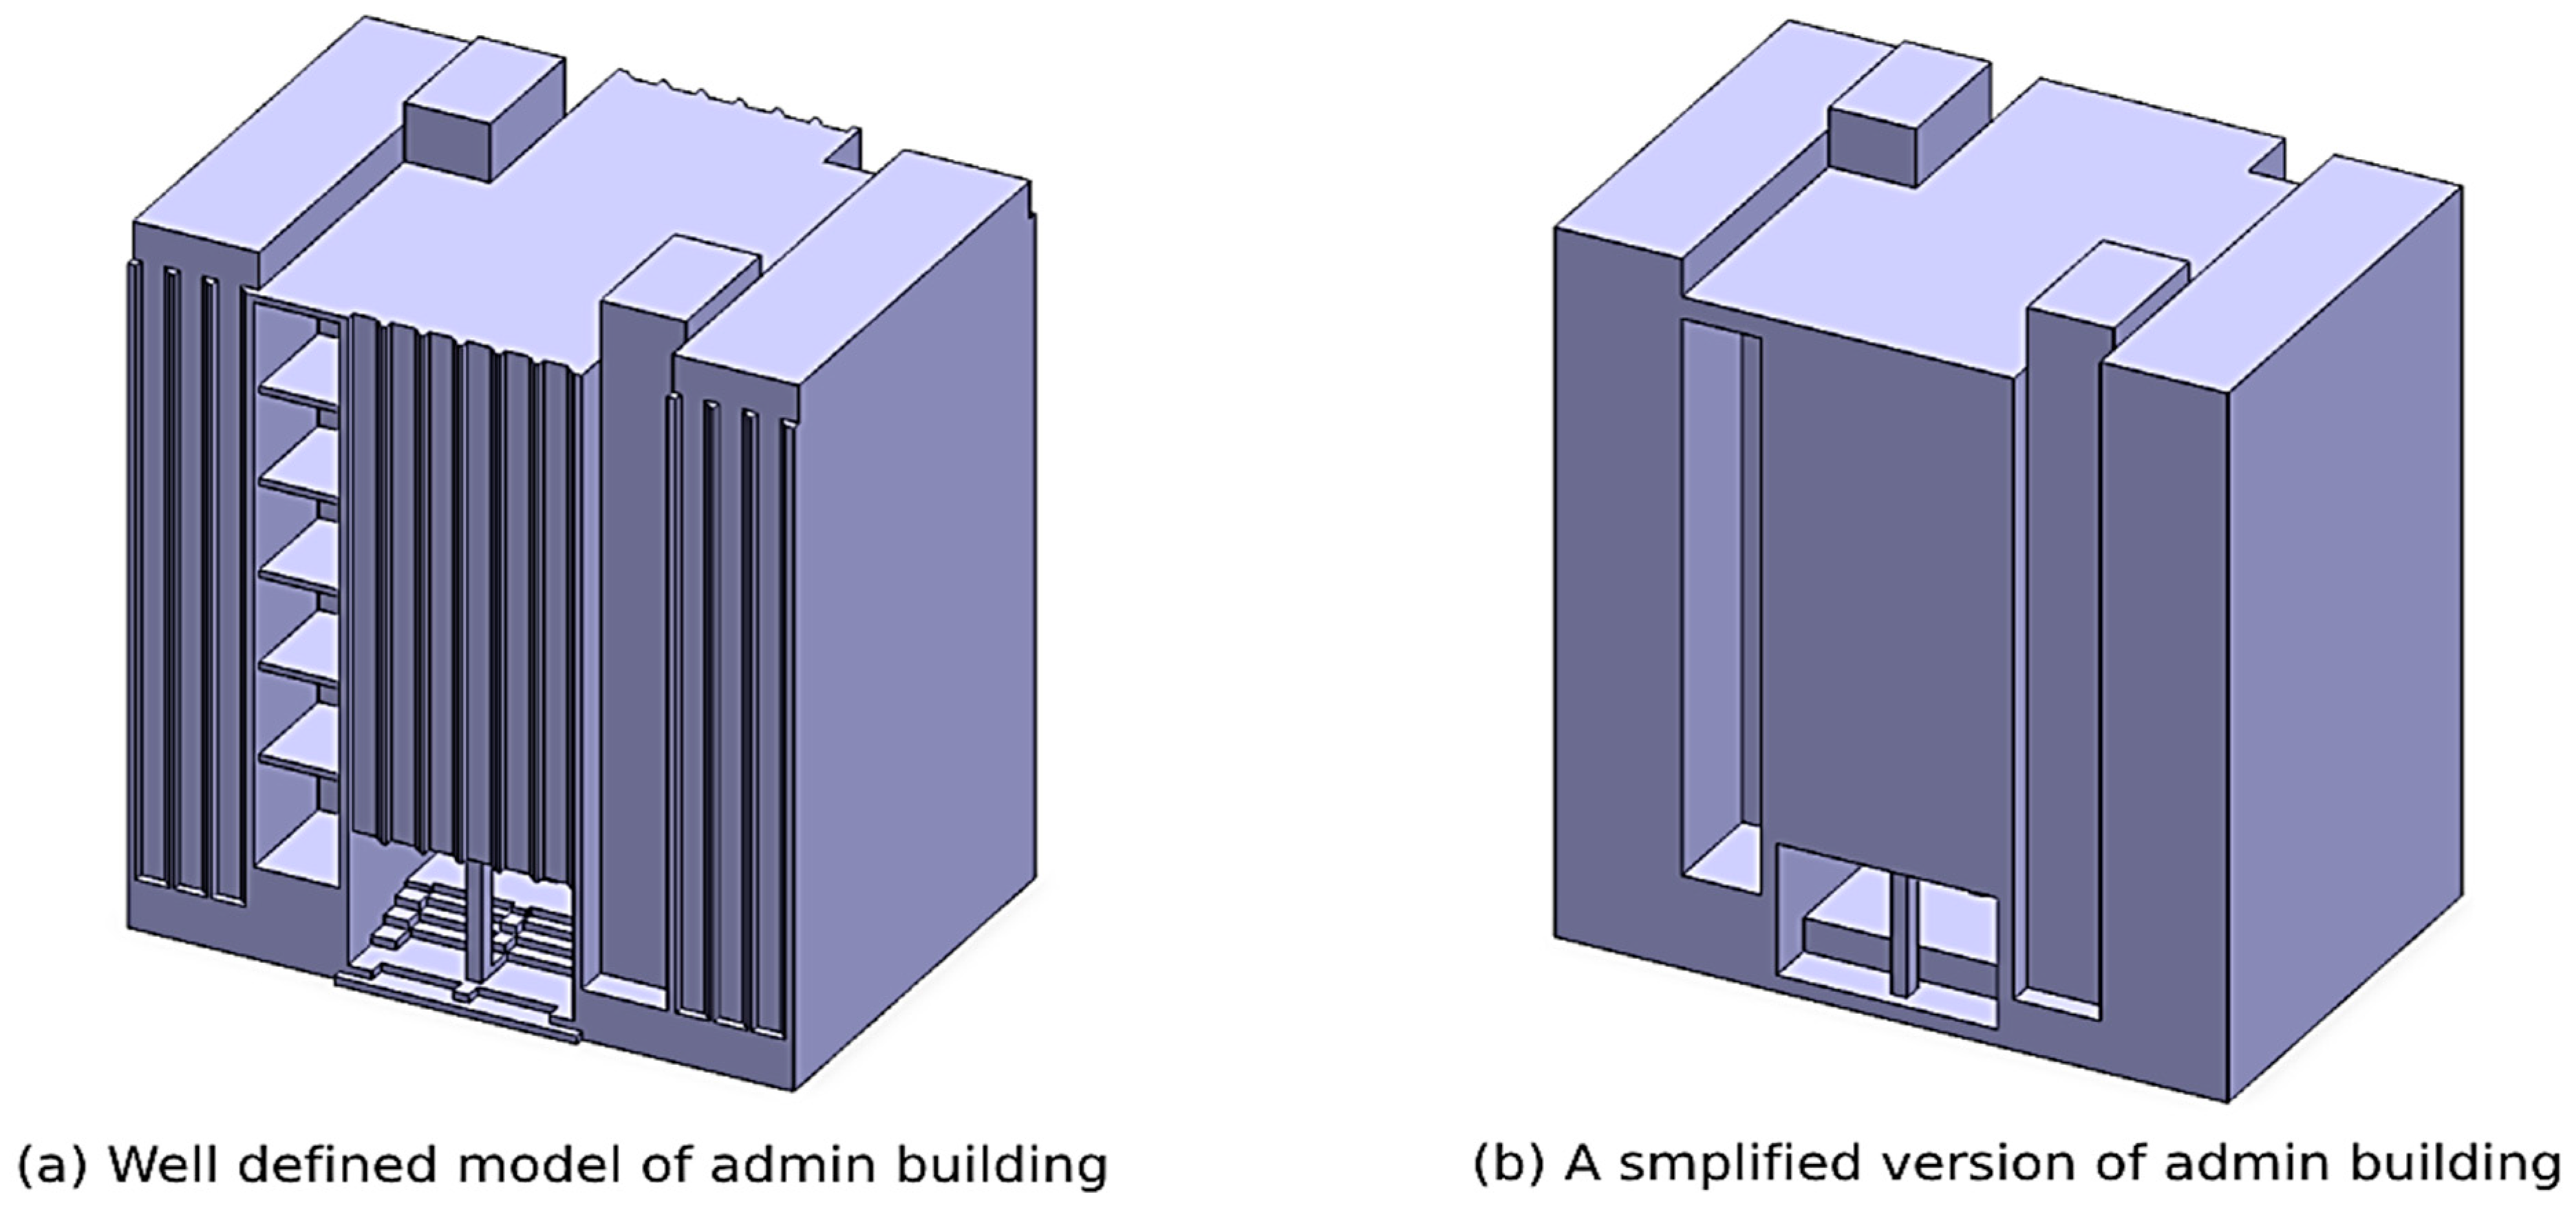
Figure 2 illustrates the well-defined, intricate model of the admin building along with its simplified counterpart, which was utilized in the simulations. The administrative building serves as an example, and the same simplification process is applied to all building models in this study. This geometric simplification leads to a significant reduction in the number of cells required for mesh generation, thereby enhancing computational efficiency.
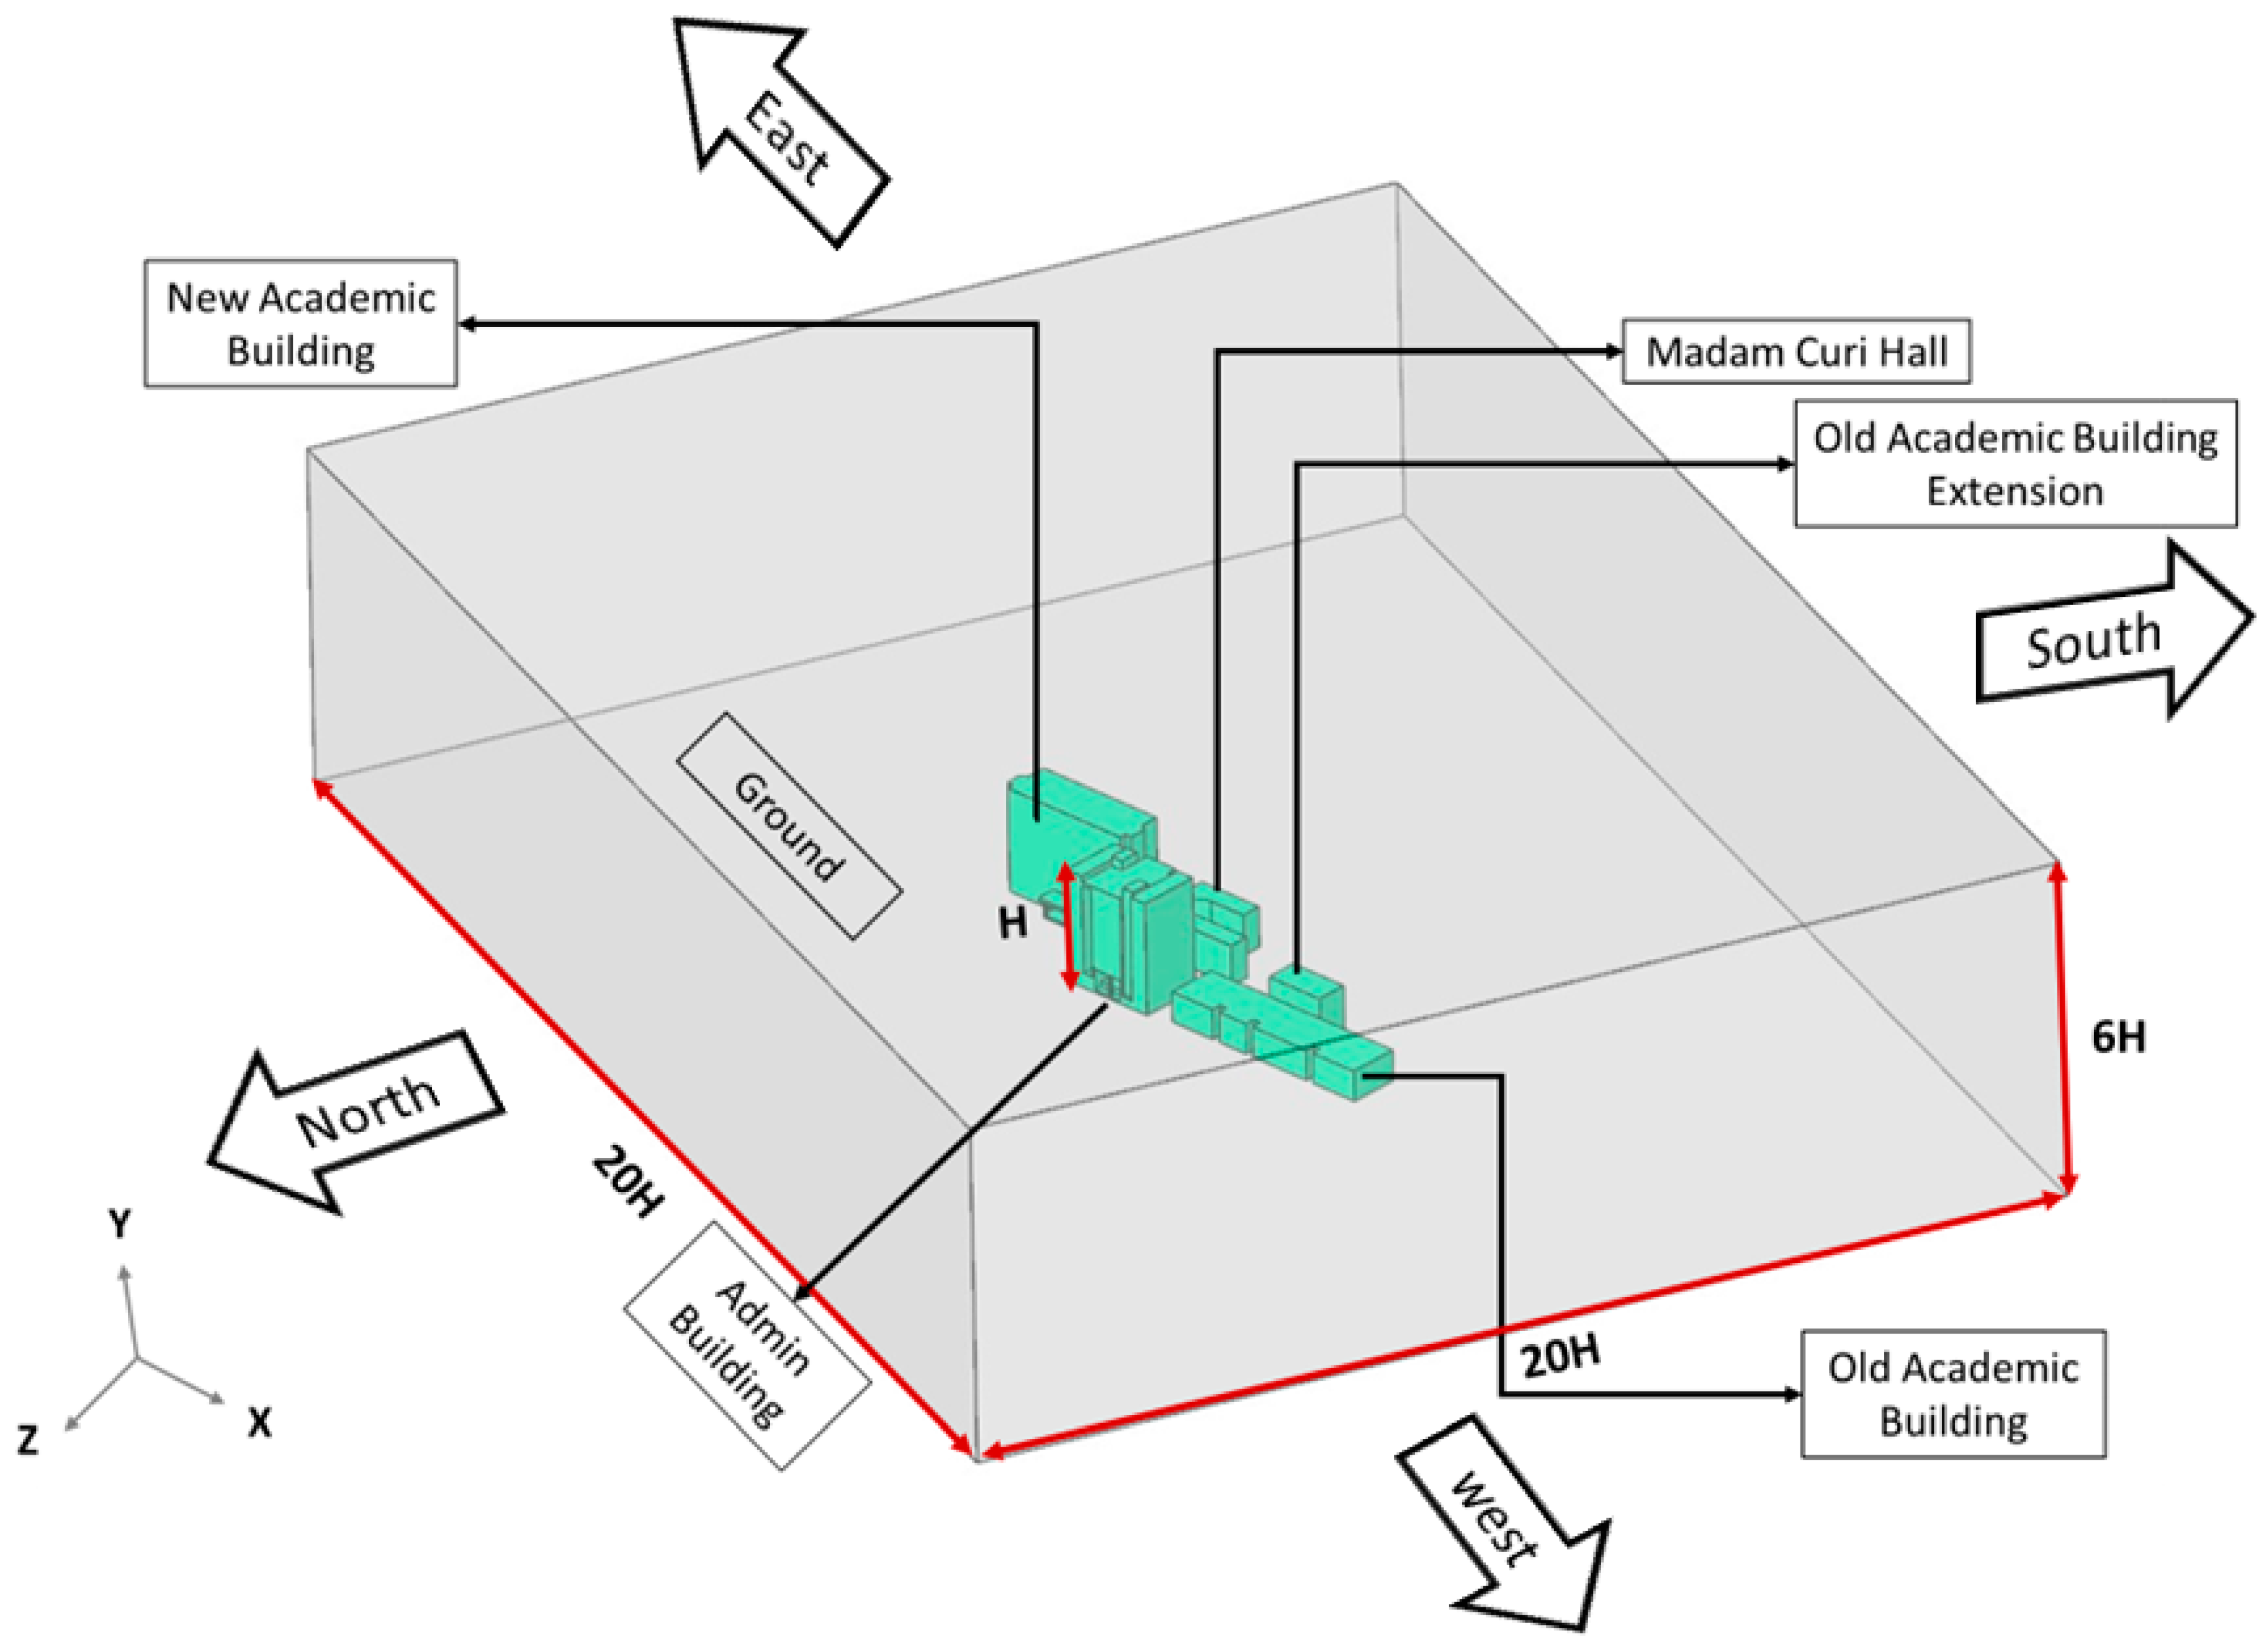
The computational domain used in this study was adapted to the specific setup, with all distances measured relative to the height of the admin building, which was H = 52.5 meters. The dimensions of the domain were assumed to be 20H × 20H × 6H along the x, z, and y axes.
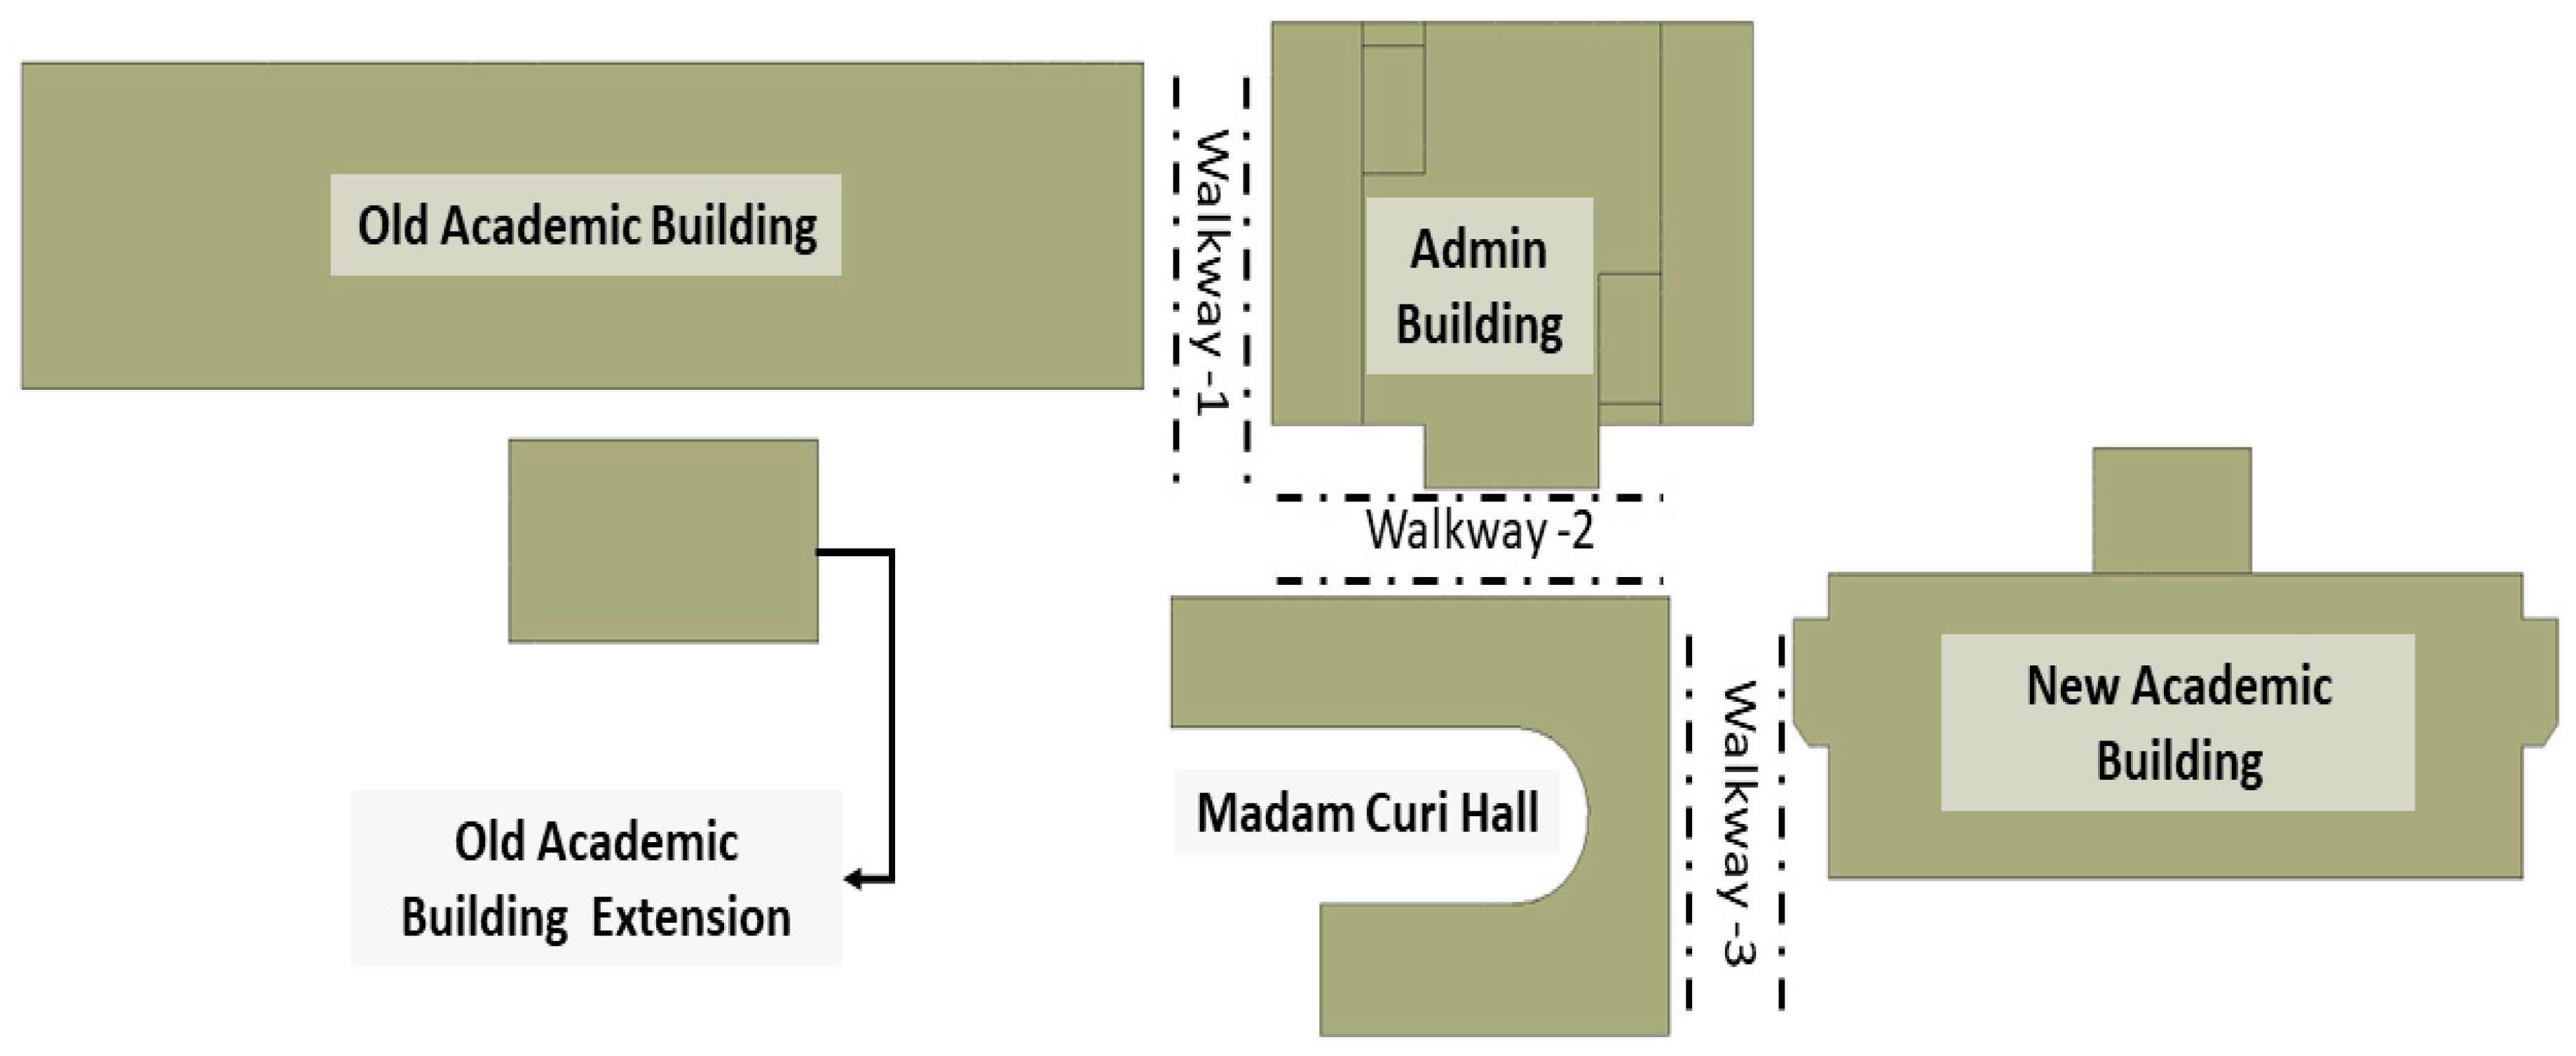
Figure 3 shows the computational domain for the campus simulations Notably, extending the boundaries of this domain did not affect the current numerical results, as confirmed in previous studies (Blocken et al., 2012a, 2016; Hågbo and Giljarhus, 2022b). Figure 4 shows a simplified top view of the study area, showing the walkways.
2.2. Meshing
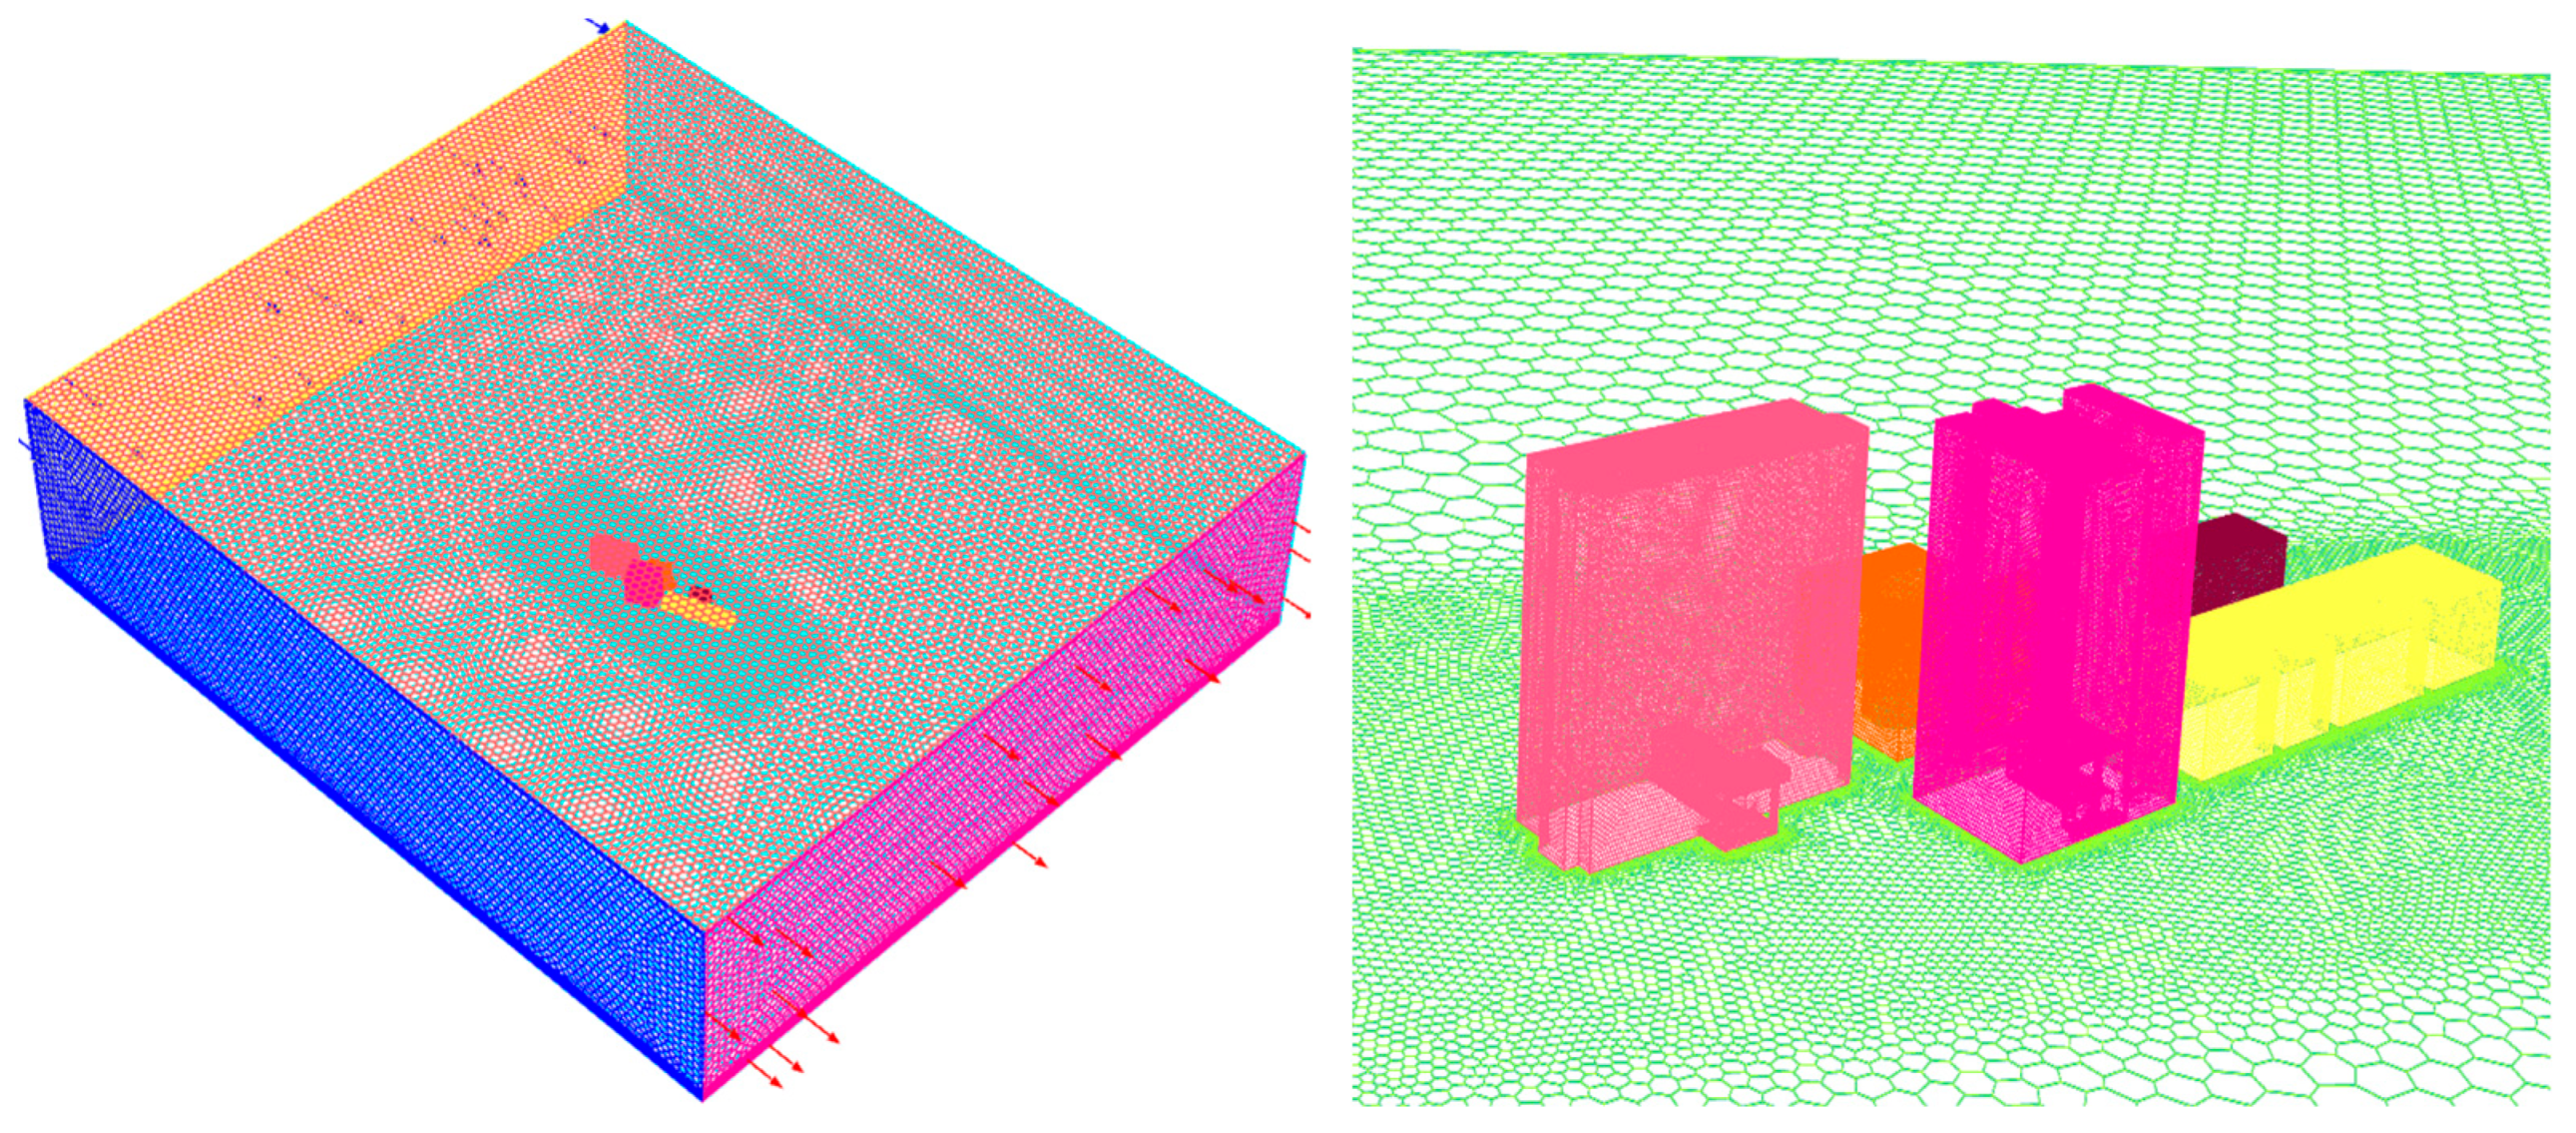
A structured polyhexcore mesh consisting of 3,106,445 cells was employed for the computational domain, following best practices in mesh generation for urban flow simulations (Franke, 2007).
Figure 5 shows the computational grid (3,106,445 cells).To accurately resolve the near-wall flow characteristics, 10 boundary layers were applied to the walls of the buildings and the ground surface.
In the vicinity of the buildings, a fine mesh resolution was adopted to accurately capture the intricate flow patterns and vortices generated by the complex geometries. The mesh gradually coarsened away from buildings. This gradual coarsening ensured a smooth transition between regions of varying cell densities, minimizing numerical diffusion and abrupt changes in cell aspect ratios, while maintaining computational efficiency in areas with lower flow gradients (Celik et al., 2008).
The final mesh exhibited a minimum orthogonal quality of 3.58620e-01, indicating a high-quality grid that is suitable for reliable and accurate simulations of complex flow patterns around university campus buildings.
2.3. Numerical Method and Boundary Conditions
The simulation setup is shown in
Table 1. A pressure-based solver was employed in the simulations. The turbulence model employed was a realizable k–ε model with scalable wall functions.
Table 2 provides an overview of the boundary conditions used in the simulations. The inlet profile was defined as velocity inlets, with inlet velocities selected to represent light breeze (3 m/s) and gentle breeze (5 m/s) conditions. The outlet boundary condition is specified as the pressure outlet. No-slip conditions implemented with wall functions were applied to both ground and building surfaces.
2.4. Mathematical Formulation
2.4.1. Assumptions
The RANS equations were formulated in Cartesian coordinates with the following assumptions made for this study:
- a)
3D flow under steady-state conditions.
- b)
The flow exhibits both turbulent and fully developed characteristics.
- c)
The working fluid was assumed to be air, with consistent physical and thermal properties throughout the flow field.
2.4.2. Governing Equations
The governing equations consisting of the continuity and momentum equations can be expressed in tensor notation, as follows:
- b)
Momentum conservation:
Equation (2) denotes the Reynolds-averaged Navier (RANS) equation. In the above equations, the terms u, p, and T are the Reynolds-averaged velocity, pressure, and temperature fields, respectively, and subscript x with i = 1, 2, and 3 represents the coordinate system, respectively. is the Kronecker delta. The momentum part of the Reynolds-averaged Navier–Stokes (RANS) equations is related to a nonlinear term associated with Reynolds stress.
2.4.3. Simulation Algorithm
This model is referred to as Reynolds stress model. The Boussinesq approximation is a method for determining the Reynolds stresses in RANS equations, assuming a linear relationship between the turbulent Reynolds stresses and the mean rate of the strain tensor. This challenge is commonly referred to as the turbulence closure problem.
Where
is the eddy viscosity,
where is the turbulent kinetic energy per unit of mass.
The stress model that represents the effect of turbulence is unknown and should be determined using the turbulence model.
The turbulence kinetic energy,
k, and its rate of dissipation,
, are obtained from the following realizable
k-
model;
And
Where,
In these equations,
Gk,
Gb, and
YM represent the creation of turbulence kinetic energy caused by changes in the velocity creation of turbulence kinetic energy as a result of buoyancy and the impact of fluctuating dilatation on the dissipation rate in compressible turbulence, respectively.
C2 and
are constants.
σk and
are the turbulent Prandtl numbers (
Table 3) for
and
, respectively.
Sk and
are source terms. As in other
k-
models, the eddy viscosity is obtained from
And
Where,
is the mean rate-of-rotation tensor viewed in a rotating reference frame with angular velocity
. The model constants
A0 and
As are given by
Where,
The terms
GK and
GB, representing the production of turbulence kinetic energy and the generation of turbulence due to buoyancy in equation (4) may be defined as
Where
Prt is the turbulent Prandtl number for energy and
gi is the gravitational vector component in the
i-th direction. In the standard and realizable
k-ϵ models, the default value of
Prt is 0.85. The coefficient of thermal expansion,
β, is defined as
For an ideal gas, equation (12) reduces to
Where,
v represents the flow velocity component parallel to the gravitational vector and
u represents the component perpendicular to it.
2.5. Gid Independence Study
A grid independence test was performed to ensure the reliability and accuracy of the numerical simulations. The test aims to evaluate the influence of mesh resolution on the solution by systematically refining the mesh and monitoring the changes in the variables of interest until a negligible variation is observed, indicating mesh-independent results (Roache, 1998).
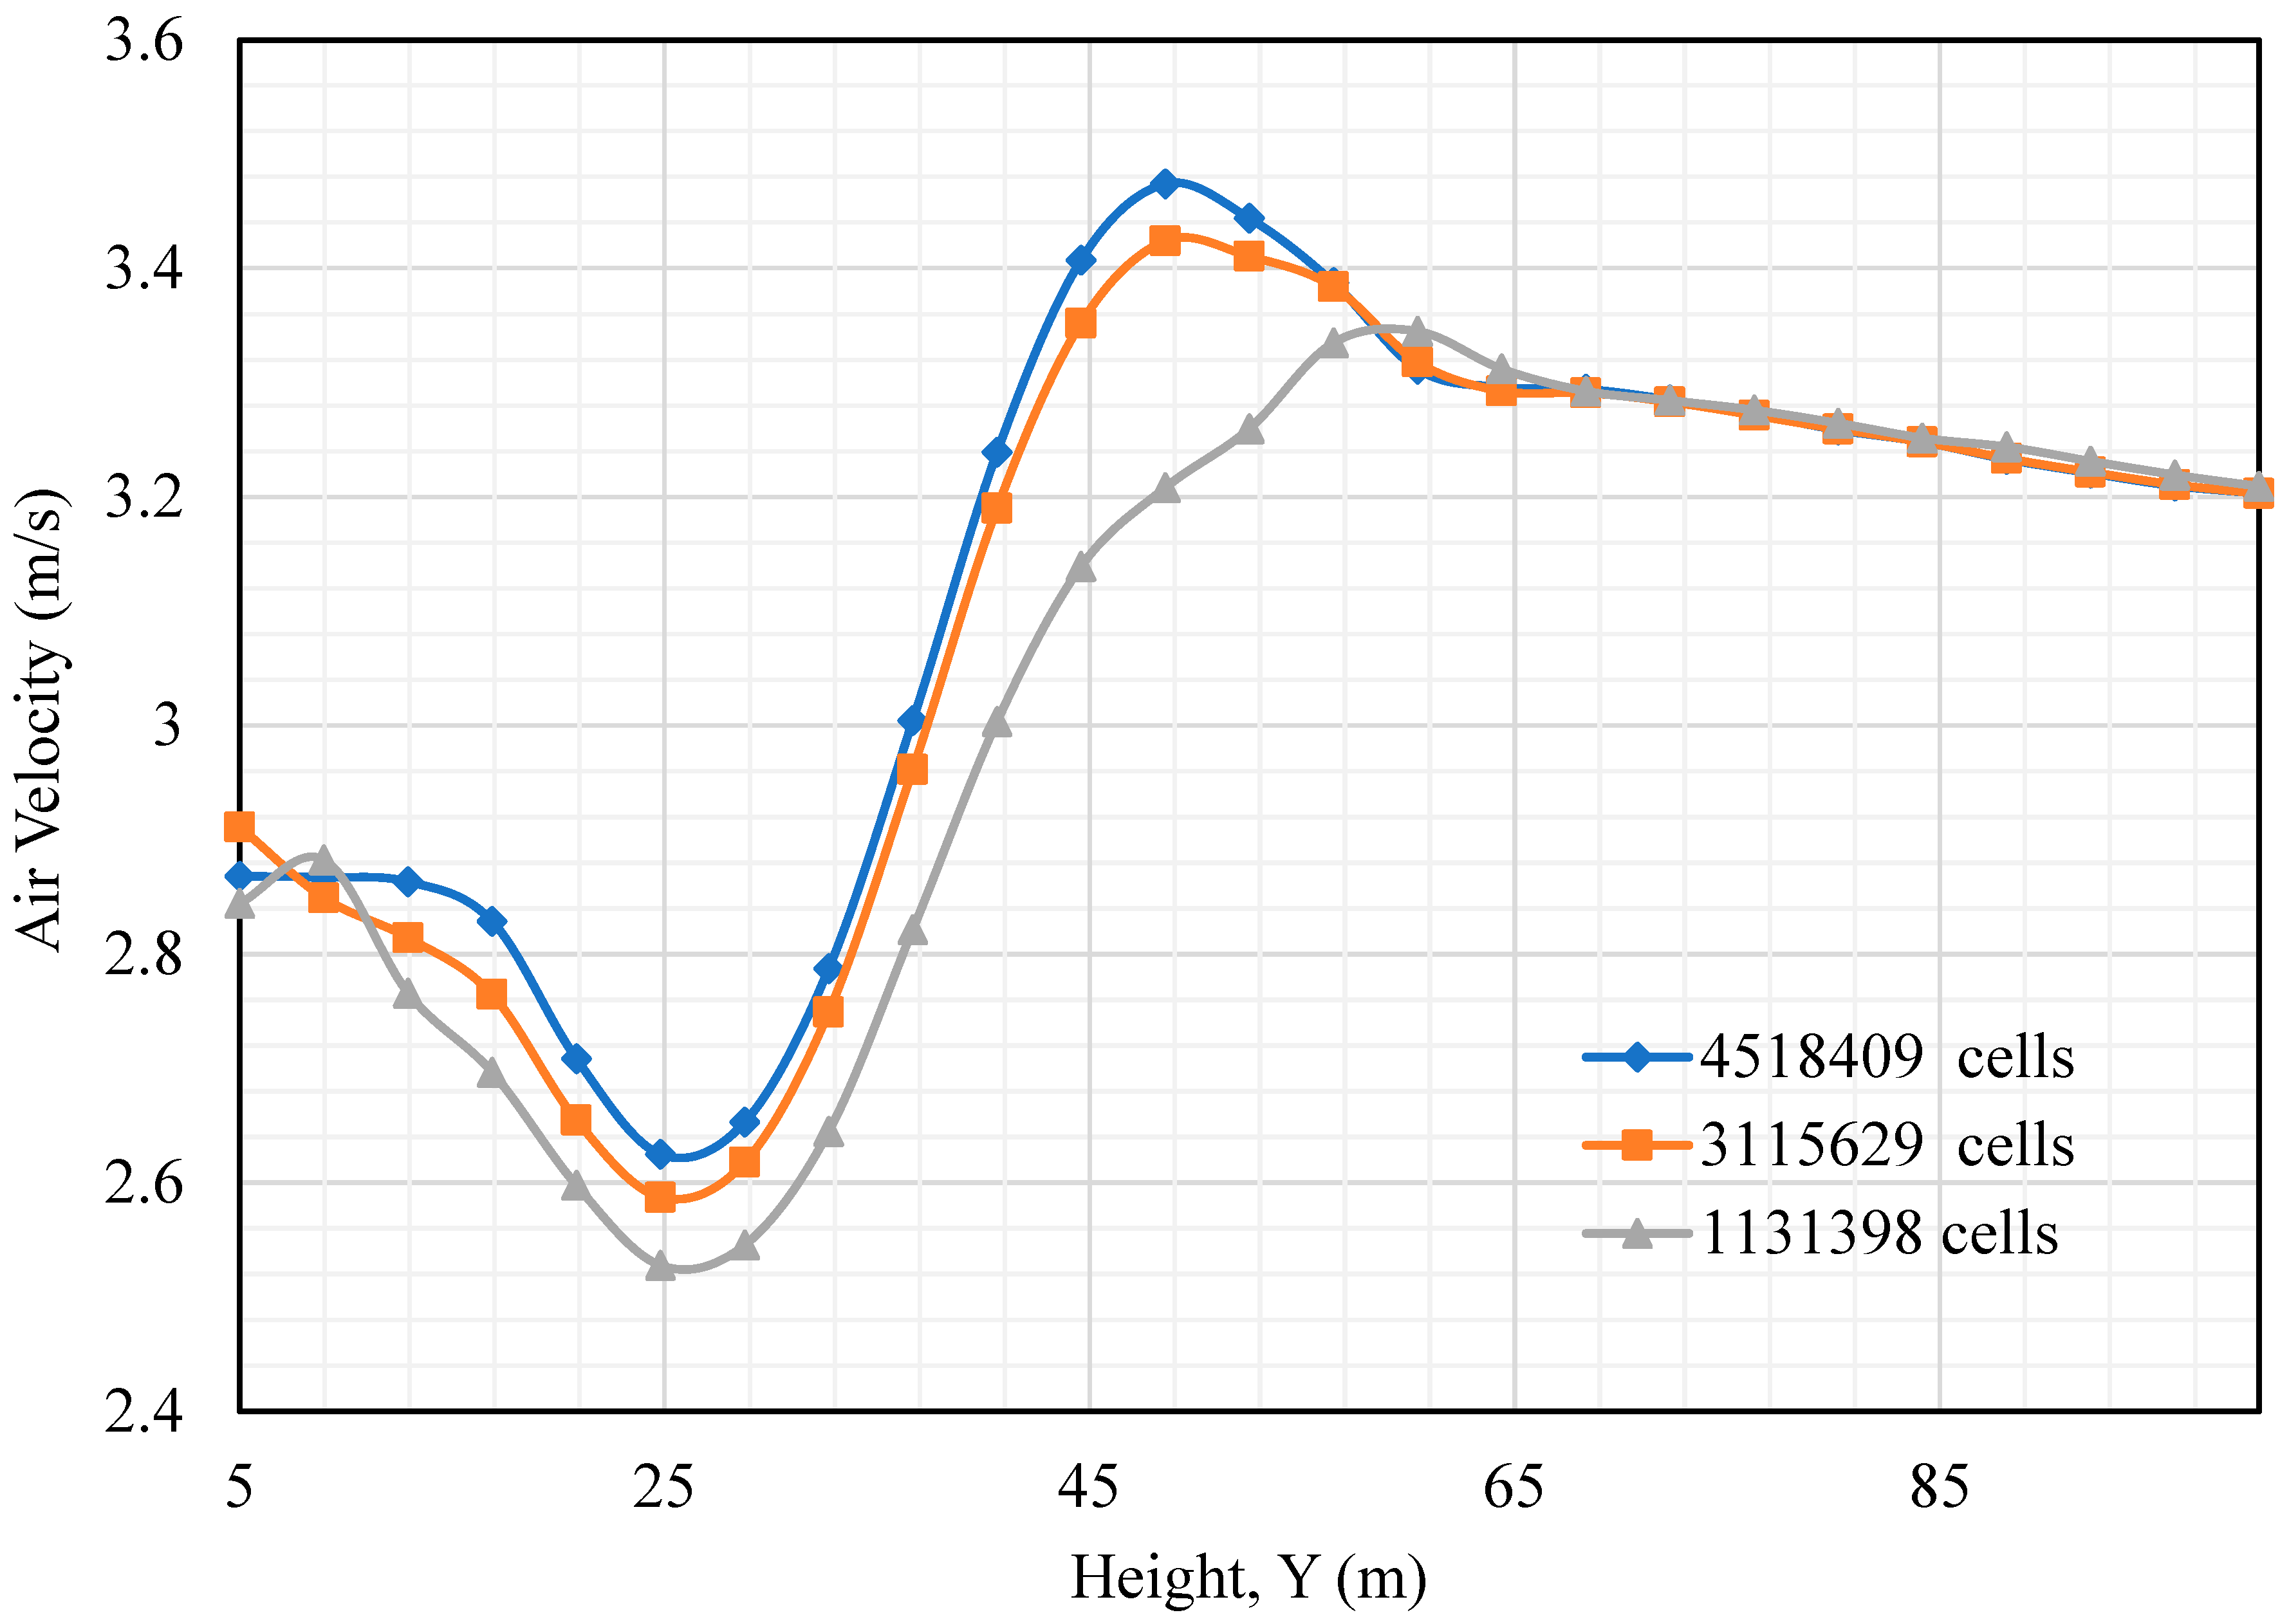
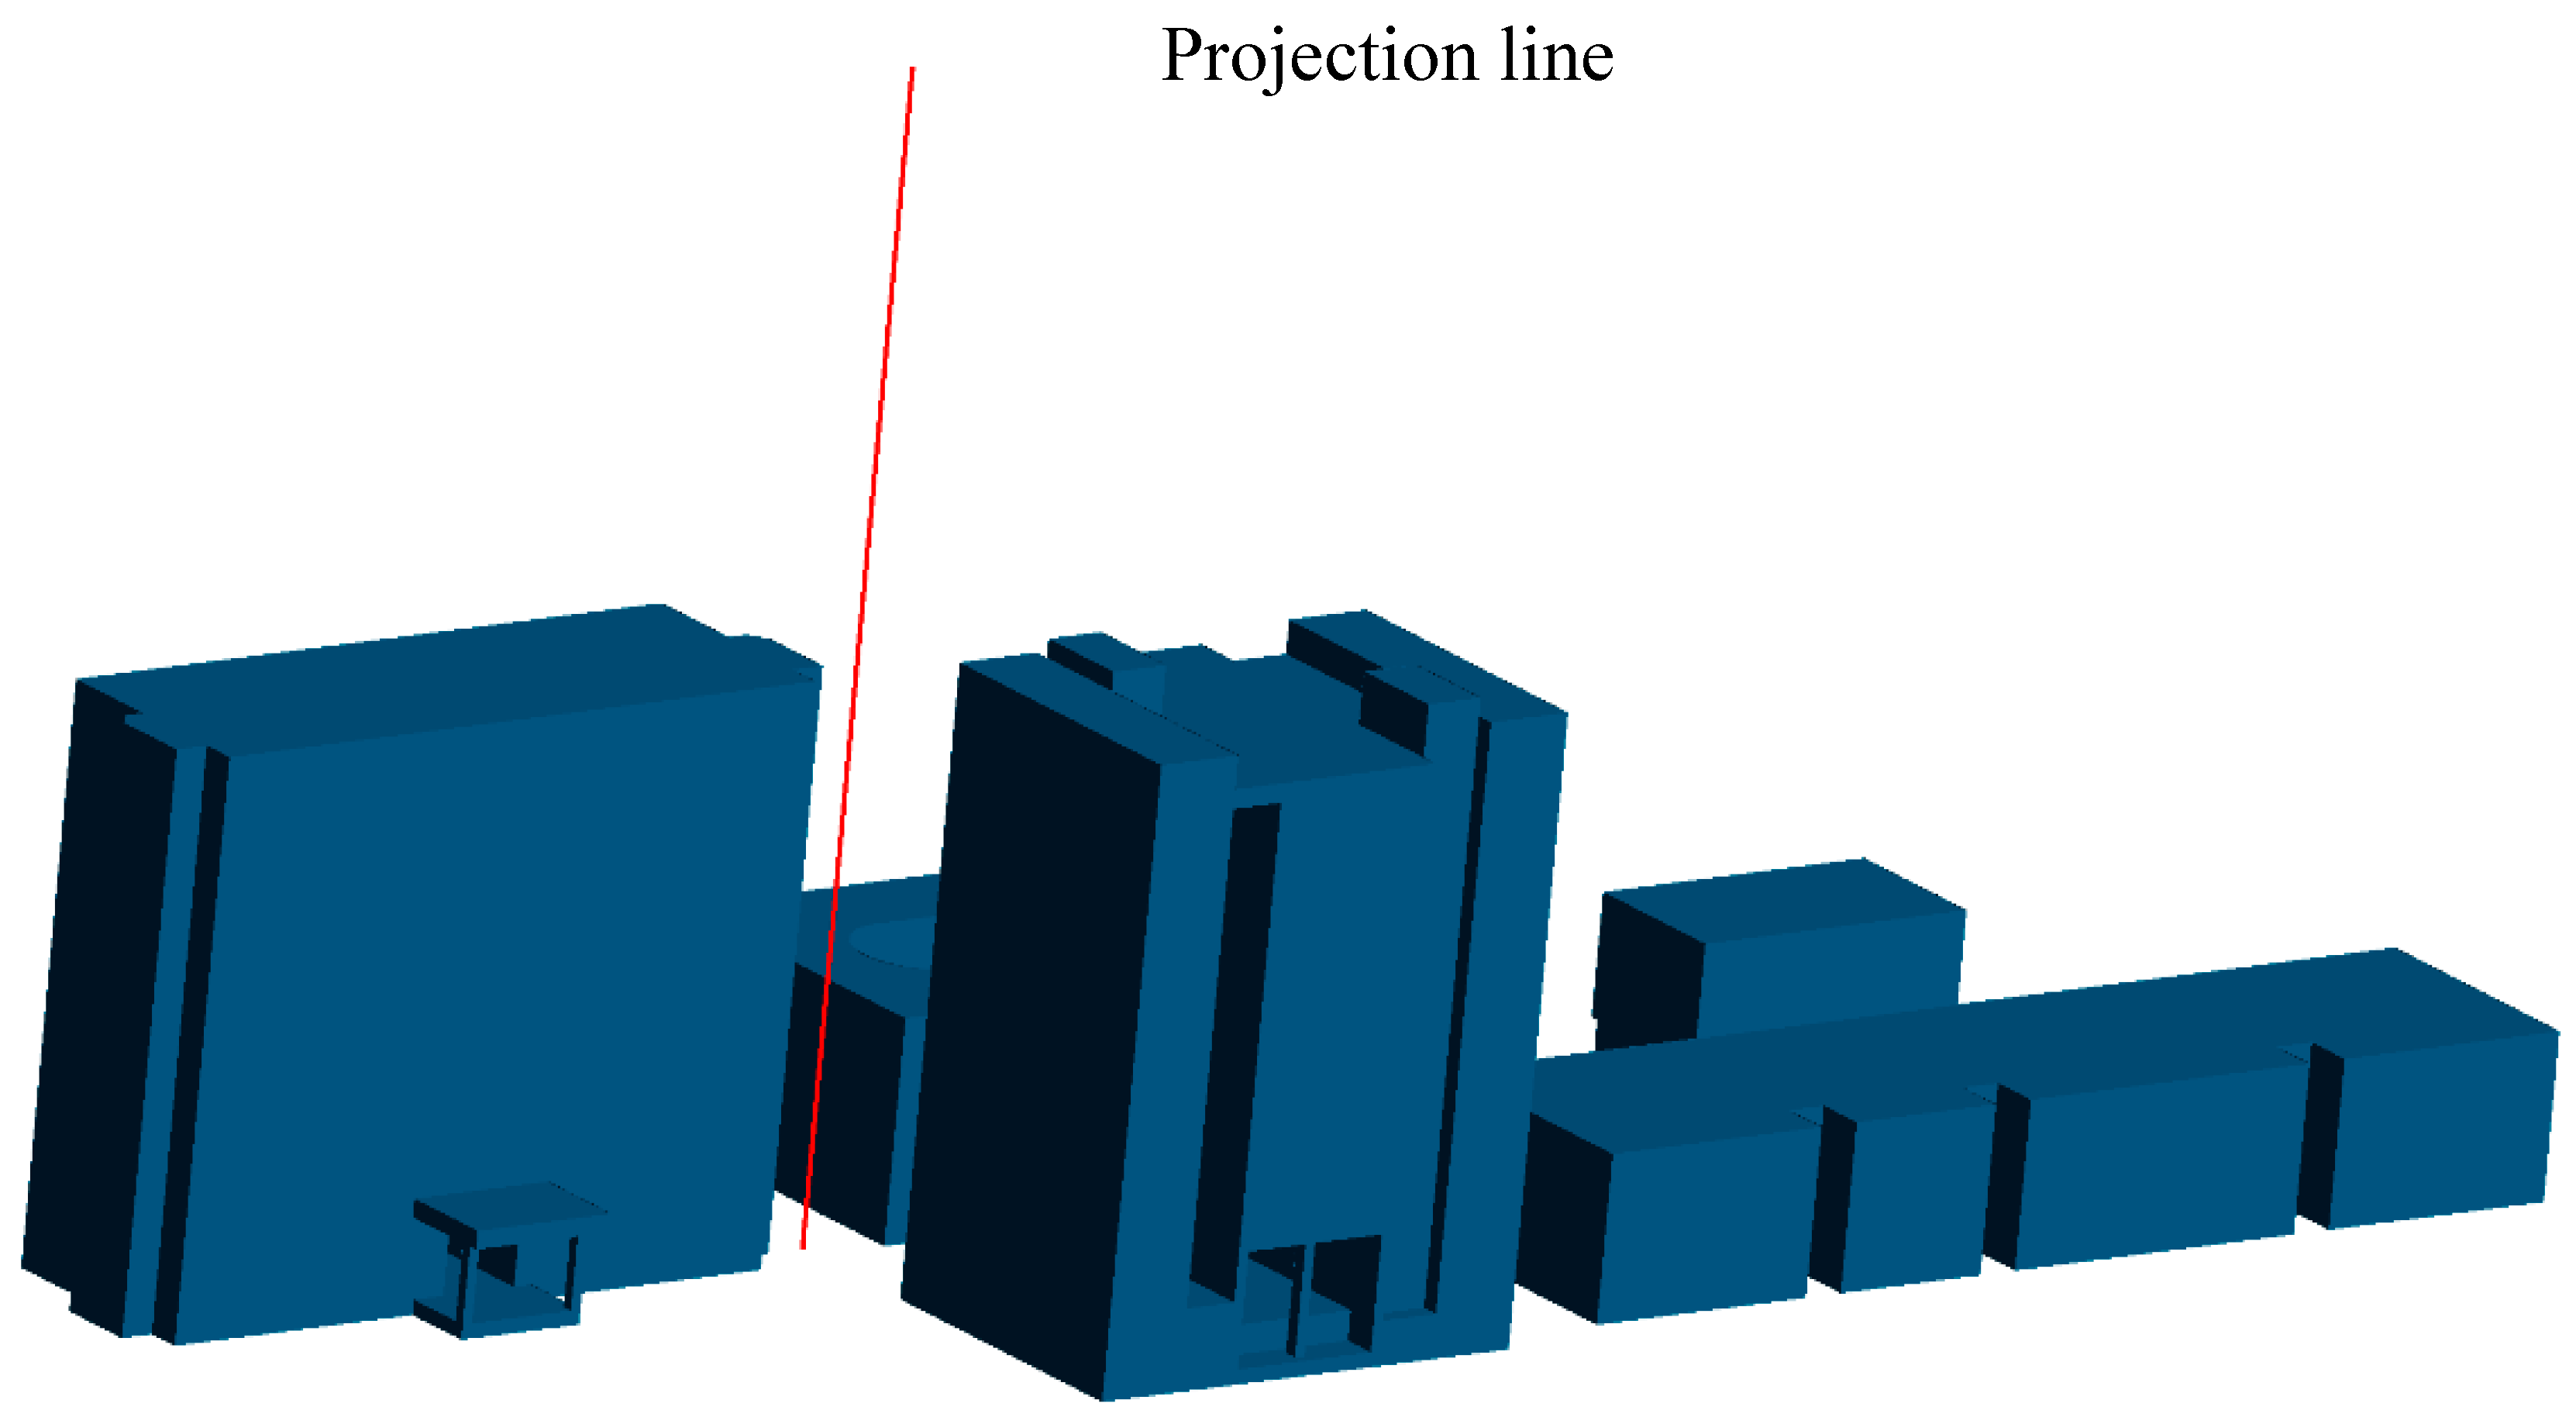
Three different mesh resolutions were considered for the grid independence test: 1,131,398, 3,106,445, and 4,518,409 cells, respectively. The air velocity at different heights was selected as the critical parameter for the grid-independence study. To investigate the vertical distribution of air velocity, measurements were taken along a projection line spanning from (−47, 5, −10) to (−47, 100, −10) in the computational domain coordinates, capturing velocities at various heights above ground level. The projection line is shown in
Figure 6.
The results of the grid independence test are presented in
Figure 7, which shows the air velocity profiles at different mesh resolutions. As is evident from
Figure 7, the velocity profiles converged as the mesh resolution increased, indicating that the solution became less dependent on the mesh size. The average percentage of relative error (ε
a) between the coarse (3,106,445 cells) and fine (4,518,409 cells) mesh resolutions was calculated to be 0.694%, which is within the acceptable range for CFD simulations (Franke, 2007).
Figure 8.
Air velocities along the projection line at different heights from the ground.
Figure 8.
Air velocities along the projection line at different heights from the ground.
Based on the grid independence study, the mesh with 3,106,445 elements was selected as the optimal mesh size for the simulations. The grid independence test was performed considering a situation with a balance between computational efficiency and solution accuracy. (Celik, 2008).
3. Results and Discussion
3.1. Code Validation
The accuracy of the (CFD) simulations was validated through experimental measurements, following the guidelines suggested by (Franke, 2007) and(Tominaga et al., 2008) For CFD simulations of pedestrian-level wind environments.
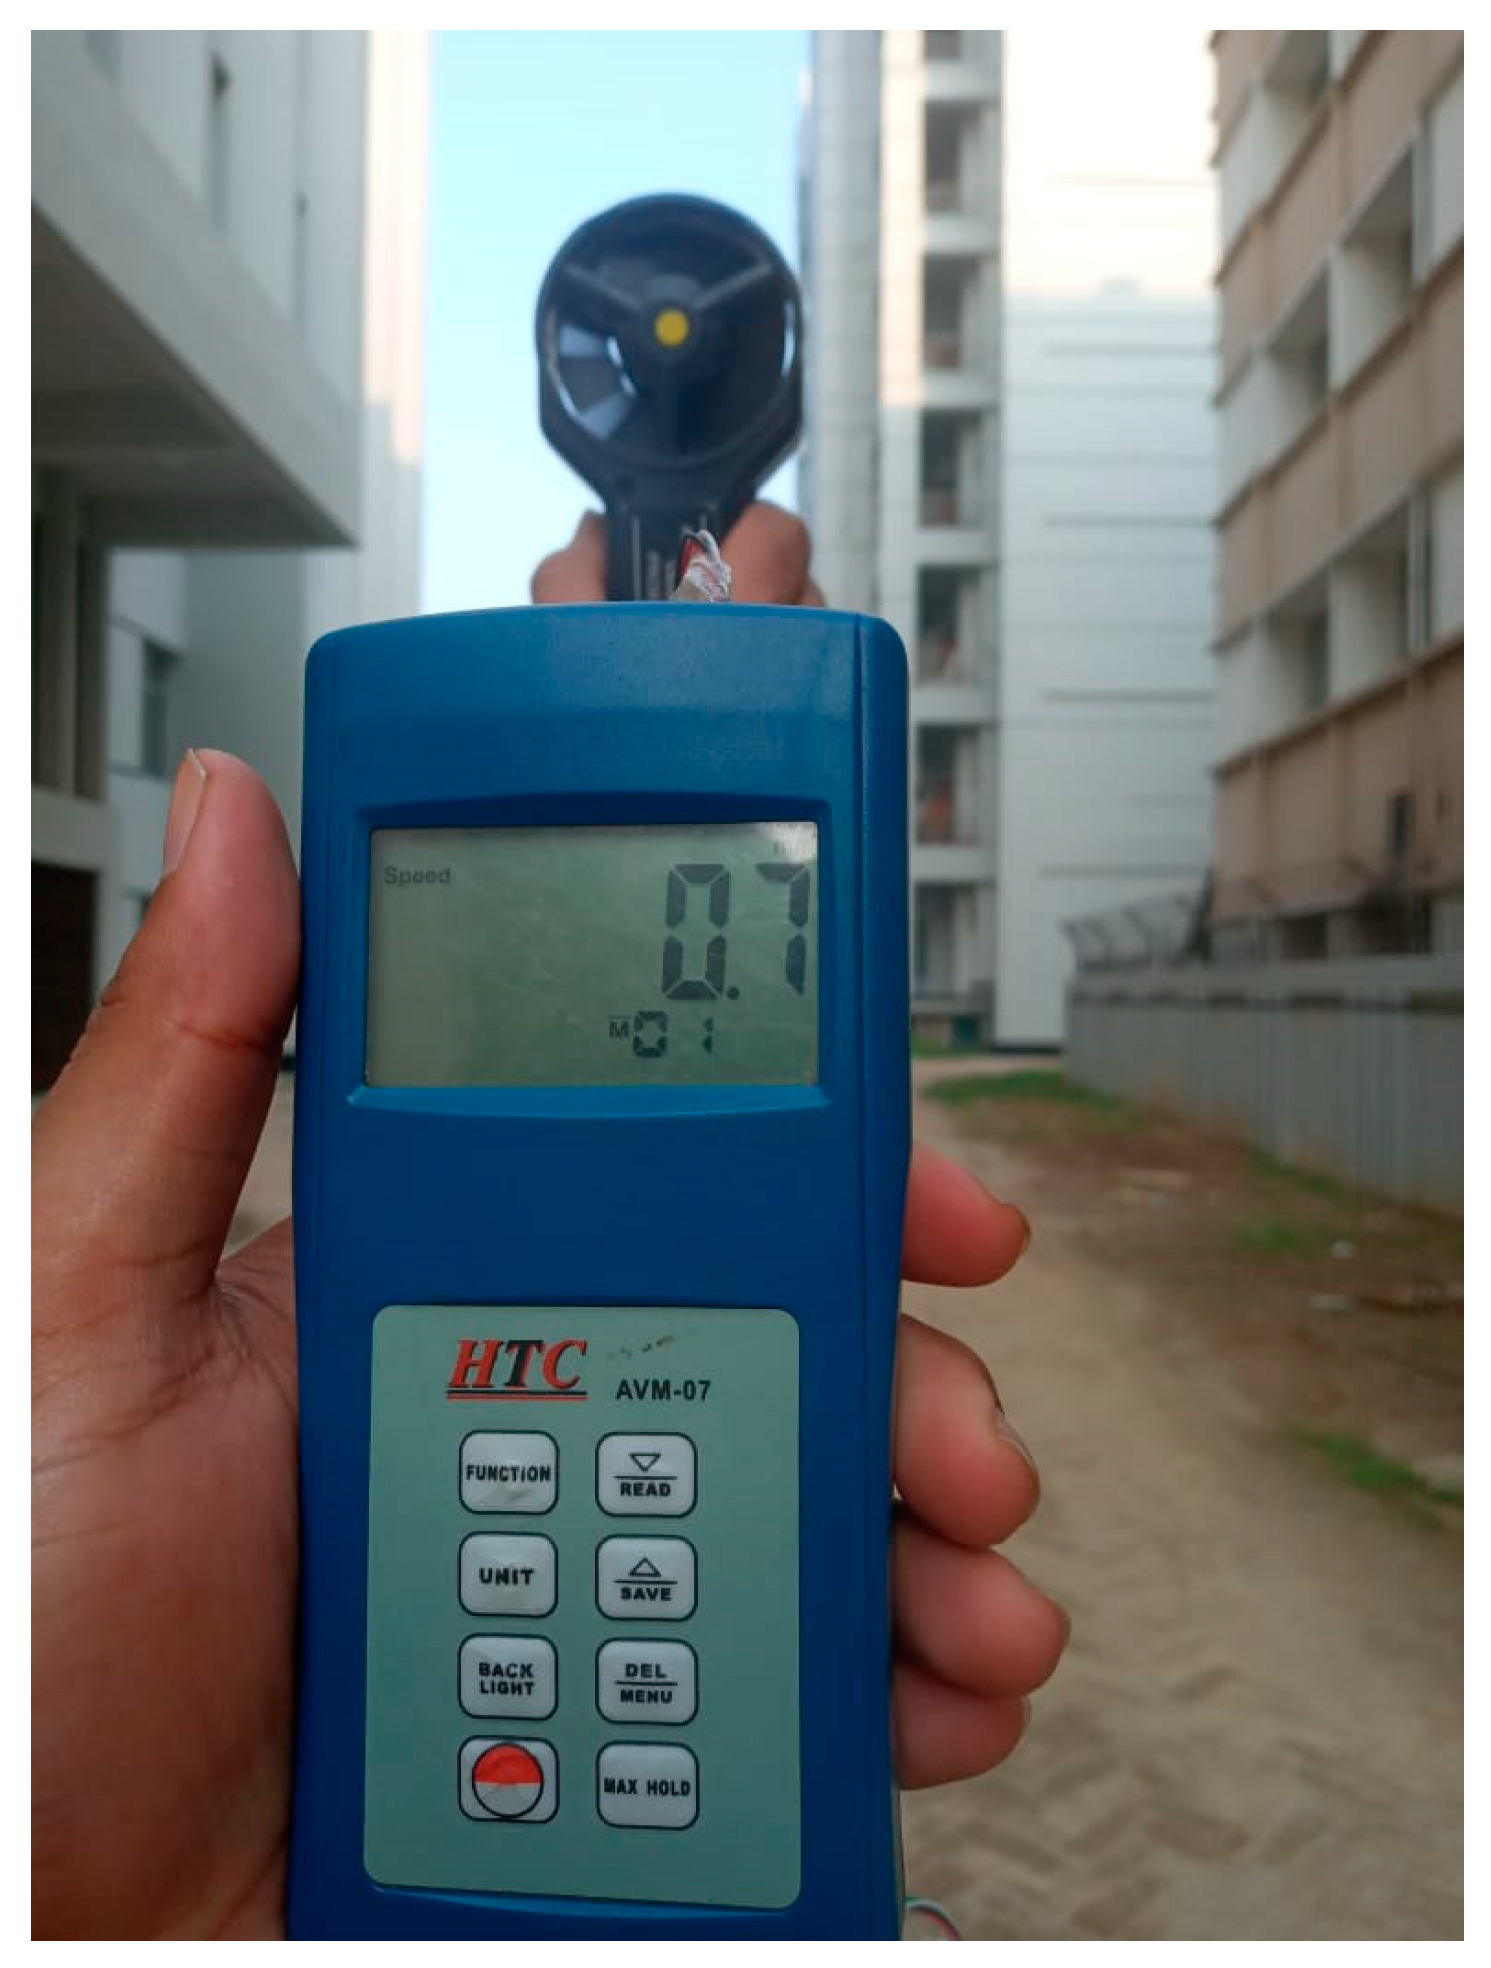
Wind velocity and direction measurements were performed using an anemometer, as shown in
Figure 8. The anemometer readings indicated an incoming wind velocity of 0.994 m/s, approaching 22 °south of the primary direction. To account for this angle, the computational geometry was rotated 22 °to the west. Three different locations, defined as A, B, and C, were selected within the computational domain to compare the simulation results with experimental measurements. Figure 9 shows the velocity contours for an inlet velocity of 0.944 m/s.
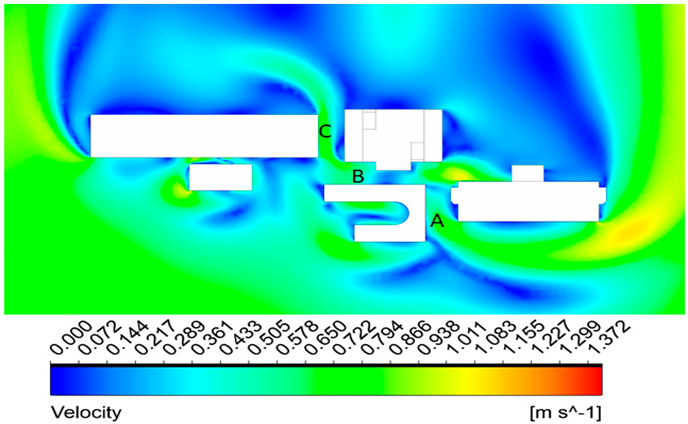
Table 4 presents a comparison between the simulation results and experimental measurements at the three locations. The percentage error between the simulation and experimental results is calculated for each location. The maximum error observed was 9.30%, whereas the average error across all the three locations was 7.47%. According to (Franke, 2007), an average error of less than 10% is considered acceptable for CFD simulations of pedestrian-level wind environments.
As shown in
Table 4, the vertical profile of the streamwise wind speed from the present simulation corresponds well with that obtained from the present experiment, with an error of less than 10%.
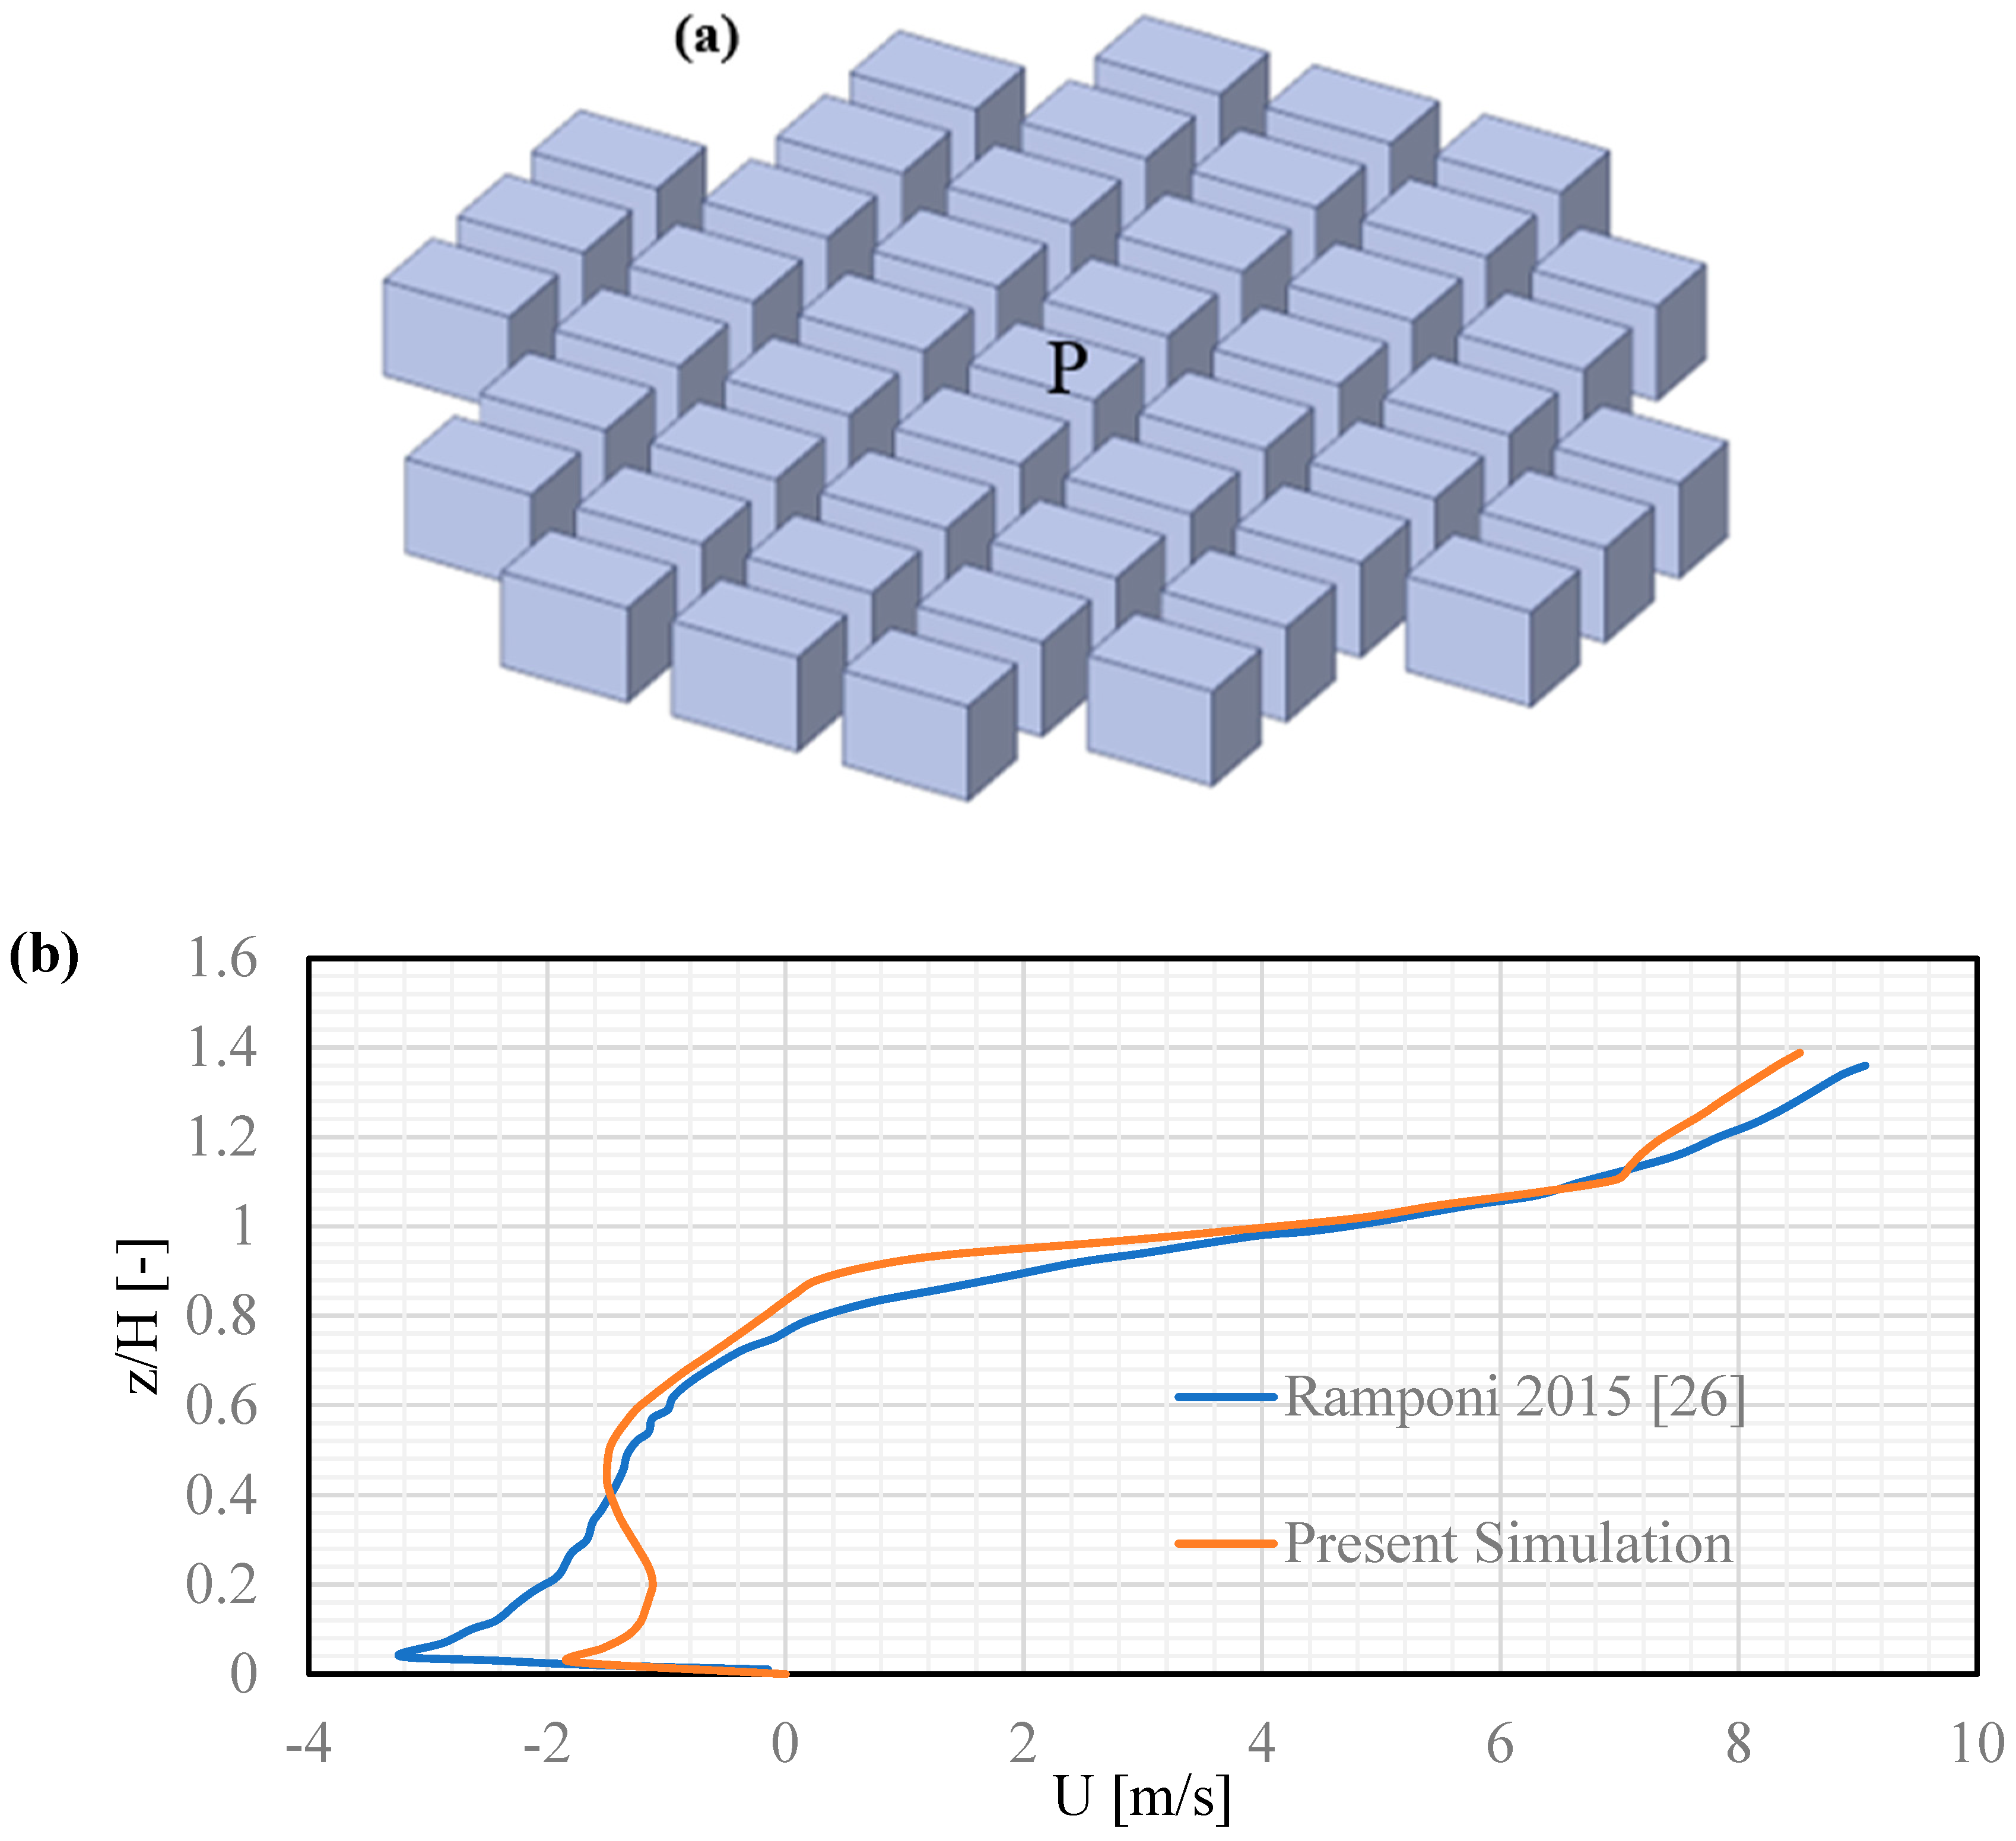
Another additional validation study was performed by simulating the regularly arranged rectangular building geometry investigated by Ramponi et al. (Ramponi et al., 2015b), using the same boundary conditions with a realizable
k-ε model across all CFD simulations in this study. The buildings had a footprint of 16 × 24 m² and a height of 18 m, with 47 buildings arranged in a circular layout, as shown in
Figure 10a. The mean percentage error in our study was less than 15%.
Figure 10b shows the streamwise wind-speed profile along the vertical direction, as studied by Ramponi et al. (Ramponi et al., 2015b).
As shown in
Figure 10b, the vertical profile of the streamwise wind speed along a vertical line in front of the central building (black) at position P corresponds well with that obtained by Ramponi et al. (Ramponi et al., 2015b) with an error of less than 15%.
3.2. Velocity Distribution
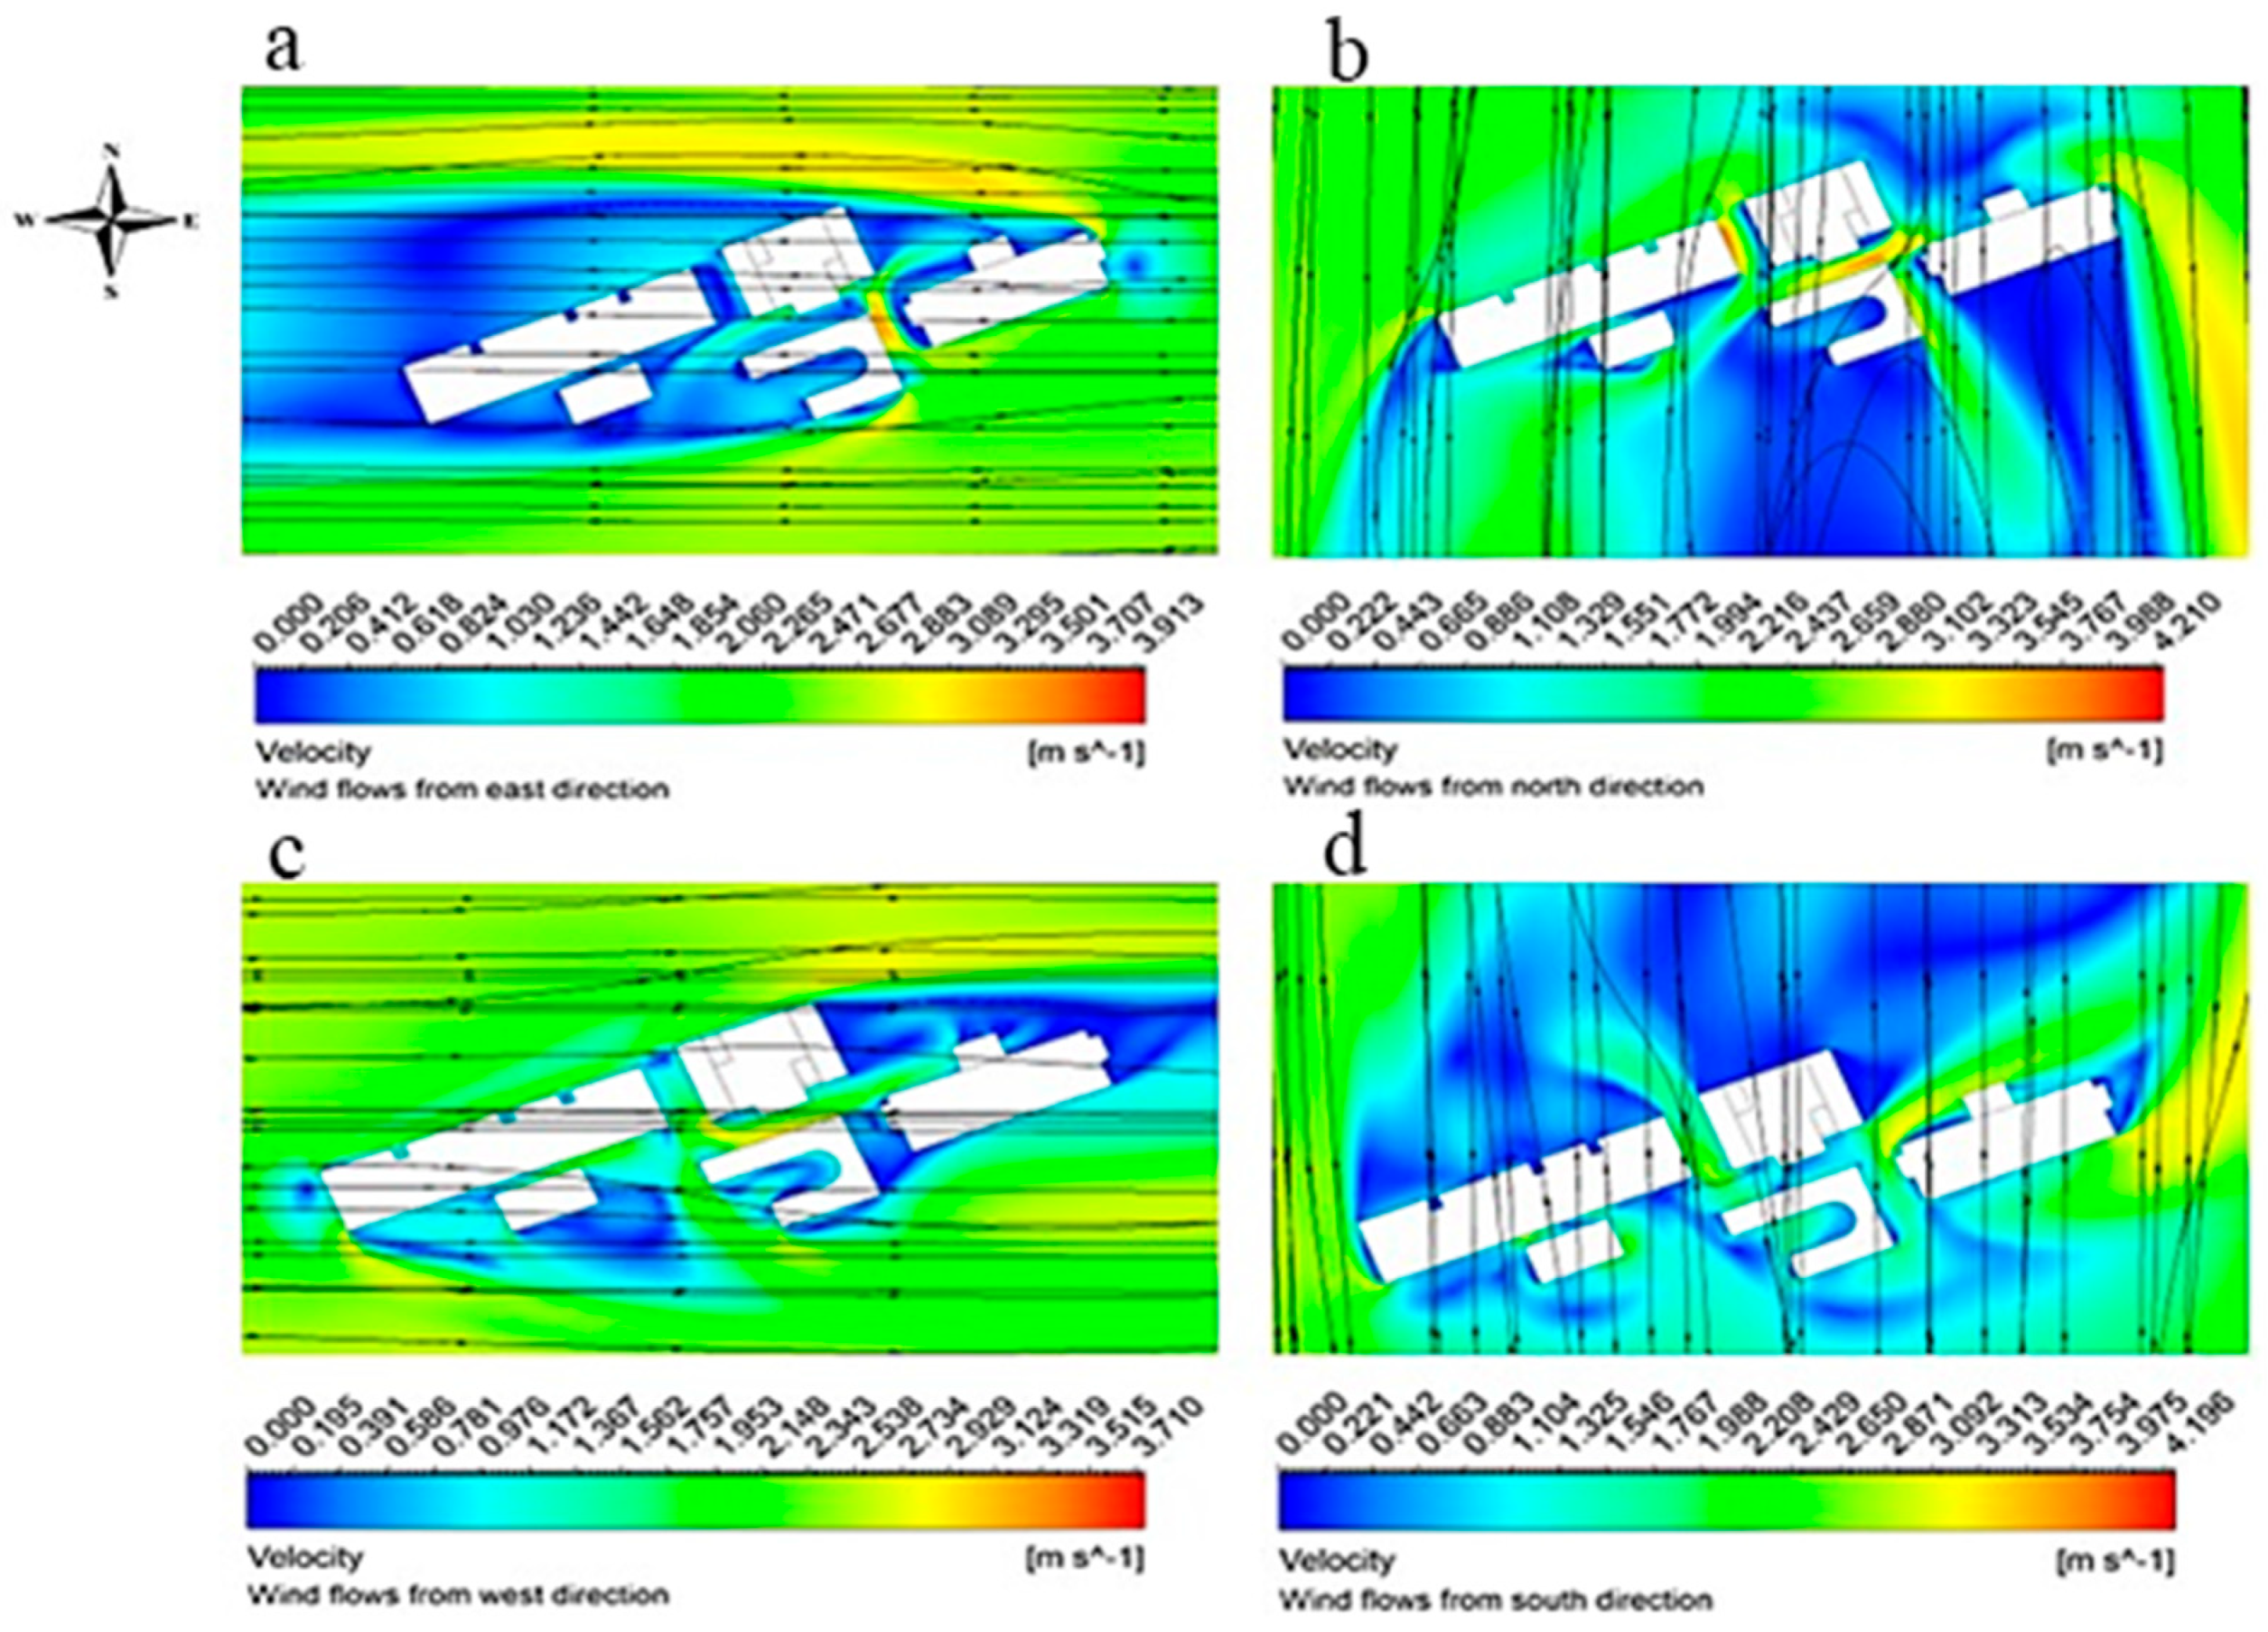
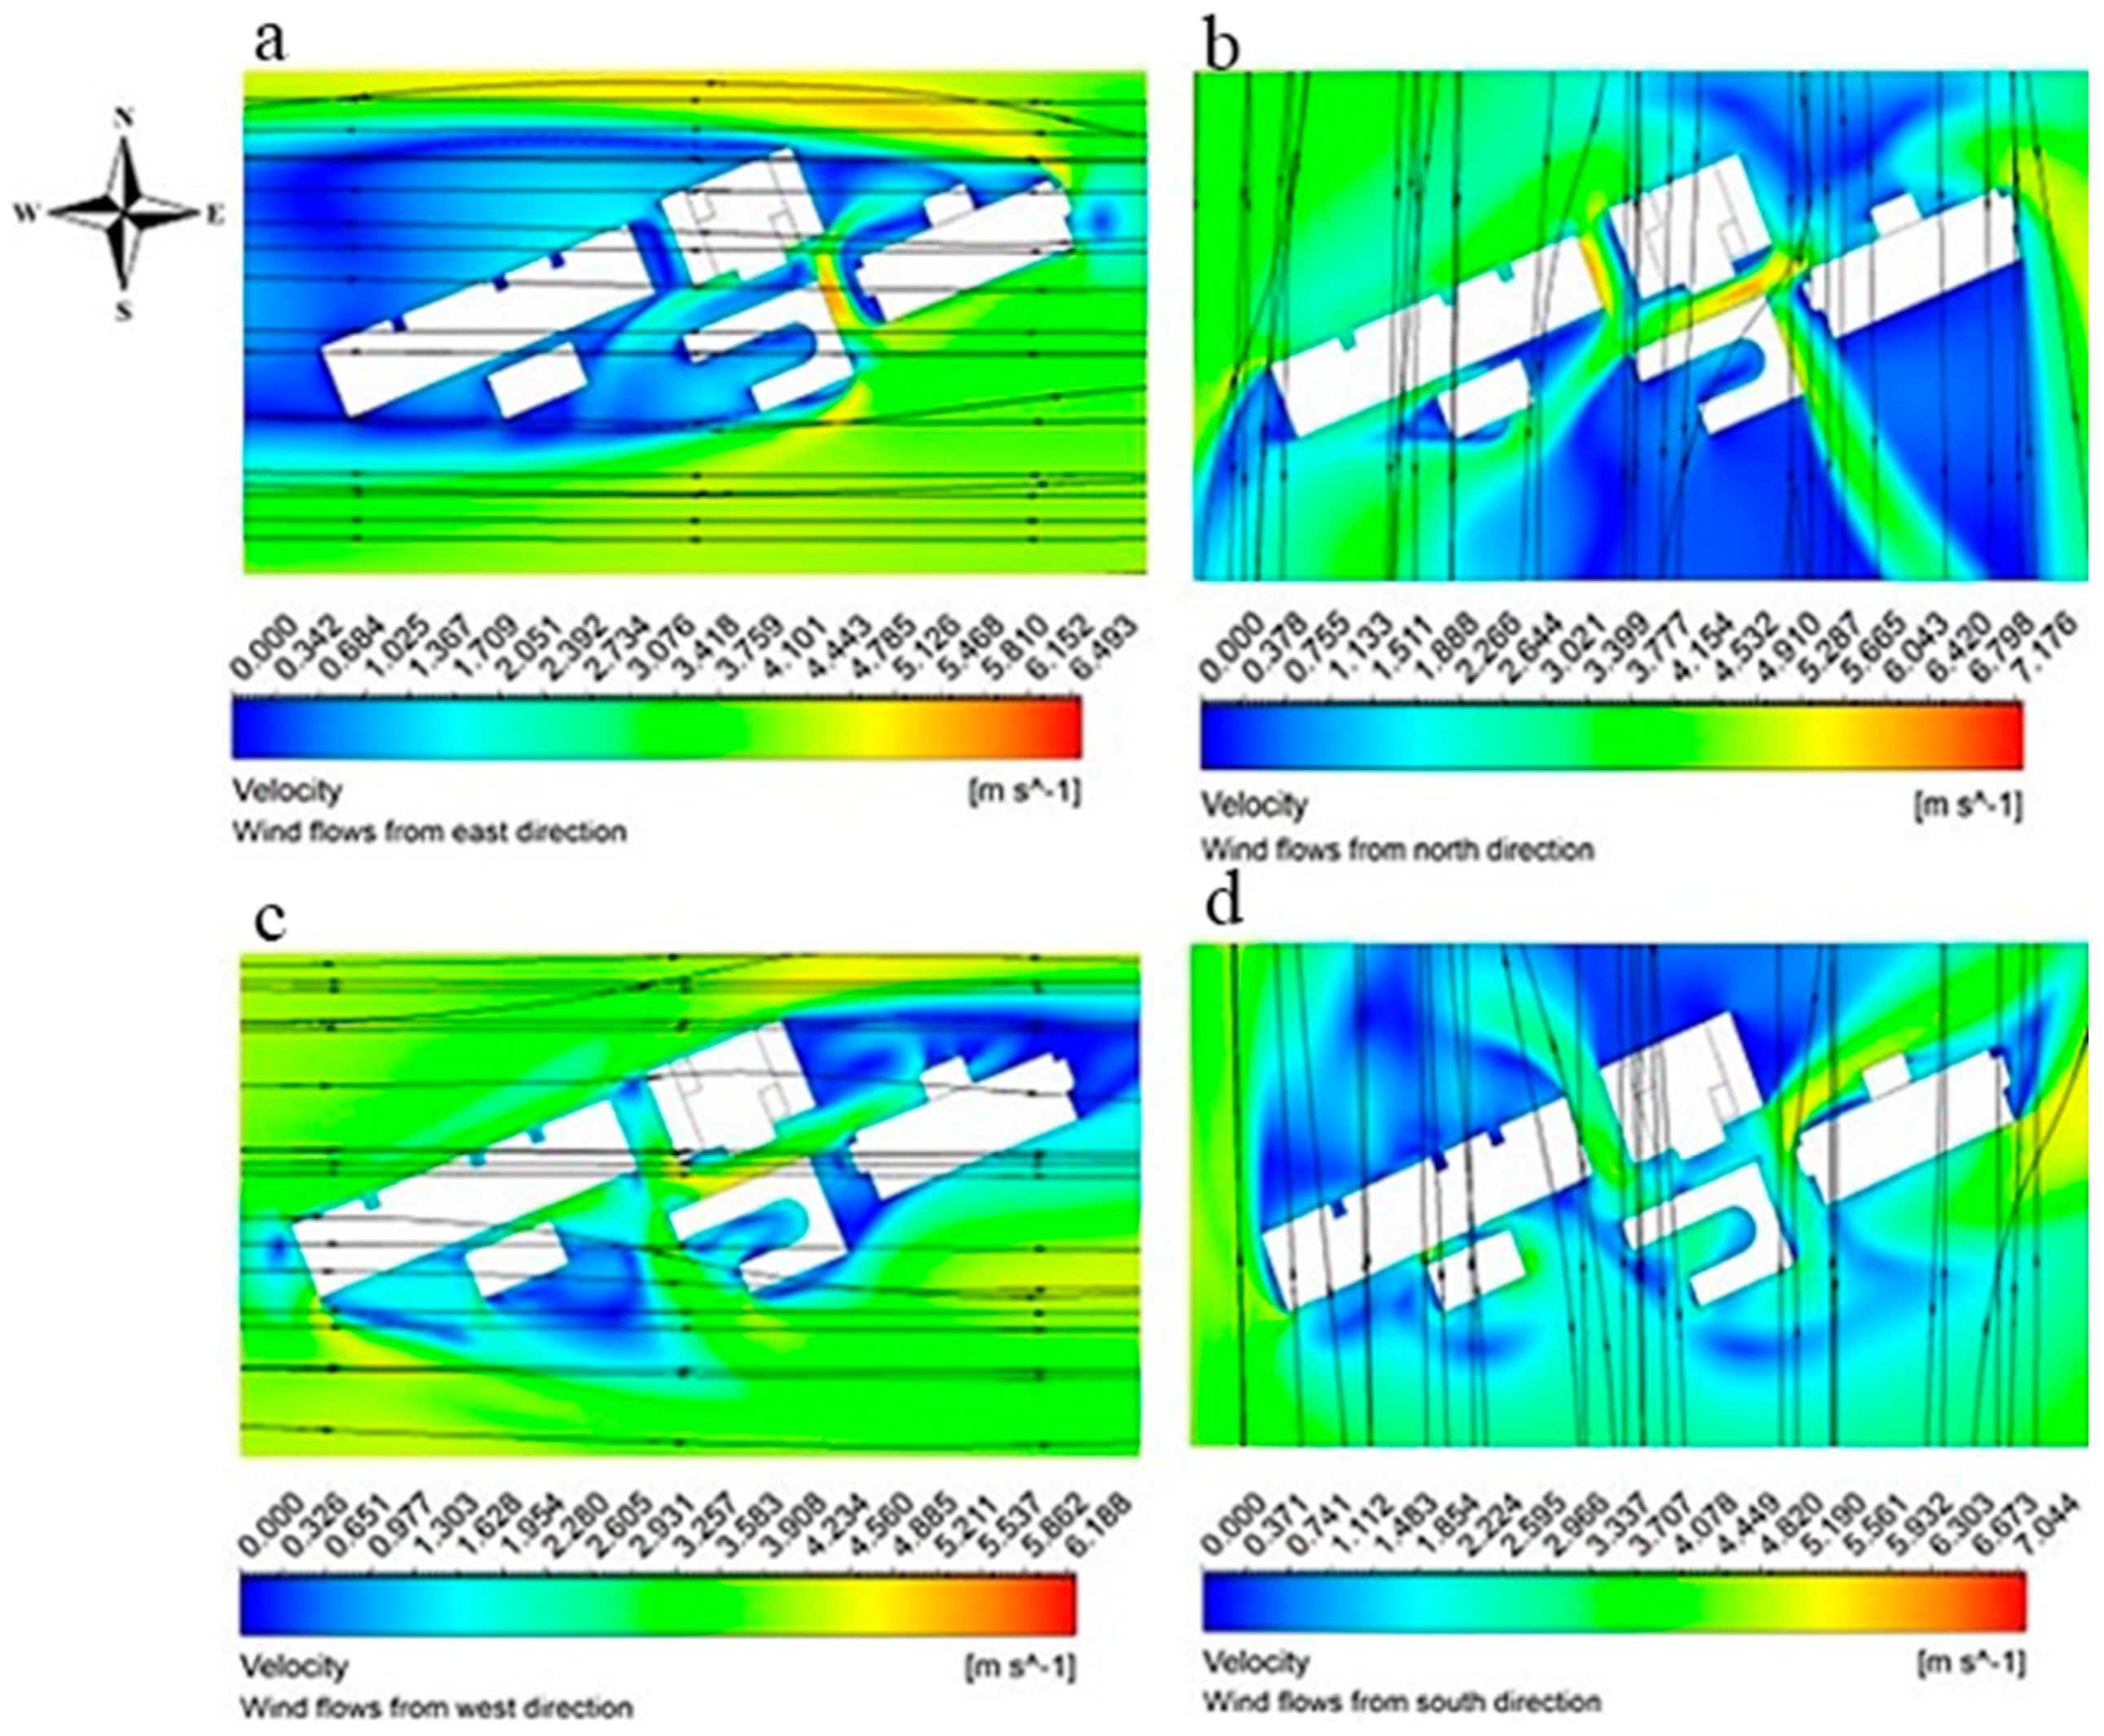
The effect of wind on pedestrian comfort around the DUET campus buildings was investigated using ANSYS Fluent simulations. Simulations were performed for wind speeds of 3 m/s and 5 m/s from different directions.
Figure 11 shows the streamlines and velocity contours at a height of 1.75 meters for a 3 m/s wind from the east (
Figure 11a), north (
Figure 11b), west (
Figure 11c), and south (
Figure 11d).
Figure 12 displays similar data for a wind speed of 5 m/s from the east (
Figure 12a), north (
Figure 12b), west (
Figure 12c), and south (
Figure 12d).
As shown in
Figure 11 and
Figure 12, the velocity contours show an increase in air velocity along the corners of the building. Thus, locating restaurants, pedestrian walkways, gardens, or other outdoor arrangements in such areas is not advisable because of the potential discomfort and safety risks posed by the high wind speeds at the corners of buildings. The analysis reveals that the leeward sides of the buildings exhibit considerable blue regions, indicating that the air velocity is almost zero, which is the sheltering effect of the structures that significantly reduce the air speed. In contrast, narrow walkways between buildings experience elevated wind velocity. However, this is not always true when the wind velocity is less than the inlet velocity in walkways. On the other hand, Walkway-1 and Walkway-2 demonstrated high wind speeds when the wind originated from the north, whereas Walkway-3 shows an increase in air velocity when the wind flowed from the east, regardless of whether the inlet velocity was 3 m/s or 5 m/s. In addition, in Walkway-2, northward wind flow resulted in a velocity increase of up to 35.96%, primarily because of the Venturi effect induced by the adjacent building walls. This phenomenon poses a significant safety risk to pedestrians.
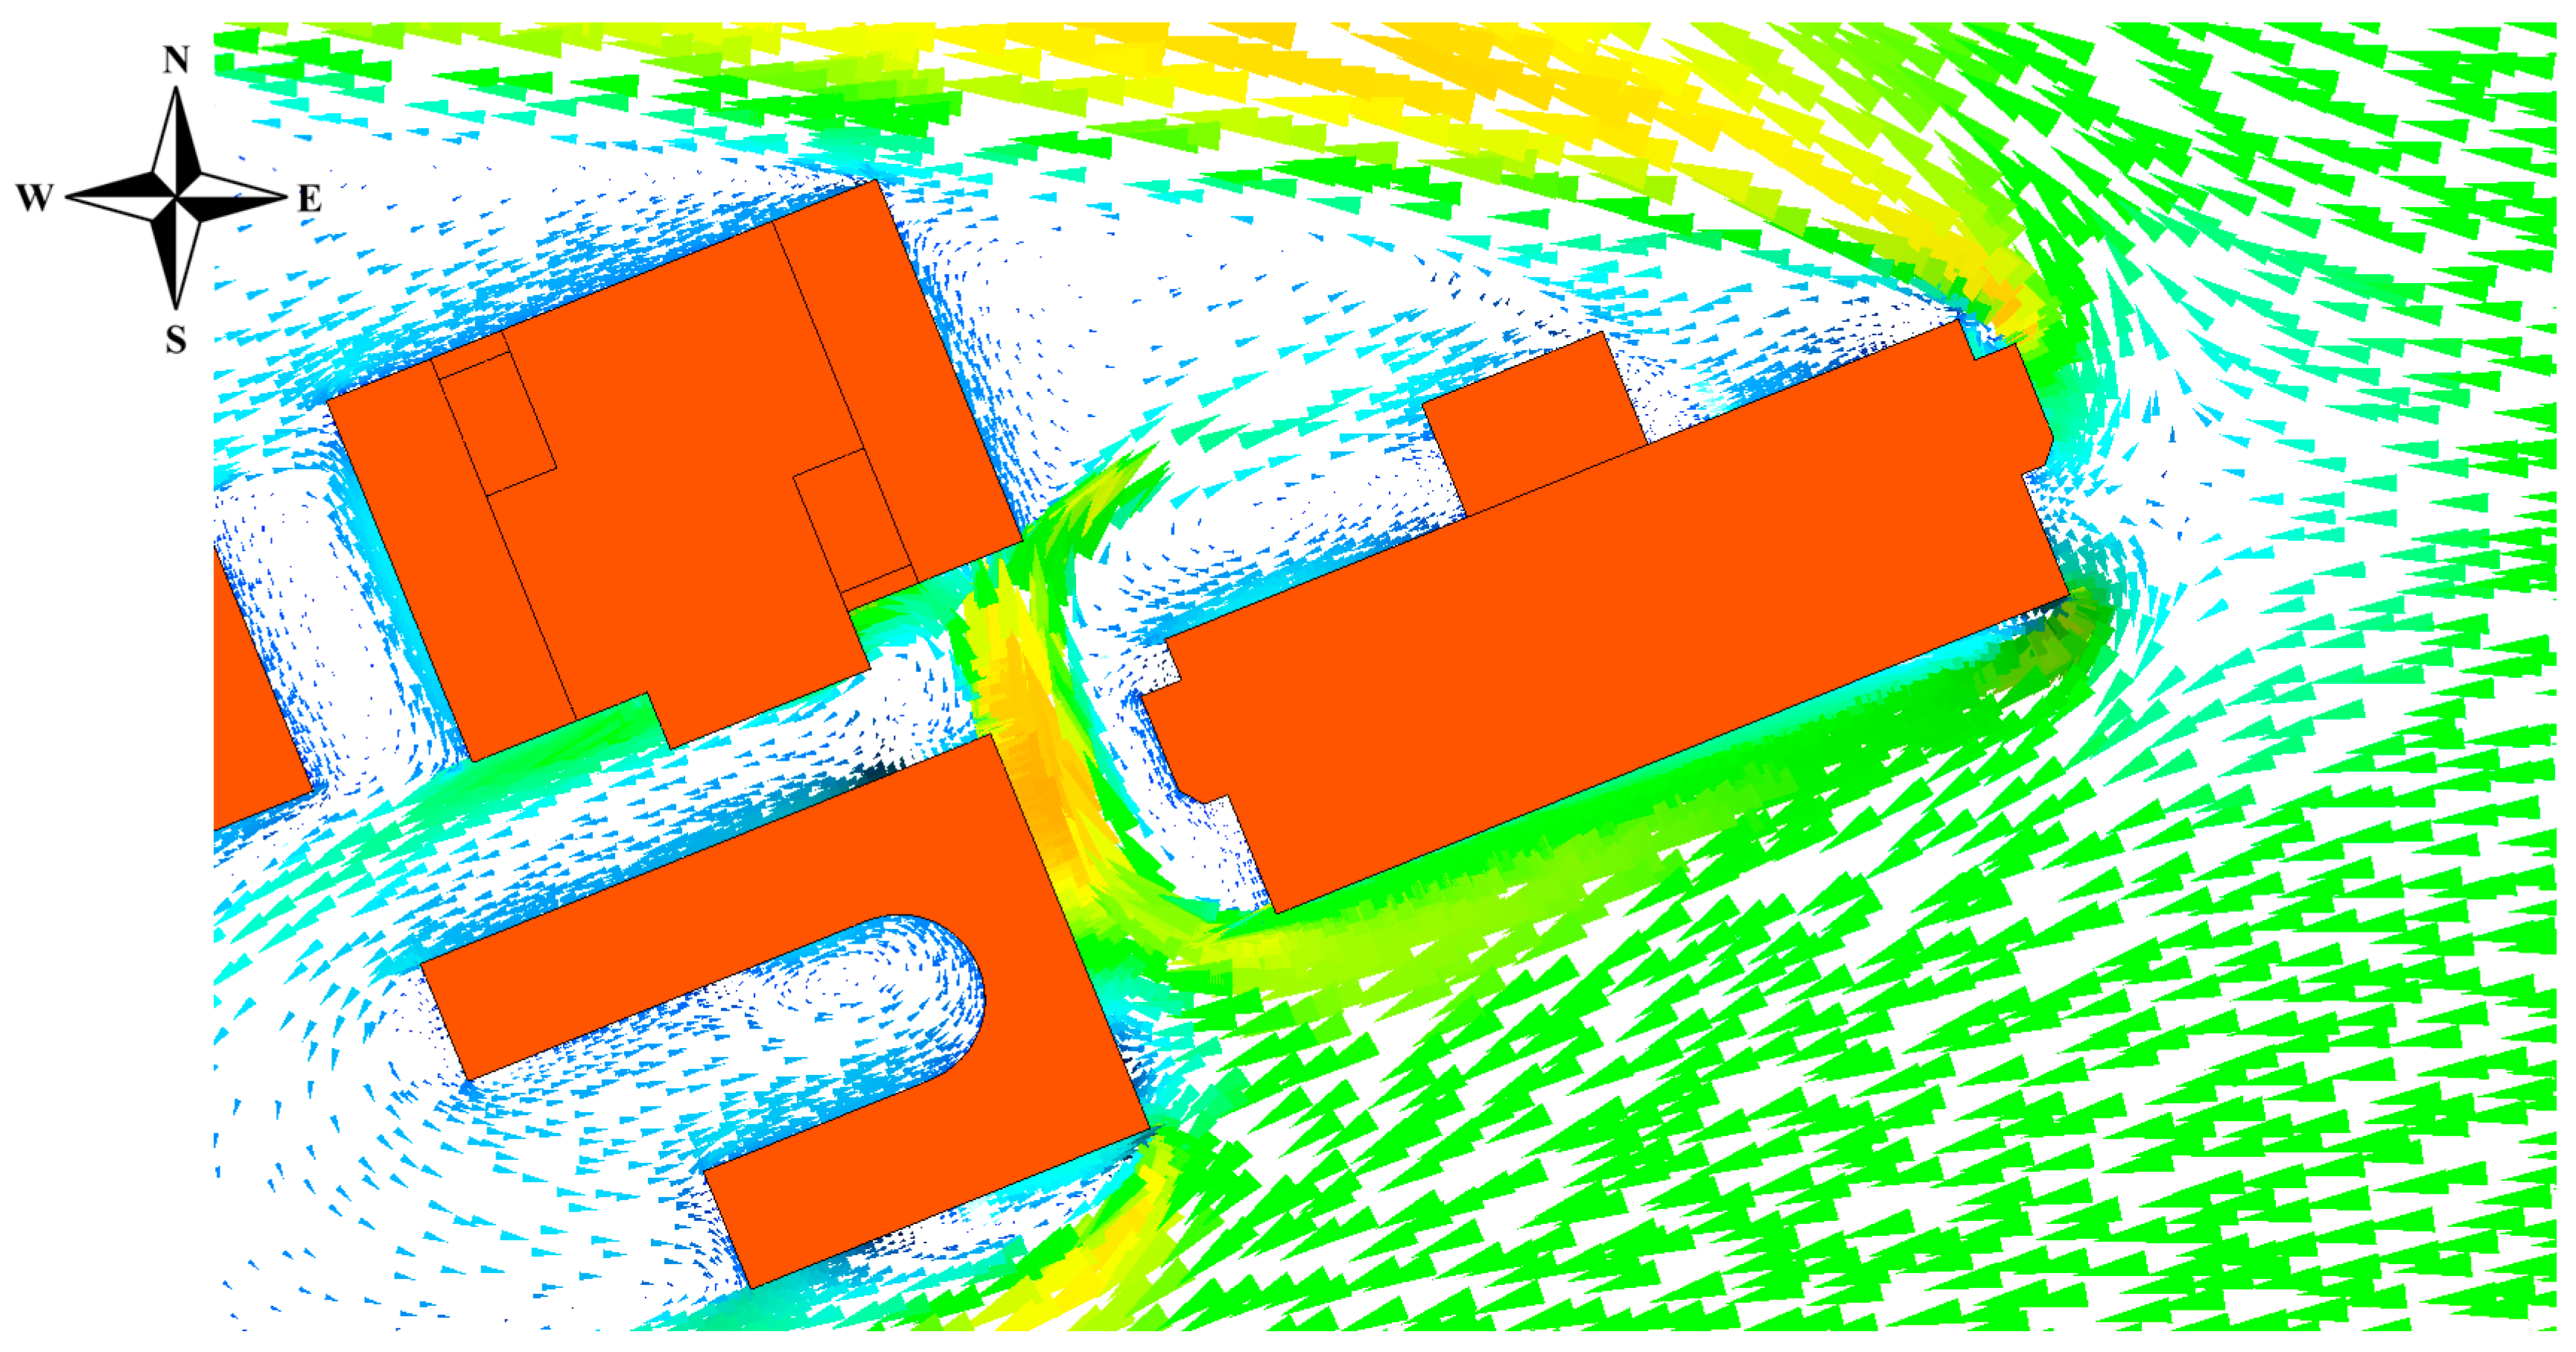
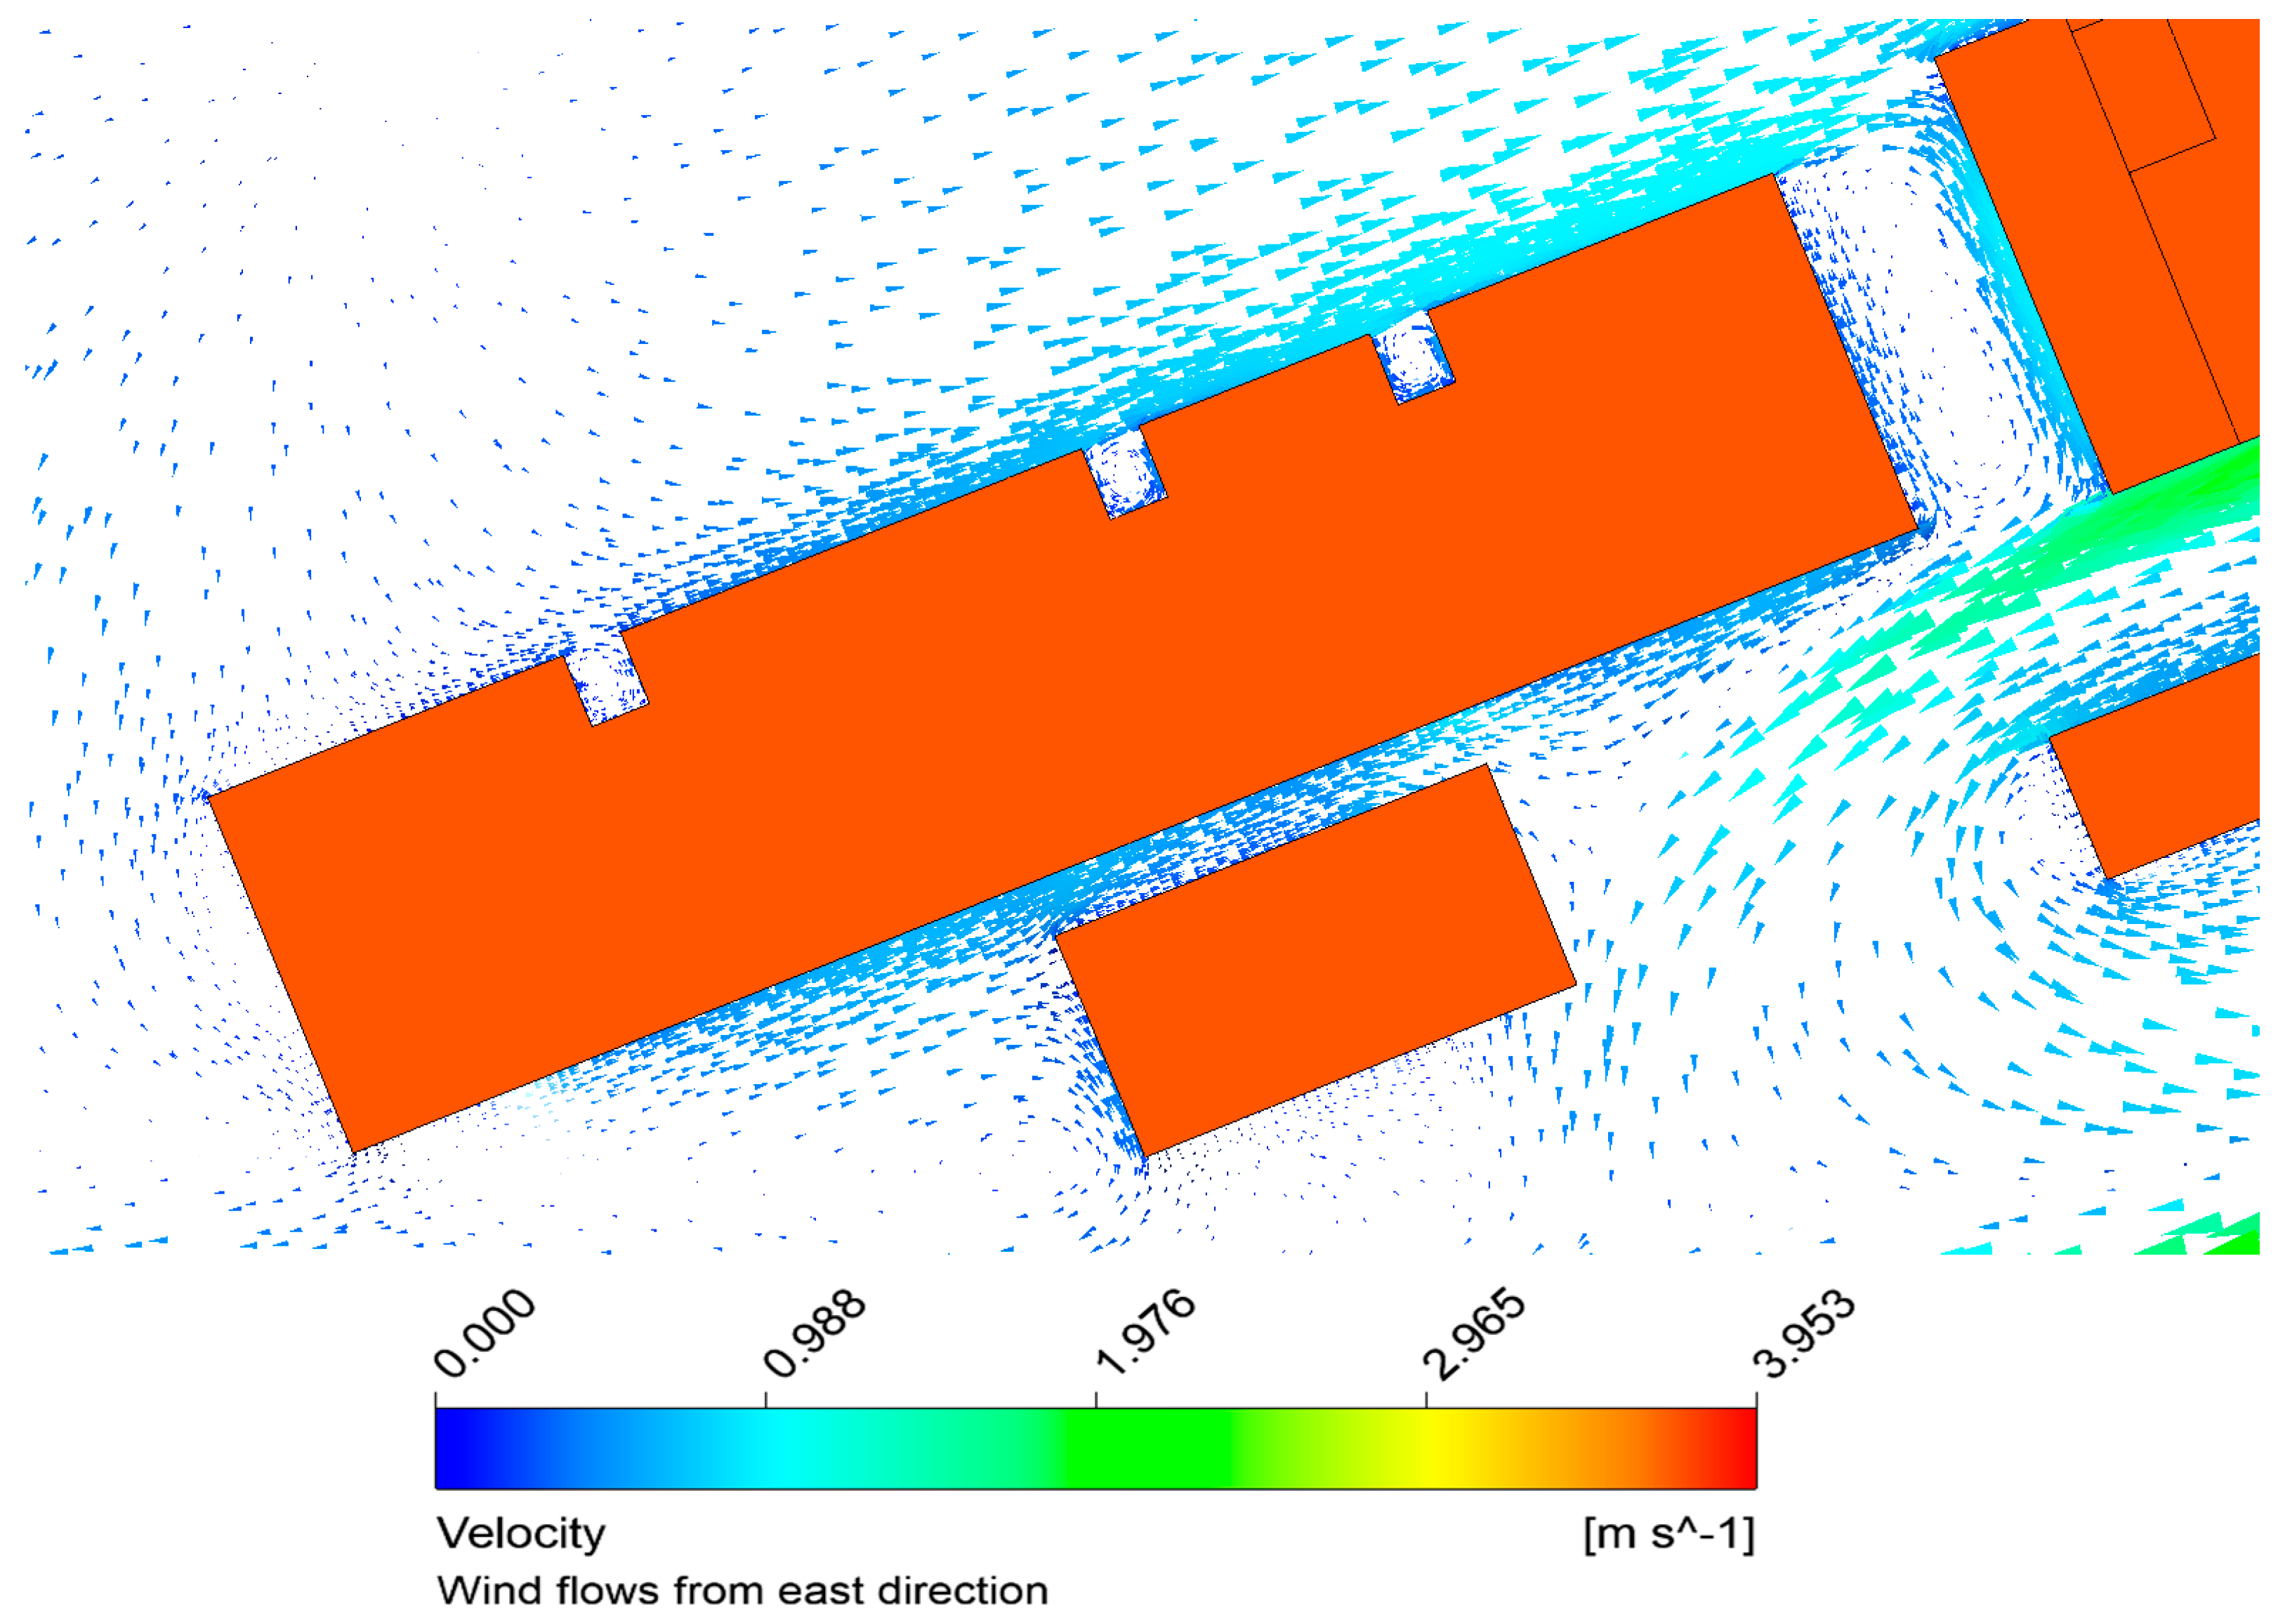
Figure 13 shows the vector contours around the building, which are packed together owing to wind friction on its surfaces.
Figure 13 also shows that the recirculation vortices formed in the upstream flow are characterized by reversed flow (negative axial speed) and low pressure (negative pressure values). This also indicates that these vortices can develop within the walkway, lifting dust and debris, which can degrade the air quality and cause eye or respiratory issues for pedestrians.
3.3. Turbulence Kinetic Energy Distribution
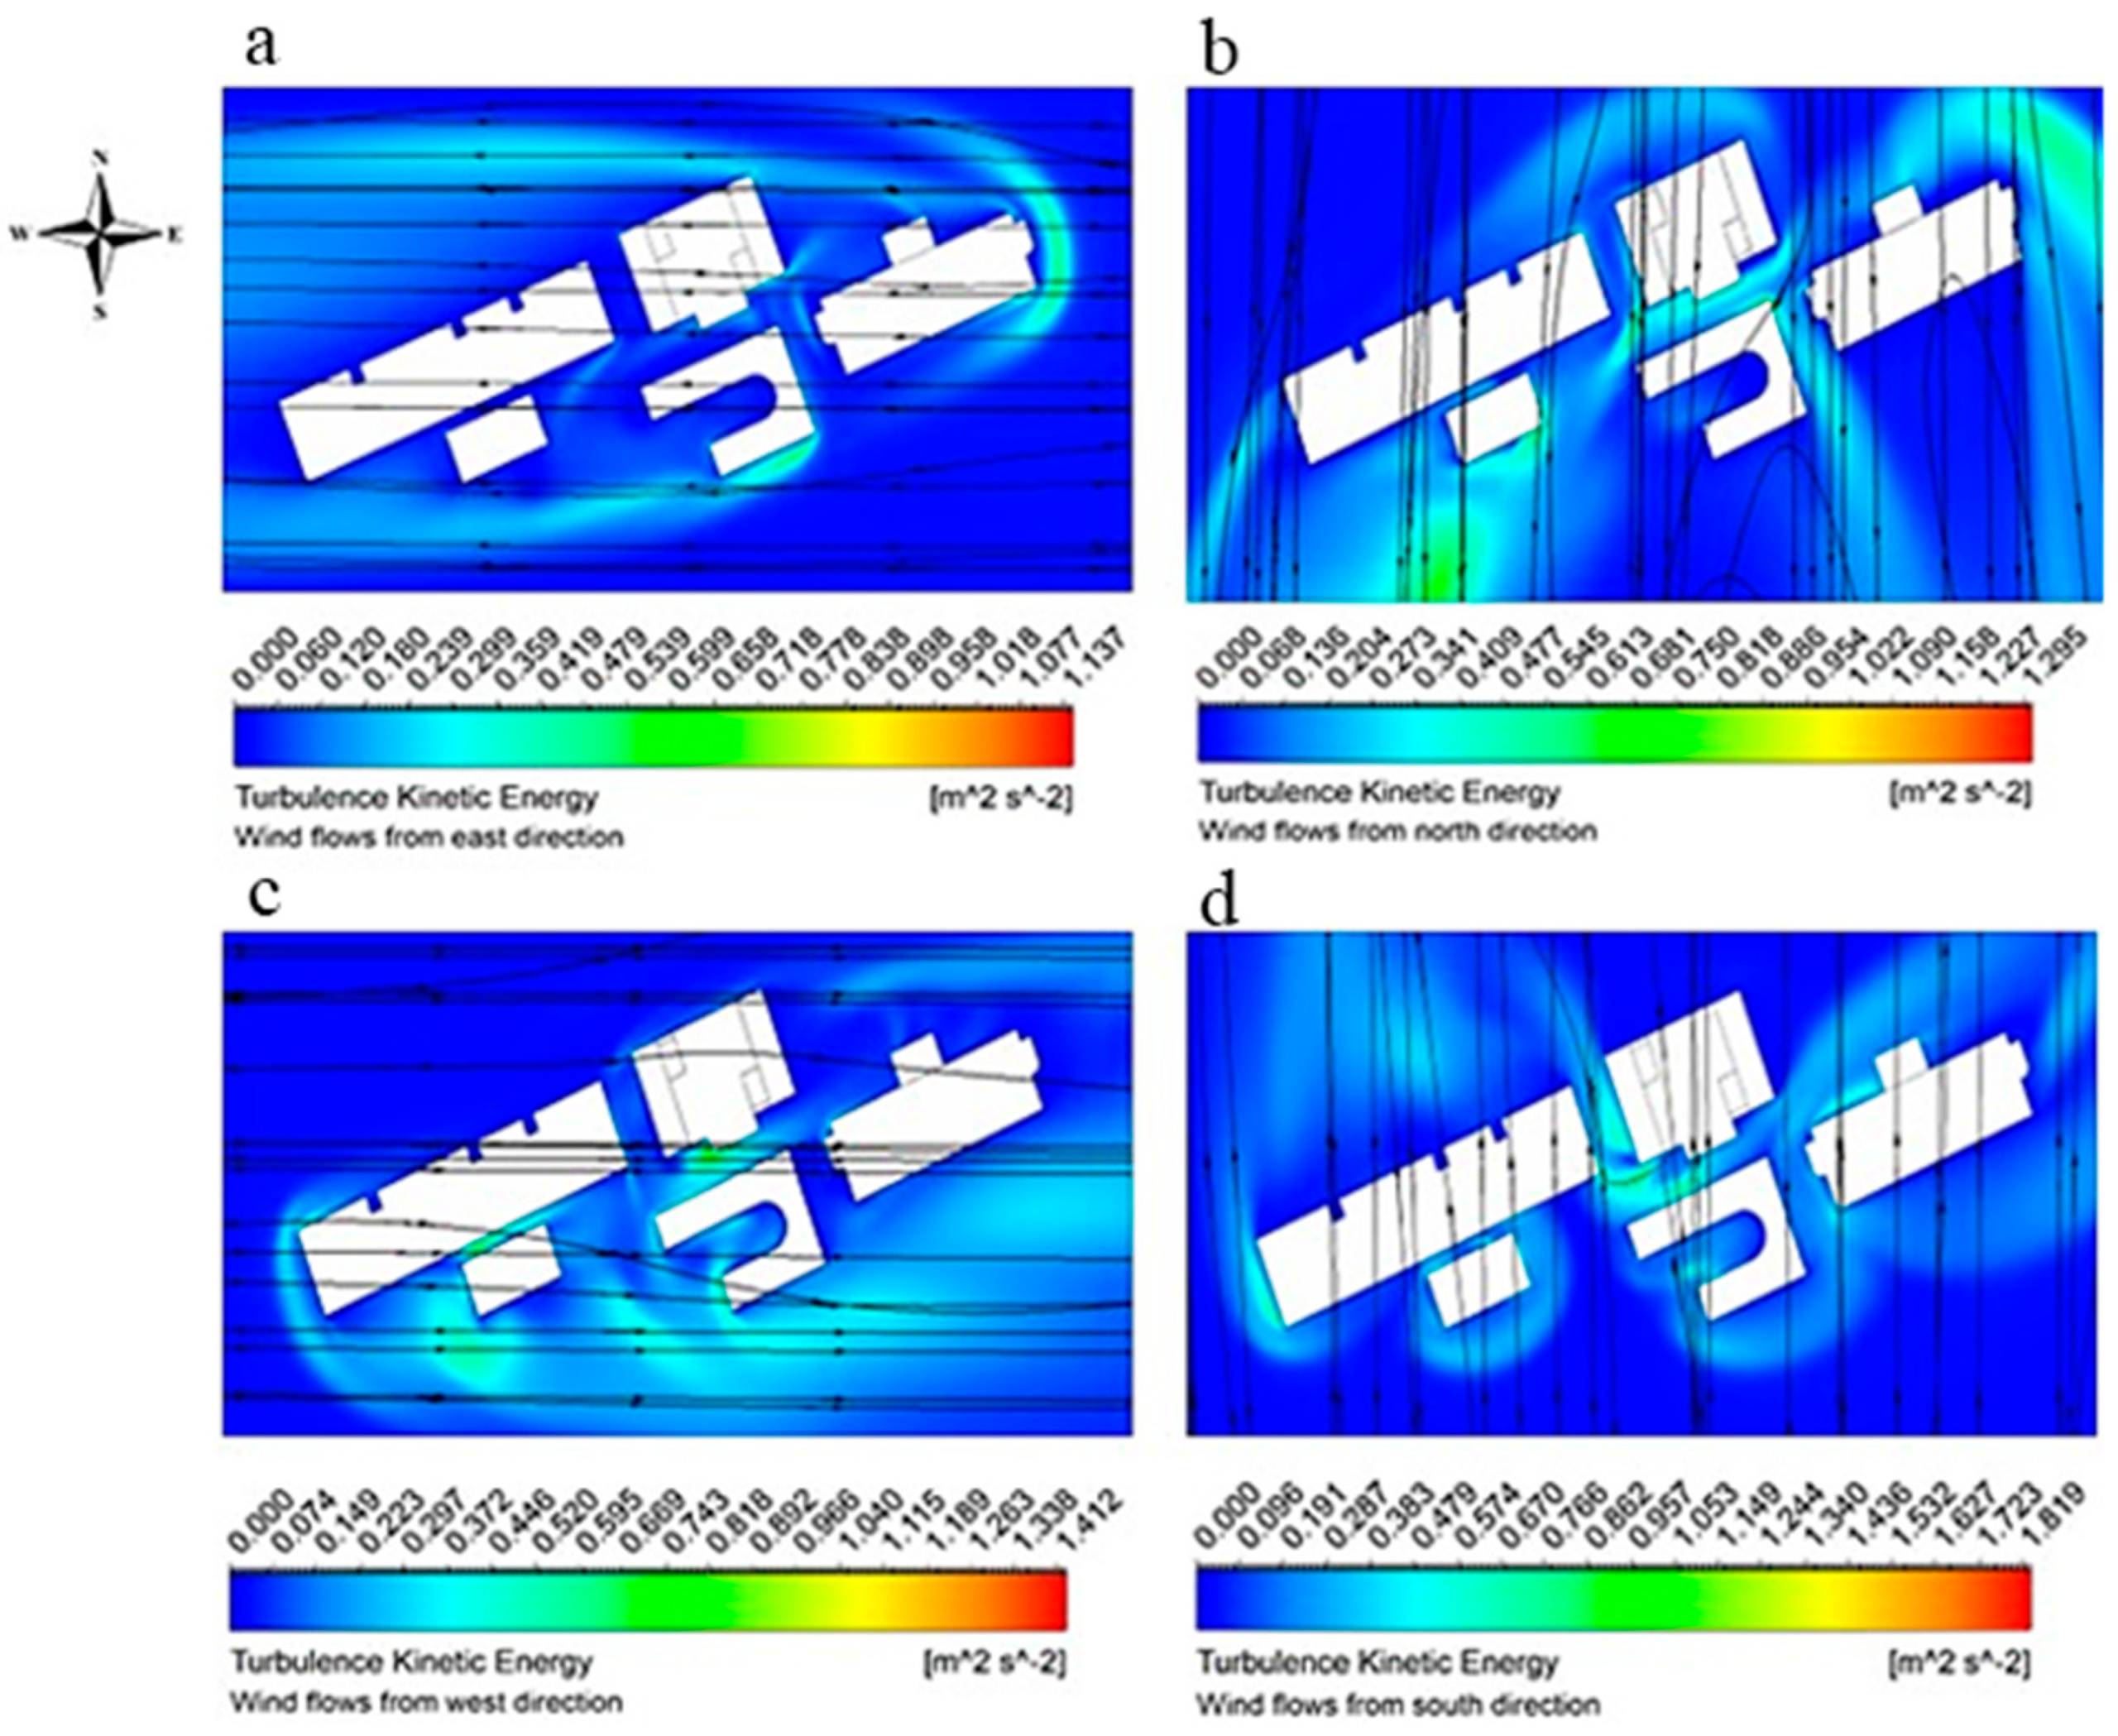
Wind turbulence kinetic energy (TKE) significantly impacts pedestrian comfort and safety. Elevated TKE levels can cause increased wind fluctuations and gusts, which may lead to discomfort, difficulty walking, and even potential hazards, such as being pushed off balance or debris being blown around. These effects are particularly pronounced in urban environments, where buildings and other structures can amplify the turbulence. Studies have shown that high TKE in pedestrian areas can lead to adverse experiences and reduced outdoor activity levels (Blocken et al., 2012b; Mochida and Lun, 2008).
Figure 14 illustrates the streamlines and turbulence kinetic energy contours at a height of 1.75 meters above ground level for a wind speed of 3 m/s from the east (
Figure 14a), north (
Figure 14b), west (
Figure 14c), and south (
Figure 14d).
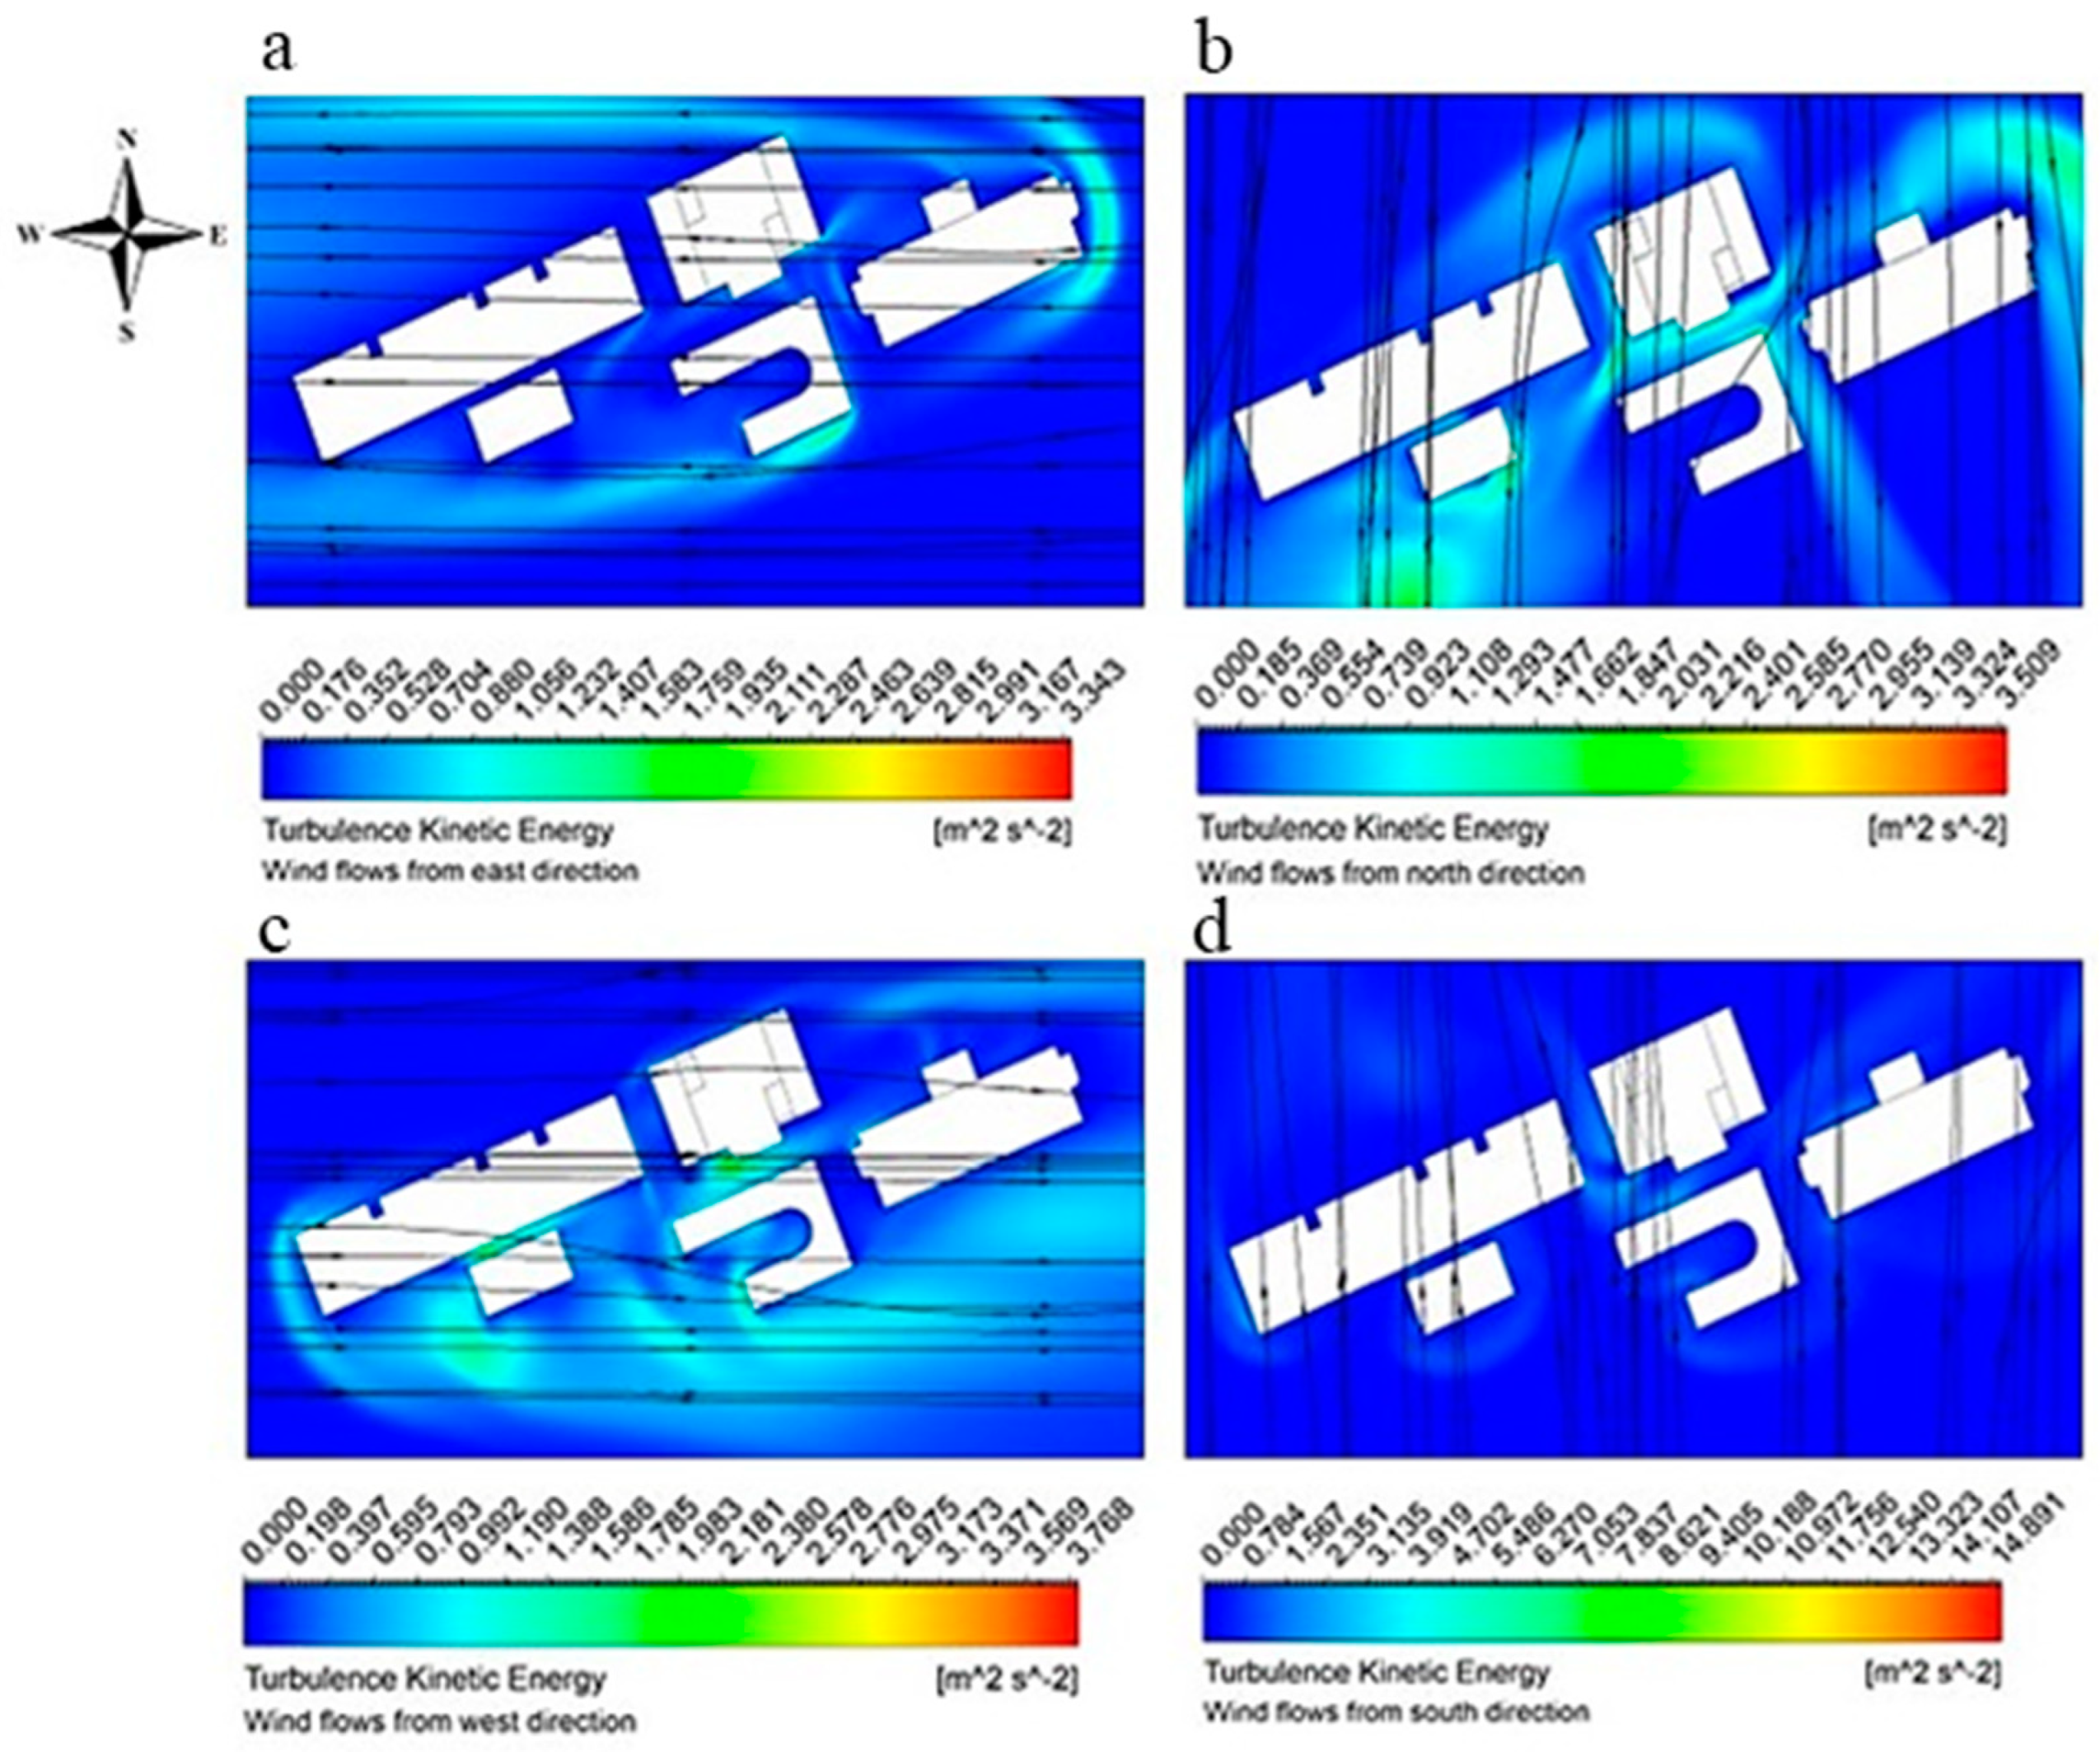
Figure 15 shows comparable data for wind speeds of 5 m/s from east (
Figure 15a), north (
Figure 15b), west (
Figure 15c), and south (
Figure 15d).
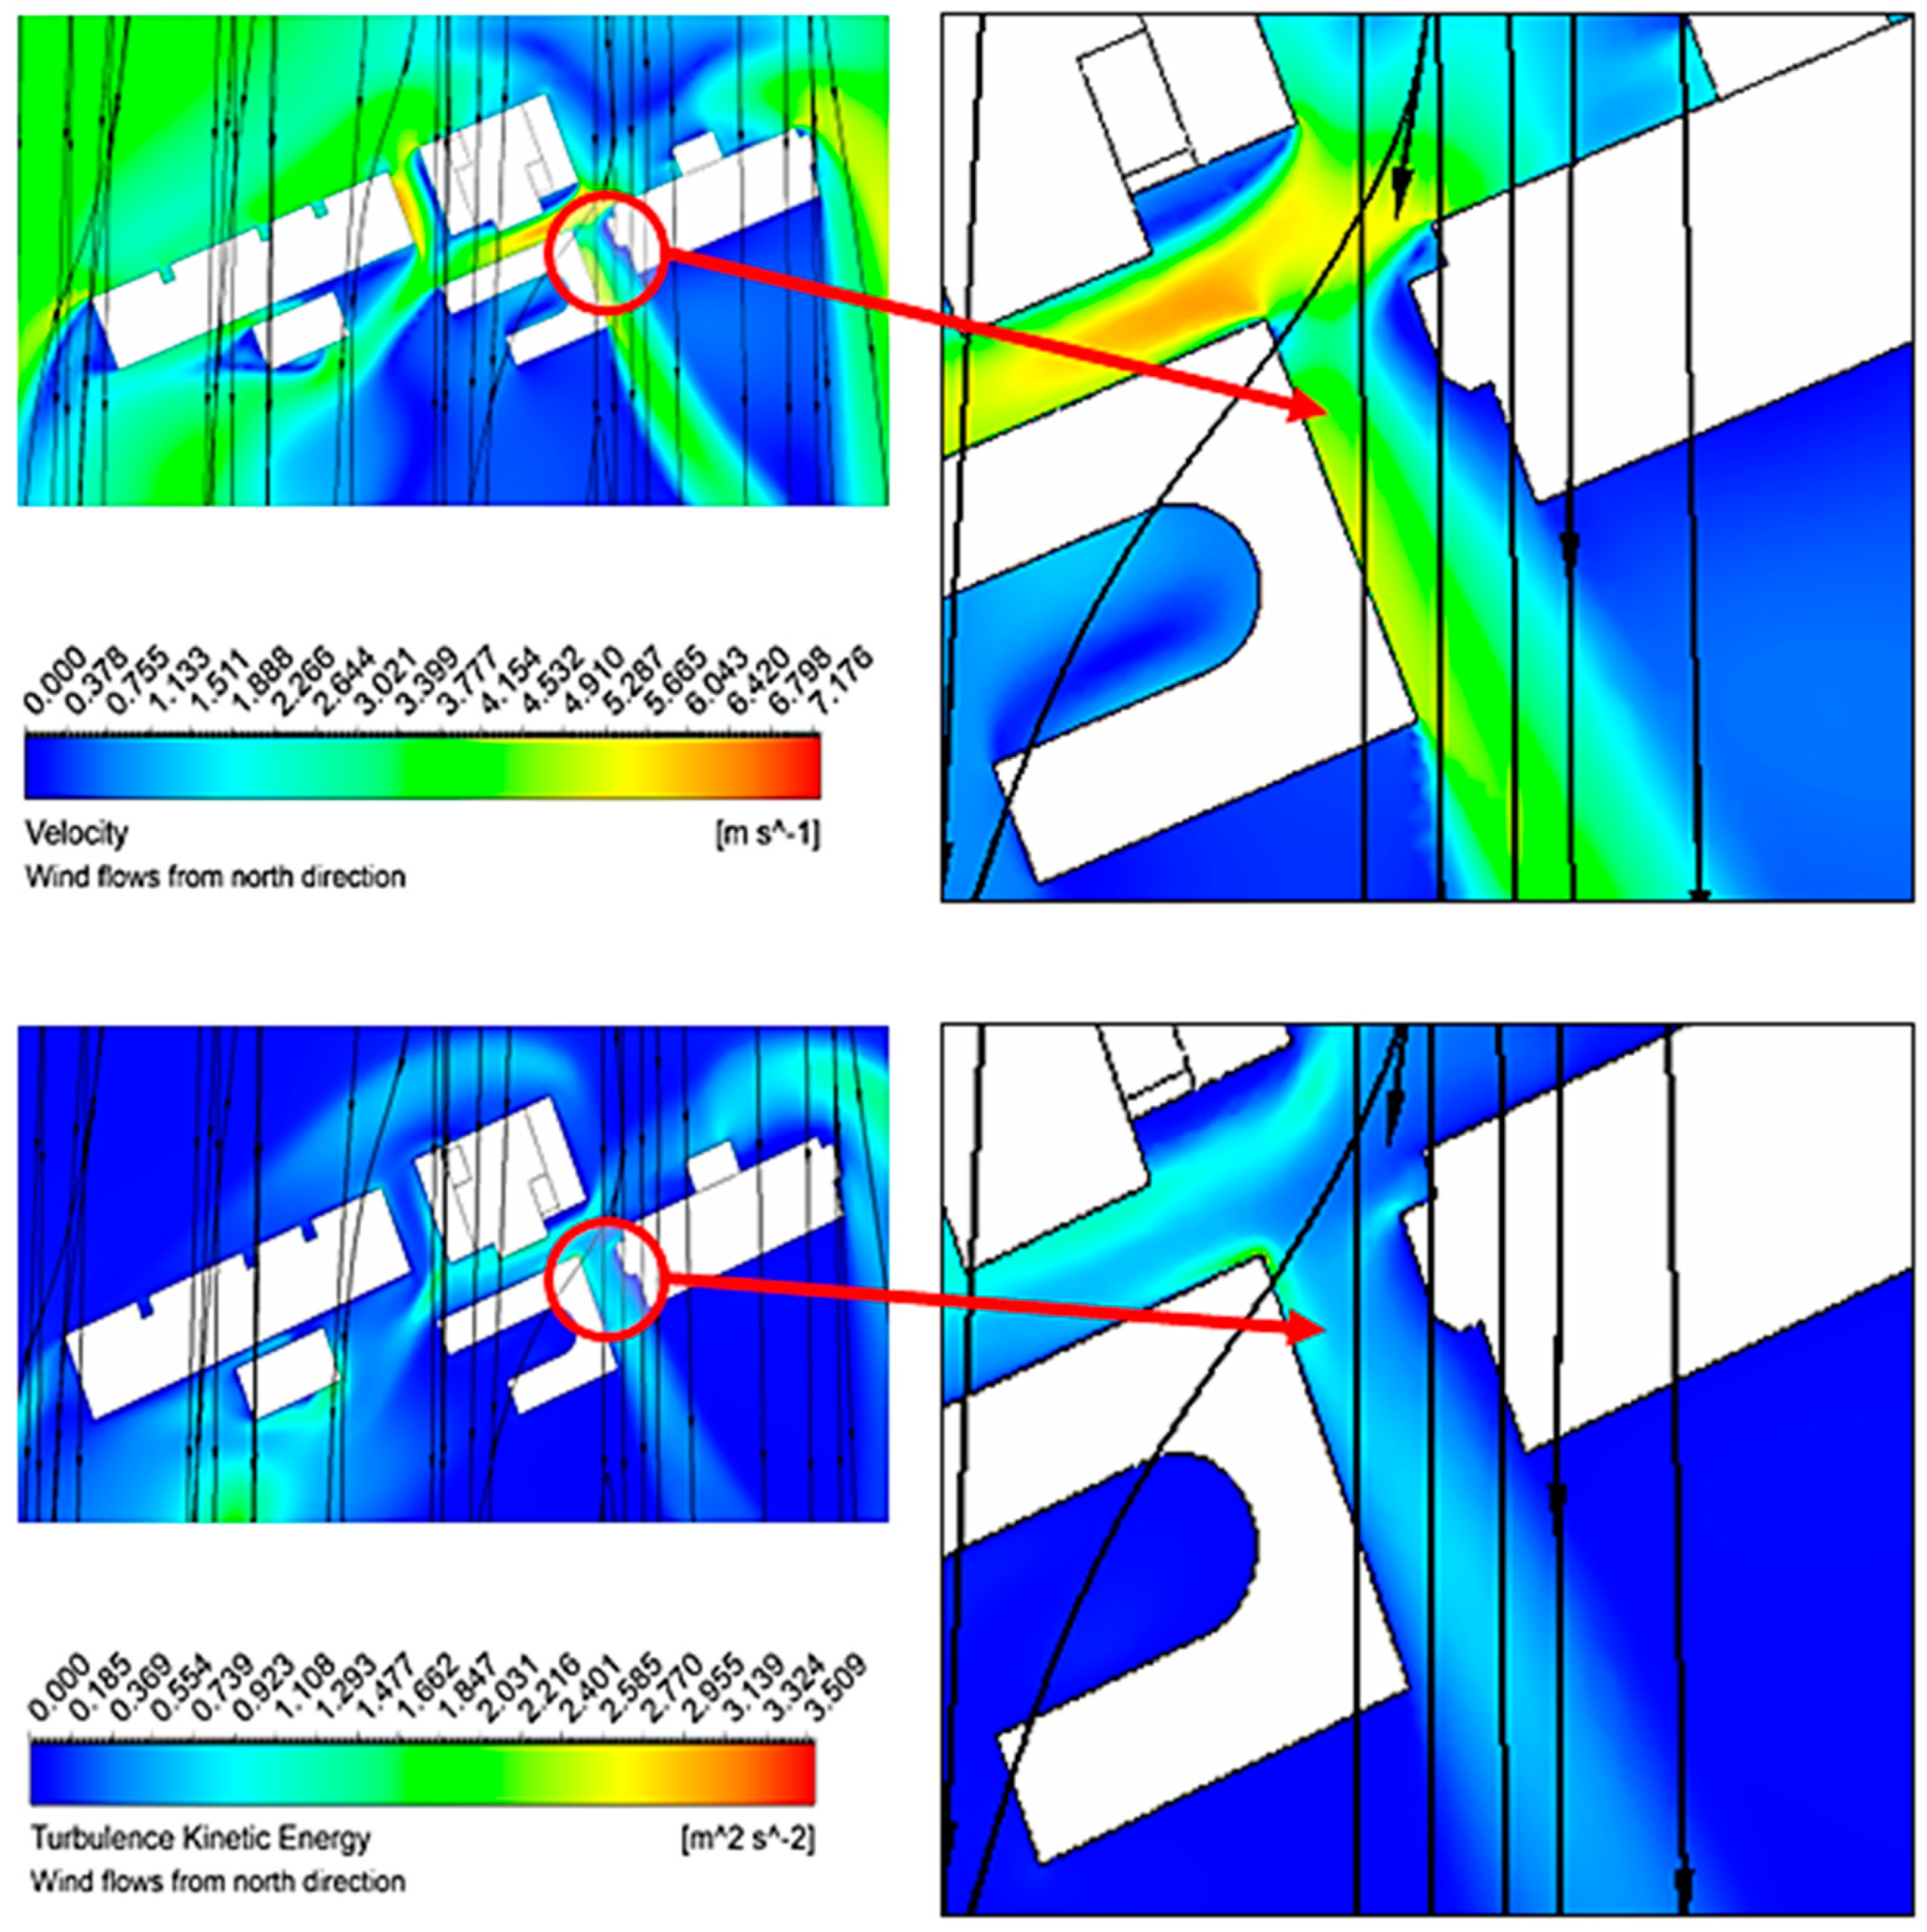
Figure 15 shows a magnified view of the turbulence kinetic energy (TKE) in the northern direction at a wind speed of 3 m/s.
As shown in
Figure 14 and
Figure 15, despite the sheltering effects of buildings reducing the mean wind speed, walkways in urban environments can exhibit amplified levels of turbulence kinetic energy. This phenomenon arises from complex aerodynamics, as winds interact with building geometries, inducing strong shear layers and vortex shedding. Consequently, although the overall velocities may be diminished, intensified turbulence contributes to elevated fluctuations and intermittent gusting.
However, as shown in
Figure 16, the mean air velocity in Walkway 3 was lower than that inlet air velocity. However, the TKE contour revealed that walkway-3 experienced significantly higher turbulence kinetic energy, measuring 0.739 m²/s². This elevated TKE can lead to discomfort and safety issues for the pedestrians.
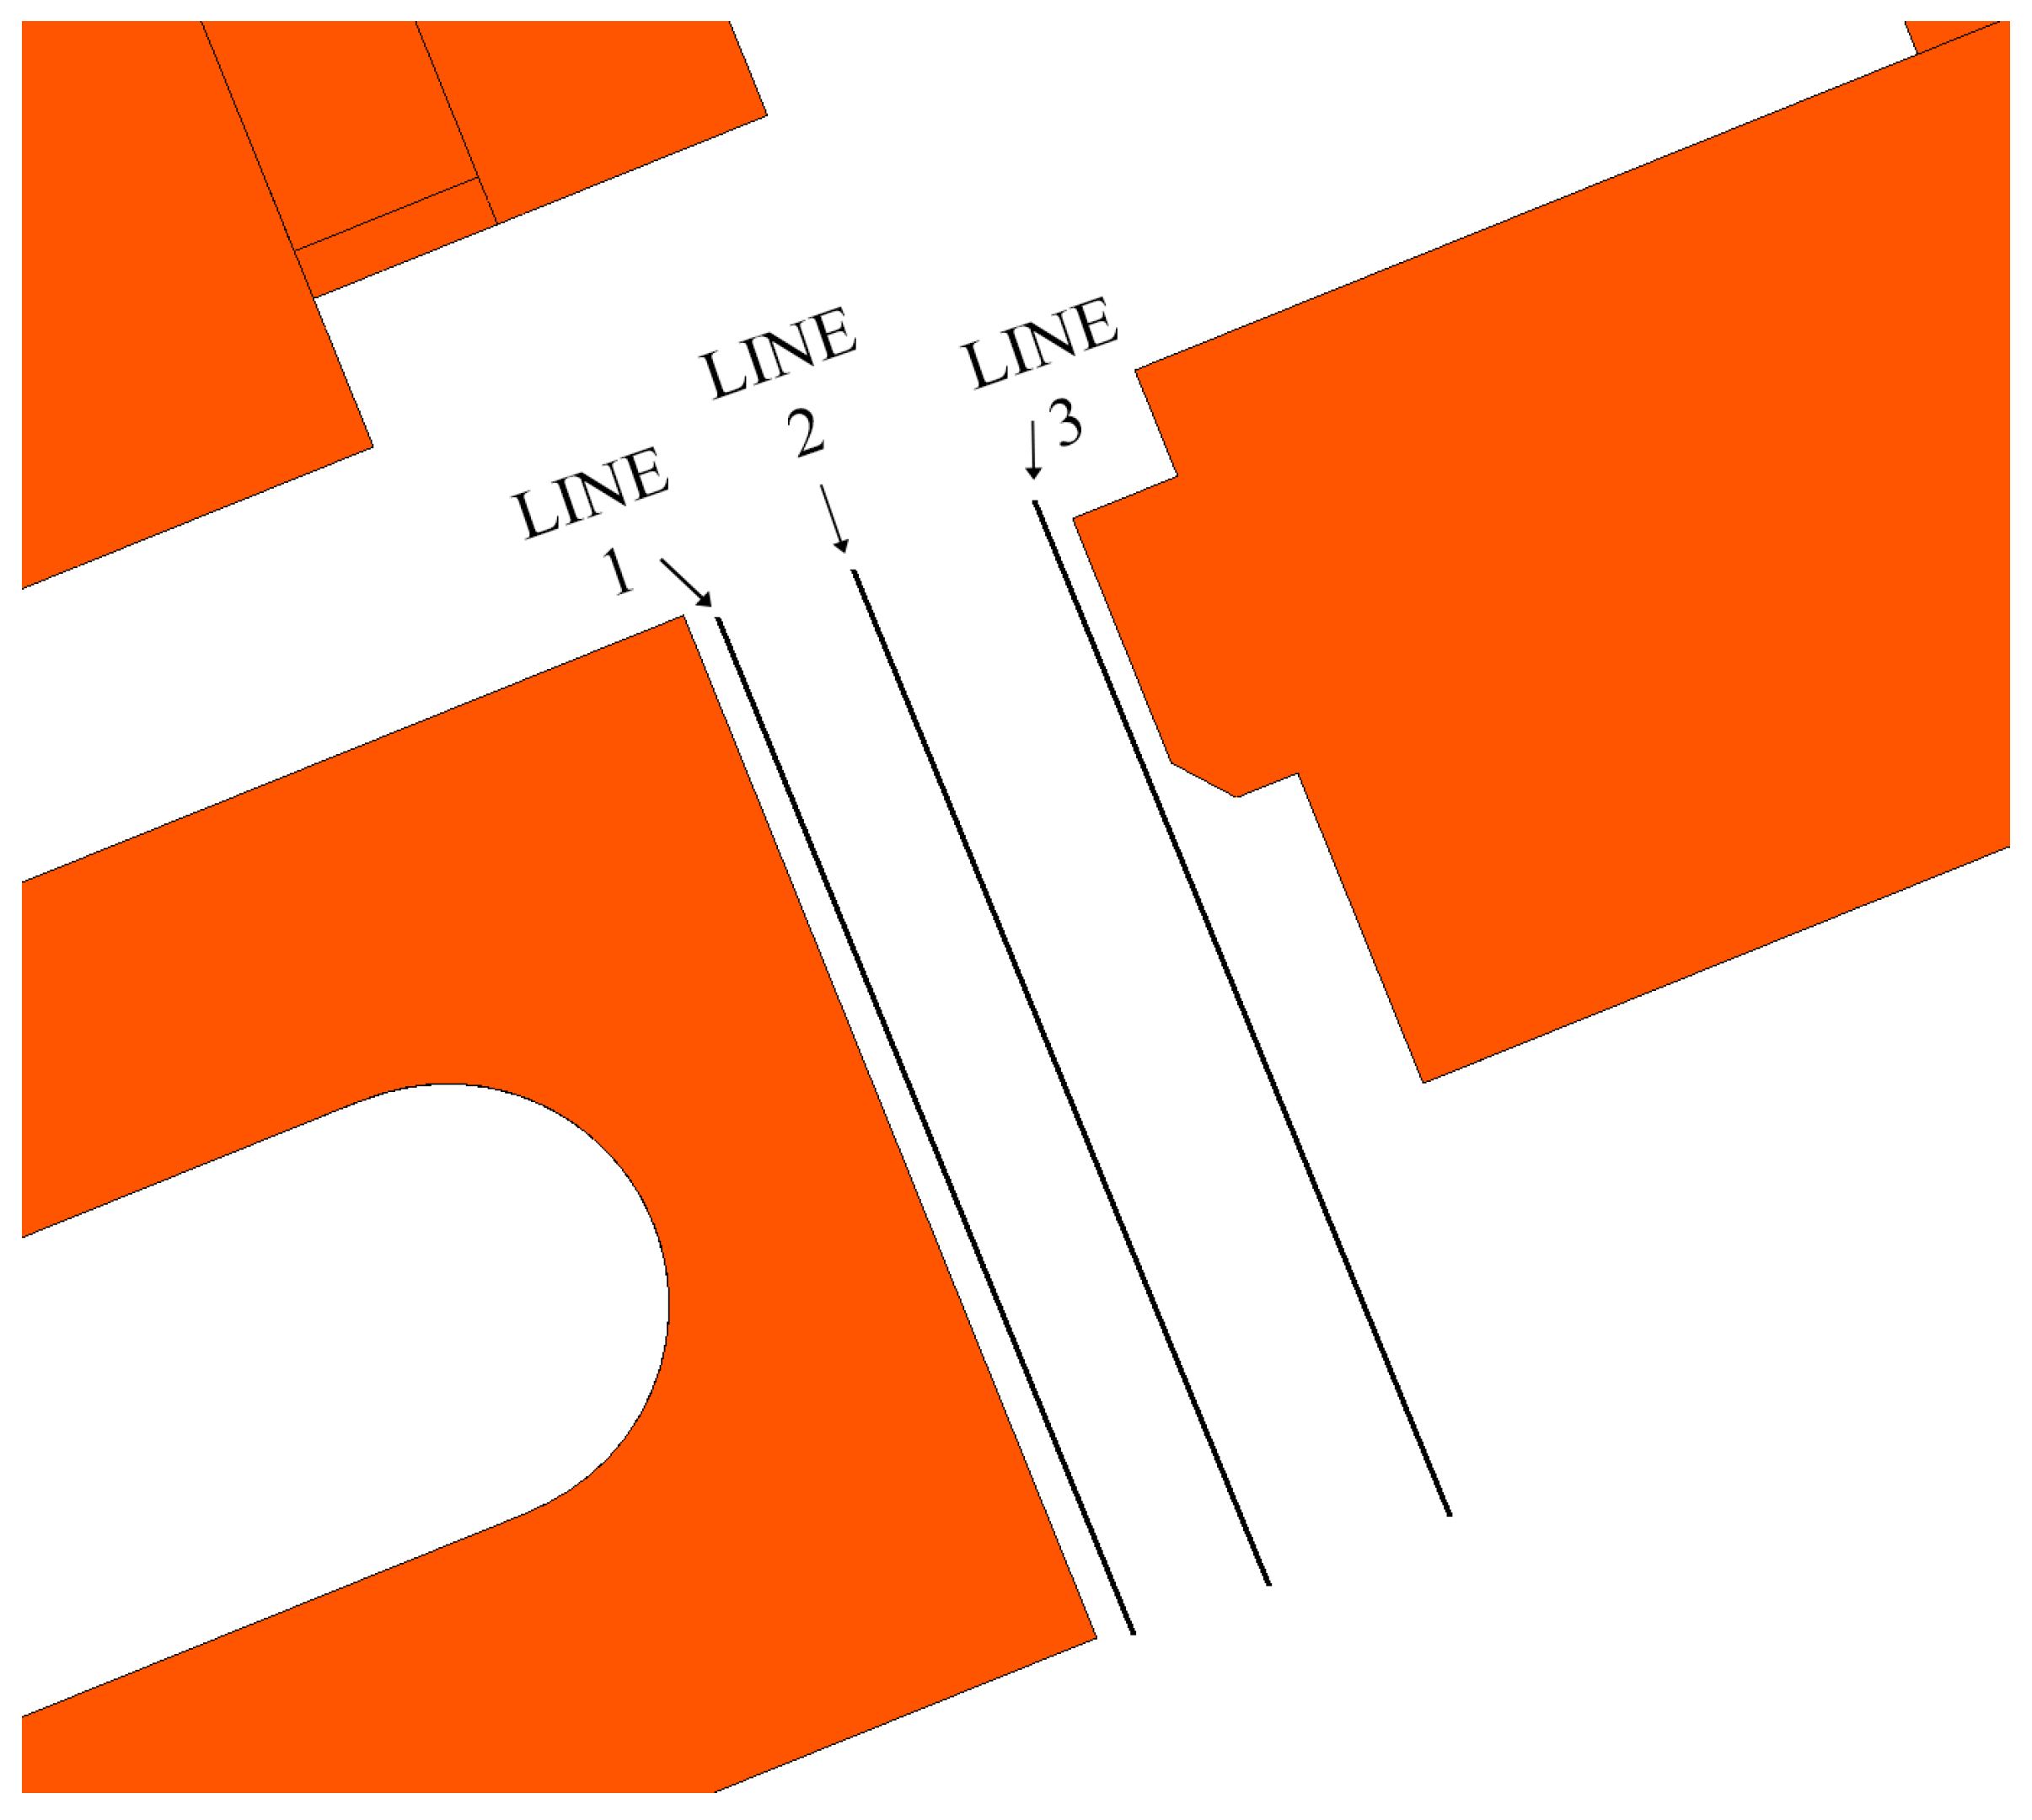
For an inlet velocity of 5 m/s, a higher TKE was observed for walkway-3, which can cause significant problems for pedestrians. For further analysis, three parallel lines were created, as illustrated in
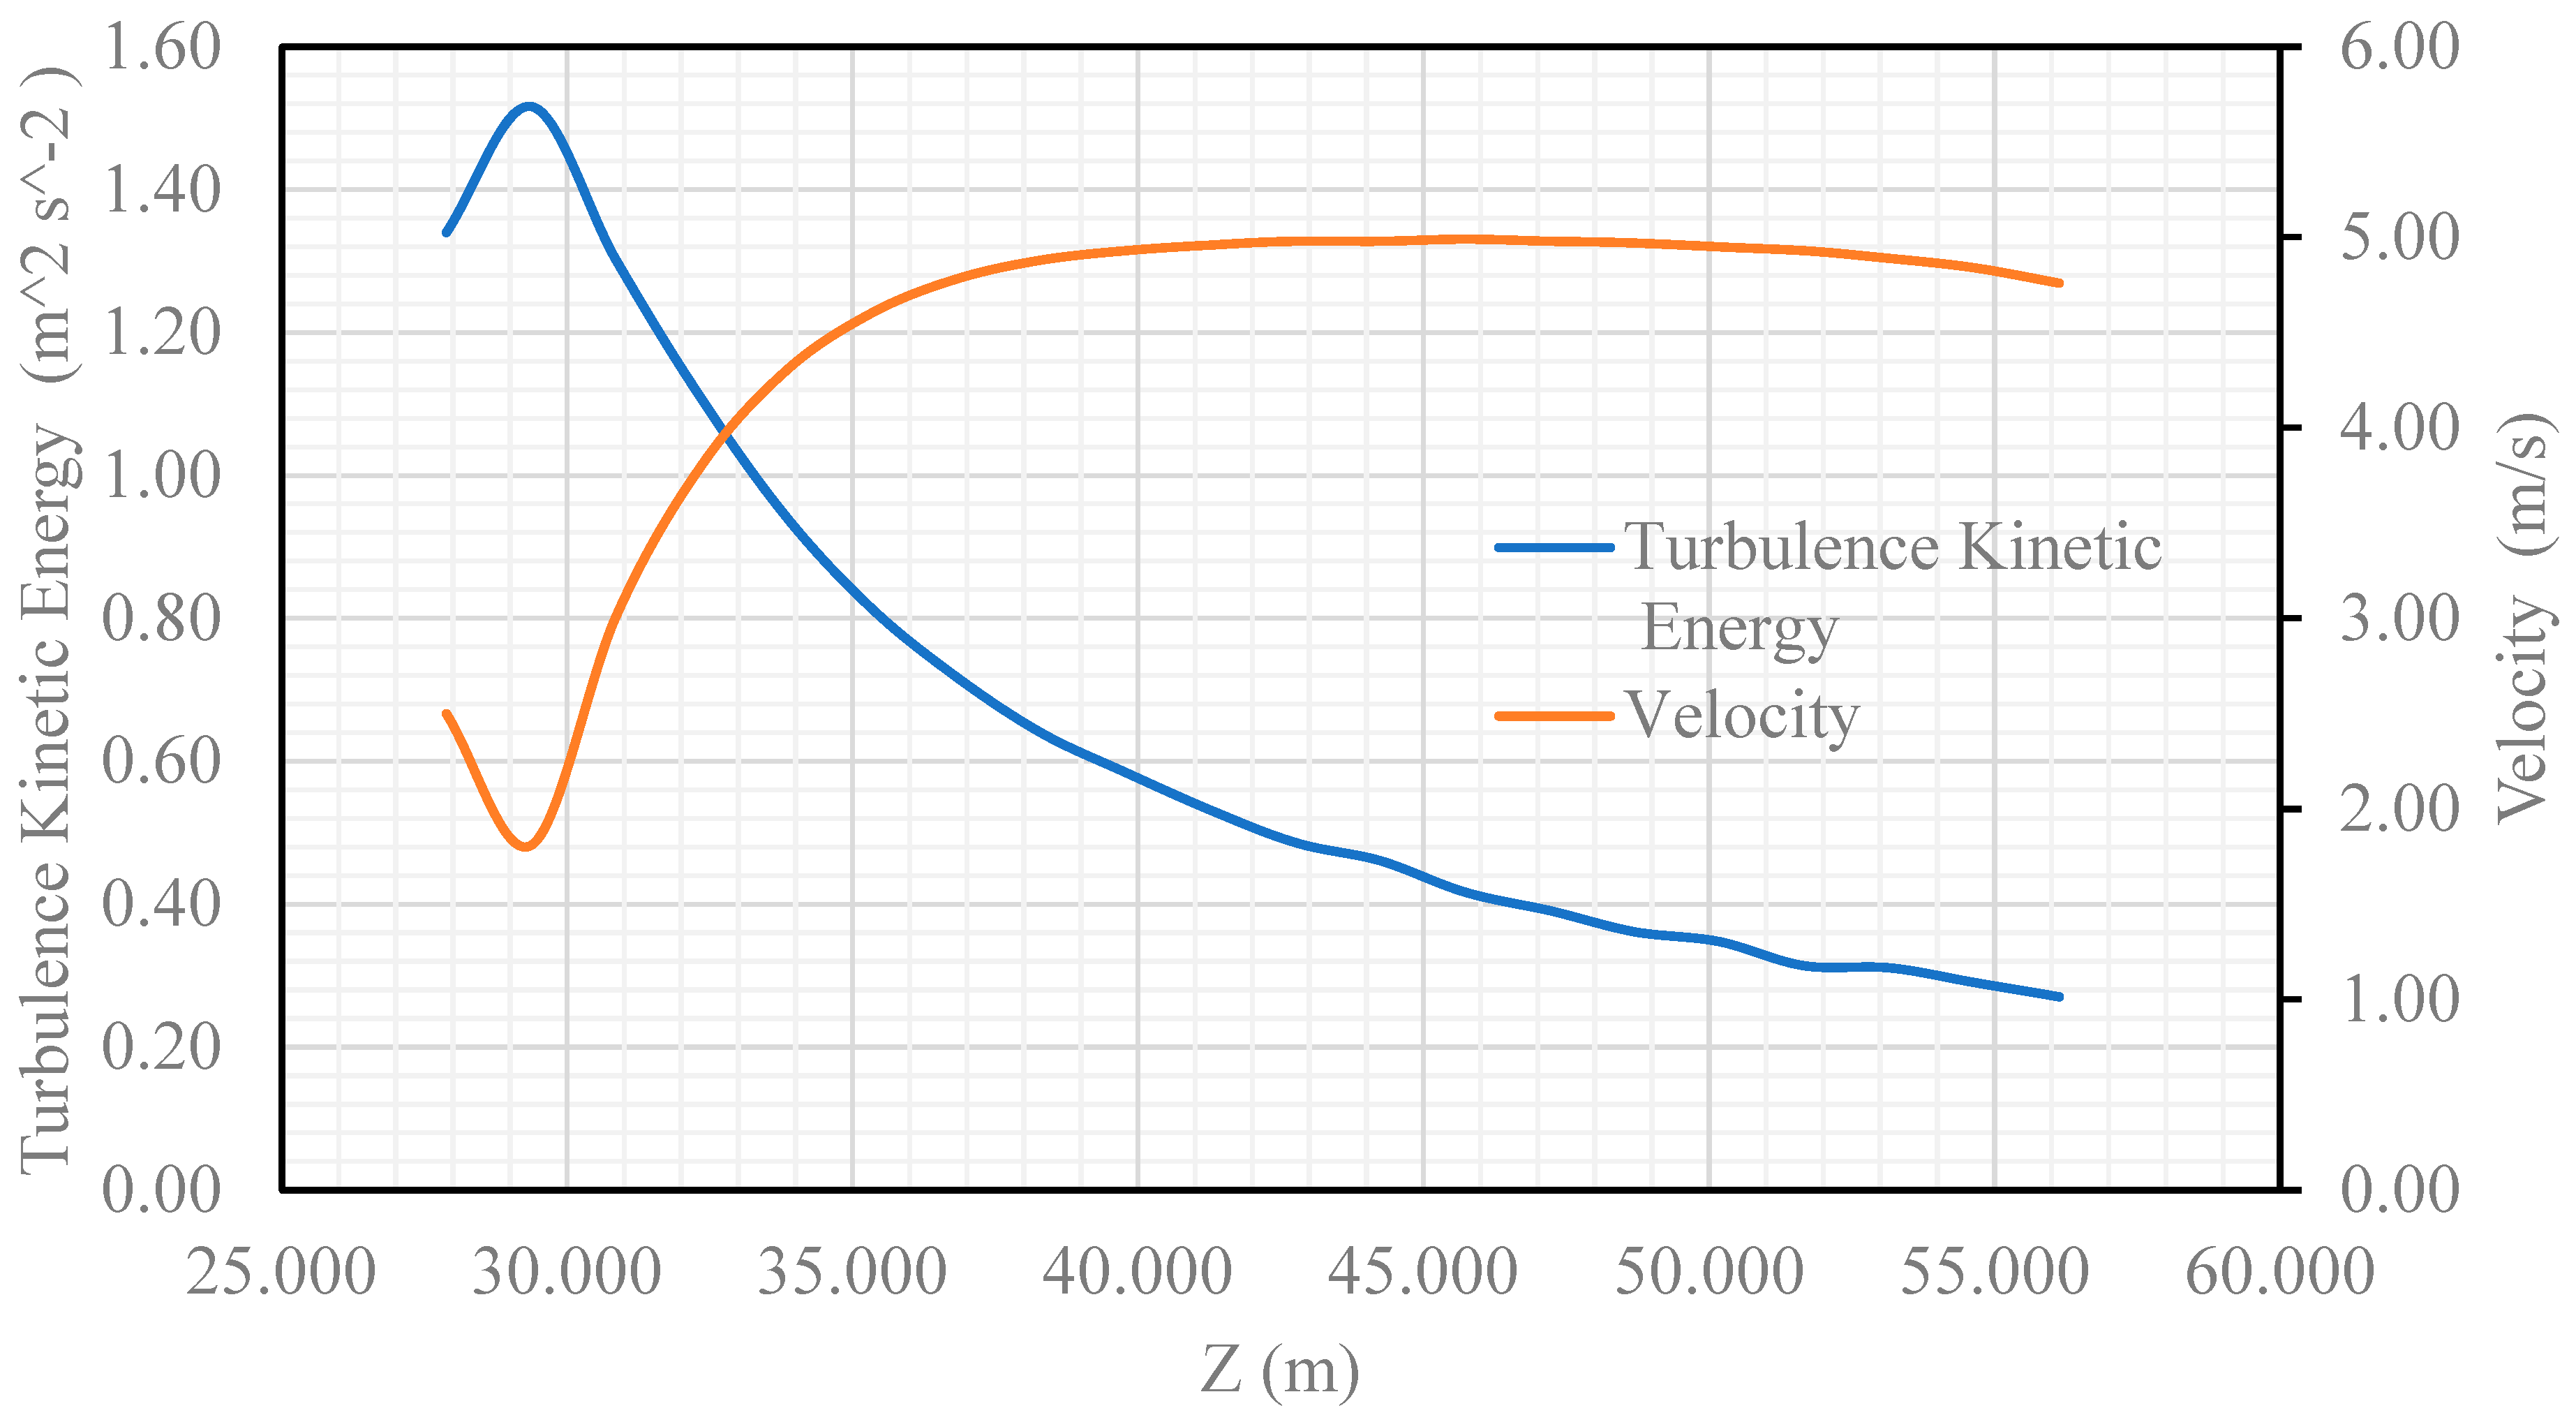
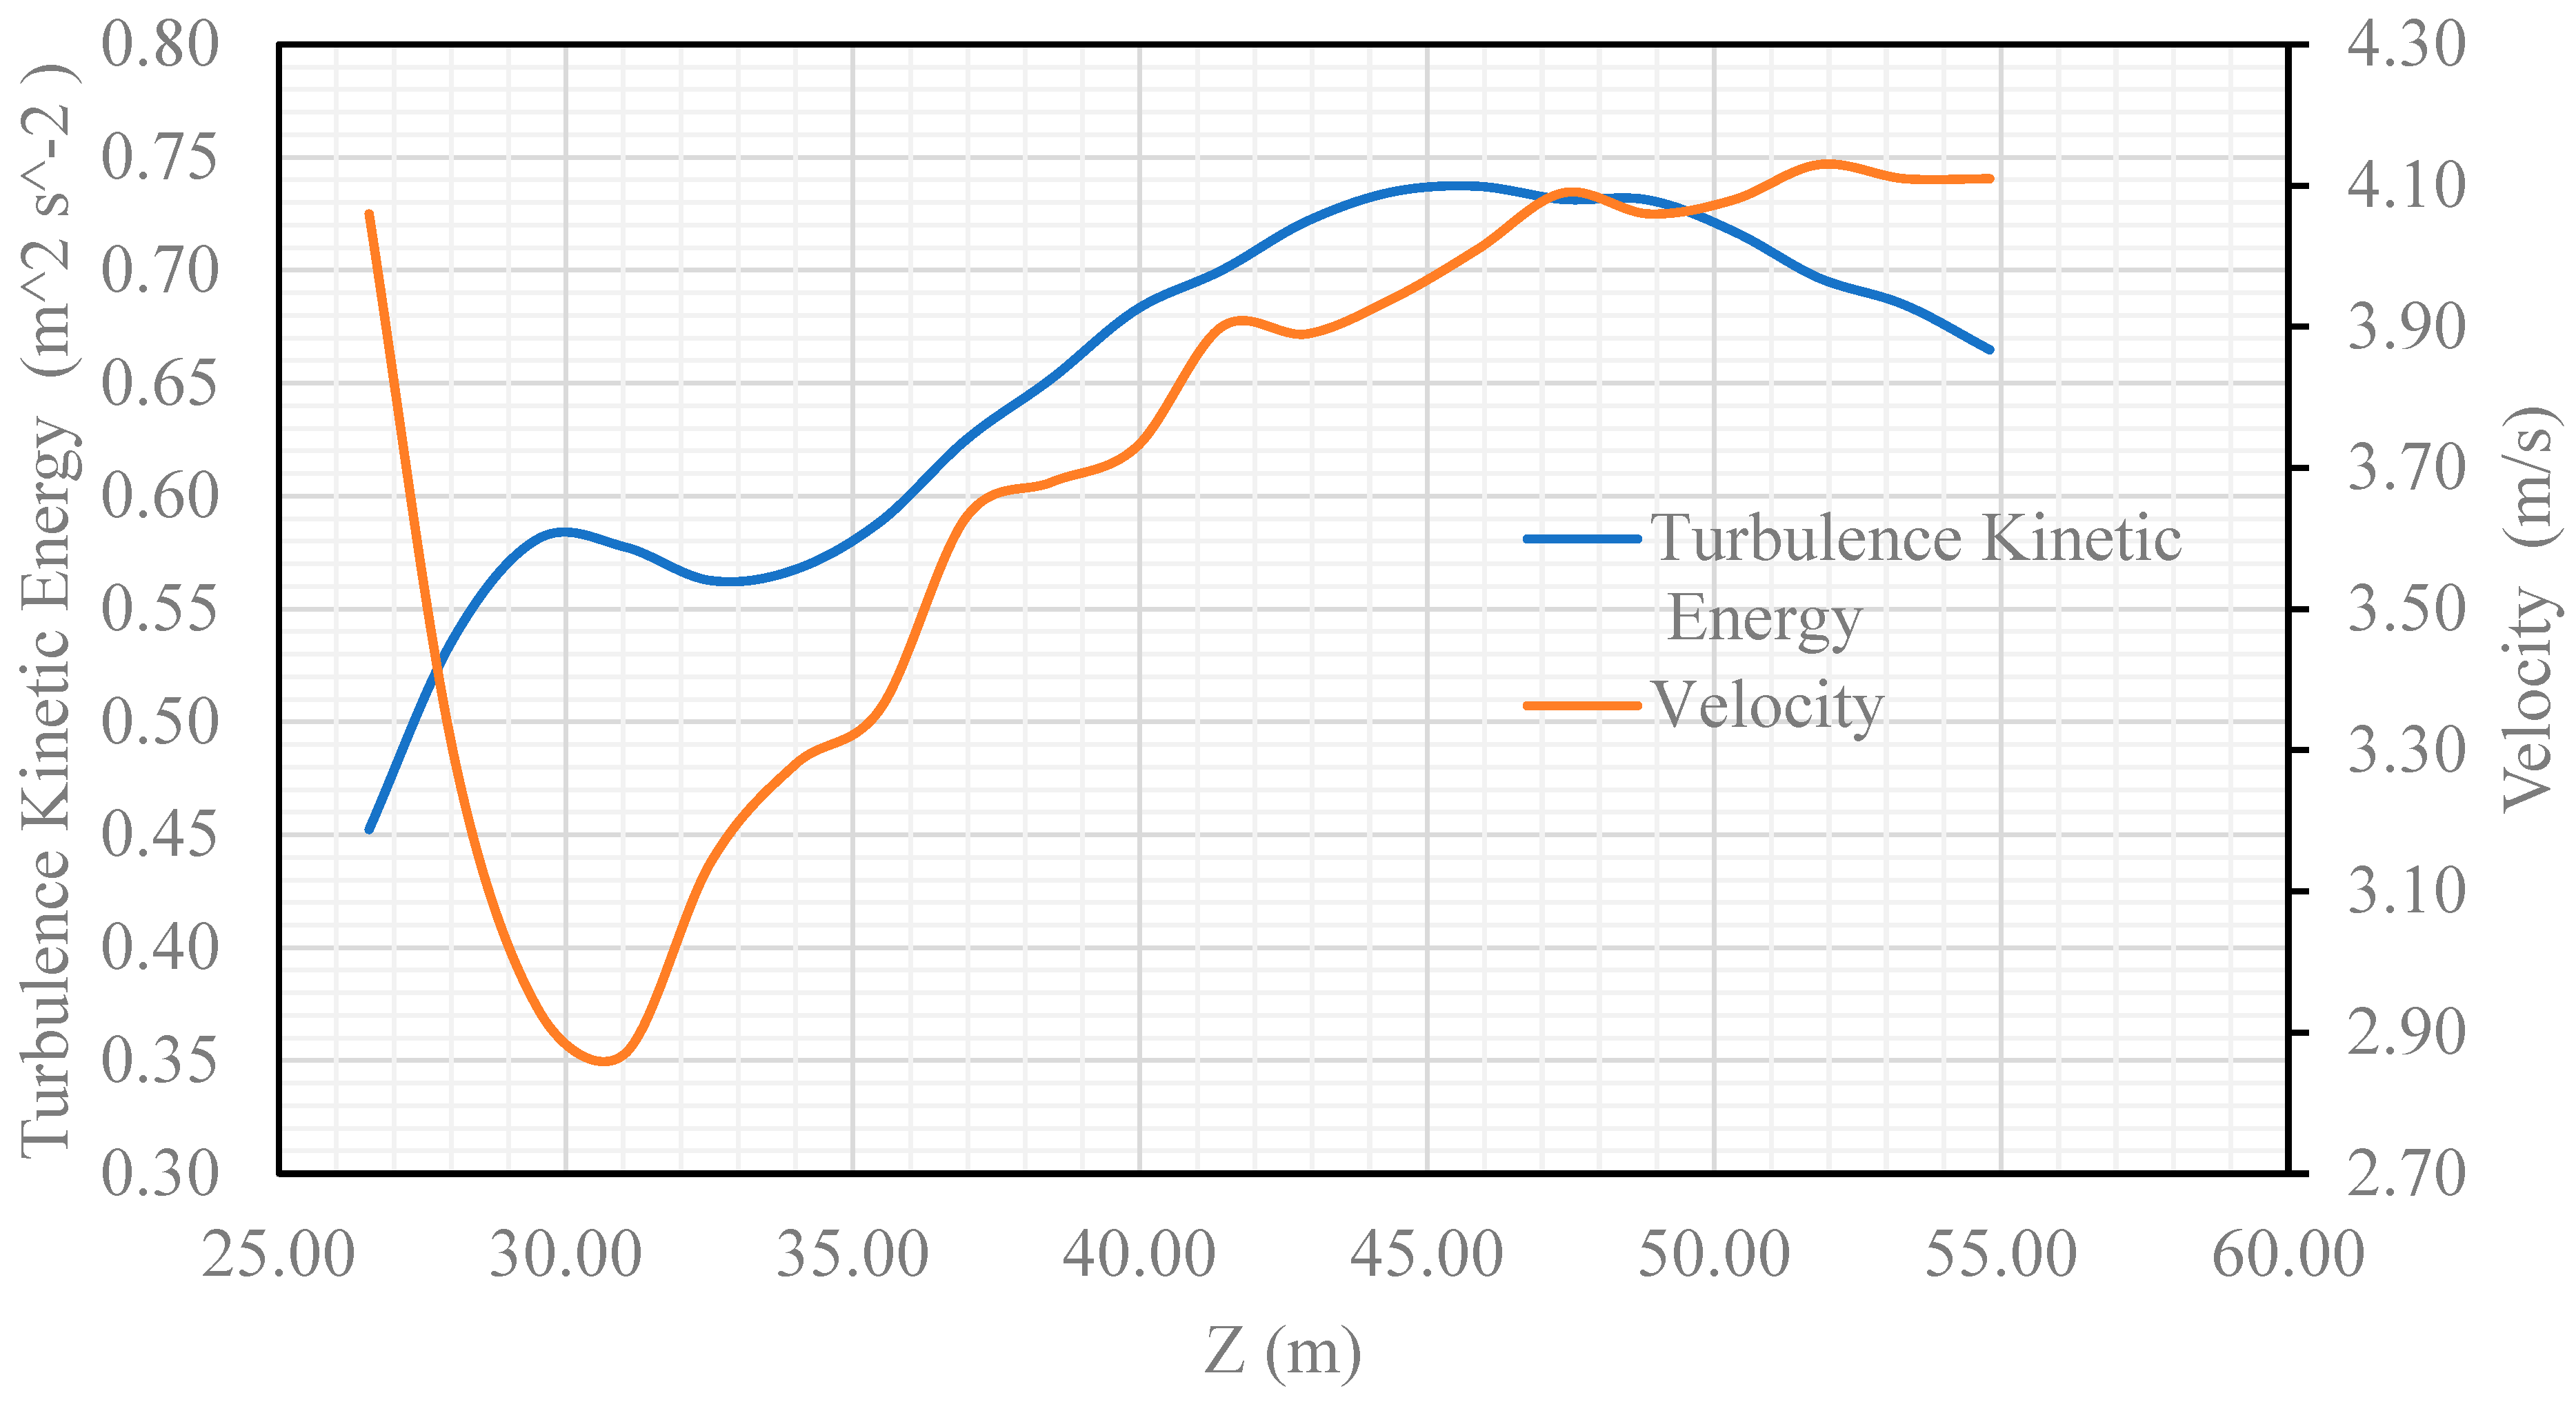
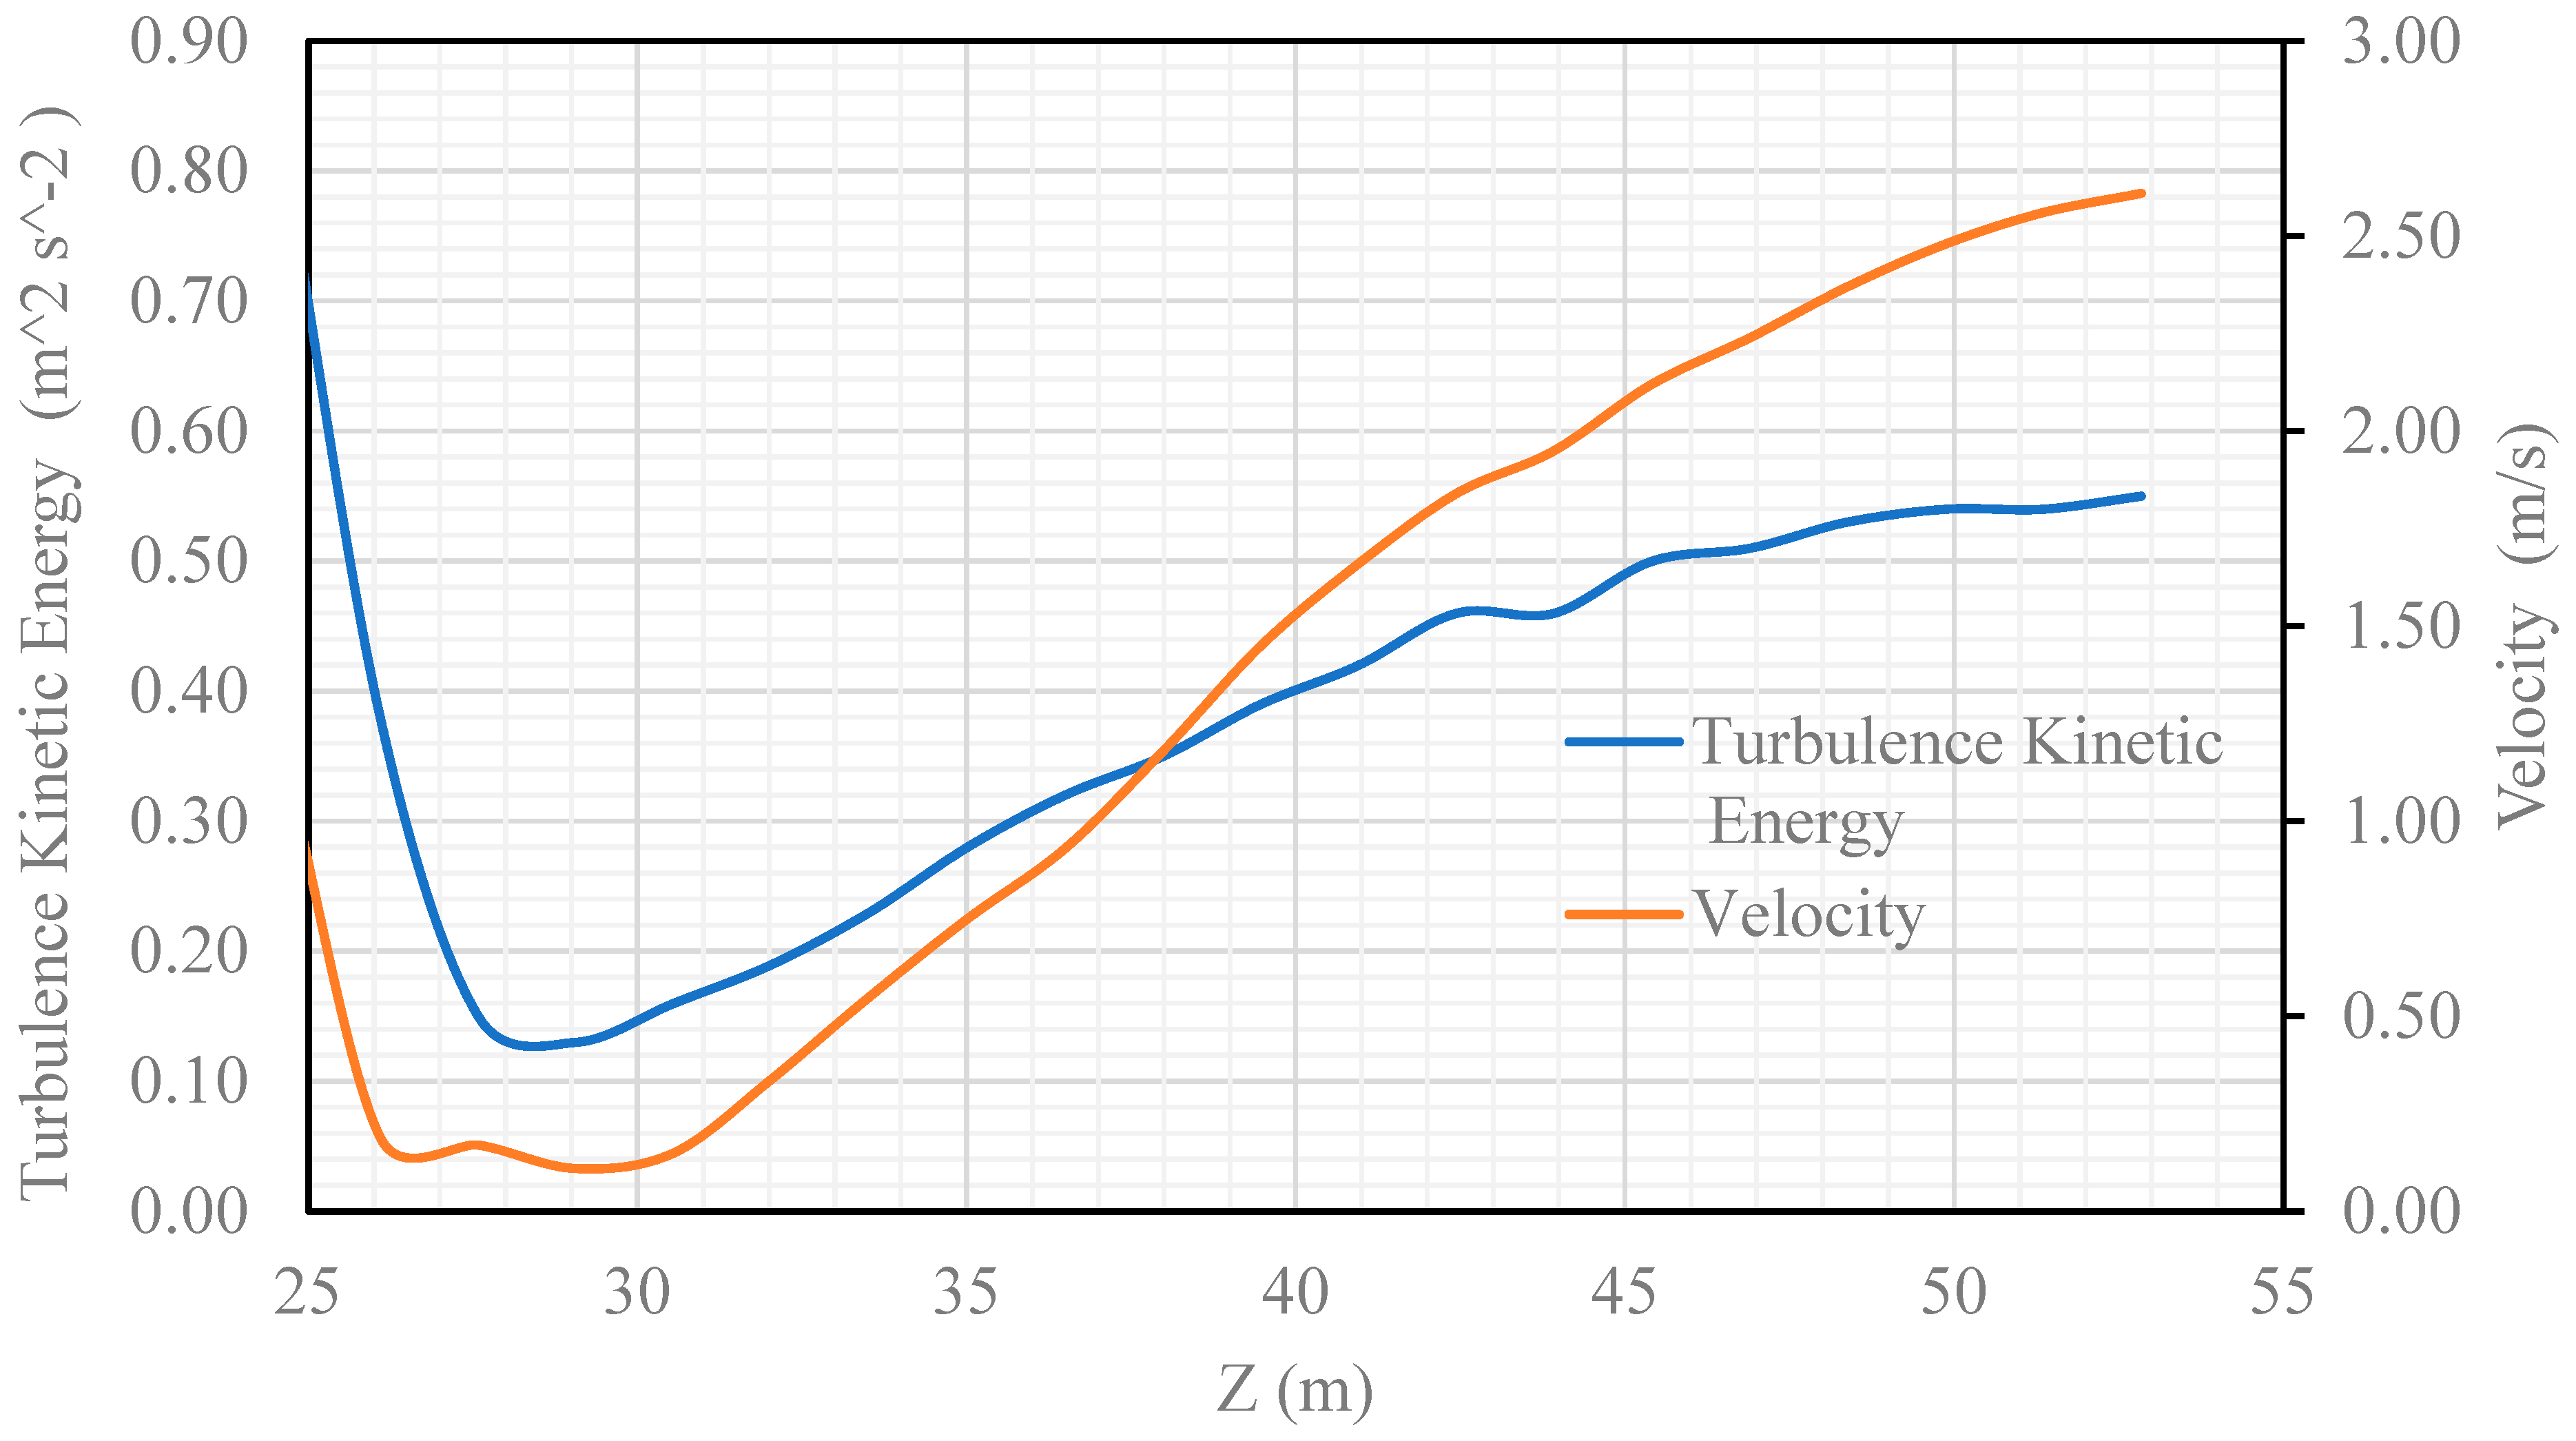
Figure 17. The TKE and wind velocity were measured along parallel lines. The results for lines 1, 2, and 3 are plotted in
Figure 18,
Figure 19 and
Figure 20, respectively. It can be seen from the figures that the TKE is significantly higher in some positions. Especially in line 1, the maximum TKE observed is 1.52 m
2 s
-2 which is considerably higher than the 0.5 m
2 s
-2 which is the maximum value of TKE suggested in (Lawson TV., 1978)In this position, the velocity is 1.81 m/s, which is lower than the inlet velocity 5 m/s lower than inlet velocity 5 m/s. It is shown in all three lines that a TKE higher than 0.5 m2s-2 with a lower velocity than the uncomfortable wind velocity of 7.8 m/s as suggested in (Lawson TV., 1978)
4. Conclusion
This study demonstrated the effect of wind on pedestrian comfort and safety in narrow walkways between high- and moderate-tall buildings, particularly on the DUET main campus. The impacts of wind velocity and TKE on pedestrian wind comfort and safety on the DUET main campus were revealed through the analysis. These findings underscore the importance of analyzing wind flow fields and building aerodynamics for pedestrian comfort and safety. In addition, the vertical profile of the streamwise wind speed was validated with existing observations, and it was found that the vertical profile of the streamwise wind speed corresponded well with existing observations. The main findings of this study are as follows:
- a)
The wind speed at the building corners increased compared to the air inlet velocity. In addition, the wind speeds in the walkways among the buildings were found to vary. On the contrary, the air velocity on the leeward sides of the buildings was significantly lower than the air inlet velocity.
- b)
The velocity vectors surrounding the building were densely packed. The recirculation vortices formed in the upstream flow were characterized by reversed flow (negative axial speed) and low pressure (negative pressure values). This also indicates that these vortices can develop within the walkway, lifting dust and debris, which can degrade the air quality and cause eye or respiratory issues for pedestrians.
- c)
Walkways in urban environments can exhibit amplified levels of turbulence kinetic energy. This phenomenon arises from complex aerodynamics, as winds interact with building geometries, inducing strong shear layers and vortex shedding. Consequently, although the overall velocities may be diminished, intensified turbulence contributes to elevated fluctuations and intermittent gusting.
Author Contributions
Conceptualization: Mohammad Zoynal Abedin, Md. All Amin Sumon. Methodology: Md. All Amin Sumon, Rafiqul Islam Reja, and Shamim Hasan. Formal analysis and investigation: Md. All Amin Sumon, Rafiqul Islam Reja, Ashif Imdad, Md. Rajib Hamam. Writing-original draft preparation: Mohammad Zoynal Abedin, Md. All Amin Sumon, Rafiqul Islam Reja, Md. Rajib Hamam. Writing – review and editing: Mohammad Zoynal Abedin and Rafiqul Islam Reja. Supervision: Mohammad Zoynal Abedin.
Funding
The author(s) received no financial support for the research, authorship, and/or publication of this article.
Acknowledgments
The authors would like to acknowledge the use of AI-driven language tools for their assistance in improving the writing and linguistic quality of the manuscript.
Conflicts of Interest
The authors state that they have no financial or personal conflicts of interest that could potentially influence the findings presented in this study.
References
- Blocken B and Carmeliet J (2004) Pedestrian Wind Environment around Buildings: Literature Review and Practical Examples. Journal of Thermal Envelope and Building Science 28(2): 107–159. [CrossRef]
- Blocken B, Janssen WD and van Hooff T (2012a) CFD simulation for pedestrian wind comfort and wind safety in urban areas: General decision framework and case study for the Eindhoven University campus. Environmental Modelling & Software 30: 15–34. [CrossRef]
- Blocken B, Janssen WD and van Hooff T (2012b) CFD simulation for pedestrian wind comfort and wind safety in urban areas: General decision framework and case study for the Eindhoven University campus. Environmental Modelling & Software 30: 15–34. [CrossRef]
- Blocken B, Stathopoulos T and van Beeck JPAJ (2016) Pedestrian-level wind conditions around buildings: Review of wind-tunnel and CFD techniques and their accuracy for wind comfort assessment. Building and Environment 100: 50–81. [CrossRef]
- Celik IB, Ghia U, Roache PJ, et al. (2008) Procedure for estimation and reporting of uncertainty due to discretization in CFD applications. Journal of Fluids Engineering 130(7). [CrossRef]
- Celik IB, GU, RPJ, FCJ, CH, & RPE (2008) Procedure for estimation and reporting of uncertainty due to discretization in CFD applications. Journal of Fluids Engineering 130(7). [CrossRef]
- Chen Q (2006) Design of Natural Ventilation with CFD. Sustainable Urban Housing in China. Springer, Dordrecht: 116–123. [CrossRef]
- Franke J, HA, SH, & CB (2007) Best practice guideline for the CFD simulation of flows in the urban environment. In: COST Action, pp. 1–52.
- Hågbo TO and Giljarhus KET (2022a) Pedestrian Wind Comfort Assessment Using Computational Fluid Dynamics Simulations With Varying Number of Wind Directions. Frontiers in Built Environment 8. Frontiers Media S.A.: 858067. [CrossRef]
- Hågbo TO and Giljarhus KET (2022b) Pedestrian Wind Comfort Assessment Using Computational Fluid Dynamics Simulations With Varying Number of Wind Directions. Frontiers in Built Environment 8. Frontiers Media S.A.: 858067. [CrossRef]
- Jin M, Zuo W and Chen Q (2013) Simulating Natural Ventilation in and Around Buildings by Fast Fluid Dynamics. Numerical Heat Transfer, Part A: Applications 64(4). Taylor & Francis Group: 273–289. [CrossRef]
- Lawson, T.V, Penwarden, et al. (1975) The effects of wind on people in the vicinity of buildings. In: Proceedings 4th International Conference on Wind Effects on Buildings and Structures. In: Heathrow, 1975, pp. 605–622. Cambridge University Press.
- Lawson TV. (1978) The wind content of the built environment. J Ind Aerodyn 3: 93–105. [CrossRef]
- Liu Z, Li W, Shen L, et al. (2021) Numerical study of stable stratification effects on the wind over simplified tall building models using large-eddy simulations. Building and Environment 193. Pergamon: 107625. [CrossRef]
- Miroshnichenko I V. and Sheremet MA (2018) Turbulent natural convection heat transfer in rectangular enclosures using experimental and numerical approaches: A review. Renewable and Sustainable Energy Reviews 82. Pergamon: 40–59. [CrossRef]
- Mochida A and Lun IYF (2008) Prediction of wind environment and thermal comfort at pedestrian level in urban area. Journal of Wind Engineering and Industrial Aerodynamics 96(10–11): 1498–1527. [CrossRef]
- National Academies of Sciences, Engineering, Medicine, et al. (2016) Attribution of Extreme Weather Events in the Context of Climate Change. Washington, D.C.: National Academies Press. [CrossRef]
- Panagiotou I, Neophytou MK-A, Hamlyn D, et al. (2013) City breathability as quantified by the exchange velocity and its spatial variation in real inhomogeneous urban geometries: An example from central London urban area. Science of The Total Environment 442: 466–477. [CrossRef]
- Ramponi R, Blocken B, de Coo LB, et al. (2015a) CFD simulation of outdoor ventilation of generic urban configurations with different urban densities and equal and unequal street widths. Building and Environment 92. Pergamon: 152–166. [CrossRef]
- Ramponi R, Blocken B, de Coo LB, et al. (2015b) CFD simulation of outdoor ventilation of generic urban configurations with different urban densities and equal and unequal street widths. Building and Environment 92: 152–166. [CrossRef]
- Roache PJ (1998) Verification and Validation in Computational Science and Engineering. Available at: http://www.hermosa-pub.com/hermosa.
- Šarkić Glumac A, Hemida H and Höffer R (2018) Wind energy potential above a high-rise building influenced by neighboring buildings: An experimental investigation. Journal of Wind Engineering and Industrial Aerodynamics 175. Elsevier: 32–42. [CrossRef]
- Sheremet MA and Miroshnichenko I V. (2015) Numerical study of turbulent natural convection in a cube having finite thickness heat-conducting walls. Heat and Mass Transfer/Waerme- und Stoffuebertragung 51(11). Springer Verlag: 1559–1569. [CrossRef]
- Stathopoulos T (2006) Pedestrian level winds and outdoor human comfort. Journal of Wind Engineering and Industrial Aerodynamics 94(11): 769–780. [CrossRef]
- Tamura T, Nozawa K and Kondo K (2008) AIJ guide for numerical prediction of wind loads on buildings. Journal of Wind Engineering and Industrial Aerodynamics 96(10–11): 1974–1984. [CrossRef]
- Tominaga Y, Mochida A, Yoshie R, et al. (2008) AIJ guidelines for practical applications of CFD to pedestrian wind environment around buildings. Journal of Wind Engineering and Industrial Aerodynamics 96(10–11): 1749–1761. [CrossRef]
- van Druenen T, van Hooff T, Montazeri H, et al. (2019) CFD evaluation of building geometry modifications to reduce pedestrian-level wind speed. Building and Environment 163. Pergamon: 106293. [CrossRef]
- Willemsen E and Wisse JA (2007) Design for wind comfort in The Netherlands: Procedures, criteria and open research issues. Journal of Wind Engineering and Industrial Aerodynamics 95(9–11): 1541–1550. [CrossRef]
- Yoshie R, Mochida A, Tominaga Y, et al. (2007) Cooperative project for CFD prediction of pedestrian wind environment in the Architectural Institute of Japan. Journal of Wind Engineering and Industrial Aerodynamics 95(9–11): 1551–1578. [CrossRef]
Figure 1.
View of the study area.
Figure 1.
View of the study area.
Figure 2.
Explicit and implicit modeling of building geometries.
Figure 2.
Explicit and implicit modeling of building geometries.
Figure 3.
Computational domain for simulations.
Figure 3.
Computational domain for simulations.
Figure 5.
Simplified top view of the study area showing walkways.
Figure 5.
Simplified top view of the study area showing walkways.
Figure 6.
Computational grid (3,106,445 cells).
Figure 6.
Computational grid (3,106,445 cells).
Figure 7.
Projection line used to assist the grid-independence test.
Figure 7.
Projection line used to assist the grid-independence test.
Figure 8.
On-site air velocity measurements.
Figure 8.
On-site air velocity measurements.
Figure 10.
(a) Rectangular geometry with 47 building models for the validation, (b) Vertical profile of streamwise wind speed along a vertical line in front of the central building (black) at position P with those obtained by Ramponi et al. (Ramponi et al., 2015b).
Figure 10.
(a) Rectangular geometry with 47 building models for the validation, (b) Vertical profile of streamwise wind speed along a vertical line in front of the central building (black) at position P with those obtained by Ramponi et al. (Ramponi et al., 2015b).
Figure 11.
Velocity contour for 3 m/s inlet air velocity from the direction of (a) East (b) North (c) West (d) South.
Figure 11.
Velocity contour for 3 m/s inlet air velocity from the direction of (a) East (b) North (c) West (d) South.
Figure 12.
Velocity contour for 5 m/s inlet air velocity from the direction of (a) East (b) North (c) West (d) South.
Figure 12.
Velocity contour for 5 m/s inlet air velocity from the direction of (a) East (b) North (c) West (d) South.
Figure 13.
Zoomed view of the flow vector: V = 3 m/s east-direction inlet.
Figure 13.
Zoomed view of the flow vector: V = 3 m/s east-direction inlet.
Figure 14.
Turbulence kinetic energy contour for 3 m/s inlet air velocity from (a) east, (b) north, (c) west, and (d) south.
Figure 14.
Turbulence kinetic energy contour for 3 m/s inlet air velocity from (a) east, (b) north, (c) west, and (d) south.
Figure 15.
Turbulence kinetic energy contour for inlet air velocity of 5 m/s from (a) east, (b) north, (c) west, and (d) south.
Figure 15.
Turbulence kinetic energy contour for inlet air velocity of 5 m/s from (a) east, (b) north, (c) west, and (d) south.
Figure 16.
Zoomed view of the turbulence kinetic energy (TKE) for 3 m/s inlet air velocity.
Figure 16.
Zoomed view of the turbulence kinetic energy (TKE) for 3 m/s inlet air velocity.
Figure 17.
3 parallel reference lines in walkway-3.
Figure 17.
3 parallel reference lines in walkway-3.
Figure 18.
Turbulence kinetic energy and velocity as functions of distance (Z) for line 1.
Figure 18.
Turbulence kinetic energy and velocity as functions of distance (Z) for line 1.
Figure 19.
Turbulence kinetic energy and velocity as functions of distance (Z) for line 2.
Figure 19.
Turbulence kinetic energy and velocity as functions of distance (Z) for line 2.
Figure 20.
Turbulence kinetic energy and velocity as functions of distance (Z) for Line 3.
Figure 20.
Turbulence kinetic energy and velocity as functions of distance (Z) for Line 3.
Table 1.
Overview of the simulation setup.
Table 1.
Overview of the simulation setup.
| Feature |
Type |
| Simulation software |
Ansys Fluent |
| 3d modeling software |
SolidWorks |
| Solver |
Steady pressure-based absolute velocity formulation |
| Turbulence model |
realizable k-ϵ, scalable wall functions |
| Pressure-velocity coupling |
Coupled |
| Convergence criteria |
residual drop to 1.0 × 10⁻⁴ |
Table 2.
Overview of applied boundary conditions.
Table 2.
Overview of applied boundary conditions.
| Patch |
Boundary Condition Type |
| Sides |
East, west, north, and south tunnel wall |
| Inlet |
Velocity inlet (Magnitude, normal to boundary) |
| Outlet |
Pressure outlet (Normal to the boundary) |
| Buildings |
No slip wall |
| Ground |
No slip wall |
Table 3.
Values of constants used in Equations (1)–(15).
Table 3.
Values of constants used in Equations (1)–(15).
| Constant |
Value |
|
C1ϵ
|
1.44 |
|
1.9 |
|
1.0 |
|
1.2 |
Table 4.
Air velocities along the projection line at different heights from the ground.
Table 4.
Air velocities along the projection line at different heights from the ground.
| Position |
Simulation Results of Velocity (m/s) |
Experimental Results of Velocity (m/s) |
Error (%) |
| A |
0.78 |
0.82 |
4.88 |
| B |
0.62 |
0.68 |
8.82 |
| C |
0.78 |
0.86 |
9.30 |
|
Disclaimer/Publisher’s Note: The statements, opinions and data contained in all publications are solely those of the individual author(s) and contributor(s) and not of MDPI and/or the editor(s). MDPI and/or the editor(s) disclaim responsibility for any injury to people or property resulting from any ideas, methods, instructions or products referred to in the content. |
© 2024 by the authors. Licensee MDPI, Basel, Switzerland. This article is an open access article distributed under the terms and conditions of the Creative Commons Attribution (CC BY) license (http://creativecommons.org/licenses/by/4.0/).
