1. Introduction
Methane, a potent greenhouse gas (GHG) with a significantly higher global warming potential than carbon dioxide (CO₂), plays a critical role in environmental sustainability efforts. Its significant sources – agriculture, oil and gas production, waste management, and coal mining – pose unique challenges for emission reduction. Due to methane’s short atmospheric lifespan, reducing emissions could yield rapid climate benefits, making methane management vital to achieving global climate goals while maintaining economic growth. This paper integrates methane management within the Environmental, Social, and Governance (ESG) framework, highlighting methane's broader impacts on social and economic structures. Methane mitigation is framed as a key ESG indicator, reflecting progress in sustainability. Despite global ESG improvements, methane emissions continue to rise, revealing the complexities of addressing it within current economic and policy systems. Using panel data from the World Bank's ESG database, the study disaggregates methane drivers across the three ESG pillars. The environmental (E) component examines factors such as agricultural practices, renewable energy consumption, and forest depletion. While agricultural land management can lower methane emissions, the study finds that energy imports shift emissions abroad, and forest depletion increases methane release. Renewable energy consumption, conversely, is negatively correlated with methane emissions, emphasizing the role of cleaner energy in reducing environmental impacts. For the social (S) component, the relationship between methane emissions and public health, income inequality, and labor force participation is analyzed. Less industrialized countries with higher infectious disease burdens tend to emit lower methane. In contrast, economic development, healthcare expansion, and increased labor force participation are linked to higher emissions, reflecting advanced agricultural and industrial activities. The governance (G) component explores how government effectiveness, legal frameworks, and Research and Development (R&D) investments influence methane emissions. Strong management and investment in R&D are associated with lower emissions, demonstrating the importance of regulatory policies and technological innovation in controlling methane. The paper concludes by emphasizing the need for coordinated international efforts, such as the Global Methane Pledge, to reduce emissions through technology, policy reforms, and renewable energy investments. Methane management must be integrated into ESG strategies to address environmental, socioeconomic, and governance challenges related to methane emissions. This holistic approach is essential for achieving sustainability goals and mitigating climate change’s global impact.
Relevance of the topic. Methane emission in the context of ESG issues is highly relevant today, considering that climate change is already an urgent issue. Methane is a very active greenhouse gas, contributing much to global warming; it has many times greater heat-trapping capacity than carbon dioxide, although it also has a shorter atmospheric lifetime. Moreover, as the world struggles for sustainability, this representative appearance of methane emissions in ESG metrics fundamentally reveals that environmental health, social responsibility, and governance effectiveness are closely linked. Agricultural and waste management activities, as well as the extraction of fossil fuel, are the sources of methane emissions that pose critical challenges to achieving environmental sustainability. From the perspective of ESG, it could be a strong environmental proxy reflecting broad societal consideration. For instance, methane emitted to the atmosphere can lead not only to accelerated climate change if left unaccounted for but also seriously damage human health and affect natural ecosystems. Therefore, methane mitigation will be of high importance by technological innovation and application of regulations through international cooperation. Methane management also has far-reaching implications in the social and governance dimensions. For example, it helps in improving population health because methane emissions are arrested; therefore, air pollution, which affects vulnerable populations, is reduced. In the context of governance frameworks, good governance can ensure severe legislation for methane emissions, which poor governance will hamper and make the global methane problem more intractable. Thirdly, methane emissions are linked to socio-economic aspects associated with industrialization and energy production. This implies that devising methods of mitigating methane has to be founded on achievable economic development. It is relevant to both policymakers and industries since methane management can equally serve as a litmus test for sustainability efforts and the potential area where technological advances could result in quick environmental dividends. Therefore, methane emission under the ESG framework involves not only environmental protection but also the necessity to contribute to the sustainable development that manages to balance economic growth with social and environmental responsibility. Cooperation and governance on a global level will be explicitly necessary in order to reduce methane emissions and keep global climate goals intact.
Significance of the sample study. The importance of the sample study in research is that it allows this small amount of selected data or subjects to represent a whole population and enables the identification of broader phenomena. The study, in the context of the provided document, focuses on methane emissions within the ESG framework and covers the global dataset from the World Bank across 193 countries over a period of ten years: 2011-2020. Such broad data allow for an overall view of the global trends and drivers of methane emissions that are hugely relevant to knowing the environmental impacts caused by methane and integrating them into sustainability policies. The importance of this sample is related to its global scope and the rich, diverse data available. It looks into countries in various stages of development, industrialization, and different agricultural practices; hence, its sample allows the modeling of different drivers of methane emission in different economic sectors. Results are more robust by applying the panel data econometric models, such as Random Effects, Fixed Effects, Pooled OLS, and WLS, and can actually slice the emissions across the three ESG pillars. This is in-depth analysis that contributes to a nuanced understanding of how different sectors-for instance, agriculture and energy-along with governance and social factors drive the emissions of methane at the global scale. Moreover, the relevance of the sample study is further increased by the fact of being relevant to policy-making. The results provide critical insight into how current methane mitigation practices function under the ESG framework, as well as the inherent limitations that come with reliance on ESG enhancements without dedicated policy action for methane mitigation. Because methane is on the rise despite improvements in ESG metrics, this report harps on the need for targeted policy action as it pertains to battling methane within multiple sectors, like agriculture and energy. This brings out disparities from a global perspective by the inclusion of both developed and developing nations in the sample, and it ascertains the need for differential strategies to be adopted based on the development level and industrial profile of each country. The global scope of the sample study, coupled with methodical analysis relevance to policymaking, makes it an important study for driving global methane management efforts forward by providing the key data required for driving informed environmental governance and lifestyles of sustainability.
Novelty aspects. Methane emissions are known to be one of the most potent greenhouse gases; however, the study of methane emissions is seldom carried out in the ESG model, let alone being discussed on the global scale across 193 countries. Using the World Bank ESG database, the paper provided ten-year-long comprehensive analysis from 2011 to 2020 and set a basic foundation for further research that seeks to systematically embed environmental metrics such as methane into ESG reporting and governance. The paper is innovative in the econometric approach because different models were applied. Finally, the disaggregation of methane emission drivers into three ESG pillars, namely Environmental, Social, and Governance, further introduces nuance to the discussion not typically seen in the literature published thus far. For instance, the negative relationship studied in this paper between renewable energy consumption underlines the need for transitions to clean forms of energy. The analysis of agricultural activities, being directly linked with emissions, forms an extremely important basis for policy intervention. In any case, such an emphasis on interaction with the socioeconomic variables of public health and methane emissions, labor participation, and income inequality widens the discussion from environmental impact to broader societal implications. These facets put together give an indication of major steps forward in deciphering the nexus of methane emission and global sustainability governance, offering new directions for both academic inquiry and practical policy application.
2. Literature Review
2.1. Methane Emissions and Environmental Mitigation
Methane emissions, a significant contributor to climate change, require urgent mitigation through technological, policy, and governance strategies. [
1] stress the need for strong governance and policy reforms in oil-producing nations like Nigeria to address methane leaks. [
2] advocate for market-based solutions like carbon pricing and methane-specific taxes, emphasizing international cooperation to support developing nations. [
3] underscores advanced monitoring technologies for real-time data and regulatory compliance, while [
4] calls for standardized Measurement, Reporting, and Verification- MRV frameworks to ensure credible methane reductions. Together, these studies promote integrated strategies for global methane emission reduction.
[
5] propose atmospheric methane removal as an innovative strategy to complement traditional mitigation efforts for near-term climate impact. [
6] stress collaboration between industry, government, and civil society in developing effective European Union (EU) methane regulations that balance environmental and economic goals. [
7] advocate for international cooperation and ambitious policies, highlighting technologies like leak detection and capture systems. [
8] analyze historical methane emissions data, emphasizing sustained mitigation in Organisation for Economic Cooperation and Development (OECD) countries. [
9] focus on methane's environmental and health impacts, particularly ground-level ozone, urging comprehensive policies. [
10] highlights the need for improved fossil fuel emissions reporting. [
11] and [
12] provide strategies for reducing livestock and agricultural methane emissions, stressing policy support.
[
13] explores the political complexities of methane emissions from livestock, emphasizing how geopolitical power dynamics shape methane reduction policies between developed and developing nations. [
14] provide a roadmap for achieving global methane pledge targets, highlighting the need for technological advancements, regulatory reforms, and international cooperation. [
15] focus on methane emissions from municipal wastewater systems, advocating for methane capture technologies to reduce emissions and generate energy, expanding mitigation efforts to urban infrastructure. [
16] analyze global methane trends, noting emissions stabilization in developed nations but increases in developing ones due to industrialization, calling for tailored strategies. [
17] highlight that methane mitigation’s benefits outweigh its costs, stressing immediate action to reduce emissions and slow global warming.
A synthesis of the relationships between methane emission and environmental mitigation is shown in
Figure 1.
2.2. Socioeconomic Aspects and Impacts of Methane Emissions
The increasing relevance of ESG metrics underscores the vital connection between sustainability and economic development. Various studies explore how methane emissions, governance, and economic policies intersect with ESG goals, emphasizing the need for strong regulatory frameworks to balance growth with environmental and social priorities. [
18] highlight how integrating ESG in Gulf Cooperation Council (GCC) countries can help resource-dependent economies transition toward sustainability, attracting foreign investment and supporting long-term growth. [
19] show that ESG ratings guide investment decisions, linking financial returns to sustainability. [
20] advocate including methane’s social cost in economic decision-making, urging policymakers to internalize these external costs in industries to align with ESG sustainability objectives.
[
21] highlights the crucial role of institutions in regulating methane emissions, particularly in the natural gas sector. He emphasizes the need for strong governance, international cooperation, and best practices to align methane reduction efforts with global climate goals. [
22] presents an N-shaped Environmental Kuznets Curve (EKC) model, suggesting that methane emissions initially rise with economic growth, decrease, and may rise again at advanced stages, urging for balanced policies. [
23] examines methane emissions in Central African countries, showing that environmental degradation can impede long-term development and calling for its integration into economic planning. [
24] use a methane-adjusted Dynamic Integrated Climate-Economy-DICE model to project the long-term costs of inaction.
[
25] emphasize the importance of financial mechanisms, such as public-private partnerships, to fund methane capture technologies in the oil and gas sector, promoting innovation through strategic investments. [
26] critique US natural gas emissions certification, calling for stricter enforcement and transparency to improve regulatory frameworks. [
27] argue that methane reduction strategies must consider their impact on vulnerable populations, promoting equitable global policies. [
28] link methane emissions to negative public health outcomes, urging policies that address both emissions and health. [
29] suggest the EU leverage its collective purchasing power to enforce stricter methane standards globally (see
Figure 2).
2.3. Technologies for Monitoring and Regulation of Methane Emissions
Reducing methane emissions is crucial for sustainability due to methane’s strong greenhouse effect. Recent studies highlight the importance of advanced monitoring technologies, strong policy frameworks, and improved industry practices in high-emission sectors like oil, gas, and marine fuel. [
30] emphasize real-time methane detection tools, such as ground-based sensors, airborne systems, and satellite technologies, but stress the need for globally harmonized emissions reporting for transparency. [
31] showcase the cost-effectiveness of satellite and airborne remote sensing in oil and gas, emphasizing collaboration between regulators and industry to maximize emissions reductions. [
32] address methane slip during Liquefied Natural Gas-LNG combustion in the marine fuel sector, advocating for stricter regulations, better monitoring, and technological innovations to minimize emissions.
[
33] reviews methane emissions from the global oil and gas industry, highlighting research gaps, particularly in the long-term effectiveness of reduction technologies and the socioeconomic impacts of regulations. The study emphasizes the need for interdisciplinary research, especially in developing countries. [
34] demonstrate the transformative role of satellite technology in detecting methane leaks and improving emissions reporting in remote areas, enhancing transparency and accountability. They argue that satellite-based monitoring can standardize global reporting, which is crucial for international climate goals. [
35] provides a cost-benefit analysis of methane abatement technologies in natural gas production, highlighting that the long-term environmental and health benefits far outweigh the initial costs, urging policymakers to invest in methane reduction efforts.
[
36] advocate using Audit 4.0 technologies, especially satellite imagery, to improve transparency in methane emissions reporting and enhance ESG assurance. Satellite data provides real-time, verifiable emissions information, helping companies meet regulatory and investor expectations. [
37] stress the importance of precise methane data through advanced monitoring technologies for shaping effective mitigation policies. [
38] call for a demand-side approach to methane management, targeting the entire supply chain to reduce fuel consumption. [
39] highlight the transformative role of satellite technology in improving emissions reporting transparency. [
40] emphasize the need for standardized reporting in Canada’s oil and gas sector. [
41] prioritize methane mitigation, advocating for international cooperation and stricter regulations. [
42] introduce a model for tracking flare emissions. [
43] call for flexible, industry-specific mitigation strategies, while [
44,
45] explore the growing role of ESG management and digital technologies in methane reporting and sustainability (see
Figure 3).
3. Data
The World Bank's ESG dataset [
46] has been used for the empirical estimates.
Table 1 shows the variables used.
4. Econometric Results
4.1. Methane Emissions and the E-Environmental Component within the ESG Model
Regarding the relationship between methane emissions and the environmental component of the ESG model, the following equation is estimated:
where
i=193 and
t=[2011;2020].
The econometric results are shown in
Table 2.
The relationship between agricultural land and methane emissions. The results show that the percentage of agricultural land as a fraction of total land area and methane emissions are inversely related. Any increase in the proportion of agricultural land necessarily leads to a reduction in methane emissions. Several factors can be cited for this inverse relationship. For instance, prompt regions with a higher share of agricultural land to apply land management practices with minimal methane emission through direct methods or using methane-reducing technologies. Countries with more land could also implement policies to reduce GHG emissions within the agriculture sector. However, this might vary by the form of agriculture practiced, the intensity of land use, and regional climatic conditions. Further, the scale and nature of agriculture crop-based or livestock-intensive systems can also be reasons for determining the scale of emissions (see
Figure 4). Thus, though there is a negative trend, its internal dynamics are complex and do need further investigation if nuances across different regions are to be understood [
81,
82,
83].
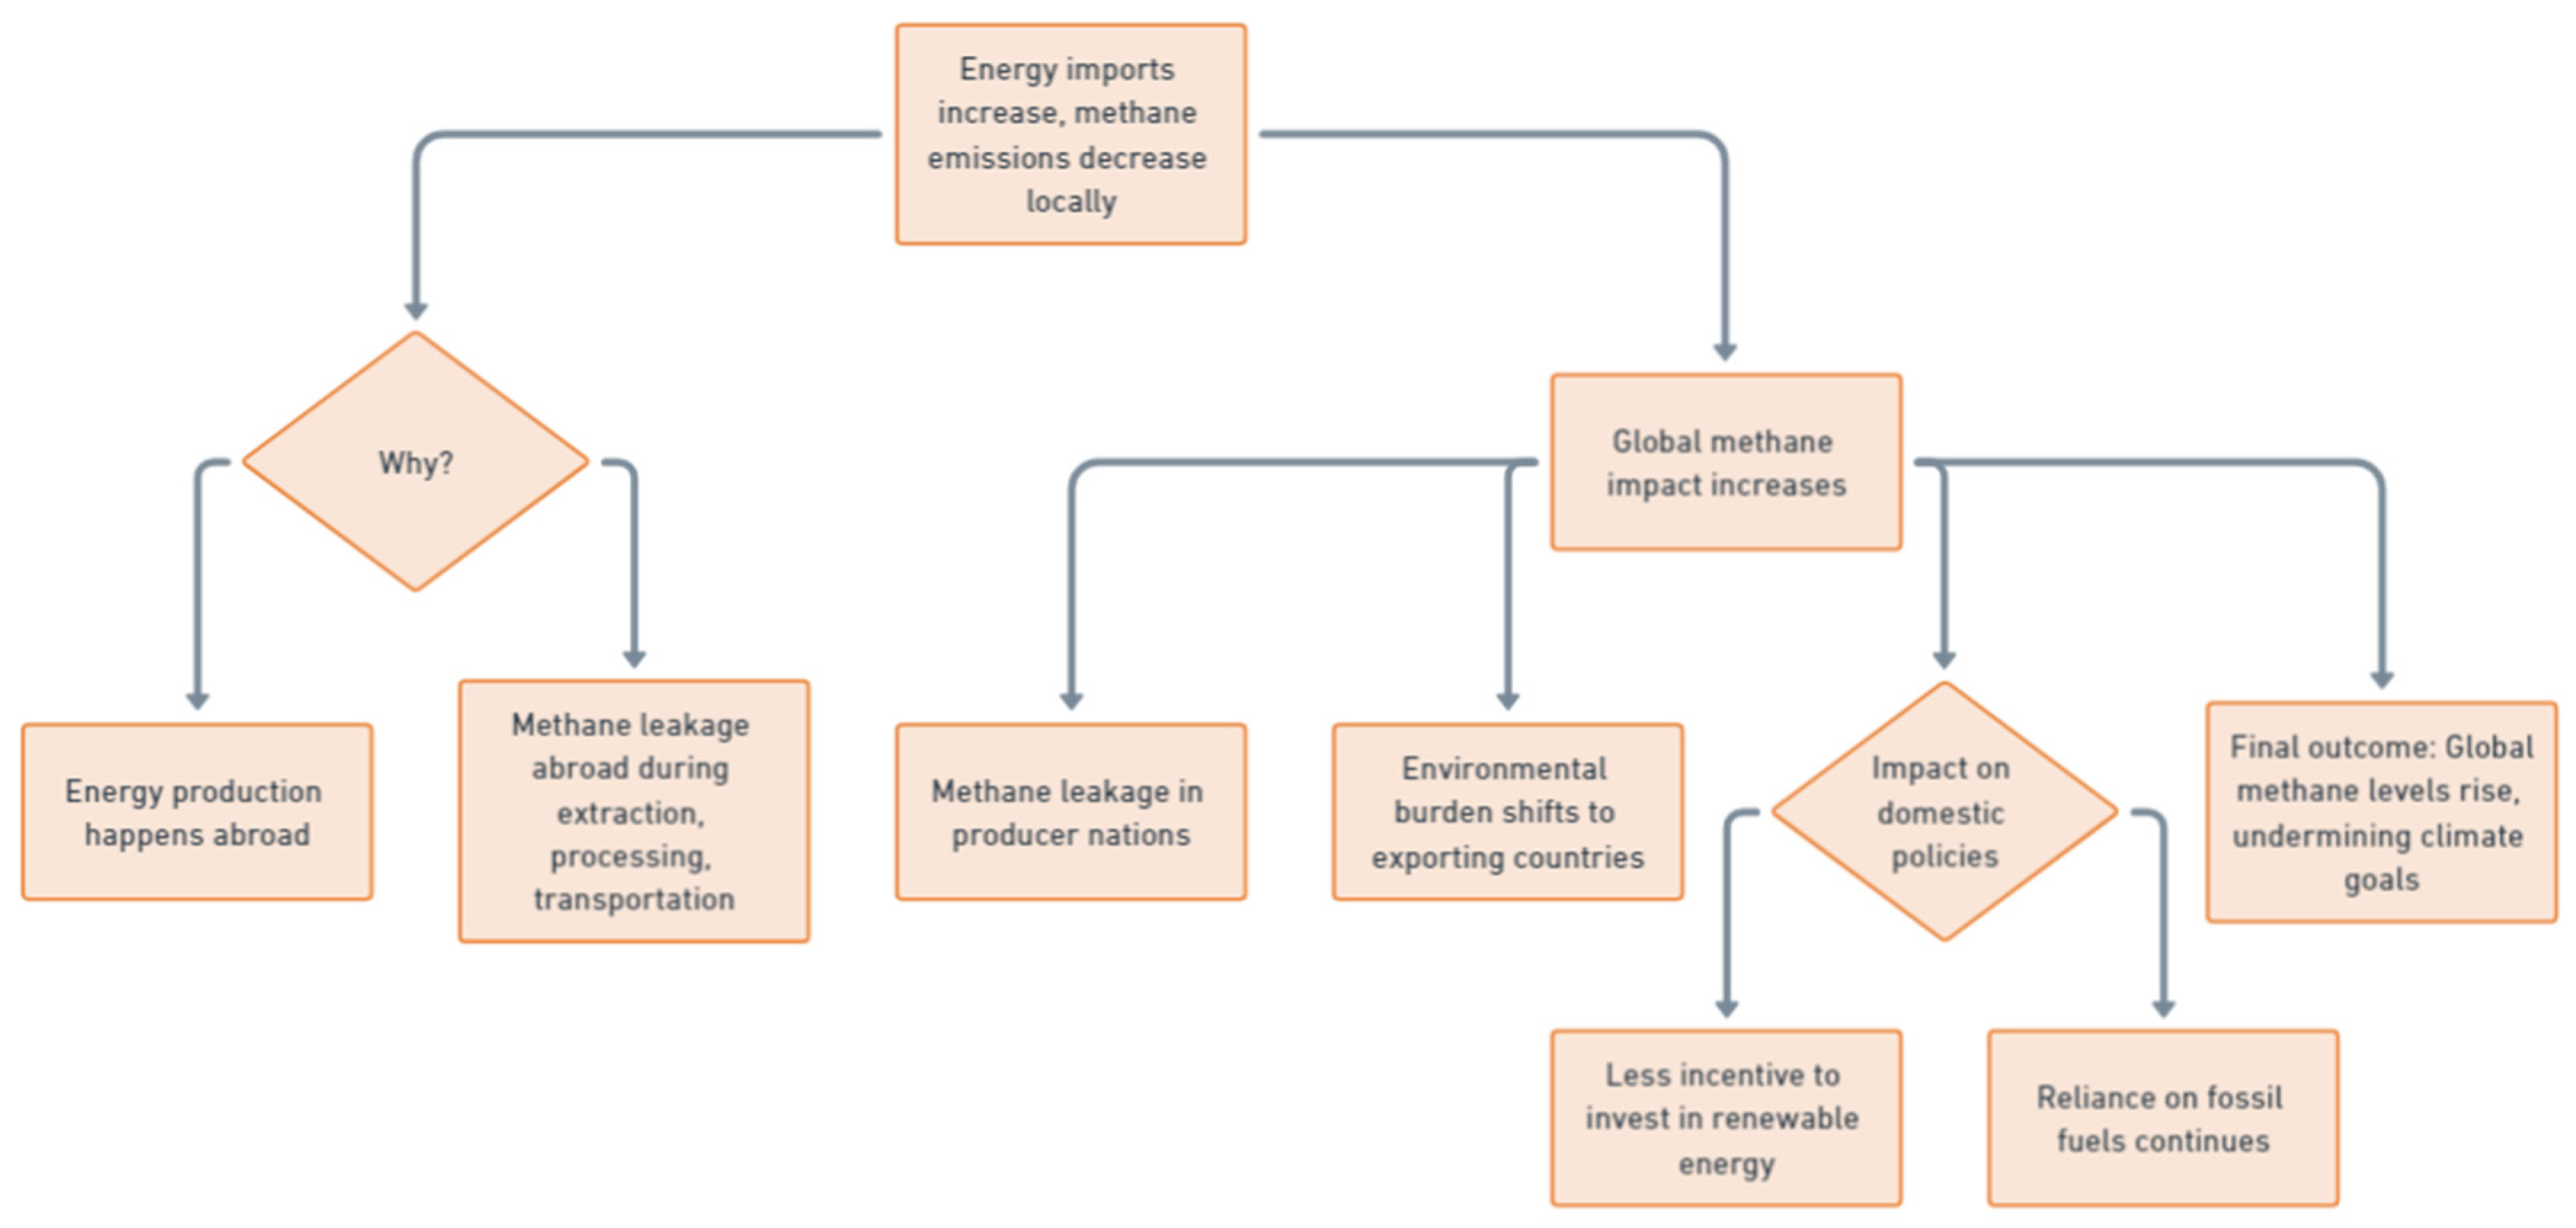
The relationship between energy imports and methane. Energy import use and methane emissions are inversely correlated due to the interplay between energy dependence and environmental impact. Countries become increasingly dependent on imported energy – mainly fossil fuels – and they will contribute less and less to local methane emissions in some cases, as much of the production and transportation happens abroad. However, this reduction masks the global environmental impact rather than solving it, for methane leakage during the various extraction, processing, and transportation stages can be considerable in exporting countries. Thus, net energy-importing nations might observe a decline in domestic methane emissions while their energy use indirectly contributes to world methane levels. Methane usually results in very high emissions related to the extraction of oil, coal, and natural gas. It is a very potent GHG, having a heating potential many times greater than carbon dioxide. Countries most reliant upon imported energy tend to shift this burden onto their producer nations, thus giving a misleading appearance of environmental improvement in their home countries. This can create a dynamic where countries that are high net energy importers often appear to have better environmental performance. At the same time, their reliance on methane-intensive fuels continues to worsen the global climate crisis. Importing countries usually have fewer incentives to invest in the domestic renewable energy infrastructure that a transition to zero emissions would eventually require; this hardens dependence on fossil fuels. In the case of this study, especially natural gas, oil, and coal production, global methane emissions are likely to be extended. Therefore, while net energy imports are negatively associated with methane emissions for the importing country, the relationship is positive globally, insofar as environmental impact is shifted upward within the producer nations under conditions that assure a worldwide increase in methane levels and erode shared climate performance aspirations (see
Figure 5). However, though it may reduce methane emissions at home, high energy imports mean greater and more alarming methane buildups globally and contribute to a more significant environmental crisis [
84,
85,
86].
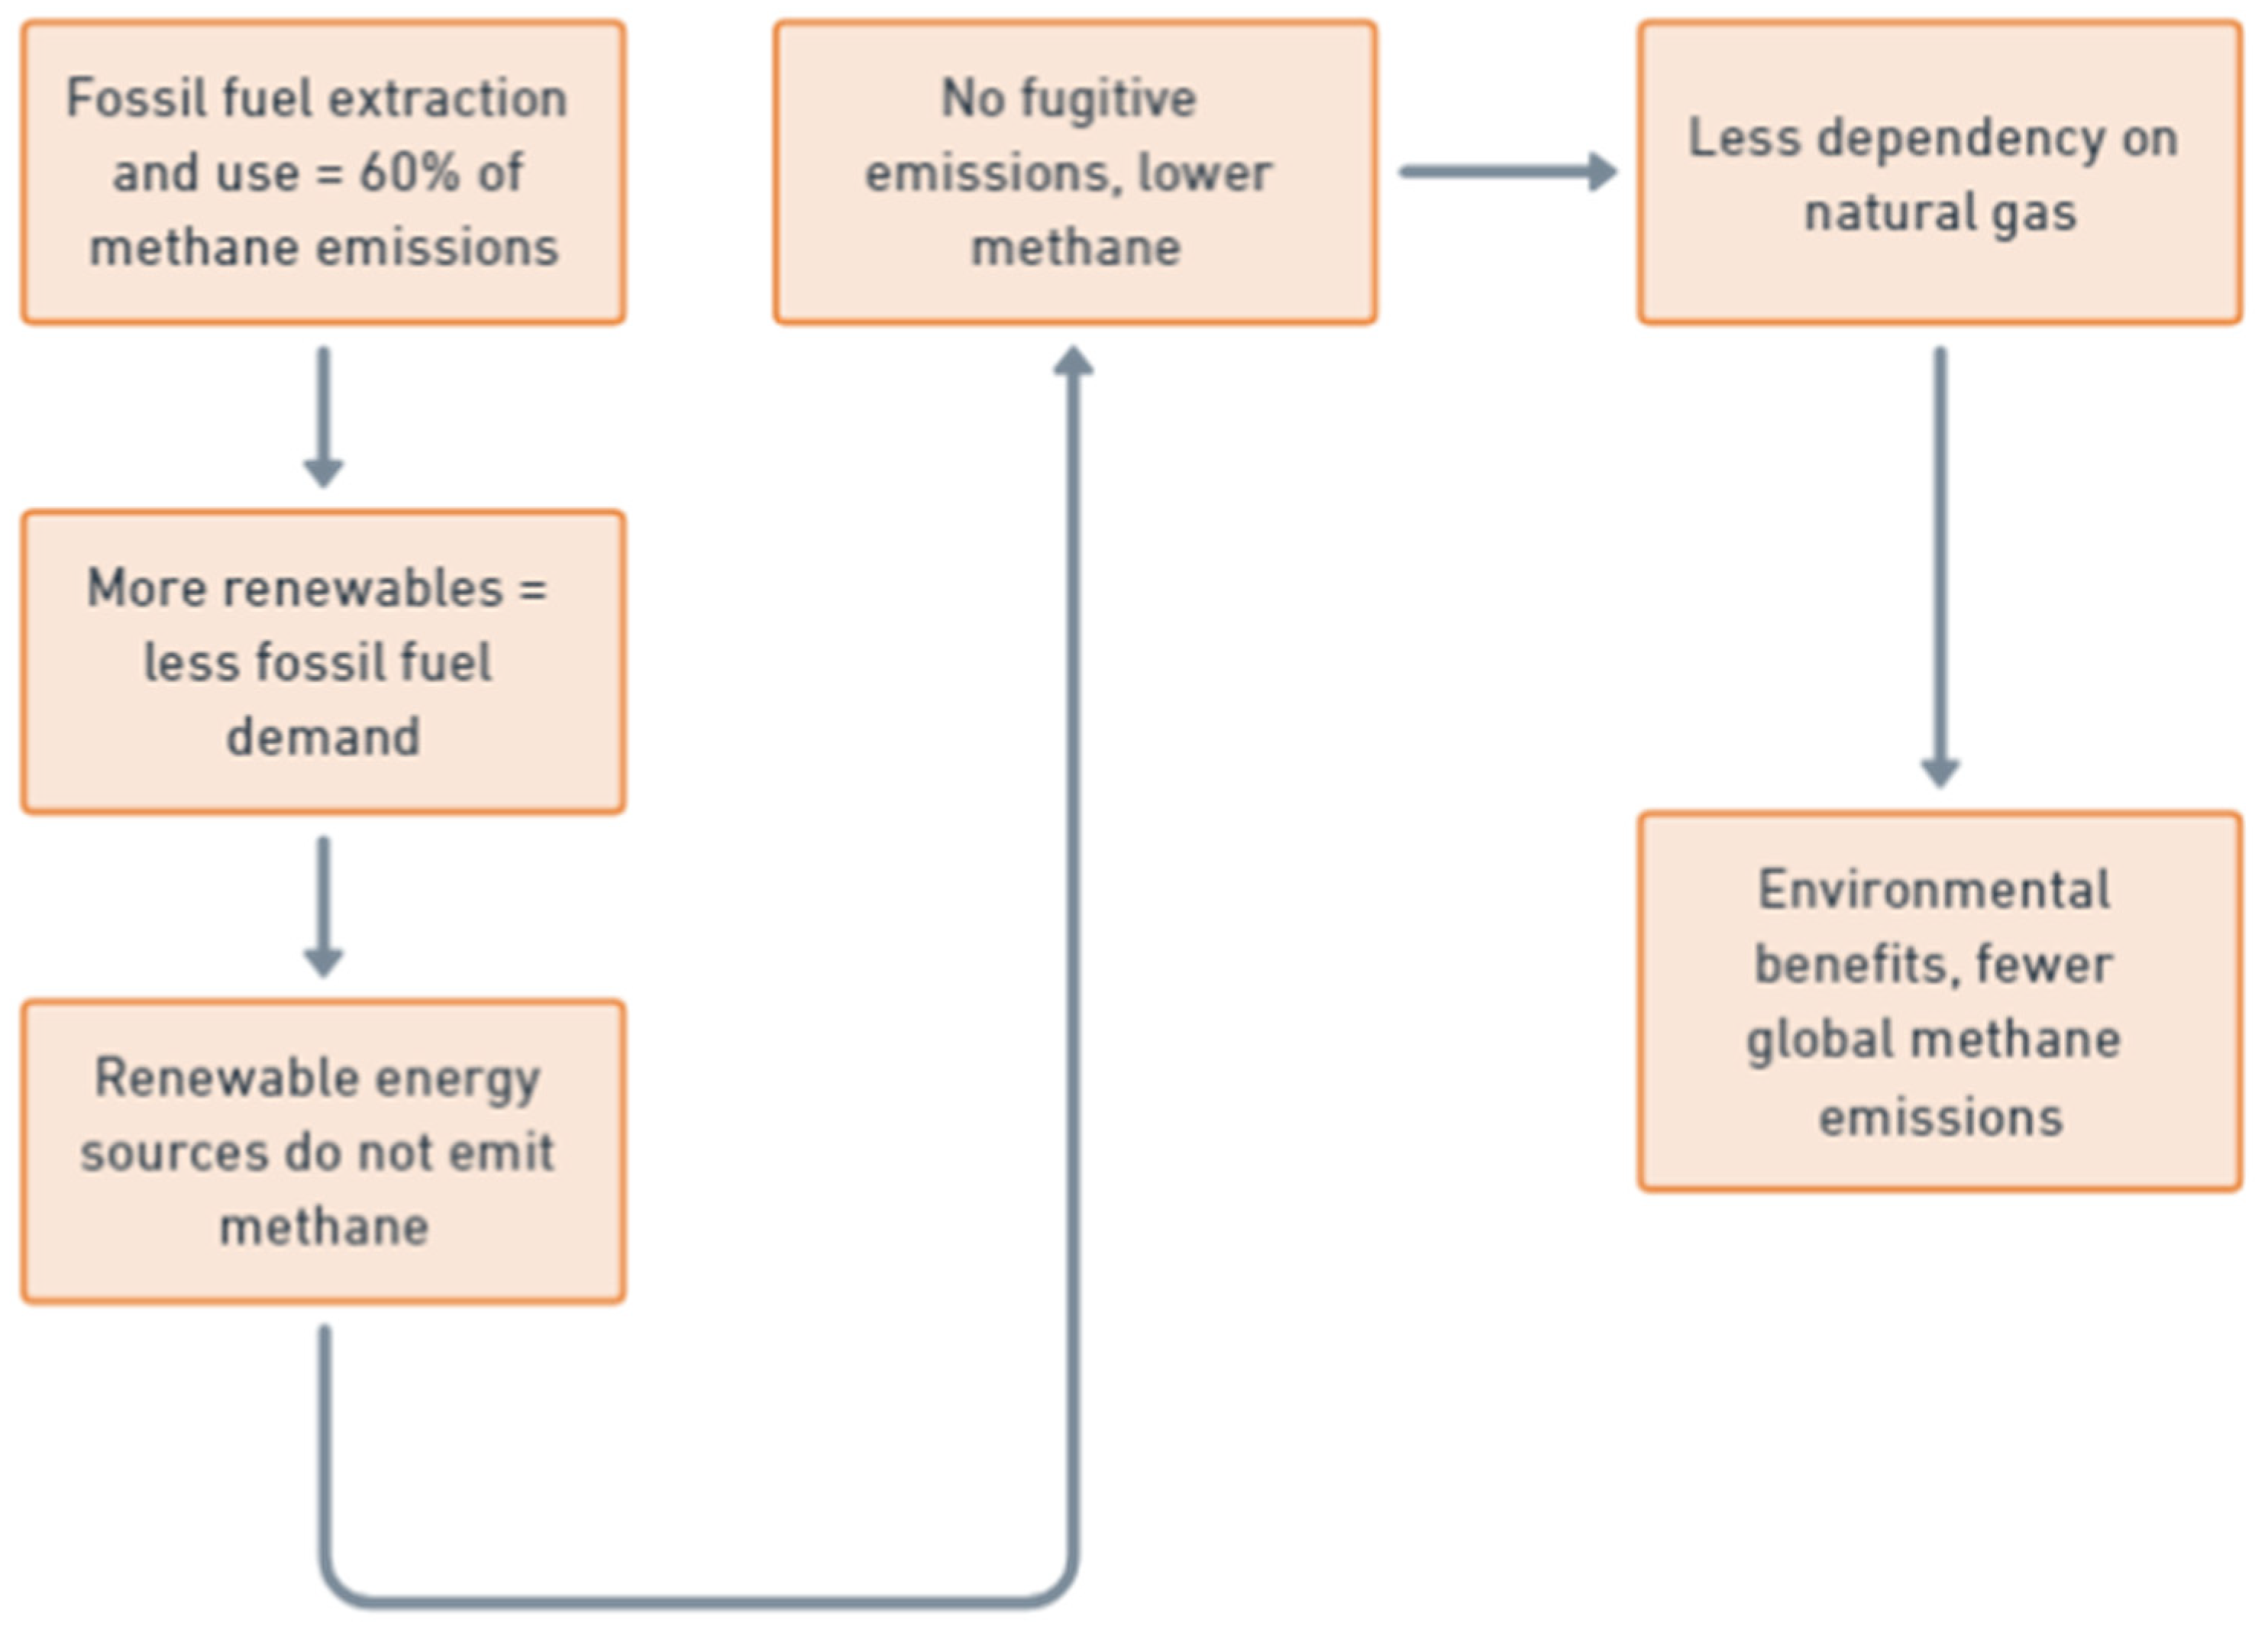
The relationship between renewable energy consumption and methane emissions. Nearly 60 percent of methane emissions come from human activities such as extraction, production, and transport of fossil fuels, mainly natural gas, oil, and coal. A higher share of renewable energy in a country's energy mix automatically lowers the demand for fossil fuel-based energy, which is directly proportional to a reduction in methane emissions associated with conventional sources of energy creation. Solar, wind, and hydropower OECD countries do not emit methane during operation. These technologies naturally generate energy with renewable resources and negate hazardous environmental side effects of combustion or leakage caused by fossil fuels. This, in turn, considerably helps countries reduce at least the methane contribution to the atmosphere by shifting to renewable energy since renewables completely remove both direct and indirect methane emissions from conventional systems. Natural gas extraction is usually linked to methane leakage, known as fugitive emissions, which occur even in advanced infrastructure. Contrasting that, renewable energy systems have negligible or zero operational emissions after installation, none of which are from methane. In addition, increased renewable energy consumption reduces dependency on natural gas, the so-called "bridge fuel," into a cleaner future. Its combustion produces substantially less carbon dioxide compared to coal combustion. As this shifts with the increase in renewables, total methane emissions from energy production are reduced. Put differently, increased renewable energy use cuts down significantly on methane emissions by reducing dependency on fossil fuel extraction and use (See
Figure 6). In fact, the negative relation underpins the environmental benefits that can be derived from investing in renewable infrastructure and shows how critical a role renewable can play when it comes to global GHG emission reduction [
84,
87,
88].
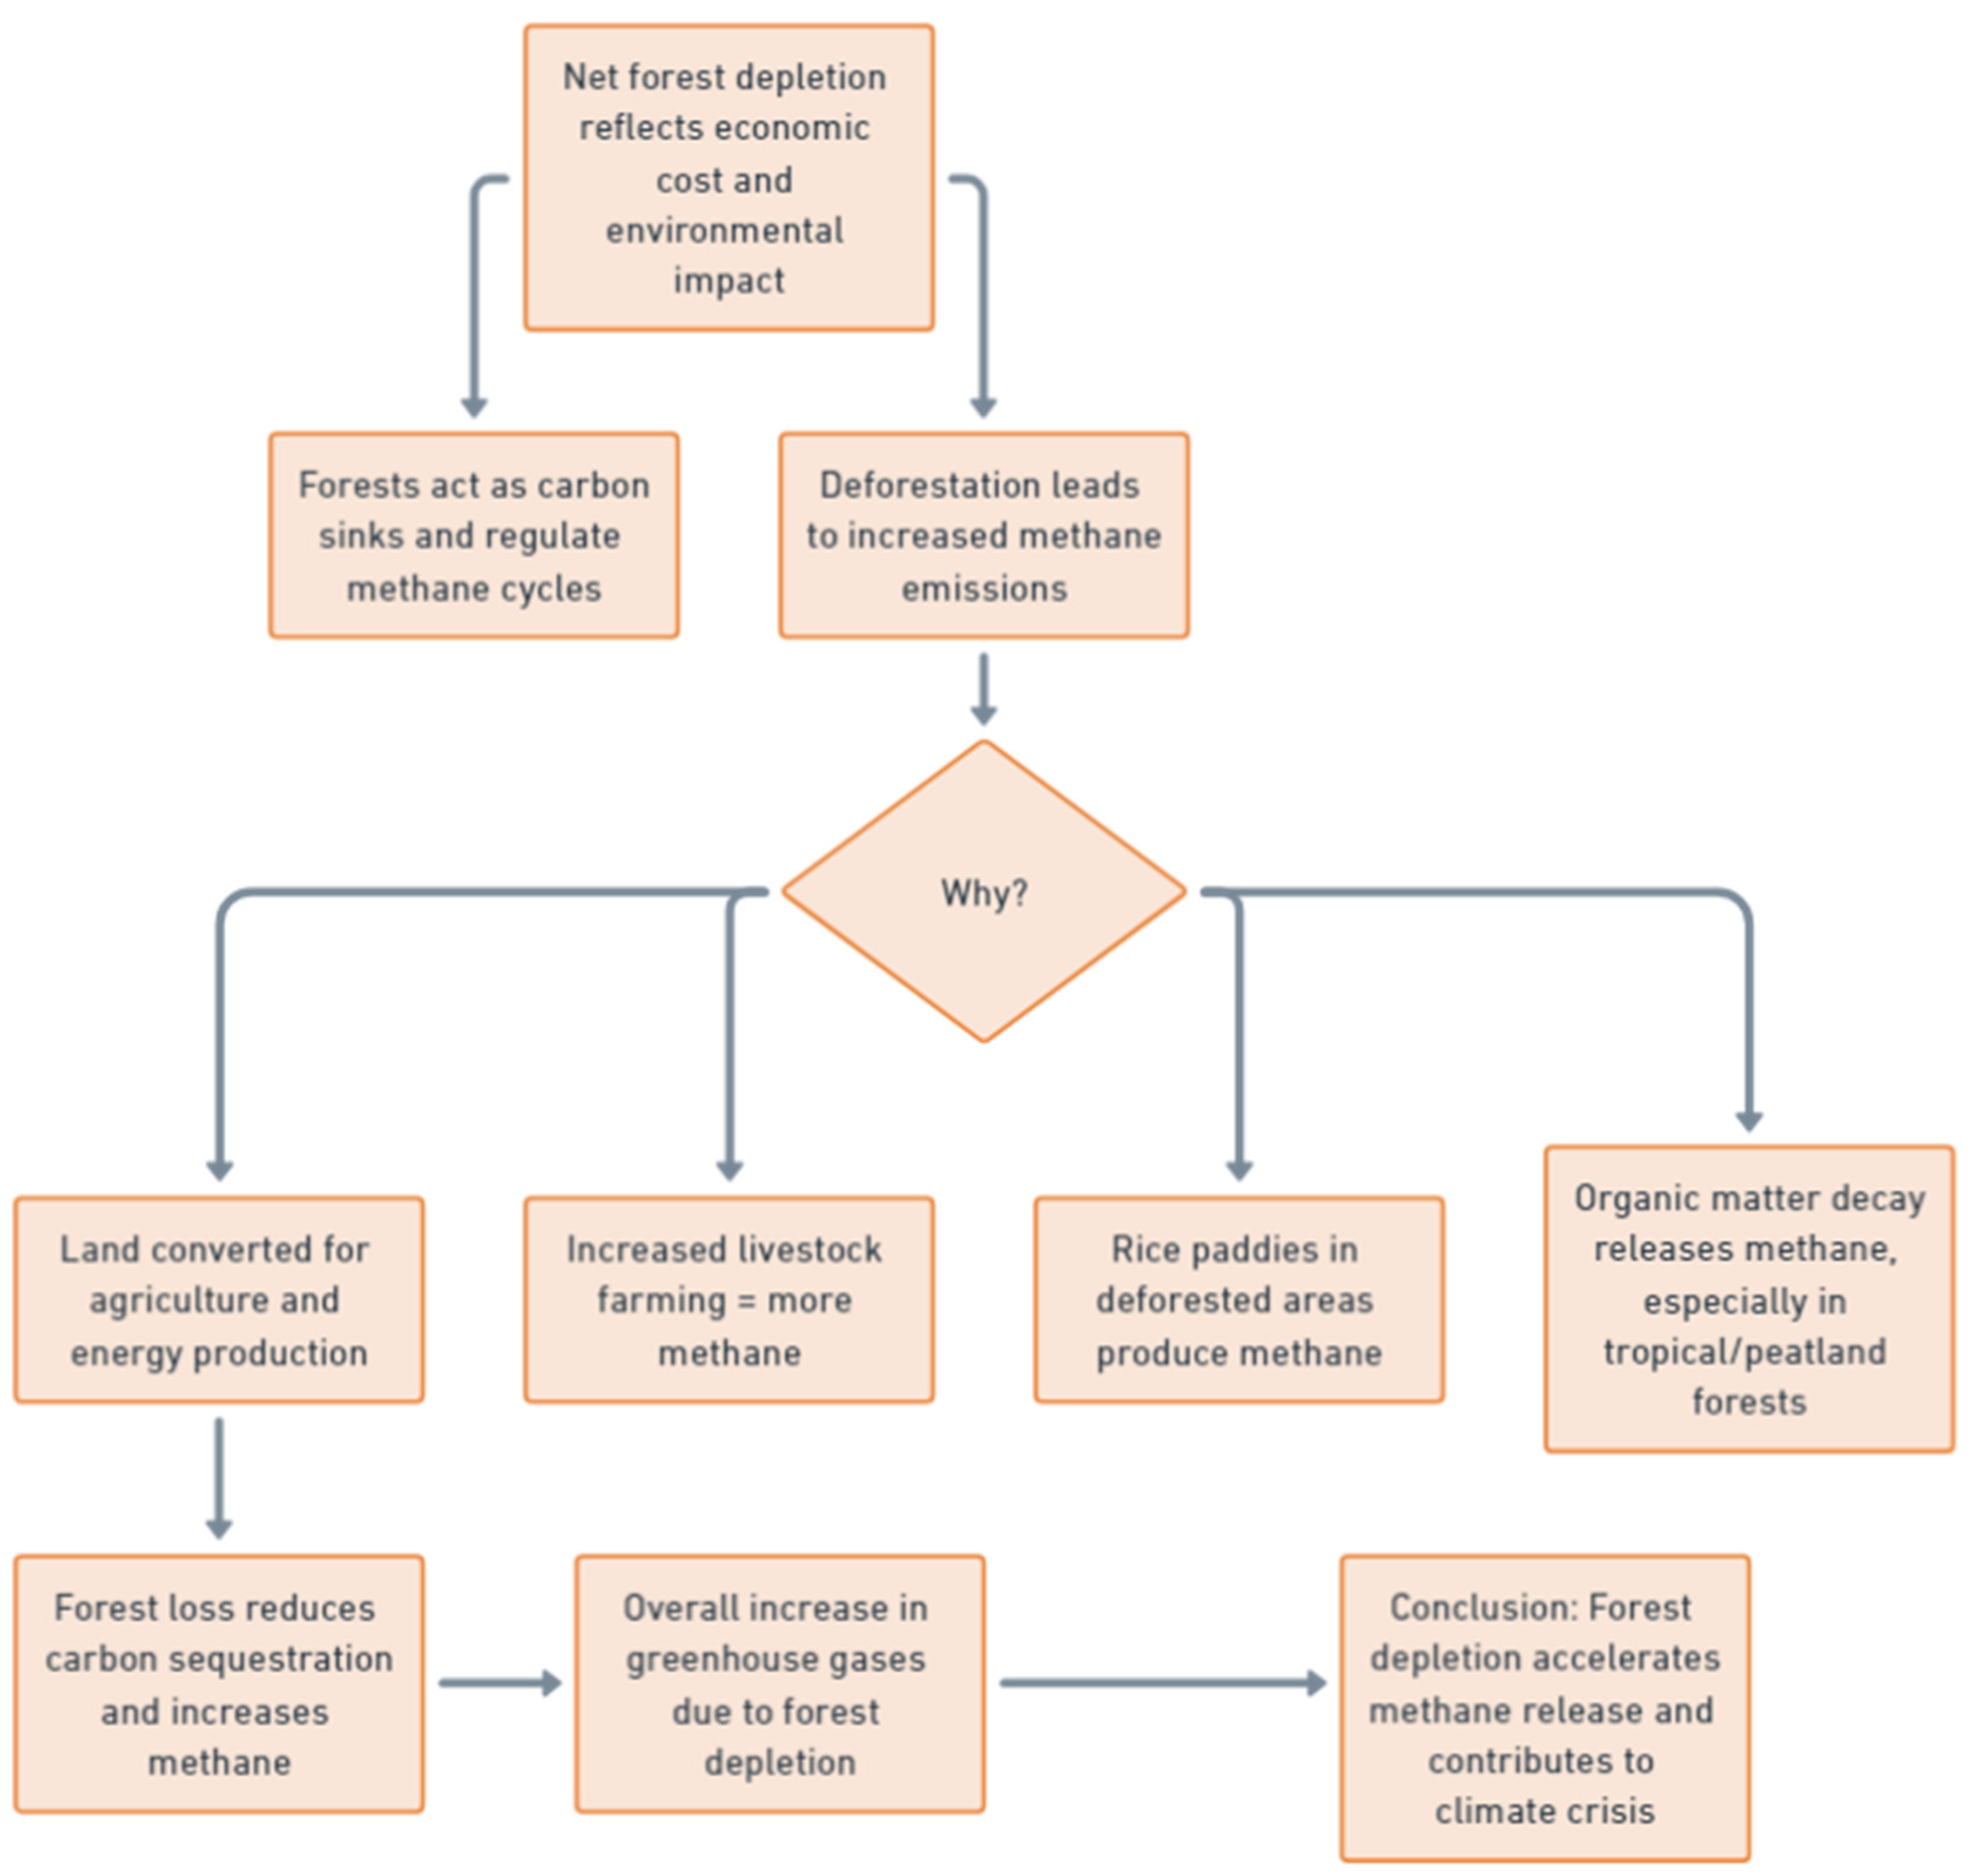
The relationship between net forest depletion and methane emissions. The positive relationship between net forest depletion and methane emissions stems from the interconnectedness of land use changes, deforestation, and methane-producing activities. Forest depletion, often driven by agricultural expansion, logging, and land conversion for energy production, can exacerbate methane emissions in various ways, highlighting the environmental consequences of unsustainable land use practices. Net forest depletion reflects the economic cost of losing forests, which serve as vital carbon sinks. Forests absorb large amounts of carbon dioxide and regulate methane cycles in ecosystems. However, when forests are depleted, they lose their capacity to sequester carbon and methane, contributing to an increase in GHG concentrations. Moreover, deforestation often leads to land being repurposed for agricultural activities, particularly livestock farming and rice cultivation – two of the largest anthropogenic sources of methane. Livestock farming, especially cattle, produces significant amounts of methane through enteric fermentation, a digestive process in ruminants that generates methane as a byproduct. As forests are cleared to make way for pasturelands, the methane emissions from livestock increase, further intensifying the positive relationship between forest depletion and methane. Additionally, rice paddies, often developed in deforested areas, are another major source of methane due to anaerobic decomposition in waterlogged soils. The expansion of agriculture into formerly forested areas directly amplifies methane emissions. Furthermore, forest depletion can contribute to methane emissions through the decay of organic matter in cleared land. When forests are cut down or burned, the carbon stored in trees and soil is released into the atmosphere, sometimes as methane, depending on the conditions of decomposition. In tropical and peatland forests, this can be particularly significant, as the conditions in these ecosystems are conducive to methane production during biomass decay. In conclusion, net forest depletion is positively correlated with methane emissions due to the conversion of forests into agricultural lands, increased livestock farming, and the release of methane from decaying organic matter (see
Figure 7). This dynamic underscores the far-reaching consequences of deforestation, not only in terms of carbon emissions but also in accelerating methane release, thus exacerbating the global climate crisis [
82,
89,
90].
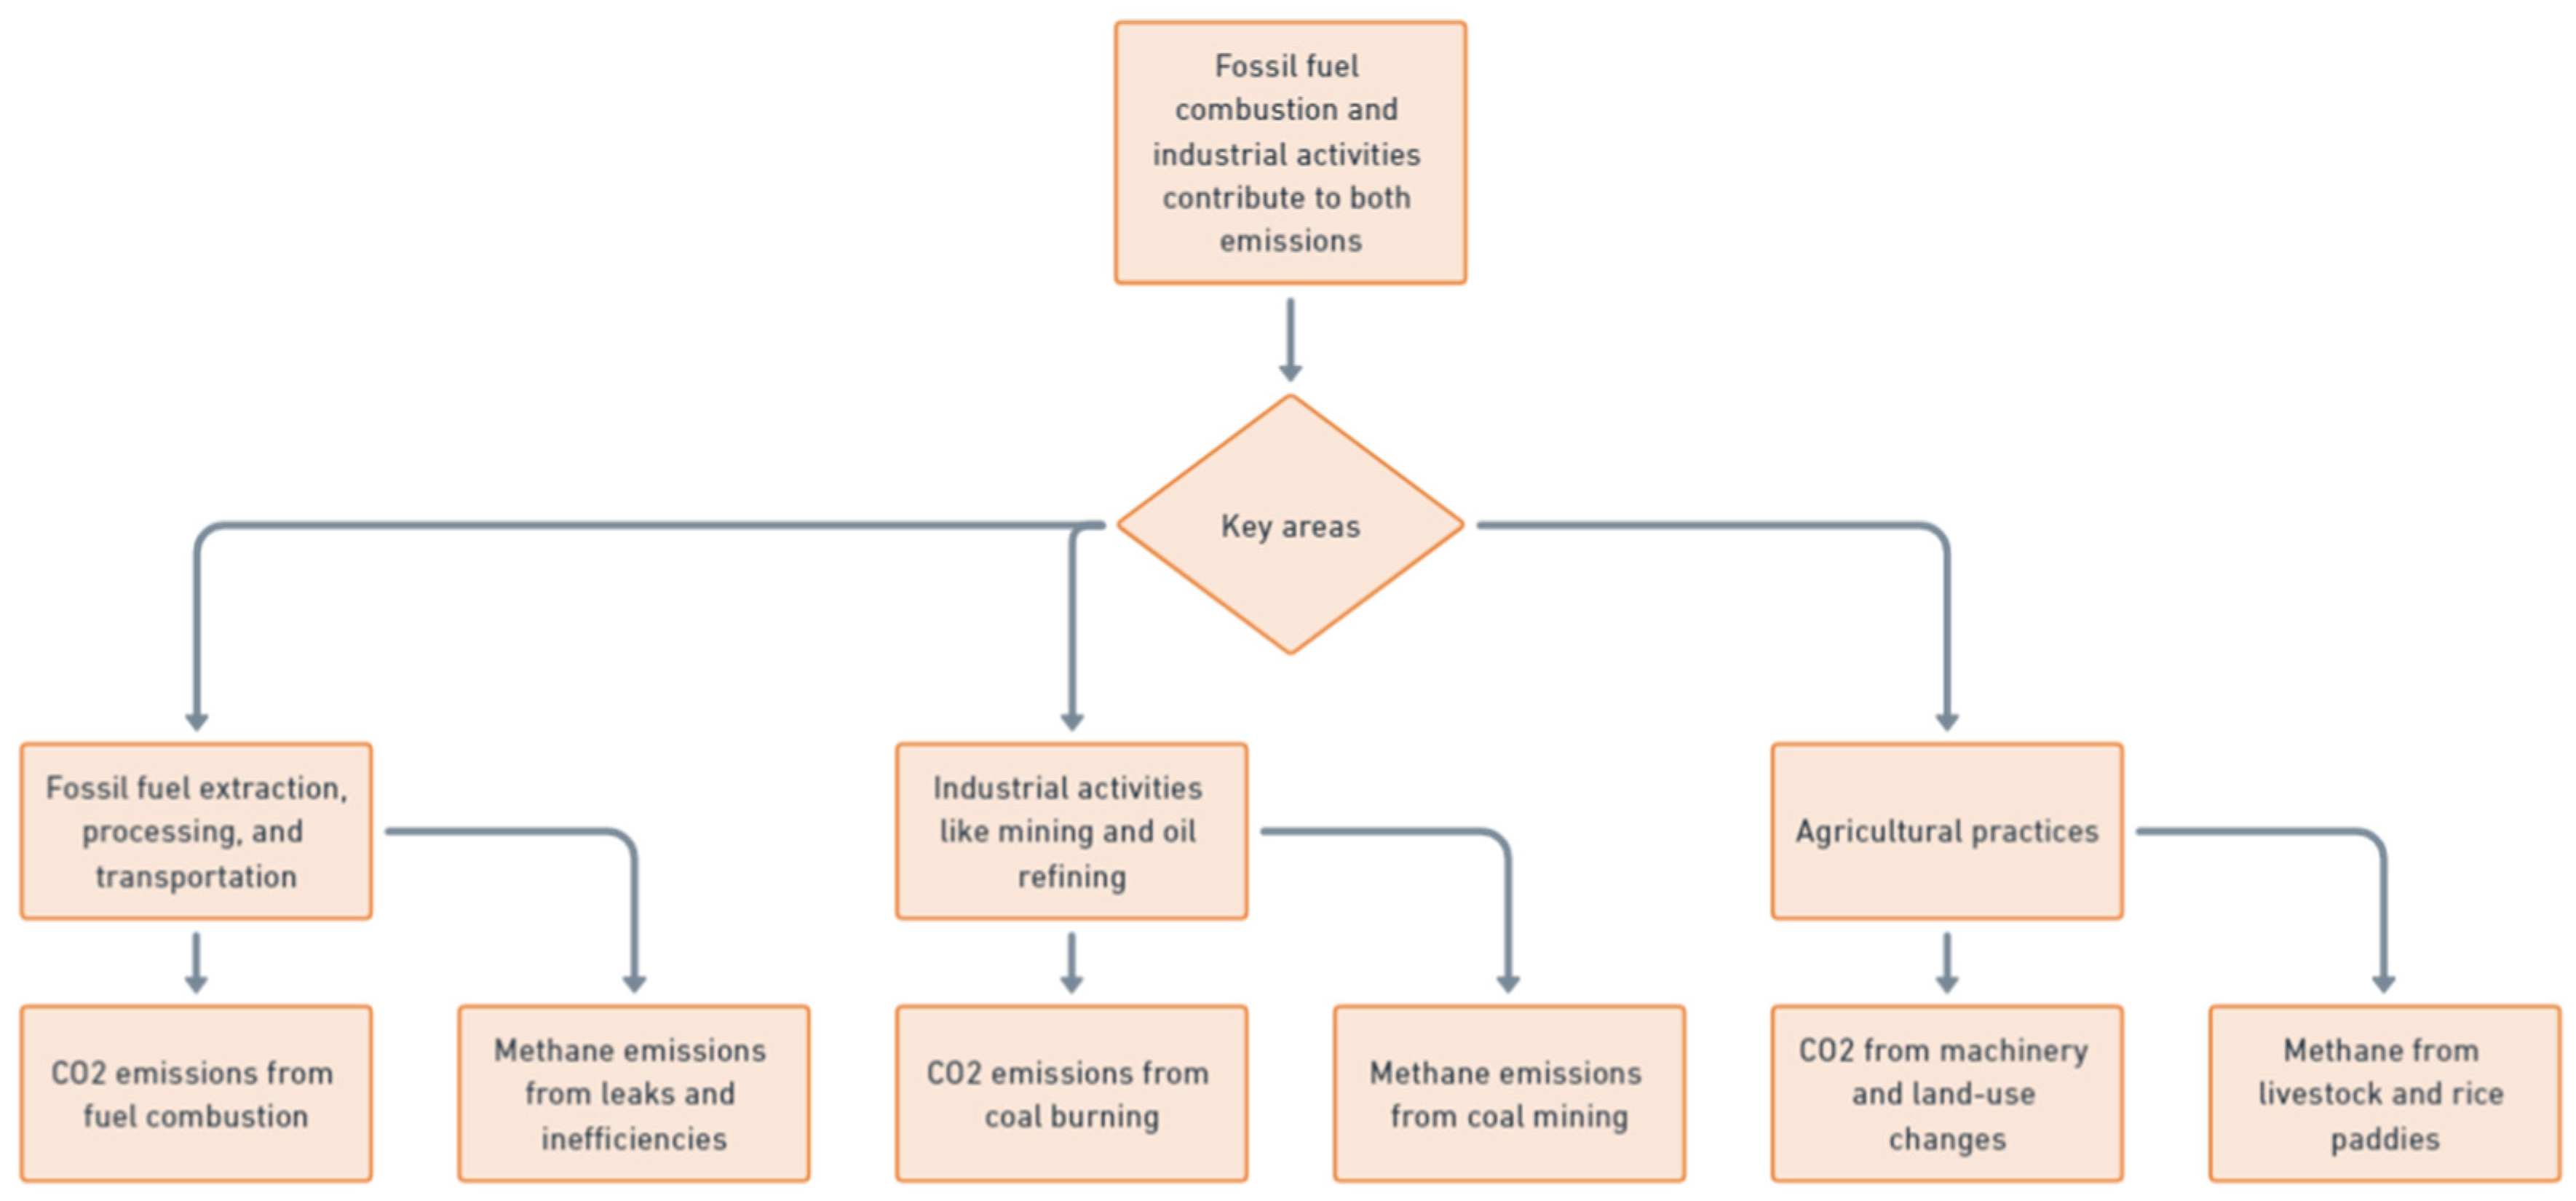
The relationship between CO₂ emissions and methane emissions. The positive relationship between CO₂ emissions (metric tons per capita) and methane emissions arises from their common sources, particularly fossil fuel combustion, industrial activities, and agricultural practices. Both carbon dioxide and methane are major GHGs that contribute to global warming, but they originate from overlapping sectors, making their emissions interrelated. One key area where CO₂ and methane emissions are linked is fossil fuel extraction and use. Fossil fuels such as coal, oil, and natural gas are primary contributors to CO₂ emissions when burned for energy production, transportation, and industrial processes. At the same time, methane is often released during the extraction, processing, and transportation of these fuels. For example, methane is a major component of natural gas and can leak into the atmosphere during drilling, extraction, and transportation – a phenomenon known as fugitive methane emissions. This means that as CO₂ emissions increase with higher fossil fuel consumption per capita, methane emissions also tend to rise due to these leaks and inefficiencies in the fossil fuel supply chain. In addition to energy production, industrial activities like mining and oil refining release both CO₂ and methane. For instance, coal mining generates significant methane emissions, as methane is trapped in coal seams and released during mining operations. Simultaneously, the burning of coal for electricity and industrial energy contributes to high levels of CO₂ emissions. The coexistence of these emissions sources in industrial sectors strengthens the positive correlation between CO₂ and methane. Agriculture is another critical sector where the relationship between these emissions is evident. Practices like livestock farming and rice cultivation release both methane (from enteric fermentation in animals and anaerobic conditions in rice paddies) and CO₂ (from the combustion of fossil fuels in agricultural machinery and land-use changes). Countries with intensive agricultural activities thus tend to have high per capita emissions of both CO₂ and methane. In conclusion, the positive relationship between CO₂ emissions and methane emissions arises from shared sources in fossil fuel use, industrial activity, and agriculture (see
Figure 8). As economic activities and energy consumption intensify, both CO₂ and methane emissions increase, contributing to the broader challenge of global climate change [
91,
92,
93].
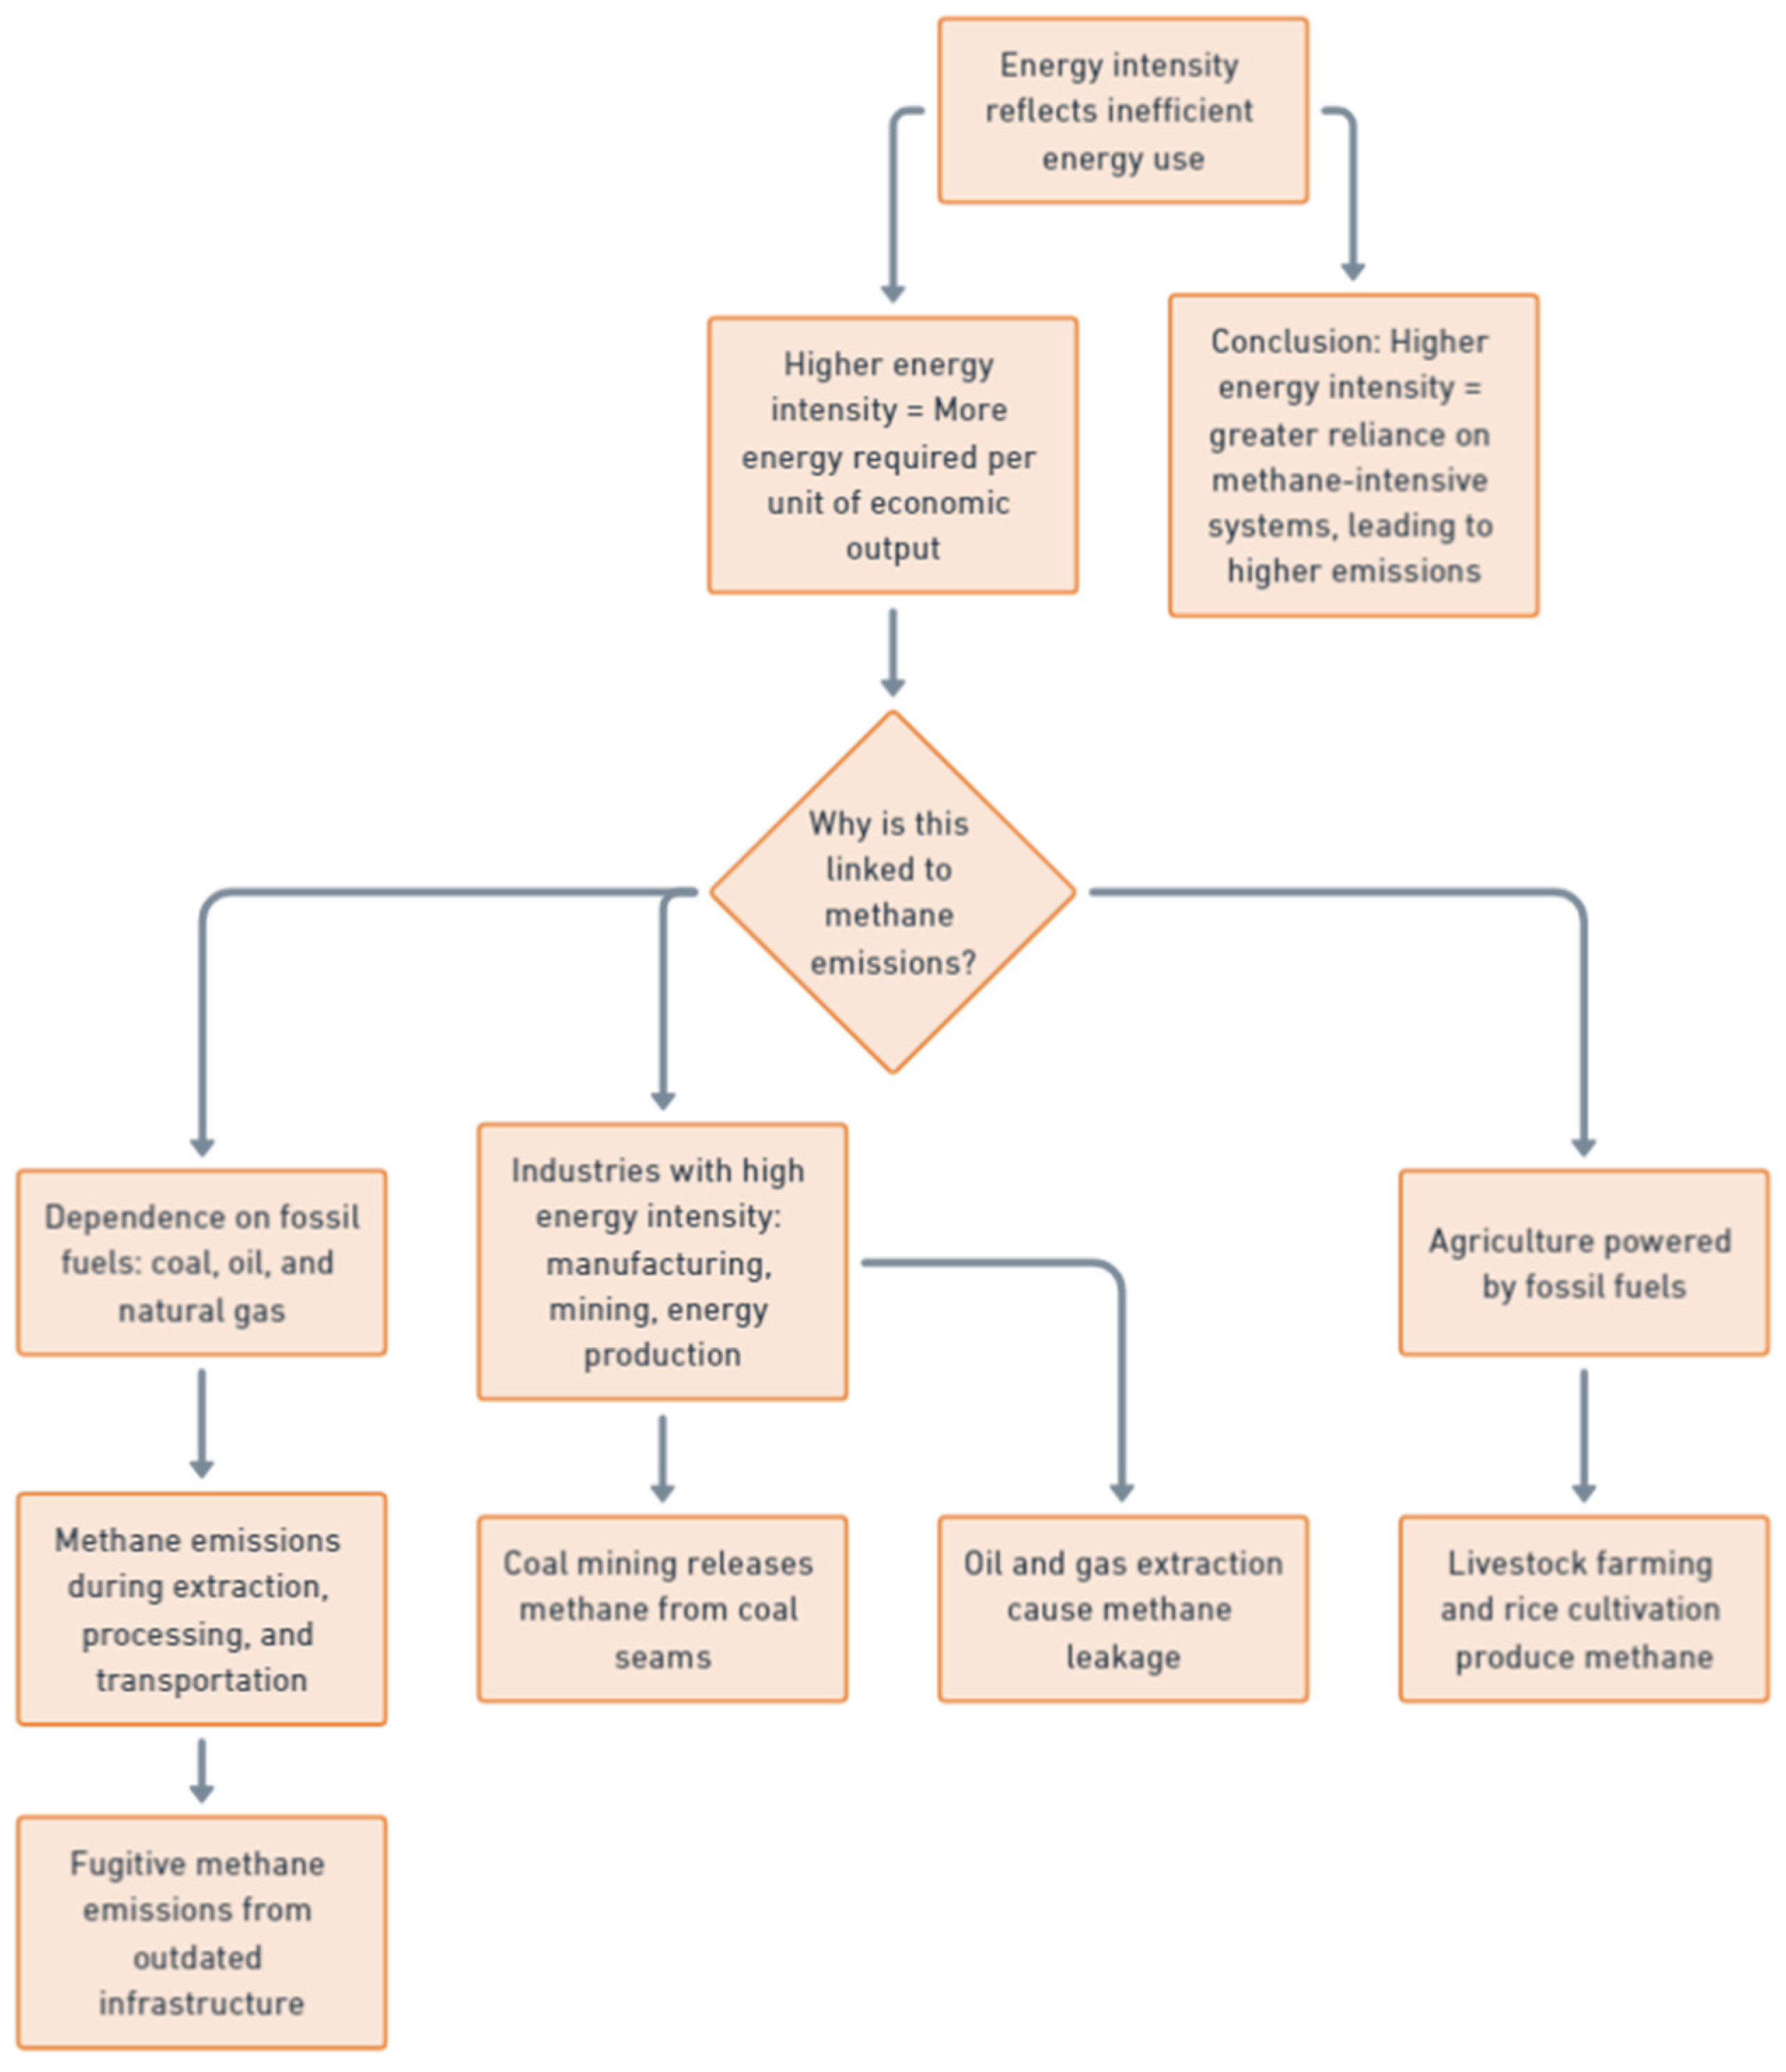
The relationship between energy intensity and methane emissions. Energy intensity reflects the amount of energy required to produce one unit of economic output, with higher values indicating that a country or economy is using energy less efficiently. This inefficiency is often linked to higher methane emissions due to the reliance on methane-intensive energy sources, such as coal, oil, and natural gas, which release methane during extraction, processing, and transportation. In economies with high energy intensity, a significant portion of energy comes from fossil fuels, particularly natural gas. Natural gas, while considered cleaner than coal in terms of carbon dioxide emissions, contributes significantly to methane emissions. Methane, being the primary component of natural gas, leaks at various stages of the fuel's life cycle, from extraction to distribution. These "fugitive" methane emissions are especially prevalent in energy systems with outdated or poorly maintained infrastructure, where energy losses are high, and methane is released unintentionally. As energy intensity rises, more fossil fuels are required to sustain economic output, thereby increasing the chances of methane emissions, particularly from natural gas operations. Furthermore, economies with higher energy intensity tend to rely heavily on industries such as manufacturing, mining, and energy production, which are both energy-intensive and methane-producing. For example, coal mining, a significant contributor to energy intensity, is also a major source of methane emissions, as methane trapped in coal seams is released during the extraction process. Similarly, oil and gas extraction, central to many high-energy-intensity economies, results in significant methane leakage alongside carbon dioxide emissions. Additionally, agricultural sectors in energy-intensive economies, often powered by fossil fuels, contribute to methane emissions, particularly from livestock farming and rice cultivation. These agricultural activities are energy-intensive and produce significant methane, further illustrating the link between energy inefficiency and methane emissions. In conclusion, higher energy intensity often indicates greater reliance on inefficient, methane-intensive energy systems, leading to increased methane emissions (see
Figure 9). The combination of fossil fuel dependency, outdated infrastructure, and energy-intensive industries amplifies both energy use and methane emissions, reinforcing the positive relationship between these two variables [
94,
95].
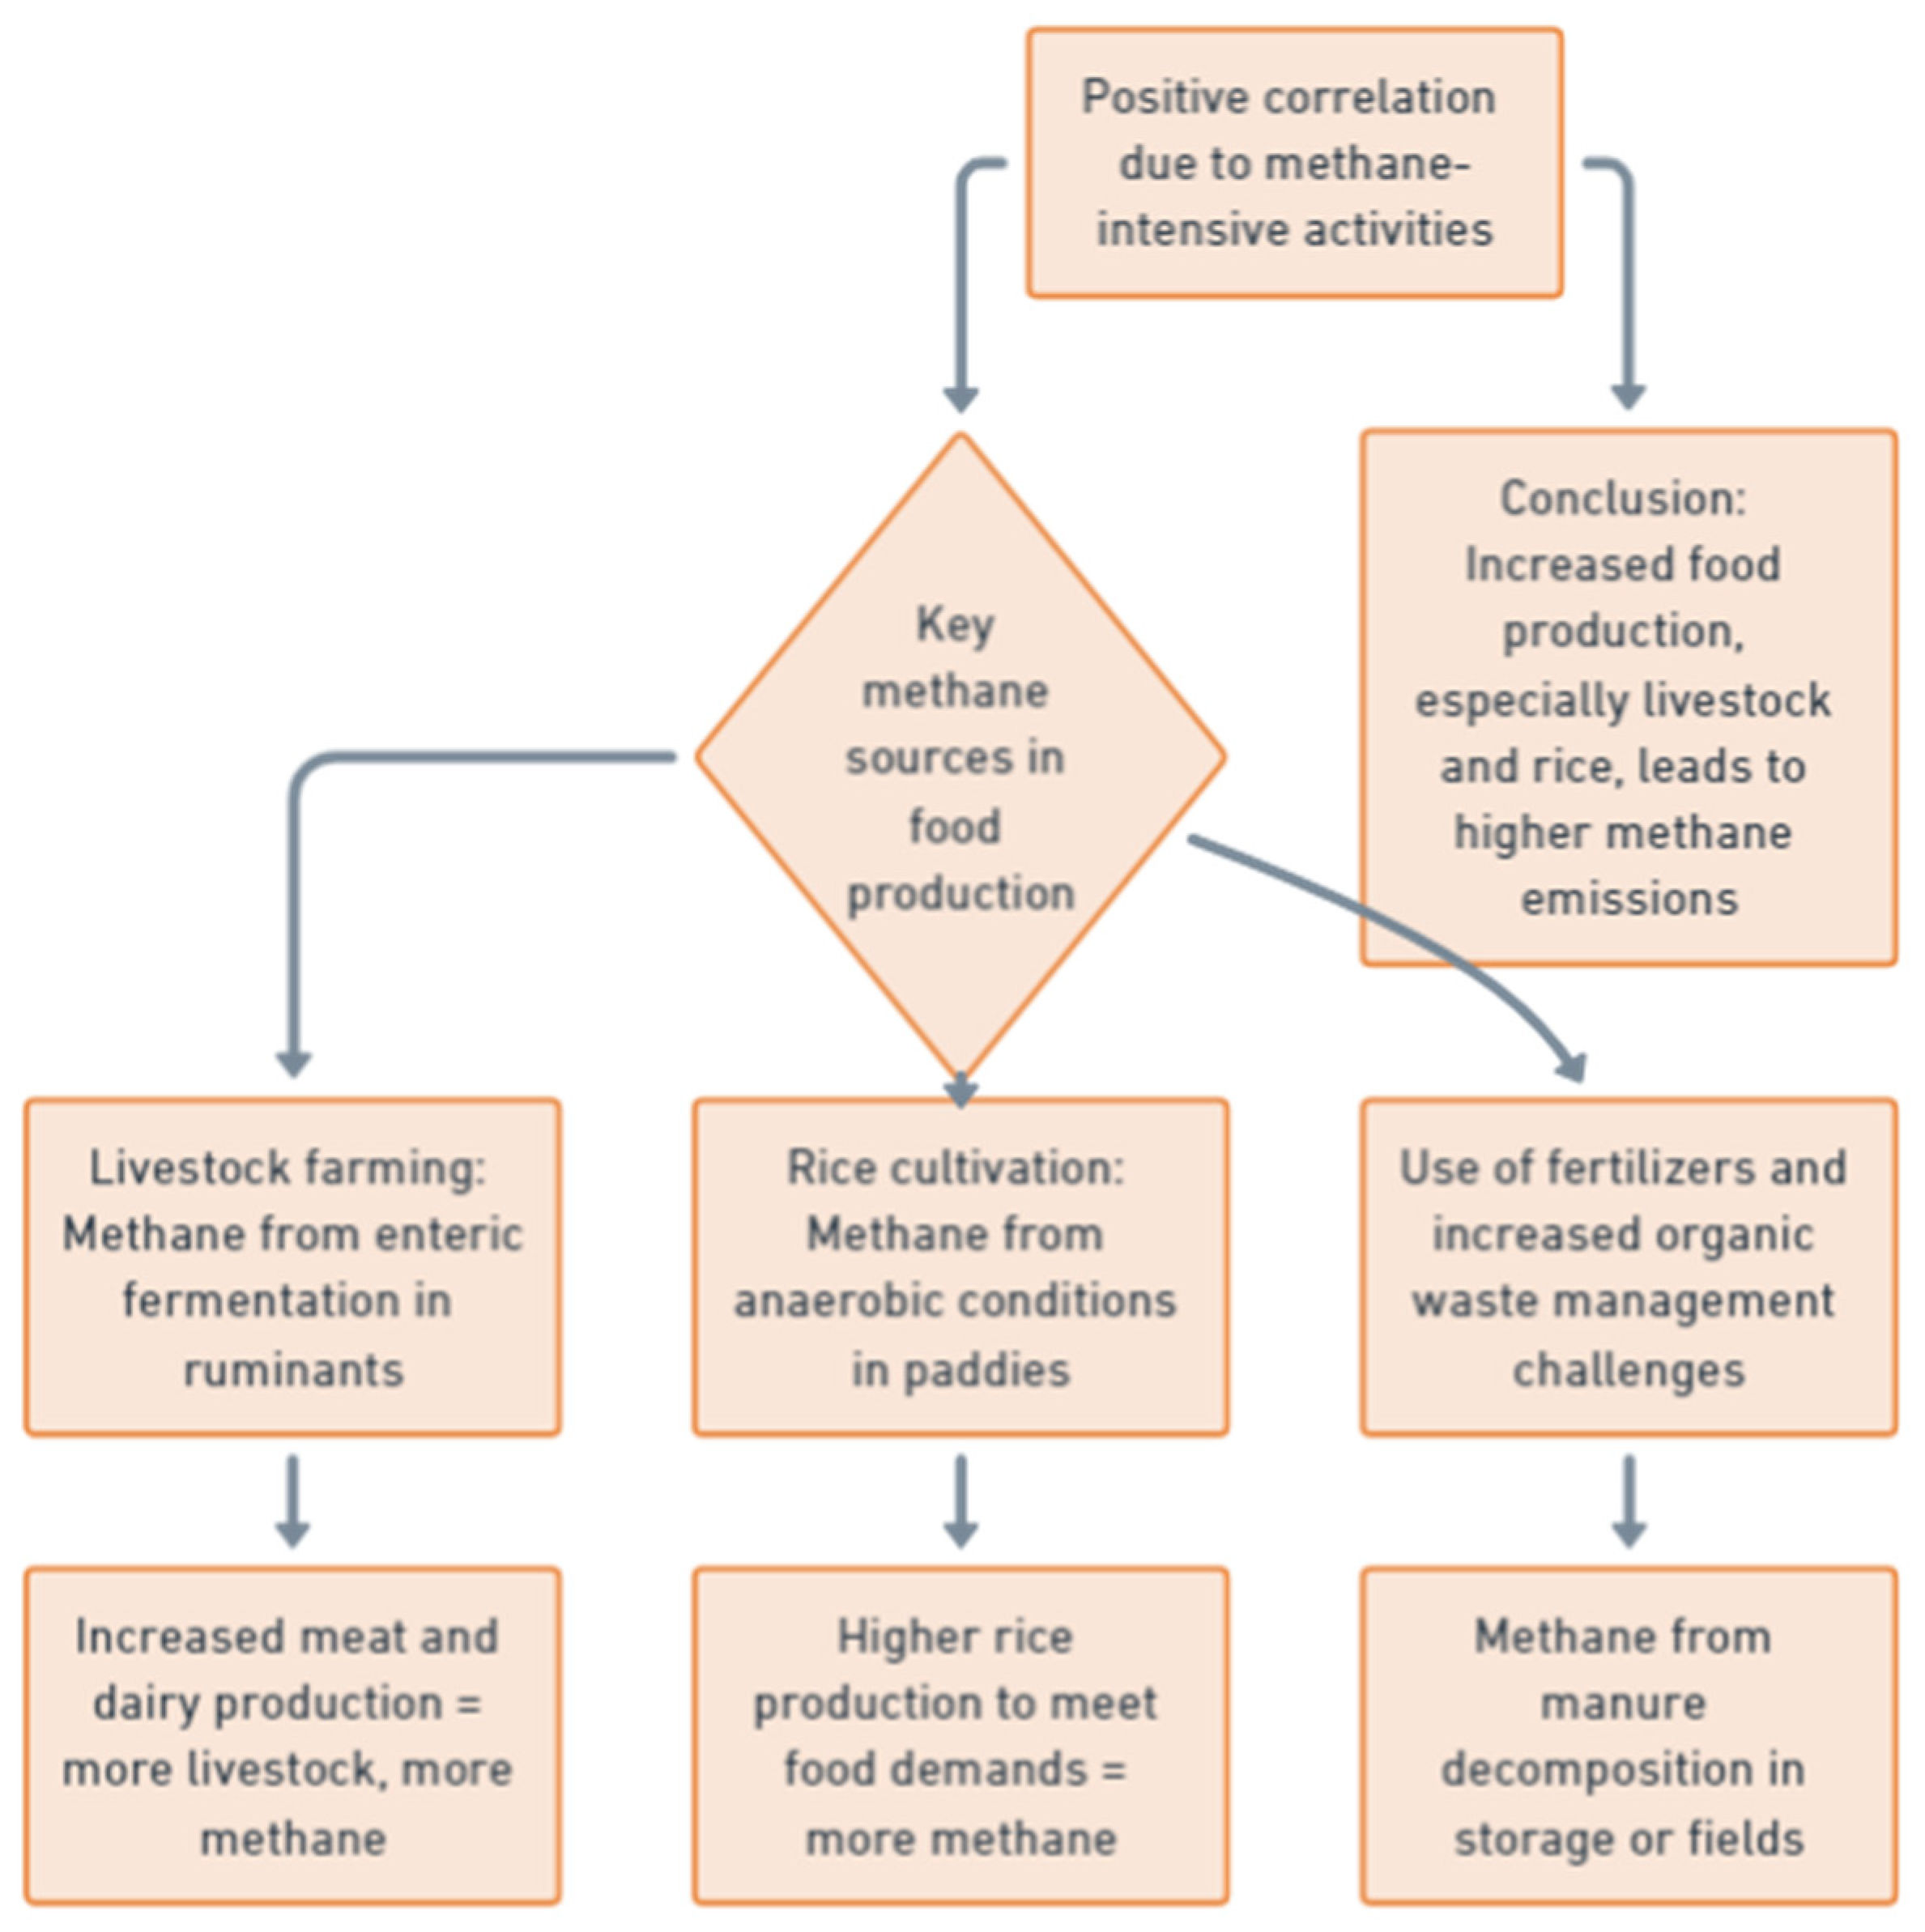
Food production index and methane emissions. The positive relationship between the Food Production Index and methane emissions is driven by the significant methane-producing activities associated with increasing food production, particularly in the agricultural sector. As the Food Production Index rises, indicating higher levels of food production, so do the processes that generate methane, contributing to a positive correlation between the two. One of the most significant contributors to methane emissions in food production is livestock farming. Ruminant animals such as cows, sheep, and goats produce methane through enteric fermentation, a digestive process that generates methane as a byproduct. As food production increases, especially in meat and dairy products, the number of livestock tends to rise, leading to higher methane emissions. The growing global demand for animal-based products, especially in developing countries experiencing economic growth, further amplifies this trend, directly linking increases in the Food Production Index to greater methane output. In addition to livestock farming, rice cultivation plays a crucial role in methane emissions. Rice paddies are responsible for a large share of agricultural methane emissions due to the anaerobic conditions under which rice is grown. When fields are flooded, organic matter in the soil decomposes without oxygen, producing methane as a byproduct. As the Food Production Index increases to meet rising global food demands, rice production also scales up, intensifying methane emissions from these waterlogged fields. Furthermore, using fertilizers in agriculture, which often increases with intensified food production, can contribute indirectly to methane emissions. Although the primary GHG from fertilizers is nitrous oxide, the overall intensification of agriculture can lead to more significant organic waste management challenges, such as increased production of manure from livestock, which generates methane as it decomposes in storage or during application on fields. In conclusion, the positive relationship between the Food Production Index and methane emissions stems from the intensification of livestock farming, rice cultivation, and organic waste decomposition—all of which are methane-intensive activities (see
Figure 10). As food production rises to meet global demands, these agricultural processes expand, contributing to the overall increase in methane emissions, thus linking greater food production to heightened environmental impacts [
96,
97,
98].
4.2. Methane Emissions and the S-Social Component within the ESG Model
Regarding the relationship between methane emissions and the social component of the ESG model, the following equation is estimated:
where i=193 and t=[2011;2020].
The econometric results are shown in
Table 3.
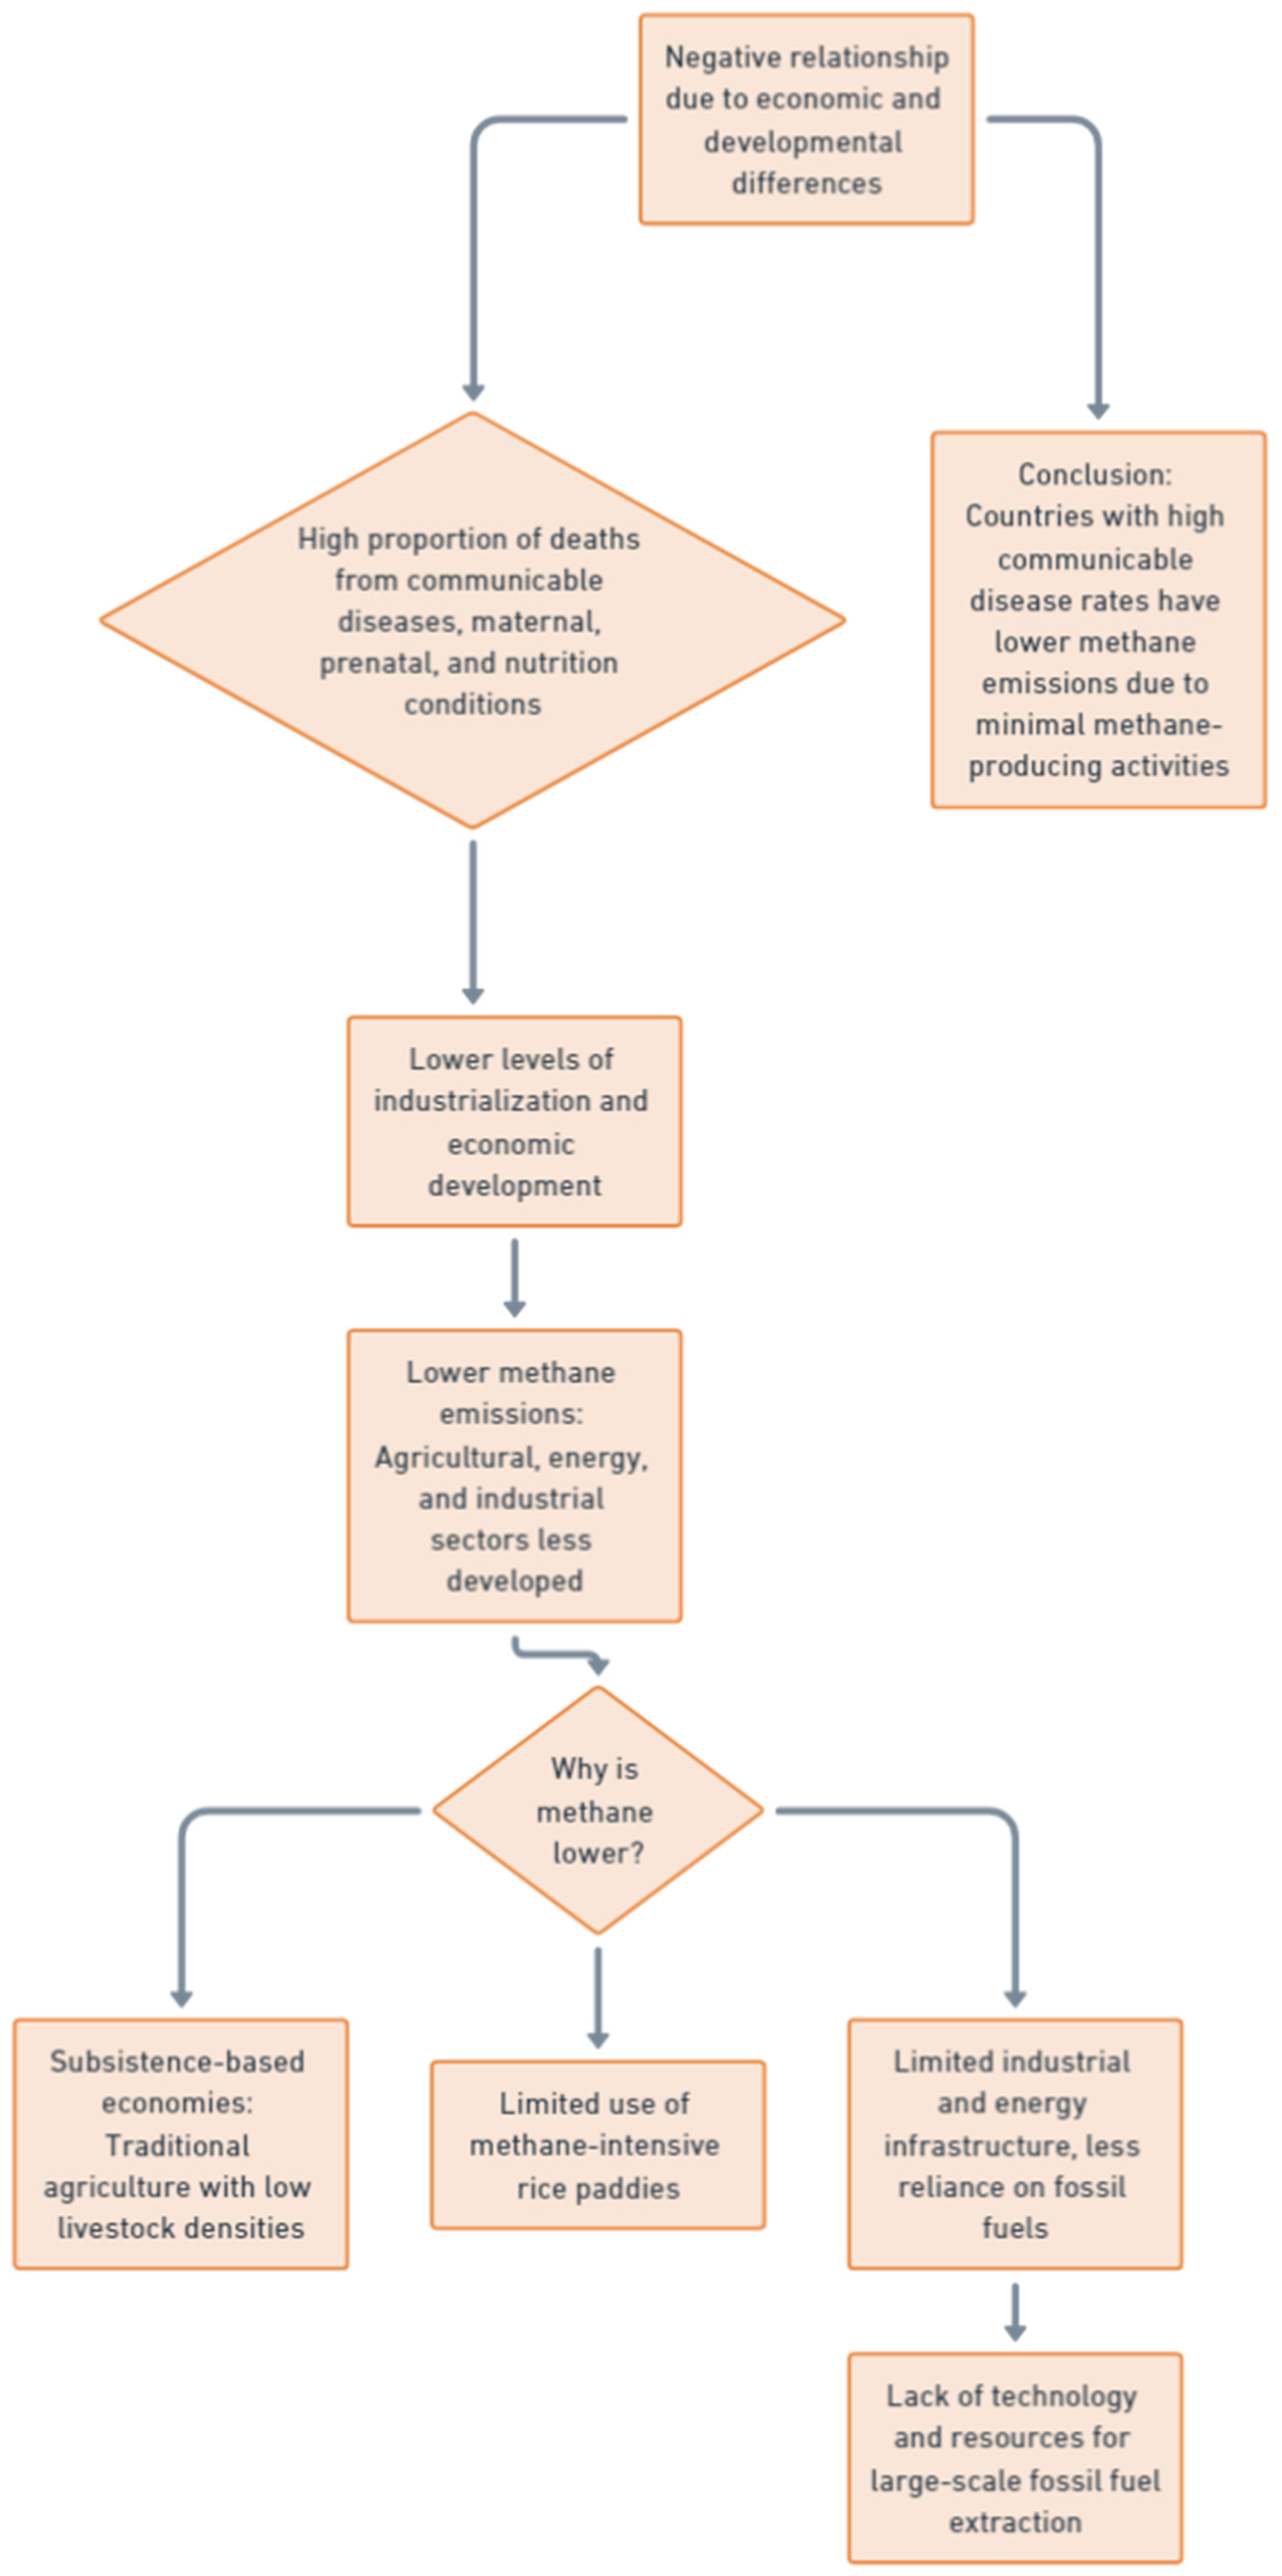
The relationship between the cause of death and methane emissions. The negative relationship between the percentage of deaths caused by infectious diseases, maternal, prenatal, and nutrition conditions, and methane emissions can be explained by the economic and developmental differences between countries with varying public health profiles. Countries with a high proportion of deaths attributed to infectious diseases and maternal, prenatal, and nutritional conditions often have lower levels of industrialization and economic development. These nations typically emit lower methane levels, as their agricultural, energy, and industrial sectors are not as heavily developed or mechanized compared to more industrialized economies. Methane emissions are primarily associated with advanced agricultural practices, fossil fuel extraction, and energy-intensive industries, which are more prevalent in developed countries where non-communicable diseases cause mortality. In contrast, countries struggling with high rates of infectious diseases and maternal or nutritional conditions often have subsistence-based economies where traditional, less methane-intensive agricultural methods prevail. For instance, small-scale farming in these regions usually involves lower livestock densities and minimal use of rice paddies, which are significant methane sources in industrial agriculture. Additionally, the limited industrial and energy infrastructure in these countries means less reliance on methane-emitting fossil fuels, such as natural gas. These countries often lack the technology and resources for large-scale fossil fuel extraction, reducing their contribution to methane emissions from the energy sector. These economies usually emphasize meeting basic needs rather than expanding agricultural production or energy consumption to levels that significantly increase methane output. In summary, countries where infectious diseases and maternal, prenatal, and nutritional conditions are prevalent tend to have lower methane emissions due to their less developed agricultural, industrial, and energy sectors (see
Figure 11). This creates a negative relationship between these health indicators and methane emissions, as the underlying economic activities associated with high methane output are generally absent or minimal [
99,
100,
101].
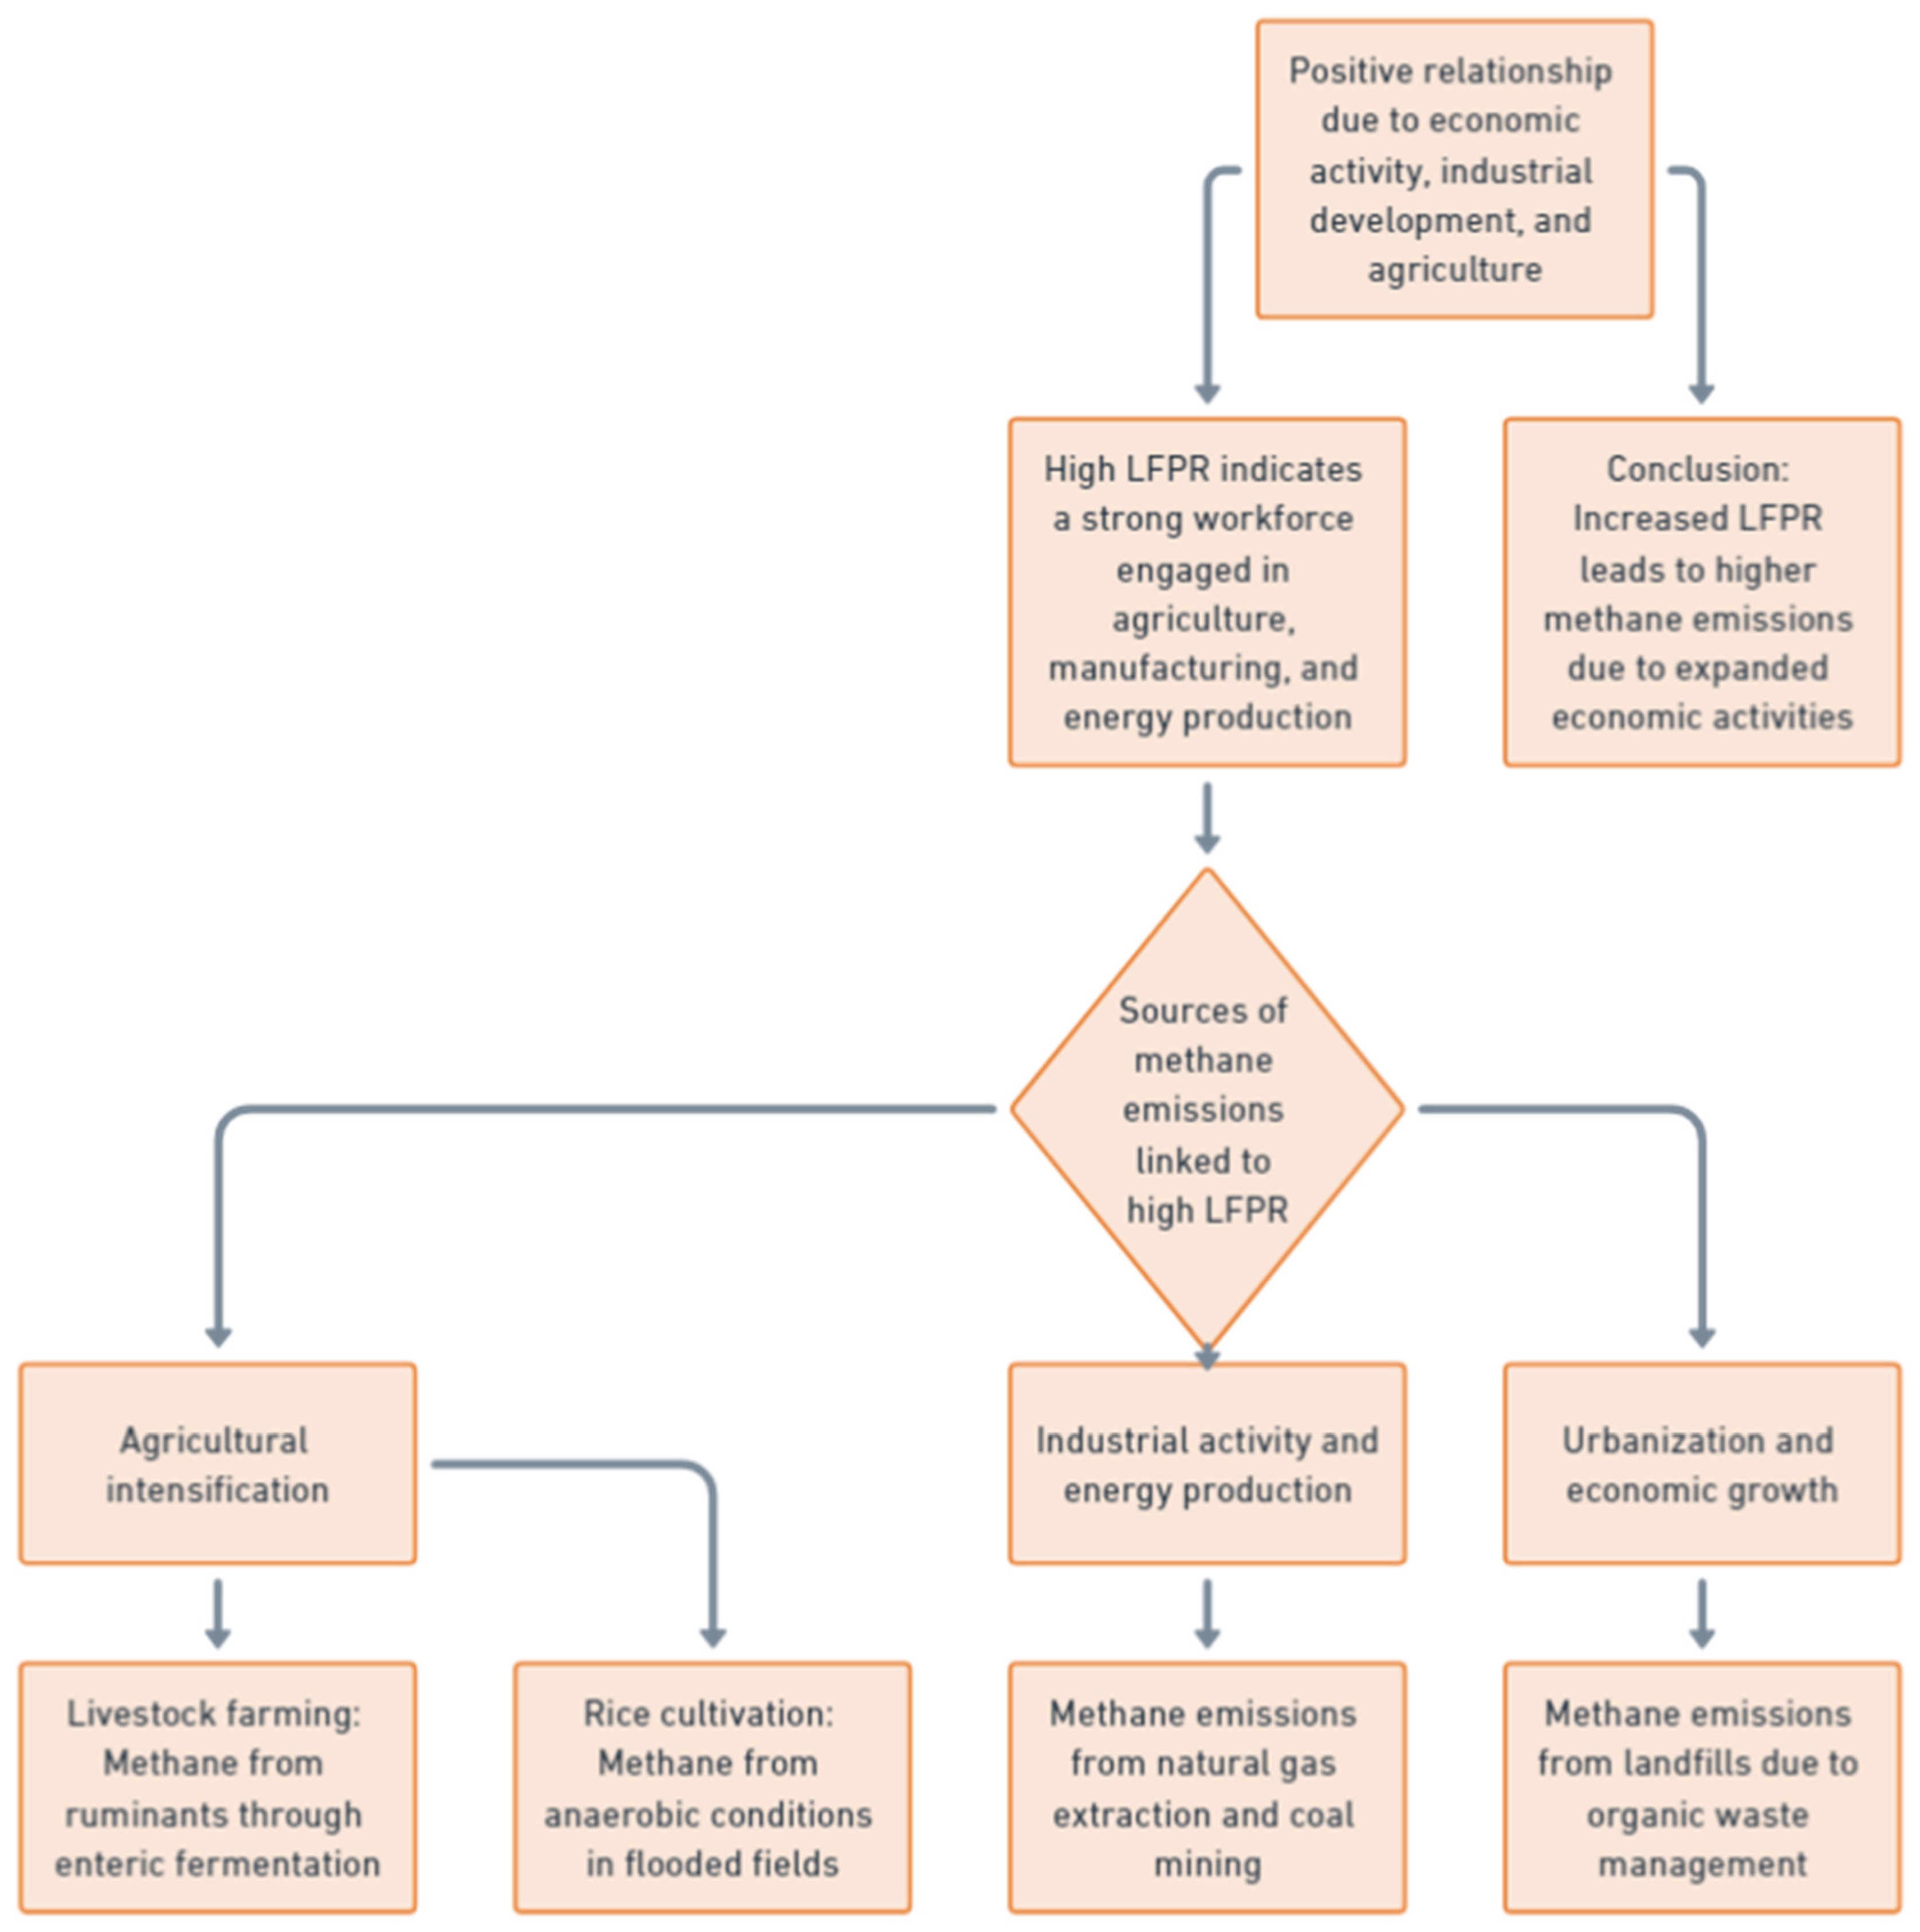
The positive relationship between labor force participation and methane emissions. The positive relationship between the labor force participation rate and methane emissions is largely influenced by economic activity, industrial development, and agricultural practices. A high labor force participation rate typically indicates an economy with a strong workforce actively engaged in various sectors, including agriculture, manufacturing, and energy production. These sectors, particularly in developing and industrialized countries, are significant sources of methane emissions, thus establishing a positive link between labor force engagement and methane output. In economies where a large proportion of the population is employed, agricultural activities are often intensified to meet both domestic and export demands. Labor-intensive livestock farming becomes a significant contributor to methane emissions. Ruminant animals, such as cattle, sheep, and goats, produce methane through enteric fermentation. With a higher labor force engaged in this sector, agricultural production expands, leading to increased livestock numbers and, consequently, higher methane emissions. Additionally, rice cultivation, another labor-intensive agricultural activity prevalent in many developing countries, generates methane due to the anaerobic conditions in flooded fields. Emissions increase proportionally as the workforce actively engages in and supports these methane-producing activities. Beyond agriculture, a high LFPR is also associated with higher levels of industrial activity and energy production, both of which contribute to methane emissions. Economies with strong labor force participation often have active energy sectors, such as natural gas extraction and coal mining, where methane leaks occur as a byproduct. The greater the scale of industrial operations supported by a large workforce, the more opportunities for methane emissions, particularly when fossil fuel extraction and processing are involved. Urbanization and economic growth, which accompany high labor force participation, can also increase methane emissions indirectly through greater waste production. A growing labor force supports expanding urban centers, where organic waste management becomes challenging, often leading to methane emissions from landfills (see
Figure 12). Therefore, as the labor force participation rate increases, so does the intensity and scale of economic activities that are major sources of methane, reinforcing the positive relationship between these variables [
102,
103,
104].
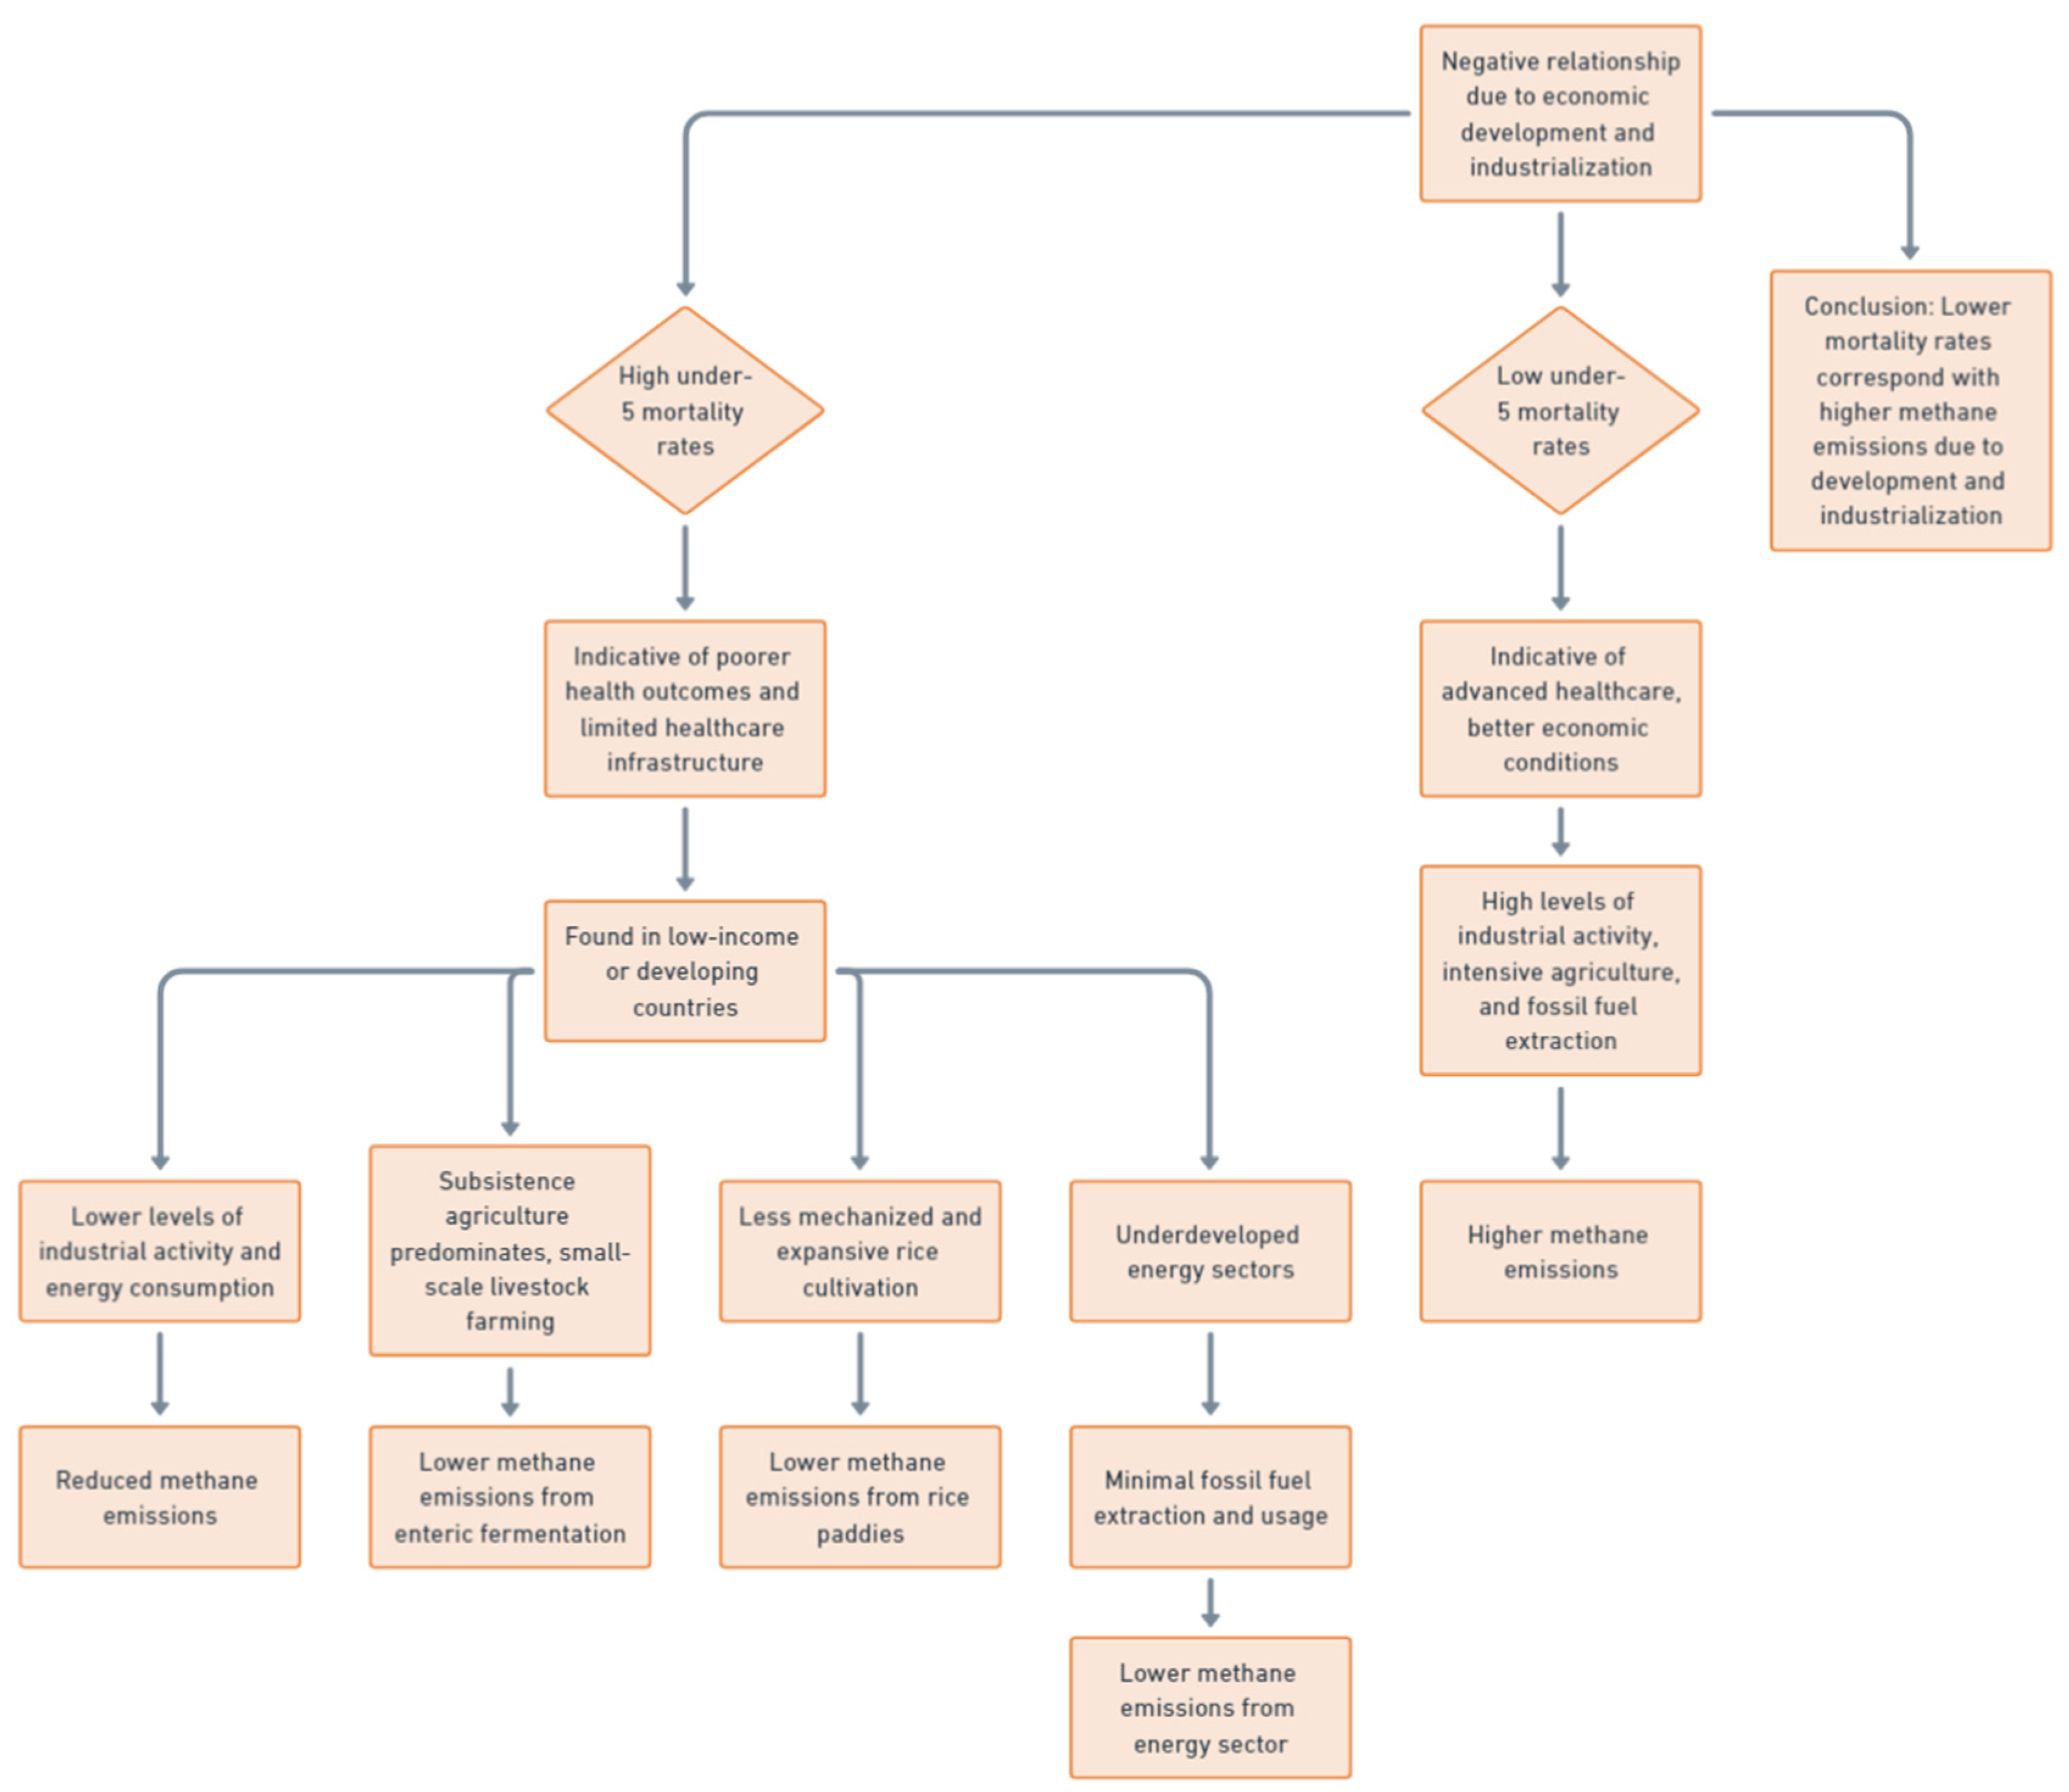
The relationship between mortality rate and methane emissions. The negative relationship between mortality rate and methane emissions is closely tied to the level of economic development and industrialization within a country. High mortality rates are generally indicative of poorer health outcomes, limited healthcare infrastructure, and lower socioeconomic development. These conditions are most commonly found in low-income or developing countries that typically have lower levels of industrial activity and energy consumption, leading to reduced methane emissions. Countries with high mortality rates often rely on subsistence agriculture rather than intensive, methane-emitting agricultural practices. In these regions, livestock farming tends to be small-scale, with fewer animals per farm compared to the large-scale operations found in more developed nations. Consequently, methane emissions from enteric fermentation (a significant source of methane in livestock farming) are lower. Furthermore, rice cultivation – a major methane source in agriculture – is less mechanized and expansive in countries with high mortality rates, reducing methane emissions from waterlogged rice paddies. Additionally, these countries often have underdeveloped energy sectors. Fossil fuel extraction and usage, particularly natural gas, are significant sources of methane emissions in more industrialized nations. However, in countries with high mortality rates, energy infrastructure is often minimal, and there is less reliance on fossil fuels for energy production. As a result, these nations contribute less to methane emissions associated with fossil fuel extraction and usage. In contrast, countries with low mortality rates typically have advanced healthcare systems, better economic conditions, and more developed agricultural and energy sectors – all of which contribute to higher methane emissions. These nations often engage in intensive agriculture, industrial-scale livestock farming, and fossil fuel extraction, leading to increased methane output. Thus, the negative relationship between mortality rates and methane emissions reflects the link between economic development, health outcomes, and the scale of methane-producing activities (see
Figure 13). Lower mortality rates correspond with higher methane emissions due to the expansion of agriculture, industry, and energy production typical of more developed economies [
105,
106,
107].
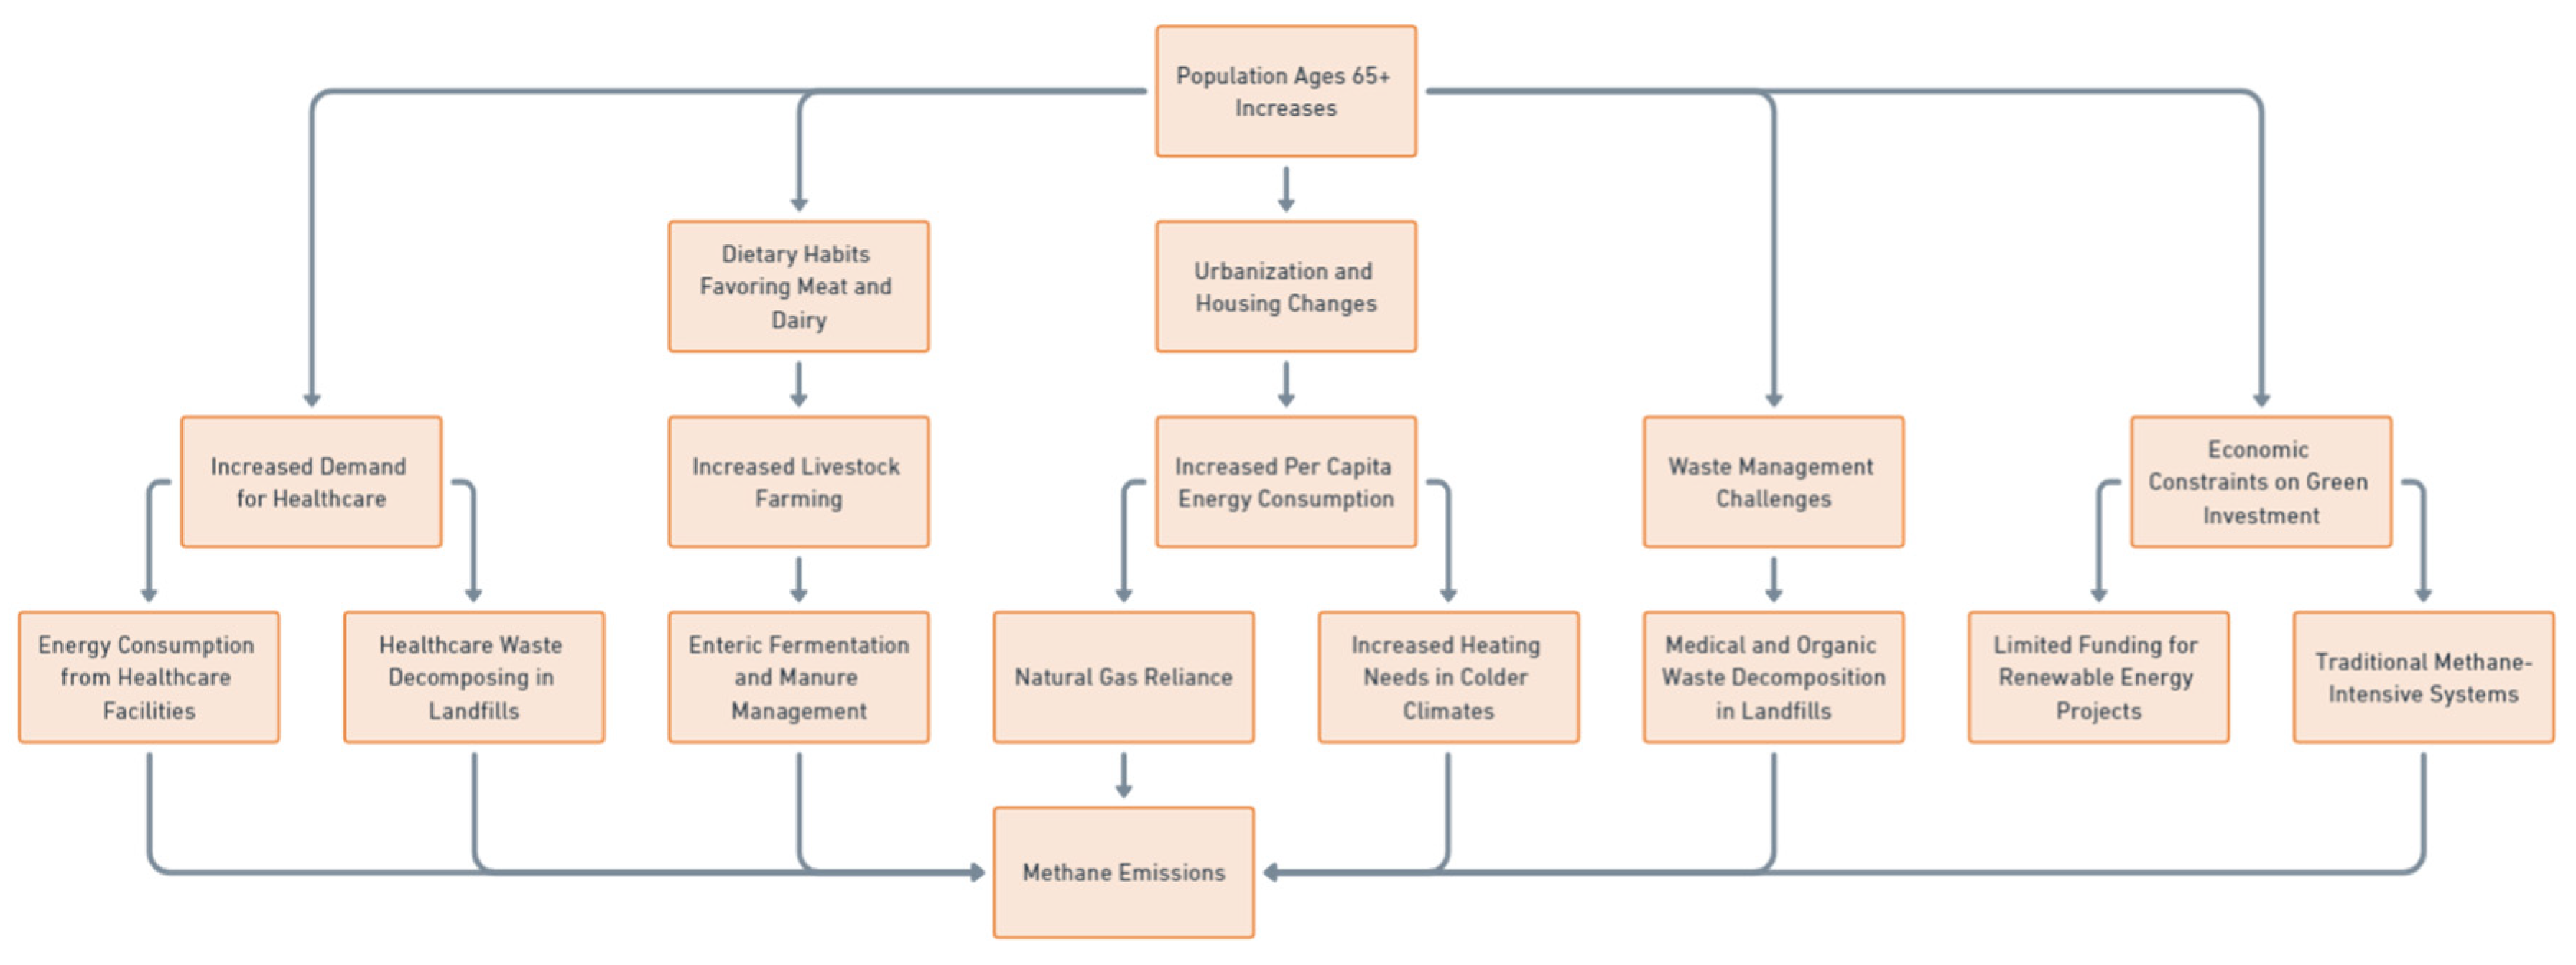
The relationship between population ages 65 and above and methane emissions. The positive relationship between an aging population and methane emissions emerges from various socio-economic and demographic factors. As populations age, particularly in developed countries, there is increased demand for healthcare services and facilities, which consume significant energy and produce organic waste. Both are sources of methane emissions, especially when healthcare waste is decomposed in landfills. Dietary habits also play a role. Older generations often consume more meat and dairy, driving demand for livestock farming, a significant methane source through enteric fermentation and manure management. Thus, as the elderly population grows, this dietary pattern supports increased livestock production, contributing directly to methane emissions. Urbanization and housing changes further amplify methane release. Elderly people tend to move into smaller households or retirement communities, increasing per capita energy consumption, often reliant on methane-emitting natural gas. This trend, coupled with colder climates' heating needs, escalates methane output as older individuals require consistent energy use. Additionally, waste management challenges associated with aging populations include the rise in medical and organic waste. Inadequate systems for managing this waste, especially in aging societies, lead to higher methane emissions as decomposition occurs in landfills. Economically, the focus on supporting elderly populations diverts resources from investments in green technologies and methane-reduction efforts. Limited funding for renewable energy projects or modernized agricultural practices further entrenches reliance on traditional, methane-intensive systems (see
Figure 14). In summary, the demographic shift toward a larger elderly population is linked to increased methane emissions due to higher healthcare and energy needs, livestock farming demand, waste management issues, and economic constraints limiting environmental investments [
85,
108,
109].
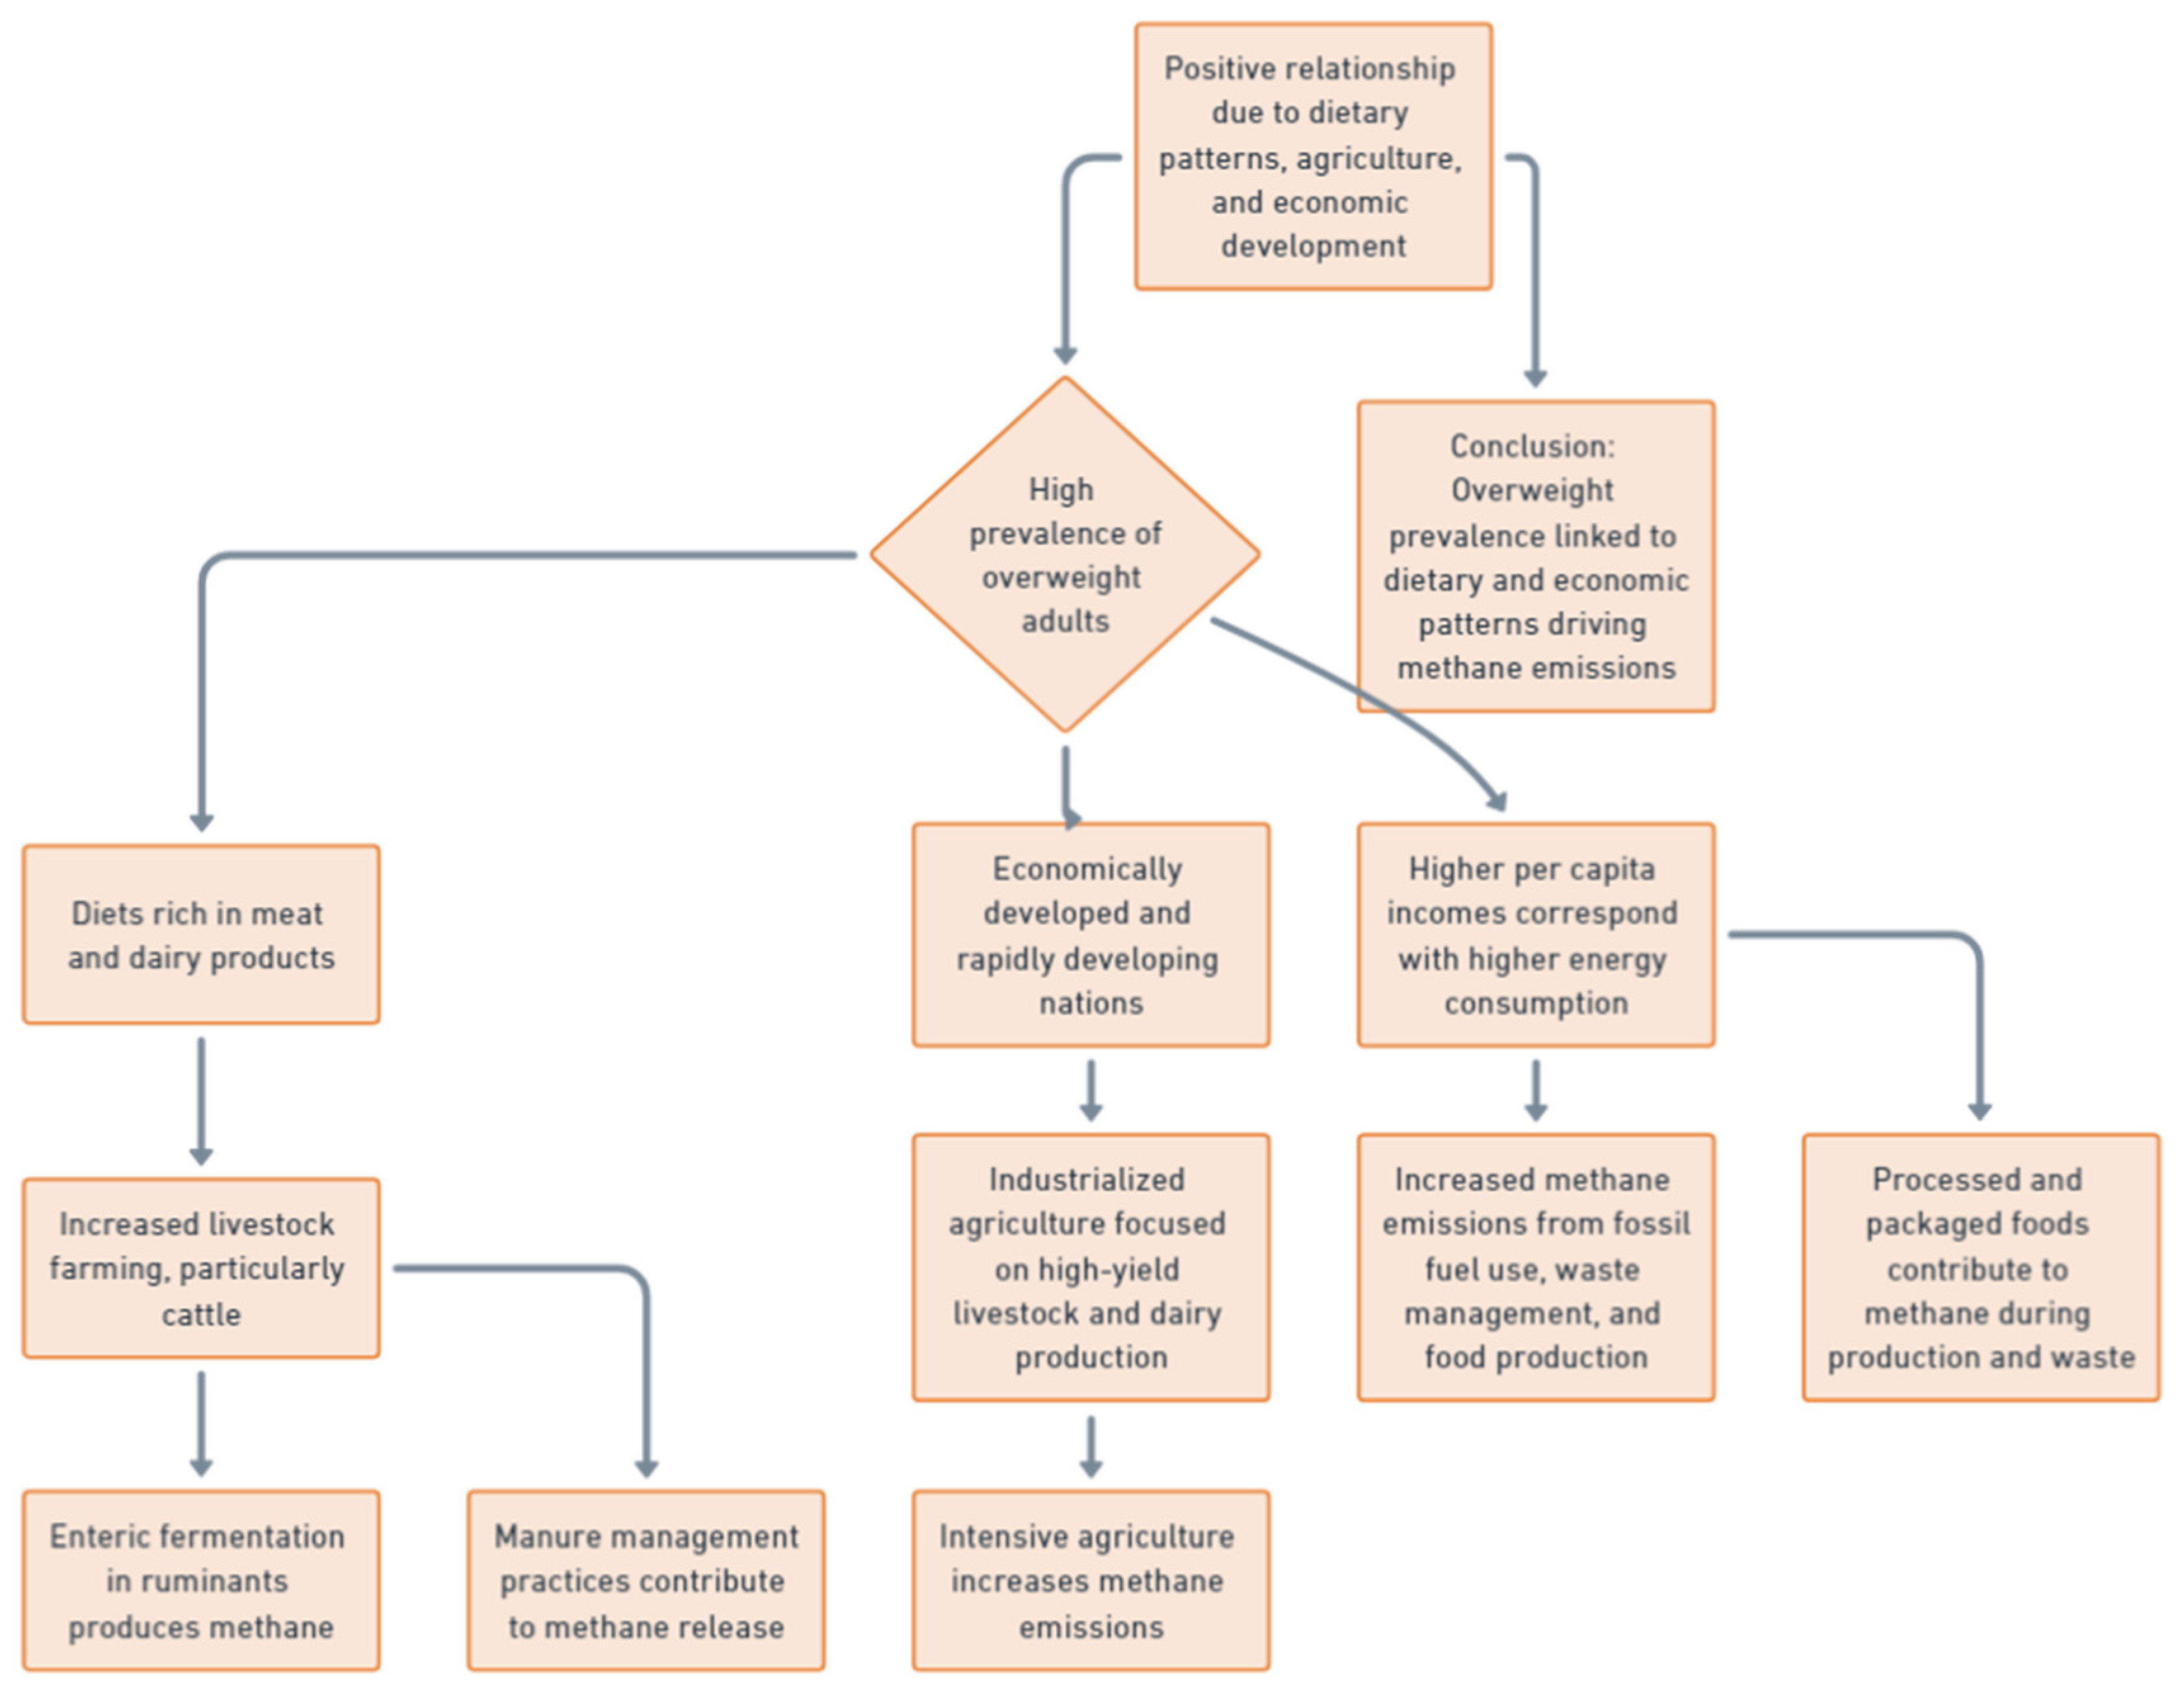
The relationship between the prevalence of overweight and methane emissions. The positive relationship between the prevalence of overweight adults and methane emissions is largely due to the connection between dietary patterns, agricultural practices, and economic development. In countries where a high percentage of adults are overweight, diets tend to be rich in meat and dairy products, which are primary drivers of methane emissions. Livestock farming, particularly of cattle, is a significant source of methane due to enteric fermentation – a digestive process in ruminants that produces methane as a byproduct. As the demand for meat and dairy increases in societies with higher rates of overweight adults, livestock production scales up, leading to an increase in methane emissions. Economically developed countries and rapidly developing nations often see a rise in overweight populations due to changes in lifestyle and diet. These countries tend to have more industrialized agricultural systems that focus on high-yield livestock and dairy production to meet consumer demands. Such intensive livestock farming not only increases methane emissions from animals but also from manure management practices, which contribute to methane release. The growth in intensive agriculture, aimed at supporting meat-heavy diets, reflects a direct link between food consumption patterns in populations with higher overweight prevalence and methane emissions. Furthermore, countries with higher rates of overweight adults often have higher per capita incomes, which typically correspond with higher energy consumption. This economic growth is frequently accompanied by an increase in methane emissions from other sources such as fossil fuel use, waste management, and food production infrastructure. For instance, more processed and packaged foods, which are often part of diets in populations with higher overweight prevalence, contribute to methane emissions during production, transportation, and waste decomposition. Thus, the prevalence of overweight adults is positively associated with methane emissions, as it is linked to a dietary and economic pattern that drives intensive agriculture, livestock farming, and increased energy use (
Figure 15). These factors combine to create a significant source of methane emissions, reinforcing the connection between health outcomes and environmental impact [
110,
111,
112].
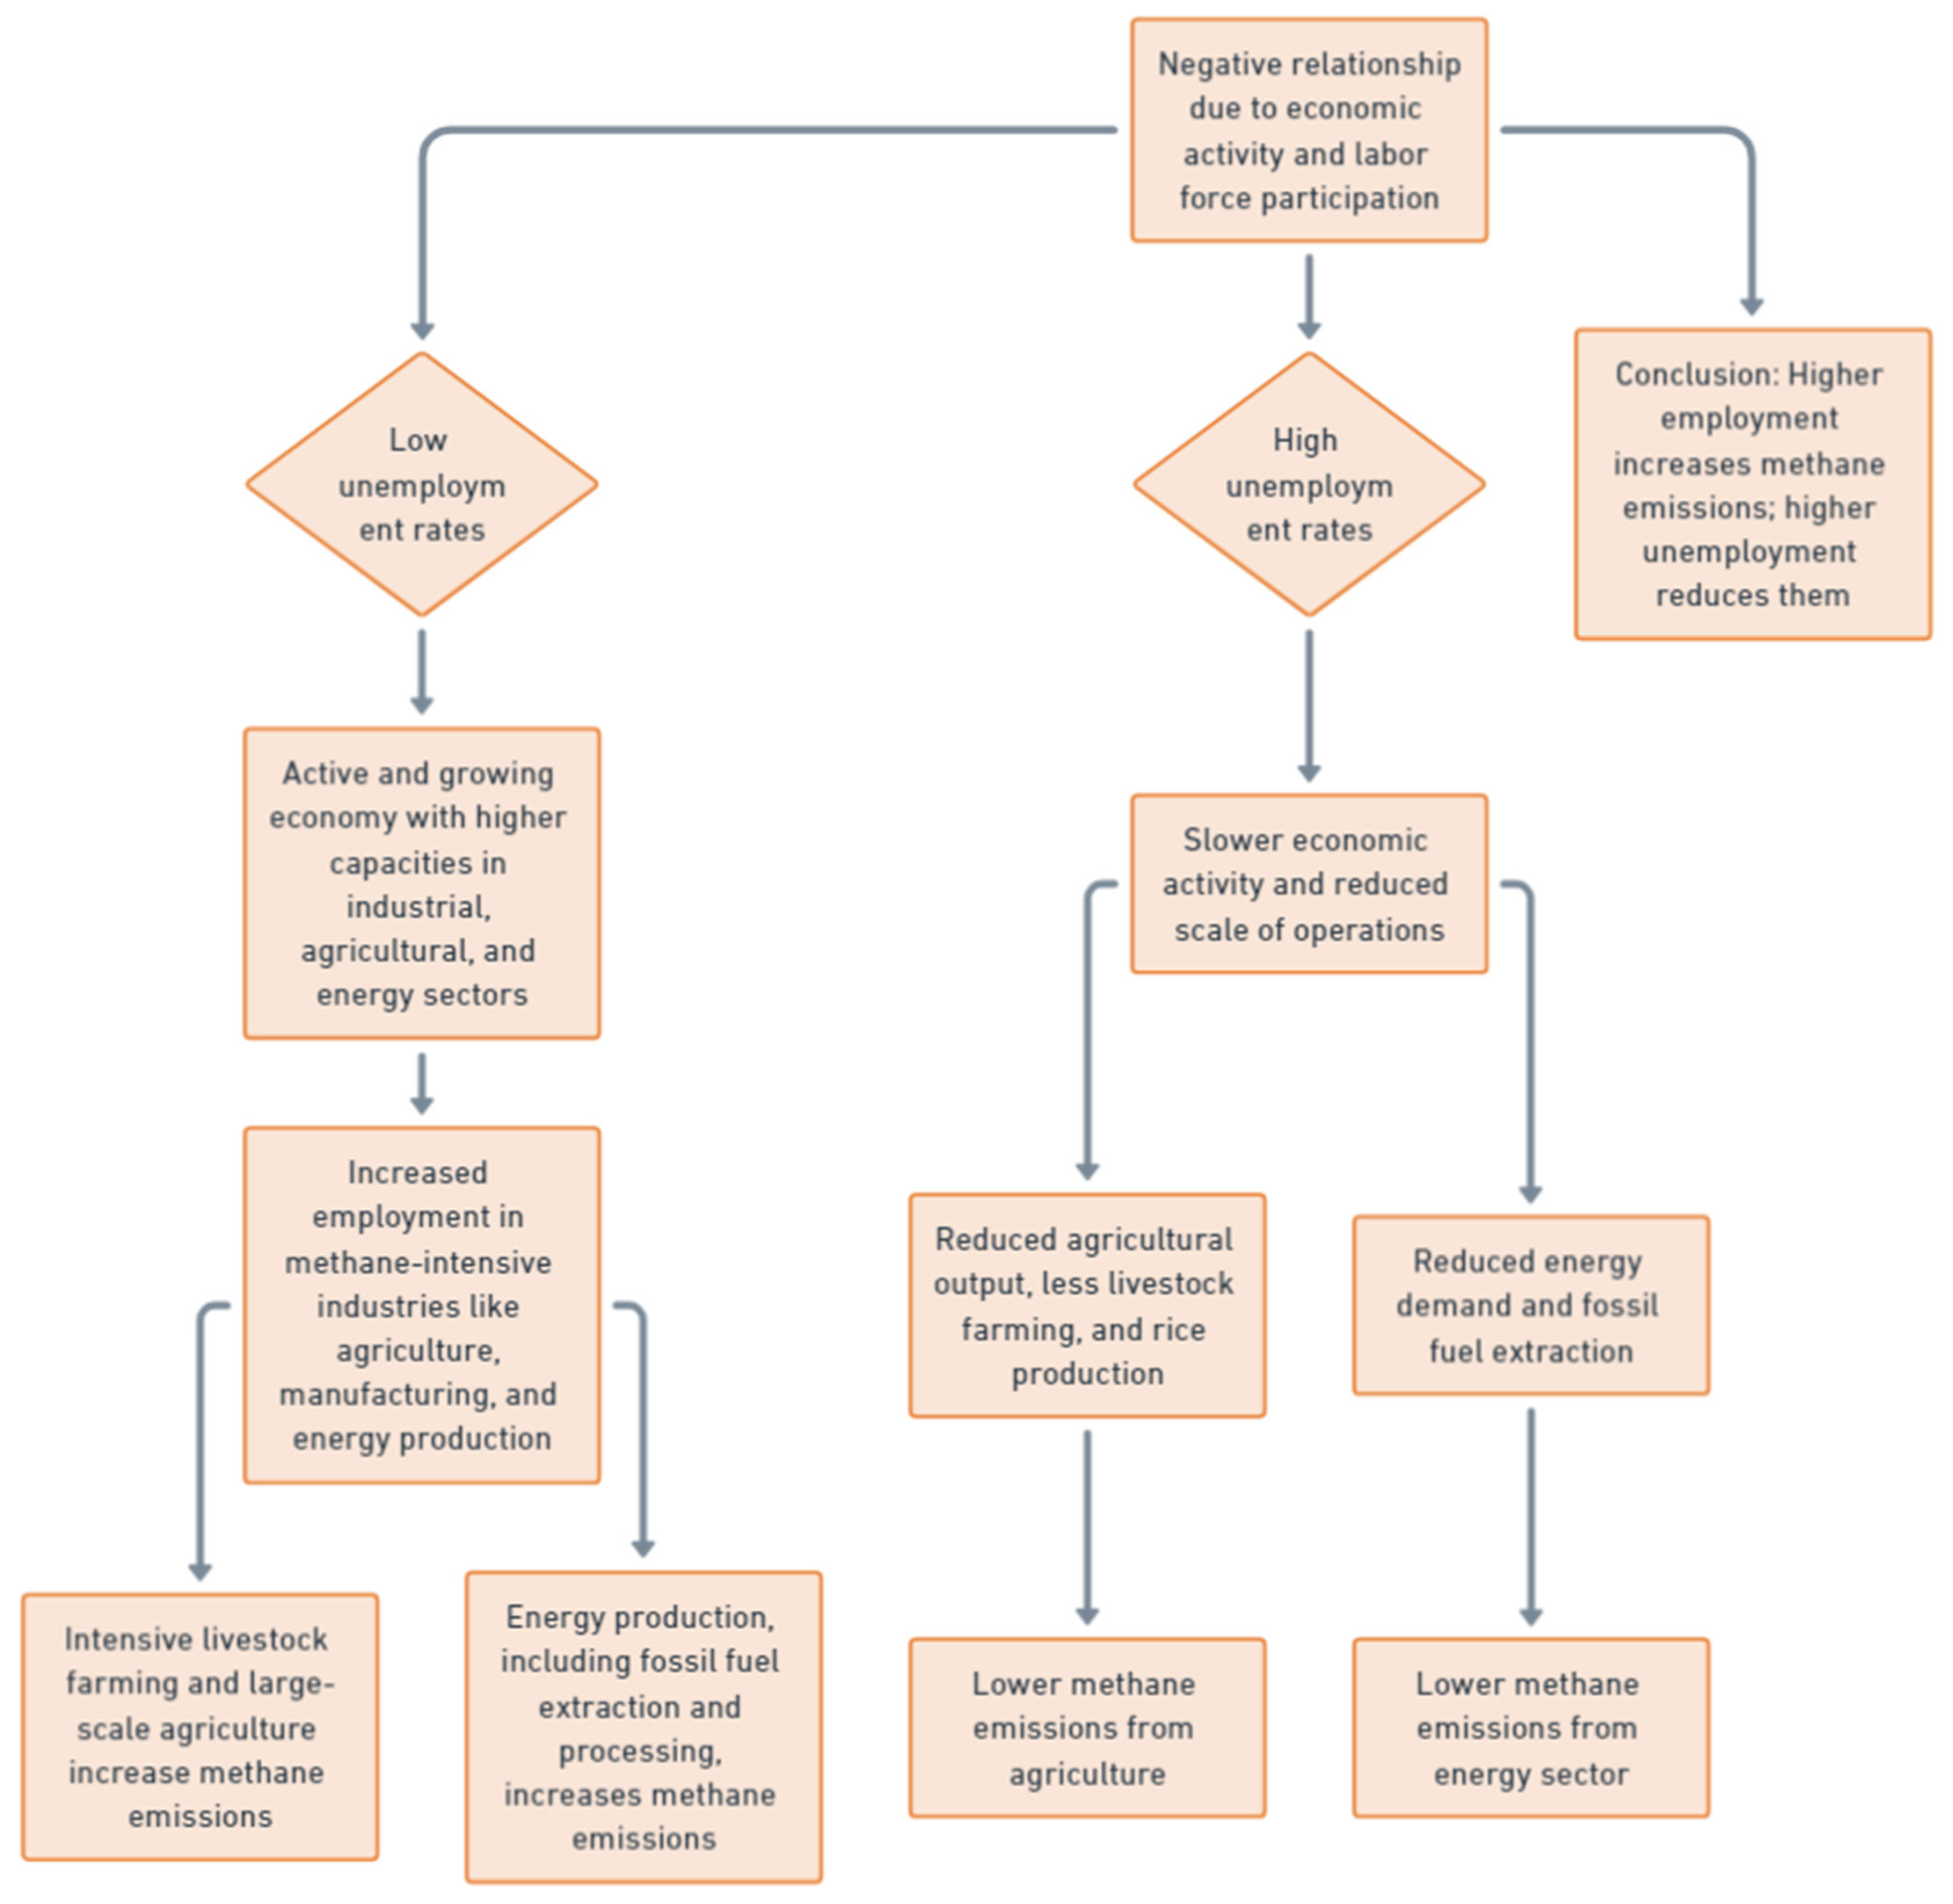
The relationship between unemployment and methane emissions. The negative relationship between unemployment rates and methane emissions can be explained through the connection between economic activity and labor force participation. Lower unemployment rates typically indicate a more active and growing economy where industrial, agricultural, and energy sectors operate at higher capacities. These sectors are often significant contributors to methane emissions, suggesting that as unemployment decreases and economic activity rises, methane emissions tend to increase. Conversely, higher unemployment rates are usually associated with lower economic activity, resulting in reduced methane emissions. In economies with low unemployment, more people are employed in various industries, such as agriculture, manufacturing, and energy production, all of which can be methane intensive. For instance, intensive livestock farming and large-scale agricultural practices, which generate significant methane emissions through enteric fermentation and rice paddies, are more prevalent when there is a sufficient labor force to support these operations. Similarly, energy industries, especially those involved in extracting and processing fossil fuels like natural gas, employ large numbers of people and are substantial sources of methane emissions through processes such as drilling and transportation. On the other hand, when unemployment rates are high, economic activity slows down, and the scale of industrial and agricultural operations typically decreases. A smaller labor force implies reduced agricultural output, including fewer intensive livestock farming and rice production, which directly lowers methane emissions. Furthermore, high unemployment often reflects reduced energy demand, as fewer industrial and economic activities require power, leading to decreased fossil fuel extraction and consumption. This reduction directly impacts methane emissions, as less natural gas and oil are extracted and transported, minimizing the associated methane leaks. In summary, the negative relationship between unemployment rates and methane emissions highlights that increased employment drives higher economic activity, which often comes with methane-intensive practices in agriculture and energy production (see
Figure 16). Conversely, high unemployment tends to suppress these activities, leading to lower methane emissions [
113,
114,
115].
4.3. Methane Emissions and the G-Governance Component within the ESG Model
Regarding the relationship between methane emissions and the governance component of the ESG model, the following equation is estimated:
where i=193 and t=[2011;2020].
Table 4 provides the econometric results.
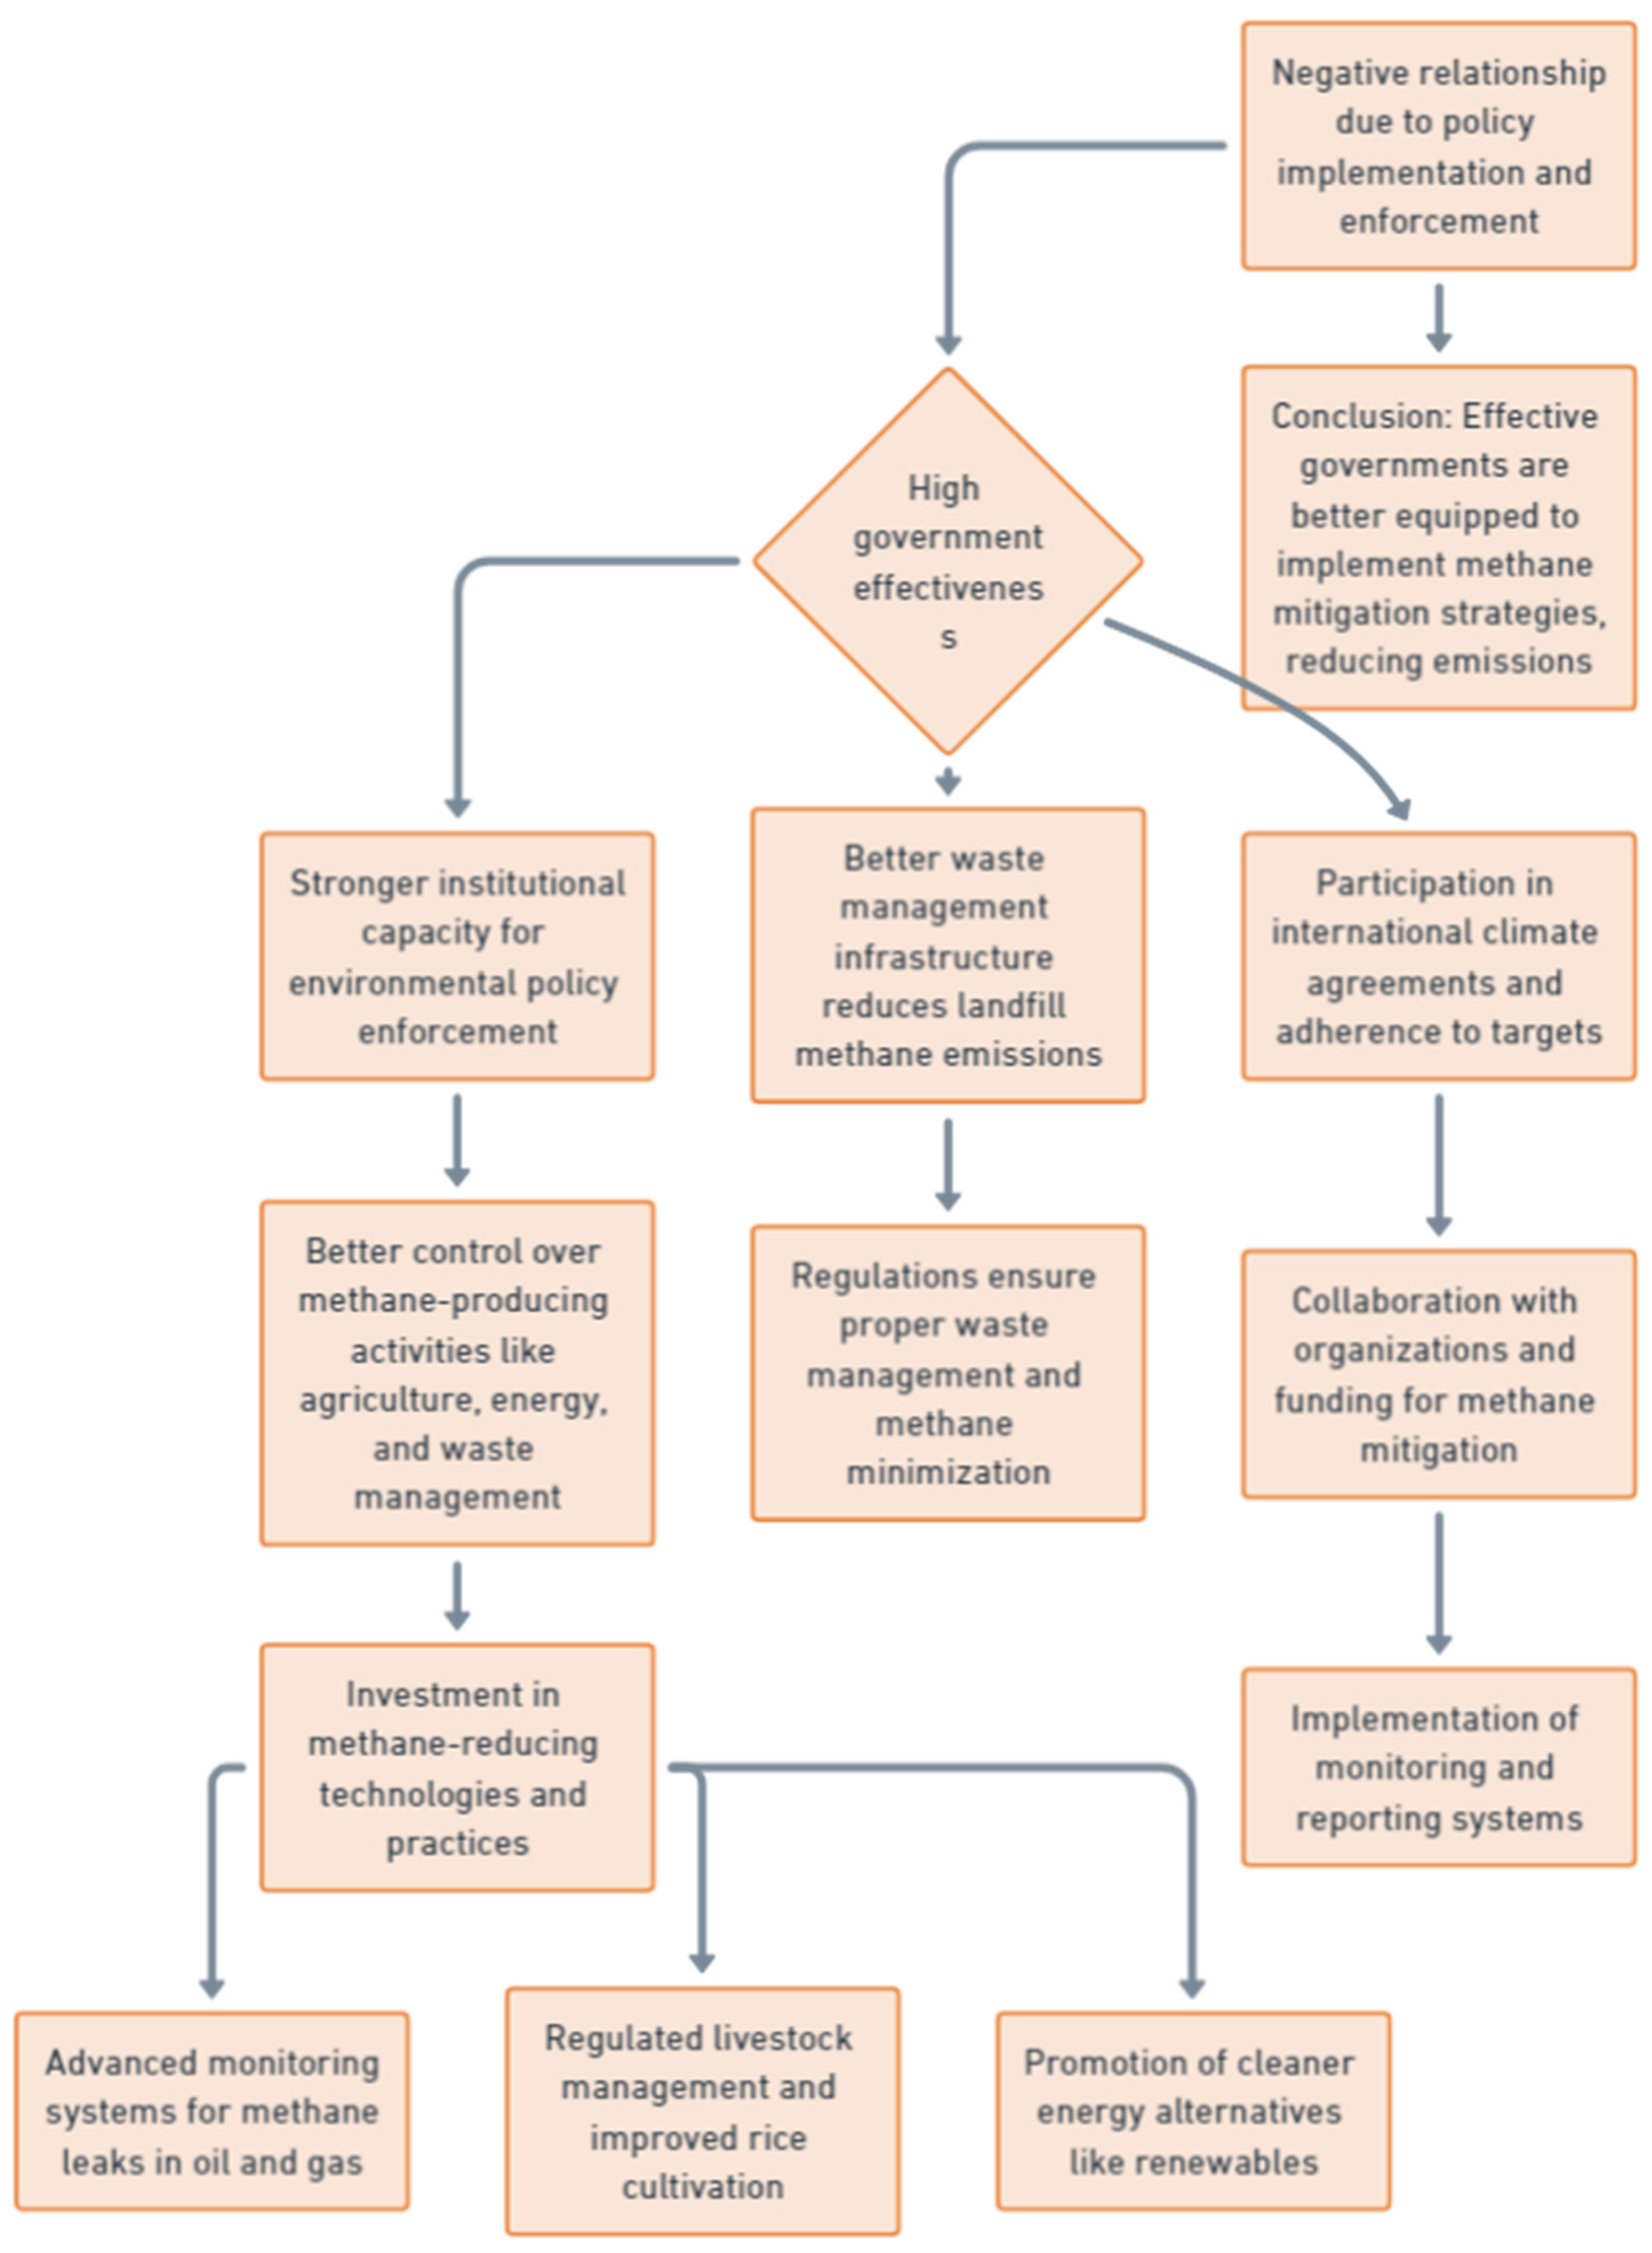
The relationship between government effectiveness and methane emissions. The negative relationship between government effectiveness and methane emissions is rooted in the ability of effective governments to implement and enforce policies that reduce emissions. Government effectiveness, as measured by the quality of public services, the competence of civil servants, and the credibility of policymakers, plays a critical role in addressing environmental challenges, including regulating and managing methane emissions. In countries with high levels of government effectiveness, there is typically a stronger institutional capacity to design and enforce environmental policies, which leads to better control over methane-producing activities such as agriculture, energy production, and waste management. Effective governments are more likely to invest in technologies and practices that reduce methane emissions. For instance, they can implement advanced monitoring systems for methane leaks in the oil and gas industry, regulate livestock management practices to minimize methane from enteric fermentation and improve rice cultivation techniques to limit methane emissions from waterlogged fields. Additionally, they can promote and subsidize cleaner energy alternatives, such as renewables, which reduce reliance on methane-emitting fossil fuels like natural gas. Governments with higher effectiveness also tend to have better waste management infrastructure, reducing methane emissions from landfills. They enforce regulations that require waste to be managed properly, ensuring organic materials are composted or treated to minimize methane release. In contrast, countries with low government effectiveness may lack the necessary resources, infrastructure, and regulatory enforcement to control methane emissions effectively. Furthermore, effective governments often participate in international climate agreements and adhere to global methane reduction targets, creating a framework for domestic policies to reduce GHG emissions. They are more likely to collaborate with international organizations, secure funding for methane mitigation projects, and implement transparent monitoring and reporting systems. Overall, the negative relationship between government effectiveness and methane emissions reflects how well-functioning institutions and competent policies can significantly curb emissions (
Figure 17). Effective governments are better equipped to address methane sources systematically, leading to lower overall emissions as they successfully implement mitigation strategies [
116,
117,
118].
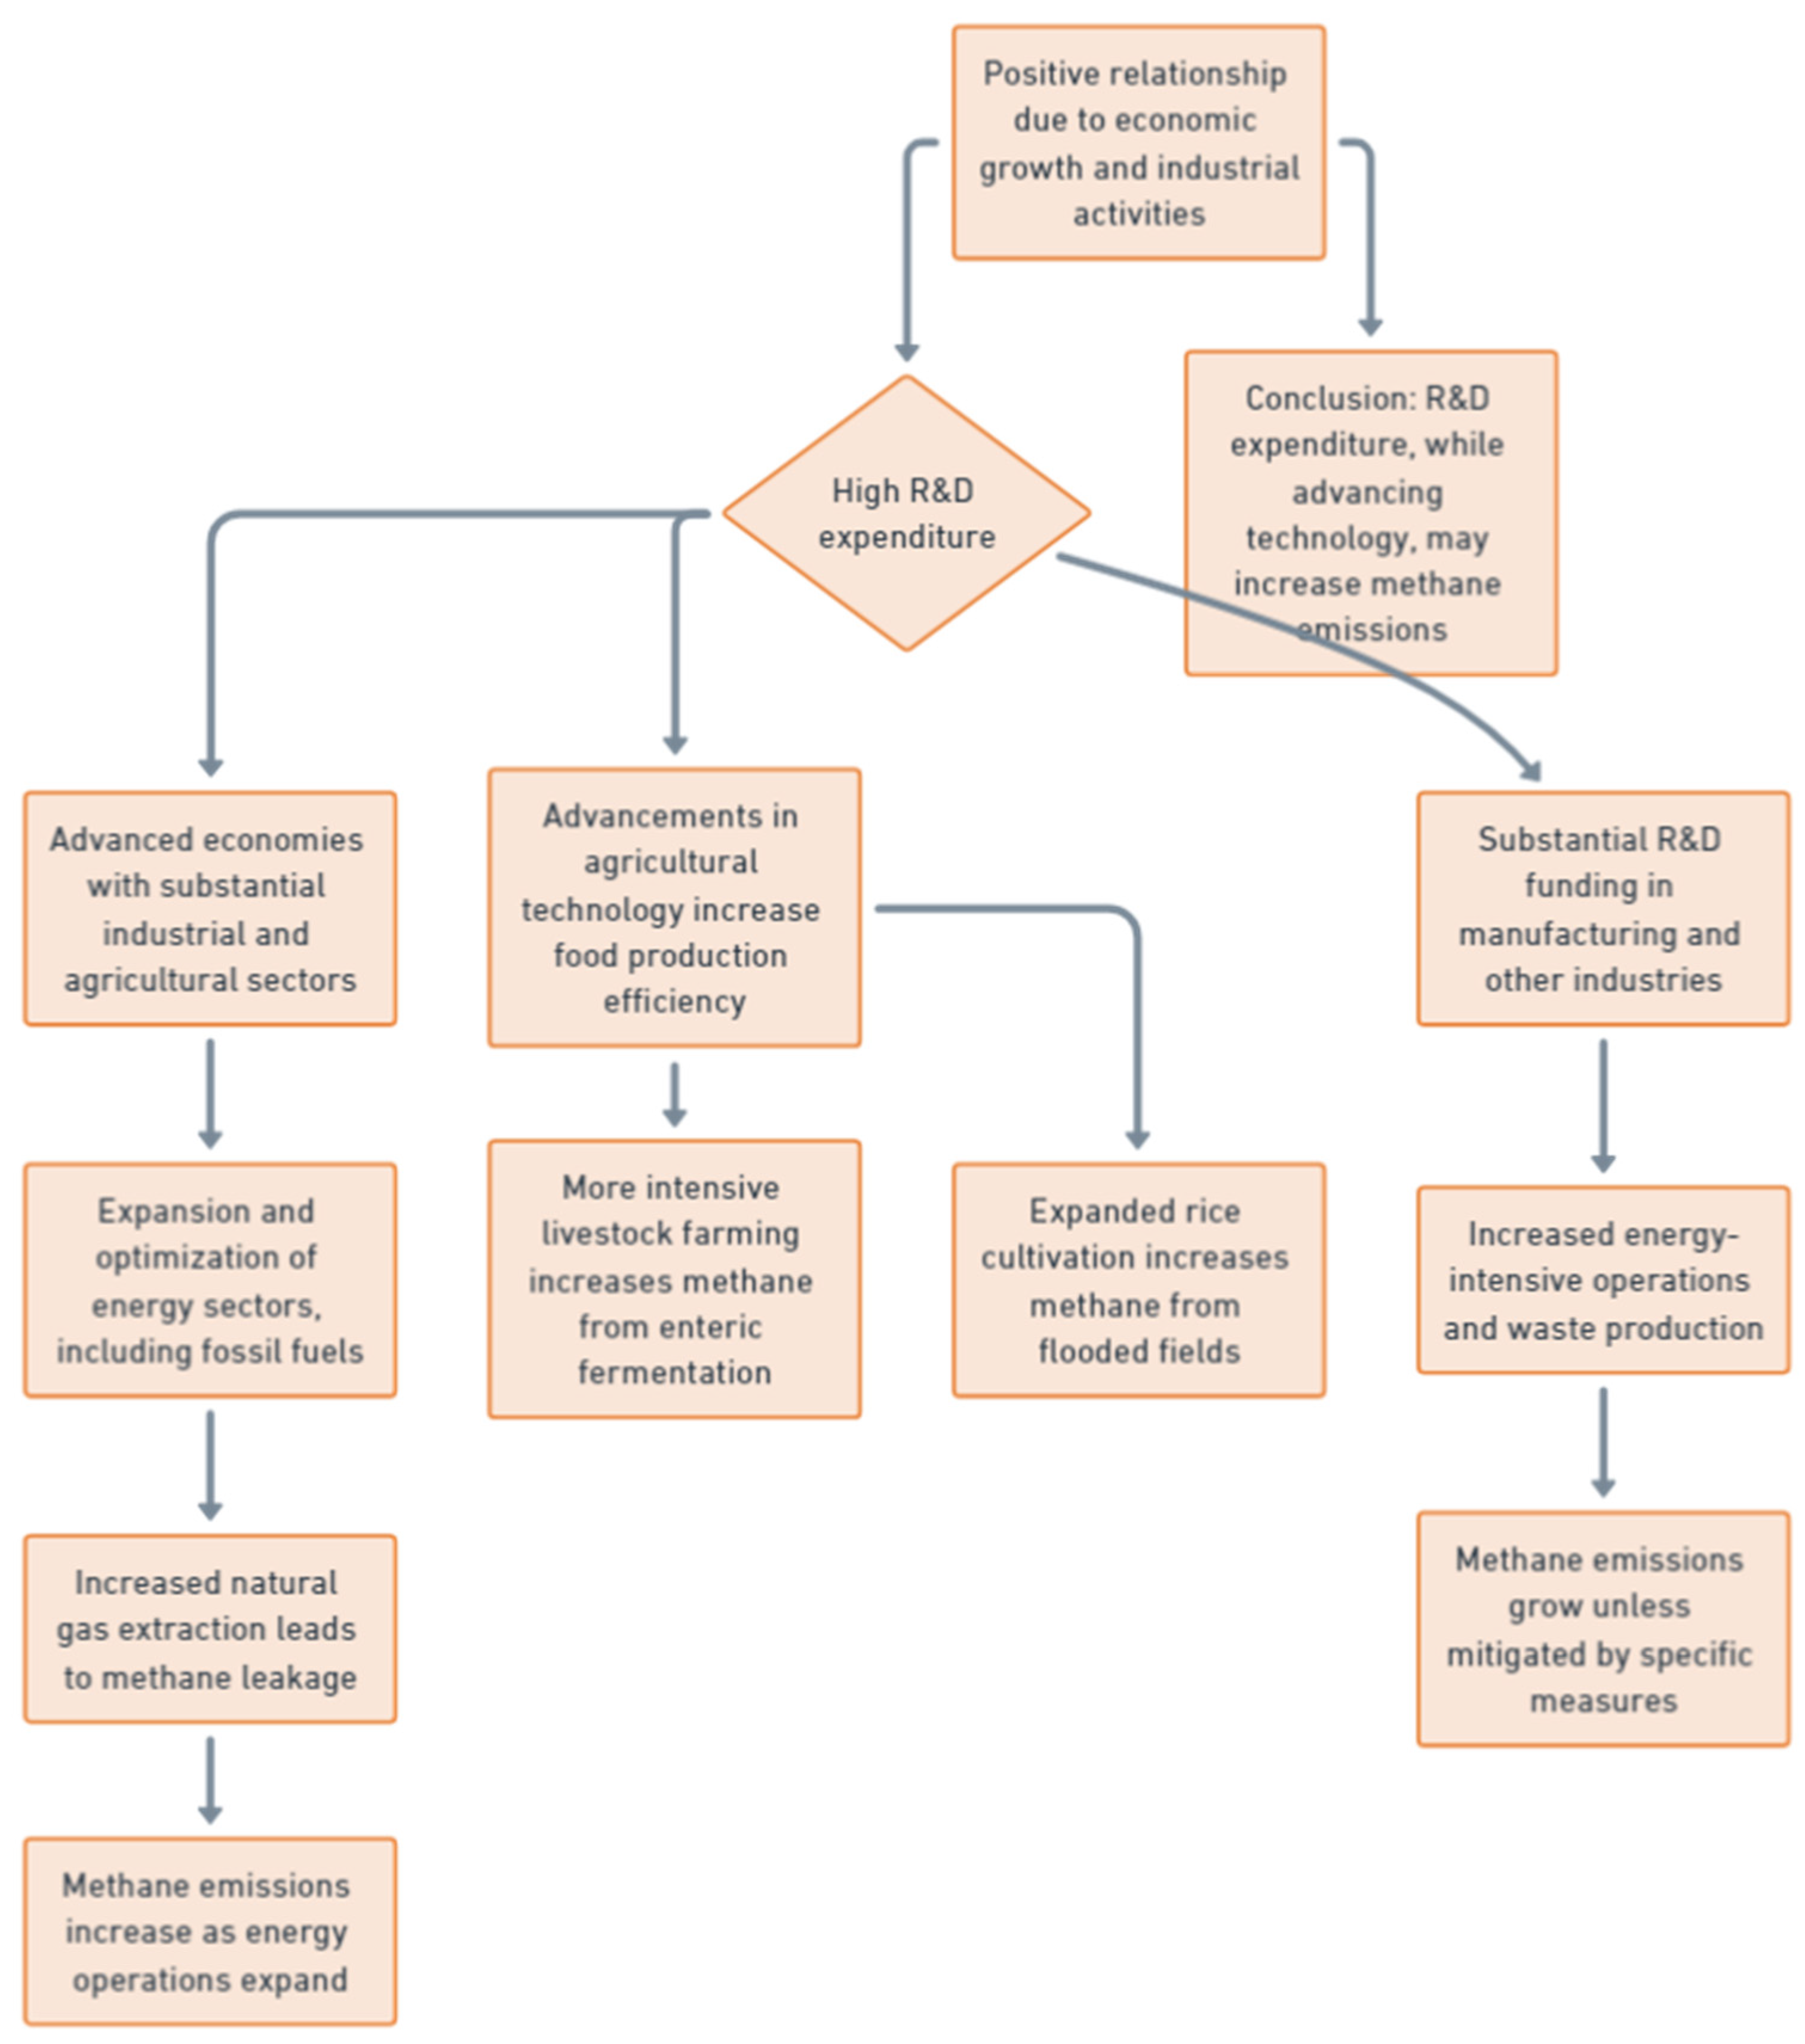
The relationship between R&D expenditure and methane emissions. The positive relationship between R&D expenditure and methane emissions is primarily linked to the economic growth and industrial activities that accompany high levels of investment in innovation. Countries that allocate a significant portion of their GDP to R&D typically have advanced economies with substantial industrial and agricultural sectors, both of which are major sources of methane emissions. This correlation highlights how economic and technological development, while advancing R&D, can simultaneously contribute to increased methane emissions through expanded energy use and intensified agriculture. Nations with higher R&D expenditure often focus on expanding and optimizing their energy sectors, including the extraction and utilization of fossil fuels like natural gas. While such investment may lead to technological innovations that improve efficiency, it also sustains and expands fossil fuel production activities, which are significant sources of methane emissions. Natural gas, in particular, is prone to methane leakage during extraction, processing, and transportation. In countries where significant resources are dedicated to R&D in the energy sector, methane emissions may increase as the scale of these operations grows to meet energy demands. Furthermore, R&D spending is frequently tied to advancements in agricultural technology, aiming to increase food production and efficiency. However, these advancements often lead to more intensive livestock farming and expanded rice cultivation, both of which are key contributors to methane emissions. For example, innovations that increase the scale or efficiency of cattle farming inadvertently amplify methane production through enteric fermentation, while improvements in rice yields do not eliminate methane emissions from flooded paddy fields. Additionally, industries that receive substantial R&D funding, such as manufacturing, also contribute indirectly to methane emissions through energy-intensive operations and waste production. As countries develop new technologies and industrial processes, their overall methane footprint may grow unless they implement specific measures to mitigate emissions (see
Figure 18). Thus, while R&D expenditure drives economic and technological advancement, it can also contribute to increased methane emissions when linked to the expansion of energy, agricultural, and industrial activities, revealing a positive relationship between the two [
119,
120,
121].
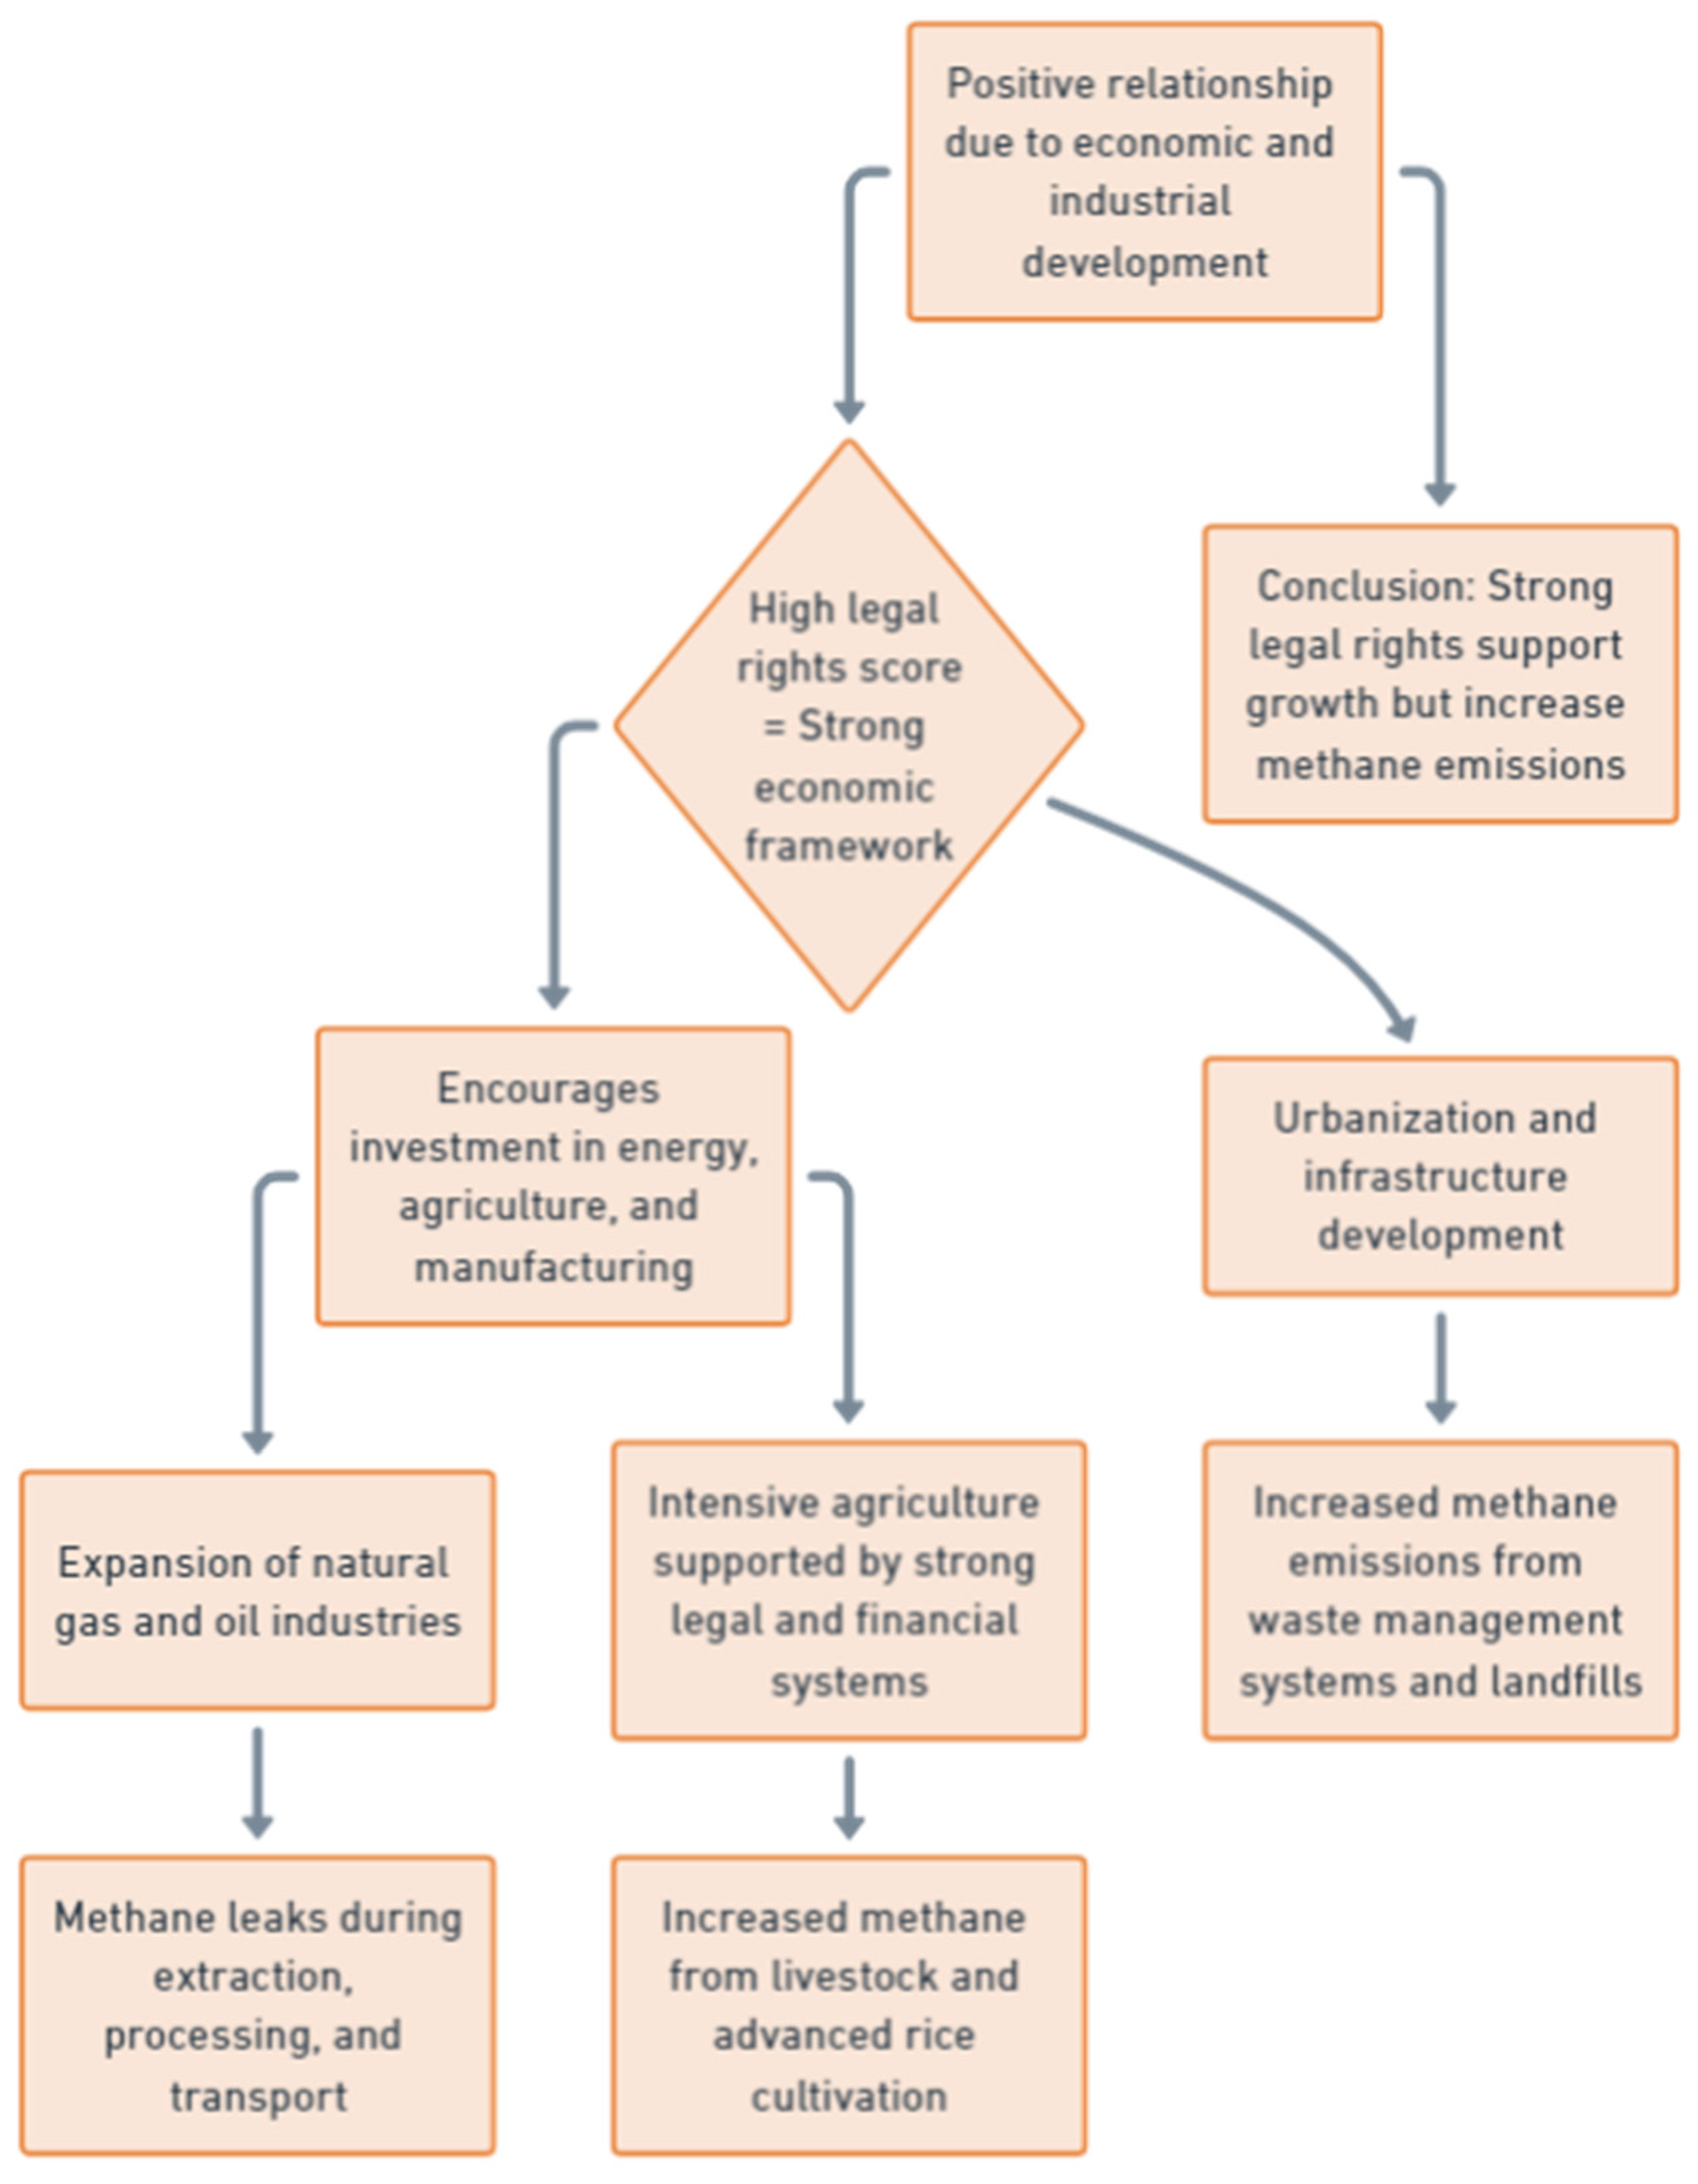
The relationship between the strength of the legal rights index and methane emissions. The positive relationship between the Strength of Legal Rights Index and methane emissions is linked to the broader context of economic development, industrial activity, and agricultural intensity in countries with strong legal frameworks. The index measures the degree to which collateral and bankruptcy laws protect the rights of borrowers and lenders, which is a critical aspect of a country’s financial and economic system. Generally, countries with strong legal rights (higher index scores) are more economically developed, have more robust financial markets, and are likely to engage in large-scale industrial and agricultural activities – key sources of methane emissions. A strong legal rights framework encourages investment and economic growth, allowing industries like energy, agriculture, and manufacturing to expand. For instance, these countries are more likely to have developed natural gas and oil industries, both of which are significant sources of methane due to leakages during extraction, processing, and transportation. The presence of clear legal protections makes it easier for companies to access financing for these large-scale projects, further increasing methane emissions associated with fossil fuel exploitation. Moreover, nations with strong legal protections often have advanced and mechanized agricultural systems. Intensive livestock farming, a major contributor to methane emissions through enteric fermentation, is more common in economically advanced countries that possess the legal and financial mechanisms to support large-scale agribusiness. Similarly, advanced rice cultivation techniques, which can also emit methane, are more prevalent in regions with secure property rights and financial support for agricultural development. Additionally, strong legal systems often coincide with higher levels of urbanization and infrastructure development, leading to increased methane emissions from waste management systems, particularly landfills, which emit methane when organic waste decomposes anaerobically. Thus, while strong legal rights are beneficial for economic growth and stability, they are also associated with higher levels of industrial, agricultural, and urban activities, which contribute to methane emissions (see
Figure 19). This relationship underscores how legal and economic development can inadvertently lead to environmental challenges, including increased GHG emissions [
122,
123,
124].
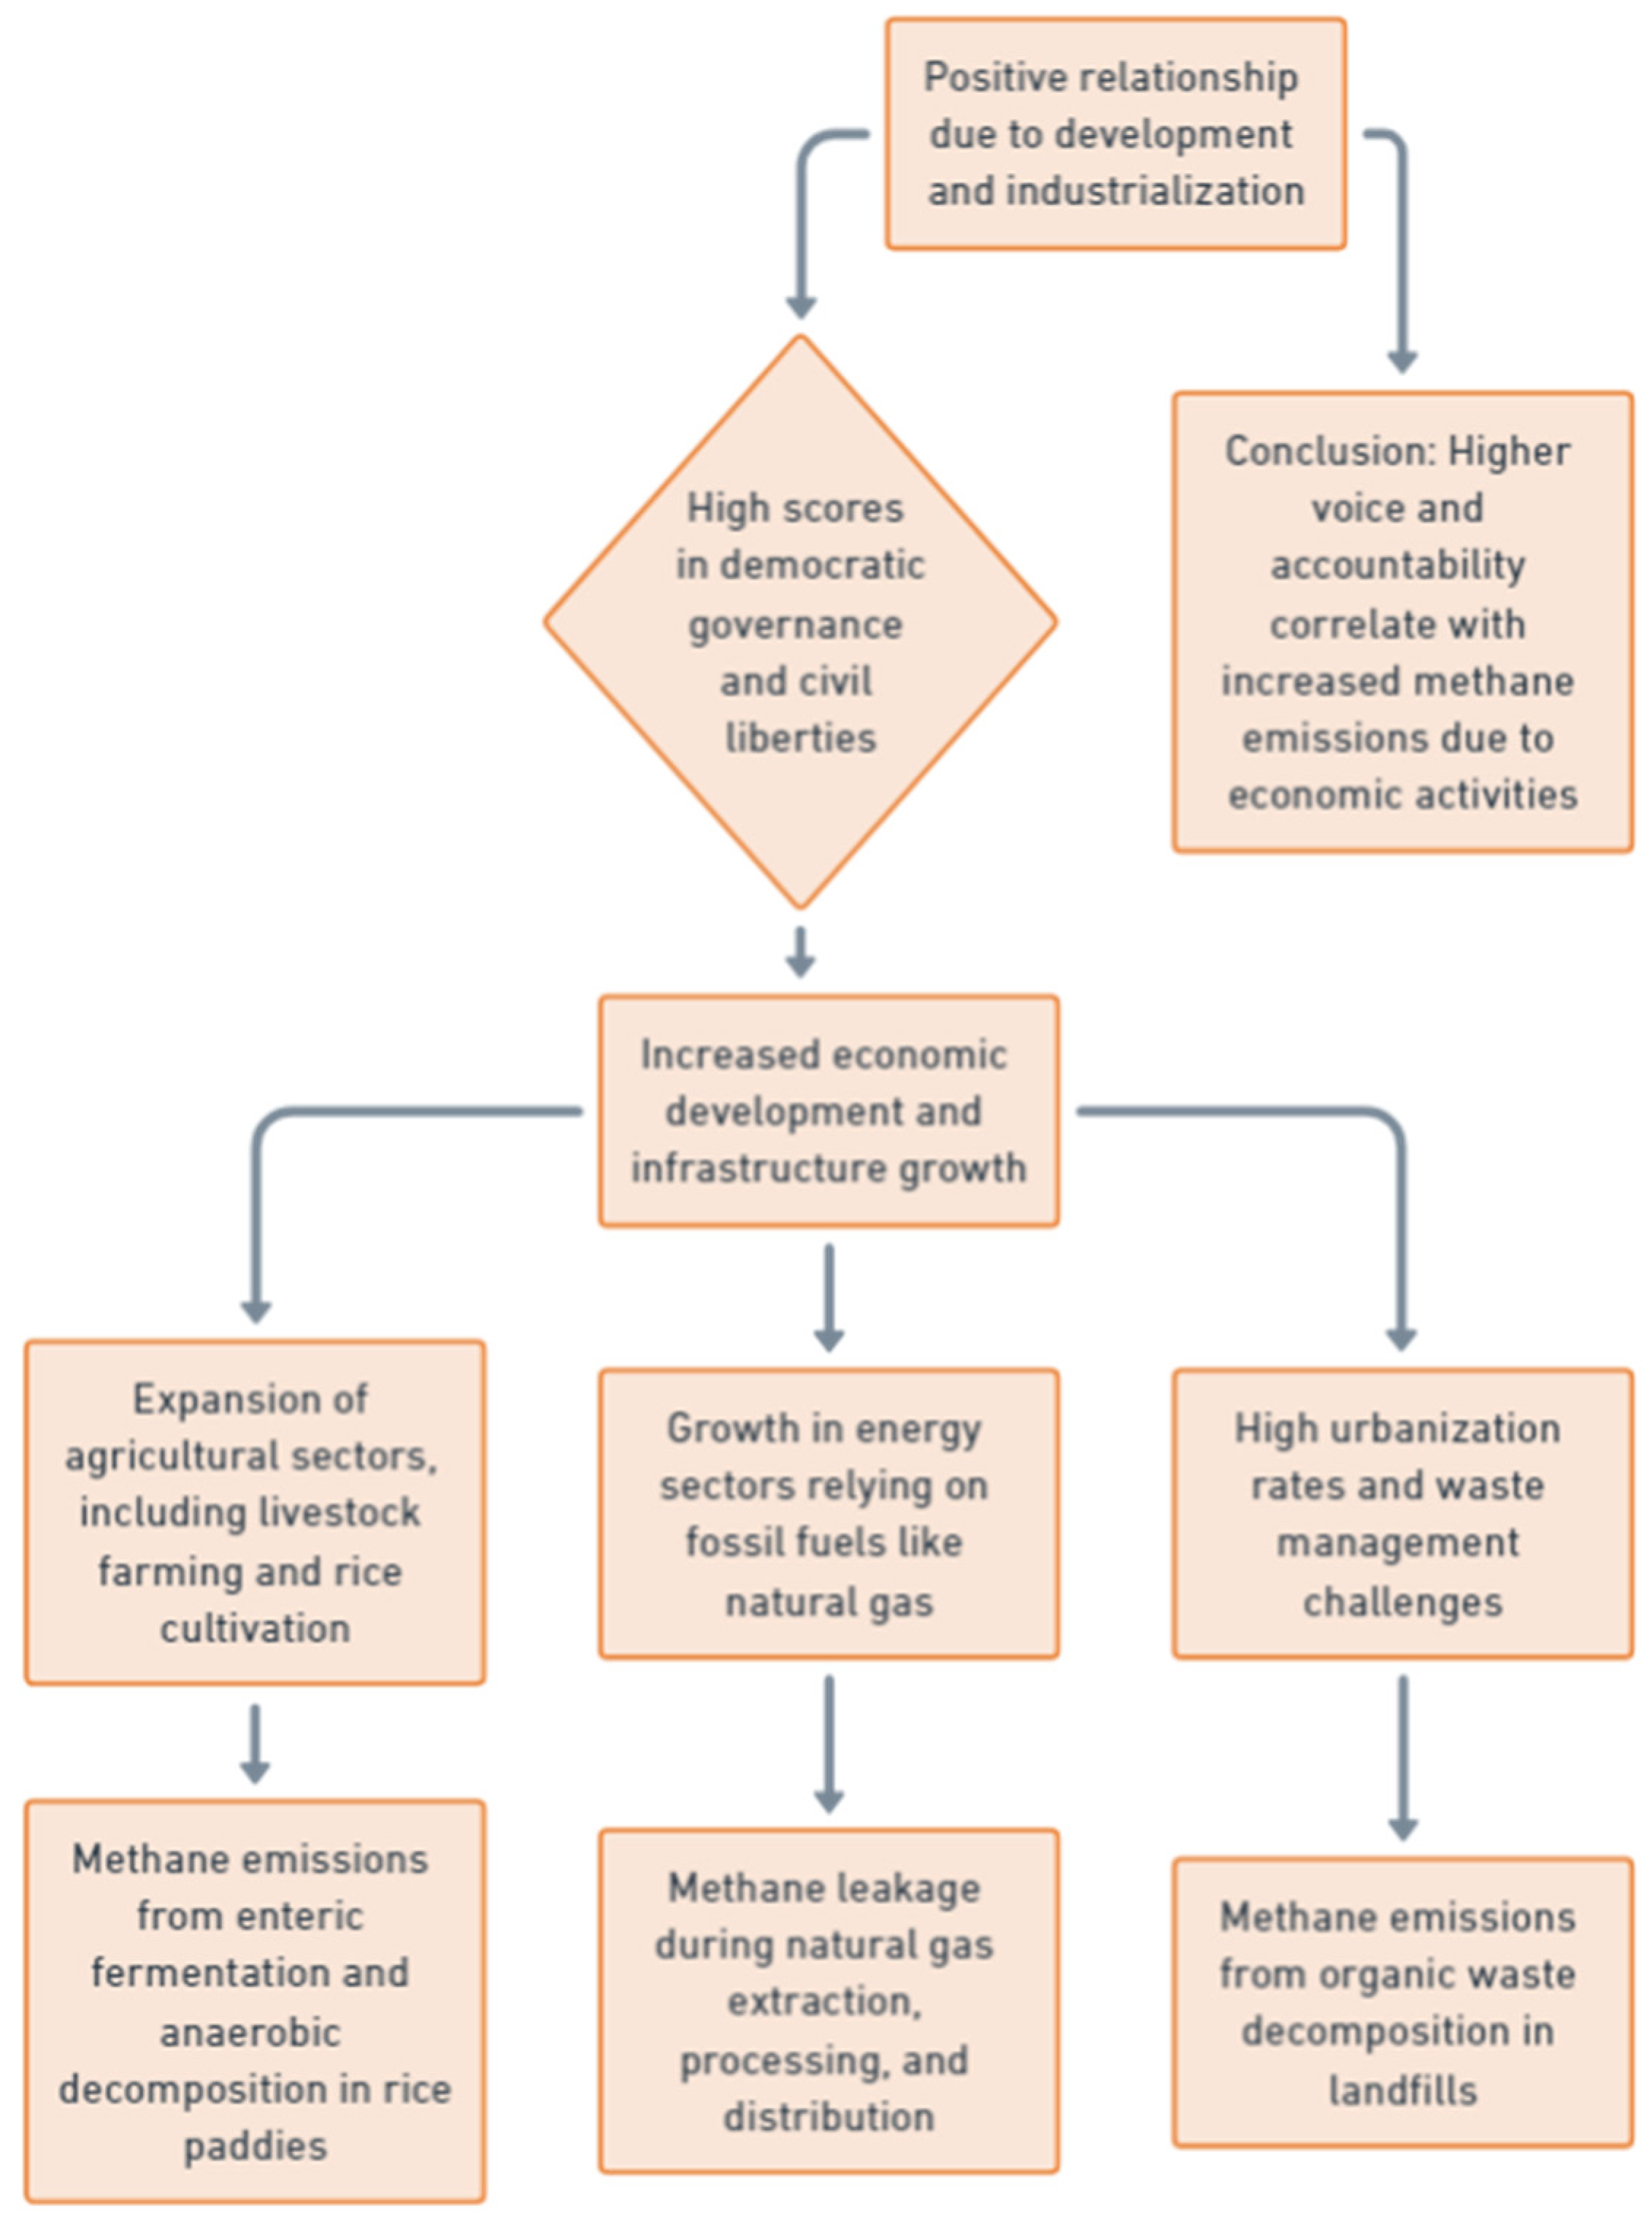
The relationship between Voice and Accountability and methane emissions. The positive relationship between Voice and Accountability and methane emissions is largely tied to the levels of development and industrialization that often accompany higher scores in democratic governance and civil liberties. Countries with high levels of voice and accountability typically have more transparent and participatory governments, which are often correlated with higher economic development, technological advancement, and industrial activity – all of which can contribute to increased methane emissions. In democracies or countries with high levels of accountability, citizens and interest groups often push for economic growth and infrastructure development, which are associated with methane emissions. For instance, the expansion of agricultural sectors – especially large-scale livestock farming and rice cultivation – occurs more frequently in nations where the government is responsive to the demands of various economic and social groups. Livestock farming and rice cultivation are two major sources of methane emissions, as ruminant animals produce methane through enteric fermentation, and rice paddies emit methane due to anaerobic decomposition in flooded fields. Moreover, countries with greater levels of voice and accountability tend to have energy sectors that heavily rely on fossil fuels, including natural gas, as part of their development strategy. Natural gas, while often seen as a cleaner alternative to coal, is a significant source of methane leakage during extraction, processing, and distribution. The existence of well-developed infrastructure and the ability for citizens to influence energy policy may lead to an increase in natural gas usage, which directly contributes to methane emissions. Additionally, countries with high levels of accountability often have high urbanization rates, leading to increased methane emissions from waste management and landfills. In urban areas, organic waste decomposition produces methane, contributing further to emissions (
Figure 20). Therefore, while voice and accountability can foster economic and social development, they are also associated with activities and sectors that lead to higher methane emissions, illustrating the positive correlation between the two variables [
125,
126,
127].
5. Conclusions
The analysis of methane emissions within the ESG framework highlights the complexity and urgency of addressing this potent GHG. Drawing on data from 193 countries between 2011 and 2020, the study reveals the intricate relationship between methane emissions and ESG components, using econometric models such as Random Effects, Fixed Effects, Pooled OLS, and WLS. A key conclusion is that despite improvements in global ESG scores, methane emissions continue to rise, particularly in agriculture and fossil fuel extraction sectors. This suggests that while beneficial for ESG progress, current measures are insufficient in curbing methane emissions. Environmental factors such as land use, energy imports, and renewable energy consumption play critical roles. Countries with more agricultural land tend to have lower methane emissions, likely due to sustainable practices, but there remains a need for further optimization. Conversely, nations dependent on energy imports may shift their environmental burden to exporting countries, highlighting global disparities in methane management. The study also finds that renewable energy use correlates with lower methane emissions, reinforcing the need for countries to prioritize a transition to renewable energy, particularly in natural gas systems prone to fugitive methane leaks. Governance is critical, with stronger governance structures linked to more effective methane management. Countries with higher governance scores are better equipped to enforce environmental regulations, underscoring the importance of international cooperation and capacity building in developing nations to support methane reduction efforts. From a social perspective, socio-economic factors such as healthcare infrastructure and income distribution are linked to methane emissions. Developed countries with advanced healthcare systems and industrial activities tend to have higher emissions. Economic inequality also correlates with increased emissions, as wealthier nations typically have methane-intensive industries. Less industrialized countries, with higher child mortality rates, emit less methane but are likely to see emissions rise as they develop unless proactive policies are adopted. The study concludes that methane mitigation strategies must be tailored to each country’s development level and socio-economic structure. Developed nations should focus on energy transitions and renewable energy, while developing countries require support for sustainable agriculture and governance capacity-building to manage future emissions growth.
The international community must prioritize equitable responsibility and support mechanisms for methane mitigation. Developed countries, as historically high emitters with advanced technology and resources, should assist developing nations in adopting methane reduction strategies through technology transfer, financial aid, and capacity-building initiatives. Integrating advanced technologies like blockchain and satellite monitoring is critical for improving methane detection and accountability. Accurate reporting is essential for compliance with international standards and enhancing mitigation efforts, particularly in the oil and gas sector. Aligning methane mitigation with broader ESG goals is vital to ensure that measures do not disproportionately impact vulnerable populations, especially in developing countries that are reliant on agriculture. Policies should provide financial support and alternatives for affected communities. International cooperation is also crucial; global frameworks like the Global Methane Pledge must be reinforced with financial and technological commitments to harmonize regulations and reduce emissions globally. In conclusion, addressing methane emissions requires technological innovation, robust governance, equitable policies, and international collaboration to align environmental efforts with economic growth and social well-being, advancing the ESG framework’s goals.
Abbreviations
| Abbreviation |
Definition |
| METHANE |
Methane Emissions (kt of CO₂ equivalent) |
| AL |
Agricultural land (% of land area) |
| EIMP |
Energy imports, net (% of energy use) |
| REC |
Renewable energy consumption (% of total final energy consumption) |
| NFD |
Adjusted savings: net forest depletion (% of GNI) |
| CO₂E |
CO₂ emissions (metric tons per capita) |
| INTENSITY |
Energy intensity level of primary energy (MJ/$2017 PPP GDP) |
| FPI |
Food production index (2014-2016 = 100) |
| CD |
Cause of death, by communicable diseases and maternal, prenatal and nutrition conditions (% of total) |
| LFPR |
Labor force participation rate, total (% of total population ages 15-64) (modeled ILO estimate) |
| MR5 |
Mortality rate, under-5 (per 1,000 live births) |
| P65 |
Population ages 65 and above (% of total population) |
| PO |
Prevalence of overweight (% of adults) |
| UT |
Unemployment, total (% of total labor force) (modeled ILO estimate) |
| GE |
Government Effectiveness: Estimate |
| RAND |
Research and development expenditure (% of GDP) |
| STRENGHT |
Strength of legal rights index (0=weak to 12=strong) |
| VA |
Voice and Accountability: Estimate |
| OLS |
Ordinary Least Squares |
| ESG |
Environmental, Social and Governance |
| WLS |
Weighted Least Squares |
| CO₂ |
Carbon Dioxide |
| R&D |
Research and development |
| MRV |
Measurement, Reporting, and Verification |
| IMF |
International Monetary Found |
| LNG |
Liquefied Natural Gas |
| EU |
European Union |
| OECD |
Organization for Economic Co-operation and Development |
| EKC |
Environmental Kuznets Curve |
| G20 |
Group of 20 |
| DICE |
Dynamic Integrated Climate-Economy |
| IoT |
Internet of Things |
| CH₄ |
Methane |
| kt |
Kilotonnes |
| FAO |
Food and Agriculture Organization of the United Nations |
| GDP |
Gross domestic product |
| ILO |
International Labour Organization |
| BMI |
Body Mass Index |
References
- Ogbowuokara, O. S., Leton, T. G., Ugbebor, J. N., & Orikpete, O. F. (2023). Developing climate governance strategies in Nigeria: An emphasis on methane emissions mitigation. The Journal of En-gineering and Exact Sciences, 9(9), 17383-01e. [CrossRef]
- Parry, I. W., Black, M. S., Minnett, D. N., Mylonas, M. V., & Vernon, N. (2022). How to cut methane emissions. International Monetary Fund. [CrossRef]
- Castelijns, N. (2024). Monitor and reduce emissions to meet compliance and sustainability goals. Australian Energy Producers Journal, 64(2), S115-S118. [CrossRef]
- Stern, J. P. (2022). Measurement, reporting, and verification of methane emissions from natural gas and LNG trade: creating transparent and credible frameworks (No. 06). OIES Paper: ET.
- Abernethy, S., & Jackson, R. B. (2024). Atmospheric methane removal may reduce climate risks. Environmental Research Letters, 19(5), 051001. [CrossRef]
- Olczak, M., Piebalgs, A., & Balcombe, P. (2022). Methane regulation in the EU: Stakeholder per-spectives on MRV and emissions reductions. Environmental Science & Policy, 137, 314-322.
- Sawyer, W. J., Genina, I., Brenneis, R. J., Feng, H., Li, Y., & Luo, S. X. L. (2022). Methane emissions and global warming: Mitigation technologies, policy ambitions, and global efforts. MIT Sci. Policy Rev, 3, 73-84. [CrossRef]
- Solarin, S. A., Erdogan, S., & Okumus, I. (2022). Wavelet and Fourier augmented convergence analysis of methane emissions in more than two centuries: implications for environmental manage-ment in OECD countries. Environmental Science and Pollution Research, 29(36), 54518-54530.
- Mar, K. A., Unger, C., Walderdorff, L., & Butler, T. (2022). Beyond CO₂ equivalence: The im-pacts of methane on climate, ecosystems, and health. Environmental science & policy, 134, 127-136.
- Howarth, R. W. (2020). Methane emissions from fossil fuels: exploring recent changes in green-house-gas reporting requirements for the State of New York. Journal of Integrative Environmental Sciences, 17(3), 69-81.
- Reisinger, A., Clark, H., Cowie, A. L., Emmet-Booth, J., Gonzalez Fischer, C., Herrero, M., ... & Leahy, S. (2021). How necessary and feasible are reductions of methane emissions from livestock to support stringent temperature goals?. Philosophical Transactions of the Royal Society A, 379(2210), 20200452. [CrossRef]
- Neuhaus, L. (2020). Recommendations for reducing methane emissions from agricultural sources in the United States. Environs: Envtl. L. & Pol'y J., 43, 207.
- Scoones, I. (2023). Livestock, methane, and climate change: The politics of global assessments. Wiley Interdisciplinary Reviews: Climate Change, 14(1), e790. [CrossRef]
- Malley, C. S., Borgford-Parnell, N., Haeussling, S., Howard, I. C., Lefèvre, E. N., & Kuylen-stierna, J. C. (2023). A roadmap to achieve the global methane pledge. Environmental Research: Climate, 2(1), 011003. [CrossRef]
- Song, C., Zhu, J. J., Willis, J. L., Moore, D. P., Zondlo, M. A., & Ren, Z. J. (2023). Methane emissions from municipal wastewater collection and treatment systems. Environmental science & technology, 57(6), 2248-2261. [CrossRef]
- Fernández-Amador, O., Oberdabernig, D. A., & Tomberger, P. (2022). Do methane emissions converge? Evidence from global panel data on production-and consumption-based emissions. Em-pirical Economics, 63(2), 877-900. [CrossRef]
- Ravishankara, A. R., Kuylenstierna, J. C., Michalopoulou, E., Höglund-Isaksson, L., Zhang, Y., Seltzer, K., ... & Borgford-Parnell, N. (2021). Global methane assessment: Benefits and costs of mitigating methane emissions (No. Job No: DTI/2352/PA). United Nations Environment Pro-gramme.
- Sadriwala, K. F., Shannaq, B., & Sadriwala, M. F. (2024). GCC Cross-National Comparative Study on Environmental, Social, and Governance (ESG) Metrics Performance and Its Direct Impli-cations for Economic Development Outcomes. In The AI Revolution: Driving Business Innovation and Research: Volume 2 (pp. 429-441). Cham: Springer Nature Switzerland.
- Doni, F., & Johannsdottir, L. (2020). Environmental social and governance (ESG) ratings. Cli-mate action, 435-449.
- Azar, C., Martín, J. G., Johansson, D. J., & Sterner, T. (2023). The social cost of methane. Cli-matic Change, 176(6), 71. [CrossRef]
- Oyewunmi, T. (2021). Natural gas in a carbon-constrained world: Examining the role of institu-tions in curbing methane and other fugitive emissions. LSU J. Energy L. & Resources, 9, 87.
- Ericsson, A. (2022). Methane Emissions and Economic Growth: An N-shaped Environmental Kuznets Curve for the G20 countries?
- Djoukouo, A. F. D. (2021). Relationship between methane emissions and economic growth in Central Africa countries: Evidence from panel data. Global Transitions, 3, 126-134. [CrossRef]
- Aleshina, S., Delgado-Antequera, L., & Gemar, G. (2024). Assessing the economic implications of carbon emissions on climate change: Estimating the impact using methane-adjusted DICE model. Structural Change and Economic Dynamics, 71, 35-44. [CrossRef]
- Lorenzato, G., Tordo, S., Howells, H. M., & van den Berg, B. (2022). Financing solutions to re-duce natural gas flaring and methane emissions. World Bank Publications.
- Garg, S., Boz, D. E., Gilbert, B., & Crompton, J. (2023). A critical review of natural gas emis-sions certification in the United States. Environmental Research Letters, 18(2), 023002.
- Errickson, F. C., Keller, K., Collins, W. D., Srikrishnan, V., & Anthoff, D. (2021). Equity is more important for the social cost of methane than climate uncertainty. Nature, 592(7855), 564-570. [CrossRef] [PubMed]
- Adeleye, B. N., & Tiwari, A. K. (2024, January). Empirical assessment of methane emissions, so-cioeconomic factors, and infant mortality in Europe. In Natural Resources Forum. Oxford, UK: Blackwell Publishing Ltd.
- Piebalgs, A., & Olczak, M. (2023). The EU can reduce global methane emissions by jointly pur-chasing gas. European University Institute.
- Erland, B. M., Thorpe, A. K., & Gamon, J. A. (2022). Recent advances toward transparent me-thane emissions monitoring: a review. Environmental Science & Technology, 56(23), 16567-16581.
- Esparza, Á., Ebbs, M., & Gauthier, J. F. (2022, September). Application of Remote Sensing Techniques to Detect Methane Emissions from the Oil and Gas Sector to Assist Operators with Sus-tainability Efforts. In SPE Annual Technical Conference and Exhibition? (p. D031S047R002). SPE.
- Laskar, I. I., & Giang, A. (2023). Policy approaches to mitigate in-use methane emissions from natural gas use as a marine fuel. Environmental Research: Infrastructure and Sustainability, 3(2), 025005. [CrossRef]
- Vollrath, C. (2022). Methane Emissions from the Global Oil and Gas Industry: A Scoping Re-view to Characterize Research Trends, Knowledge Gaps, and Priorities. Calgary, Alberta: Universi-ty of Calgary. https://prism.ucalgary.ca/handle/1880/115218.
- Cooper, J., Dubey, L., & Hawkes, A. (2022). Methane detection and quantification in the up-stream oil and gas sector: the role of satellites in emissions detection, reconciling and reporting. En-vironmental Science: Atmospheres, 2(1), 9-23.
- Marks, L. (2022). The abatement cost of methane emissions from natural gas production. Journal of the Association of Environmental and Resource Economists, 9(2), 165-198. [CrossRef]
- Gu, Y., Dai, J., & Vasarhelyi, M. A. (2023). Audit 4.0-based ESG assurance: An example of us-ing satellite images on GHG emissions. International Journal of Accounting Information Systems, 50, 100625.
- Qureshi, Z., King, M., & Nayak, S. (2023). Quantifying impact in the environment sector: a greenhouse gas emissions monitoring study.
- Chen, B., Kan, S., Wang, S., Deng, H., & Zhang, B. (2023). Beyond wells: towards demand-side perspective to manage global methane emissions from oil and gas production. Resources, Conserva-tion and Recycling, 193, 106971. [CrossRef]
- Elkind, J., Blanton, E., Denier Van Der Gon, H., Kleinberg, R. L., & Leemhuis, A. (2020). No-where to Hide: the implications of satellite-based methane detection for policy, industry and fi-nance. Columbia Center on Global Energy Policy. Accessed on November, 15, 2021.
- Lavoie, M., MacKay, K., Stirling, J., & Risk, D. (2022). Methane inventories, but not regulatory submissions, show major variations in methane intensity for Canadian oil and gas producers. Cleaner Environmental Systems, 5, 100081. [CrossRef]
- Shindell, D., Sadavarte, P., Aben, I., Bredariol, T. D. O., Dreyfus, G., Höglund-Isaksson, L., ... & Maasakkers, J. D. (2024). The methane imperative. Frontiers in Science, 2, 1349770. [CrossRef]
- Evans, P., Lowe, J., Newman, D., Washington, M., Tao, C., & Bottino, G. (2024, September). The Application of a Parametric Model to Track Methane Emissions from Flares–New Insights from a Global Deployment Programme. In SPE International Conference and Exhibition on Health, Safe-ty, Environment, and Sustainability? (p. D031S022R002). SPE.
- Joynes, I., Wittwer, M., & Manolas, Y. (2023). Developing a ‘fit for purpose’approach to manag-ing methane emissions. The APPEA Journal, 63(2), S399-S403.
- Siao, H. J., Gau, S. H., Kuo, J. H., Li, M. G., & Sun, C. J. (2022). Bibliometric analysis of envi-ronmental, social, and governance management research from 2002 to 2021. Sustainability, 14(23), 16121. [CrossRef]
- Yu, W., Gu, Y., & Dai, J. (2023). Industry 4.0-enabled environment, social, and governance re-porting: A case from a Chinese energy company. Journal of Emerging Technologies in Accounting, 20(1), 245-258.
- World Bank (2024). Sovereign ESG Database. Link: https://esgdata.worldbank.org/?lang=en ac-cessed: 10/08/2024.
- Krautwurst, S., Gerilowski, K., Borchardt, J., Wildmann, N., Galkowski, M., Swolkien, J., ... & Bovensmann, H. (2021). Quantification of CH 4 coal mining emissions in Upper Silesia by passive airborne remote sensing observations with the MAMAP instrument during CoMet. Atmospheric Chemistry and Physics Discussions, 2021, 1-39.
- Cael, B. B., & Goodwin, P. A. (2023). Global methane pledge versus carbon dioxide emission reduction. Environmental Research Letters, 18(10), 104015. [CrossRef]
- Šandera, J., & Štych, P. (2020). Selecting relevant biological variables derived from Sentinel-2 data for mapping changes from grassland to arable land using random forest classifier. Land, 9(11), 420.
- Prăvălie, R., Patriche, C., Borrelli, P., Panagos, P., Roșca, B., Dumitraşcu, M., ... & Bandoc, G. (2021). Arable lands under the pressure of multiple land degradation processes. A global perspec-tive. Environmental Research, 194, 110697. [CrossRef] [PubMed]
- Mincicova, V. S. (2021). Possible medium-term scenarios of dynamics of Russia’s energy re-source exports after the economic crisis of 2020. In Current Problems and Ways of Industry Devel-opment: Equipment and Technologies (pp. 840-848). Cham: Springer International Publishing.
- Li, F., Yang, C., Li, Z., & Failler, P. (2021). Does geopolitics have an impact on energy trade? Empirical research on emerging countries. Sustainability, 13(9), 5199. [CrossRef]
- Proskurina, S., Sikkema, R., Banja, M., & Vakkilainen, E. (2020). How are the EU member states contributing to the biomass target for EU's renewable energy consumption and environmental im-pact? 28th European Biomass Conference and Exhibition Proceedings, 722-724.
- Nelles, M., Deprie, K., & Jalalipour, H. (2023). The role of biogenic wastes and residues in a cli-mate-neutral society: Carbon source, bioenergy and negative emissions. Waste Management & Re-search, 41, 741-743.
- Lundbäck, M., Häggström, C., & Nordfjell, T. (2021). Worldwide trends in methods for harvest-ing and extracting industrial roundwood. International Journal of Forest Engineering, 32(3), 202-215.
- Mishra, A., Humpenöder, F., Dietrich, J. P., Bodirsky, B. L., Sohngen, B., PO Reyer, C., ... & Popp, A. (2021). Estimating global land system impacts of timber plantations using MAgPIE 4.3. 5. Geoscientific Model Development, 14(10), 6467-6494. [CrossRef]
- Andrew, R. M. (2019). Global CO 2 emissions from cement production, 1928–2018. Earth Sys-tem Science Data, 11(4), 1675-1710.
- Liu, Z., Ciais, P., Deng, Z., Davis, S. J., Zheng, B., Wang, Y., ... & Chevallier, F. (2020). Carbon Monitor, a near-real-time daily dataset of global CO₂ emission from fossil fuel and cement produc-tion. Scientific data, 7(1), 392.
- Anisimova, V. Y., Podbornova, E. S., & Tukavkin, N. M. (2020, September). Energy consump-tion and energy intensity of the Russian GDP, taking into account the development of the transport network. In IOP Conference Series: Materials Science and Engineering (Vol. 918, No. 1, p. 012234). IOP Publishing.
- Sueyoshi, T., & Goto, M. (2023). Energy Intensity, Energy Efficiency and Economic Growth among OECD Nations from 2000 to 2019. Energies, 16(4), 1927. [CrossRef]
- Jones, S. K., Estrada-Carmona, N., Juventia, S. D., Dulloo, M. E., Laporte, M. A., Villani, C., & Remans, R. (2021). Agrobiodiversity Index scores show agrobiodiversity is underutilized in national food systems. Nature food, 2(9), 712-723. [CrossRef]
- Gedik, M. A., & Günel, T. (2021). The impact of climate change on edible food production: a panel data analysis. Acta Agriculturae Scandinavica, Section B—Soil & Plant Science, 71(5), 318-323. [CrossRef]
- Kassebaum, N. J., Bertozzi-Villa, A., Coggeshall, M. S., Shackelford, K. A., Steiner, C., Heuton, K. R., ... & Kazi, D. S. (2014). Global, regional, and national levels and causes of maternal mortality during 1990–2013: a systematic analysis for the Global Burden of Disease Study 2013. The Lancet, 384(9947), 980-1004. [CrossRef]
- Melaku, Y. A., Gill, T. K., Taylor, A. W., Appleton, S. L., Gonzalez-Chica, D., Adams, R., ... & Renzaho, A. (2019). Trends of mortality attributable to child and maternal undernutrition, over-weight/obesity and dietary risk factors of non-communicable diseases in sub-Saharan Africa, 1990–2015: findings from the Global Burden of Disease Study 2015. Public health nutrition, 22(5), 827-840.
- Leigh, I., Montes, J., & Smith, C. L. (2021). Caregiving for children and parental labor force par-ticipation during the pandemic (No. 2021-11-05-2). Board of Governors of the Federal Reserve Sys-tem (US).
- Espi-Sanchis, G., Leibbrandt, M., & Ranchhod, V. (2022). Age, employment and labour force participation outcomes in COVID-era South Africa. Development Southern Africa, 39(5), 664-688. [CrossRef]
- Aheto, J. M. K., Yankson, R., & Chipeta, M. G. (2020). Geostatistical analysis and mapping: so-cial and environmental determinants of under-five child mortality, evidence from the 2014 Ghana demographic and health survey. BMC Public Health, 20, 1-12.
- Tessema, Z. T., Tebeje, T. M., & Gebrehewet, L. G. (2022). Geographic variation and factors as-sociated with under-five mortality in Ethiopia. A spatial and multilevel analysis of Ethiopian mini demographic and health survey 2019. PLoS One, 17(10), e0275586. [CrossRef] [PubMed]
- Kasimovskaya, N., Egorova, E., Shustikova, N., Poleshchuk, I., Khvostunov, K., Malkina, O., & Ermilova, V. (2022). Development of healthcare and social care services for the elderly popula-tion. Journal of Comparative Effectiveness Research, 11(17), 1263-1276.
- Shuba, M. N., & Frolova, V. R. (2022). The population aging in the European Union: features and socioeconomic consequences. [CrossRef]
- Piantanida, E., Gallo, D., & Tanda, M. L. (2020). Liraglutide is an effective drug for the treat-ment of obesity also in real life. Journal of Endocrinological Investigation, 43(12), 1827-1828.
- Schienkiewitz, A., Kuhnert, R., Blume, M., & Mensink, G. B. (2022). Overweight and obesity among adults in Germany–results from GEDA 2019/2020-EHIS. Journal of Health Monitor-ing, 7(3), 21.
- Gallant, J., Kroft, K., Lange, F., & Notowidigdo, M. J. (2020). Temporary unemployment and labor market dynamics during the COVID-19 recession (No. w27924). National Bureau of Econom-ic Research. [CrossRef]
- Davidescu, A. A., Apostu, S. A., & Stoica, L. A. (2021). Socioeconomic effects of COVID-19 pandemic: Exploring uncertainty in the forecast of the Romanian unemployment rate for the period 2020–2023. Sustainability, 13(13), 7078. [CrossRef]
- Zhang, M., & Bhattacharjee, B. (2023). Challenges Prevailing in Bangladesh Civil Service: A Brief Analysis. Public Administration Research, 12(2), 1-59. [CrossRef]
- Jordan, R. P., & Caotivo, J. M. (2023). Fractal Analysis of Gross Domestic Expenditures on Re-search and Development (R&D) Worldwide.
- Kalın, F. (2023). R&D Expenditures and Economic Growth: A Panel Data Analysis For Selected Developing Economies (Doctoral dissertation, Murat Ali YÜLEK).
- González, F. (2021). Creditor rights and entrepreneurship: Evidence from legal changes. Interna-tional Review of Economics & Finance, 75, 278-299. [CrossRef]
- Simiyu, M. A. (2022). Freedom of expression and African elections: Mitigating the insidious ef-fect of emerging approaches to addressing the false news threat. African Human Rights Law Jour-nal, 22(1), 76-107.
- Michel, D. (2023). The Impact of E-Government on Governance in the Case of ASIA Countries in 2020. West Science Interdisciplinary Studies, 1(08), 539-551. [CrossRef]
- Pérez-Barbería, F. J., Mayes, R. W., Giráldez, J., & Sánchez-Pérez, D. (2020). Ericaceous species reduce methane emissions in sheep and red deer: Respiration chamber measurements and predictions at the scale of European heathlands. Science of The Total Environment, 714, 136738. [CrossRef]
- Lage Filho, N. M., Cardoso, A. D. S., Azevedo, J. C. D., Macedo, V. H. M., Domingues, F. N., Faturi, C., ... & do Rêgo, A. C. (2023). How does land use change affect the methane emission of soil in the Eastern Amazon?. Frontiers in Environmental Science, 11, 1244152. [CrossRef]
- Huang, M., Gu, C., & Bai, Y. (2023). Effect of Fertilization on Methane and Nitrous Oxide Emissions and Global Warming Potential on Agricultural Land in China: A Meta-Analysis. Agricul-ture, 14(1), 34. [CrossRef]
- Höglund-Isaksson, L., Gómez-Sanabria, A., Klimont, Z., Rafaj, P., & Schöpp, W. (2020). Tech-nical potentials and costs for reducing global anthropogenic methane emissions in the 2050 timeframe–results from the GAINS model. Environmental Research Communications, 2(2), 025004.
- McNorton, J., Bousserez, N., Agustí-Panareda, A., Balsamo, G., Cantarello, L., Engelen, R., ... & Ribas, R. (2022). Quantification of methane emissions from hotspots and during COVID-19 using a global atmospheric inversion. Atmospheric Chemistry and Physics, 22(9), 5961-5981. [CrossRef]
- Gu, A., Zhou, S., Xu, S., & Tong, Q. (2022). Energy industry methane emissions trajectory anal-ysis in China until 2050. Atmosphere, 13(12), 1989.
- Sikirica, A., Theis, N., & Betancourt, M. (2022). Conflicting outcomes of alternative energies: ag-ricultural methane emissions and hydroelectricity, 1975–2015. Environmental Research: Cli-mate, 1(2), 025005.
- Pignataro, V., Liponi, A., Bargiacchi, E., & Ferrari, L. (2023). Impact of management strategy on green methane production from wind energy. In E3S Web of Conferences (Vol. 414, p. 01005). EDP Sciences.
- Deshmukh, C. S., Julius, D., Evans, C. D., Nardi, Susanto, A. P., Page, S. E., ... & Desai, A. R. (2020). Impact of forest plantation on methane emissions from tropical peatland. Global Change Bi-ology, 26(4), 2477-2495. [CrossRef] [PubMed]
- Aini, F. K., Hergoualc’h, K., Smith, J. U., Verchot, L., & Martius, C. (2020). How does replacing natural forests with rubber and oil palm plantations affect soil respiration and methane flux-es?. Ecosphere, 11(11), e03284.
- Nisbet, E. G., Fisher, R. E., Lowry, D., France, J. L., Allen, G., Bakkaloglu, S., ... & Zazzeri, G. (2020). Methane mitigation: methods to reduce emissions, on the path to the Paris agree-ment. Reviews of Geophysics, 58(1), e2019RG000675. [CrossRef]
- Nunes, L. J. (2023). The rising threat of atmospheric CO₂: a review on the causes, impacts, and mitigation strategies. Environments, 10(4), 66.
- Ullah, S., Nadeem, M., Ali, K., & Abbas, Q. (2022). Fossil fuel, industrial growth and inward FDI impact on CO₂ emissions in Vietnam: testing the EKC hypothesis. Management of Environ-mental Quality: An International Journal, 33(2), 222-240.
- Al-Kuwari, O., Welsby, D., Rodriguez, B. S., Pye, S., & Ekins, P. (2020). Carbon intensity of oil and gas production.
- Burns, D., & Grubert, E. (2021). Attribution of production-stage methane emissions to assess spatial variability in the climate intensity of US natural gas consumption. Environmental Research Letters, 16(4), 044059. [CrossRef]
- Tarazkar, M. H., Kargar Dehbidi, N., Ansari, R. A., & Pourghasemi, H. R. (2021). Factors affect-ing methane emissions in OPEC member countries: does the agricultural production matter?. Envi-ronment, Development and Sustainability, 23, 6734-6748.
- Mrówczyńska-Kamińska, A., Bajan, B., Pawłowski, K. P., Genstwa, N., & Zmyślona, J. (2021). Greenhouse gas emissions intensity of food production systems and its determinants. PLoS One, 16(4), e0250995. [CrossRef]
- Singh, A., Kuttippurath, J., Abbhishek, K., Mallick, N., Raj, S., Chander, G., & Dixit, S. (2021). Biogenic link to the recent increase in atmospheric methane over India. Journal of Environmental Management, 289, 112526. [CrossRef]
- Anser, M. K., Islam, T., Khan, M. A., Zaman, K., Nassani, A. A., Askar, S. E., ... & Kabbani, A. (2020). Identifying the potential causes, consequences, and prevention of communicable diseases (including COVID-19). BioMed Research International, 2020(1), 8894006.
- Karn, M., & Sharma, M. (2021). Climate change, natural calamities and the triple burden of dis-ease. Nature Climate Change, 11(10), 796-797.
- Gori, L., Mammana, C., Manfredi, P., & Michetti, E. (2022). Economic development with deadly communicable diseases and public prevention. Journal of Public Economic Theory, 24(5), 912-943. [CrossRef]
- Sakamoto, L. S., Berndt, A., Pedroso, A. D. F., Lemes, A. P., Azenha, M. V., Alves, T. C., ... & Oliveira, P. P. (2020). Pasture intensification in beef cattle production can affect methane emission intensity. Journal of Animal Science, 98(10), skaa309. [CrossRef]
- Chandra, N., Patra, P. K., Bisht, J. S., Ito, A., Umezawa, T., Saigusa, N., ... & Canadell, J. G. (2021). Emissions from the oil and gas sectors, coal mining and ruminant farming drive methane growth over the past three decades. Journal of the Meteorological Society of Japan. Ser. II, 99(2), 309-337. [CrossRef]
- Bakkaloglu, S., Lowry, D., Fisher, R., France, J., Brunner, D., Chen, H., ... Nisbet, E. (2021). Quantification of methane emissions from UK biogas plants. Waste Management, 124, 82-93. [CrossRef]
- Cardona, M., Millward, J., Gemmill, A., Jison Yoo, K., & Bishai, D. M. (2022). Estimated im-pact of the 2020 economic downturn on under-5 mortality for 129 countries. Plos one, 17(2), e0263245.
- Sasmoko, Shabnam, Handayani, W., Nassani, A. A., Haffar, M., & Zaman, K. (2022). Do precar-ious female employment and political autonomy affect the under-5 mortality rate? Evidence from 166 countries. Plos one, 17(6), e0269575.
- Suerungruang, S., Sornlorm, K., Laohasiriwong, W., & Mahato, R. (2023). Spatial association and modelling of under-5 mortality in Thailand, 2020. Geospatial Health. [CrossRef] [PubMed]
- Feng, L., Palmer, P. I., Parker, R. J., Lunt, M. F., & Bösch, H. (2023). Methane emissions are predominantly responsible for record-breaking atmospheric methane growth rates in 2020 and 2021. Atmospheric Chemistry and Physics, 23(8), 4863-4880. [CrossRef]
- Drinkwater, A., Palmer, P. I., Feng, L., Arnold, T., Lan, X., Michel, S. E., ... & Boesch, H. (2023). Atmospheric data support a multi-decadal shift in the global methane budget towards natu-ral tropical emissions. Atmospheric Chemistry and Physics, 23(14), 8429-8452.
- Wang, Y. Y., Tian, T., Pan, D., Zhang, J. X., Xie, W., Wang, S. K., ... & Sun, G. (2021). The re-lationship between dietary patterns and overweight and obesity among adult in Jiangsu Province of China: a structural equation model. BMC Public Health, 21(1), 1225.
- Rodríguez-Ramírez, S., Martinez-Tapia, B., González-Castell, D., Cuevas-Nasu, L., & Shamah-Levy, T. (2022). Westernized and diverse dietary patterns are associated with overweight-obesity and abdominal obesity in Mexican adult men. Frontiers in Nutrition, 9, 891609. [CrossRef] [PubMed]
- Li, K., Zhang, H. D., Jian, W. X., Sun, X. M., Zhao, L., Wang, H. J., ... & Peng, W. (2023). Prevalence of obesity and its association with dietary patterns: a cohort study among Tibetan pas-toralists in Qinghai Province. Zhonghua liu xing bing xue za zhi= Zhonghua liuxingbingxue za-zhi, 44(8), 1257-1263.
- Saunois, M., Stavert, A. R., Poulter, B., Bousquet, P., Canadell, J. G., Jackson, R. B., ... & Zhuang, Q. (2019). The global methane budget 2000–2017. Earth System Science Data Discus-sions, 2019, 1-136.
- Rutherford, J. S., Sherwin, E. D., Ravikumar, A. P., Heath, G. A., Englander, J., Cooley, D., ... & Brandt, A. R. (2021). Closing the methane gap in US oil and natural gas production emissions in-ventories. Nature communications, 12(1), 4715.
- Adeel-Farooq, R. M., Raji, J. O., & Adeleye, B. N. (2021). Economic growth and methane emis-sion: testing the EKC hypothesis in ASEAN economies. Management of Environmental Quality: An International Journal, 32(2), 277-289.
- Kleinberg, R. (2021). Methane emission controls: toward more effective regulation. Available at SSRN 3860311.
- Bletsas, K., Oikonomou, G., Panagiotidis, M., & Spyromitros, E. (2022). Carbon dioxide and greenhouse gas emissions: the role of monetary policy, fiscal policy, and institutional quali-ty. Energies, 15(13), 4733. [CrossRef]
- Liang, Y. (2022). Analysis and Enlightenment of Methane Emission Reduction Control in Oil and Gas Industry. Academic Journal of Science and Technology, 4(3), 47-50. [CrossRef]
- Petrović, P., & Lobanov, M. M. (2020). The impact of R&D expenditures on CO₂ emissions: evi-dence from sixteen OECD countries. Journal of Cleaner Production, 248, 119187.
- Lauvaux, T., Giron, C., Mazzolini, M., d’Aspremont, A., Duren, R., Cusworth, D., ... & Ciais, P. (2022). Global assessment of oil and gas methane ultra-emitters. Science, 375(6580), 557-561. [CrossRef]
- Baldos, U. L. C. (2023). Impacts of US Public R&D Investments on Agricultural Productivity and GHG Emissions. Journal of Agricultural and Applied Economics, 55(3), 536-550. [CrossRef]
- Ronaghi, M., Reed, M., & Saghaian, S. (2020). The impact of economic factors and governance on greenhouse gas emission. Environmental Economics and Policy Studies, 22, 153-172. [CrossRef]
- Szymczyk, K., Şahin, D., Bağcı, H., & Kaygın, C. Y. (2021). The effect of energy usage, eco-nomic growth, and financial development on CO₂ emission management: an analysis of OECD countries with a High environmental performance index. Energies, 14(15), 4671.
- Ruza, C., & Caro-Carretero, R. (2022). The non-linear impact of financial development on envi-ronmental quality and sustainability: evidence from G7 countries. International Journal of Environ-mental Research and Public Health, 19(14), 8382.
- Güngör, H., Olanipekun, I. O., & Usman, O. (2021). Testing the environmental Kuznets curve hypothesis: the role of energy consumption and democratic accountability. Environmental Science and Pollution Research, 28, 1464-1478. [CrossRef]
- Simionescu, M., Neagu, O., & Gavurova, B. (2022). The role of quality of governance in reduc-ing pollution in Romania: An ARDL and nonparametric bayesian approach. Frontiers in Environ-mental Science, 10, 892243.
- Sadaoui, N., Zabat, L., Sekrafi, H., & Abid, M. (2024). The moderating role of natural resources between governance and CO₂ emissions: Evidence from MENA countries. Energy & Environ-ment, 35(3), 1597-1615. [CrossRef]
Figure 1.
Methane emissions and environmental mitigation.
Figure 1.
Methane emissions and environmental mitigation.
Figure 2.
Socioeconomic aspects and impacts of methane emissions.
Figure 2.
Socioeconomic aspects and impacts of methane emissions.
Figure 3.
Technologies for monitoring and regulation of methane emissions.
Figure 3.
Technologies for monitoring and regulation of methane emissions.
Figure 4.
The relationship between agricultural land and methane emissions.
Figure 4.
The relationship between agricultural land and methane emissions.
Figure 5.
The relationship between energy imports and methane.
Figure 5.
The relationship between energy imports and methane.
Figure 6.
The relationship between renewable energy consumption and methane emissions.
Figure 6.
The relationship between renewable energy consumption and methane emissions.
Figure 7.
The relationship between net forest depletion and methane emissions.
Figure 7.
The relationship between net forest depletion and methane emissions.
Figure 8.
The relationship between CO₂ and methane emissions.
Figure 8.
The relationship between CO₂ and methane emissions.
Figure 9.
The relationship between energy intensity and methane emissions.
Figure 9.
The relationship between energy intensity and methane emissions.
Figure 10.
Food production index and methane emissions.
Figure 10.
Food production index and methane emissions.
Figure 11.
The relationship between the cause of death and methane emissions.
Figure 11.
The relationship between the cause of death and methane emissions.
Figure 12.
The relationship between labor force participation and methane emissions.
Figure 12.
The relationship between labor force participation and methane emissions.
Figure 13.
The relationship between mortality rate and methane emissions.
Figure 13.
The relationship between mortality rate and methane emissions.
Figure 14.
The relationship between population ages 65 and above and methane emissions.
Figure 14.
The relationship between population ages 65 and above and methane emissions.
Figure 15.
The relationship between the prevalence of overweight and methane emissions.
Figure 15.
The relationship between the prevalence of overweight and methane emissions.
Figure 16.
The relationship between unemployment and methane emissions.
Figure 16.
The relationship between unemployment and methane emissions.
Figure 17.
The relationship between government effectiveness and methane emissions.
Figure 17.
The relationship between government effectiveness and methane emissions.
Figure 18.
The relationship between R&D expenditure and methane emissions.
Figure 18.
The relationship between R&D expenditure and methane emissions.
Figure 19.
The relationship between the Strength of Legal Rights Index and methane emissions.
Figure 19.
The relationship between the Strength of Legal Rights Index and methane emissions.
Figure 20.
The relationship between Voice and Accountability and methane emissions.
Figure 20.
The relationship between Voice and Accountability and methane emissions.
Table 1.
Variables used for the estimation of the econometric model.
Table 1.
Variables used for the estimation of the econometric model.
| Macrocategory |
Variable |
Acronym |
Description |
| |
Methane Emissions (kt of CO₂ equivalent) |
METHANE |
Anthropogenic methane emissions refer to those CH₄ releases to the atmosphere resulting from human activities including agriculture, landfills, and fossil fuel systems. Emissions are expressed in kt CO₂ equivalent, using a 28-34 times higher global warming effect of methane compared to CO₂ over 100 years [47,48]. |
| E-Environment |
Agricultural land (% of land area) |
AL |
Agricultural land includes land area used for arable land, permanent crops, and permanent pastures. Arable land comprises land for temporary crops and pastures, while permanent crops include land for cocoa, coffee, etc., that do not require replanting. It is measured as a percentage of total land area [49,50]. |
| Energy imports, net (% of energy use) |
EIMP |
It is the difference between energy production and its consumption in an economy, with net energy imports accounting for it. This would indicate whether or not the country is a net importer or exporter regarding energy. Oil equivalents are the units of measurements used. A negative value means it is a net exporter of energy [51,52]. |
| Renewable energy consumption (% of total final energy consumption) |
REC |
Renewable energy consumption refers to the percentage of total final energy use that is accounted for by renewable resources such as wind, solar, hydro, geothermal, and biomass. The generally accepted measure for renewable energy is a proportion of the total energy consumption, usually expressed in percentage [53,54]. |
| Adjusted savings: net forest depletion (% of GNI) |
NFD |
Net forest depletion is the loss of forest resources when the roundwood is harvested at an excess of natural growth, hence an indicator of poor forest management. It is measured as a percentage of Gross National Income, indicating how much value has been lost economically due to over-harvesting [55,56]. |
| CO₂ emissions (metric tons per capita) |
CO₂E |
CO₂ emissions are particularly produced by the combustion of fossil fuels and cement production, including those using solid, liquid, and gaseous fuels, and gas flaring. Commonly, these emissions are measured as metric tons per capita to track environmental impact and develop strategies for decreasing greenhouse gas emissions [57,58]. |
| Energy intensity level of primary energy (MJ/$2017 PPP GDP) |
INTENSITY |
Primary energy Energy intensity is the amount of energy used in producing one unit of economic output, adjusted for PPP. The usual measurement is megajoules per dollar of GDP, that is in MJ/ $2017 PPP GDP [59,60]. |
| Food production index (2014-2016 = 100) |
FPI |
Food Production Index measures the output of crops that are edible and contribute to human nutrition, omitting non-nutritive crops such as coffee and tea. Consequently, the unit of measurement adopted is a relative index, with the base period 2014-2016 set at 100 [61,62]. |
| S-Social |
Cause of death, by communicable diseases and maternal, prenatal and nutrition conditions (% of total) |
CD |
Cause of death refers to the percentage share in the total deaths in all age groups by causes that include communicable diseases, maternal health conditions, congenital anomalies, and nutritional disorders. It is measured in respect to total deaths within the population in percentage form [63,64]. |
| Labor force participation rate, total (% of total population ages 15-64) (modeled ILO estimate) |
LFPR |
Labor force participation rate refers to the percent of the population aged 15-64 which is economically active: either employed or unemployed. It is given as a percentage of the total population of working age [65,66]. |
| Mortality rate, under-5 (per 1,000 live births) |
MR5 |
Under-five mortality rate refers to the probability that a newborn baby will die before reaching age five; it reflects the key factors of the quality of healthcare, disease prevention, nutrition, and living conditions. It is expressed as the number of deaths per 1,000 live births in a given year [67,68]. |
| Population ages 65 and above (% of total population) |
P65 |
The population aged 65 and older as a percentage of the total population represents the proportion of people in this age group relative to the entire population. By convention, this indicator is expressed as a percent and is calculated based on the de facto population, which comprehends all persons present on the territory regardless of their legal status or citizenship [69,70]. |
| Prevalence of overweight (% of adults) |
PO |
Adult obesity prevalence is the percentage of people ages 18 and over with a Body Mass Index of equal to or greater than 30 kg/m², which is indicative of obesity. For any given height, a calculation of weight in kilograms divided by height in meters squared determines BMI (kg/m²) [71,72]. |
| Unemployment, total (% of total labor force) (modeled ILO estimate) |
UT |
Unemployment represents the percentage of the labor force that is jobless, actively seeking, and available for work. It is measured as a percentage of the total labor force [73,74]. |
| G-Governance |
Government Effectiveness: Estimate |
GE |
Government Effectiveness captures the quality of public services, the quality and independence of the civil service, and the credibility of government commitment to policies and plans. It is a score calculated from a standard normal distribution ranging from approximately -2.5 to 2.5. Higher scores indicate better government performance [75]. |
| Research and development expenditure (% of GDP) |
RAND |
Gross domestic expenditure on R&D refers to the share of a nation's GDP that goes to research and experimental development, operating costs, and capital spending in business enterprises, government, higher education, and private non-profit organizations. This is measured as a percentage of GDP and reflects the investment in scientific and technological innovation for the nation [76,77]. |
| Strength of legal rights index (0=weak to 12=strong) |
STRENGHT |
The Strength of Legal Rights Index provides a rating with respect to the laws of collateral and bankruptcy that enable borrowers and lenders to make a shift towards easier credit accessibility. Higher scores indicate that the legal environment is more conducive to secured forms of lending. It is measured from 0 to 12 [78]. |
| Voice and Accountability: Estimate |
VA |
Voice and Accountability measures the extent to which a country's citizens are able to participate in the political process, exercise freedom of expression, associate freely, and have an independent media. Scores for this dimension normally follow the normal distribution between -2.5 and 2.5, where higher values represent stronger democratic institutions and greater participation of the public [79,80]. |
Table 2.
Panel data estimates for the environmental component.
Table 2.
Panel data estimates for the environmental component.
| Model |
|
Constant |
NFD |
AL |
CO₂E |
EIMP |
INTENSITY |
FPI |
REC |
| Fixed Effects |
Coefficient |
0.062 |
0.190*** |
-0.008*** |
0.146*** |
-0.001*** |
0.014*** |
0.015*** |
-0.007*** |
| Std. Error |
0.057 |
0.027 |
0.002 |
0.014 |
0.000 |
0.001 |
0.001 |
0.002 |
| t-ratio |
1.090 |
6.989 |
-2.965 |
10.07 |
-3.745 |
10.28 |
8.914 |
-2.734 |
| Random Effects |
Coefficient |
0.062 |
0.203*** |
-0.009*** |
0.141*** |
-0.001*** |
0.0151*** |
0.015*** |
-0.008*** |
| Std. Error |
0.174 |
0.025 |
0.002 |
0.013 |
0.000 |
0.001 |
0.001 |
0.002 |
| t-ratio |
0.3589 |
7.850 |
-3.364 |
10.23 |
-4.037 |
10.95 |
9.672 |
-3.321 |
| Weighted Least Squares |
Coefficient |
0.018 |
0.121*** |
-0.0119*** |
0.086*** |
-0.002*** |
0.023*** |
0.017*** |
-0.010*** |
| Std. Error |
0.014 |
0.009 |
0.000 |
0.004 |
0.000 |
0.002 |
0.000 |
0.000 |
| t-ratio |
1.277 |
12.22 |
-25.83 |
21.01 |
-8.764 |
11.83 |
49.69 |
-23.55 |
| Pooled OLS |
Coefficient |
0.105 |
0.244*** |
-0.014*** |
0.097*** |
-0.004*** |
0.034*** |
0.020*** |
-0.018*** |
| Std. Error |
0.112 |
0.025 |
0.002 |
0.014 |
0.000 |
0.002 |
0.002 |
0.002 |
| t-ratio |
0.9339 |
9.414 |
-5.004 |
6.779 |
-6.124 |
14.47 |
10.28 |
-7.000 |
Table 3.
Panel data estimates for the social component.
Table 3.
Panel data estimates for the social component.
| |
Random Effects |
Pooled OLS |
Fixed Effects |
Weighted Least Squares |
| Variable |
Coefficient |
Std. Error |
z |
Coefficient |
Std. Error |
t-ratio |
Coefficient |
Std. Error |
t-ratio |
Coefficient |
Std. Error |
t-ratio |
| Constant |
-0.162 |
0.233 |
-0.696 |
0.284* |
0.149 |
1.901 |
4.477*** |
0.629 |
7.114 |
0.147*** |
0.025 |
5.882 |
| CD |
-0.017*** |
0.002 |
-6.662 |
-0.009* |
0.004 |
-1.852 |
-0.016*** |
0.002 |
-6.439 |
-0.008*** |
0.000 |
-11.89 |
| LFPR |
0.018*** |
0.001 |
11.66 |
0.008*** |
0.002 |
4.073 |
0.016*** |
0.001 |
9.456 |
0.009*** |
0.000 |
23.63 |
| MR5 |
-0.0001*** |
3.861 |
-3.516 |
-0.0002*** |
7.227 |
-3.563 |
-0.0001*** |
3.79 |
-2.882 |
-0.000*** |
0.000 |
-3.126 |
| P65 |
0.053*** |
0.009 |
5.512 |
0.065*** |
0.004 |
16.23 |
-0.407*** |
0.058 |
-6.910 |
0.015*** |
0.003 |
4.998 |
| PO |
0.013*** |
0.001 |
10.16 |
0.014*** |
0.002 |
6.562 |
0.007*** |
0.001 |
5.120 |
0.009*** |
0.000 |
20.01 |
| UT |
-0.031* |
0.0166 |
-1.906 |
-0.037*** |
0.009 |
-3.817 |
-0.075*** |
0.021 |
-3.505 |
-0.012*** |
0.001 |
-6.854 |
Table 4.
Panel data estimates for the governance component.
Table 4.
Panel data estimates for the governance component.
| |
Weighted Least Squares |
Random Effects |
Pooled OLS |
Fixed Effects |
| Variable |
Coefficient |
Std. Error |
t-ratio |
Coefficient |
Std. Error |
z |
Coefficient |
Std. Error |
t-ratio |
Coefficient |
Std. Error |
t-ratio |
| Costant |
-0.0007*** |
9.841 |
-7.624 |
0.008*** |
0.012 |
0.7176 |
-0.009*** |
0.001 |
-4.843 |
0.008*** |
0.0002 |
40.08 |
| GE |
-0.002*** |
0.0002 |
-9.498 |
-0.021*** |
0.0002 |
-87.28 |
-0.0367*** |
0.001 |
-32.30 |
-0.021*** |
0.0002 |
-86.74 |
| RAND |
0.001*** |
0.0002 |
5.618 |
-0.002*** |
0.0003 |
-6.978 |
0.020*** |
0.002 |
9.497 |
-0.002*** |
0.0003 |
-6.977 |
| STRENGHT |
5.425*** |
7.436 |
7.296 |
6.917*** |
1.673 |
41.34 |
0.0002*** |
9.121 |
23.96 |
6.89*** |
1.682 |
41.00 |
| VA |
0.0008*** |
0.0001 |
6.709 |
0.008*** |
0.0004 |
20.32 |
0.014*** |
0.001 |
7.239 |
0.008*** |
0.0004 |
20.21 |
|
Disclaimer/Publisher’s Note: The statements, opinions and data contained in all publications are solely those of the individual author(s) and contributor(s) and not of MDPI and/or the editor(s). MDPI and/or the editor(s) disclaim responsibility for any injury to people or property resulting from any ideas, methods, instructions or products referred to in the content. |
© 2024 by the authors. Licensee MDPI, Basel, Switzerland. This article is an open access article distributed under the terms and conditions of the Creative Commons Attribution (CC BY) license (http://creativecommons.org/licenses/by/4.0/).


