Submitted:
21 October 2024
Posted:
22 October 2024
Read the latest preprint version here
Abstract
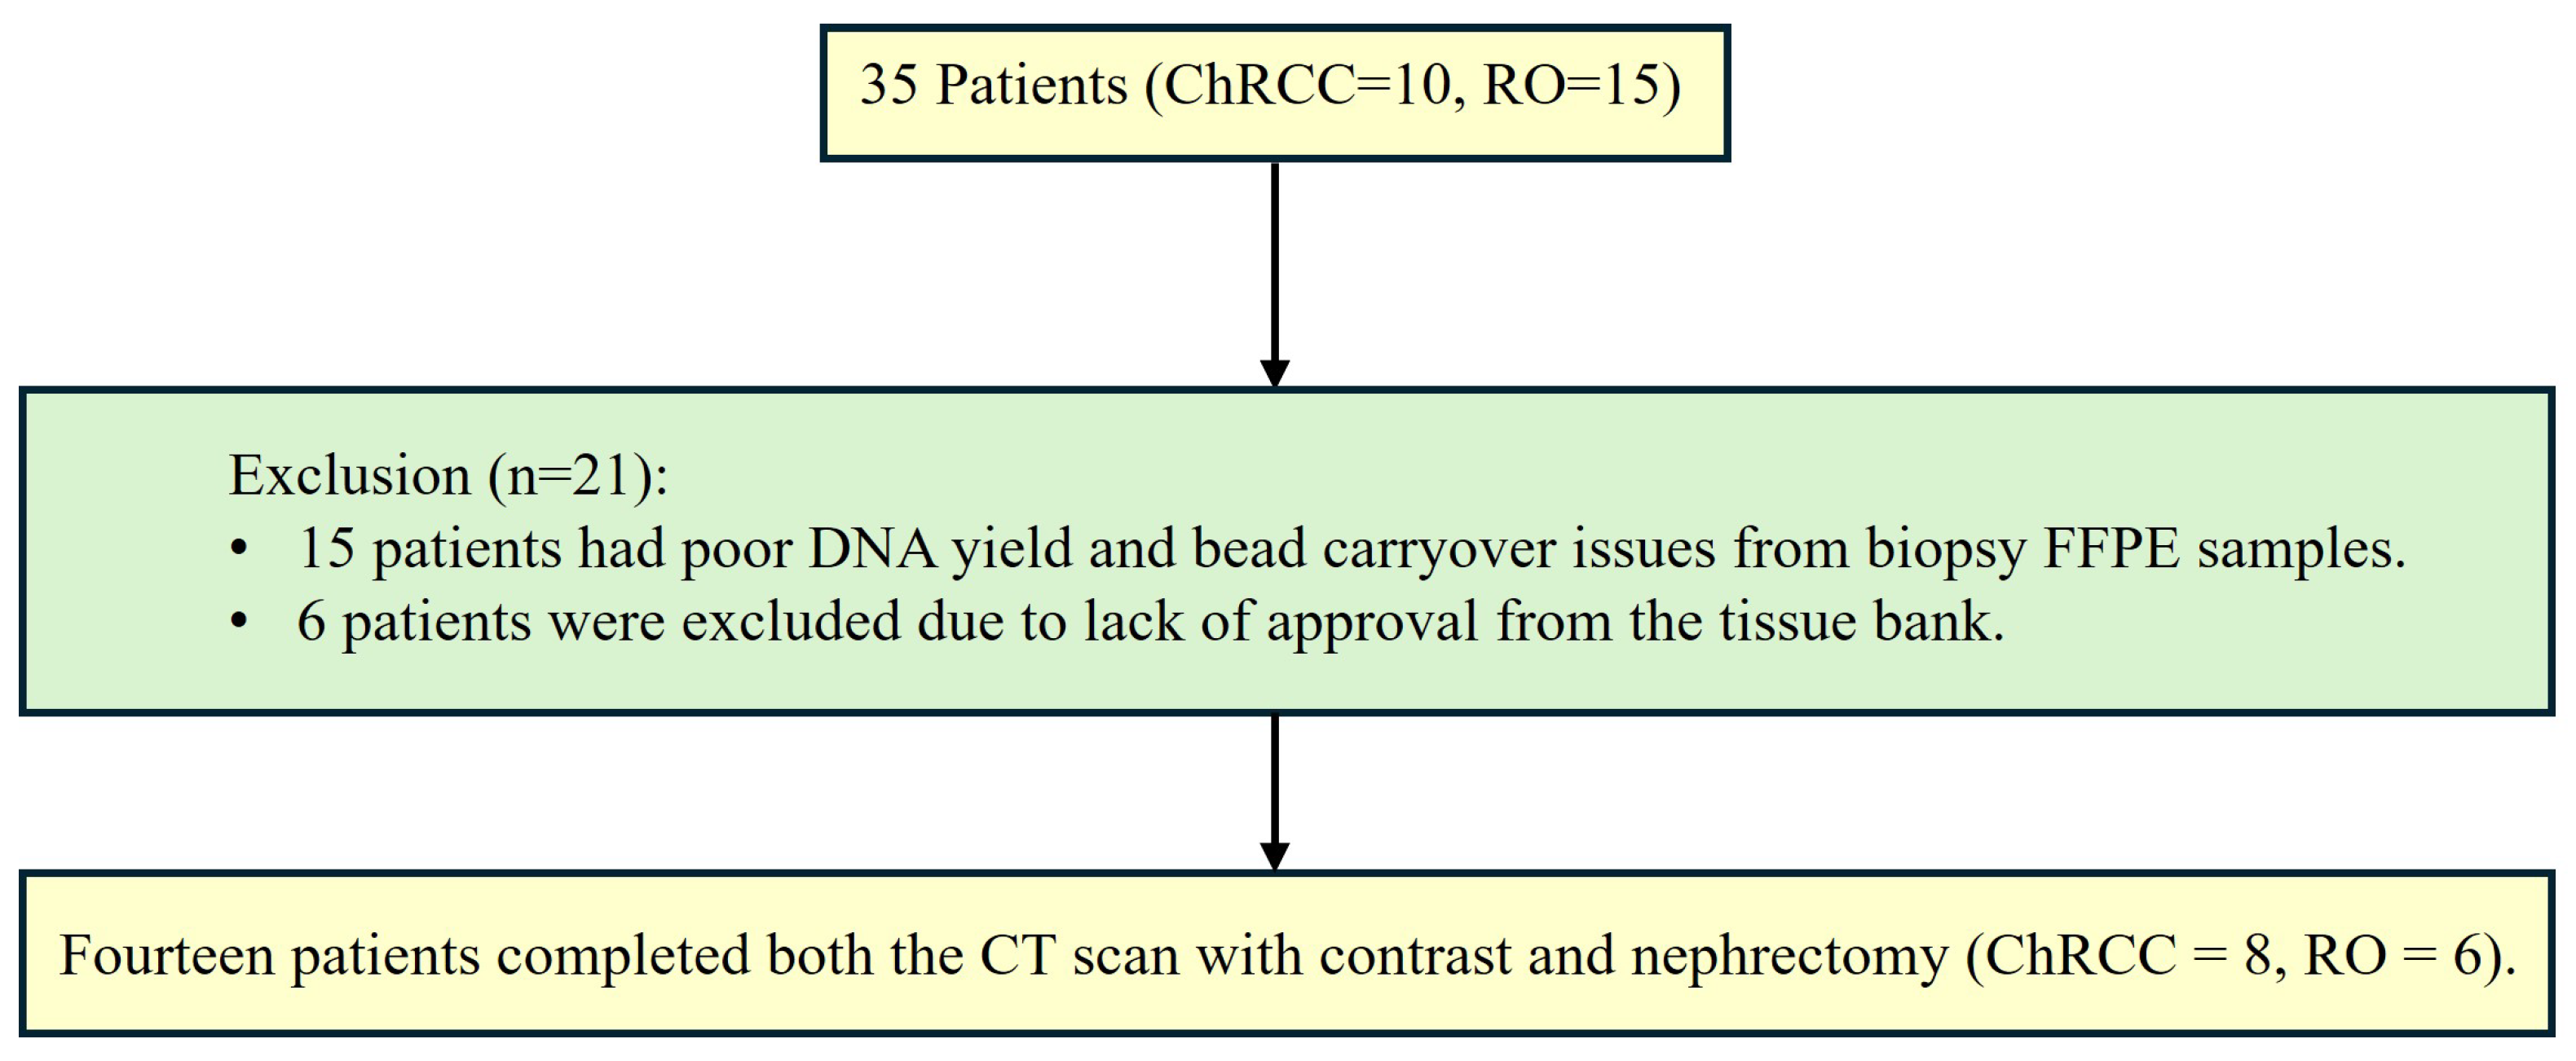
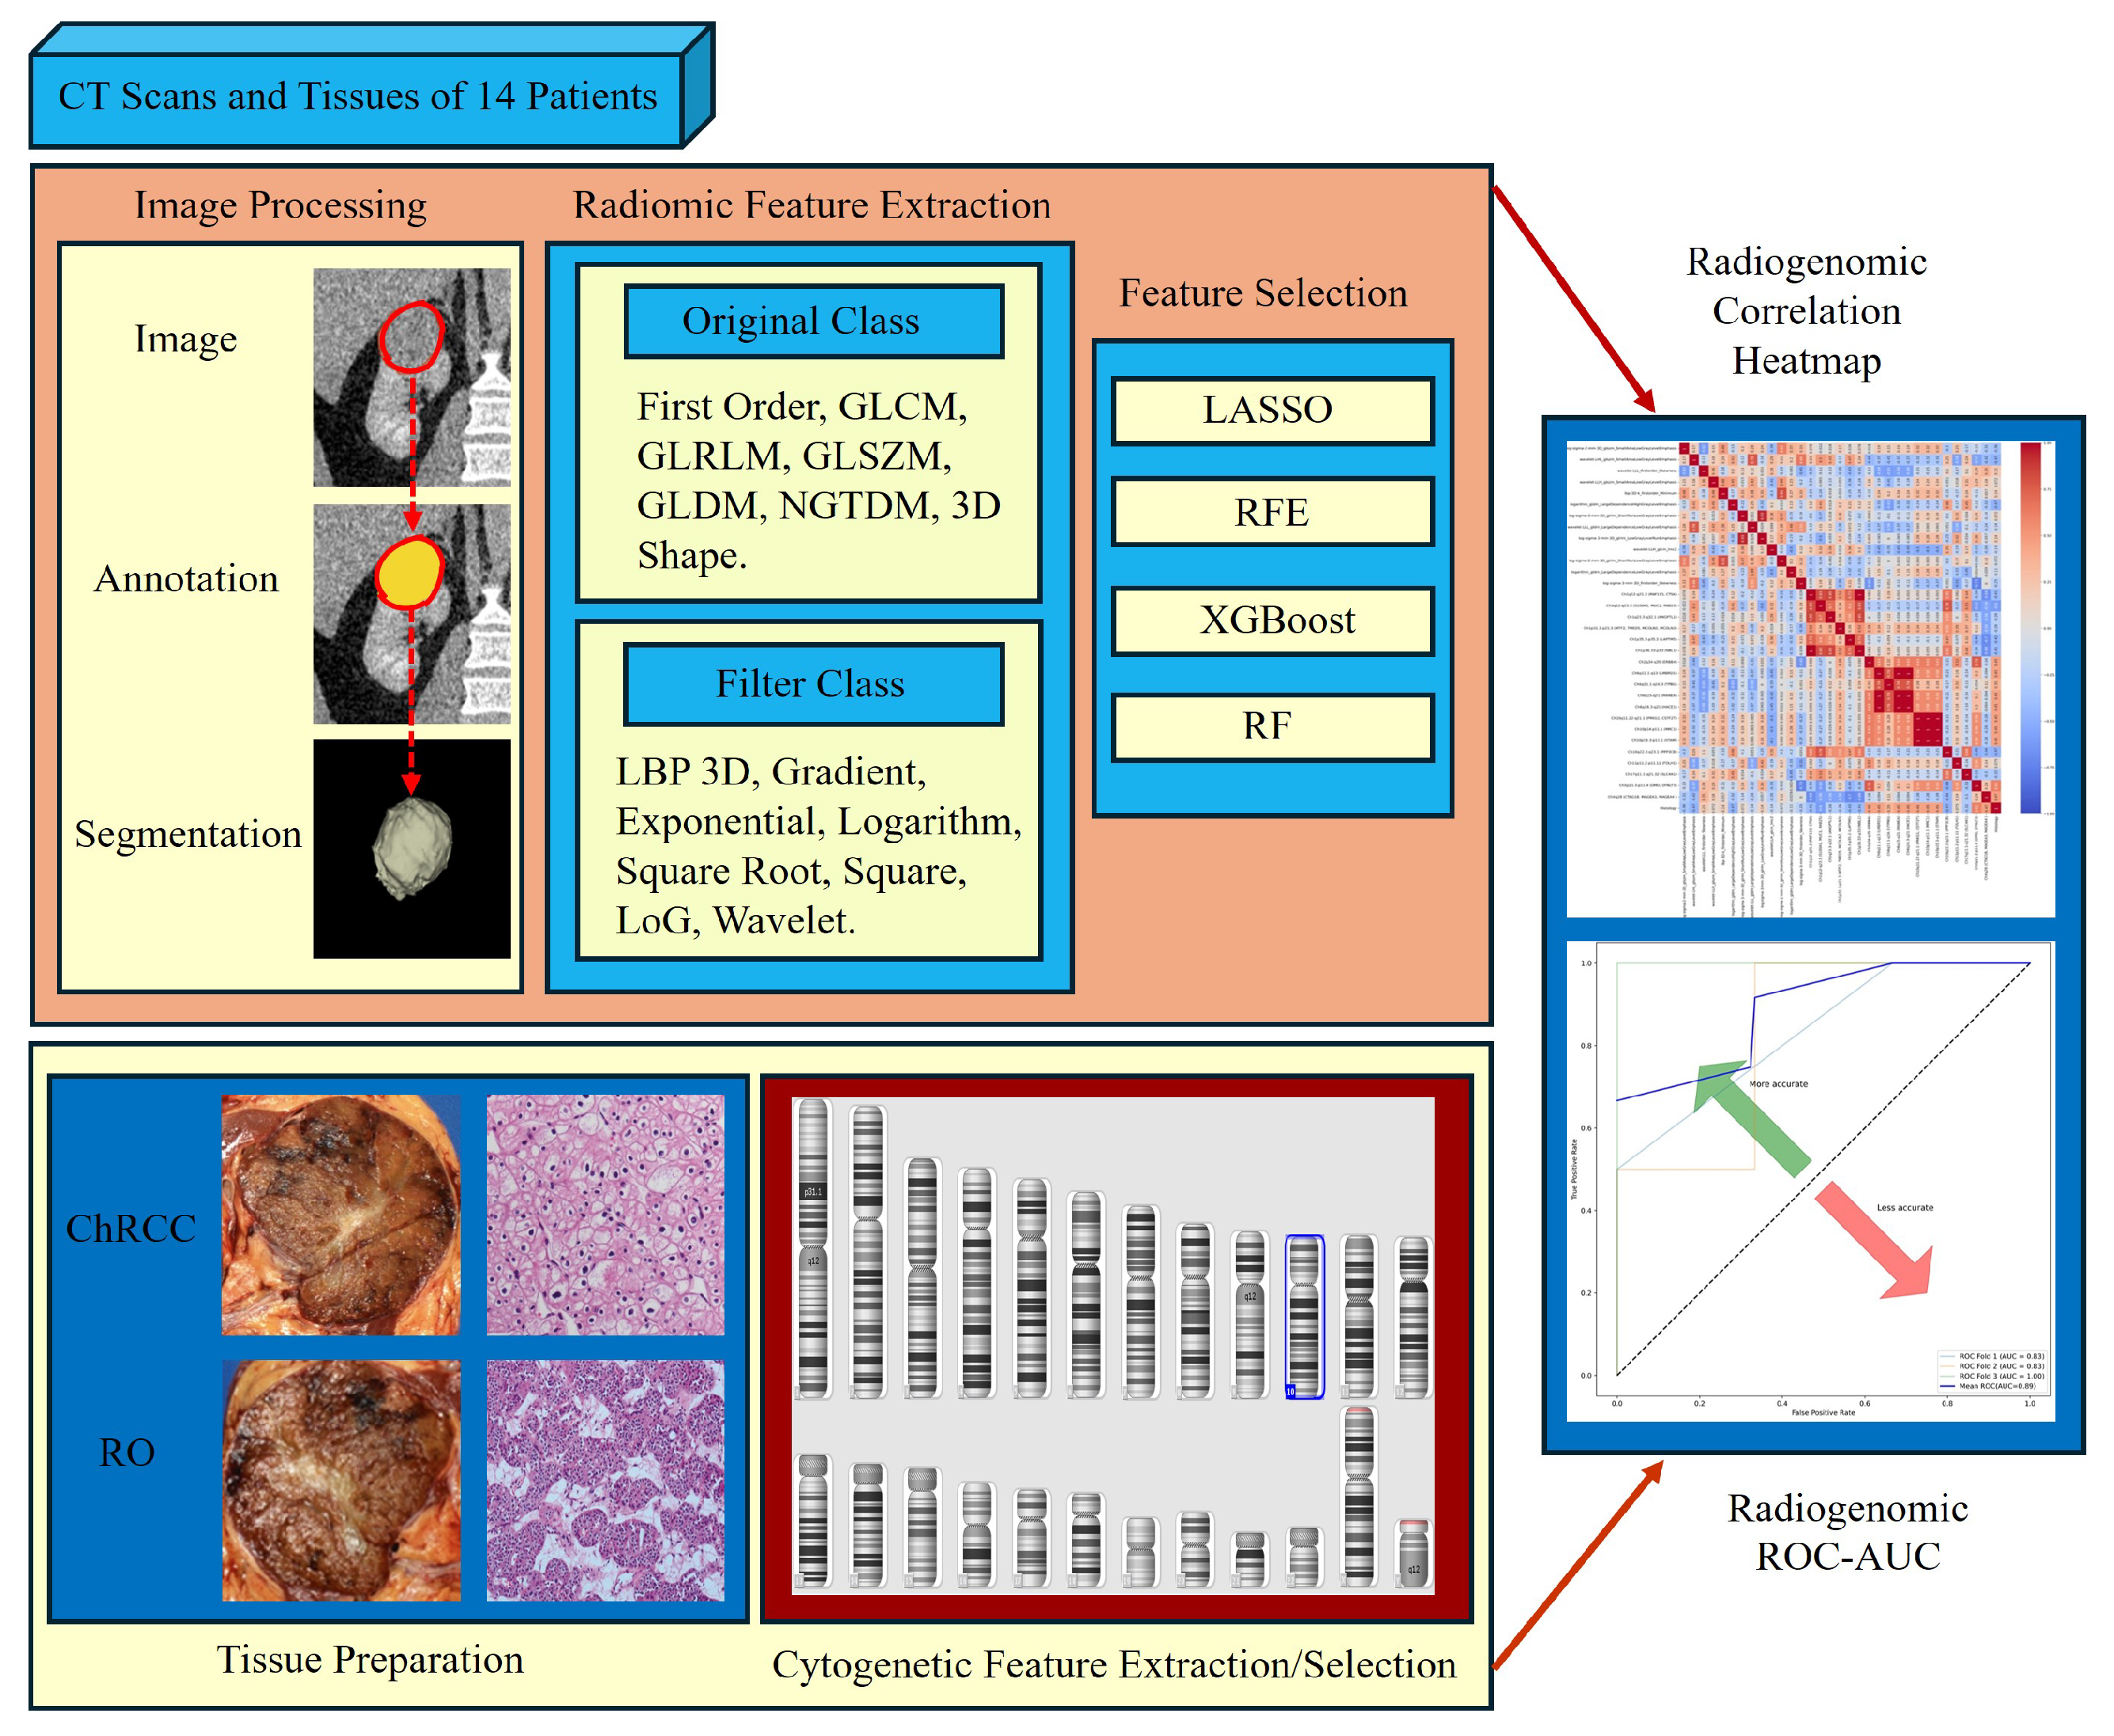
Background: RO and ChRCC are kidney tumours with overlapping characteristics, making differentiation between them challenging. Objectives: The objective of this research is to create a radiogenomics map by correlating radiomic features to molecular phenotypes in ChRCC and RO, using resection as the gold standard. Methods: Fourteen patients (6 RO and 8 ChRCC) were included in the study. A total of 1,875 radiomic features were extracted from CT scans, alongside 632 cytobands containing 16,303 genes from the genomic data. Results: Feature selection algorithms applied to the radiomic features resulted in 13 key features. From the genomic data, 24 cytobands highly correlated with histology were selected and cross-correlated with the radiomic features. The analysis identified four radiomic features that were strongly associated with seven genomic features. Conclusion: These findings demonstrate the potential of integrating radiomic and genomic data to enhance the differential diagnosis of RO and ChRCC, paving the way for more precise and non-invasive diagnostic tools in clinical practice.
Keywords:
1. Introduction
2. Materials and Methods
2.1. Ethical Approval
2.2. Patients and Tissues
- -
- 4 with only 1 FFPE sample.
- -
- 1 with 2 FFPE samples and 1 frozen tissue samples.
- -
- 1 with both 2 FFPE.
- -
- 4 with 1 FFPE sample.
- -
- 1 with 2 FFPE samples.
- -
- 1 with 2 FFPE and 1 frozen tissue.
- -
- 1 with 2 FFPE and 2 frozen tissues.
- -
- 1 with both 1 FFPE and 1 frozen tissue samples.
2.3. Statistical Analysis
2.4. Computed Tomography Scans
2.5. Tumour Volume Segmentation Technique
- -
- is the size of the intersection between two sets A and B (i.e., the number of pixels in the case of image segmentation, that are common to both sets).
- -
- and are the sizes of sets A and B, respectively (i.e., the number of pixels in each set).
- -
- A represents the set of pixels in the segmentation performed by one reader or at one time point.
- -
- B represents the set of pixels in the segmentation performed by another reader or at another time point.
2.6. Radiomics Feature Computation
2.7. Radiomics Feature Pre-Processing and Selection
2.8. Tissue Data Scanning and Processing
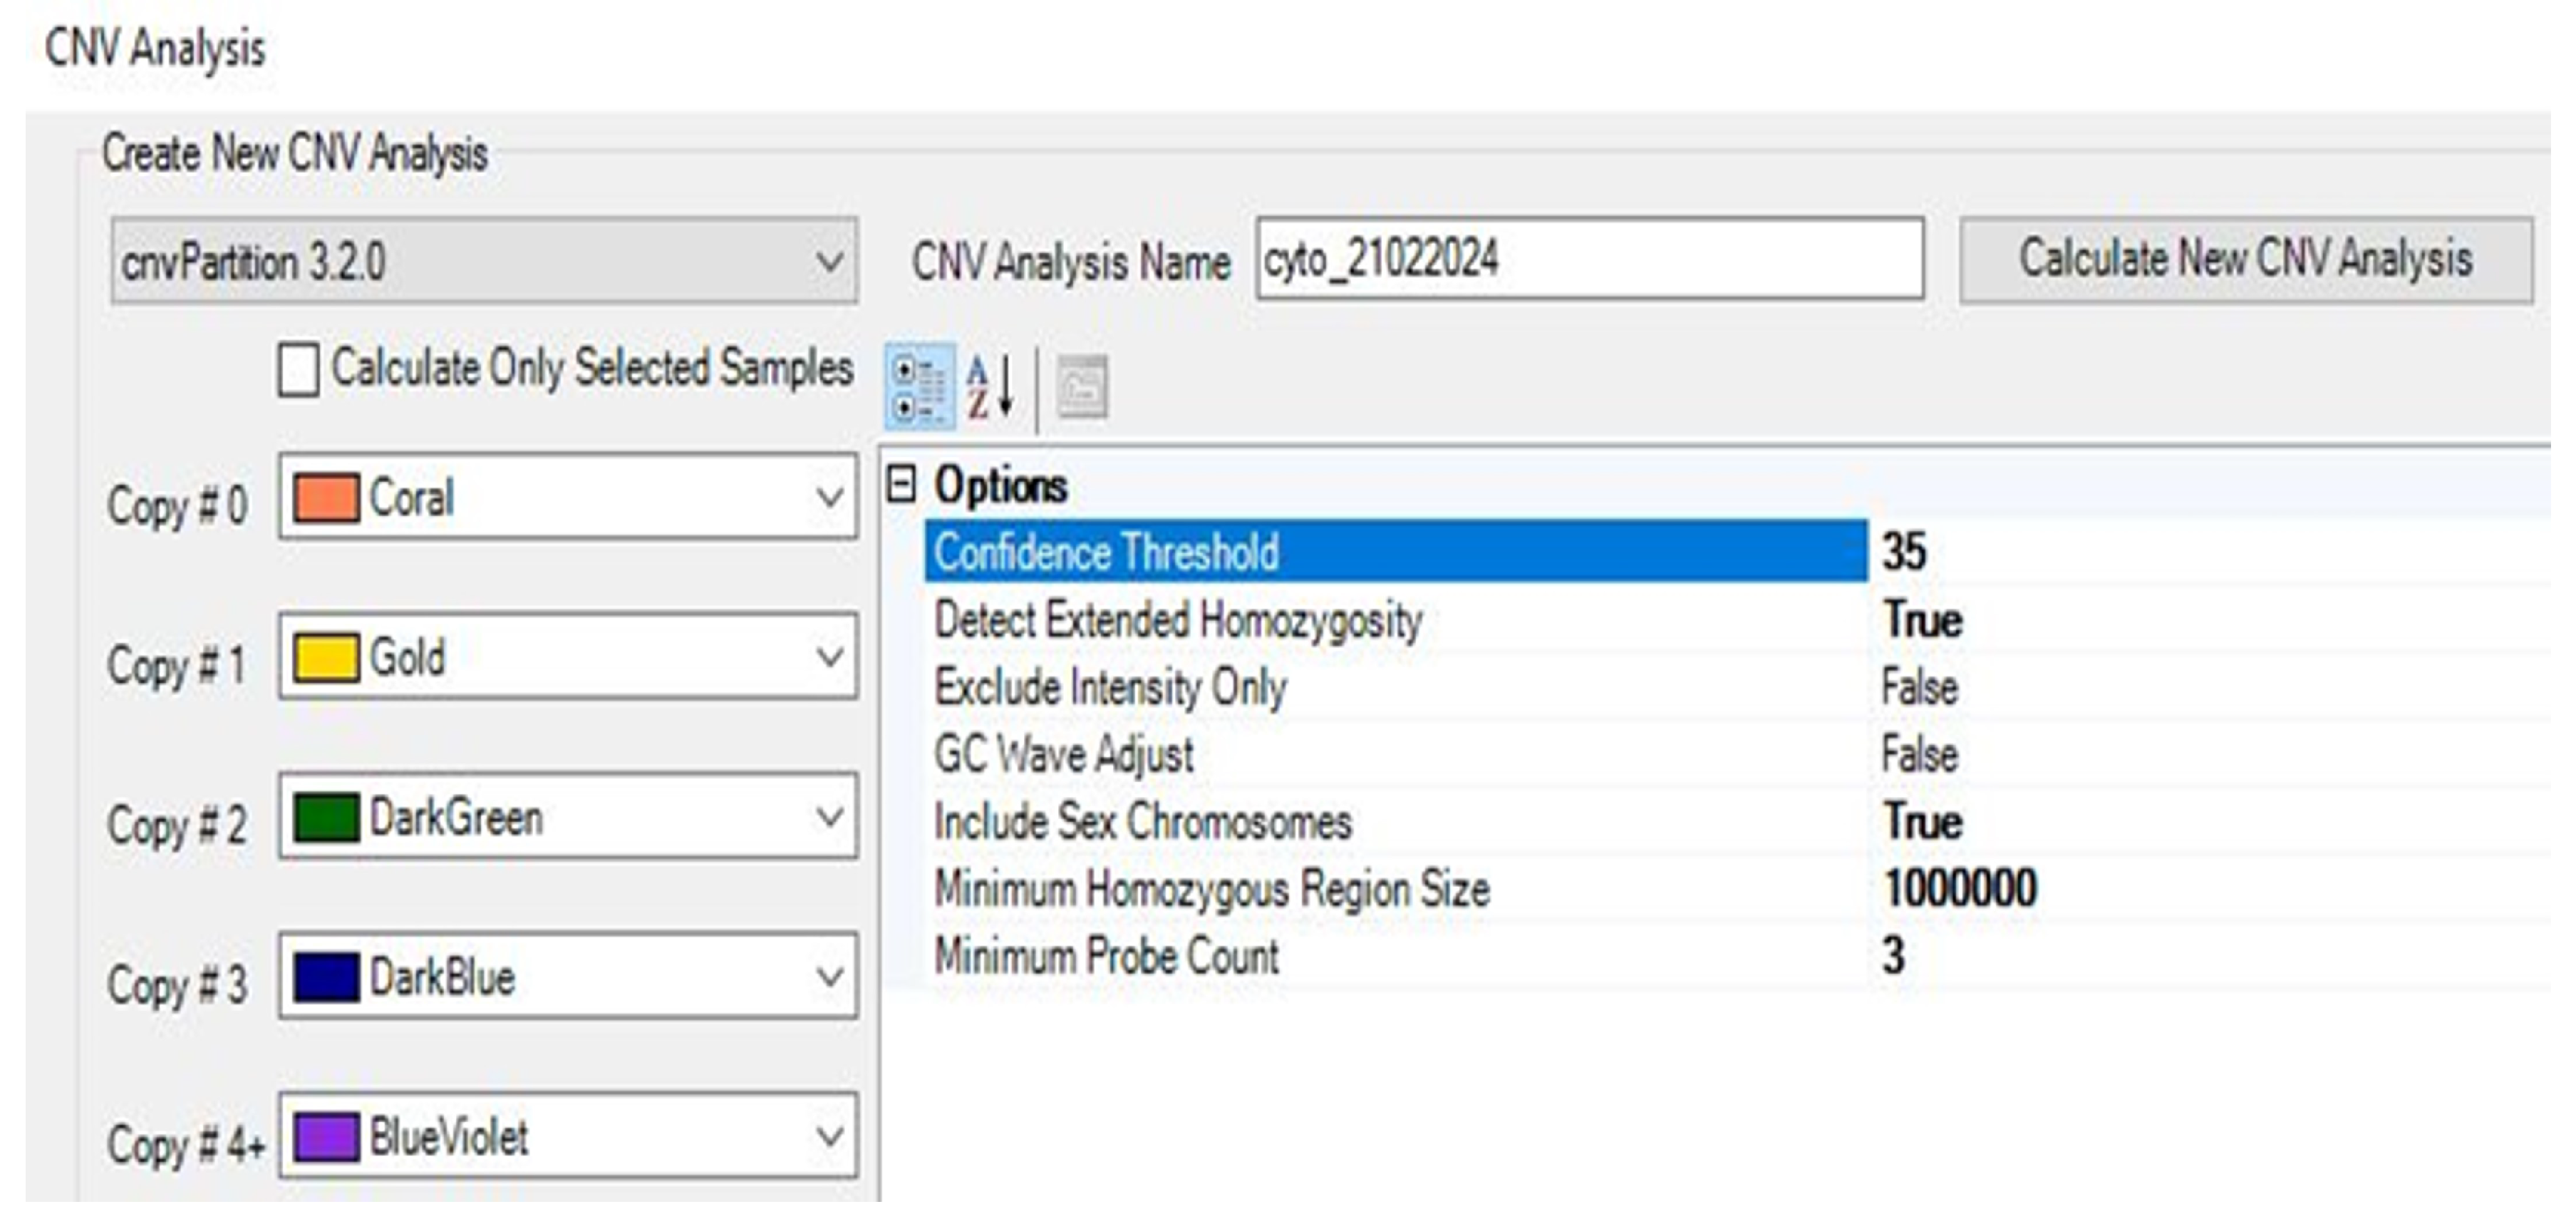
2.9. CNV Analysis
2.9.1. Performing CNV Analysis Using cnvPartition Algorithm
2.9.2. Performing CNV Analysis Using PennCNV Algorithm
2.10. Classify CNV
2.11. CNV Analysis Report and Data Extraction Using R Package
2.12. Chromosomal Cytogenetic Band Selection
2.13. Model Construction
3. Results
3.1. Statistical Analysis
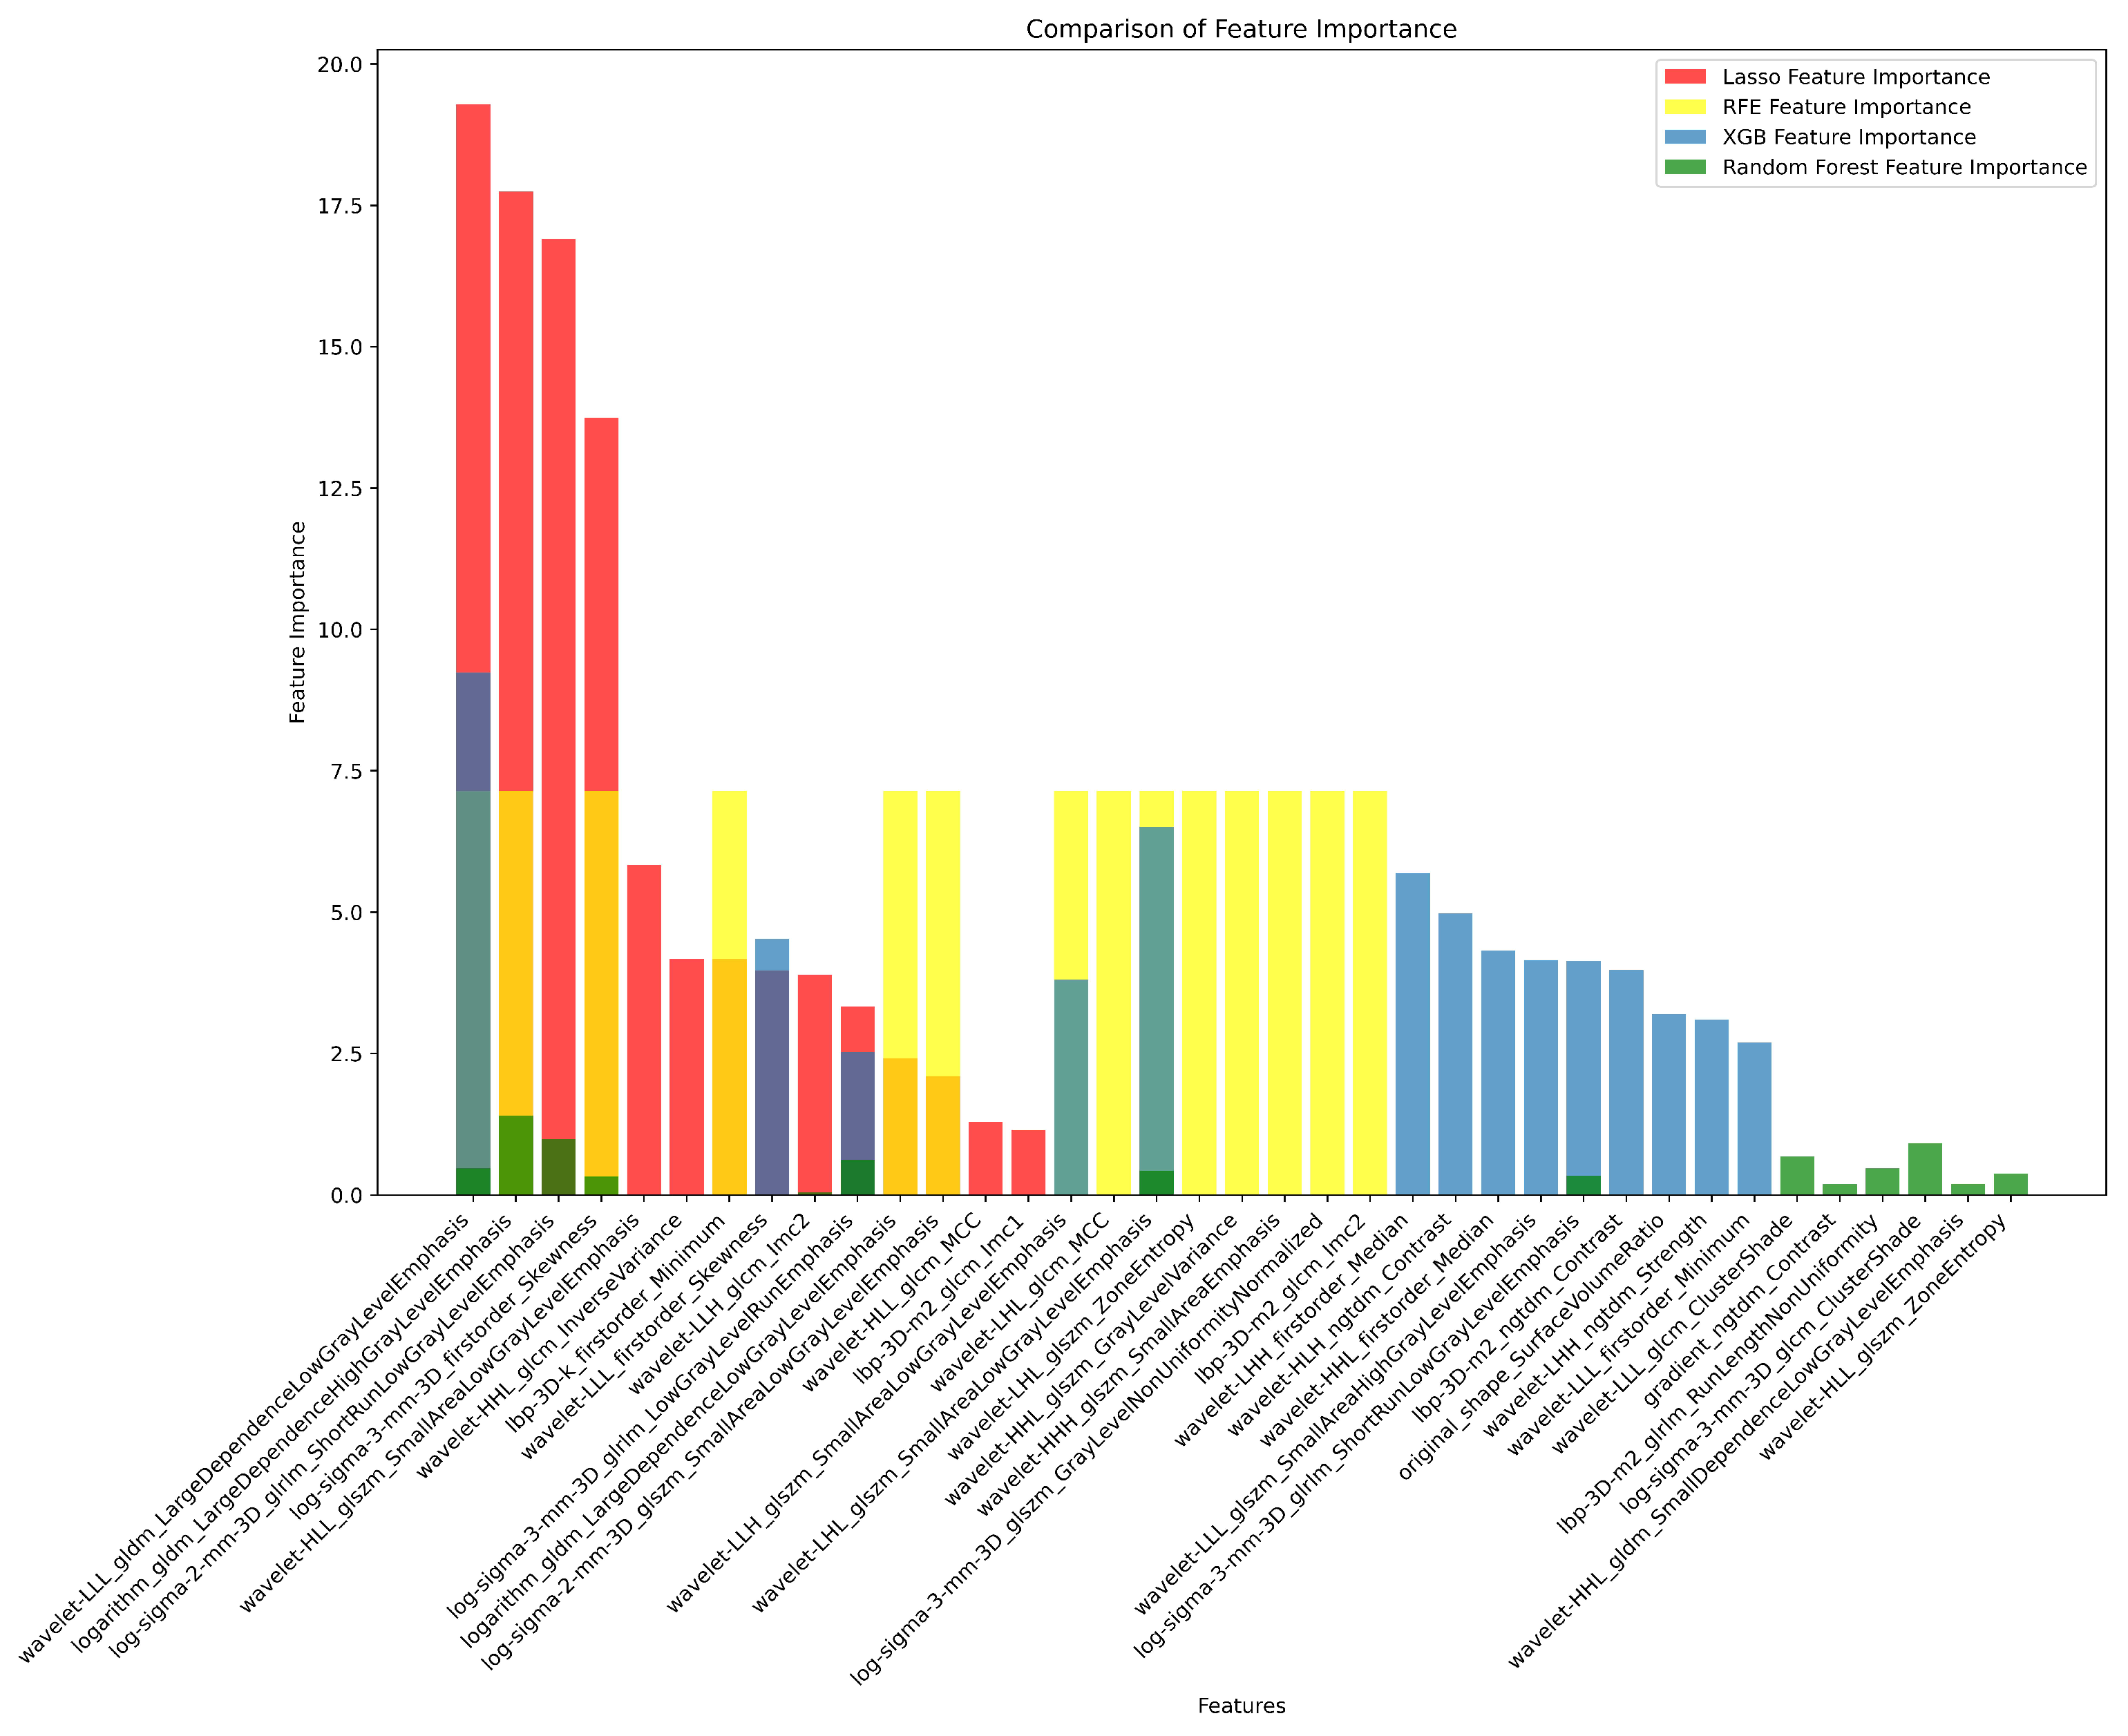
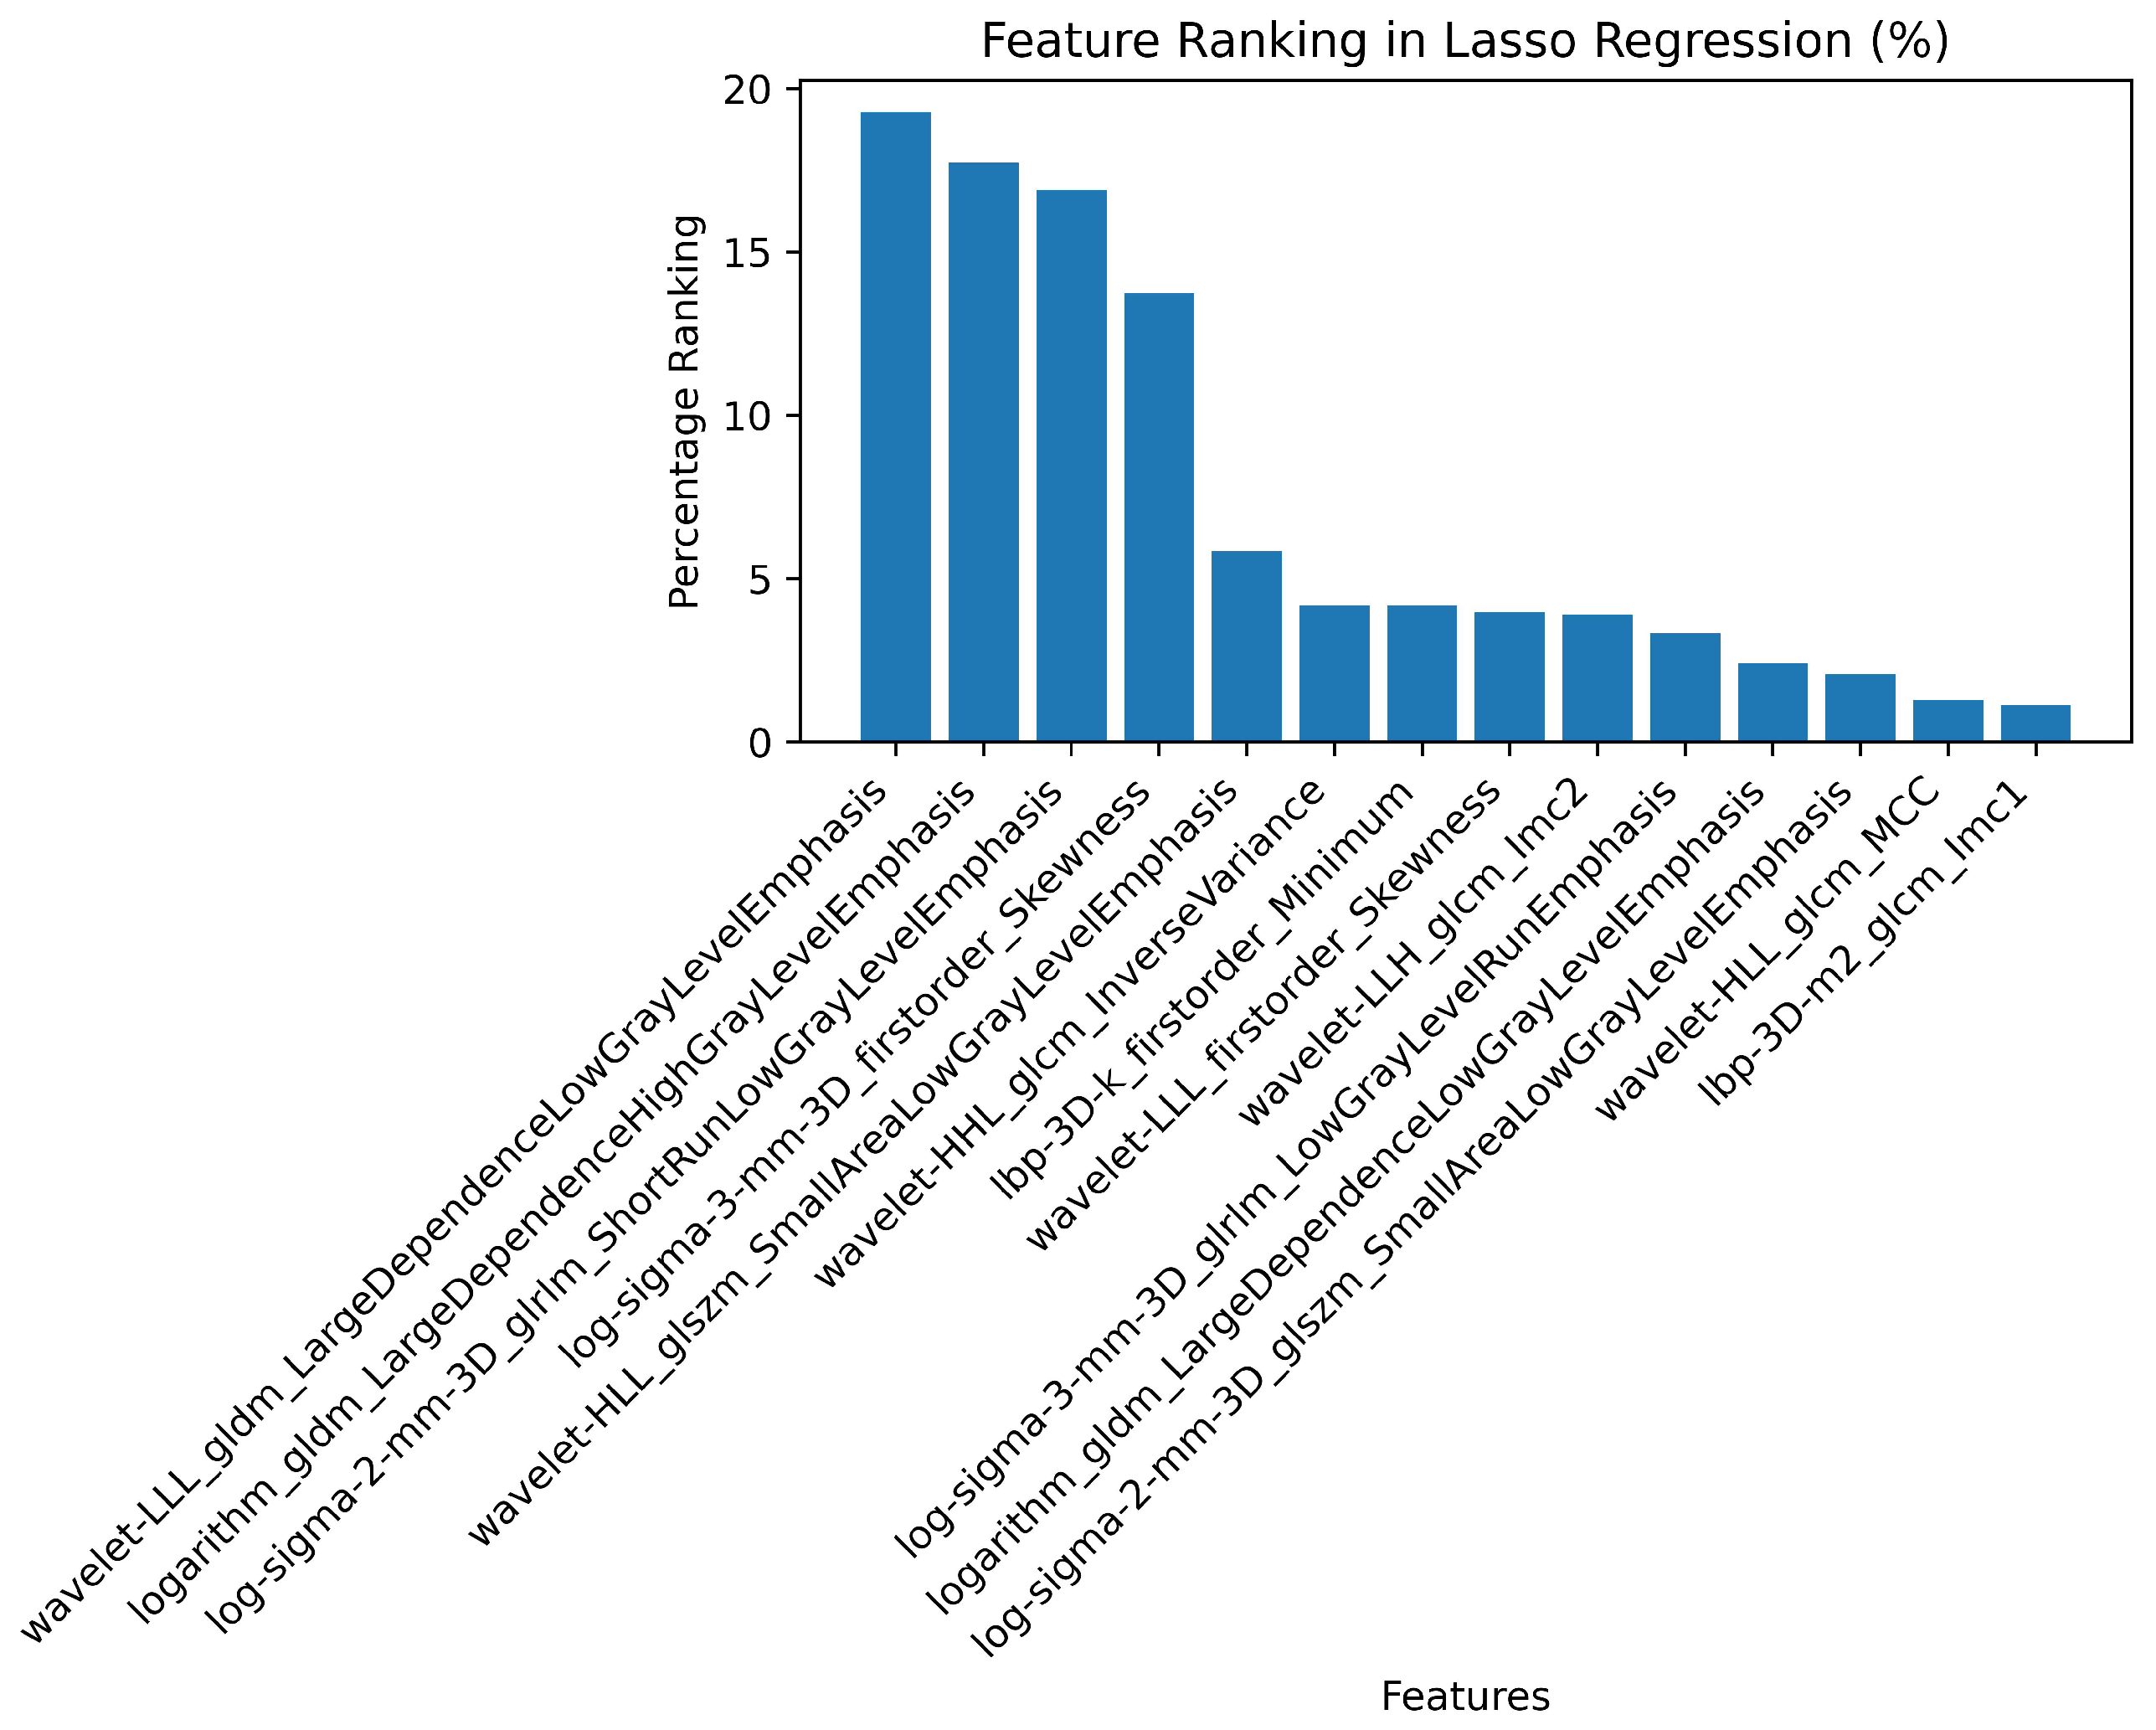
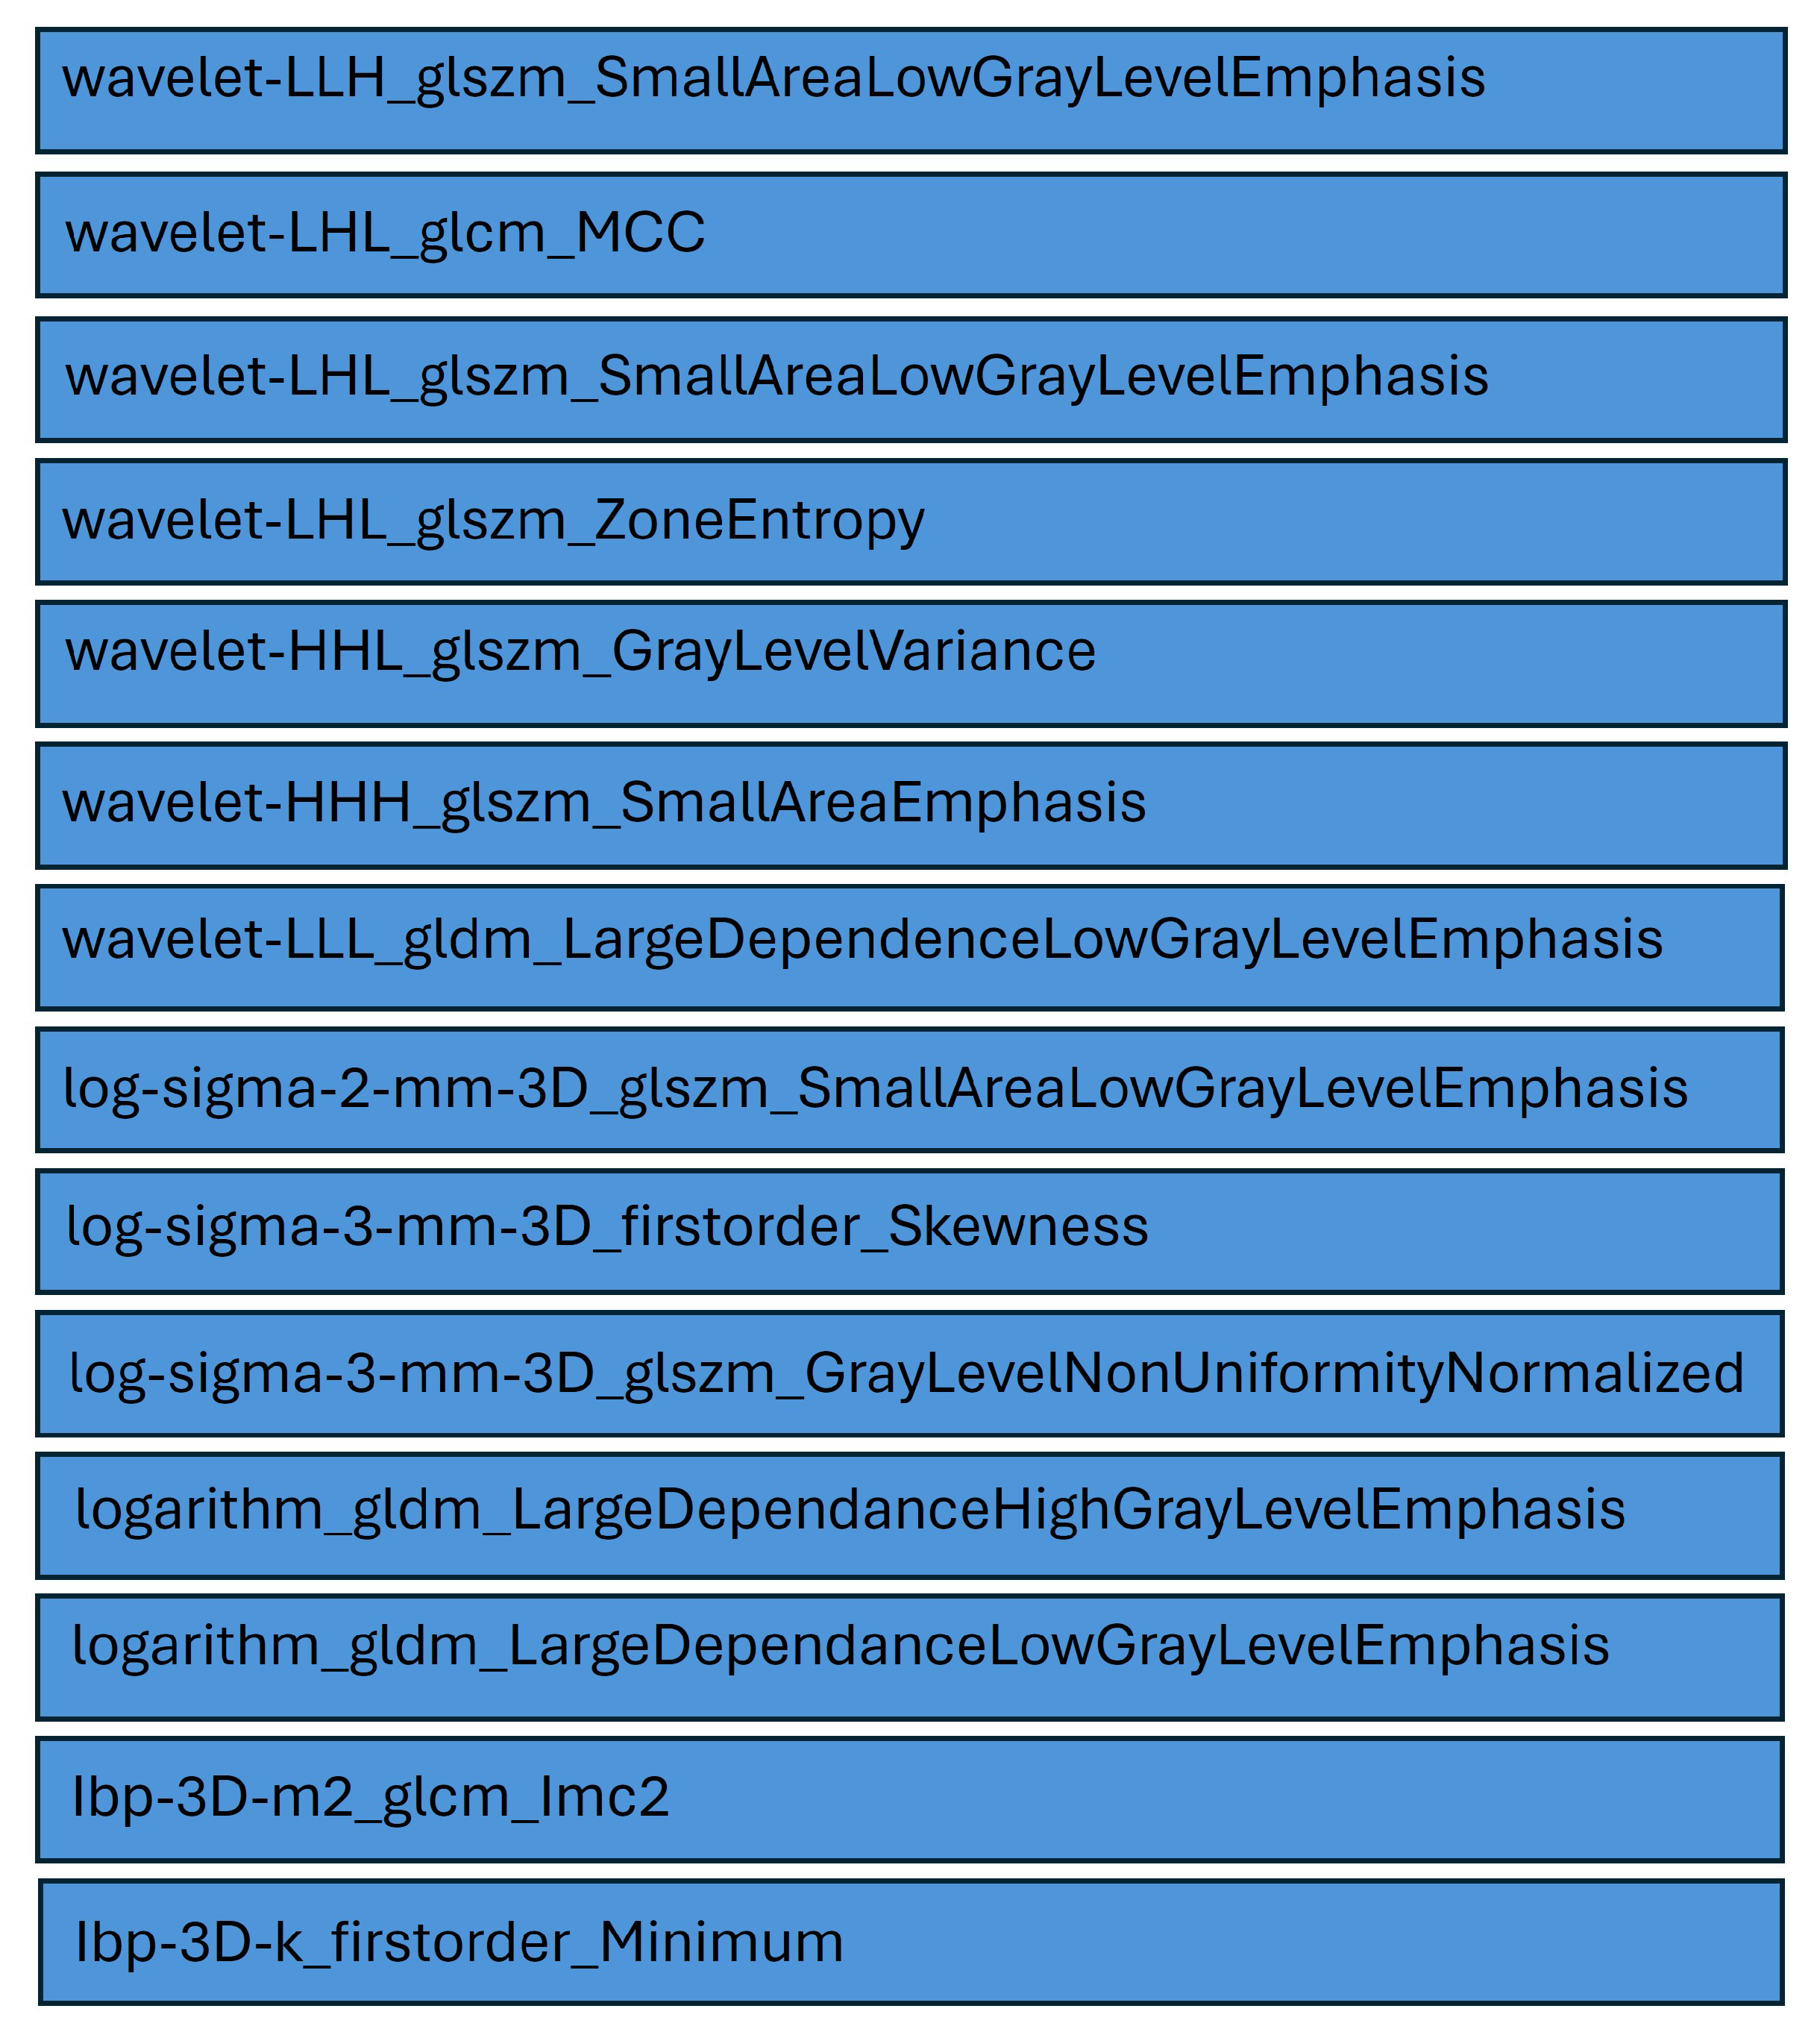
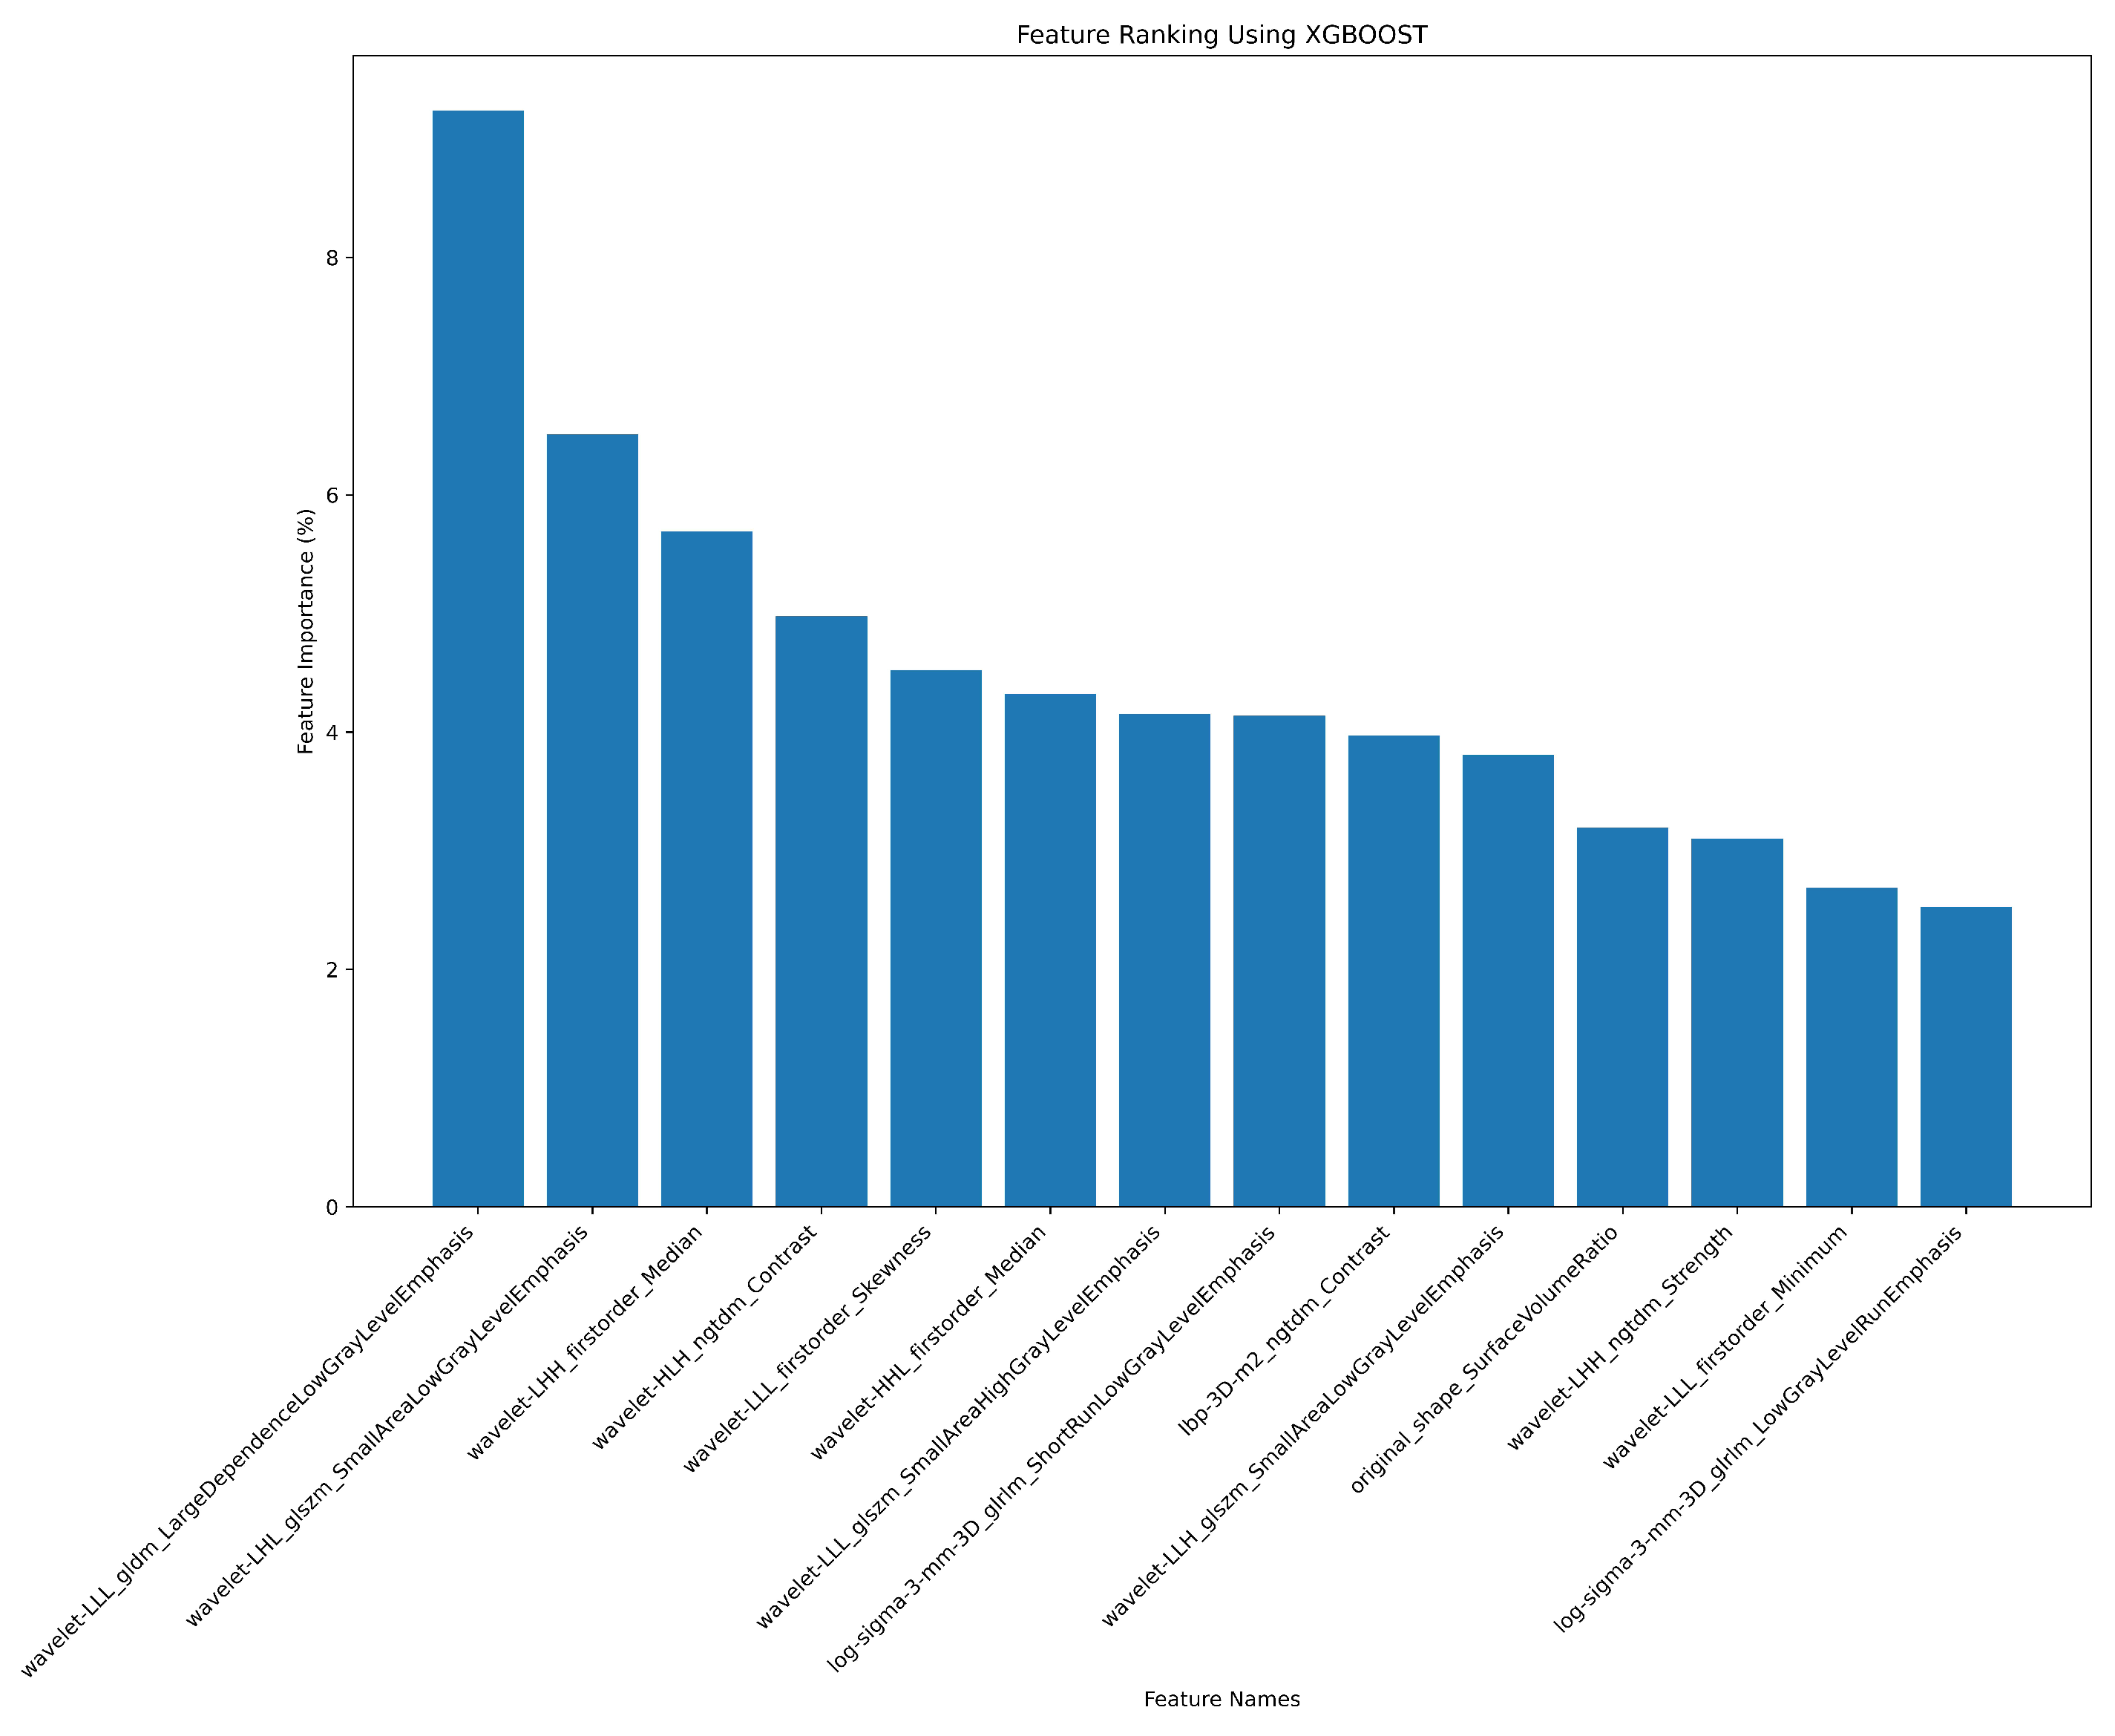
3.2. Radiomics Feature Extraction and Selection
3.3. Genomics Feature Extraction and Selection
3.4. CNV Analysis
- -
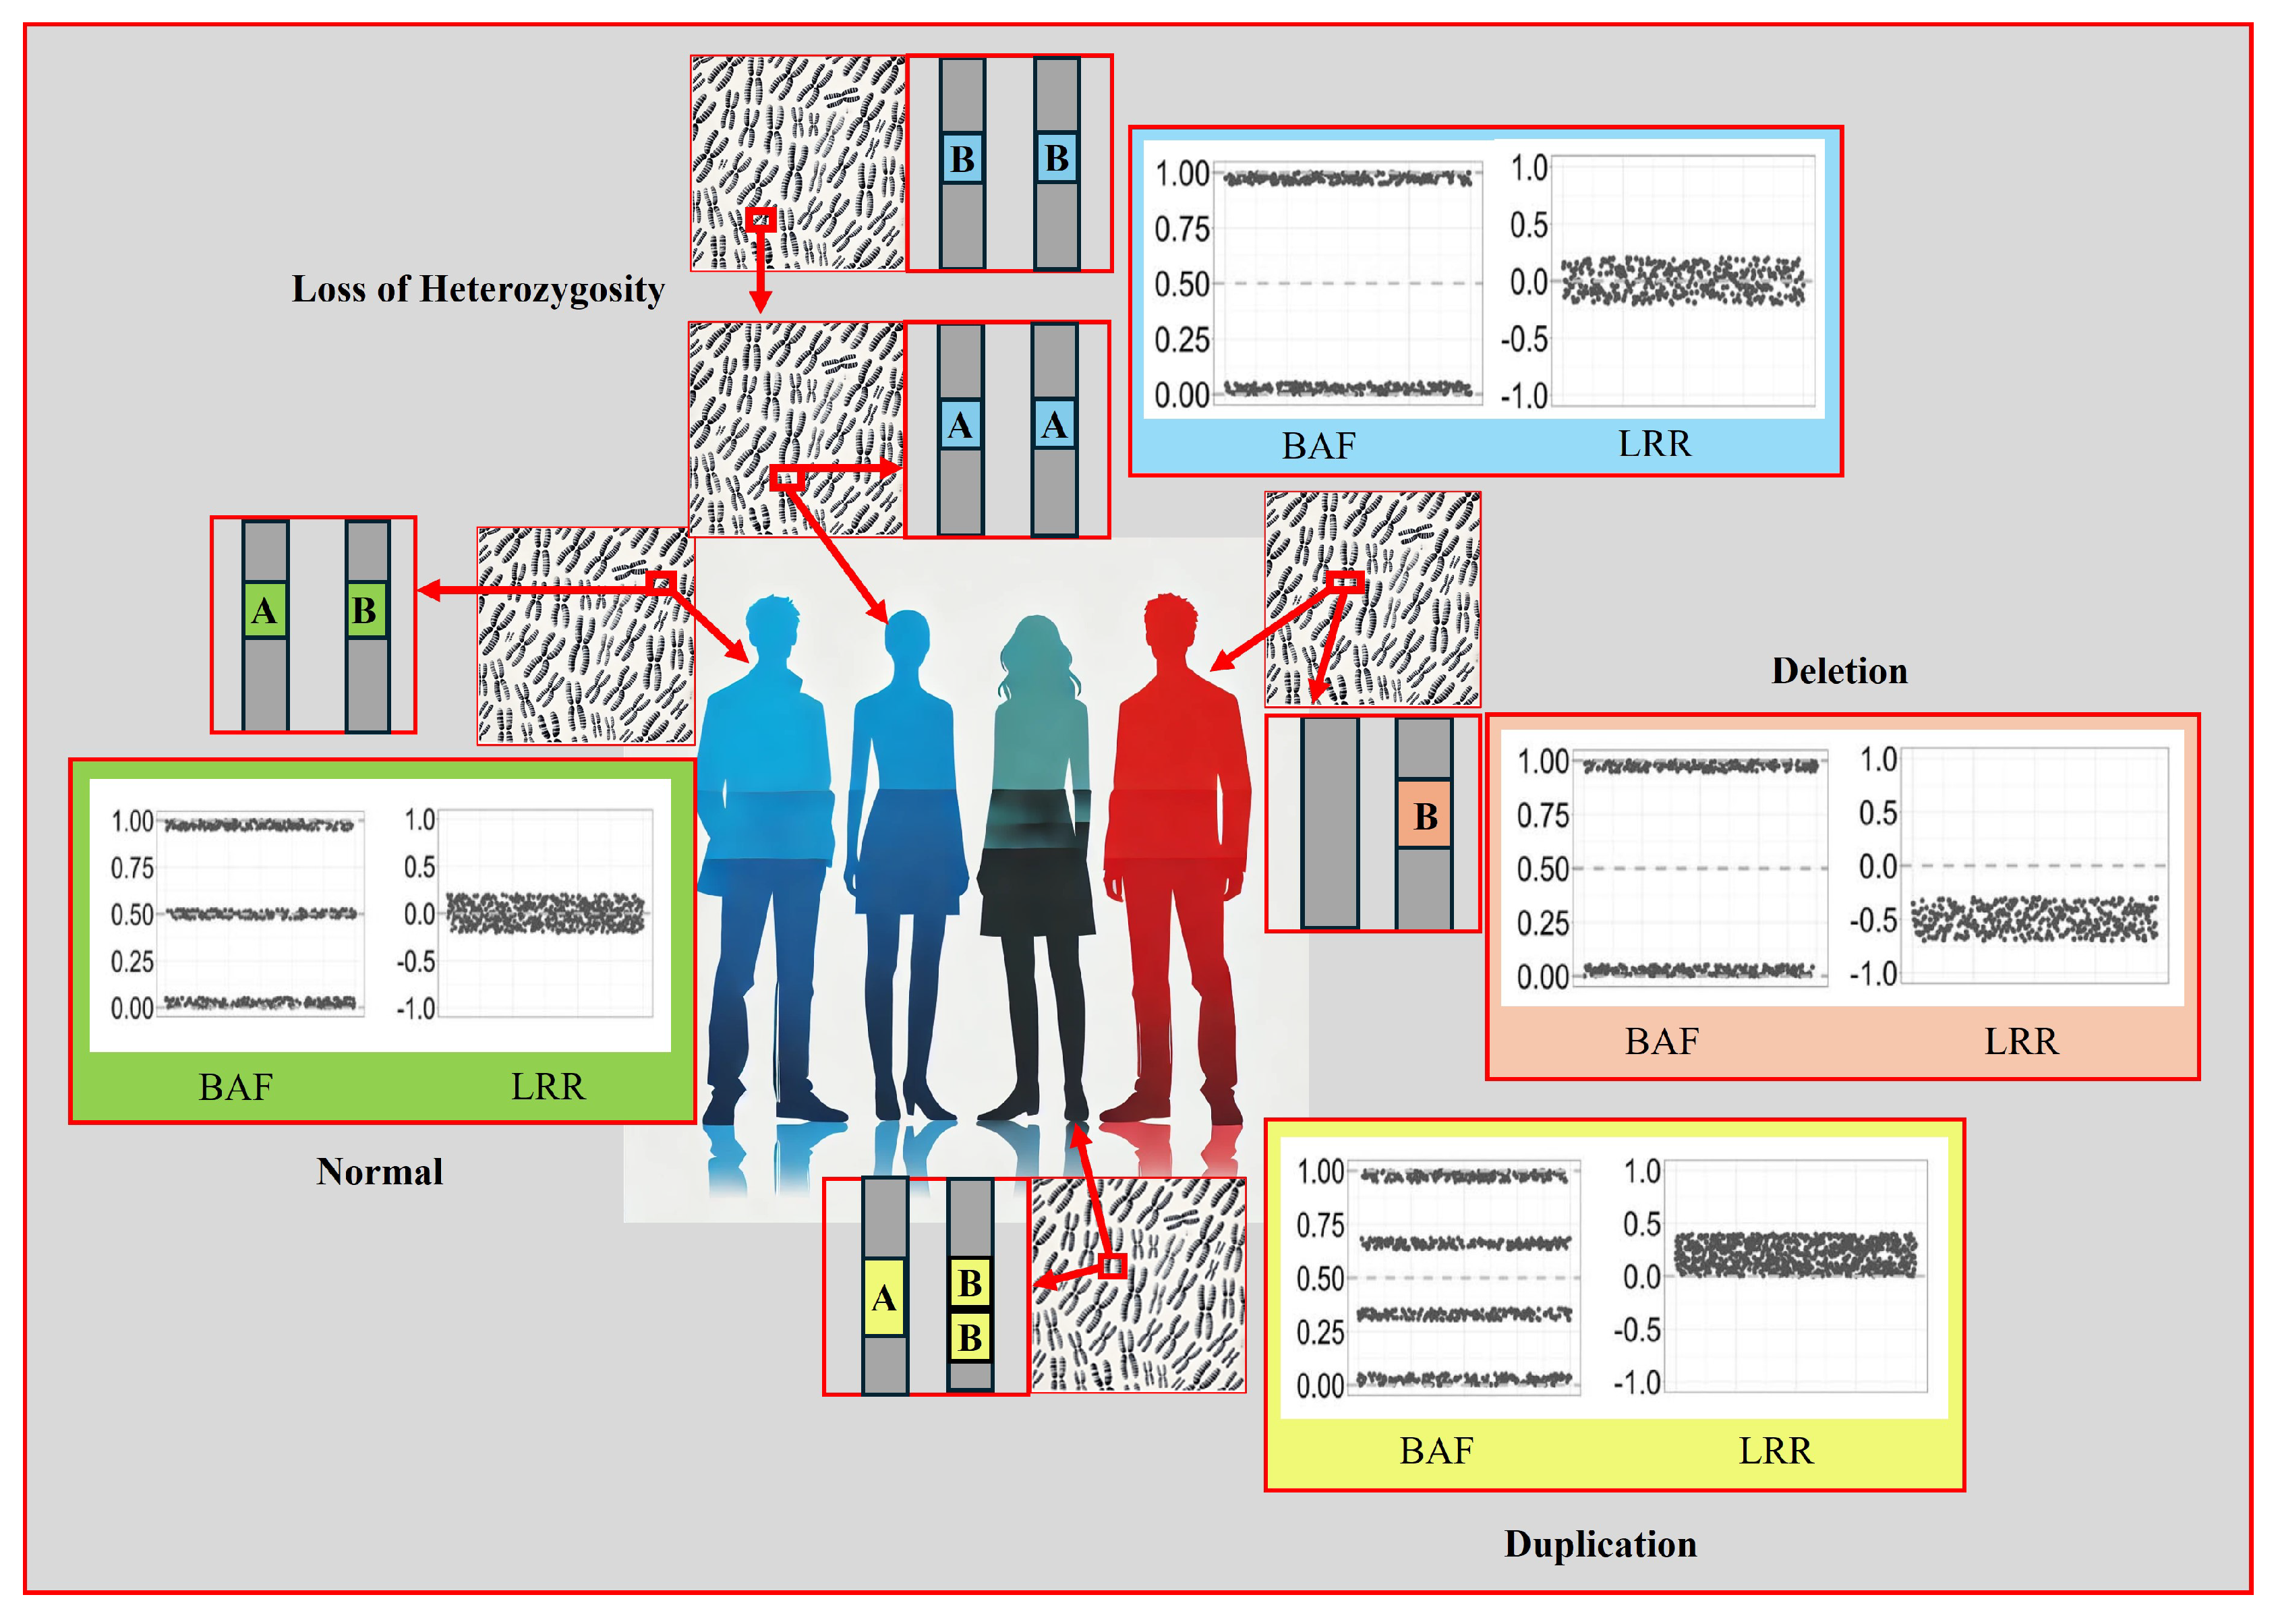
- Standard Report: Lists each copy number variation and loss of heterozygosity (LOH) region for each sample.
- -
- Allele-Specific Copy Number Report: Reports copy number-informed genotypes, such as A- and ABB.
- -
- PLINK CNV Input Report: Creates input files for PLINK CNV Analysis Software.
3.5. Visualisation of Results in Illumina Genome Viewer
3.6. Classification of CNVs
- -
- Benign Variant: Scores less than or equal to -0.99.
- -
- Likely Benign Variant: Scores between -0.90 and -0.98.
- -
- Variant of Uncertain Significance: Scores between -0.89 and 0.89.
- -
- Likely Pathogenic Variant: Scores between 0.90 and 0.98.
- -
- Pathogenic Variant: Scores greater than or equal to 0.99.
3.7. Radiogenomics Analysis
3.8. Model Construction
4. Discussion
4.1. Comparison with Related Methodological Literature
4.2. Limitations and Future Work
- -
- is the sample size of each independent sample.
- -
- is the proportion of the first sample.
- -
- is the proportion of the second independent sample.
- -
- Z is the Z-score of the confidence interval.
- -
- E is the margin of error.
4.3. Strengths
- -
- Non-Invasive Analysis: It is considered to be an alternative to biopsies; by leveraging imaging data, which can be obtained non-invasively, reducing the need for tissue biopsies. This is particularly beneficial for patients with tumours in hard-to-reach locations or those who cannot undergo invasive procedures.
- -
- Comprehensive Tumour Profiling: Unlike traditional biopsies, which sample only a small portion of a tumour, radiogenomics analyses the entire tumour through imaging. This provides a more comprehensive view of tumour heterogeneity, capturing variations across different regions of the tumour.
- -
- Molecular Insights from Imaging: Radiogenomics establishes correlations between imaging features and molecular markers, allowing for the prediction of genetic and molecular characteristics based on imaging data. This can lead to better understanding and characterisation of tumours.
- -
- Tailored Treatment Strategies: By linking imaging features with specific genetic mutations, radiogenomics can help in personalising treatment plans. This ensures that therapies are more closely aligned with the molecular profile of the tumour, potentially improving patient outcomes.
- -
- Potential for Early Detection and Prognosis: Radiogenomic research can identify imaging biomarkers that correlate with molecular signatures, which may be used for early detection of diseases or to predict disease outcomes such as response to treatment or risk of recurrence.
- -
- Widespread Imaging Availability: Imaging technologies like CT, MRI, and PET scans are widely available in clinical settings, making radiogenomics more accessible and scalable compared to genetic testing, which may require specialised laboratories and significant costs.
- -
- Cost-Effectiveness: In low-resource settings, where molecular testing may be cost-prohibitive, radiogenomics offers a more affordable alternative for tumour characterisation and risk stratification.
- -
- Real-Time Tracking: Allows for continuous monitoring of tumour changes over time through serial imaging, enabling the assessment of treatment response and disease progression without repeated invasive procedures.
- -
- Utilisation of Routine Clinical Data: Research can utilise existing imaging data routinely collected in clinical practice, making it possible to conduct large-scale studies without the need for new data collection efforts.
- -
- Facilitating Research and Clinical Trials: Can aid in the discovery and validation of new biomarkers, enhancing the design and effectiveness of clinical trials. It also enables the stratification of patients based on imaging-genomic correlations, improving trial outcomes.
- -
- Advancing Precision Medicine: Enhances the precision of medical interventions by integrating imaging and genomic data, leading to more accurate diagnoses, better-targeted therapies, and improved patient management.
4.4. Summary
5. Conclusions
Author Contributions
Funding
Institutional Review Board Statement
Informed Consent Statement
Data Availability Statement
Acknowledgments
Conflicts of Interest
Appendix A
Appendix A.1
| Patient | CT Scan and Histopathology Report |
|---|---|
| 00294* | CT: Renal neoplastic. Histology: RN shows a tumour composed of cells with well-defined cell borders, abundant granular eosinophilic cytoplasm, and central nuclei with surrounding perinuclear halo. Occasional resinoid and binucleate forms are noted. Immunohistochemistry shows diffuse positive staining within the tumour cells for cytokeratin 7 and focal positivity for CD117. Immunohistochemistry for racemase is negative. The morphological and immunophenotypical features are consistent with chromophobe carcinoma. |
| 00295* | CT: Well-defined enhancing lesion 35 HU non-contrast, 56 HU post-contrast. Histology: PN; chromophobe RCC. Invasion of prerenal fat. |
| 00296* | CT: Small renal mass lesion. Histology: PN; macroscopically sections show a partial resection of kidney and perirenal fat with a well-circumscribed tumour. The tumour exhibits solid growth and nests of polygonal cells with distinct cell borders. Nuclei are pleomorphic, irregular, and wrinkled. Some cells have eosinophilic granular cytoplasm and other cells have clear cytoplasm. The appearance is suggestive of a chromophobe renal cell carcinoma. While the tumour is present very close to the capsule, it does not extend beyond the capsule. There is no evidence of vascular invasion, within the specimen. The appearance is suggestive of chromophobe RCC. |
| 00297* | CT: Enhancing mass suggestive of malignancy. Histology: PN; 3.4 cm; chromophobe histology shows a well-circumscribed tumour composed of islands of cells separated by vessels of varying calibre. The tumour cells have well-defined cell borders, a moderate volume of granular eosinophilic cytoplasm, perinuclear halos, and in most cases central slightly irregular nuclei. In areas, nuclear pleomorphism is more prominent, atypical and multinucleate forms are present. The features are those of a chromophobe carcinoma of the kidney. |
| 00300* | CT: Enhancing heterogeneous mass, partly exophytic unenhanced 36 HU, post-contrast 71 HU. Highly suspicious of malignancy. Histology: PN; sections show a cellular tumour composed of cells with prominent cell borders, and large and occasionally crinkled nuclei with perinuclear halos. The features are typical chromophobe RCC. Margin clear. |
| 00301* | CT: Renal neoplastic. Histology: PN; microscopically show a lesion composed of nested tumour cells with abundant associated eosinophilic cytoplasm. The nuclei show moderate atypia with often prominent nucleoli and irregular nuclear outlines. Some cells show perinuclear clearing. In areas, the cytoplasm shows peripheral clearing giving a cell wall-type appearance. Much of the tumour is cystically dilated with numerous blood-filled pools and areas of haemosiderin deposition. Morphologically the appearance is most in keeping with those of a renal chromophobe type renal cell carcinoma. Unfortunately, confirmatory immunohistochemistry has not been helpful in this case. Excision margins are clear. |
| 00302* | CT: Enhancing lesion. Histology: PN; microscopically histology shows a well circumscribed tumour composed of cells with well-defined cell borders, pale eosinophilic granular cytoplasm and central nuclei with prominent nucleoli and occasional raisinoid forms. These cells are arranged predominantly in solid nests with occasional more cystic areas. Immunohistochemistrey has been performed. This shows strong diffuse positive staining for Cytokeratin 7. There is also positivity for CD10. A Hale’s colloidal iron stain is positive. Whilst CD10 positivity is less common (around 26% according to some studies), the presence of Cytokeratin 7 positivity and Hale’s colloidal iron positivity, together with the morphological features, are consistent with those of a chromophobe carcinoma. The lesion adequately excised. |
| 00303* | CT: Exophytic left renal cortical lesion concerning for RCC. Histology: PN; microscopically sections show a tumour composed of closely packed cells with clear or mildly eosinophilic cytoplasm, with other cells showing cytoplasmic clearing. Many of the nuclei are irregular and crinkled in shape and some have perinuclear halos. Immunohistochemistry: The tumour cells show positivity for cytokeratin 7 over most of the areas of the tumour in the section. Widespread membrane CD117 staining is also present. Vimentin staining is negative. The appearance is in keeping with a chromophobe carcinoma. The tumour appears well clear of the sinus excision margin. However, in areas at the outer aspect of the tumour where it bulges the capsule; there is evidence of spread beyond the capsule (pT3a). |
| 00309* | CT: Small renal mass lesion. Histology: PN; a benign oncocytoma characterised by a well-circumscribed tumour composed of nests and tubules of cells with granular eosinophilic cytoplasm and central smooth nuclei. In the centre of the lesion, the tubules and nests are set within a paucicellular edematous stroma, corresponding to the scar seen macroscopically. This benign lesion has clear margins. |
| 00311* | CT: Enhancing solid left renal mass. Histology: RN; microscopically histology shows a high relatively well-circumscribed tumour composed of variably sized nests of uniform cells with eosinophilic granular cytoplasm and central nuclei with inconspicuous nucleoli. A central oedematous area with infiltration of small nests into this is noted. The morphological features are highly characteristic of a benign oncocytoma. This is confirmed on immunohistochemistry with patchy positivity for Cytokeratin 7 and occasional cells and strong diffuse positivity for CD117 and PAX8. Notably, there is infiltration into the renal sinus fat and an area of vascular invasion is noted. However, this is a recognised phenomenon in benign oncocytomas and in large series following patient outcomes, did not affect their benign behaviour. Left kidney benign oncocytoma with infiltration of the renal sinus and renal vein. Margin clear. |
| Patient | CT Scan and Histopathology Report |
|---|---|
| 00313* | CT: RCC. Highly suspicious of malignancy. Histology: PN; sections show a cellular tumour composed of large nodules of bland cells with abundant eosinophilic cytoplasm and regular nuclei. In areas, smaller islands of similar cells are present with surrounding oedematous stroma. At the periphery of the larger nodules, there are groups of slightly different appearing cells with more hyperchromatic nuclei and less eosinophilic cytoplasm. Central myxoid degeneration/scarring is present. Immunohistochemistry shows that the more eosinophilic tumour cells are negative for vimentin and slightly positive for CD10. There is focal positivity for CK7 but diffuse positivity for CD117. The smaller more hyperchromatic tumour nuclei are positive for vimentin and cytokeratin 7. Despite some unusual morphological and immunohistochemical features, the overall appearance in keeping with the gross appearance of the tumour is best regarded as those of a benign oncocytoma. The tumour appears clear of the sinus excision margin by 2-3 mm. |
| 00315* | CT: Small renal mass of 28 HU pre-contrast and 73 HU post-contrast. Suspicious of malignancy. Histology: Biopsy; two cores up to 8 mm and fragments. All taken. Microscopically; sections show two cores of renal parenchyma with one of them containing nested groups of closely packed round cells. These cells have abundant intensely eosinophilic cytoplasm, uniform small round central nuclei, mild pleomorphism, evenly distributed chromatin, and smooth nuclear membranes. There is no necrosis or mitotic activity. For immunohistochemistry these cells show strong positive staining with CD117 and patchy positive staining with CK7. The other core shows benign renal parenchyma. The features are in keeping with a benign oncocytoma. PN; macroscopically section displays renal parenchyma predominantly replaced by a neoplasm comprising nests and trabeculae of cells demonstrating intensely eosinophilic and granular cytoplasm, round nuclei, and central nucleoli. The lesion appears vascular and shows no evidence of necrosis. On immunohistochemistry these cells stain diffusely positive with CD117, show scattered positivity with CK7, and stain negative with EMA, Vimentin, and CD10. This shows negative to scattered weak positivity with CK20. Overall, the features are those of a benign oncocytoma which appears 0.4 mm away from the resection margin. |
| 00317* | CT: Exophytic enhancing solid mass lesion appearance may represent RCC. Histology: PN; oncocytoma. Histology shows a relatively well-circumscribed tumour with a central oedematous area in which small nests and pseudo cystic structures of cells are present which have abundant granular eosinophilic cytoplasm and central nuclei with inconspicuous nucleoli. Immunohistochemistry is positive within the tumour cells for CD117 and PAX8 with only one or two cells staining focally or cytokeratin 7. The features are consistent with a benign oncocytoma. Notably, there is an area of infiltration into the perinephric fat attached to the main specimen; however, this is a recognised phenomenon in benign oncocytoma and does not affect its benign behaviour. The margin is clear of the tumour. |
| 00327* | CT: RCC. Histology: PN; sections show this neoplasm is disrupted but comprises eosinophilic cells with smooth nuclei with no perinuclear halo’s. These neoplastic cells are evenly spaced and immunohistochemistry demonstrates patchy positivity for CK7 and negative staining of CD10. Taking these morphological and IHC phenotypic features this neoplasm is consistent with an oncocytoma. No evidence of a malignant tumour. |
| 00328 | CT: Enhanced lesion. Histology: PN; sections show an encapsulated but well-delineated tumour composed of oncocytic epithelial cells which have abundant finely granular eosinophilic cytoplasm with large round nuclei, some of which have prominent nucleoli. Occasional perinuclear halo is identified along with binucleate cells; however, these are sparse and not seen across the whole tumour. The oncocytic cells also lack well-defined cell borders. Very focally there is marked nuclear pleomorphism, which is associated with regions that are regarded as being degenerative. There is extensive haemorrhage throughout the tumour and in some areas, small nests and single oncocytic cells are seen set in a background oedematous stroma. There is a marked haemorrhage within the tumour and around the capsule. Immunohistochemistry shows a diffuse expression of CD117 within the tumour with only scattered occasional cells, showing expression of cytokeratin 7. These features are most in keeping with an oncocytoma. There is no evidence of extension into the adjacent perirenal fat and the tumour is clear of the surgical resection margin by 3.8mm. However, in several areas, the capsule has been disrupted and the tumour lies on the surface therefore complete excision cannot be guaranteed. |
| 00316 | CT: Mass with stellate-like central hypodensity which may represent necrosis or scarring. The appearance is suggestive of but not pathognomonic of an oncocytoma. Histology: PN; microscopically, sections show a cellular tumour composed of cells arranged in solid sheets, nodules, or microcysts. The tumour cells have abundant eosinophilic cytoplasm and the nuclei contain prominent central nucleoli. There is no significant mitotic activity or necrosis. In some areas, the tumour also has an oedematous and focally haemorrhagic stroma. The tumour is well-circumscribed and is well-clear of the inked sinus excision margin. Immunohistochemistry shows that the tumour cells are diffusely positive for pan-cytokeratin and CD117 but only very focally positive for CK7. Staining for CD10, Vimentin, and renal cell carcinoma antigen is negative. The morphological and immunohistochemical features are entirely in keeping with renal oncocytoma. |
| Patient | CT Scan and Histopathology Report |
|---|---|
| 00321 | CT: Renal neoplasm, likely RCC. Suspicious of malignancy. Histology: PN; microscopically, sections show a tumour composed of nodules and strands of tumour cells with abundant eosinophilic cytoplasm and relatively regular nuclei. The nodules are separated by an oedematous and occasionally haemorrhagic stroma with some haemosiderin deposition. The features are those of a benign oncocytoma. The tumour appears confined to the kidney and is well clear of renal sinus excision margin by approximately 5 mm. |
| 00322 | CT:Small solid lesion in keeping with small renal cell carcinoma. Histology: PN; microscopically, sections show a well circumscribed tumour partly composed of islands of regular cells with abundant eosinophilic cytoplasm in an oedematous stroma. The rest of the tumour appears cystic the cysts being lined by similar tumour cells. The appearance is those of an oncocytoma. The tumour appears clear of the sinus excision by approximately 2 mm. |
| 00308 | CT: An exophytic hyper-enhancing solid lesion, RCC cannot be excluded, further, follow-up is advised. Histology: RN; microscopically, histology shows a well circumscribed tumour with a central area of hyalinised scarring. The tumour cells are arranged in tubular structures and small nests formed of cells with central nuclei and abundant granular eosinophilic cytoplasm. Immunohistochemistry has been performed. This shows patchy focal positivity for cytokeratin 7, focal positivity for CD10 and positive staining for Vimentin predominantly concentrated in the cells around the central scar area. Immunohistochemistry for CD117 is positive. Hale’s colloidal iron shows no evidence of positivity within tumour cells. On close examination, one or two small areas are identified in which there is a slightly greater degree of nuclear abnormality with slightly irregular nuclear contours. Different diagnosis considered are chromophobe carcinoma and oncocytoma, however, on balance the central scar, morphological features of the vast majority of the tumour and the distinctive, pattern of immunohistochemistry with patchy cytokeratin 7 positivity and characteristic Vimentin positivity distribution, the features are regarded on balance as representing those of a benign oncocytoma. |
| 00324 | CT: Small renal mass demonstrate enhancement and are highly suspicious of small renal malignancies. Histology: PN; the lesion consists of packeted nests of an oncocytic neoplasm. The tumour cells have abundant oncocytic cytoplasm and central very smooth contoured round nuclei with minimal atypia. The features in both cases appear to represent those of benign oncocytoma. There is no evidence of malignancy. |
| 00298 | CT: Renal lesion Ca/Oncocytoma. Histology: Biopsy; multiple cores up to 12 mm plus fragments. Micro report: histology shows fragmented cores of tissue lesions composed of polygonal cells with abundant eosinophilic slightly granular cytoplasm, with a trabecular architecture. The nuclei are round and central, displaying little variation in size. No prominent cell membranes are identified. Immunohistochemistry shows strong expression of CK7 and EMA by the tumour cells. CD10, vimentin, and CD117 are not expressed. Hales colloidal iron staining shows a very weak focal suggestion of cytoplasmic staining but is considered largely unhelpful in further typing. In conclusion: the appearances are those of an eosinophilic cell renal tumour, the differential diagnosis of which includes the eosinophilic variant of clear cell renal cell carcinoma, chromophobe, and oncocytoma. While the morphological features are not entirely typical, the immunohistochemistry profile is most in keeping with a chromophobe neoplasm. However, a definitive diagnosis cannot be achieved on this small sample, and excision of the lesion or treatment by other means is advised. Discussion of this case at the urology MDT meeting is recommended. The patient under AS and for RFA. |
| 00299 | CT:Solid renal mass most likely to represent carcinoma. Histology: Biopsy; two cores up to 7 mm. Microscopically the specimen consists of cores of a tumour arranged in a trabecular manner, the cells of which contain abundant eosinophilic cytoplasm. The nuclei are relatively regular with no definite perinuclear halo. The impression on H&E staining was that of an oncocytoma but the immunohistochemical profile contradicts this. The tumour is negative for CD10 and vimentin but shows strong diffuse positivity for cytokeratin 7. This is much in keeping with the eosinophilic variant of chromophobe carcinoma. Patient underwent RFA. |
| 00304 | CT: Exophytic enhancing small renal mass. Histology: Biopsy; two cores up to 8 mm. All taken. Microscopically, sections show fragments of renal parenchyma and solid tumour composed of clusters and trabeculae of eosinophilic epithelial cells with minimal nuclear pleomorphism and no necrosis. Immunohistochemistry tumour cells show diffuse strong positivity for CD117 and are negative for CK7. Conclusion: taken together the morphological appearance and immunohistochemistry are in keeping with eosinophilic cell neoplasm favouring oncocytoma. Clinical correlation and MDT discussion are advised. Patient under AS. |
| Patient | CT Scan and Histopathology Report |
|---|---|
| 00305 | CT: It has a mean HU of 20 on non-cotrast CT, 42 NP and 50 excretory. The heterogeneous left interpolar lesion demonstrates enhancement and although morphologically may represent an oncocytoma, it is suspicious of an RCC. Histology: Biopsy; Three Cores. Microscopically; sections show needle core biopsies of renal parenchyma which are largely replaced by a solid epithelial neoplasm arranged in solid nests and tubules. Tumour cells are remarkably monomorphic displaying abundant eosinophilic slightly granular cytoplasm with round regular nuclei and inconspicuous nucleoli. Nuclear pleomorphism, mitotic activity, and necrosis are not identified. Background perirenal soft tissue is also seen. Immunohistochemistry; tumour cells mildly express a little CD117 but appear almost negative for Cytokeratin 7 except for a few scattered cells. Vimentin and CD10 appear negative. Conclusion: taken together the morphological appearance and immunohistochemical profile favour an oncocytoma. Further clinical correlation and MDT discussion are required. Patient under AS and for RFA. |
| 00306 | CT: Interpolar renal mass with a central low attenuation, though this could be RCC, oncocytoma cannot be excluded. Histology: Biopsy; two cores up to 25 mm. Microscopically, the cores include some normal kidney but are mainly of a tumour made up of tubular and solid arrangements of round strikingly eosinophilic epithelial cells. There is no significant nuclear pleomorphism. Immunohistochemistry; the cells show patchy expression of CD10 and very focal expression of cytokeratin 7. CD117 is expressed in a membrane fashion. The appearance is entirely in keeping with oncocytoma. There is no histological evidence of malignancy. The patient under AS. |
| 00310 | CT: Heterogeneous enhancing exophytic mass, most likely to be a renal cell carcinoma. Histology: Biopsy; small fragments, Sections show a tumour consisting of nests of relatively regular cells with small nuclei and abundant eosinophilic cytoplasm. These nests are separated by a vascular oedematous stroma. Immunohistochemistry shows very slight patchy staining for CK7 but negative staining for CD10 and vimentin. The appearance is in keeping with benign oncocytoma. |
| 00312 | CT:Suspicious enhancing rounded solid (average HU 90). May represent RCC. Histology: Biopsy; microscopically histology shows core biopsies of a tumour with nests and trabecular arrangements of cells that have abundant eosinophilic granular cytoplasm and central round nuclei with occasional nucleoli. Immunohistochemistry has been performed. This is negative for CD10 and shows only focal positivity for cytokeratin 7. The features are of an oncocytic/eosinophilic cell neoplasm, the morphology, and immunophenotype favouring origin from an oncocytoma. Patient under AS. |
| 00318 | CT: Exophytic enhancing small renal mass. Histology: Biopsy; multiple small cores, the largest 12 mm, microscopically the specimen consists of cores of a tumour composed of regular cells with small round nuclei and abundant eosinophilic granular cytoplasm. No prenuclear haloes or clear cell change is seen. Immunohistochemistry shows that the tumour cells are virtually negative for cytokeratin 7 and negative for vimentin and RCC markers. However, staining for KIT is strongly positive. The morphological and immunohistochemical features are in keeping with benign oncocytoma. Patient under AS. |
| 00319 | CT: Enhancing exophytic mass. The heterogeneous left interpolar lesion demonstrates enhancement and although morphologically may represent an oncocytoma, it is suspicious of an RCC. Histology: Biopsy; three cores of tissue. Multiple fragments up to 5 mm. Microscopically, most of the specimen consists of connective tissue, but a small focus of neoplastic cells is present. These cells have abundant eosinophilic cytoplasm and small, regular nuclei, with no obvious prominent nucleoli. Immunohistochemical staining shows that the tumour cells show slight positivity for CD10 and very occasional cells are positive for CK7. The tumour cells are negative for vimentin, racemase and HMB45. The features in this biopsy are of a low grade renal epithelial neoplasm. It is often difficult to definitely subtype eosinophilic renal tumours in a small biopsy such as this. However, the morphological and immunohistochemical features are suggestive of an oncocytoma. Patient underwent RFA. |
| 00320 | CT: Renal mass. Histology: Biopsy; microscopically the sections show strands of tissue that have been derived from a tumour comprising packets, cords, and trabecula of cells set in the relatively abundant loose and pale connective tissue matrix. The tumour cells have bland cytological features but with some variation in nuclear size. Perinuclear halos are not a prominent feature; however, nucleoli can be identified in several of the nuclei. The cytoplasm shows strong granular eosinophilia. Immunohistochemistry: The sections stained for Cytokeratin 7 demonstrate occasional positive cells within the tumour. The majority of the tumour cells are negative. The tumour cells do however show positive staining for CD117 but there is no significant staining for CD10. The principal differential diagnosis, in this case, is between an oncocytoma and a chromophobe form of renal cell carcinoma. The morphology with the immunohistochemical pattern of staining particularly with respect to the very focal staining for cytokeratin 7 would favour an oncocytoma. The patient under AS. |
| Patient | CT Scan and Histopathology Report |
|---|---|
| 00307 | CT: Contrast-enhanced renal mass. Histology: Biopsy; microscopically, sections how nests of round cells with abundant finely granular eosinophilic cytoplasm and uniform small, round, and central nuclei with evenly dispersed chromatin. Immunohistochemistry: these cells stained positive for CD10 and CD117 and were focally positive for CK7. They stained negative with vimentin. The morphology appearances and immunohistochemical profile are in keeping with renal oncocytoma. The patient under AS. |
| 00314 | CT: Solid enhancing exophytic small renal mass. May represent RCC. Histology: Biopsy; three cores up to 30 mm. Micro Report: one of these cores is of the unremarkable renal parenchyma. The other two are samples of neoplasm made up of homogenous rounded epithelial cells with prominent eosinophilic cytoplasm. Nuclear pleomorphism is not notable and there is no obvious mitotic activity. Immunohistochemistry shows only rare cells expressing cytokeratin 7. The tumour cells show membranous expression of CD117 and are negative for vimentin. The appearance is highly suggestive of oncocytoma. Patient under AS. |
| 00323 | CT: Small renal mass, enhancing solid lesion. Histology: Biopsy; three cores up to 12mm. Micro report: these cores are partially replaced by a tumour with a very eosinophilic morphology. Immunohistochemistry shows diffuse staining for CD117 and only patchy staining for Cytokeratin 7. Taken together the morphology and immunohistochemistry profile would favour an oncocytoma. Patient under AS. |
| 00325 | CT: Solid renal mass, suspicious of RCC. Histology: Biopsy; two cores. X1 up to 10 mm plus fragments. Sections show a core biopsy of renal parenchyma bearing a focus on neoplastic tissue towards one end. The tumour cells are arranged in rosettes and solid islands. Tumour cells have abundant eosinophilic cytoplasm and small hyperchromatic nuclei. No mitotic activity or necrosis is identified. Results of special stains immunohistochemical, Tumour cells appear entirely negative for cytokeratin 7. Tumour cells moderately express KIT. Tumour cells appear negative for CD10. Tumour cells are negative for RCC. Conclusion: Taken together the morphological appearance and immunohistochemical profile are most in keeping with an oncocytoma. Further clinical correlation and discussion of this case at the urology MDT meeting are strongly recommended. Patient under AS. |
| 00326 | CT: Enhanced solid small renal mass, in the arterial and delayed phase. Histology: Biopsy; 2018; two cores of tissue up to 14 mm in length. Micro Report: The section shows cores of tissue that have been derived from a tumour that is formed of trabeculae and groups of bland-appearing cells. The cells show oncocytic features with uniform pink cytoplasm. The cells have round nuclei with minimal pleomorphism. Perinuclear halos are not apparent. The cytoplasmic boundaries are not sharply defined. A panel of immunohistochemistry demonstrates that the tumour exhibits diffuse strong positivity for broad-spectrum cytokeratin’s recognised by MNF. Scattered positive tumour cells are identified in the sections stained for broad-spectrum cytokeratin’s recognised by AE1/3 as well as for cytokeratin 7. The sections stained for cytokeratin 20 show a blush of staining in the tumour cells but the section stained for cytokeratin 14 is negative. The tumour cells are negative for vimentin. There is a patchy variable cytoplasmic expression of CD10. The tumour cells are substantially negative for RCC but do show variable positive staining for EMA. Overall, the appearance indicates cores of tissue derived from a tumour with prominent oncocytic features. The principal differential diagnosis rests between oncocytic features; morphology of the lesion together with the immunohistochemical profile favour oncocytomas rather than a chromophobe RCC. Biopsy; 2019; increased in size; malignant? one core up to 20 mm. Micro Report: morphologically this is a primary renal neoplasm with marked oncocytic features with cells arranged in nests and cords. There is abundant eosinophilic cytoplasm and central round nuclei with smooth contour. Atypical features are not identified and morphological features more suggestive of a chromophobe RCC are not present. Furthermore, immunohestochimistry: there is virtually negative staining for cytokeratin 7 and positive staining for CD117. The features therefore remain consistent with those of an oncocytoma. Further clinical and radiological correlation is advised. The patient under AS. |
| Sample ID | 260/280 | ng/l |
|---|---|---|
| T511 3A (1) | 1.75 | 62.21 |
| T52223 5H | 1.84 | 215.9 |
| T53222 2C | 1.78 | 104.2 |
| T54444 1C | 1.83 | 135.5 |
| T55447 1C | 1.81 | 203.7 |
| T56643 1C | 1.82 | 516.3 |
| T535 2Cre | 1.78 | 104.2 |
| T5721 1Bre | 1.83 | 297.8 |
| T57987 1B | 1.83 | 297.8 |
| T58876 2I | 1.77 | 89.14 |
| T59543 1E | 1.78 | 175.2 |
| T51032 1D | 1.83 | 168.5 |
| T51123 4B | 1.85 | 517.9 |
| T5134 2Cre | 1.71 | 101.1 |
| T512 3A (2) | 1.58 | 37.82 |
| T51308 2C | 1.71 | 101.1 |
| T51444 2E | 1.71 | 66.63 |
| T51555 1A | 1.75 | 145.21 |
| 115161 14b | 1.74 | 91.41 |
| 114939 3re | 1.65 | 83.63 |
| 135177 34e | 1.69 | 69.51 |
| 1114188 39 | 1.65 | 83.63 |
| 115199 07f | 1.64 | 74.89 |
| 1154 14Bre | 1.74 | 91.41 |
| Genotype | CN | LRR-Mean | LRR-SD | BAF-Mean | BAF-SD |
|---|---|---|---|---|---|
| DD | 0 | -5 | 2 | NA | NA |
| A | 1 | -0.45 | 0.18 | 0 | 0.3 |
| B | 1 | -0.45 | 0.18 | 1 | 0.3 |
| AA | 2 | 0 | 0.18 | 0 | 0.3 |
| AB | 2 | 0 | 0.18 | 0.5 | 0.3 |
| BB | 2 | 0 | 0.18 | 1 | 0.3 |
| AAA | 3 | 0.3 | 0.18 | 0 | 0.3 |
| AAB | 3 | 0.3 | 0.18 | 1/3 | 0.3 |
| ABB | 3 | 0.3 | 0.18 | 2/3 | 0.3 |
| BBB | 3 | 0.3 | 0.18 | 1 | 0.3 |
| AAAA | 4 | 0.75 | 0.18 | 0 | 0.3 |
| AAAB | 4 | 0.75 | 0.18 | 0.25 | 0.3 |
| ABBB | 4 | 0.75 | 0.18 | 0.75 | 0.3 |
| BBBB | 4 | 0.75 | 0.18 | 1 | 0.3 |
| CNV-Type | CNV-Value | CNV-Confidence |
|---|---|---|
| Normal | 2 | Blank |
| Duplication | 3 or 4 | Contains Value |
| Deletion | 1 | Contains Value |
| Copy Neutral-LOH | 2 | Contains Value |
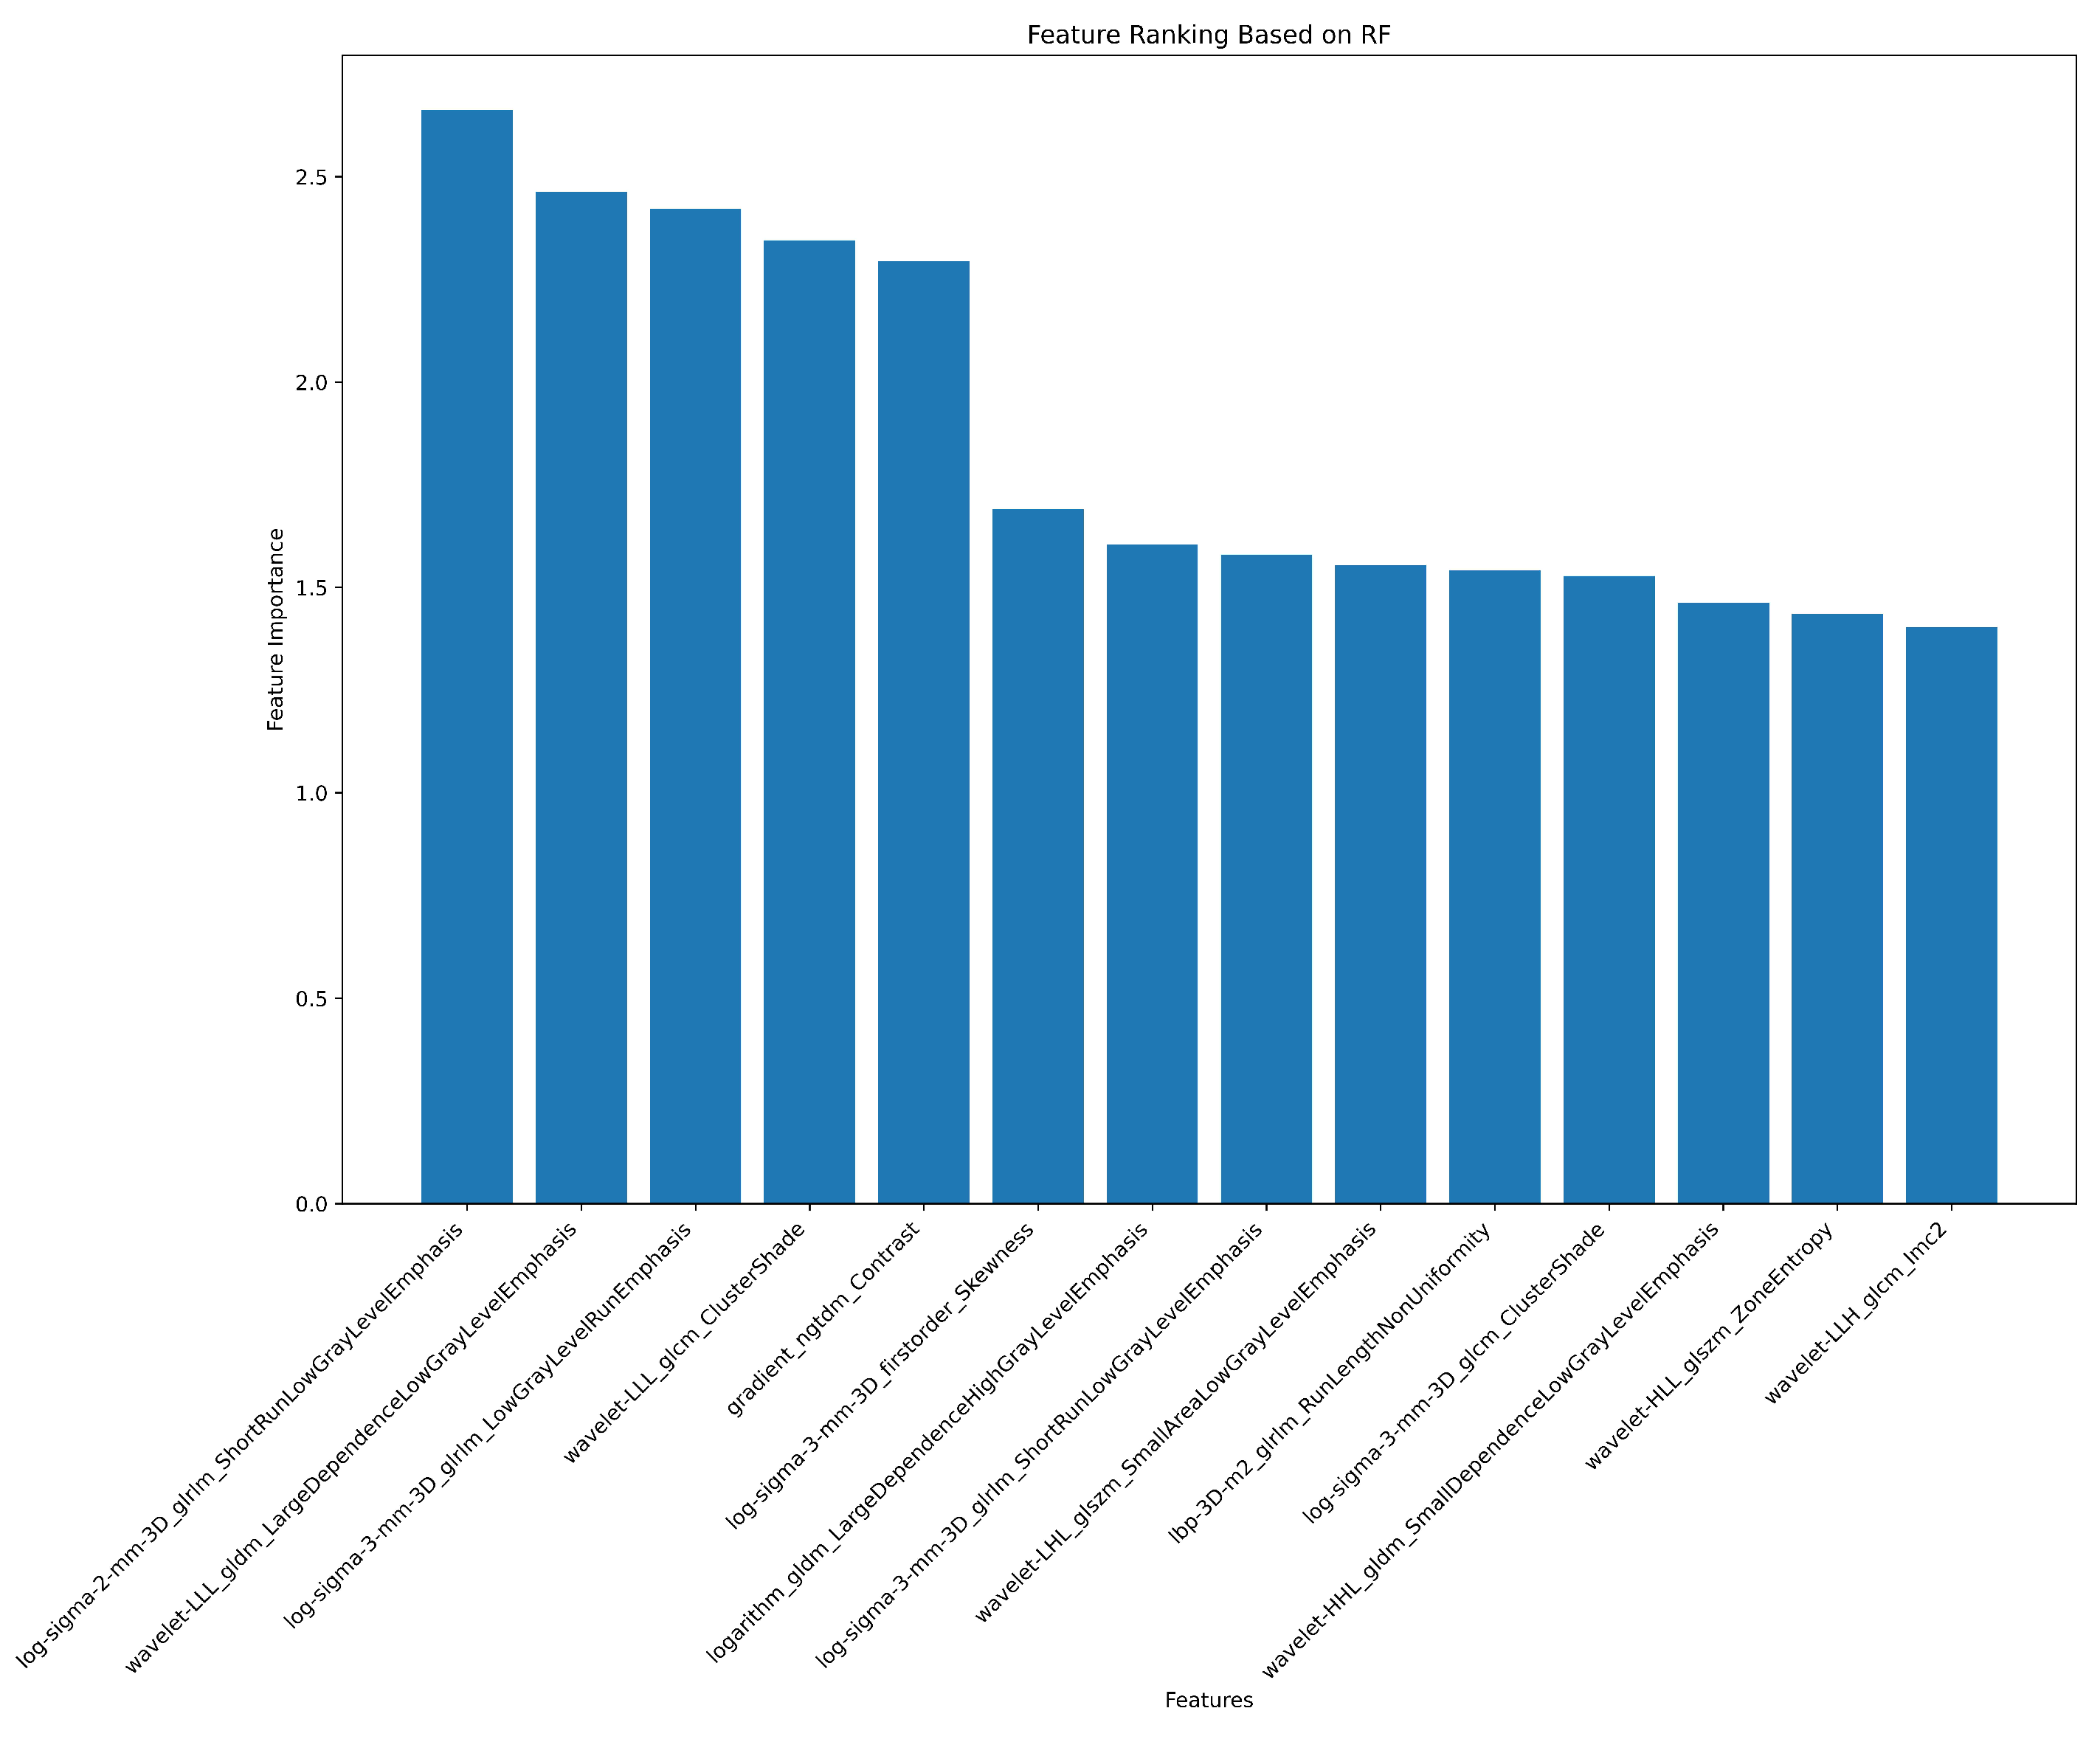
| # | Filter Type | Feature Category | Radiomic Feature | Correlation (r) | p-value |
|---|---|---|---|---|---|
| 1 | Log Sigma 3 mm 3D | First Order | Skewness | 0.39 | 0.698 |
| 2 | Wavelet LLL | First Order | Skewness | -0.37 | 0.527 |
| 3 | LBP 3D k | First Order | Minimum | 0.37 | 0.79 |
| 4 | Wavelet LLH | GLCM | Informational Measure of Correlation ‘2’ (IMC2) | 0.25 | 0.988 |
| 5 | Wavelet LLL | GLDM | Large Dependence Low Gray Level Emphasis (LDLGLE) | -0.38 | 0.85 |
| 6 | Logarithm | GLDM | Large Dependence Low Gray Level Emphasis (LDLGLE) | -0.12 | 0.594 |
| 7 | Logarithm | GLDM | Large Dependence High Gray Level Emphasis (LDHGLE) | 0.34 | 0.07 |
| 8 | Log Sigma 3 mm 3D | GLRLM | Low Gray Level Run Emphasis (LGLRE) | 0.27 | 0.69 |
| 9 | Log Sigma 2 mm 3D | GLRLM | Short Run Low Gray Level Emphasis (SRLGLE) | 0.33 | 0.626 |
| 10 | Log Sigma 3 mm 3D | GLRLM | Short Run Low Gray Level Emphasis (SRLGLE) | 0.29 | 0.956 |
| 11 | Log Sigma 2 mm 3D | GLSZM | Small Area Low Gray Level Emphasis (SALGLE) | 0.19 | 0.079 |
| 12 | Wavelet LHL | GLSZM | Small Area Low Gray Level Emphasis (SALGLE) | 0.2 | 0.137 |
| 13 | Wavelet LLH | GLSZM | Small Area Low Gray Level Emphasis (SALGLE) | -0.05 | 0.516 |
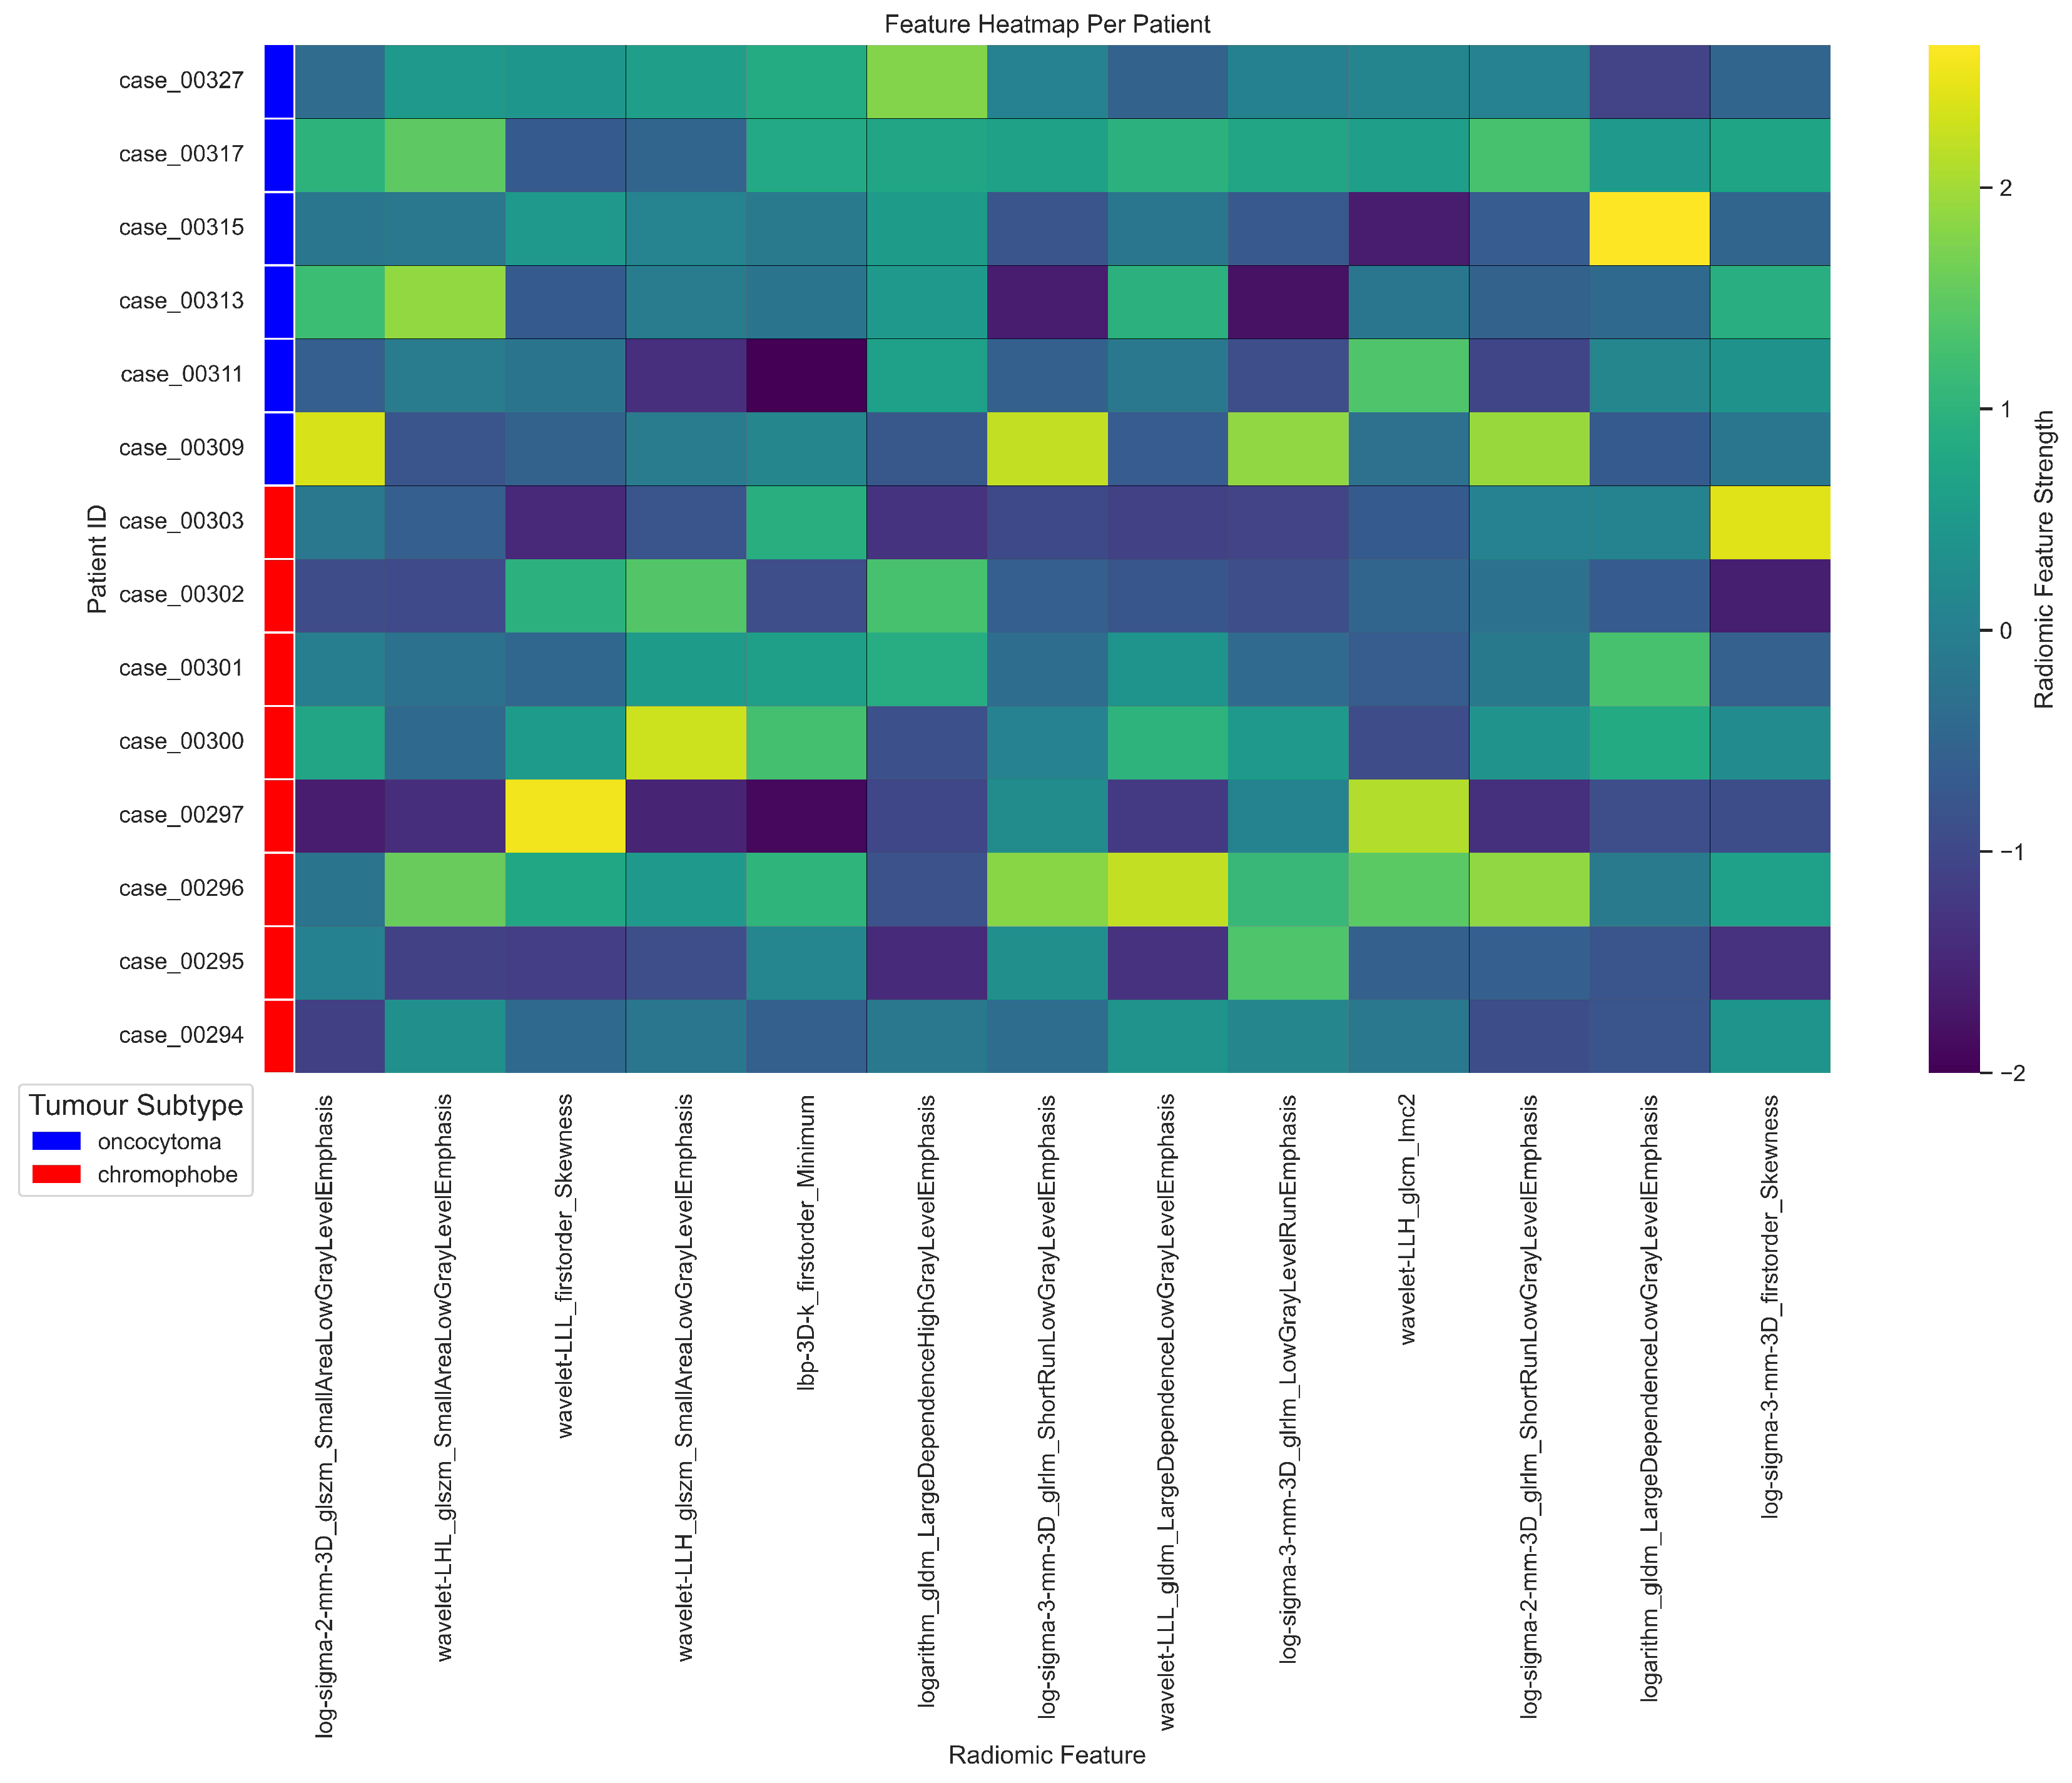
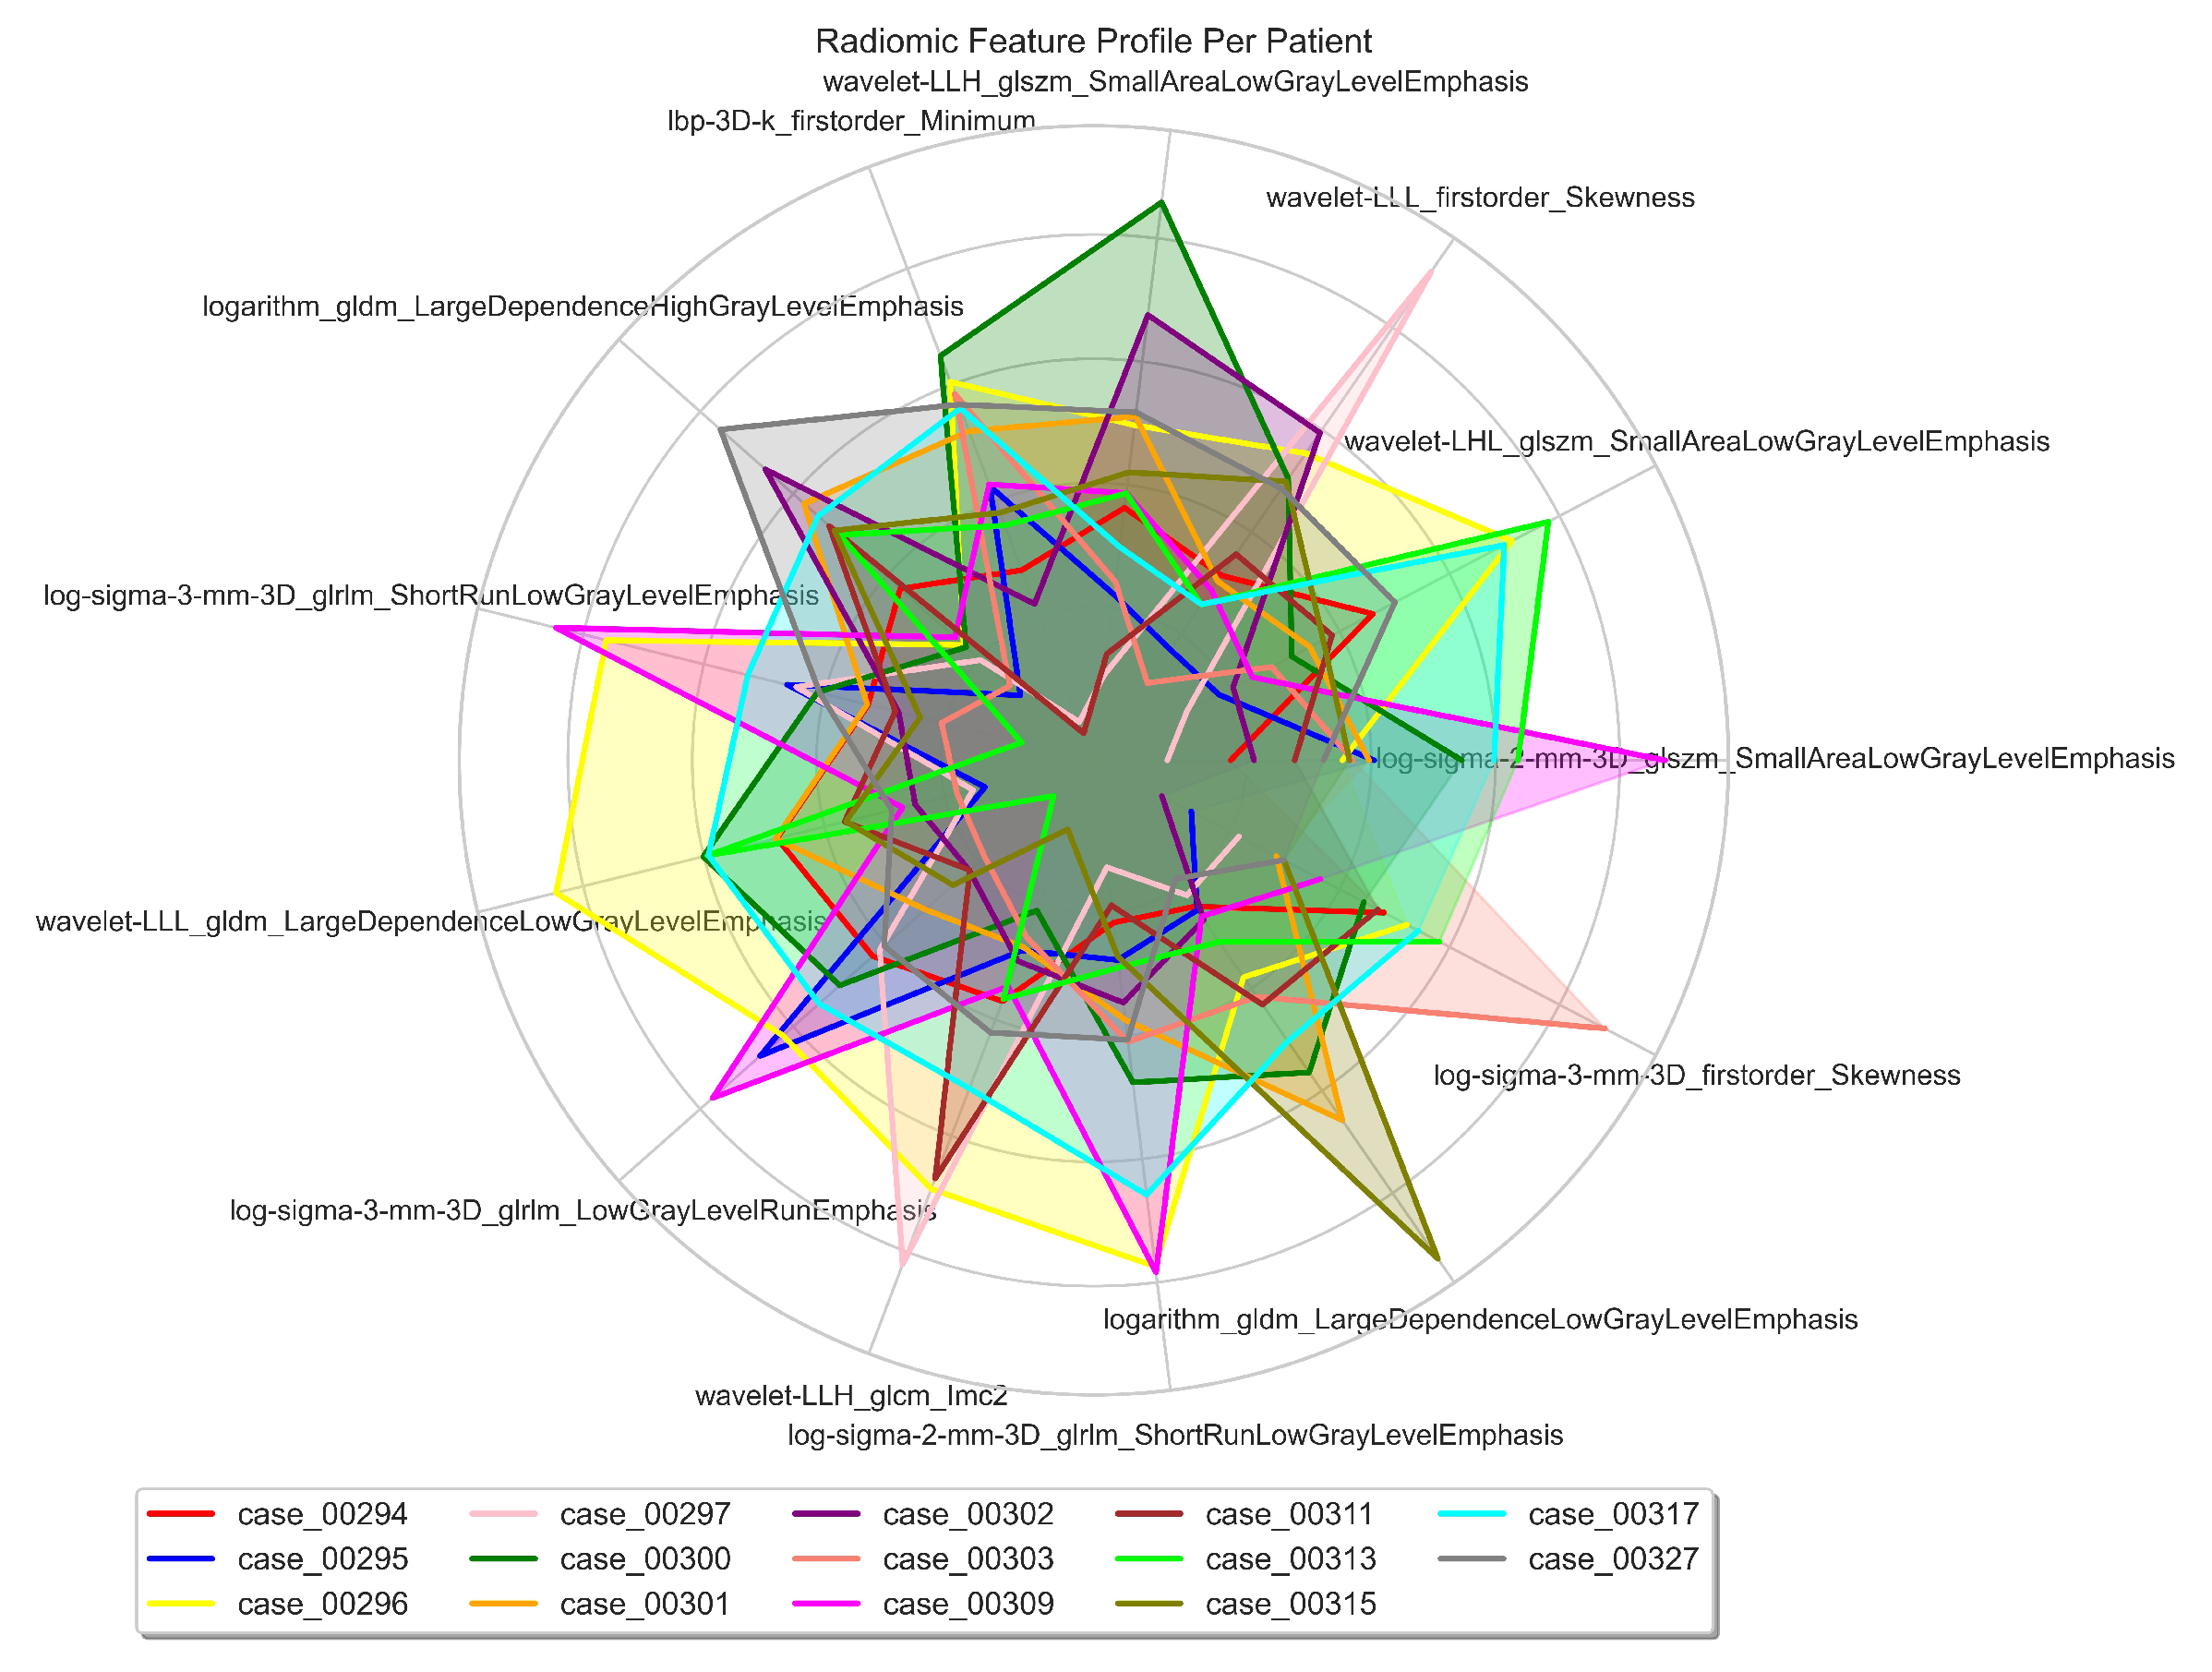
| Cytoband | Gene | Correlation (r) | ChRCC% | RO% | p-value () | p-value |
|---|---|---|---|---|---|---|
| 1p34.1 | RNF115 | 0.41 | 12.5 | 50 | 0.347 | 0.14 |
| 1q21.3 | CTSK | 0.41 | 12.5 | 50 | 0.347 | 0.14 |
| 1q21.3 | S100A1 | 0.6 | 12.5 | 50 | 0.347 | 0.02 |
| 1q22 | MUC1, RAB25 | 0.6 | 0 | 50 | 0.109 | 0.2 |
| 1q25.2 | ANGPTL1 | 0.26 | 25 | 50 | 0.687 | 0.37 |
| 1q32.3 | MTF2 | 0.26 | 25 | 50 | 0.687 | 0.37 |
| 1q42.13 | TMED5 | 0.26 | 25 | 50 | 0.687 | 0.37 |
| 1q21.2 | MCOLN2, MCOLN3 | 0.26 | 25 | 50 | 0.687 | 0.37 |
| 1q32.1 | LAPTM5 | 0.42 | 25 | 66.67 | 0.31 | 0.14 |
| 1p36.22 | NBL1 | 0.41 | 12.5 | 50 | 0.347 | 0.14 |
| 2q24 | ERBB4 | 0.45 | 37.5 | 0 | 0.301 | 0.11 |
| 6q13 | LMBRD1 | 0.45 | 37.5 | 0 | 0.301 | 0.10 |
| 6q14.1 | TPBG | 0.35 | 25 | 0 | 0.58 | 0.21 |
| 6q14.1 | MANEA | 0.45 | 37.5 | 0 | 0.301 | 0.10 |
| 6q16.3 | HACE1 | 0.45 | 37.5 | 0 | 0.301 | 0.10 |
| 10q11.23 | PRKG1 | 0.45 | 37.5 | 0 | 0.301 | 0.10 |
| 10q22.1 | CSTF2T | 0.45 | 37.5 | 0 | 0.301 | 0.10 |
| 10p12.33 | MRC1 | 0.45 | 37.5 | 0 | 0.301 | 0.10 |
| 10p12.1 | STAM | 0.45 | 37.5 | 0 | 0.301 | 0.10 |
| 10q22.2 | PPP3CB | 0.47 | 0 | 33.33 | 0.58 | 0.09 |
| 17q21.31 | SLC4A1 | 0.32 | 0 | 16.67 | 0.88 | 0.26 |
| Xp21.2 | DMD | 0.61 | 87.5 | 33.33 | 0.126 | 0.02 |
| Xp11.23 | DYNLT3 | 0.61 | 87.5 | 33.33 | 0.126 | 0.02 |
| Xq28 | CTAG1B, MAGEA4, MAGEA3 | 0.47 | 75 | 33.33 | 0.31 | 0.09 |
| Correlation | Radiogenomics Features n=34 |
|---|---|
| -0.73 | ChXp21.2 (DMD) and Log Sigma 3 mm 3D Firstorder Skewness |
| -0.73 | ChXp11.23 (DYNLT3) and Log Sigma 3 mm 3D Firstorder Skewness |
| -0.65 | Ch2q24 (ERBB4) and Log Sigma 3 mm 3D Firstorder Skewness |
| -0.61 | Ch6q14.1 (TPBG) and Logarithm GLDM Large Dependence High Gray Level Emphasis |
| -0.61 | Ch6q14.1 (TPBG) and Wavelet LLL Firstorder Skewness |
| -0.58 | Ch6q13 (LMBRD1) and Wavelet LLL First Order Skewness |
| -0.58 | Ch6q14.1 (MANEA) and Wavelet LLL First Order Skewness |
| -0.58 | Ch6q16.3 (HACE1) and Wavelet LLL First Order Skewness |
| -0.57 | ChXp21.2 (DMD) and Wavelet LHL GLSZM Small Area Low Gray Level Emphasis |
| -0.57 | ChXp11.23 (DYNLT3) and Wavelet LHL GLSZM Small Area Low Gray Level Emphasis |
| -0.56 | Ch6q14.1 (TPBG) and Wavelet LLL GLDM Large Dependence Low Gray Level Emphasis |
| 0.5 | Ch1q21.3 (S100A1) and Wavelet LHL GLSZM Small Area Low Gray Level Emphasis |
| 0.5 | Ch1q22 (MUC1, RAB25) and Wavelet LHL GLSZM Small Area Low Gray Level Emphasis |
| -0.5 | Ch1q21.3 (S100A1) and Log Sigma 3 mm 3D GLRLM Low Gray Level Run Emphasis |
| -0.5 | Ch1q22 (MUC1, RAB25) and Log Sigma 3 mm 3D GLRLM Low Gray Level Run Emphasis |
| -0.5 | Ch10q11.23 (PRKG1) and Wavelet LLH GLCM Imc2 |
| -0.5 | Ch10q22.1 (CSTF2T) and Wavelet LLH GLCM Imc2 |
| -0.5 | Ch10p12.33 (MRC1) and Wavelet LLH GLCM Imc2 |
| -0.5 | Ch10p12.1 (STAM) and Wavelet LLH GLCM Imc2 |
| 0.47 | Ch1q32.1 (LAPTM5) and Wavelet LHL GLSZM Small Area Low Gray Level Emphasis |
| 0.46 | Ch10q22.2-q23.1 (PPP3CB) and Logarithm GLDM Large Dependence High Gray Level Emphasis |
| 0.45 | Ch17q11.1-q21.32 (SLC4A1) and Logarithm GLDM Large Dependence High Gray Level Emphasis |
| -0.45 | Ch6q13 (LMBRD1) and Wavelet LLH GLCM Imc2 |
| -0.45 | Ch6q14.1 (MANEA) and Wavelet LLH GLCM Imc2 |
| -0.45 | Ch6q16.3 (HACE1) and Wavelet LLH GLCM Imc2 |
| -0.45 | Ch17q21.31 (SLC4A1) and Logarithm GLDM Large Dependence Low Gray Level Emphasis |
| -0.44 | Ch2q24 (ERBB4) and Wavelet LHL GLSZM Small Area Low Gray Level Emphasis |
| 0.43 | Ch1q25.2 (ANGPTL1) and Wavelet LHL GLSZM Small Area Low Gray Level Emphasis |
| -0.42 | ChXq28 (CTAG1B, MAGEA3, MAGEA4) and Wavelet LHL GLSZM Small Area Low Gray Level Emphasis |
| -0.41 | Ch6q14.1 (TPBG) and Wavelet LLH GLSZM Small Area Low Gray Level Emphasis |
| -0.41 | Ch6q14.1 (TPBG) and Wavelet LHL GLSZM Small Area Low Gray Level Emphasis |
| 0.41 | Ch1q21.3 (S100A1) and Logarithm GLDM Large Dependence High Gray Level Emphasis |
| 0.41 | Ch1q22 (MUC1, RAB25) and Logarithm GLDM Large Dependence High Gray Level Emphasis |
| -0.41 | Ch6q14.1 (TPBG) and Wavelet LHL GLSZM Small Area Low Gray Level Emphasis |
| Subtype | Patient | DUP | DEL | LOH | Total | DUP (%) | DEL (%) | LOH (%) | DUP (Mb) | DEL (Mb) | LOH (Mb) |
|---|---|---|---|---|---|---|---|---|---|---|---|
| ChRCC | 294 | 20 | 7 | 4 | 31 | 6.35 | 5.26 | 2.35 | 1.14 | 2.61 | 37.31 |
| 295 | 66 | 5 | 2 | 73 | 20.95 | 3.76 | 1.8 | 14.91 | 0.33 | 2.57 | |
| 296 | 3 | 25 | 6 | 34 | 0.95 | 18.8 | 3.53 | 1.35 | 0.74 | 25.18 | |
| 297 | 5 | 6 | 10 | 21 | 1.59 | 4.51 | 5.88 | 1.72 | 3.14 | 15.26 | |
| 300 | 9 | 13 | 8 | 30 | 2.6 | 9.77 | 4.71 | 10.69 | 0.03 | 20.93 | |
| 301 | 44 | 15 | 2 | 61 | 13.97 | 11.28 | 1.78 | 12.67 | 1.91 | 1.82 | |
| 302 | 11 | 19 | 131 | 161 | 3.49 | 14.29 | 77.06 | 14.21 | 1.08 | 1.35 | |
| 303 | 59 | 0 | 0 | 59 | 18.73 | 0 | 0 | 19.26 | 0 | 0 | |
| RO | 309 | 6 | 13 | 3 | 22 | 1.9 | 9.77 | 1.76 | 10.62 | 1.4 | 49.52 |
| 311 | 14 | 2 | 0 | 16 | 4.4 | 1.5 | 0 | 20.09 | 6.67 | 0 | |
| 313 | 4 | 3 | 1 | 8 | 1.27 | 2.56 | 0.59 | 17.77 | 5.94 | 1.22 | |
| 315 | 5 | 14 | 3 | 22 | 1.59 | 10.53 | 1.76 | 0.037 | 1.37 | 50.01 | |
| 317 | 11 | 10 | 0 | 21 | 3.49 | 7.52 | 0 | 1.62 | 1.95 | 0 | |
| 327 | 58 | 1 | 0 | 59 | 18.41 | 0.75 | 0 | 5.5 | 0.0065 | 0 | |
| p-value | 0.35 | 0.43 | 0* | - | - | - | - | 1.0 | 0.08 | 0.78 |
| # | 1 | 2 | 3 | 4 | 5 | 6 | 7 | 8 | 9 | 10 | 11 | 12 | 13 | 14 | 15 | 16 | 17 | 18 | 19 | 20 | 21 | 22 | X | Y |
|---|---|---|---|---|---|---|---|---|---|---|---|---|---|---|---|---|---|---|---|---|---|---|---|---|
| 294 | 9 | 1 | 1 | 0 | 0 | 1 | 0 | 0 | 0 | 2 | 1 | 0 | 0 | 3 | 0 | 0 | 4 | 0 | 0 | 0 | 0 | 1 | 4 | 4 |
| 295 | 8 | 11 | 6 | 2 | 1 | 10 | 4 | 1 | 4 | 4 | 1 | 1 | 3 | 1 | 0 | 0 | 6 | 0 | 0 | 0 | 2 | 0 | 5 | 3 |
| 296 | 3 | 1 | 0 | 1 | 1 | 1 | 3 | 2 | 0 | 2 | 2 | 1 | 1 | 1 | 1 | 2 | 0 | 0 | 0 | 1 | 1 | 0 | 6 | 4 |
| 297 | 2 | 0 | 3 | 0 | 0 | 1 | 0 | 0 | 1 | 0 | 0 | 0 | 1 | 1 | 0 | 0 | 0 | 1 | 0 | 0 | 0 | 0 | 6 | 5 |
| 300 | 0 | 1 | 0 | 0 | 0 | 2 | 0 | 2 | 1 | 8 | 0 | 0 | 2 | 0 | 1 | 0 | 1 | 0 | 0 | 2 | 1 | 0 | 6 | 3 |
| 301 | 6 | 4 | 3 | 0 | 0 | 2 | 3 | 0 | 6 | 7 | 2 | 2 | 2 | 1 | 1 | 0 | 4 | 3 | 0 | 1 | 2 | 0 | 8 | 4 |
| 302 | 25 | 33 | 28 | 0 | 1 | 21 | 1 | 1 | 3 | 10 | 3 | 0 | 8 | 1 | 1 | 0 | 7 | 1 | 0 | 2 | 2 | 0 | 8 | 5 |
| 303 | 2 | 2 | 4 | 3 | 3 | 2 | 3 | 6 | 2 | 0 | 3 | 2 | 3 | 1 | 1 | 5 | 4 | 4 | 4 | 2 | 1 | 1 | 1 | 0 |
| 309 | 6 | 0 | 0 | 1 | 2 | 1 | 1 | 0 | 0 | 0 | 0 | 0 | 0 | 0 | 1 | 0 | 0 | 1 | 1 | 0 | 0 | 0 | 4 | 4 |
| 311 | 3 | 1 | 0 | 1 | 0 | 2 | 0 | 0 | 0 | 3 | 0 | 0 | 1 | 0 | 0 | 1 | 0 | 0 | 0 | 1 | 0 | 0 | 1 | 2 |
| 313 | 2 | 0 | 0 | 0 | 1 | 0 | 0 | 0 | 0 | 0 | 0 | 0 | 0 | 0 | 0 | 1 | 0 | 0 | 0 | 1 | 0 | 0 | 0 | 3 |
| 315 | 5 | 0 | 2 | 0 | 0 | 1 | 0 | 1 | 0 | 1 | 1 | 0 | 0 | 0 | 1 | 0 | 0 | 0 | 1 | 0 | 1 | 1 | 2 | 5 |
| 317 | 7 | 0 | 0 | 0 | 0 | 1 | 0 | 2 | 0 | 1 | 0 | 0 | 1 | 0 | 0 | 1 | 1 | 2 | 0 | 0 | 0 | 1 | 0 | 4 |
| 327 | 11 | 3 | 1 | 0 | 4 | 5 | 0 | 2 | 1 | 8 | 2 | 0 | 3 | 2 | 2 | 2 | 5 | 2 | 2 | 3 | 0 | 0 | 1 | 0 |
| 0.9 | 0 | 0 | 0.1 | 0.4 | 0 | 0 | 0.3 | 0 | 0.2 | 0 | 0 | 0 | 0 | 1 | 0.7 | 0 | 0.7 | 0.1 | 0.5 | 0 | 0.7 | 0 | 0.9 |
| ChRCC | RO | p-value | |||||||||||||
|---|---|---|---|---|---|---|---|---|---|---|---|---|---|---|---|
| Patient # | 294 | 295 | 296 | 297 | 300 | 301 | 302 | 303 | 309 | 311 | 313 | 315 | 317 | 327 | |
| Pathogenic | |||||||||||||||
| DEL | 0 | 0 | 1 | 0 | 0 | 1 | 0 | 0 | 0 | 0 | 0 | 0 | 0 | 0 | |
| DUP | 0 | 7 | 0 | 0 | 0 | 3 | 3 | 8 | 0 | 1 | 1 | 0 | 0 | 4 | 0.72 |
| LOH | 3 | 0 | 4 | 4 | 4 | 1 | 11 | 0 | 3 | 0 | 0 | 3 | 0 | 0 | |
| Likely Pathogenic | |||||||||||||||
| DEL | 1 | 0 | 6 | 1 | 0 | 3 | 0 | 0 | 2 | 1 | 1 | 1 | 2 | 0 | |
| DUP | 1 | 21 | 0 | 1 | 2 | 14 | 0 | 31 | 2 | 5 | 1 | 0 | 0 | 16 | 0.16 |
| LOH | 0 | 0 | 0 | 0 | 1 | 0 | 5 | 0 | 0 | 0 | 0 | 0 | 0 | 0 | |
| Benign | |||||||||||||||
| DEL | 0 | 1 | 1 | 2 | 0 | 0 | 2 | 0 | 0 | 0 | 0 | 2 | 2 | 0 | |
| DUP | 0 | 0 | 0 | 0 | 0 | 0 | 0 | 0 | 0 | 0 | 0 | 1 | 1 | 0 | - |
| LOH | 0 | 0 | 0 | 0 | 0 | 0 | 0 | 0 | 0 | 0 | 0 | 0 | 0 | 0 | |
| Uncertain Significance | |||||||||||||||
| DEL | 6 | 4 | 17 | 3 | 13 | 0 | 13 | 0 | 11 | 0 | 2 | 11 | 6 | 1 | |
| DUP | 19 | 38 | 3 | 4 | 7 | 27 | 7 | 20 | 4 | 8 | 2 | 4 | 10 | 34 | 0* |
| LOH | 1 | 2 | 2 | 6 | 3 | 0 | 115 | 0 | 0 | 0 | 1 | 0 | 0 | 0 | |
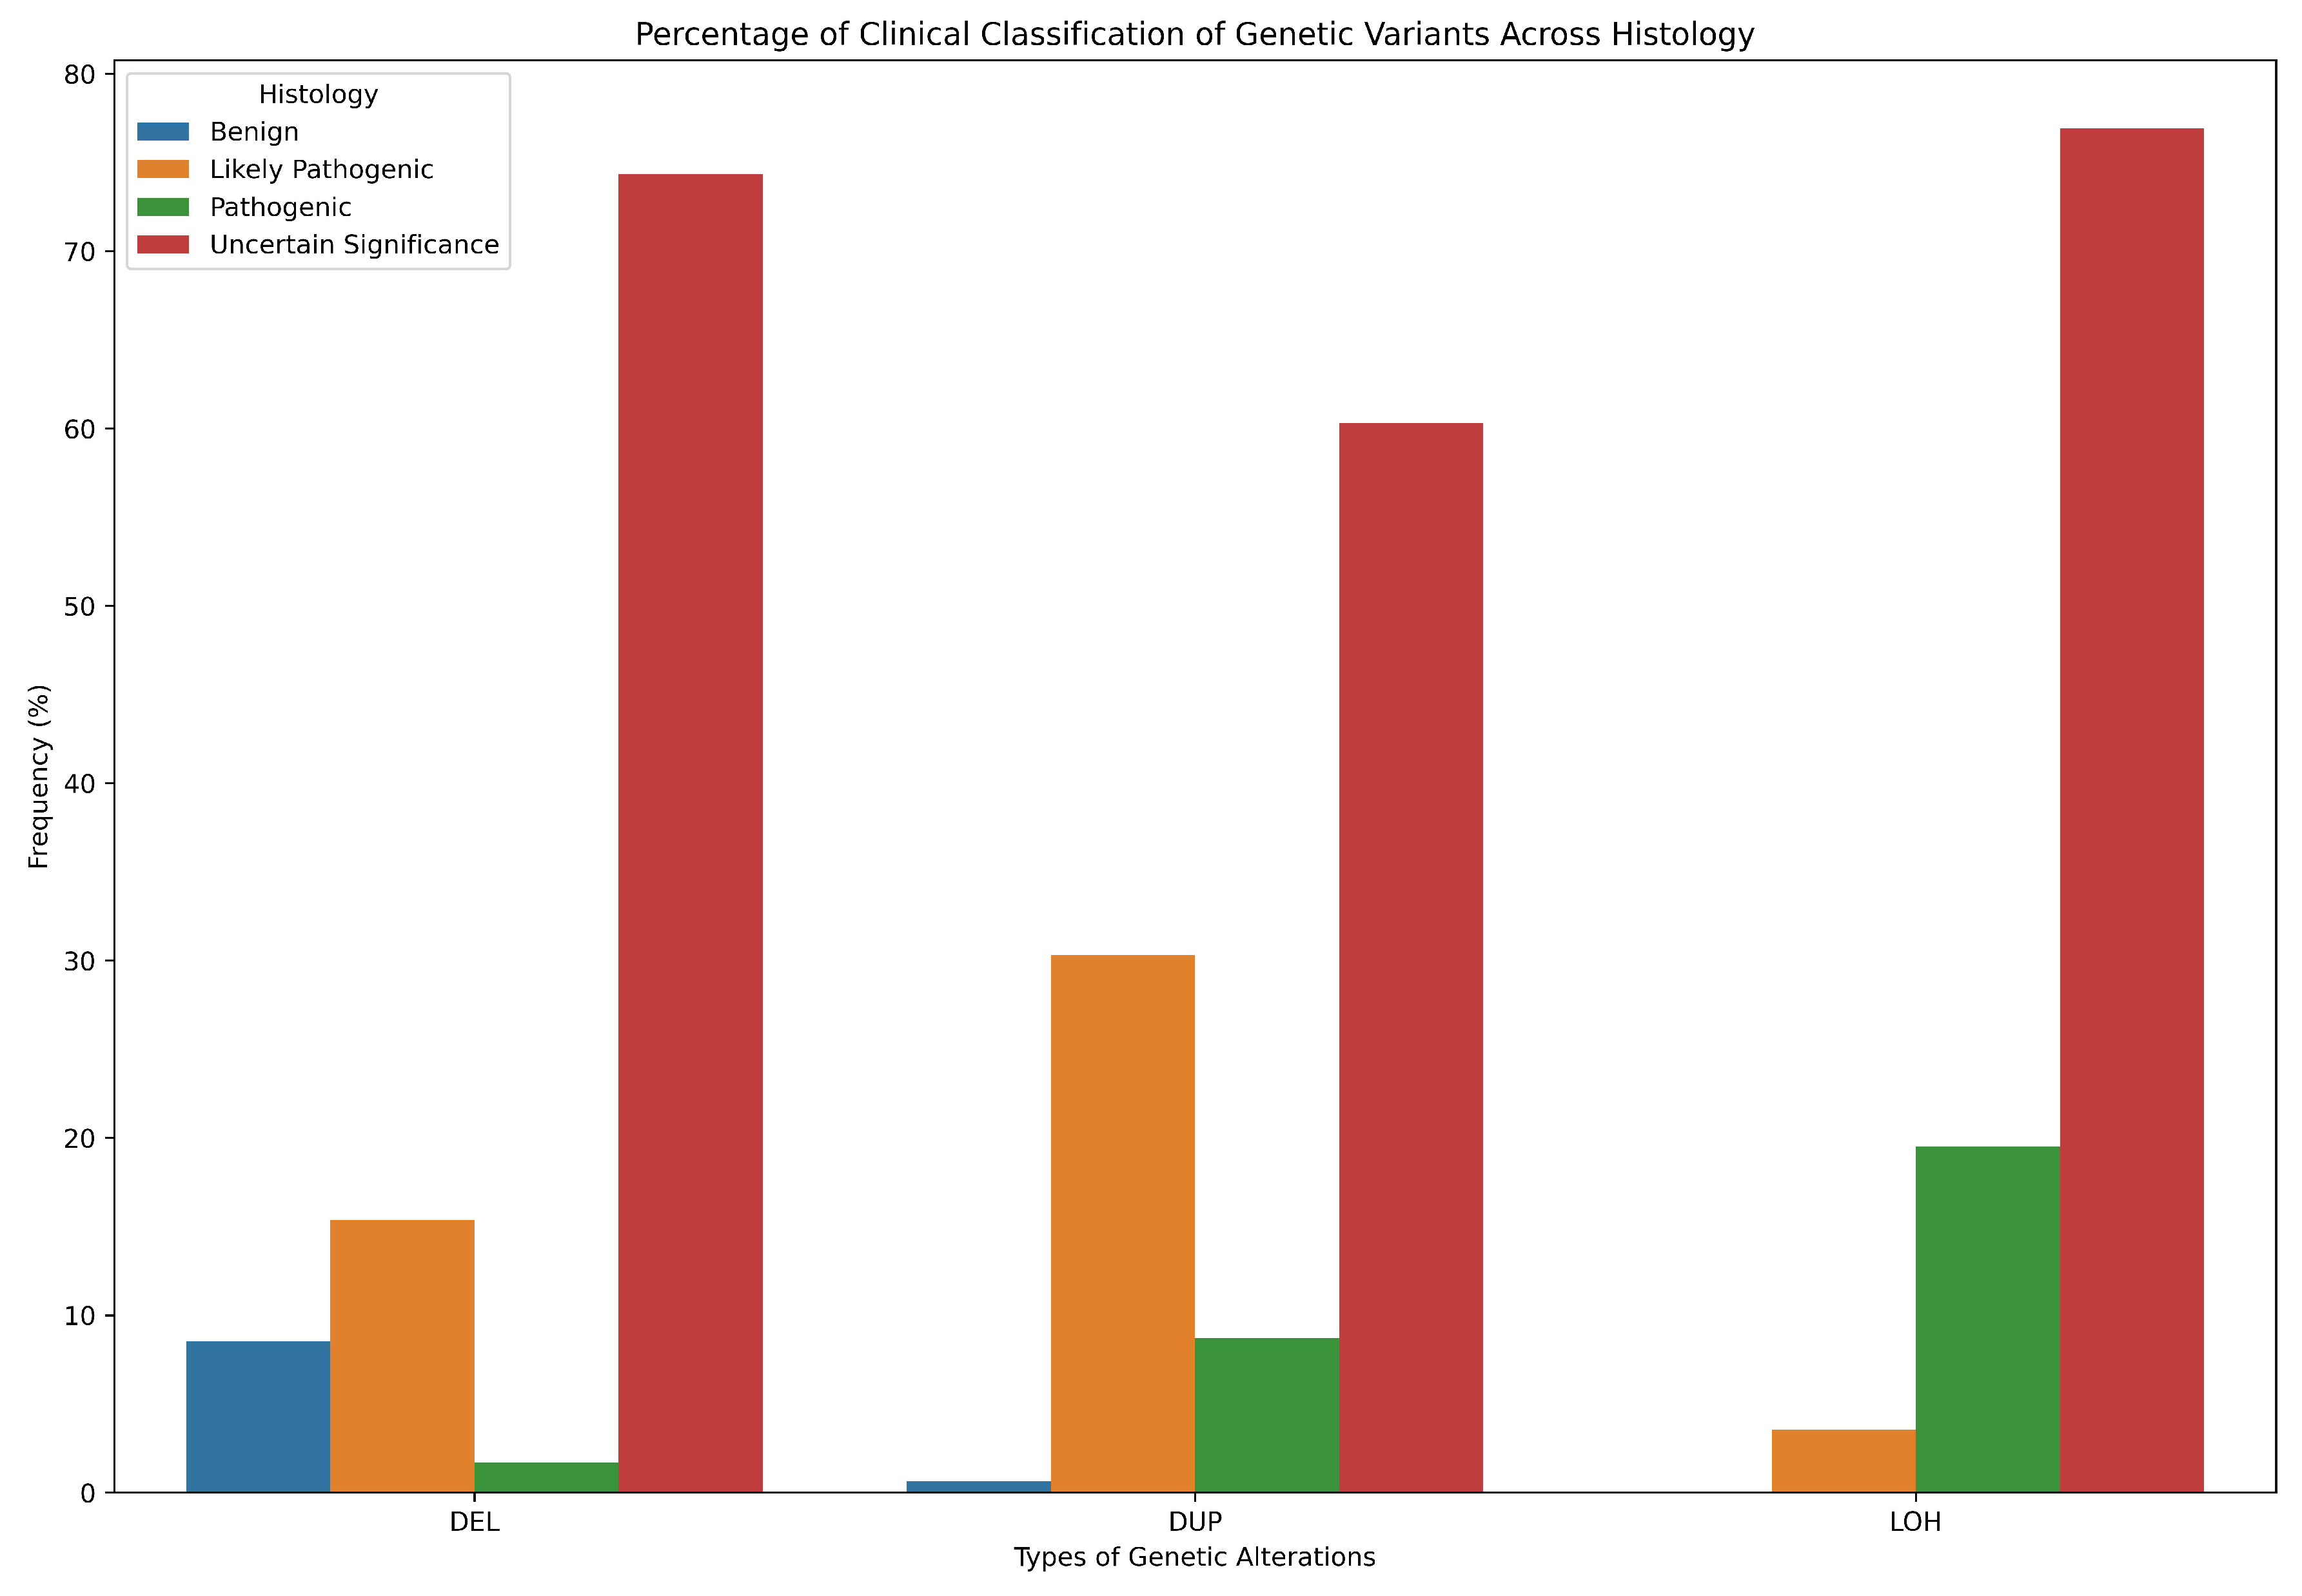
| Correlation (r) | ACC | SPE | SEN | AUC | MCC | F1 |
|---|---|---|---|---|---|---|
| >0.55 | 81.25 | 87.50 | 75.00 | 85.00 | 0.63 | 0.80 |
| >0.50 | 68.75 | 87.50 | 50.00 | 83.00 | 0.40 | 0.62 |
| >0.45 | 62.50 | 87.50 | 37.50 | 80.00 | 0.29 | 0.70 |
| >0.40 | 75.00 | 87.50 | 62.50 | 78.00 | 0.52 | 0.71 |
| >0.30 | 68.75 | 87.50 | 50.00 | 89.00 | 0.40 | 0.62 |
| (ChRCC) | (RO) | E | Z |
|---|---|---|---|
| 0.286 | 0.714 | 0.05 | 1.96 |
| 627.576 | |||
| z | .00 | .01 | .02 | .03 | .04 | .05 | .06 | .07 | .08 | .09 |
|---|---|---|---|---|---|---|---|---|---|---|
| 0.0 | .5000 | .5040 | .5080 | .5120 | .5160 | .5199 | .5239 | .5279 | .5319 | .5359 |
| 0.1 | .5398 | .5438 | .5478 | .5517 | .5557 | .5596 | .5636 | .5675 | .5714 | .5753 |
| 0.2 | .5793 | .5832 | .5871 | .5910 | .5948 | .5987 | .6026 | .6064 | .6103 | .6141 |
| 0.3 | .6179 | .6217 | .6255 | .6293 | .6331 | .6368 | .6406 | .6443 | .6480 | .6517 |
| 0.4 | .6554 | .6591 | .6628 | .6664 | .6700 | .6736 | .6772 | .6808 | .6844 | .6879 |
| 0.5 | .6915 | .6950 | .6985 | .7019 | .7054 | .7088 | .7123 | .7157 | .7190 | .7224 |
| 0.6 | .7257 | .7291 | .7324 | .7357 | .7389 | .7422 | .7454 | .7486 | .7517 | .7549 |
| 0.7 | .7580 | .7611 | .7642 | .7673 | .7704 | .7734 | .7764 | .7794 | .7823 | .7852 |
| 0.8 | .7881 | .7910 | .7939 | .7967 | .7995 | .8023 | .8051 | .8078 | .8106 | .8133 |
| 0.9 | .8159 | .8186 | .8212 | .8238 | .8264 | .8289 | .8315 | .8340 | .8365 | .8389 |
| 1.0 | .8413 | .8438 | .8461 | .8485 | .8508 | .8531 | .8554 | .8577 | .8599 | .8621 |
| 1.1 | .8643 | .8665 | .8686 | .8708 | .8729 | .8749 | .8770 | .8790 | .8810 | .8830 |
| 1.2 | .8849 | .8869 | .8888 | .8907 | .8925 | .8944 | .8962 | .8980 | .8997 | .9015 |
| 1.3 | .9032 | .9049 | .9066 | .9082 | .9099 | .9115 | .9131 | .9147 | .9162 | .9177 |
| 1.4 | .9192 | .9207 | .9222 | .9236 | .9251 | .9265 | .9279 | .9292 | .9306 | .9319 |
| 1.5 | .9332 | .9345 | .9357 | .9370 | .9382 | .9394 | .9406 | .9418 | .9429 | .9441 |
| 1.6 | .9452 | .9463 | .9474 | .9484 | .9495 | .9505 | .9515 | .9525 | .9535 | .9545 |
| 1.7 | .9554 | .9564 | .9573 | .9582 | .9591 | .9600 | .9608 | .9616 | .9625 | .9633 |
| 1.8 | .9641 | .9649 | .9656 | .9664 | .9671 | .9678 | .9686 | .9693 | .9699 | .9706 |
| 1.9 | .9713 | .9719 | .9726 | .9732 | .9738 | .9744 | .9750 | .9756 | .9761 | .9767 |
| 2.0 | .9772 | .9778 | .9783 | .9788 | .9793 | .9798 | .9803 | .9808 | .9812 | .9817 |
| 2.1 | .9821 | .9826 | .9830 | .9834 | .9838 | .9842 | .9846 | .9850 | .9854 | .9857 |
| 2.2 | .9861 | .9864 | .9868 | .9871 | .9875 | .9878 | .9881 | .9884 | .9887 | .9890 |
| 2.3 | .9893 | .9896 | .9898 | .9901 | .9904 | .9906 | .9909 | .9911 | .9913 | .9916 |
| 2.4 | .9918 | .9920 | .9922 | .9925 | .9927 | .9929 | .9931 | .9932 | .9934 | .9936 |
| 2.5 | .9938 | .9940 | .9941 | .9943 | .9945 | .9946 | .9948 | .9949 | .9951 | .9952 |
| 2.6 | .9953 | .9955 | .9956 | .9957 | .9959 | .9960 | .9961 | .9962 | .9963 | .9964 |
| 2.7 | .9965 | .9966 | .9967 | .9968 | .9969 | .9970 | .9971 | .9972 | .9973 | .9974 |
| 2.8 | .9974 | .9975 | .9976 | .9977 | .9977 | .9978 | .9979 | .9979 | .9980 | .9981 |
| 2.9 | .9981 | .9982 | .9982 | .9983 | .9984 | .9984 | .9985 | .9985 | .9986 | .9986 |
| 3.0 | .9987 | .9987 | .9987 | .9988 | .9988 | .9989 | .9989 | .9989 | .9990 | .9990 |
| 3.1 | .9990 | .9991 | .9991 | .9991 | .9991 | .9992 | .9992 | .9992 | .9992 | .9992 |
| 3.2 | .9993 | .9993 | .9993 | .9993 | .9993 | .9993 | .9994 | .9994 | .9994 | .9994 |
| 3.3 | .9994 | .9994 | .9994 | .9994 | .9994 | .9994 | .9995 | .9995 | .9995 | .9995 |
| 3.4 | .9995 | .9995 | .9995 | .9995 | .9995 | .9995 | .9995 | .9995 | .9996 | .9996 |
Appendix A.2. Technical Lab Work
Appendix A.2.1. Samples Preparation
- -
- Microtome
- -
- Microtome Blades
- -
- Floating Out Water Bath
- -
- Cold Plate/Ice Tray
- -
- Hot Plate
- -
- Slides
- -
- Forceps
- -
- Paint brush
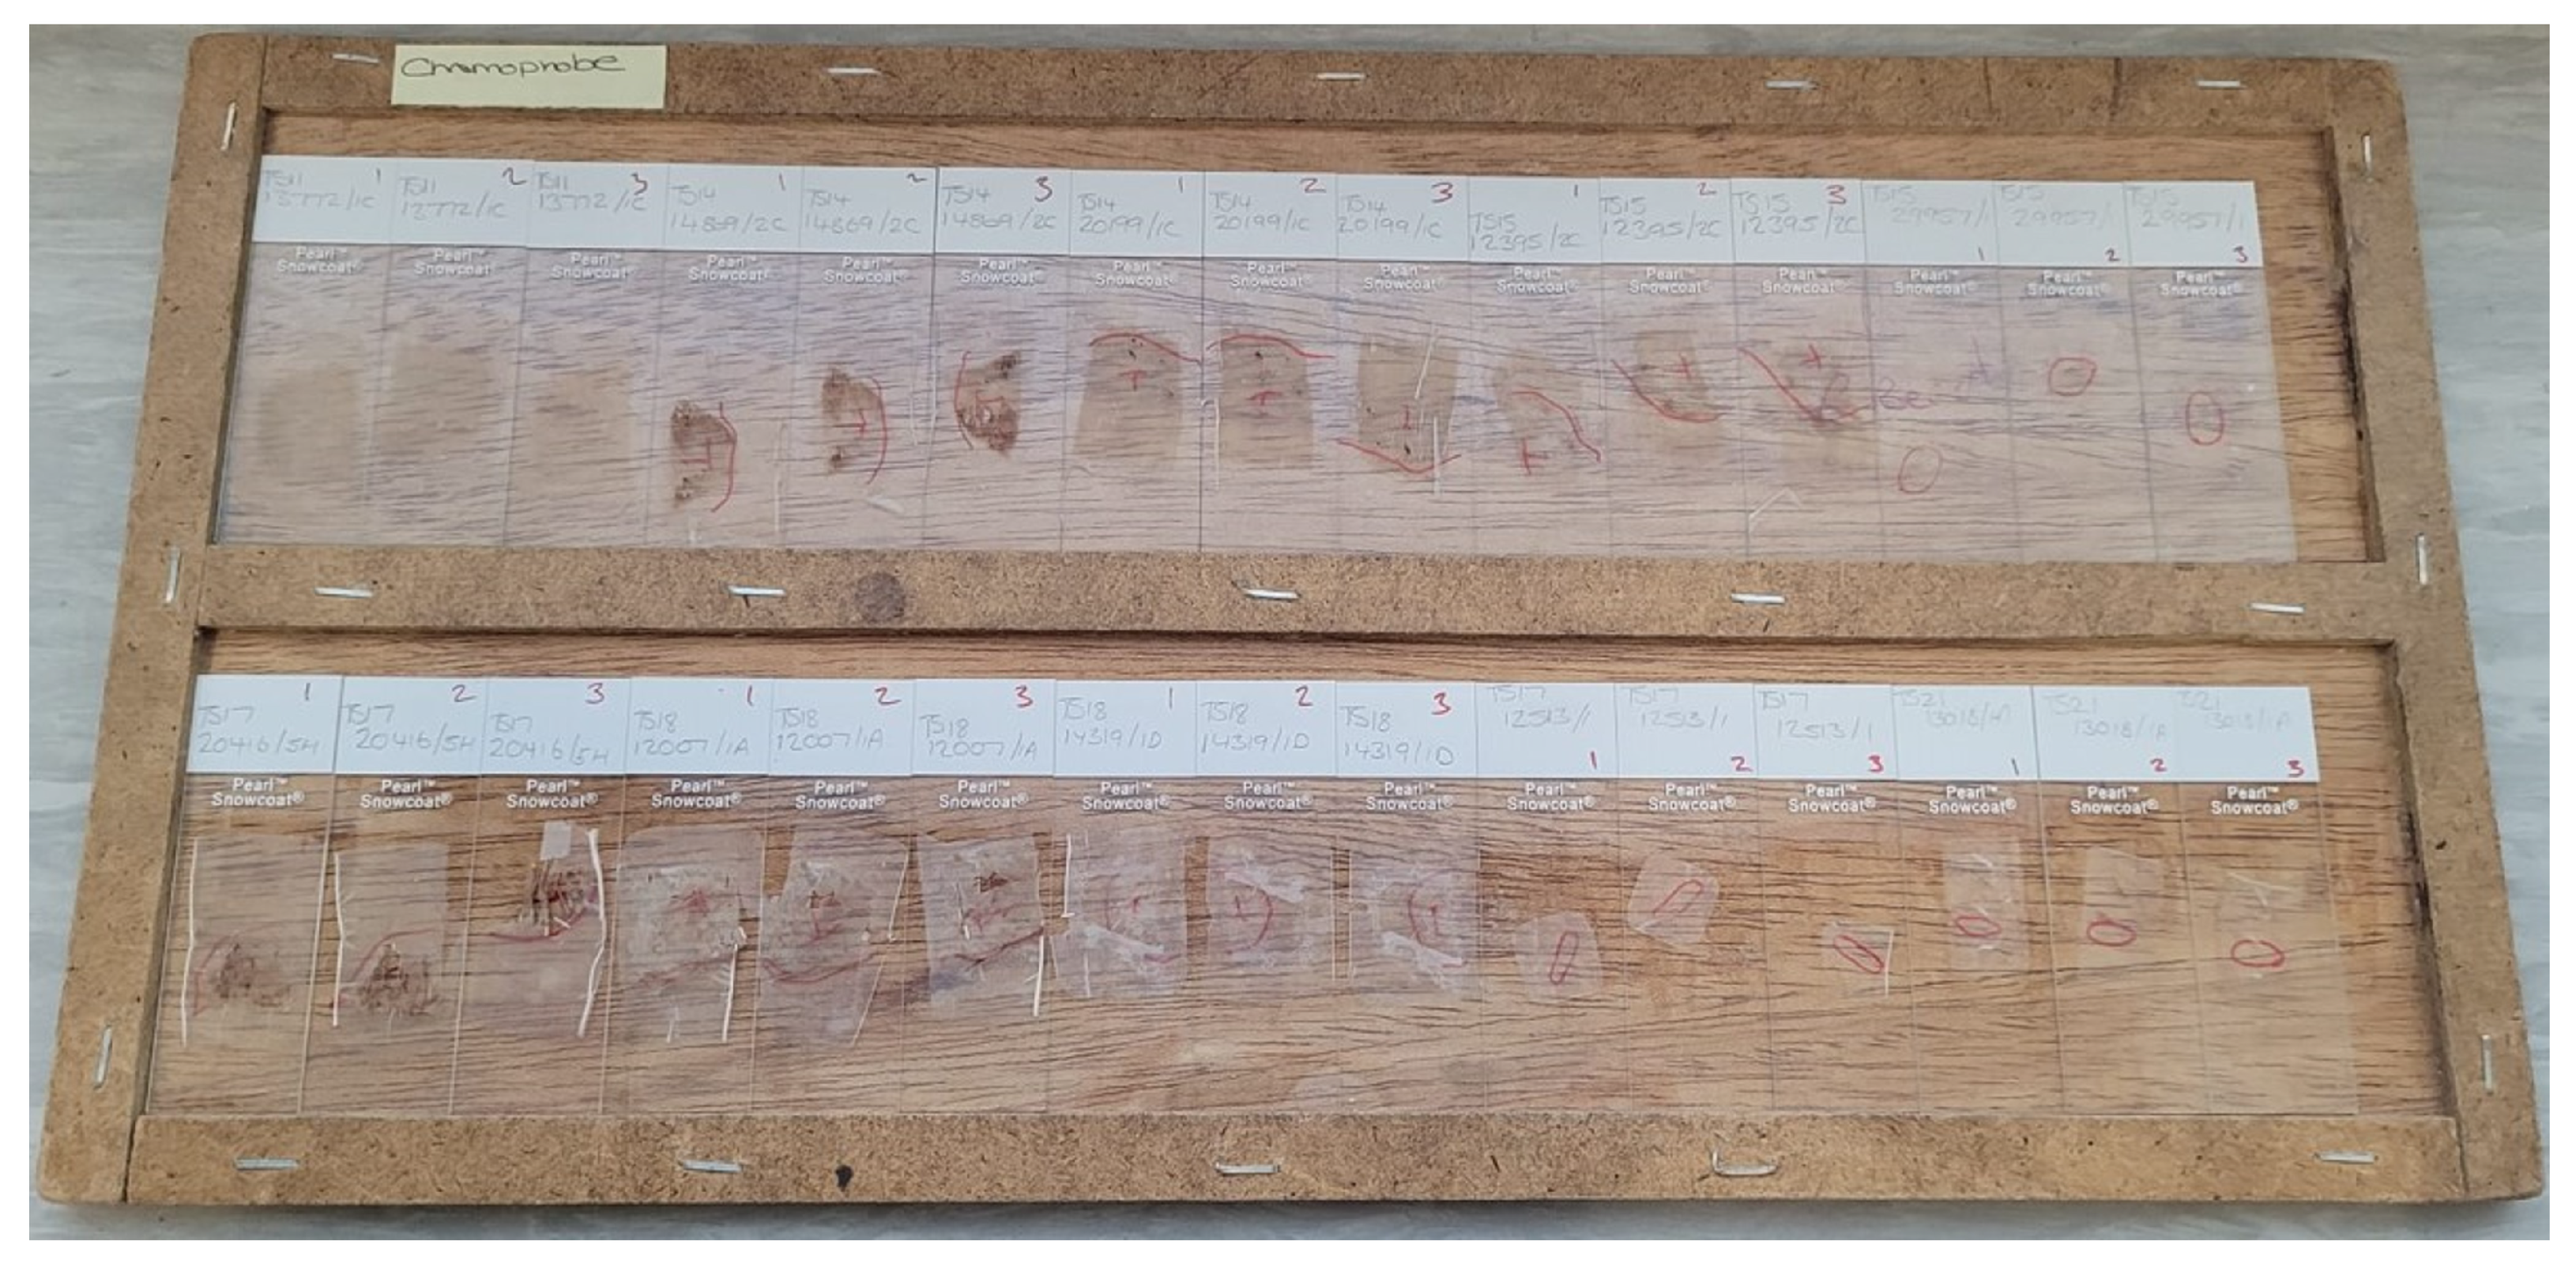
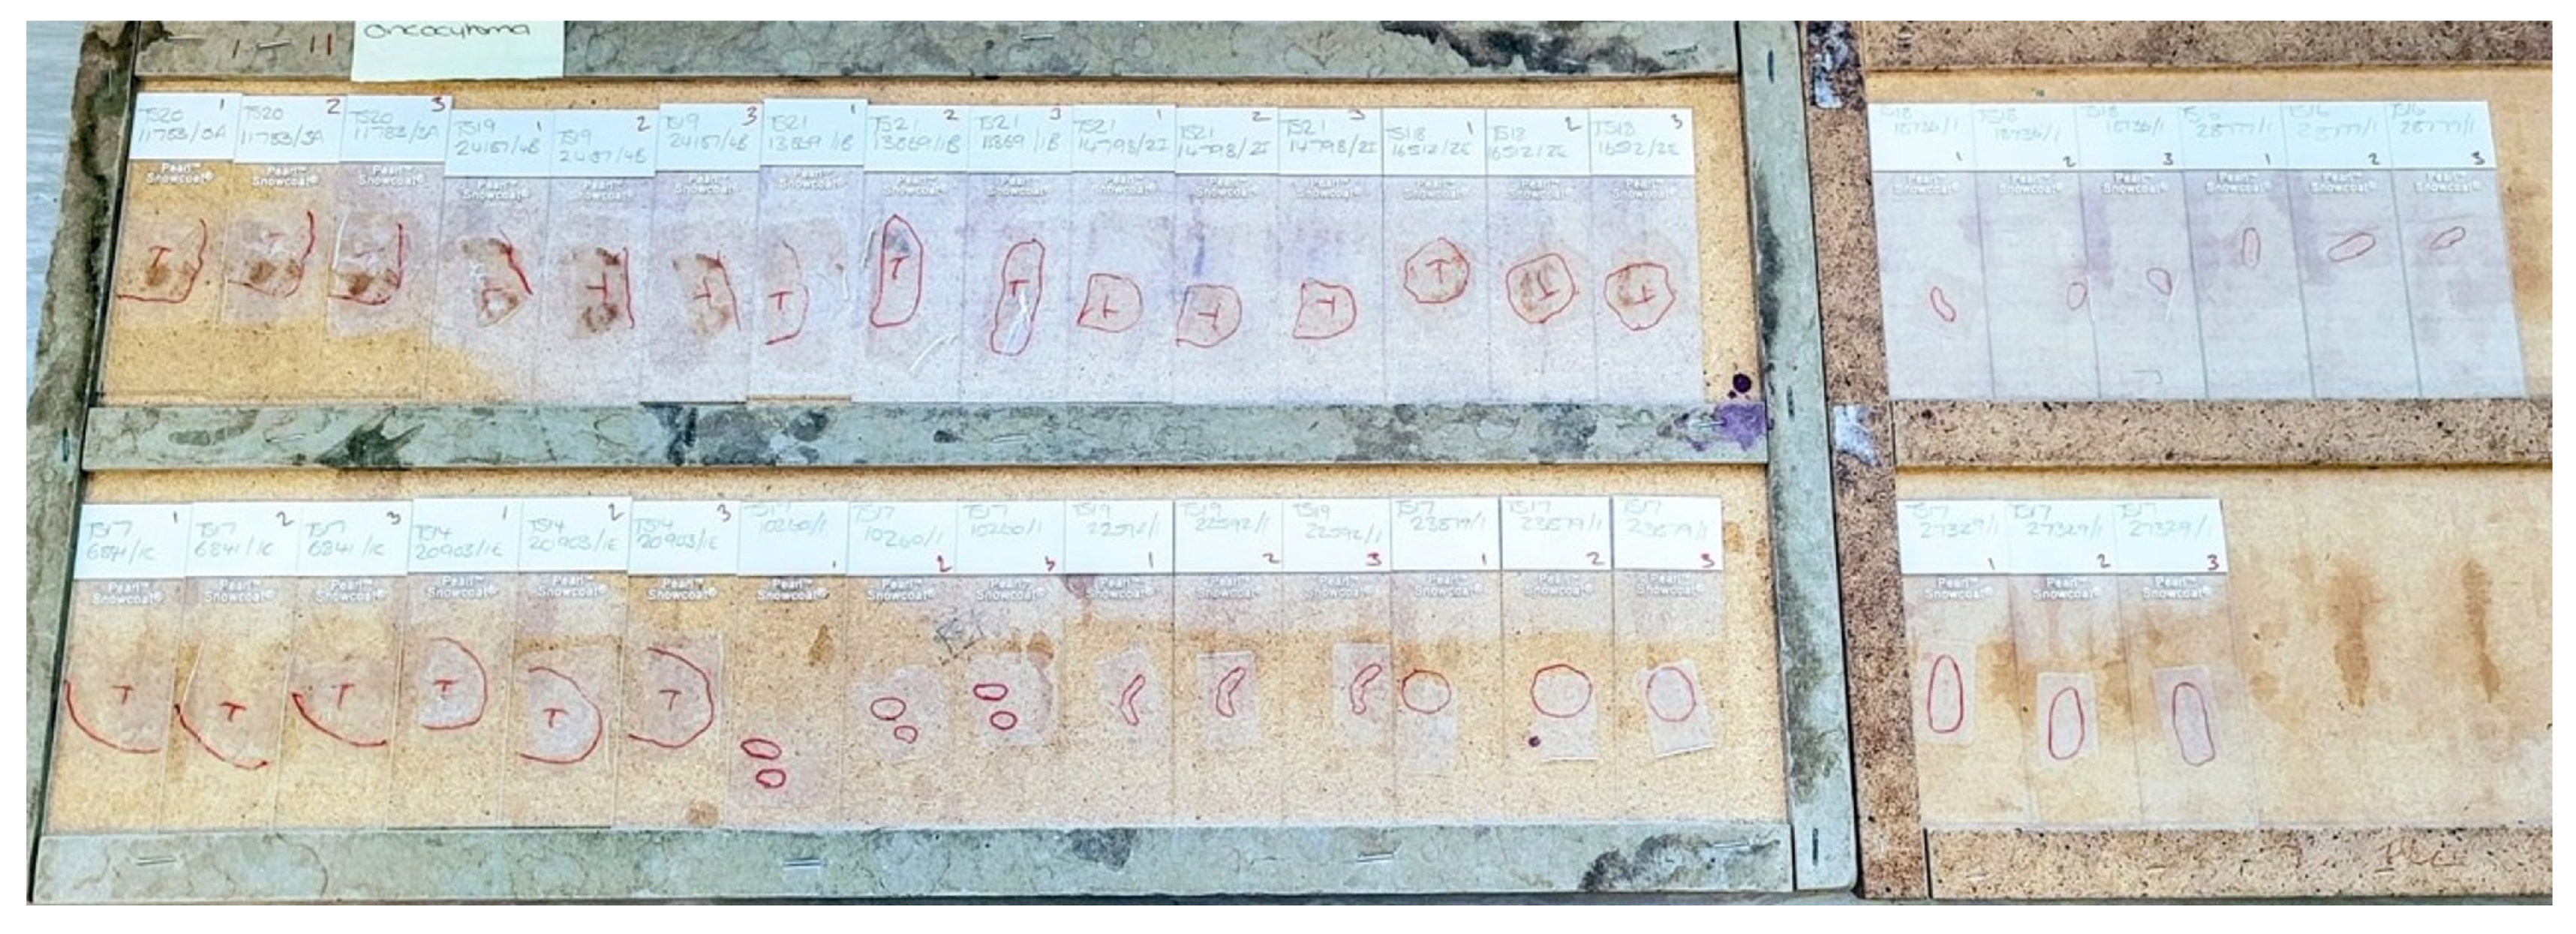
Appendix A.2.2. (DNA Extraction)
- -
- FFPE tissue samples (of volume 2.0 mm3).
- -
- Maxwell RSC DNA FFPE Kit
- -
- Micro-centrifuge
- -
- Vortex
- -
- Razor blades
- -
- Micro-tubes (1.5-2.0ml)
- -
- Pipettors and pipette tips
- -
- Heating blocks
- -
- Deionised or nuclease free water
- -
- Fresh-frozen tissue samples (of volume 2.0 mm3).
- -
- Vortex
- -
- Pipettors and pipette
- -
- Micro-tubes
- -
- Dry heat block
- -
- Deionised or nuclease free water
- -
- 1x Phosphate-buffered saline
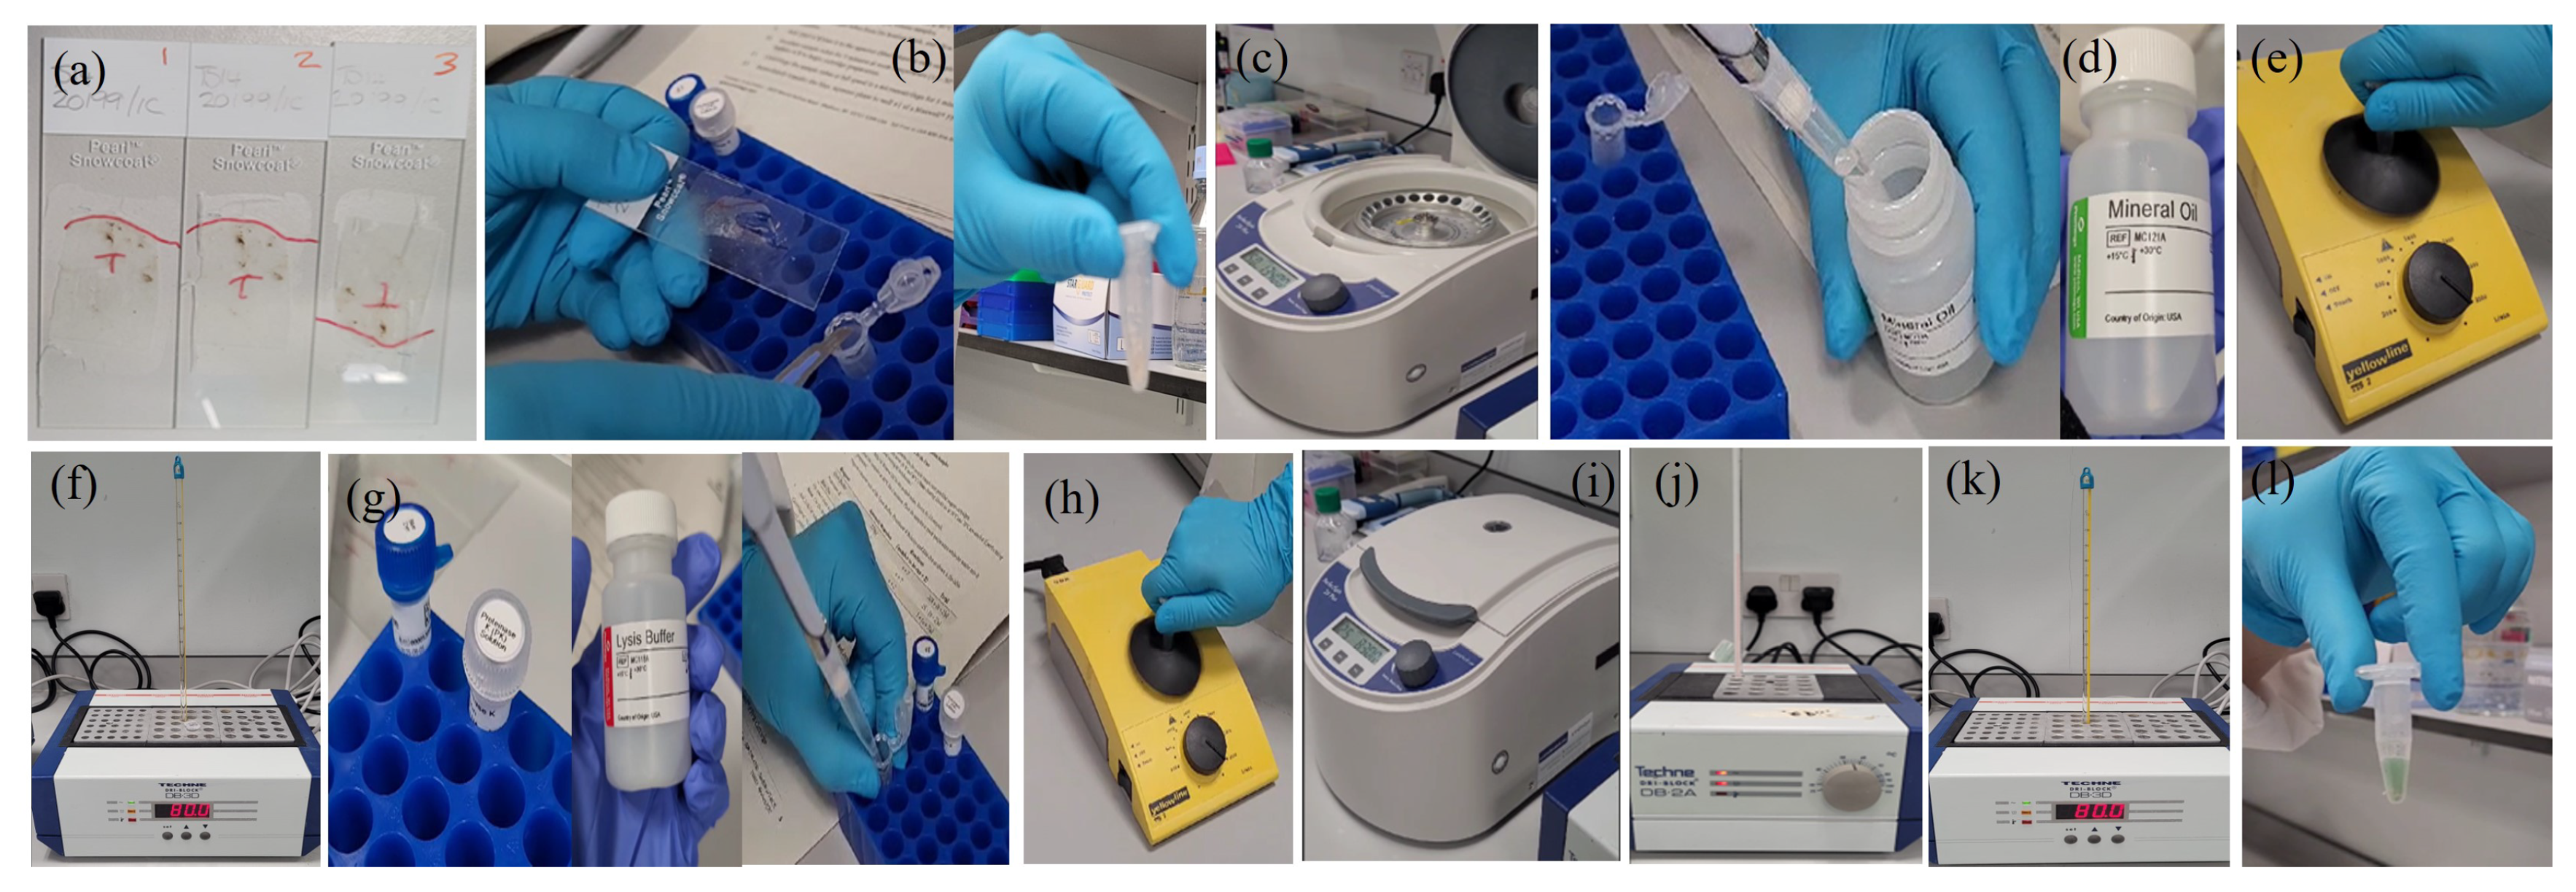
Appendix A.2.3. (Maxwell Instrument Run)


Appendix A.2.4. (BeadChip DNA assay)
| Feature | Description |
|---|---|
| Species | Human |
| No. of samples per BeadChip | 8 |
| DNA input requirement | 200 ng |
| Assay chemistry | Infinium HD Super |
| SNP replicates | 15× |
| No. of SNPs to call CNV | 10 |
| Instrument support | iScan System |
| Total no. of markers | 848,902 |
| Sample throughput per week | 960 |
| Scan time per sample | 5 min |
| Data performance | iScan System |
| Call rate | 99.89% |
| Reproducibility | 99.99% |
| Log R deviation | 0.0929 |
| Marker categories | No. of markers (iScan System) |
|---|---|
| Total no. of markers | 848,902 |
| RefSeq genes | 467,422 |
| RefSeq +/- 10 kb | 541,515 |
| ADME genes | 15,153 |
| ADME +/- 10 kb | 18,590 |
| COSMIC genes | 418,131 |
| HLA markers | 5145 |
| HLA genes | 276 |
| GO genes | 137,873 |
| Exonic regions | 68,801 |
| Promoter regions | 26,814 cont.. |
| X chromosome markers | 29,894 |
| Y chormosome marker | 1197 |
| PAR/homologous markers | 728 |
Appendix A.2.5. (DNA Amplification)
- -
- 0.1 N NaOH
- -
- DNA samples (50 ng/l)
- -
- MA1
- -
- MA2
- -
- MSM
- -
- 96-well 0.8 ml midi plate
| Item | Storage | Instructions |
|---|---|---|
| DNA | -25 C to -15 C | Thaw at room temperature |
| MA1 | -25 C to -15 C | Thaw at room temperature, invert 10 times to mix, and then pulse centrifuge |
| MA2 | -25 C to -15 C | Thaw at room temperature, invert 10 times to mix, and then pulse centrifuge |
| MSM | -25 C to -15 C | Thaw at room temperature, invert 10 times to mix, and then pulse centrifuge |

Appendix A.2.6. (DNA Fragmentation)
- -
- FMS (1 tube/ can hold 96 samples( we have 19 samples))
| Item | Storage | Instructions |
|---|---|---|
| FMS | -25 C to -15 C | Thaw at room temperature, invert 10 times to mix, and then pulse centrifuge. |
Appendix A.2.7. (DNA Precipitation)
- -
- 100% 2-propanol
- -
- PM1
| Item | Storage | Instructions |
|---|---|---|
| PM1 | -25 C to -15 C | Thaw at room temperature, invert 10 times to mix. |

Appendix A.2.8. (DNA Resuspension)
- -
- RA1
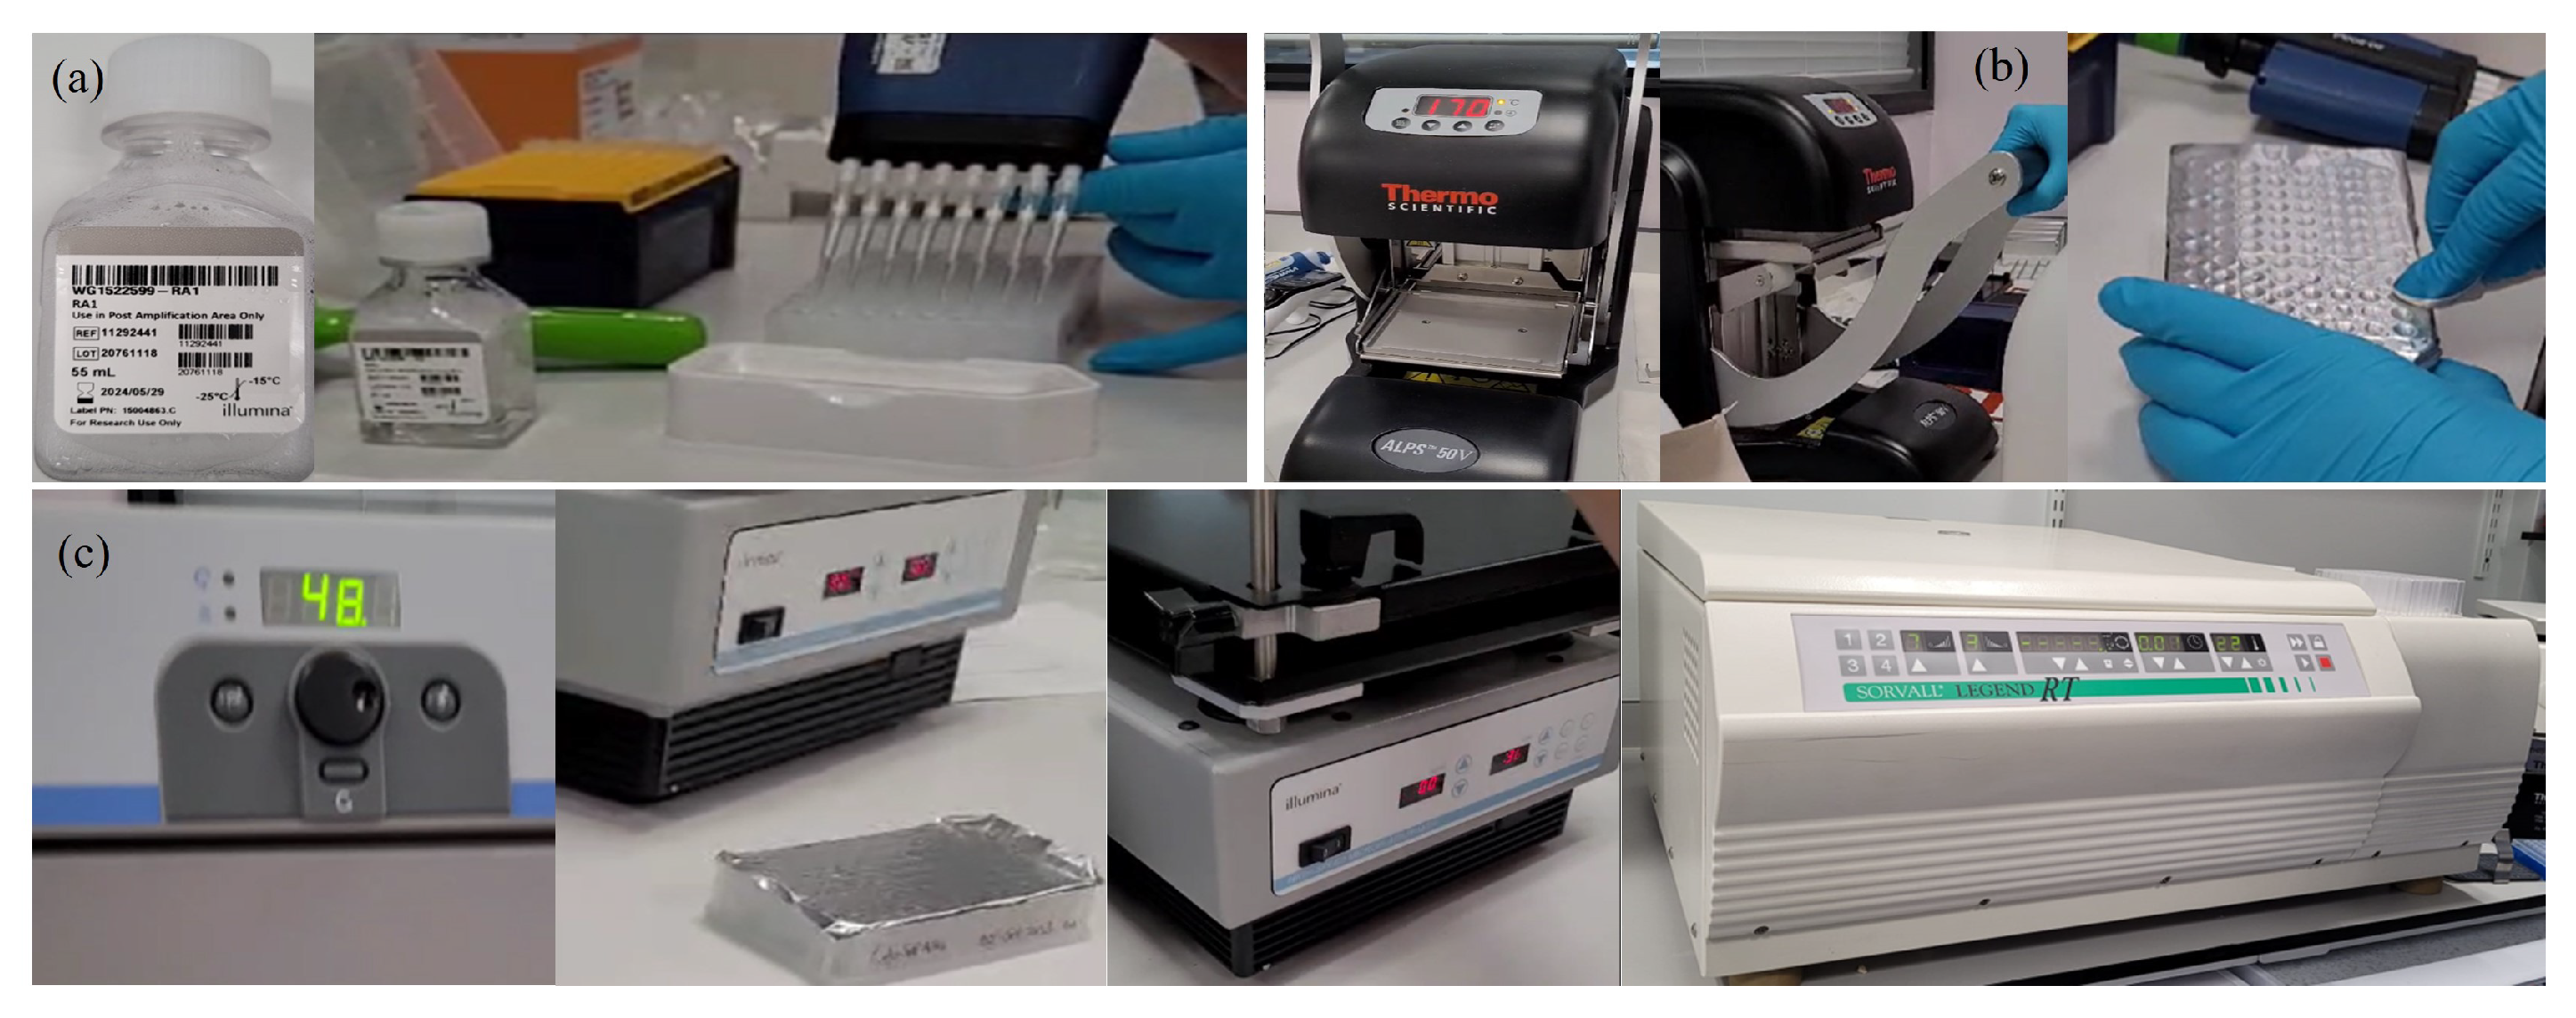
Appendix A.2.9. (DNA Hybridisation to BeadChip)
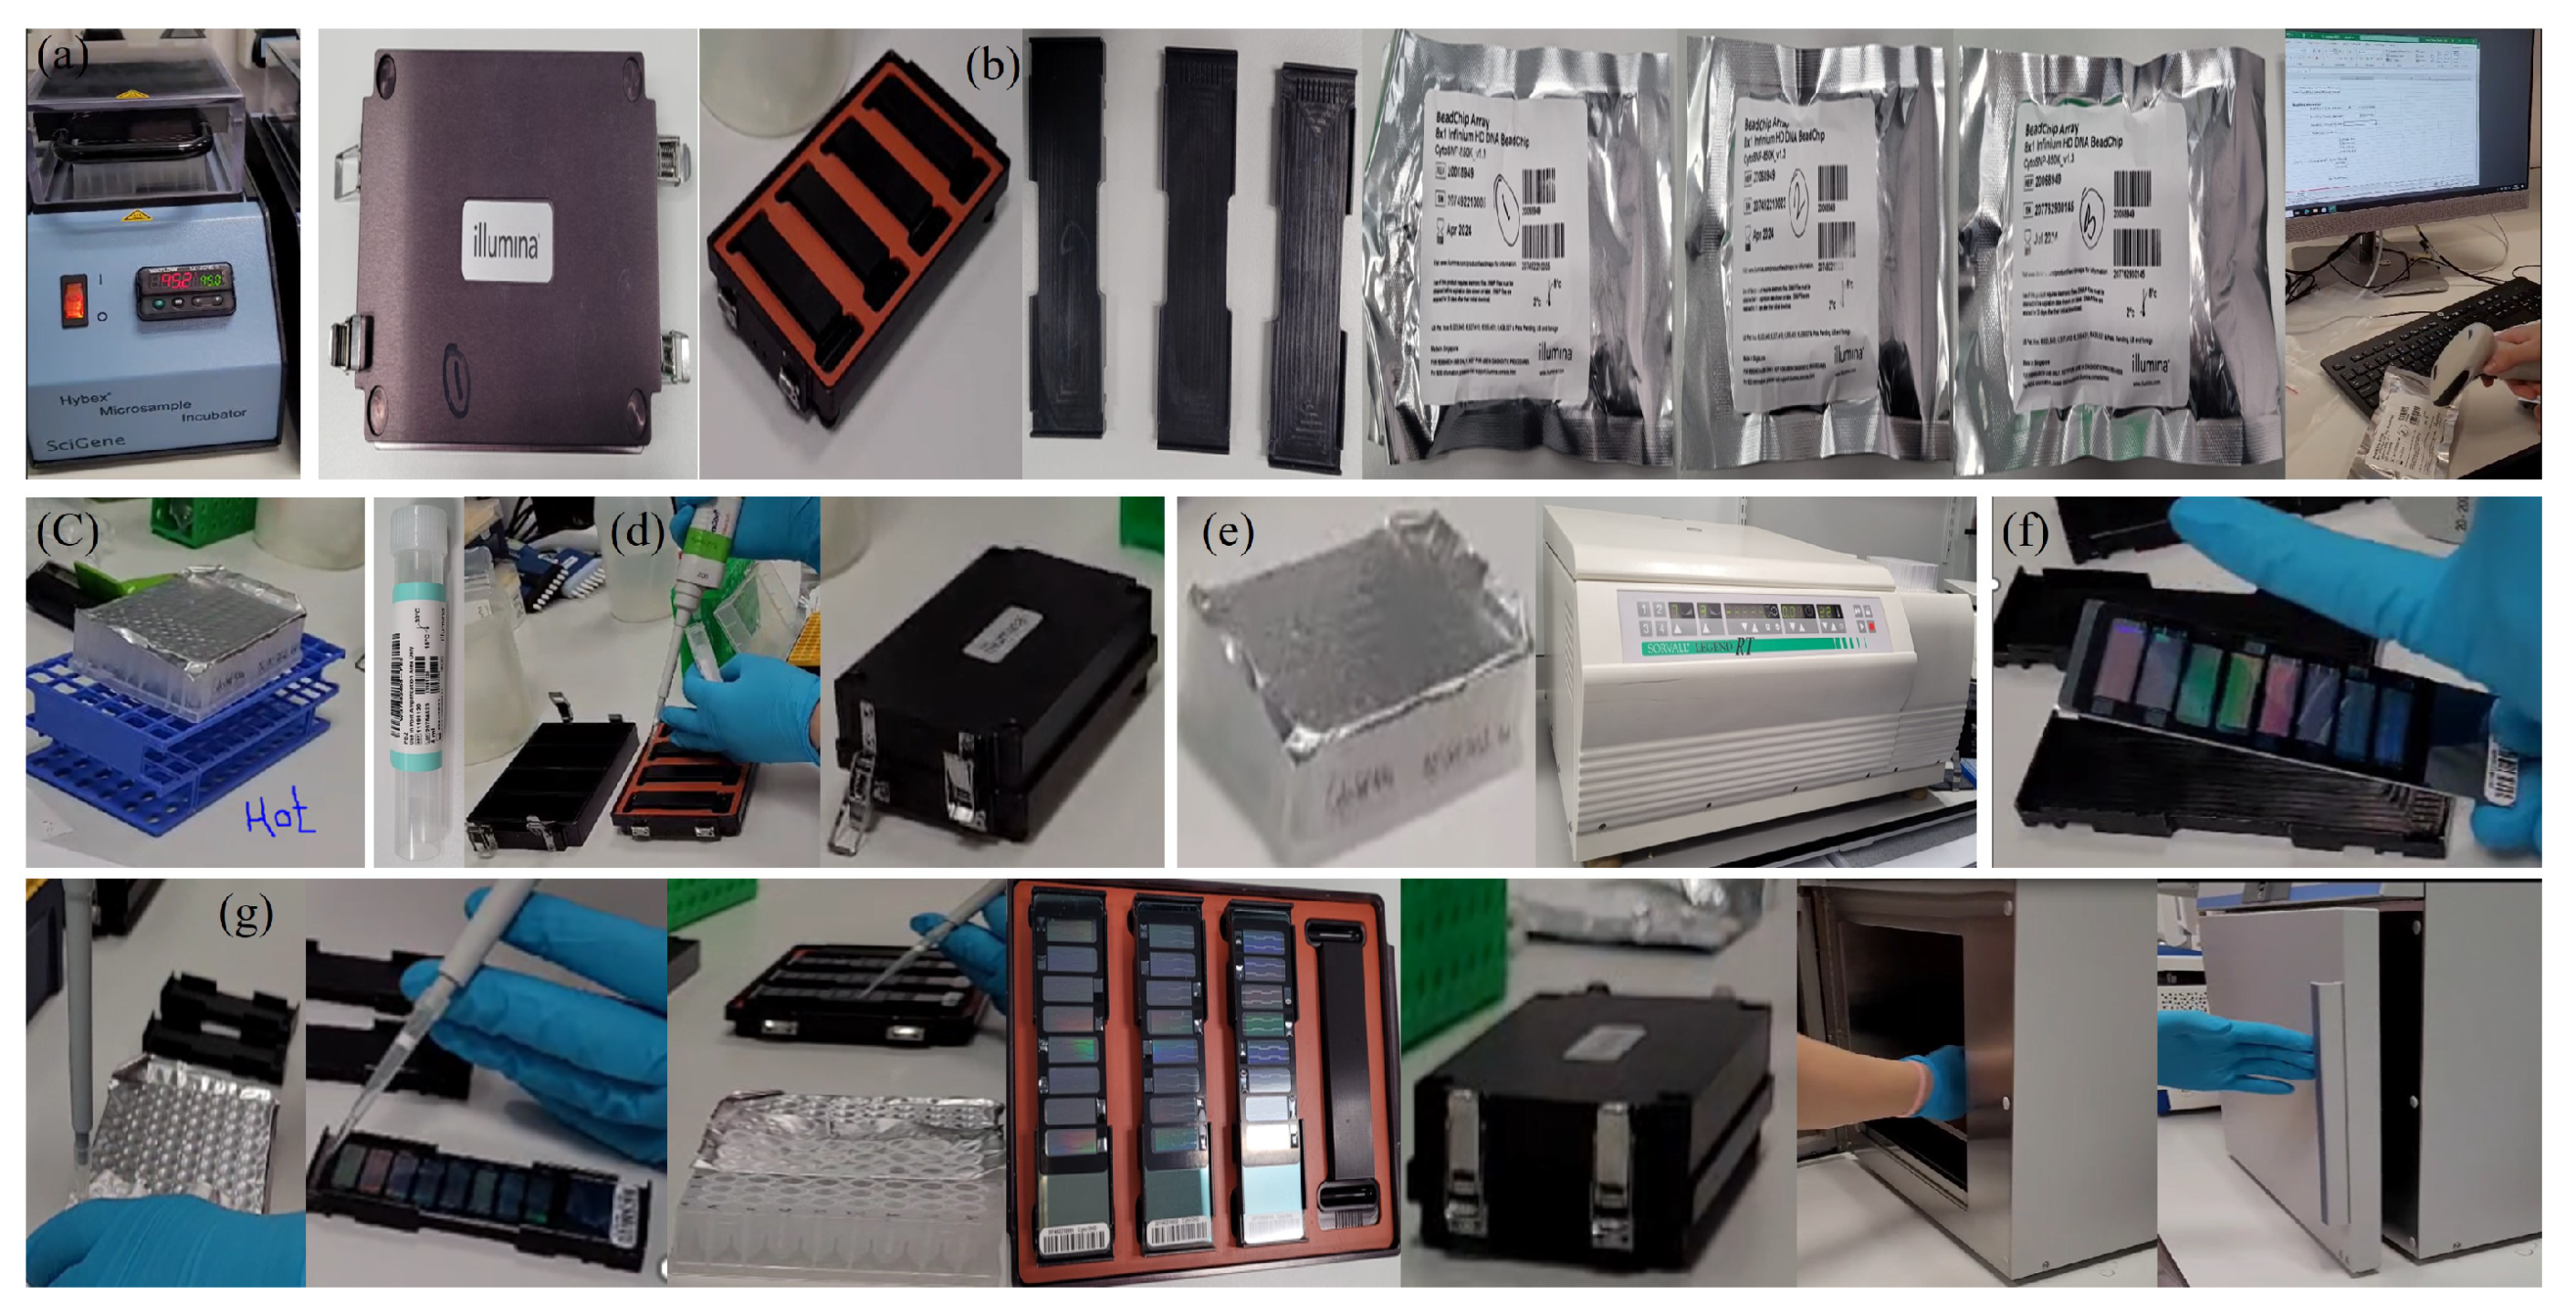
Appendix A.2.10. (Resuspend XC4)
Appendix A.2.11. (Perform Single-Base Extension)
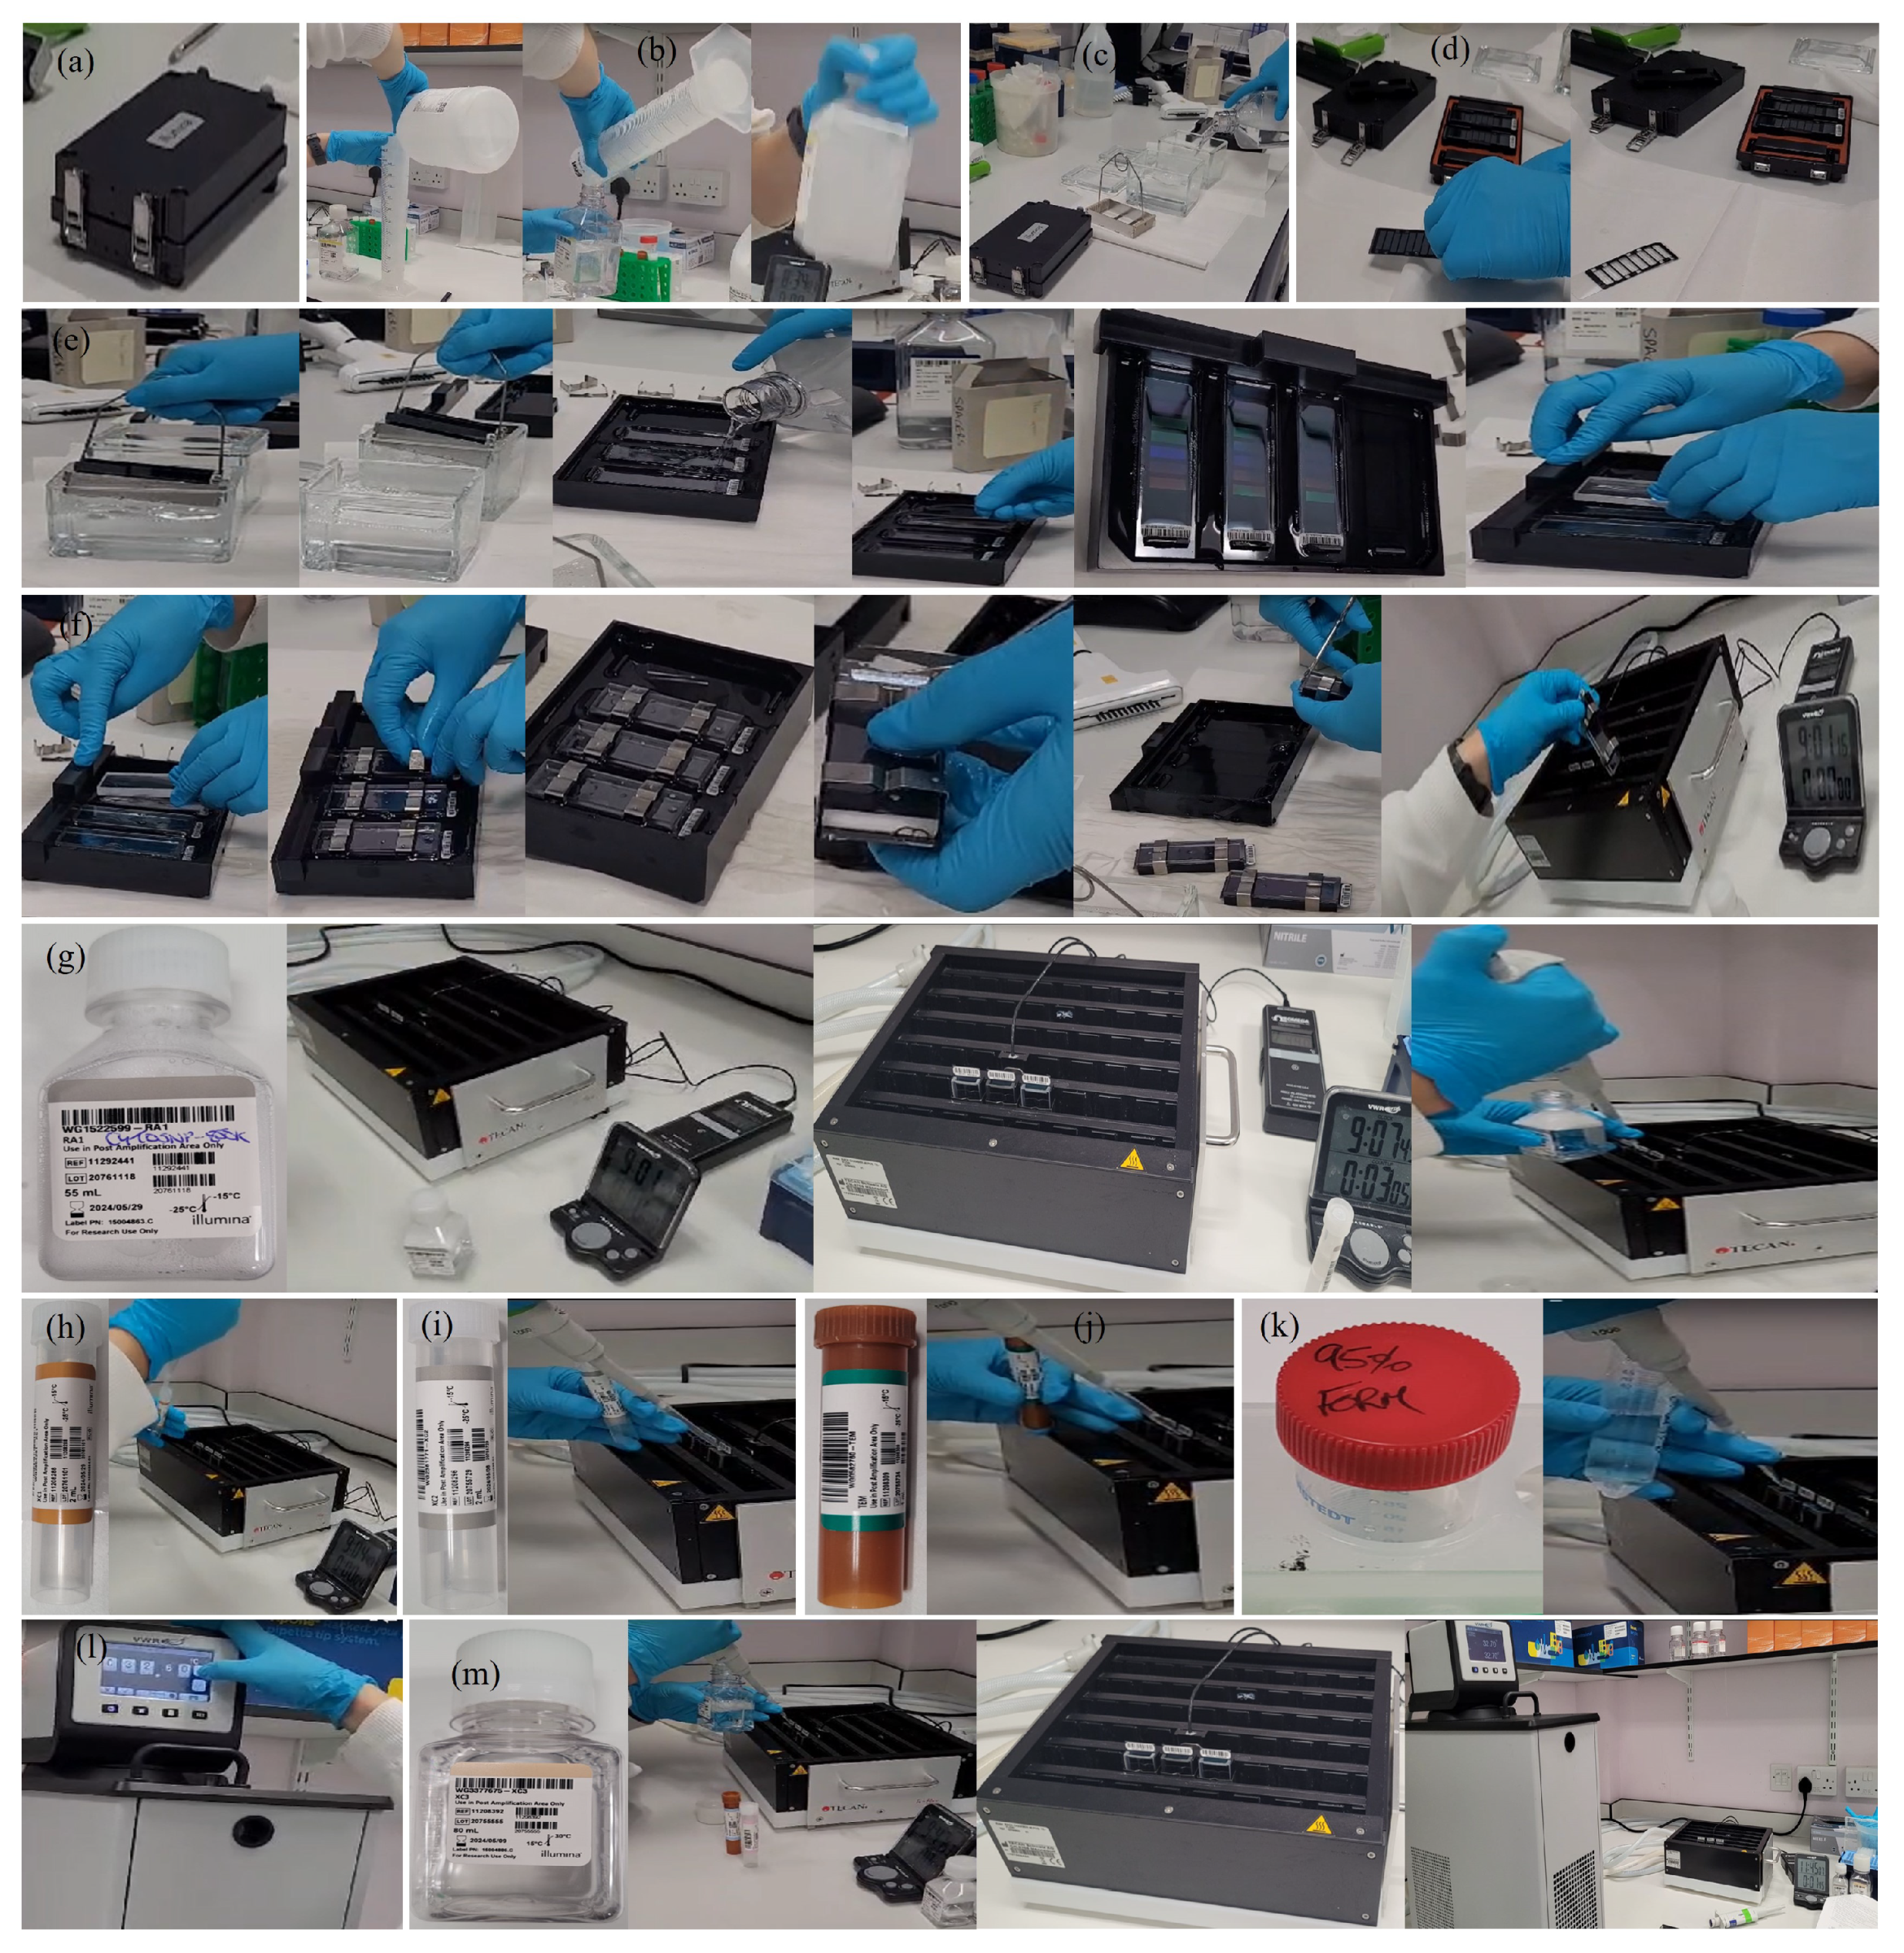
Appendix A.2.12. (Stain BeadChips)
Appendix A.2.13. (Wash and Coat BeadChips)
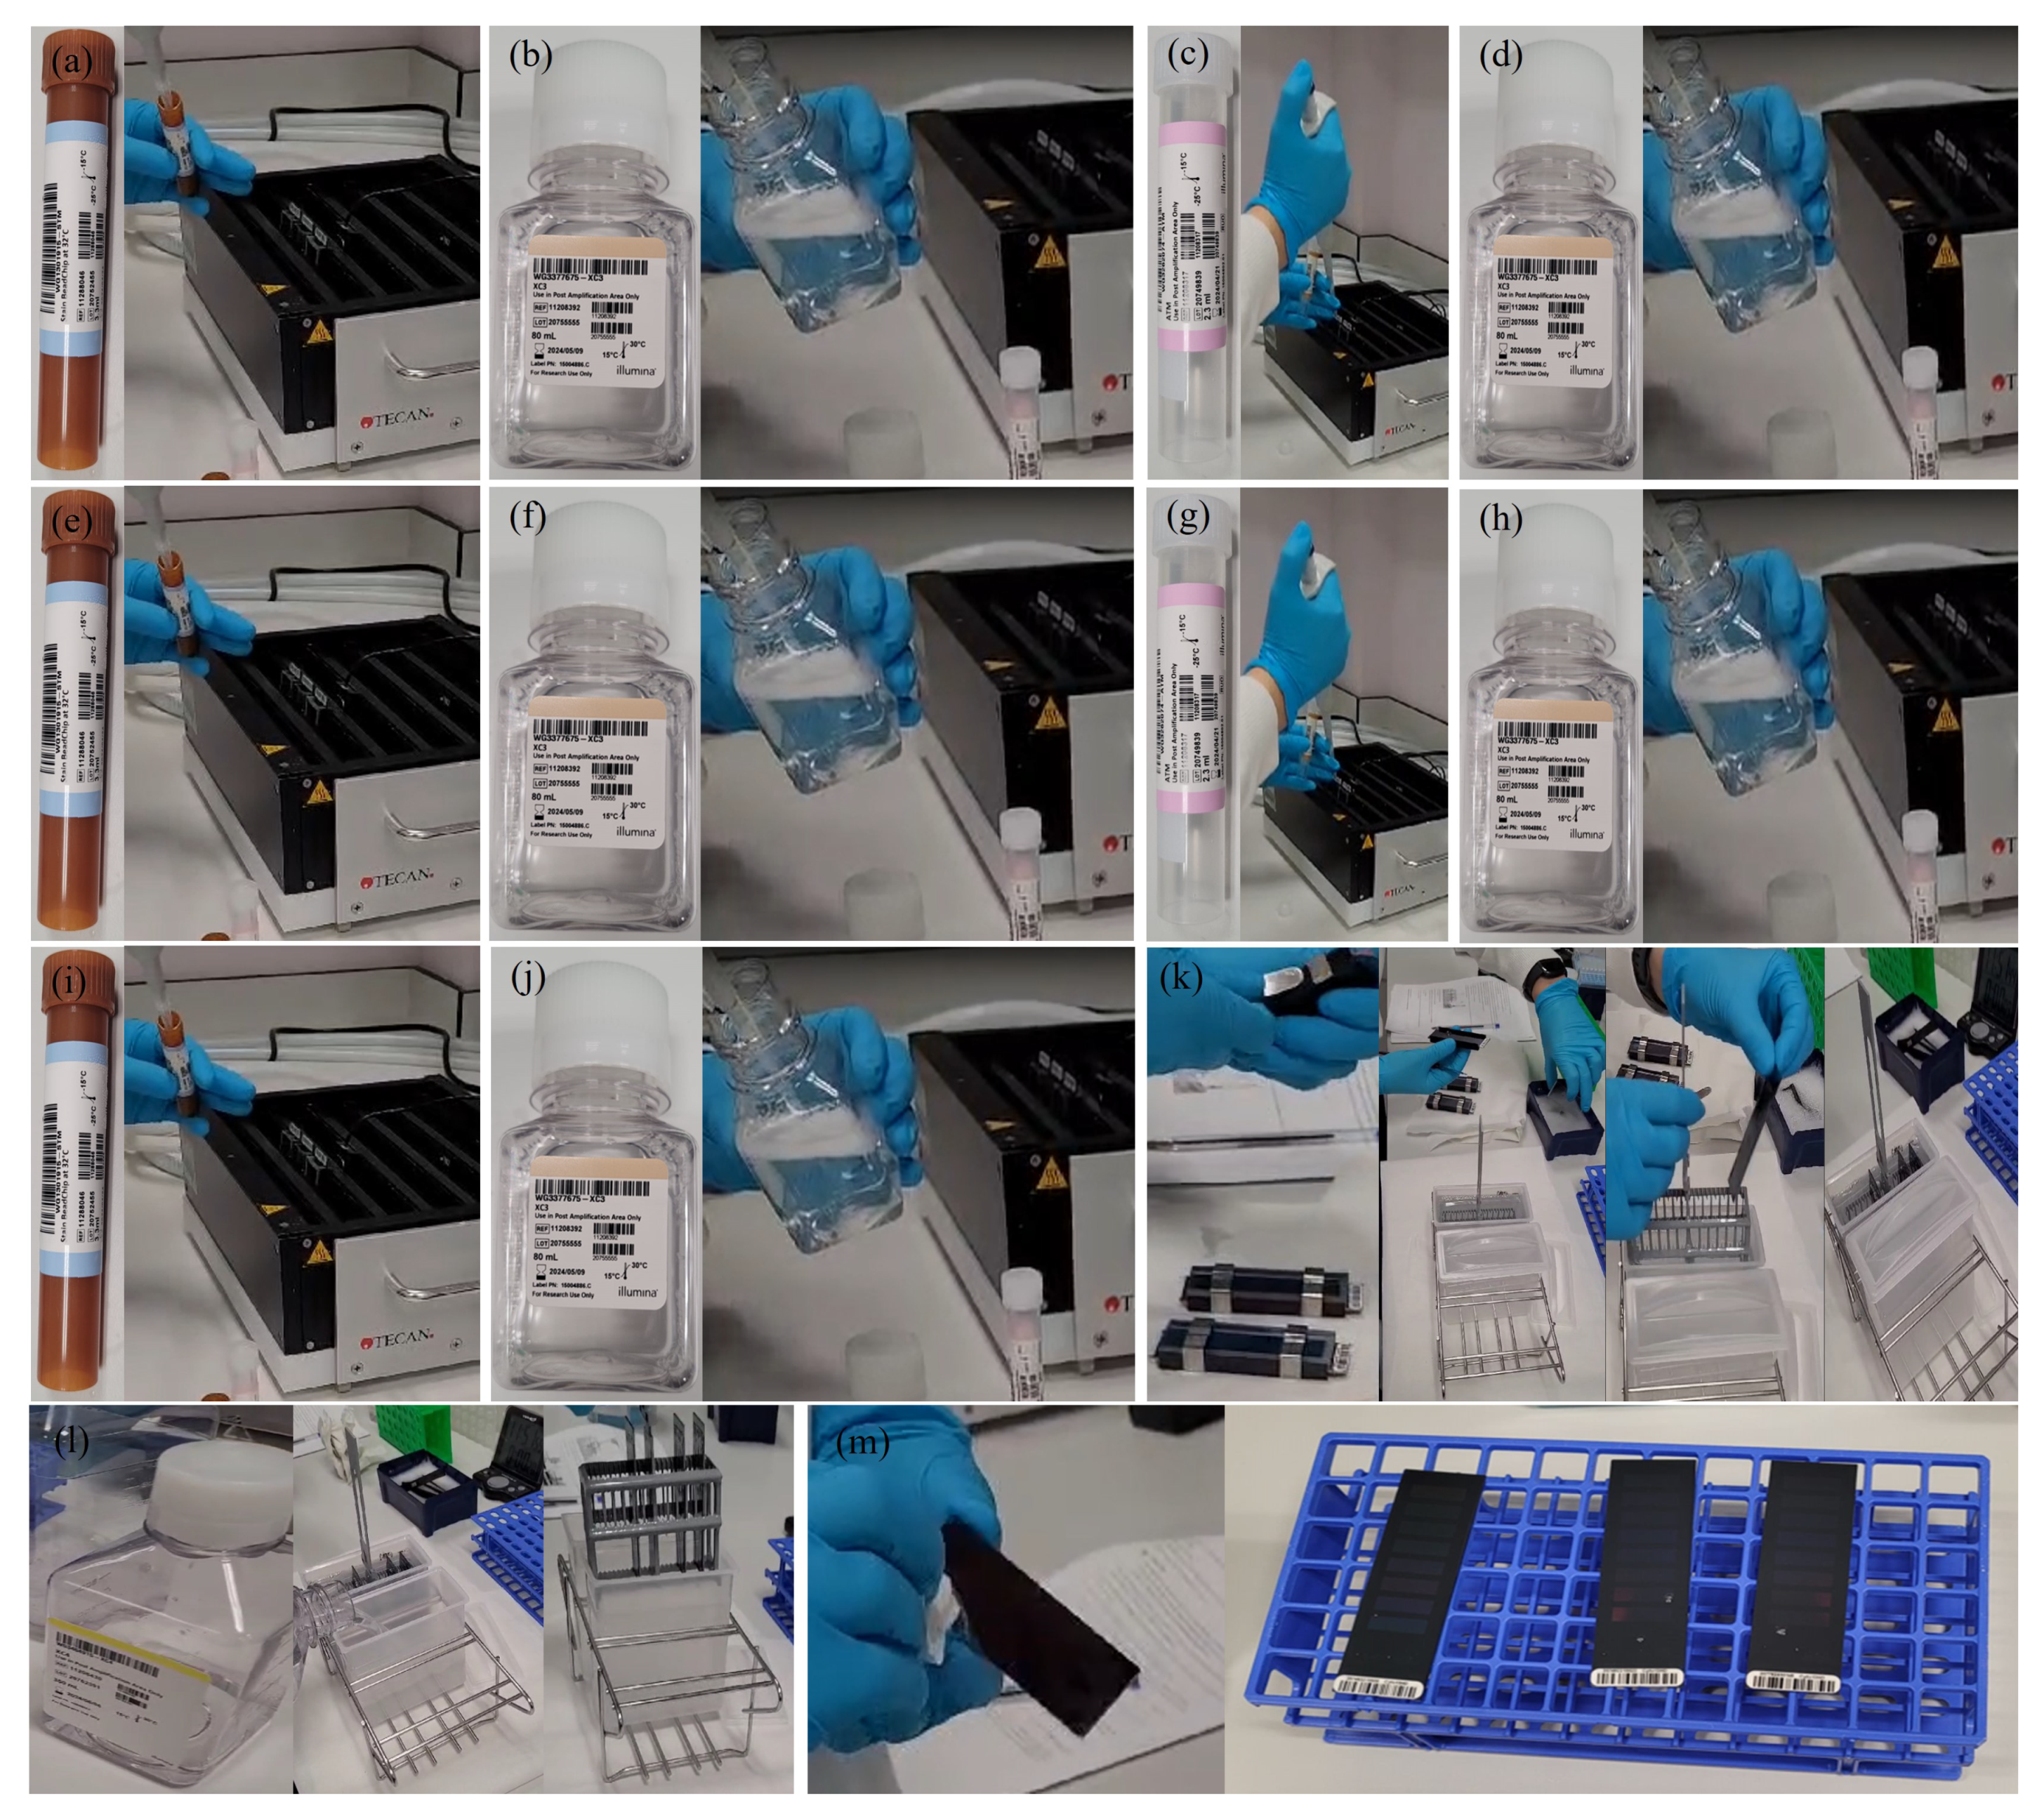
Appendix A.2.14. (Scan and Analyse BeadChips)
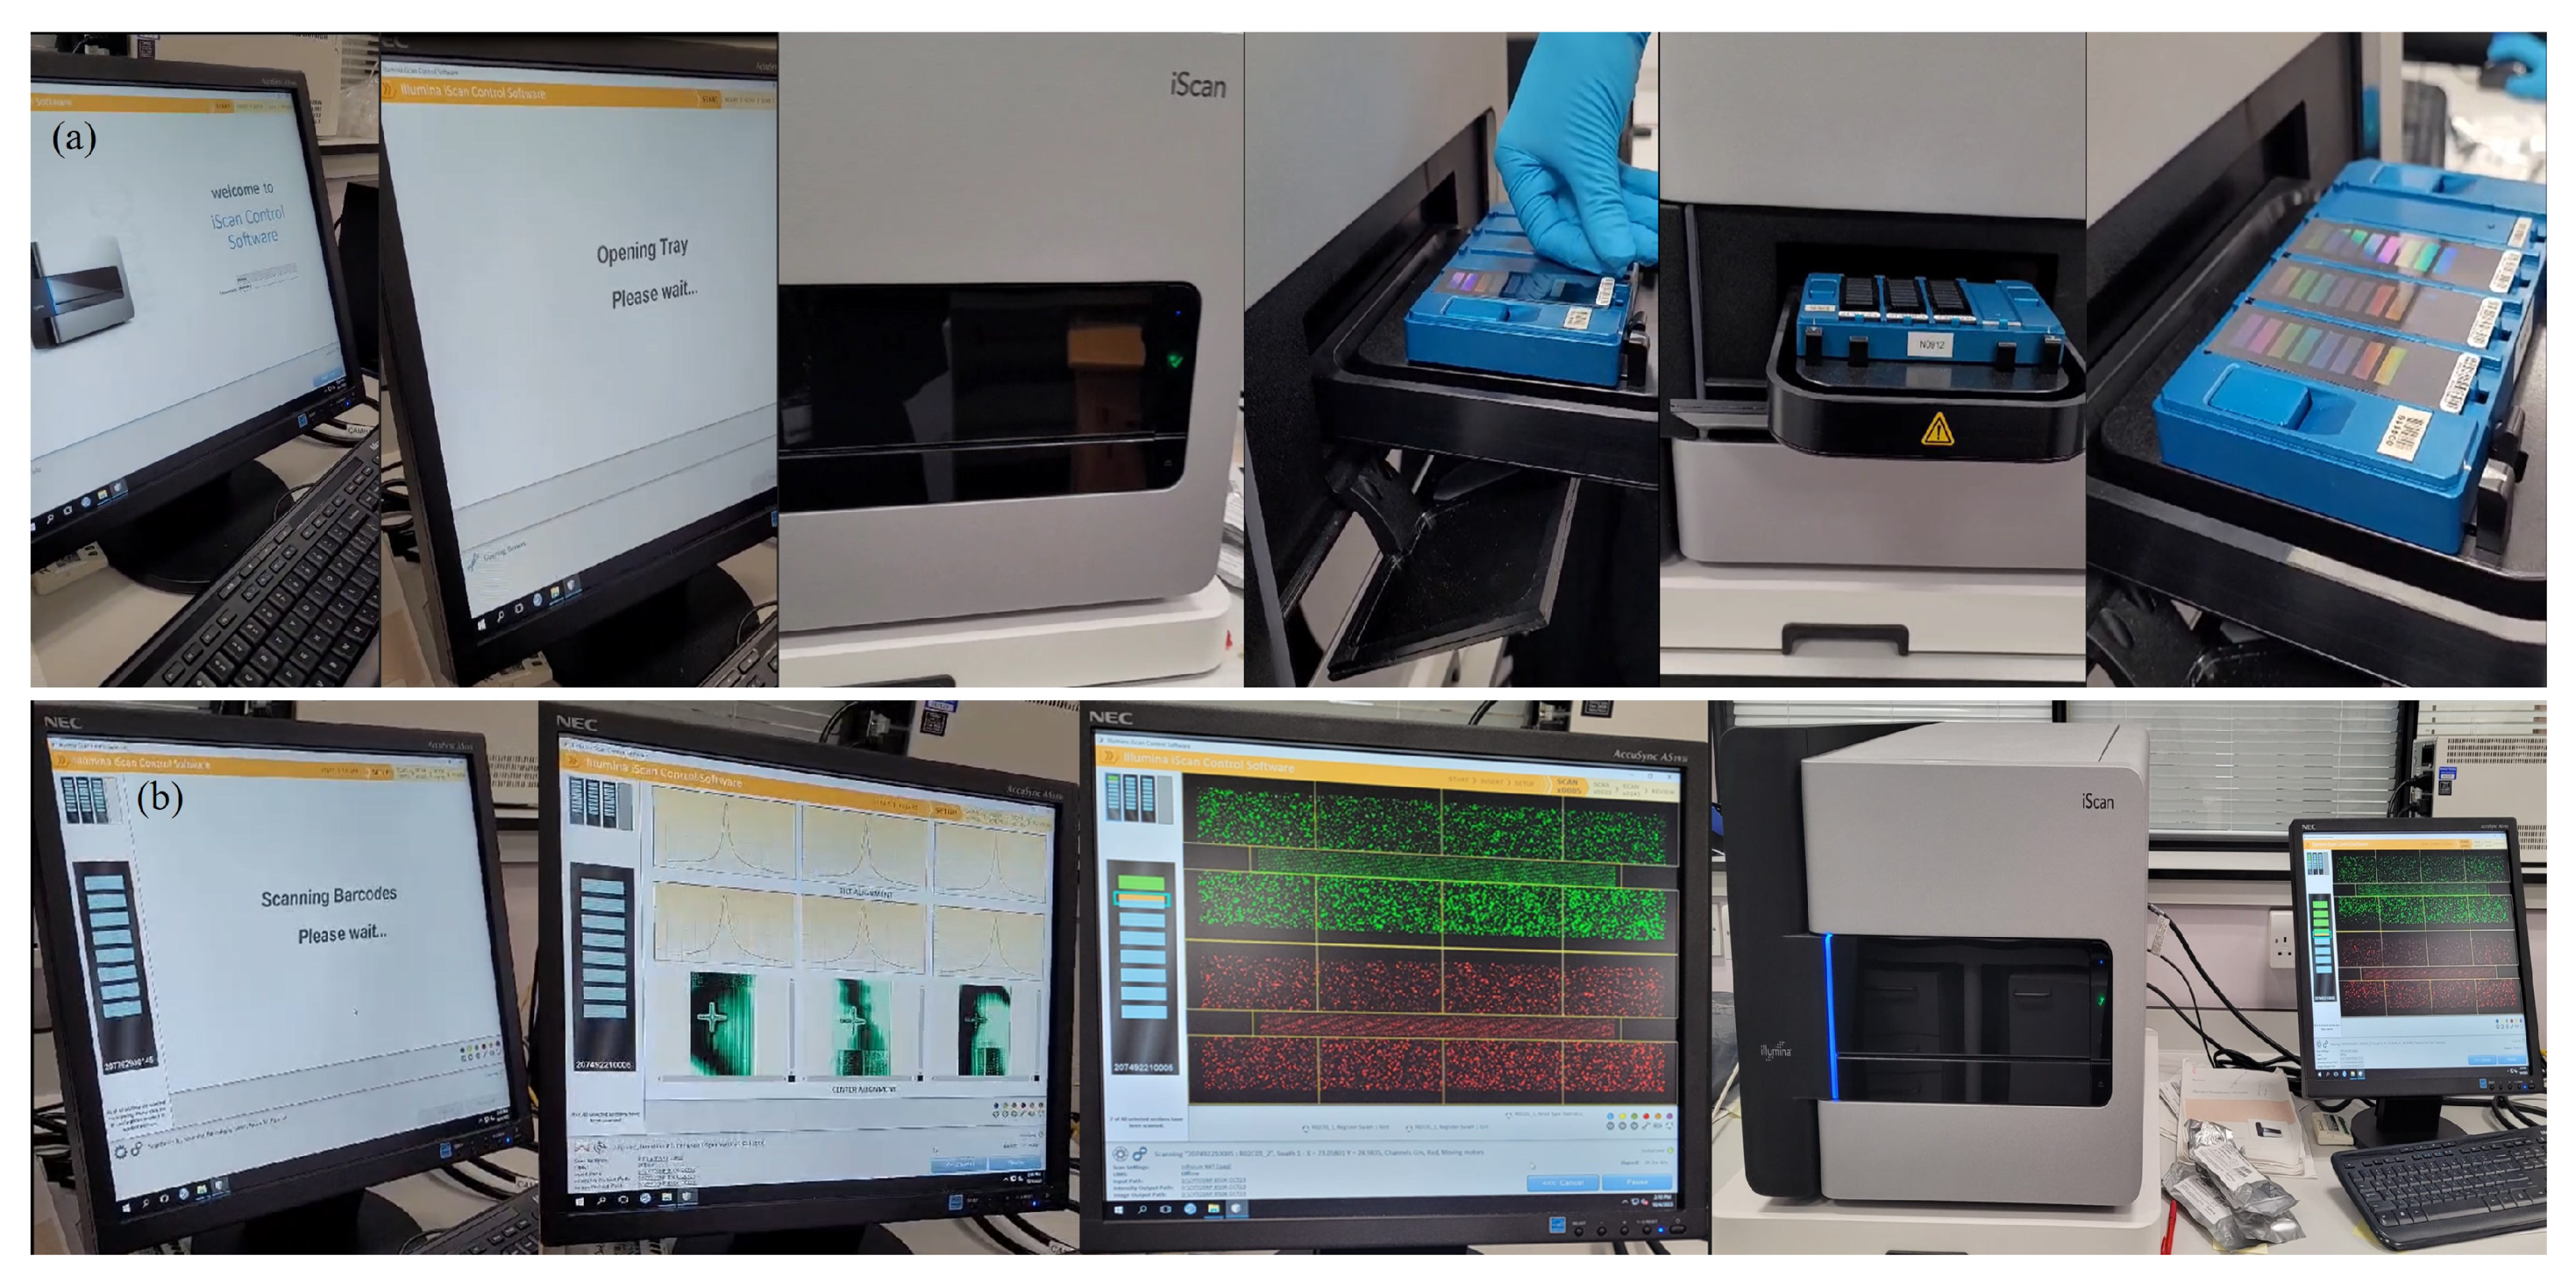
Appendix A.2.15. (SNP-based Microarrays: A Simple Summary for Non-specialists)
References
- Raman, S.P.; Johnson, P.T.; Allaf, M.E.; Netto, G.; Fishman, E.K. Chromophobe renal cell carcinoma: multiphase MDCT enhancement patterns and morphologic features. American Journal of Roentgenology 2013, 201, 1268–1276. [Google Scholar] [CrossRef] [PubMed]
- Wobker, S.E.; Williamson, S.R. Modern pathologic diagnosis of renal oncocytoma. Journal of kidney cancer and VHL 2017, 4, 1. [Google Scholar] [CrossRef] [PubMed]
- Choudhary, S.; Rajesh, A.; Mayer, N.; Mulcahy, K.; Haroon, A. Renal oncocytoma: CT features cannot reliably distinguish oncocytoma from other renal neoplasms. Clinical radiology 2009, 64, 517–522. [Google Scholar] [CrossRef] [PubMed]
- Rosenkrantz, A.B.; Hindman, N.; Fitzgerald, E.F.; Niver, B.E.; Melamed, J.; Babb, J.S. MRI features of renal oncocytoma and chromophobe renal cell carcinoma. American Journal of Roentgenology 2010, 195, W421–W427. [Google Scholar] [CrossRef]
- Wu, J.; Zhu, Q.; Zhu, W.; Chen, W.; Wang, S. Comparative study of CT appearances in renal oncocytoma and chromophobe renal cell carcinoma. Acta Radiologica 2016, 57, 500–506. [Google Scholar] [CrossRef]
- Saha, A.; Harowicz, M.R.; Grimm, L.J.; Kim, C.E.; Ghate, S.V.; Walsh, R.; Mazurowski, M.A. A machine learning approach to radiogenomics of breast cancer: a study of 922 subjects and 529 DCE-MRI features. British journal of cancer 2018, 119, 508–516. [Google Scholar] [CrossRef]
- Tamez-Pena, J.G.; Rodriguez-Rojas, J.A.; Gomez-Rueda, H.; Celaya-Padilla, J.M.; Rivera-Prieto, R.A.; Palacios-Corona, R.; Garza-Montemayor, M.; Cardona-Huerta, S.; Treviño, V. Radiogenomics analysis identifies correlations of digital mammography with clinical molecular signatures in breast cancer. PloS one 2018, 13, e0193871. [Google Scholar] [CrossRef]
- Lambin, P.; Rios-Velazquez, E.; Leijenaar, R.; Carvalho, S.; Van Stiphout, R.G.; Granton, P.; Zegers, C.M.; Gillies, R.; Boellard, R.; Dekker, A.; et al. Radiomics: extracting more information from medical images using advanced feature analysis. European journal of cancer 2012, 48, 441–446. [Google Scholar] [CrossRef]
- Zhao, M.; Wang, Q.; Wang, Q.; Jia, P.; Zhao, Z. Computational tools for copy number variation (CNV) detection using next-generation sequencing data: features and perspectives. BMC bioinformatics 2013, 14, S1. [Google Scholar] [CrossRef]
- Pinto, D.; Darvishi, K.; Shi, X.; Rajan, D.; Rigler, D.; Fitzgerald, T.; Lionel, A.C.; Thiruvahindrapuram, B.; MacDonald, J.R.; Mills, R.; et al. Comprehensive assessment of array-based platforms and calling algorithms for detection of copy number variants. Nature biotechnology 2011, 29, 512–520. [Google Scholar] [CrossRef]
- Zhang, F.; Gu, W.; Hurles, M.E.; Lupski, J.R. Copy number variation in human health, disease, and evolution. Annual review of genomics and human genetics 2009, 10, 451–481. [Google Scholar] [CrossRef] [PubMed]
- Redon, R.; Ishikawa, S.; Fitch, K.R.; Feuk, L.; Perry, G.H.; Andrews, T.D.; Fiegler, H.; Shapero, M.H.; Carson, A.R.; Chen, W.; et al. Global variation in copy number in the human genome. nature 2006, 444, 444–454. [Google Scholar] [CrossRef] [PubMed]
- Balagué-Dobón, L.; Cáceres, A.; González, J.R. Fully exploiting SNP arrays: a systematic review on the tools to extract underlying genomic structure. Briefings in bioinformatics 2022, 23, bbac043. [Google Scholar] [CrossRef] [PubMed]
- Interpreting Infinium Assay Data for Whole-Genome Structural Variation. 2024. Available online: https://www.illumina.com/Documents/products/technotes/technote_cytoanalysis.pdf accessed (accessed on 18 July 2024).
- DNA Copy Number and Loss of Heterozygosity Analysis Algorithms. 2024. Available online: https://www.illumina.com/documents/products/technotes/technote_cnv_algorithms.pdf accessed (accessed on 18 July 2024).
- Karlo, C.A.; Di Paolo, P.L.; Chaim, J.; Hakimi, A.A.; Ostrovnaya, I.; Russo, P.; Hricak, H.; Motzer, R.; Hsieh, J.J.; Akin, O. Radiogenomics of clear cell renal cell carcinoma: associations between CT imaging features and mutations. Radiology 2014, 270, 464–471. [Google Scholar] [CrossRef]
- Ferro, M.; Musi, G.; Marchioni, M.; Maggi, M.; Veccia, A.; Del Giudice, F.; Barone, B.; Crocetto, F.; Lasorsa, F.; Antonelli, A.; et al. Radiogenomics in renal cancer management—current evidence and future prospects. International journal of molecular sciences 2023, 24, 4615. [Google Scholar] [CrossRef]
- Posada Calderon, L.; Eismann, L.; Reese, S.W.; Reznik, E.; Hakimi, A.A. Advances in imaging-based biomarkers in renal cell carcinoma: a critical analysis of the current literature. Cancers 2023, 15, 354. [Google Scholar] [CrossRef]
- Tayside Biorepository. 2022. Available online: https://www.tissuebank.dundee.ac.uk accessed (accessed on 27 April 2024).
- Yap, F.Y.; Varghese, B.A.; Cen, S.Y.; Hwang, D.H.; Lei, X.; Desai, B.; Lau, C.; Yang, L.L.; Fullenkamp, A.J.; Hajian, S.; et al. Shape and texture-based radiomics signature on CT effectively discriminates benign from malignant renal masses. European Radiology 2021, 31, 1011–1021. [Google Scholar] [CrossRef]
- Yi, X.; Xiao, Q.; Zeng, F.; Yin, H.; Li, Z.; Qian, C.; Wang, C.; Lei, G.; Xu, Q.; Li, C.; et al. Computed tomography radiomics for predicting pathological grade of renal cell carcinoma. Frontiers in oncology 2021, 10, 570396. [Google Scholar] [CrossRef]
- Alhussaini, A.J.; Steele, J.D.; Nabi, G. Comparative Analysis for the Distinction of Chromophobe Renal Cell Carcinoma from Renal Oncocytoma in Computed Tomography Imaging Using Machine Learning Radiomics Analysis. Cancers 2022, 14, 3609. [Google Scholar] [CrossRef]
- Yeap, P.L.; Wong, Y.M.; Ong, A.L.K.; Tuan, J.K.L.; Pang, E.P.P.; Park, S.Y.; Lee, J.C.L.; Tan, H.Q. Predicting dice similarity coefficient of deformably registered contours using Siamese neural network. Physics in Medicine & Biology 2023, 68, 155016. [Google Scholar]
- Python Release Python 3.6.0. Available online: https://www.python.org/downloads/release/python-360/ accessed (accessed on 29 January 2021).
- Van Griethuysen, J.J.; Fedorov, A.; Parmar, C.; Hosny, A.; Aucoin, N.; Narayan, V.; Beets-Tan, R.G.; Fillion-Robin, J.C.; Pieper, S.; Aerts, H.J. Computational radiomics system to decode the radiographic phenotype. Cancer research 2017, 77, e104–e107. [Google Scholar] [CrossRef] [PubMed]
- Infinium CytoSNP-850K BeadChip Assay Reference Guide. 2023. Available online: https://support.illumina.com/ko-kr/downloads/infinium-cytosnp-850k-reference-guide-15046990.html accessed (accessed on 27 April 2023).
- GenomeStudio Software Downloads. 2024. Available online: https://support.illumina.com/array/array_software/genomestudio/downloads.html (accessed on 27 February 2024).
- GenomeStudio 2.0 Plug-ins. 2024. Available online: https://support.illumina.com/downloads/genomestudio-2-0-plug-ins.html (accessed on 7 February 2024).
- Microarray General Reference Materials. 2024. Available online: https://knowledge.illumina.com/microarray/general/microarray-general-reference_material-list/000002766 (accessed on 21 March 2024).
- PennCNV: Copy Number Variation (CNV) detection from SNP genotyping arrays. 2024. Available online: https://hpc.nih.gov/apps/PennCNV.html (accessed on 18 July 2024).
- International Standards for Cytogenomic Arrays. 2024. Available online: https://www.ncbi.nlm.nih.gov/projects/gap/cgi-bin/study.cgi?study_id=phs000205.v2.p1 (accessed on 21 March 2024).
- Gurbich, T.A.; Ilinsky, V.V. ClassifyCNV: a tool for clinical annotation of copy-number variants. Scientific reports 2020, 10, 20375. [Google Scholar] [CrossRef] [PubMed]
- National Center for Biotechnology Information (NCBI)-nstd102 - Clinical Structural Variants. 2024. Available online: https://www.ncbi.nlm.nih.gov/dbvar/studies/nstd102 (accessed on 21 March 2024).
- Database of Genomic Variants. 2024. Available online: https://dgv.tcag.ca/dgv/app/home (accessed on 8 April 2024).
- UCSC Genome Browser. 2024. Available online: https://genome.ucsc.edu/ (accessed on 8 April 2024).
- CNV Xplorer. 2024. Available online: https://cnvxplorer.com/ (accessed on 8 April 2024).
- CNV ClinViewer. 2024. Available online: https://cnv-clinviewer.broadinstitute.org/ (accessed on 8 April 2024).
- BEDsect: A Tool for Feature-based Annotations of Genomic Datasets. 2024. Available online: https://imgsb.org/bedsect/ (accessed on 8 April 2024).
- UCSC Genome Browser. Available online: https://genome.ucsc.edu/cgi-bin/hgTables.
- Ng, K.L.; Rajandram, R.; Morais, C.; Yap, N.Y.; Samaratunga, H.; Gobe, G.C.; Wood, S.T. Differentiation of oncocytoma from chromophobe renal cell carcinoma (RCC): can novel molecular biomarkers help solve an old problem? Journal of Clinical Pathology 2014, 67, 97–104. [Google Scholar] [CrossRef] [PubMed]
- Dvorakova, M.; Dhir, R.; Bastacky, S.I.; Cieply, K.M.; Acquafondata, M.B.; Sherer, C.R.; Mercuri, T.L.; Parwani, A.V. Renal oncocytoma: a comparative clinicopathologic study and fluorescent in-situ hybridization analysis of 73 cases with long-term follow-up. Diagnostic pathology 2010, 5, 1–6. [Google Scholar] [CrossRef]
- Vera-Badillo, F.E.; Conde, E.; Duran, I. Chromophobe renal cell carcinoma: a review of an uncommon entity. International Journal of Urology 2012, 19, 894–900. [Google Scholar] [CrossRef]
- Kim, J.K.; Kim, T.K.; Ahn, H.J.; Kim, C.S.; Kim, K.R.; Cho, K.S. Differentiation of subtypes of renal cell carcinoma on helical CT scans. American Journal of Roentgenology 2002, 178, 1499–1506. [Google Scholar] [CrossRef]
- Bird, V.G.; Kanagarajah, P.; Morillo, G.; Caruso, D.J.; Ayyathurai, R.; Leveillee, R.; Jorda, M. Differentiation of oncocytoma and renal cell carcinoma in small renal masses (< 4 cm): the role of 4-phase computerized tomography. World journal of urology 2011, 29, 787–792. [Google Scholar]
- Akın, I.B.; Altay, C.; Güler, E.; Çamlıdağ, İ.; Harman, M.; Danacı, M.; Tuna, B.; Yörükoğlu, K.; Seçil, M. Discrimination of oncocytoma and chromophobe renal cell carcinoma using MRI. Diagnostic and Interventional Radiology 2019, 25, 5. [Google Scholar] [CrossRef]
- Kurup, A.N.; Thompson, R.H.; Leibovich, B.C.; Harmsen, W.S.; Sebo, T.J.; Callstrom, M.R.; Kawashima, A.; Atwell, T.D. Renal oncocytoma growth rates before intervention. BJU international 2012, 110, 1444–1448. [Google Scholar] [CrossRef]
- Chawla, S.N.; Crispen, P.L.; Hanlon, A.L.; Greenberg, R.E.; Chen, D.Y.; Uzzo, R.G. The natural history of observed enhancing renal masses: meta-analysis and review of the world literature. The Journal of urology 2006, 175, 425–431. [Google Scholar] [CrossRef]
- Baharzadeh, F.; Sadeghi, M.; Ramezani, M. Chromophobe renal cell carcinoma or oncocytoma: a manner of challenge in frozen section diagnosis. BioMedicine 2019, 9. [Google Scholar] [CrossRef] [PubMed]
- Shao, X.; Lv, N.; Liao, J.; Long, J.; Xue, R.; Ai, N.; Xu, D.; Fan, X. Copy number variation is highly correlated with differential gene expression: a pan-cancer study. BMC medical genetics 2019, 20, 1–14. [Google Scholar] [CrossRef] [PubMed]
- Sebat, J.; Lakshmi, B.; Troge, J.; Alexander, J.; Young, J.; Lundin, P.; Manér, S.; Massa, H.; Walker, M.; Chi, M.; et al. Large-scale copy number polymorphism in the human genome. Science 2004, 305, 525–528. [Google Scholar] [CrossRef] [PubMed]
- Albertson, D.G.; Pinkel, D. Genomic microarrays in human genetic disease and cancer. Human molecular genetics 2003, 12, R145–R152. [Google Scholar] [CrossRef]
- Shaikh, T.H. Copy number variation disorders. Current genetic medicine reports 2017, 5, 183–190. [Google Scholar] [CrossRef]
- Füzesi, L.; Frank, D.; Nguyen, C.; Ringert, R.H.; Bartels, H.; Gunawan, B. Losses of 1p and chromosome 14 in renal oncocytomas. Cancer genetics and cytogenetics 2005, 160, 120–125. [Google Scholar] [CrossRef]
- Yap, N.Y.; Rajandram, R.; Ng, K.L.; Pailoor, J.; Fadzli, A.; Gobe, G.C. Genetic and chromosomal aberrations and their clinical significance in renal neoplasms. BioMed research international 2015, 2015, 476508. [Google Scholar] [CrossRef] [PubMed]
- Ohashi, R.; Schraml, P.; Angori, S.; Batavia, A.A.; Rupp, N.J.; Ohe, C.; Otsuki, Y.; Kawasaki, T.; Kobayashi, H.; Kobayashi, K.; et al. Classic chromophobe renal cell carcinoma incur a larger number of chromosomal losses than seen in the eosinophilic subtype. Cancers 2019, 11, 1492. [Google Scholar] [CrossRef]
- Tan, M.H.; Wong, C.F.; Tan, H.L.; Yang, X.J.; Ditlev, J.; Matsuda, D.; Khoo, S.K.; Sugimura, J.; Fujioka, T.; Furge, K.A.; et al. Genomic expression and single-nucleotide polymorphism profiling discriminates chromophobe renal cell carcinoma and oncocytoma. BMC cancer 2010, 10, 1–12. [Google Scholar] [CrossRef]
- Krill-Burger, J.M.; Lyons, M.A.; Kelly, L.A.; Sciulli, C.M.; Petrosko, P.; Chandran, U.R.; Kubal, M.D.; Bastacky, S.I.; Parwani, A.V.; Dhir, R.; et al. Renal cell neoplasms contain shared tumor type–specific copy number variations. The American journal of pathology 2012, 180, 2427–2439. [Google Scholar] [CrossRef]
- Van den Berg, E.; Van der Hout, A.; Oosterhuis, J.; Störkel, S.; Dijkhuizen, T.; Dam, A.; Zweers, H.; Mensink, H.; Buys, C.; De Jong, B. Cytogenetic analysis of epithelial renal-cell tumors: relationship with a new histopathological classification. International journal of cancer 1993, 55, 223–227. [Google Scholar] [CrossRef] [PubMed]
- Herbers, J.; Schullerus, D.; Chudek, J.; Bugert, P.; Kanamaru, H.; Zeisler, J.; Ljungberg, B.; Akhtar, M.; Kovacs, G. Lack of genetic changes at specific genomic sites separates renal oncocytomas from renal cell carcinomas. The Journal of Pathology: A Journal of the Pathological Society of Great Britain and Ireland 1998, 184, 58–62. [Google Scholar] [CrossRef]
- Wang, M.X.; Liuyu, T.; Zhang, Z.d. Multifaceted roles of the E3 ubiquitin ligase RING finger protein 115 in immunity and diseases. Frontiers in Immunology 2022, 13, 936579. [Google Scholar] [CrossRef]
- Amemiya, Y.; Bacopulos, S.; Seth, A. Novel Ubiquitin E3 Ligases as Targets for Cancer Therapy: Focus on Breast Cancer-Associated Gene 2 (BCA2). Resistance to Proteasome Inhibitors in Cancer: Molecular Mechanisms and Strategies to Overcome Resistance, 2014; 317–346. [Google Scholar]
- Pan, Z. Identification of novel substrates of the ubiquitin E3 ligase RNF126 and characterization of its role in lipid droplet homeostasis; University of Toronto (Canada), 2016.
- Ehsani, L.; Seth, R.; Bacopulos, S.; Seth, A.; Osunkoya, A.O. BCA2 is differentially expressed in renal oncocytoma: an analysis of 158 renal neoplasms. Tumor Biology 2013, 34, 787–791. [Google Scholar] [CrossRef]
- Iakymenko, O.A.; Delma, K.S.; Jorda, M.; Kryvenko, O.N. Cathepsin K (clone EPR19992) demonstrates uniformly positive immunoreactivity in renal oncocytoma, chromophobe renal cell carcinoma, and distal tubules. International journal of surgical pathology 2021, 29, 600–605. [Google Scholar] [CrossRef]
- Li, G.; Gentil-Perret, A.; Lambert, C.; Genin, C.; Tostain, J. S100A1 and KIT gene expressions in common subtypes of renal tumours. European Journal of Surgical Oncology (EJSO) 2005, 31, 299–303. [Google Scholar] [CrossRef]
- Yusenko, M.V. Molecular pathology of chromophobe renal cell carcinoma: a review. International Journal of Urology 2010, 17, 592–600. [Google Scholar] [CrossRef]
- Zhu, B.; Rohan, S.M.; Lin, X. Cytomorphology, immunoprofile, and management of renal oncocytic neoplasms. Cancer Cytopathology 2020, 128, 962–970. [Google Scholar] [CrossRef] [PubMed]
- Satter, K.B.; Tran, P.M.H.; Tran, L.K.H.; Ramsey, Z.; Pinkerton, K.; Bai, S.; Savage, N.M.; Kavuri, S.; Terris, M.K.; She, J.X.; et al. Oncocytoma-related gene signature to differentiate chromophobe renal cancer and oncocytoma using machine learning. Cells 2022, 11, 287. [Google Scholar] [CrossRef]
- Wu, H.; Fan, L.; Liu, H.; Guan, B.; Hu, B.; Liu, F.; Hocher, B.; Yin, L. Identification of key genes and prognostic analysis between chromophobe renal cell carcinoma and renal oncocytoma by bioinformatic analysis. BioMed Research International 2020, 2020, 4030915. [Google Scholar] [CrossRef]
- Yusenko, M.V.; Kuiper, R.P.; Boethe, T.; Ljungberg, B.; van Kessel, A.G.; Kovacs, G. High-resolution DNA copy number and gene expression analyses distinguish chromophobe renal cell carcinomas and renal oncocytomas. BMC cancer 2009, 9, 1–10. [Google Scholar] [CrossRef] [PubMed]
- McGillivray, P.D.; Ueno, D.; Pooli, A.; Mendhiratta, N.; Syed, J.S.; Nguyen, K.A.; Schulam, P.G.; Humphrey, P.A.; Adeniran, A.J.; Boutros, P.C.; et al. Distinguishing benign renal tumors with an oncocytic gene expression (ONEX) classifier. European urology 2021, 79, 107–111. [Google Scholar] [CrossRef] [PubMed]
- Rohan, S.; Tu, J.J.; Kao, J.; Mukherjee, P.; Campagne, F.; Zhou, X.K.; Hyjek, E.; Alonso, M.A.; Chen, Y.T. Gene expression profiling separates chromophobe renal cell carcinoma from oncocytoma and identifies vesicular transport and cell junction proteins as differentially expressed genes. Clinical cancer research 2006, 12, 6937–6945. [Google Scholar] [CrossRef] [PubMed]
- Liu, Q.; Cornejo, K.M.; Cheng, L.; Hutchinson, L.; Wang, M.; Zhang, S.; Tomaszewicz, K.; Cosar, E.F.; Woda, B.A.; Jiang, Z. Next-generation sequencing to detect deletion of RB1 and ERBB4 genes in chromophobe renal cell carcinoma: a potential role in distinguishing chromophobe renal cell carcinoma from renal oncocytoma. The American Journal of Pathology 2018, 188, 846–852. [Google Scholar] [CrossRef]
- Molnar, A.; Horvath, C.A.; Czovek, P.; Szanto, A.; Kovacs, G. FOXI1 immunohistochemistry differentiates benign renal oncocytoma from malignant chromophobe renal cell carcinoma. Anticancer Research 2019, 39, 2785–2790. [Google Scholar] [CrossRef]
- Ishihara, H.; Yamashita, S.; Liu, Y.Y.; Hattori, N.; El-Omar, O.; Ikeda, T.; Fukuda, H.; Yoshida, K.; Takagi, T.; Taneda, S.; et al. Genetic and epigenetic profiling indicates the proximal tubule origin of renal cancers in end-stage renal disease. Cancer Science 2020, 111, 4276–4287. [Google Scholar] [CrossRef]
- Giesen, E.; Jilaveanu, L.B.; Parisi, F.; Kluger, Y.; Camp, R.L.; Kluger, H.M. NY-ESO-1 as a potential immunotherapeutic target in renal cell carcinoma. Oncotarget 2014, 5, 5209. [Google Scholar] [CrossRef]
- Demirović, A.; Džombeta, T.; Tomas, D.; Spajić, B.; Pavić, I.; Hudolin, T. expression of tumor antigens MAGE-A3/4 and NY-ESO-1 in renal oncocytoma and chromophobe renal cell carcinoma. Pathology.
- Coppola, F.; Mottola, M.; Lo Monaco, S.; Cattabriga, A.; Cocozza, M.A.; Yuan, J.C.; De Benedittis, C.; Cuicchi, D.; Guido, A.; Rojas Llimpe, F.L.; et al. The heterogeneity of skewness in T2W-based radiomics predicts the response to neoadjuvant chemoradiotherapy in locally advanced rectal cancer. Diagnostics 2021, 11, 795. [Google Scholar] [CrossRef]
- Çinarer, G.; Emiroğlu, B.G.; Yurttakal, A.H. Prediction of glioma grades using deep learning with wavelet radiomic features. Applied Sciences 2020, 10, 6296. [Google Scholar] [CrossRef]
- Belfiore, M.P.; Sansone, M.; Monti, R.; Marrone, S.; Fusco, R.; Nardone, V.; Grassi, R.; Reginelli, A. Robustness of radiomics in pre-surgical computer tomography of non-small-cell lung cancer. Journal of Personalized Medicine 2022, 13, 83. [Google Scholar] [CrossRef]
- Foy, J.J.; Robinson, K.R.; Li, H.; Giger, M.L.; Al-Hallaq, H.; Armato III, S.G. Variation in algorithm implementation across radiomics software. Journal of medical imaging 2018, 5, 044505–044505. [Google Scholar] [CrossRef] [PubMed]
- Linsalata, S.; Borgheresi, R.; Marfisi, D.; Barca, P.; Sainato, A.; Paiar, F.; Neri, E.; Traino, A.C.; Giannelli, M. Radiomics of patients with locally advanced rectal cancer: effect of preprocessing on features estimation from computed tomography imaging. BioMed Research International 2022, 2022, 2003286. [Google Scholar] [CrossRef] [PubMed]
- Yu, H.; Scalera, J.; Khalid, M.; Touret, A.S.; Bloch, N.; Li, B.; Qureshi, M.M.; Soto, J.A.; Anderson, S.W. Texture analysis as a radiomic marker for differentiating renal tumors. Abdominal Radiology 2017, 42, 2470–2478. [Google Scholar] [CrossRef]
- Rahim, M.A.; Hossain, M.N.; Wahid, T.; Azam, M.S. Face recognition using local binary patterns (LBP). Global Journal of Computer Science and Technology 2013, 13, 1–8. [Google Scholar]
- D’Amico, N.C.; Sicilia, R.; Cordelli, E.; Tronchin, L.; Greco, C.; Fiore, M.; Carnevale, A.; Iannello, G.; Ramella, S.; Soda, P. Radiomics-based prediction of overall survival in lung cancer using different volumes-of-interest. Applied Sciences 2020, 10, 6425. [Google Scholar] [CrossRef]
- Santucci, D.; Faiella, E.; Cordelli, E.; Sicilia, R.; de Felice, C.; Zobel, B.B.; Iannello, G.; Soda, P. 3T MRI-radiomic approach to predict for lymph node status in breast cancer patients. Cancers 2021, 13, 2228. [Google Scholar] [CrossRef]
- Sicilia, R.; Cordelli, E.; Merone, M.; Luperto, E.; Papalia, R.; Iannello, G.; Soda, P. Early radiomic experiences in classifying prostate cancer aggressiveness using 3D local binary patterns. In Proceedings of the 2019 IEEE 32nd International Symposium on Computer-Based Medical Systems (CBMS). IEEE; 2019; pp. 355–360. [Google Scholar]
- Tibermacine, H.; Rouanet, P.; Sbarra, M.; Forghani, R.; Reinhold, C.; Nougaret, S.; the GRECCAR Study Group. Radiomics modelling in rectal cancer to predict disease-free survival: evaluation of different approaches. British Journal of Surgery 2021, 108, 1243–1250. [Google Scholar] [CrossRef]
- Yu, Y.; Li, X.; Du, T.; Rahaman, M.; Grzegorzek, M.J.; Li, C.; Sun, H. Increasing the accuracy and reproducibility of positron emission tomography radiomics for predicting pelvic lymph node metastasis in patients with cervical cancer using 3D local binary pattern-based texture features. Intelligent Medicine 2024. [Google Scholar] [CrossRef]
- Jensen, L.J.; Kim, D.; Elgeti, T.; Steffen, I.G.; Schaafs, L.A.; Hamm, B.; Nagel, S.N. Enhancing the stability of CT radiomics across different volume of interest sizes using parametric feature maps: a phantom study. European Radiology Experimental 2022, 6, 43. [Google Scholar] [CrossRef]
- Scalco, E.; Belfatto, A.; Mastropietro, A.; Rancati, T.; Avuzzi, B.; Messina, A.; Valdagni, R.; Rizzo, G. T2w-MRI signal normalization affects radiomics features reproducibility. Medical physics 2020, 47, 1680–1691. [Google Scholar] [CrossRef]
- Tietz, E.; Truhn, D.; Müller-Franzes, G.; Berres, M.L.; Hamesch, K.; Lang, S.A.; Kuhl, C.K.; Bruners, P.; Schulze-Hagen, M. A radiomics approach to predict the emergence of new hepatocellular carcinoma in computed tomography for high-risk patients with liver cirrhosis. Diagnostics 2021, 11, 1650. [Google Scholar] [CrossRef] [PubMed]
- Shin, J.; Lim, J.S.; Huh, Y.M.; Kim, J.H.; Hyung, W.J.; Chung, J.J.; Han, K.; Kim, S. A radiomics-based model for predicting prognosis of locally advanced gastric cancer in the preoperative setting. Scientific reports 2021, 11, 1879. [Google Scholar] [CrossRef] [PubMed]
- Bernatowicz, K.; Grussu, F.; Ligero, M.; Garcia, A.; Delgado, E.; Perez-Lopez, R. Robust imaging habitat computation using voxel-wise radiomics features. Scientific reports 2021, 11, 20133. [Google Scholar] [CrossRef] [PubMed]
- Choi, W.; Liu, C.J.; Alam, S.R.; Oh, J.H.; Vaghjiani, R.; Humm, J.; Weber, W.; Adusumilli, P.S.; Deasy, J.O.; Lu, W. Preoperative 18F-FDG PET/CT and CT radiomics for identifying aggressive histopathological subtypes in early stage lung adenocarcinoma. Computational and Structural Biotechnology Journal 2023, 21, 5601–5608. [Google Scholar] [CrossRef] [PubMed]
- Lee, J.; Yoo, S.K.; Kim, K.; Lee, B.M.; Park, V.Y.; Kim, J.S.; Kim, Y.B. Machine learning-based radiomics models for prediction of locoregional recurrence in patients with breast cancer. Oncology Letters 2023, 26, 1–10. [Google Scholar] [CrossRef]
- Chen, Q.; Wang, L.; Wang, L.; Deng, Z.; Zhang, J.; Zhu, Y. Glioma grade prediction using wavelet scattering-based radiomics. IEEE Access 2020, 8, 106564–106575. [Google Scholar] [CrossRef]
- Meijer, K. Accuracy and stability of radiomic features for characterising tumour heterogeneity using multimodality imaging: a phantom study. Master’s thesis, University of Twente, 2019.
- Ericsson-Szecsenyi, R.; Zhang, G.; Redler, G.; Feygelman, V.; Rosenberg, S.; Latifi, K.; Ceberg, C.; Moros, E.G. Robustness assessment of images from a 0.35 T scanner of an integrated MRI-Linac: characterization of radiomics features in phantom and patient data. Technology in Cancer Research & Treatment 2022, 21, 15330338221099113. [Google Scholar]
- Fernandes, C.D.; Dinh, C.V.; Walraven, I.; Heijmink, S.W.; Smolic, M.; van Griethuysen, J.J.; Simões, R.; Losnegård, A.; van der Poel, H.G.; Pos, F.J.; et al. Biochemical recurrence prediction after radiotherapy for prostate cancer with T2w magnetic resonance imaging radiomic features. Physics and imaging in radiation oncology 2018, 7, 9–15. [Google Scholar] [CrossRef]
- Li, Y.; Huang, X.; Xia, Y.; Long, L. Value of radiomics in differential diagnosis of chromophobe renal cell carcinoma and renal oncocytoma. Abdominal Radiology 2020, 45, 3193–3201. [Google Scholar] [CrossRef]
- Varma, S.; Simon, R. Bias in error estimation when using cross-validation for model selection. BMC bioinformatics 2006, 7, 1–8. [Google Scholar] [CrossRef]
- Vabalas, A.; Gowen, E.; Poliakoff, E.; Casson, A.J. Machine learning algorithm validation with a limited sample size. PloS one 2019, 14, e0224365. [Google Scholar] [CrossRef] [PubMed]
- Cawley, G.C.; Talbot, N.L. On over-fitting in model selection and subsequent selection bias in performance evaluation. The Journal of Machine Learning Research 2010, 11, 2079–2107. [Google Scholar]
- Gupta, N. DNA extraction and polymerase chain reaction. Journal of cytology 2019, 36, 116–117. [Google Scholar] [CrossRef] [PubMed]
- Maxwell® RSC DNA FFPE Kit Technical Manual. 2022. Available online: https://www.promega.co.uk/resources/protocols/technical-manuals/101/maxwell-rsc-dna-ffpe-kit-protocol/ (accessed on 27 April 2023).
- Maxwell® RSC Genomic DNA Kit Technical Manual. 2022. Available online: https://www.promega.co.uk/resources/protocols/technical-manuals/500/maxwell-rsc-genomic-dna-kit-protocol/ (accessed on 27 April 2023).
- InfiniumTM CytoSNP-850K v1.4 BeadChip Data Sheet. 2023. Available online: https://support.illumina.com/content/dam/illumina/gcs/assembled-assets/marketing-literature/infinium-cytosnp850k-data-sheet-m-gl-01507/infinium-cytosnp850k-data-sheet-m-gl-01507.pdf (accessed on 27 April 2023).
- iScan System Guide. 2023. Available online: https://support-docs.illumina.com/ARR/iScan/Content/ARR/FrontPages/iscan.htm (accessed on 27 April 2023).
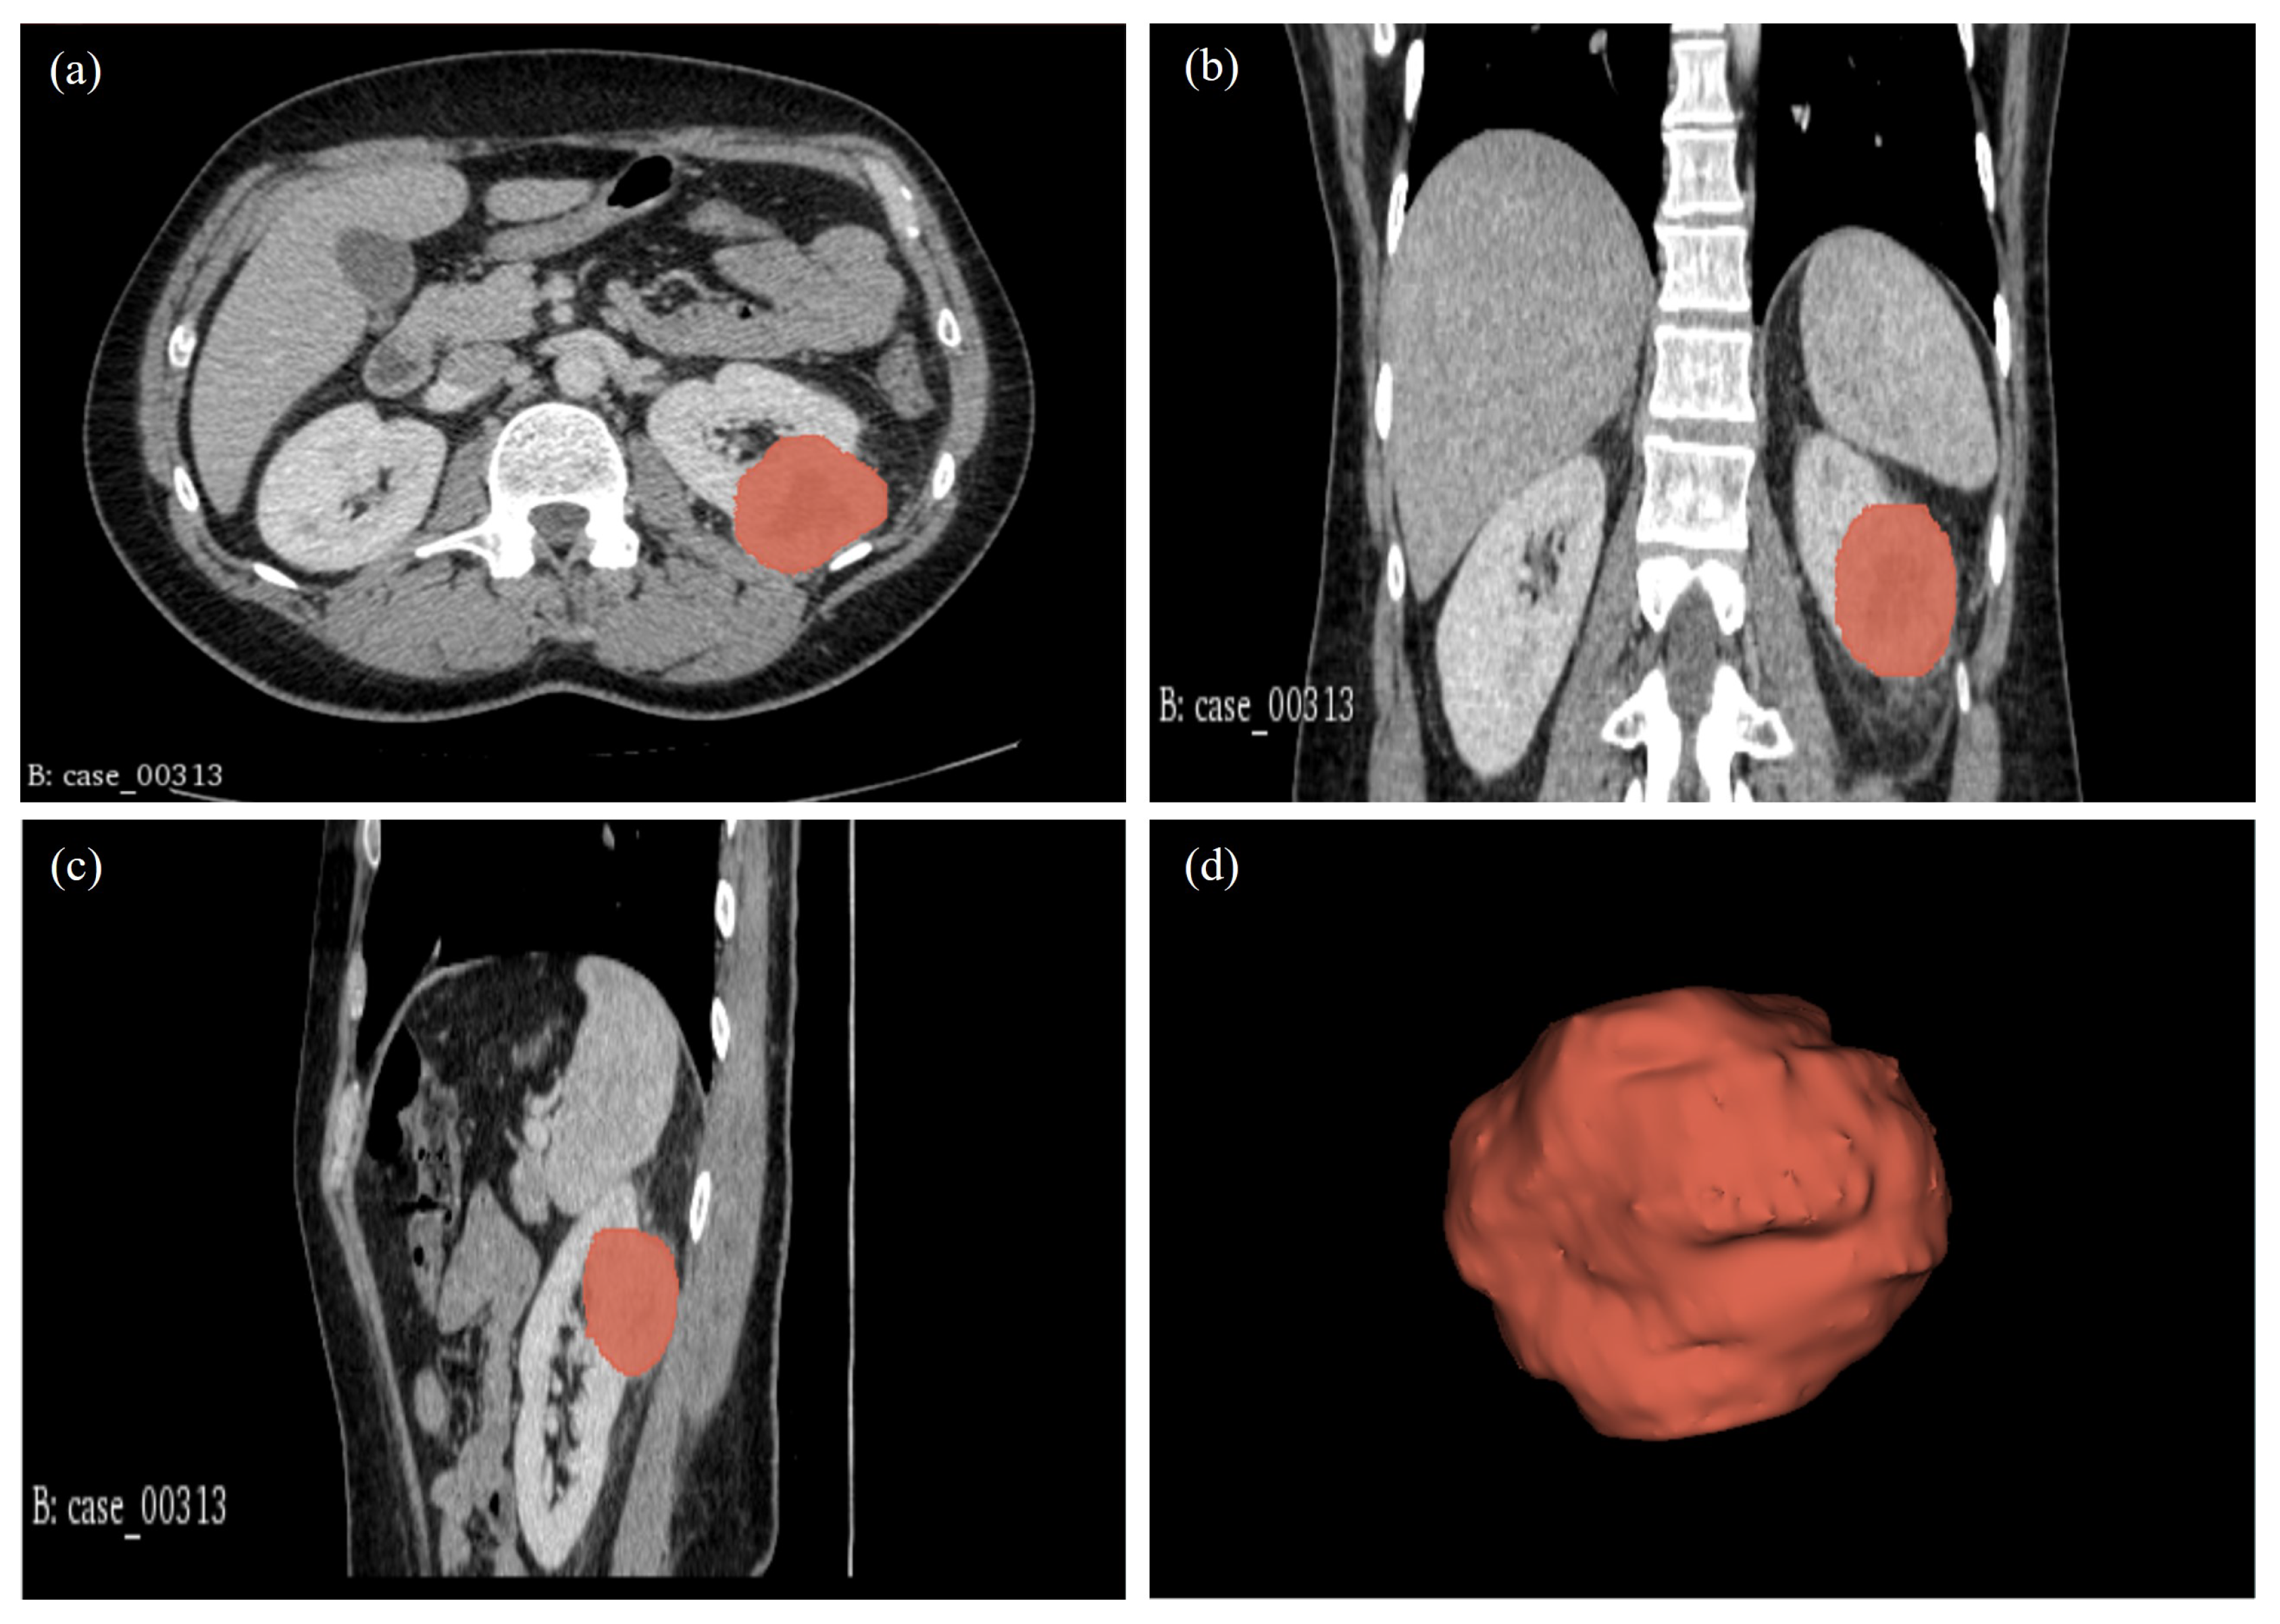
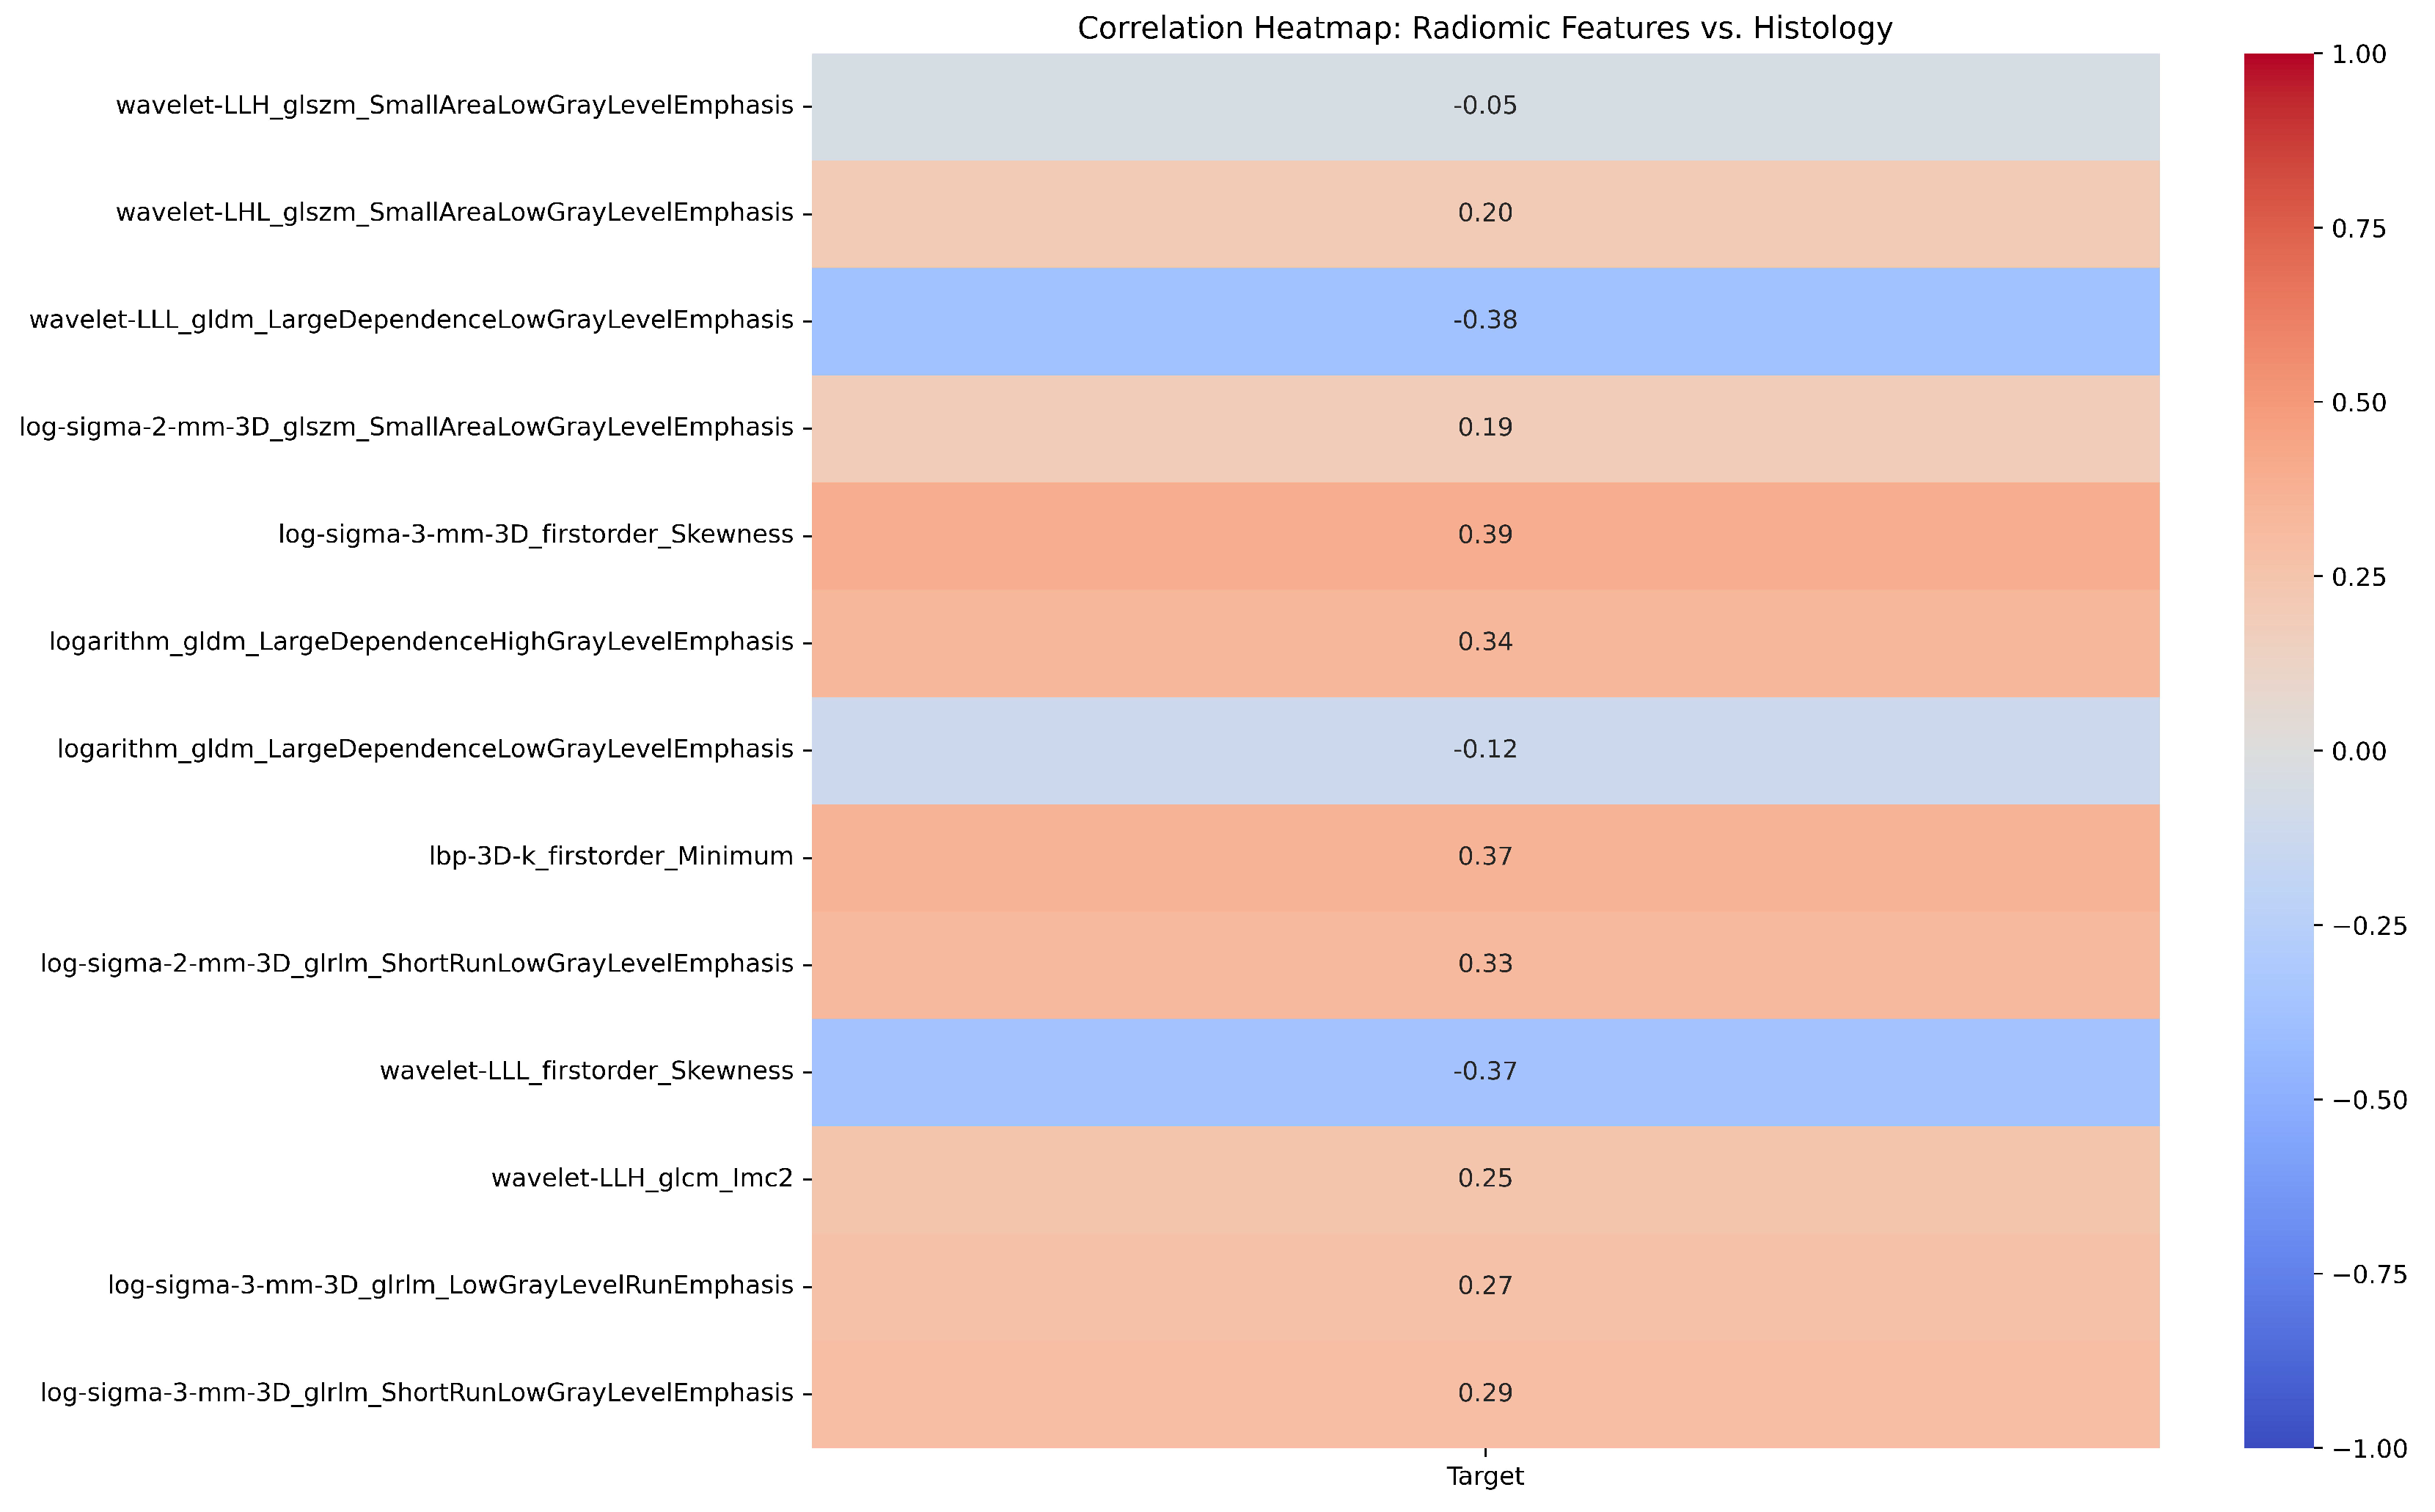
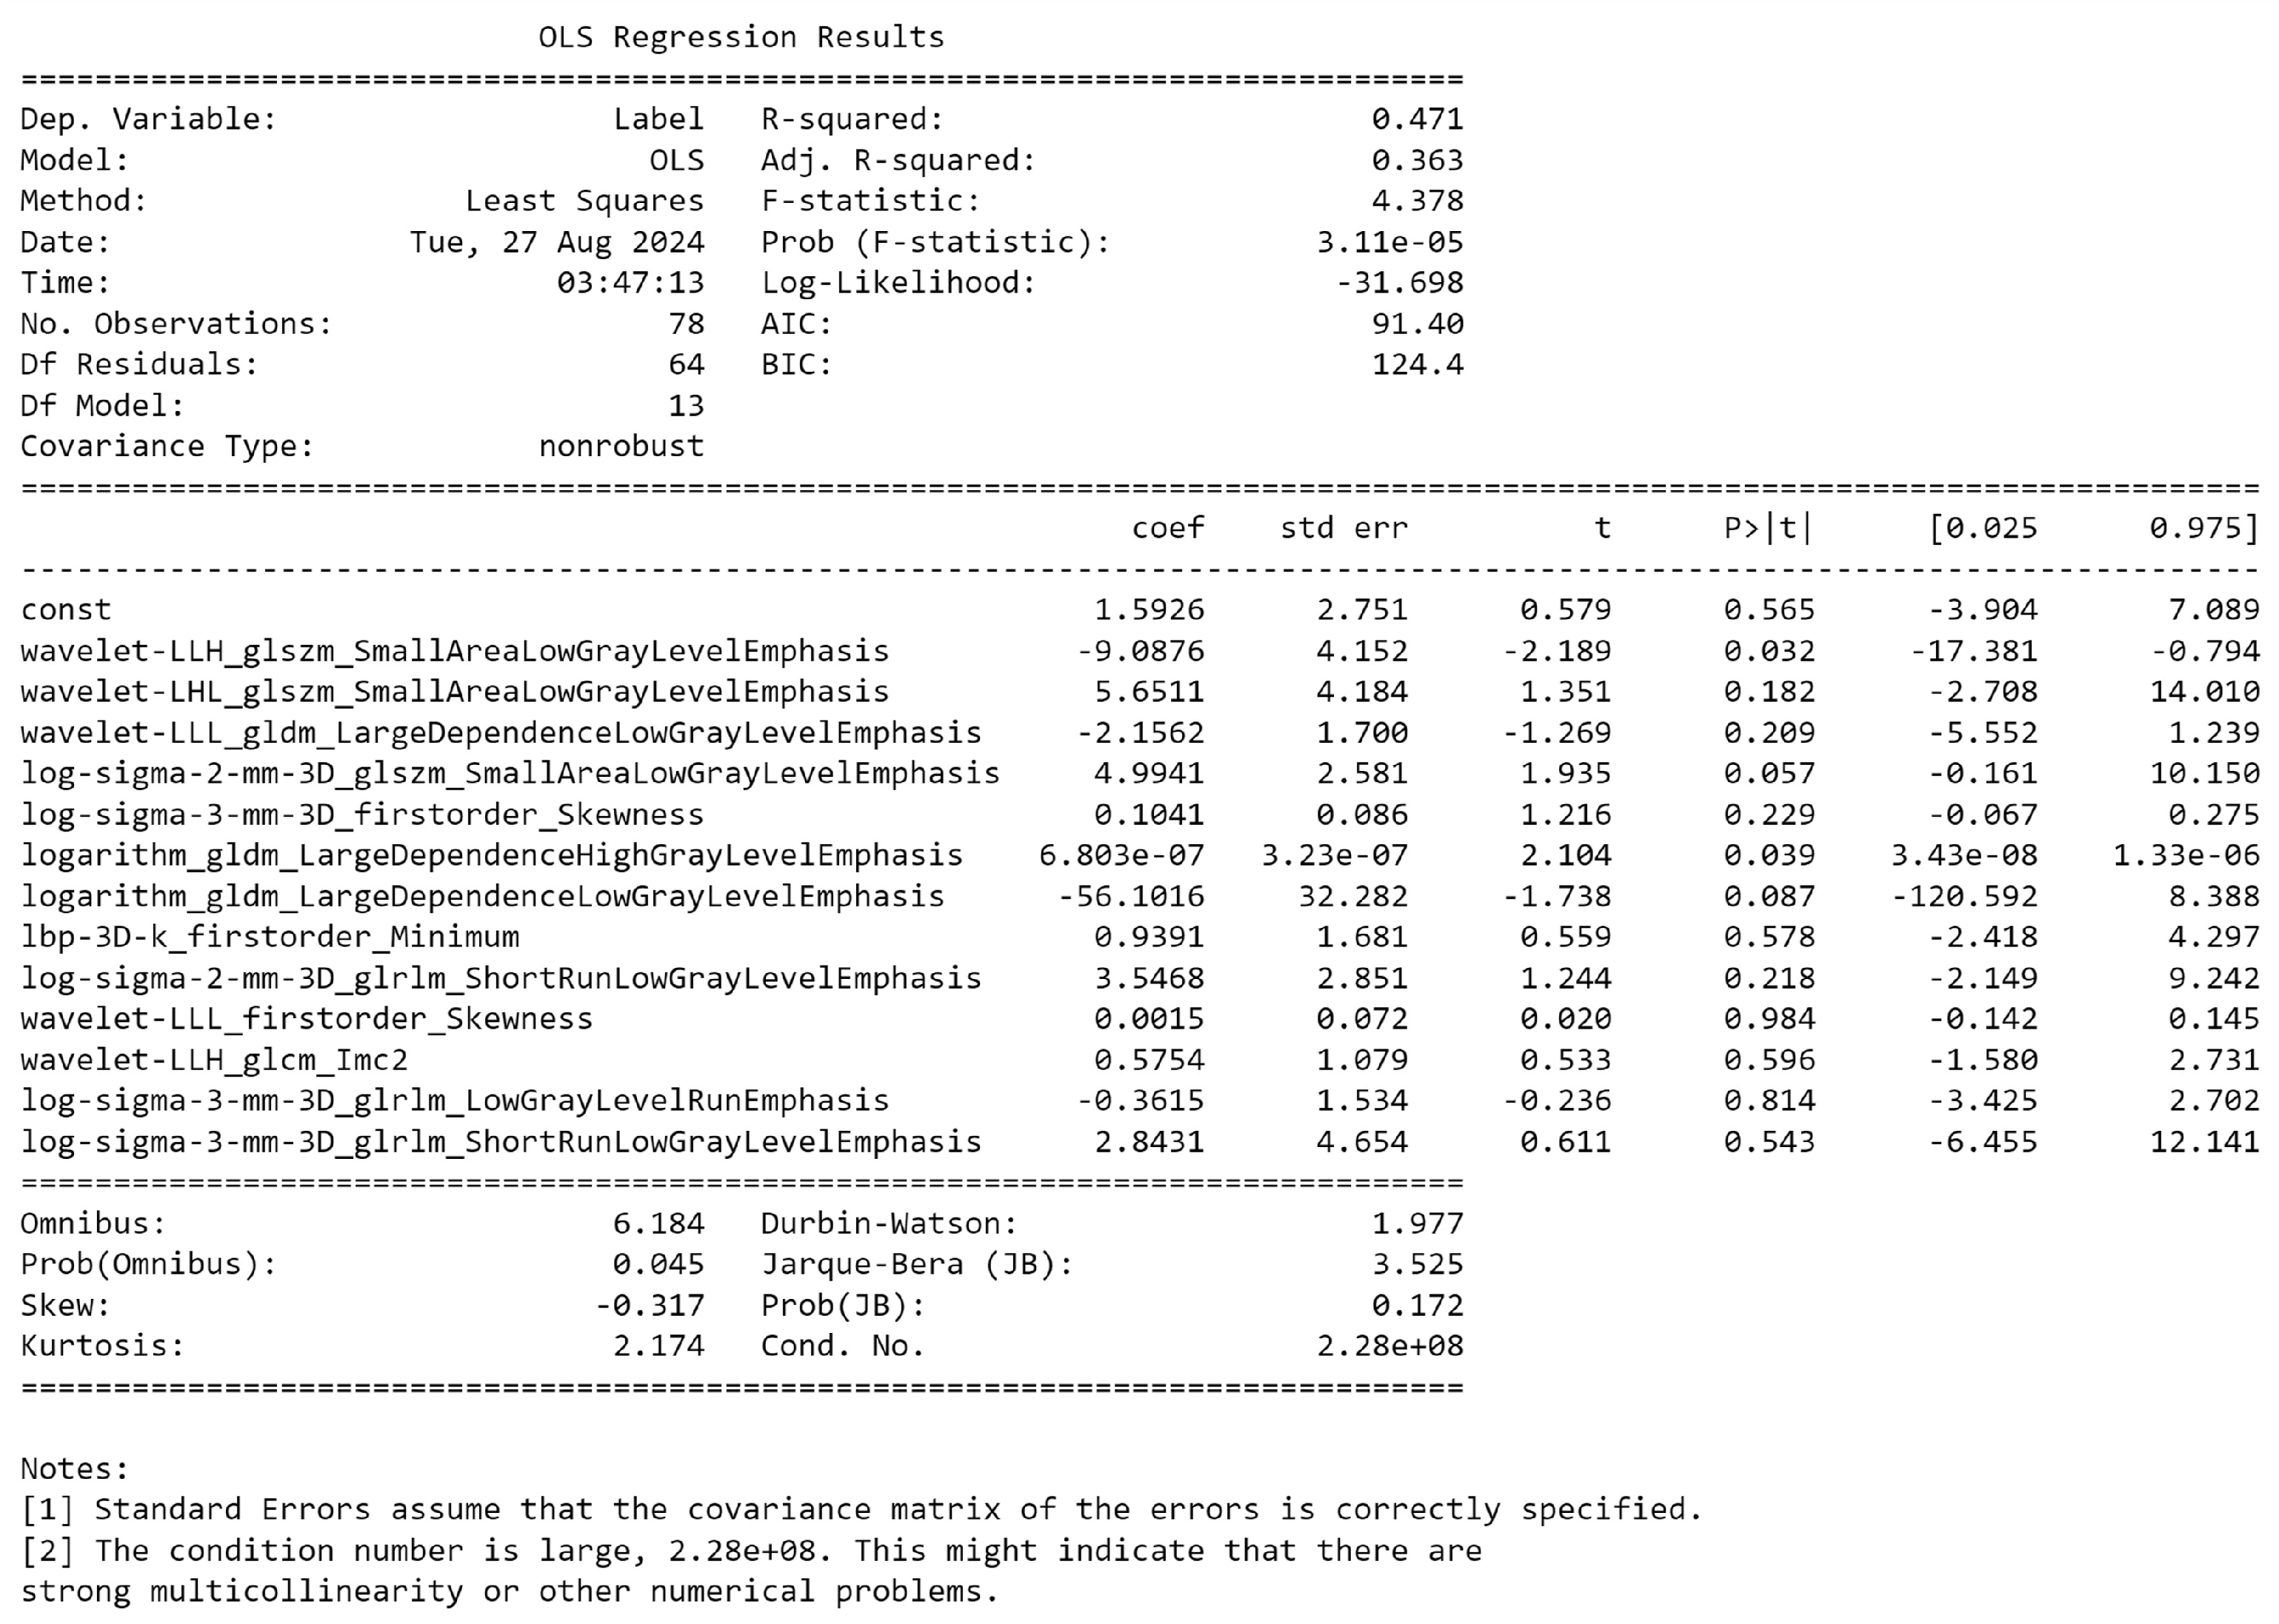
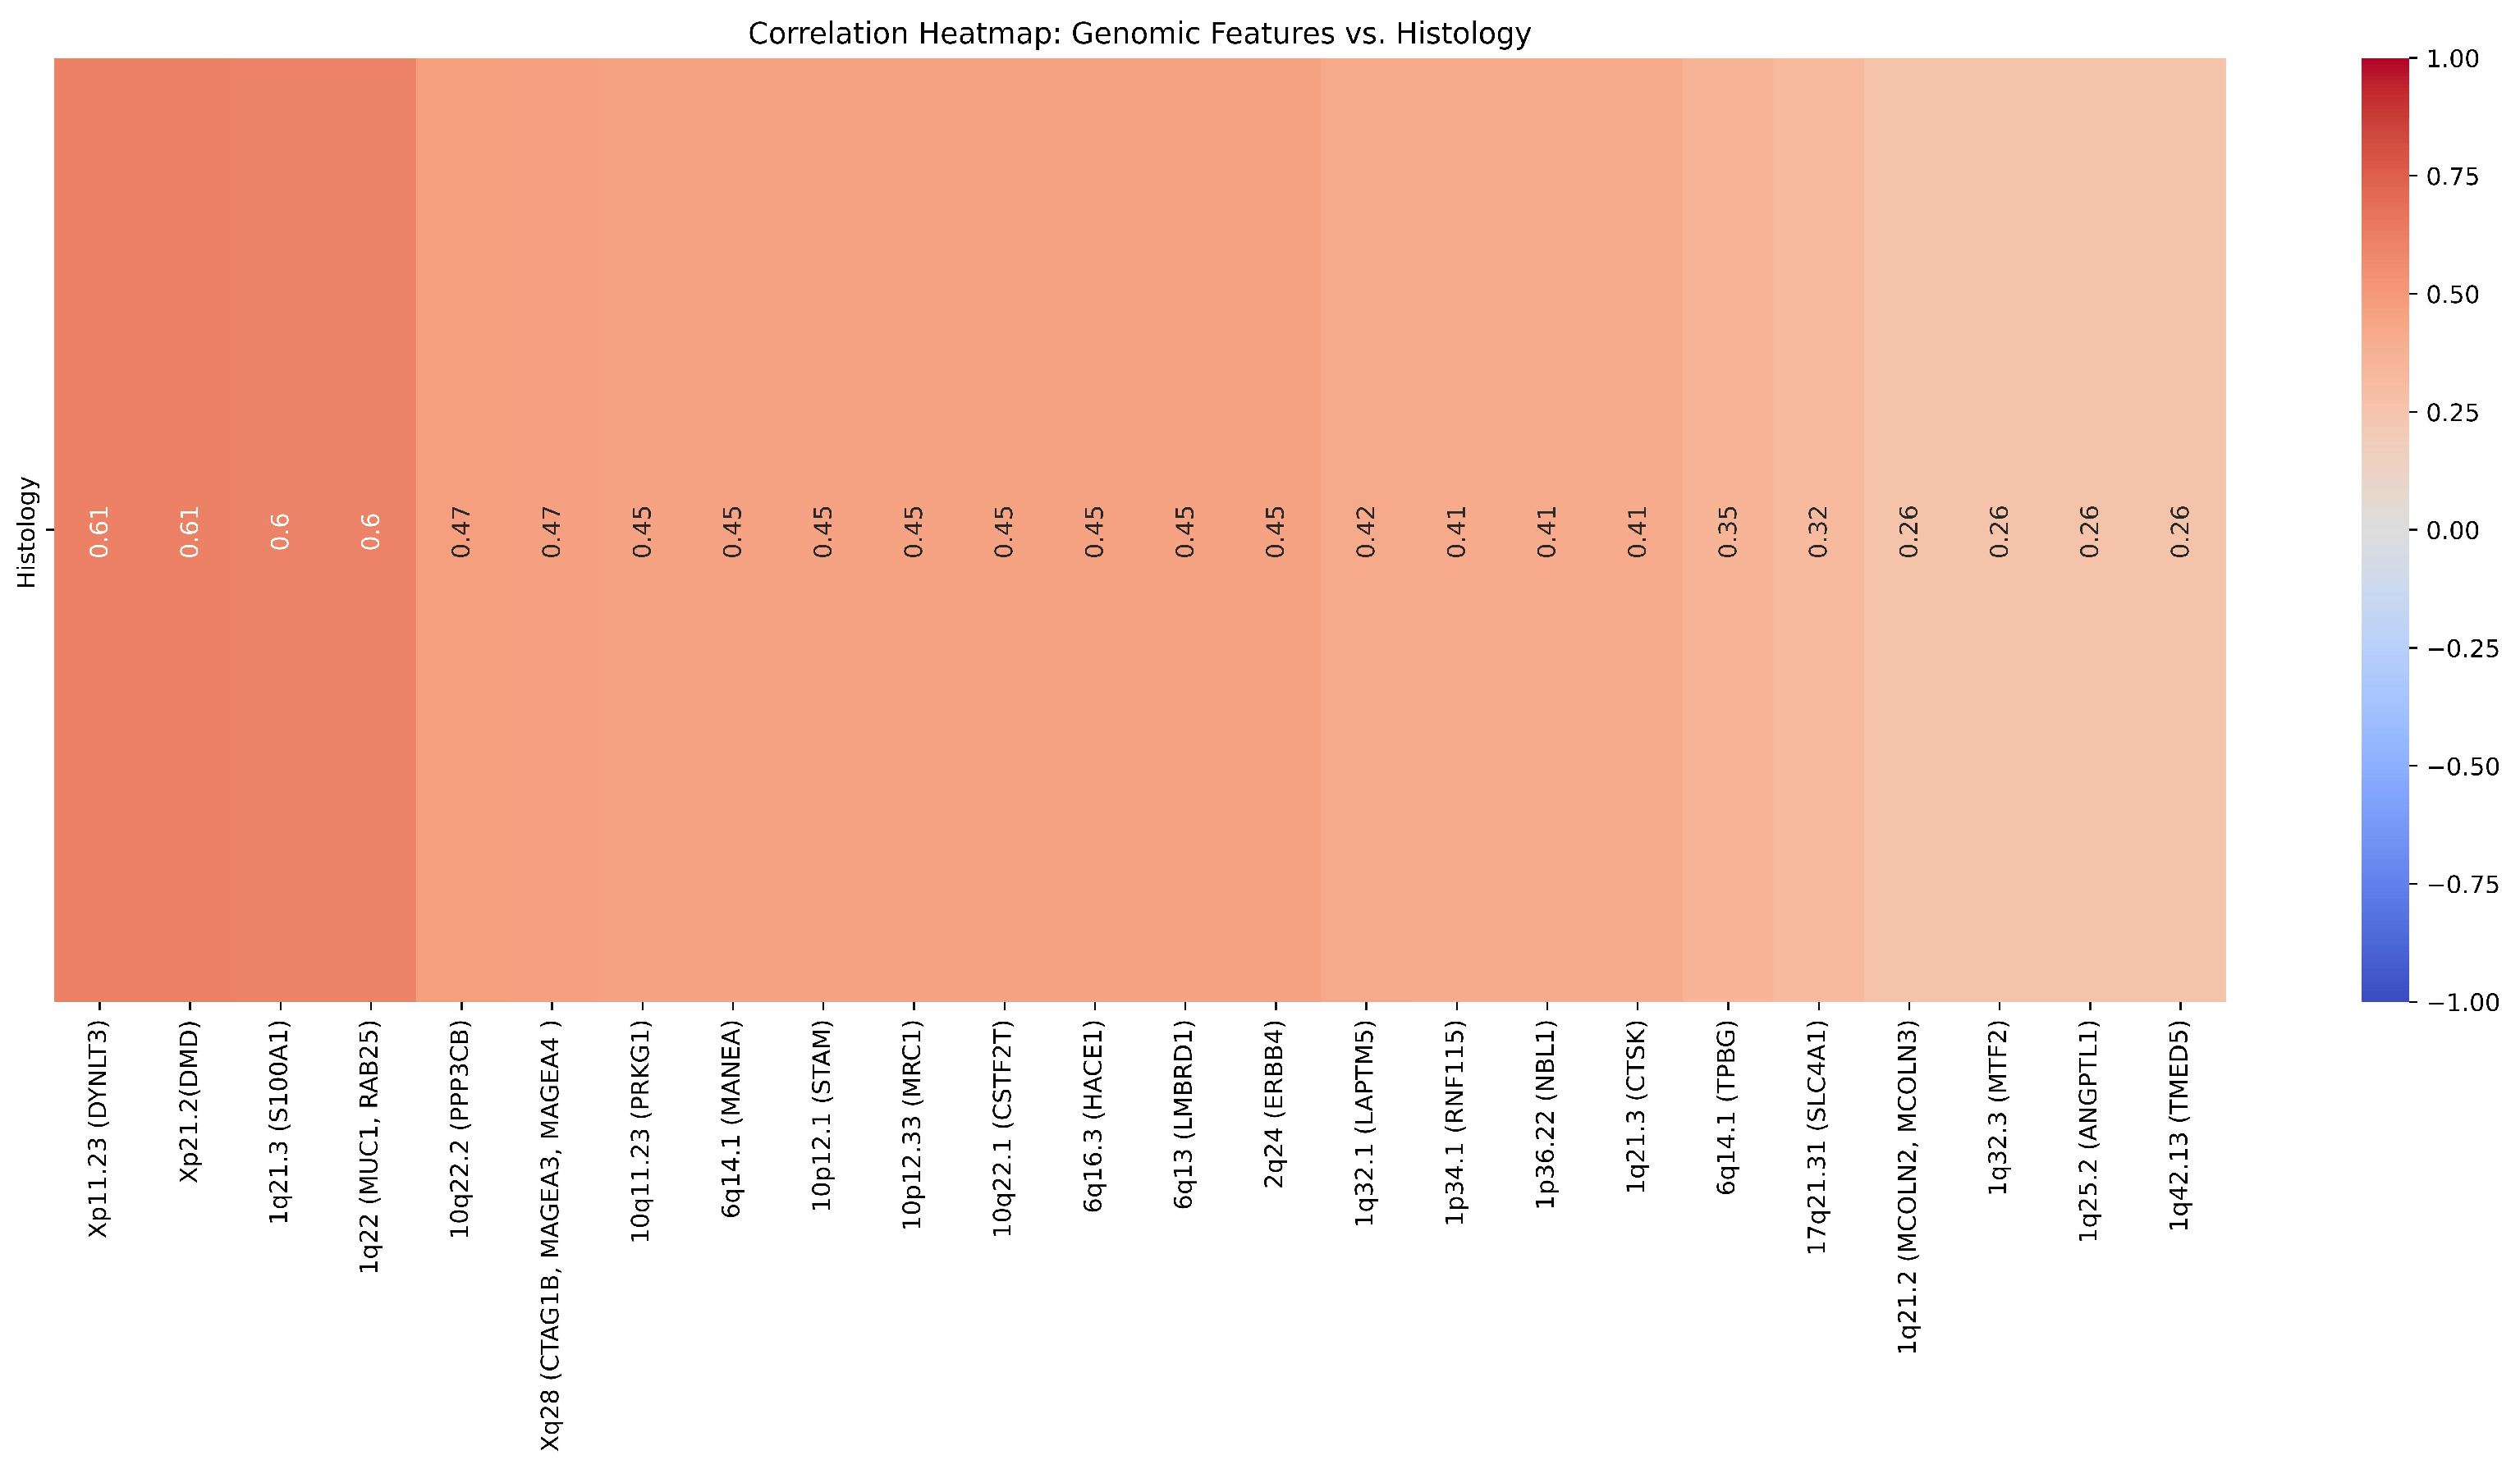
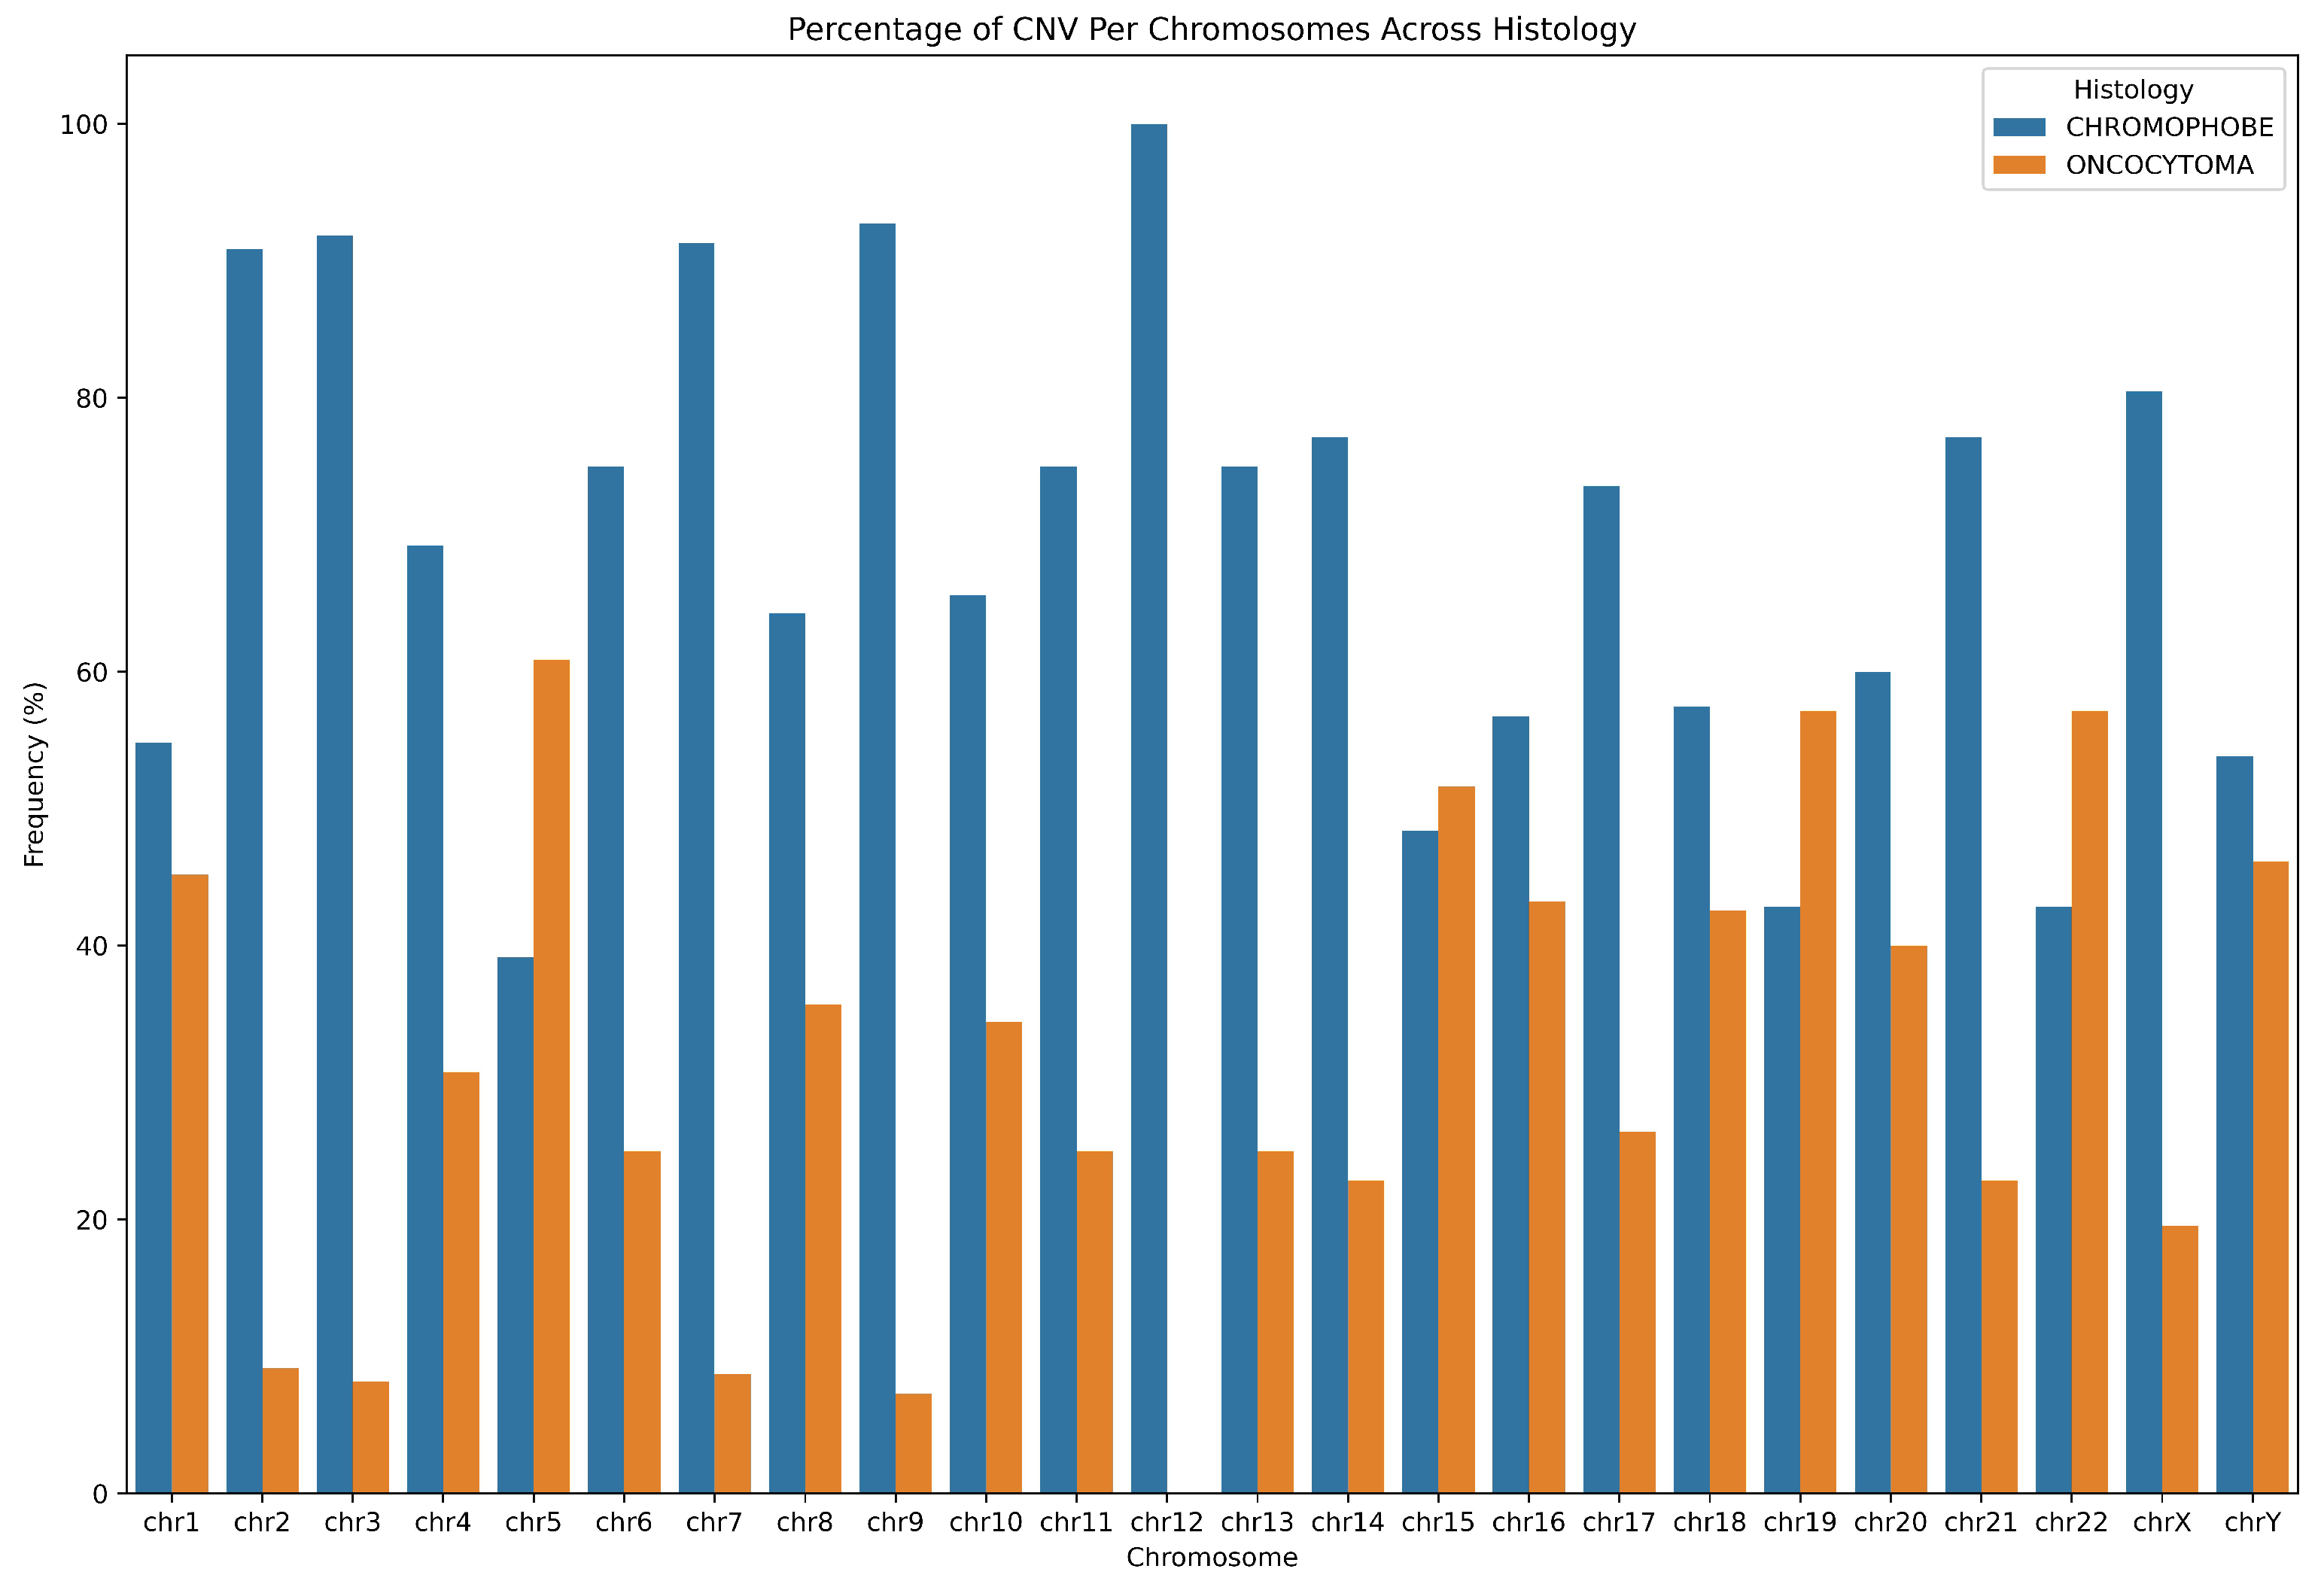
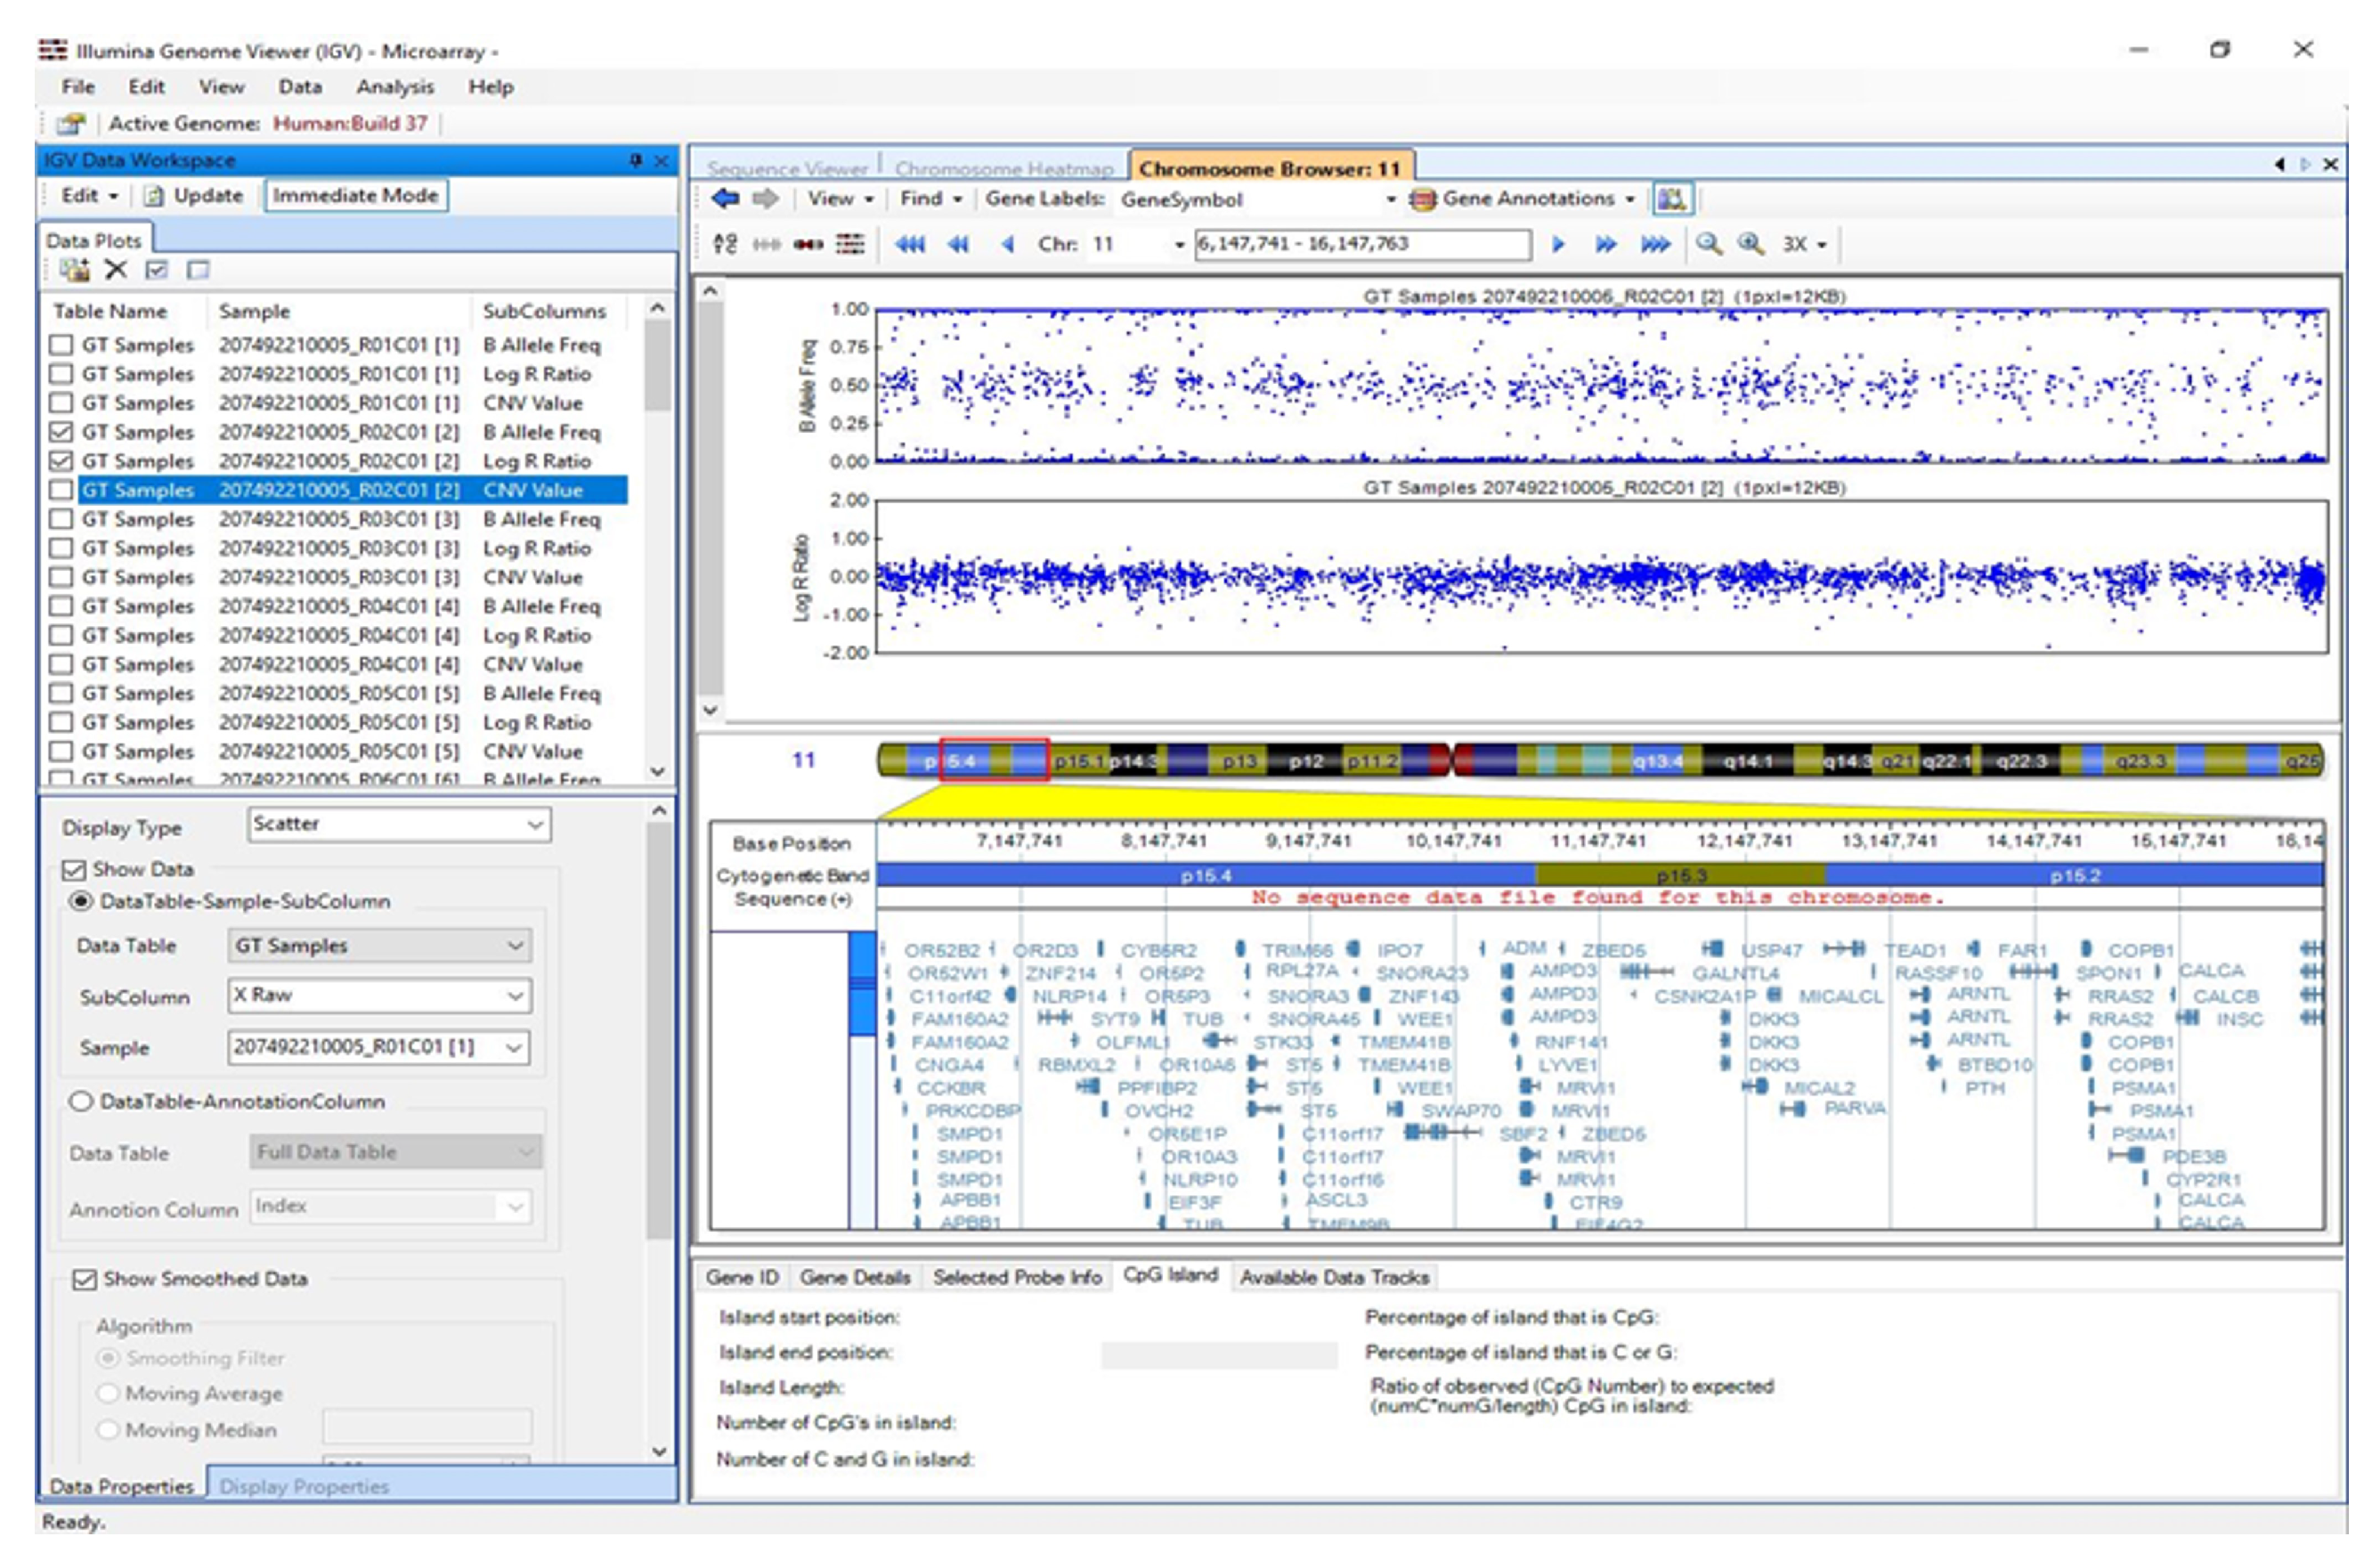
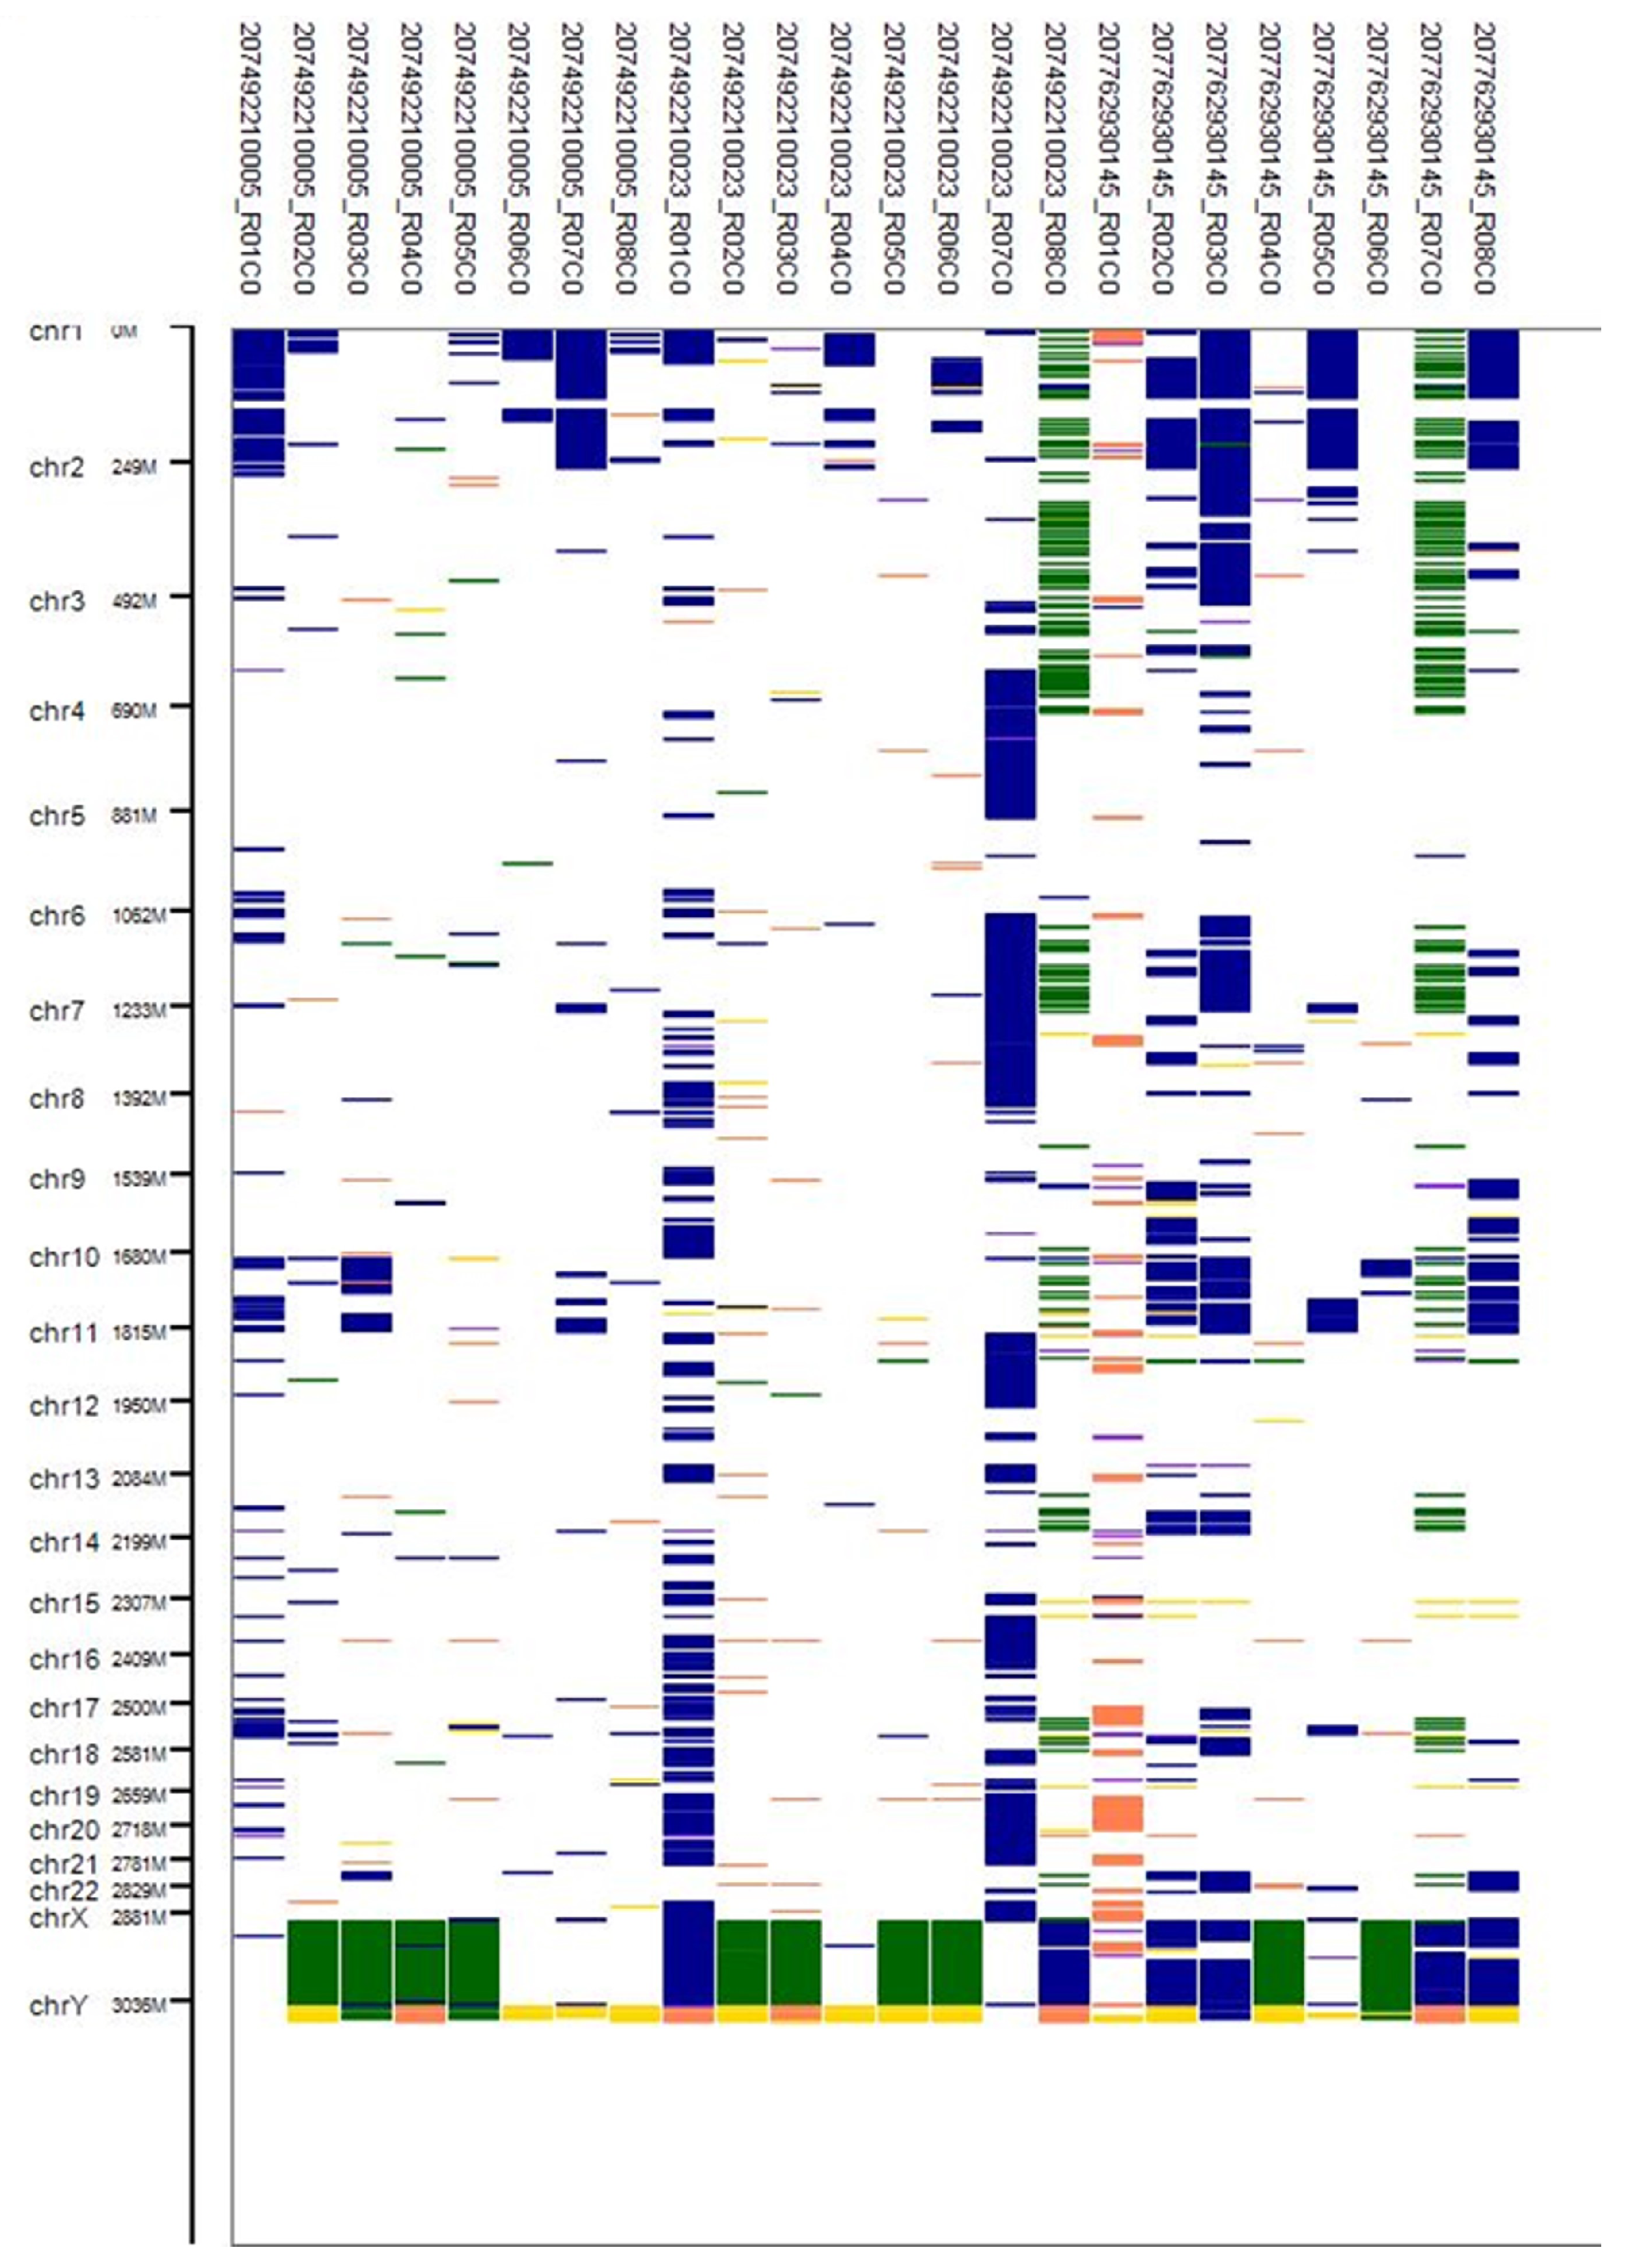
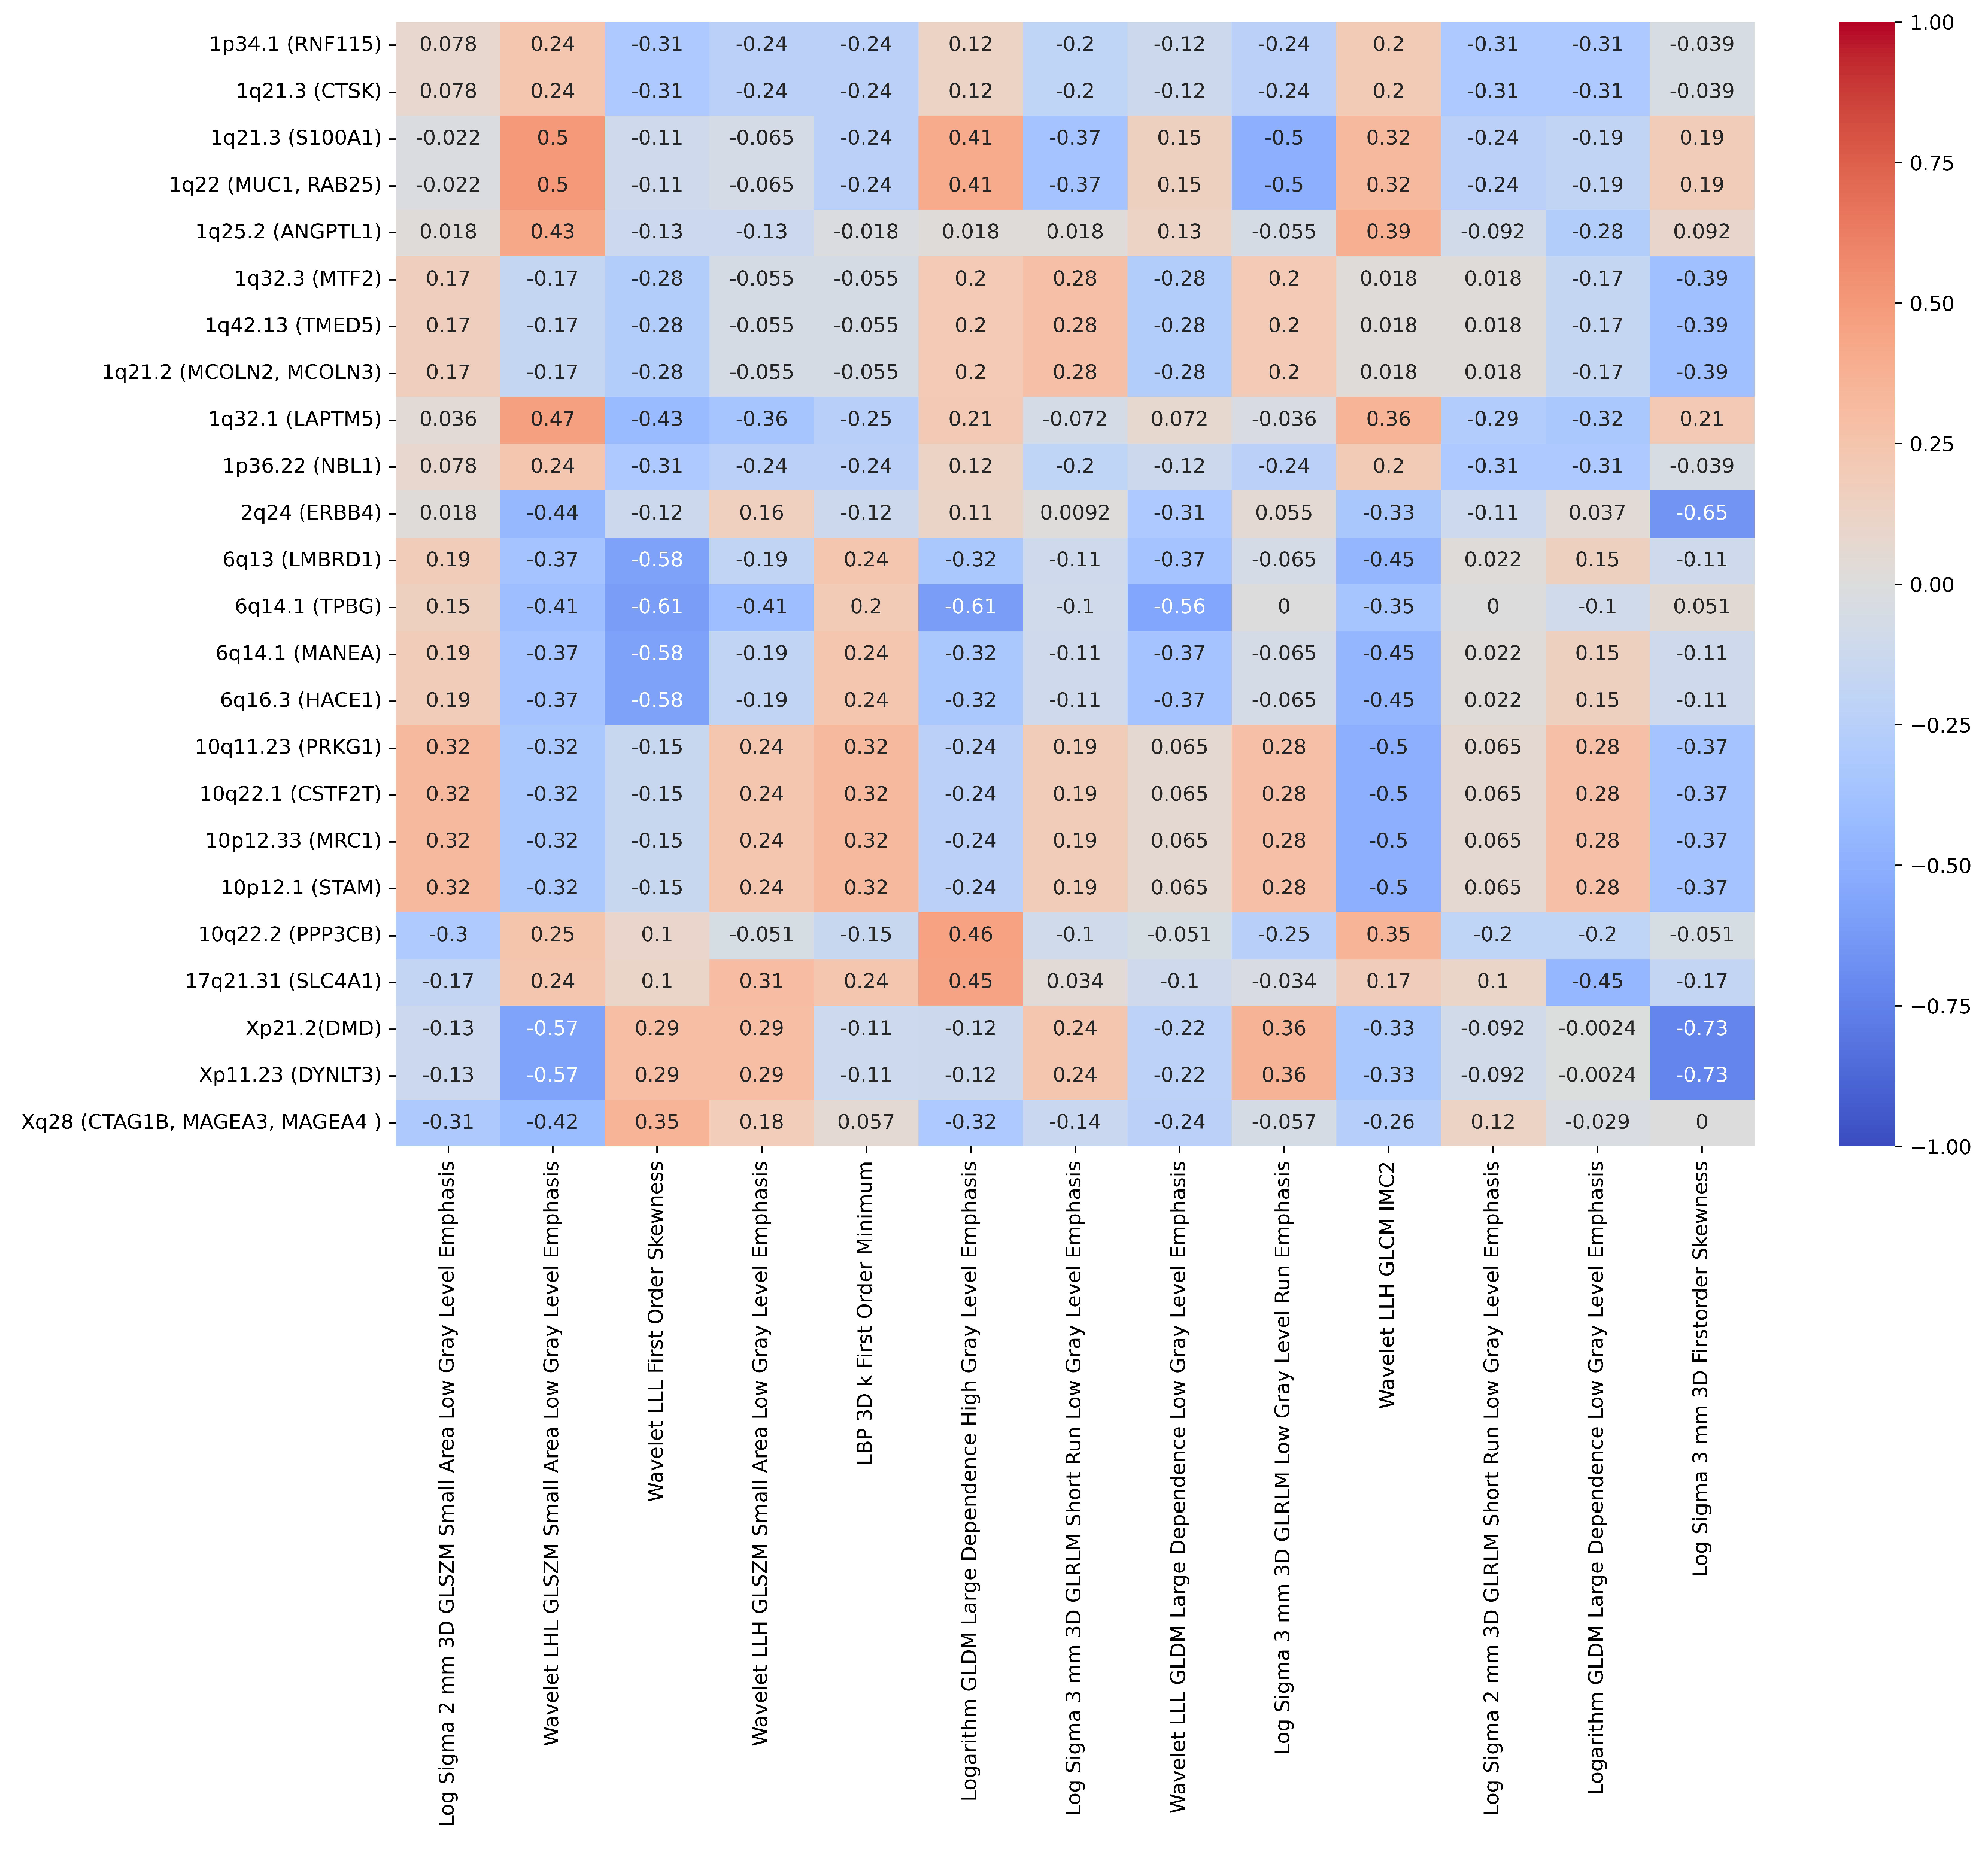
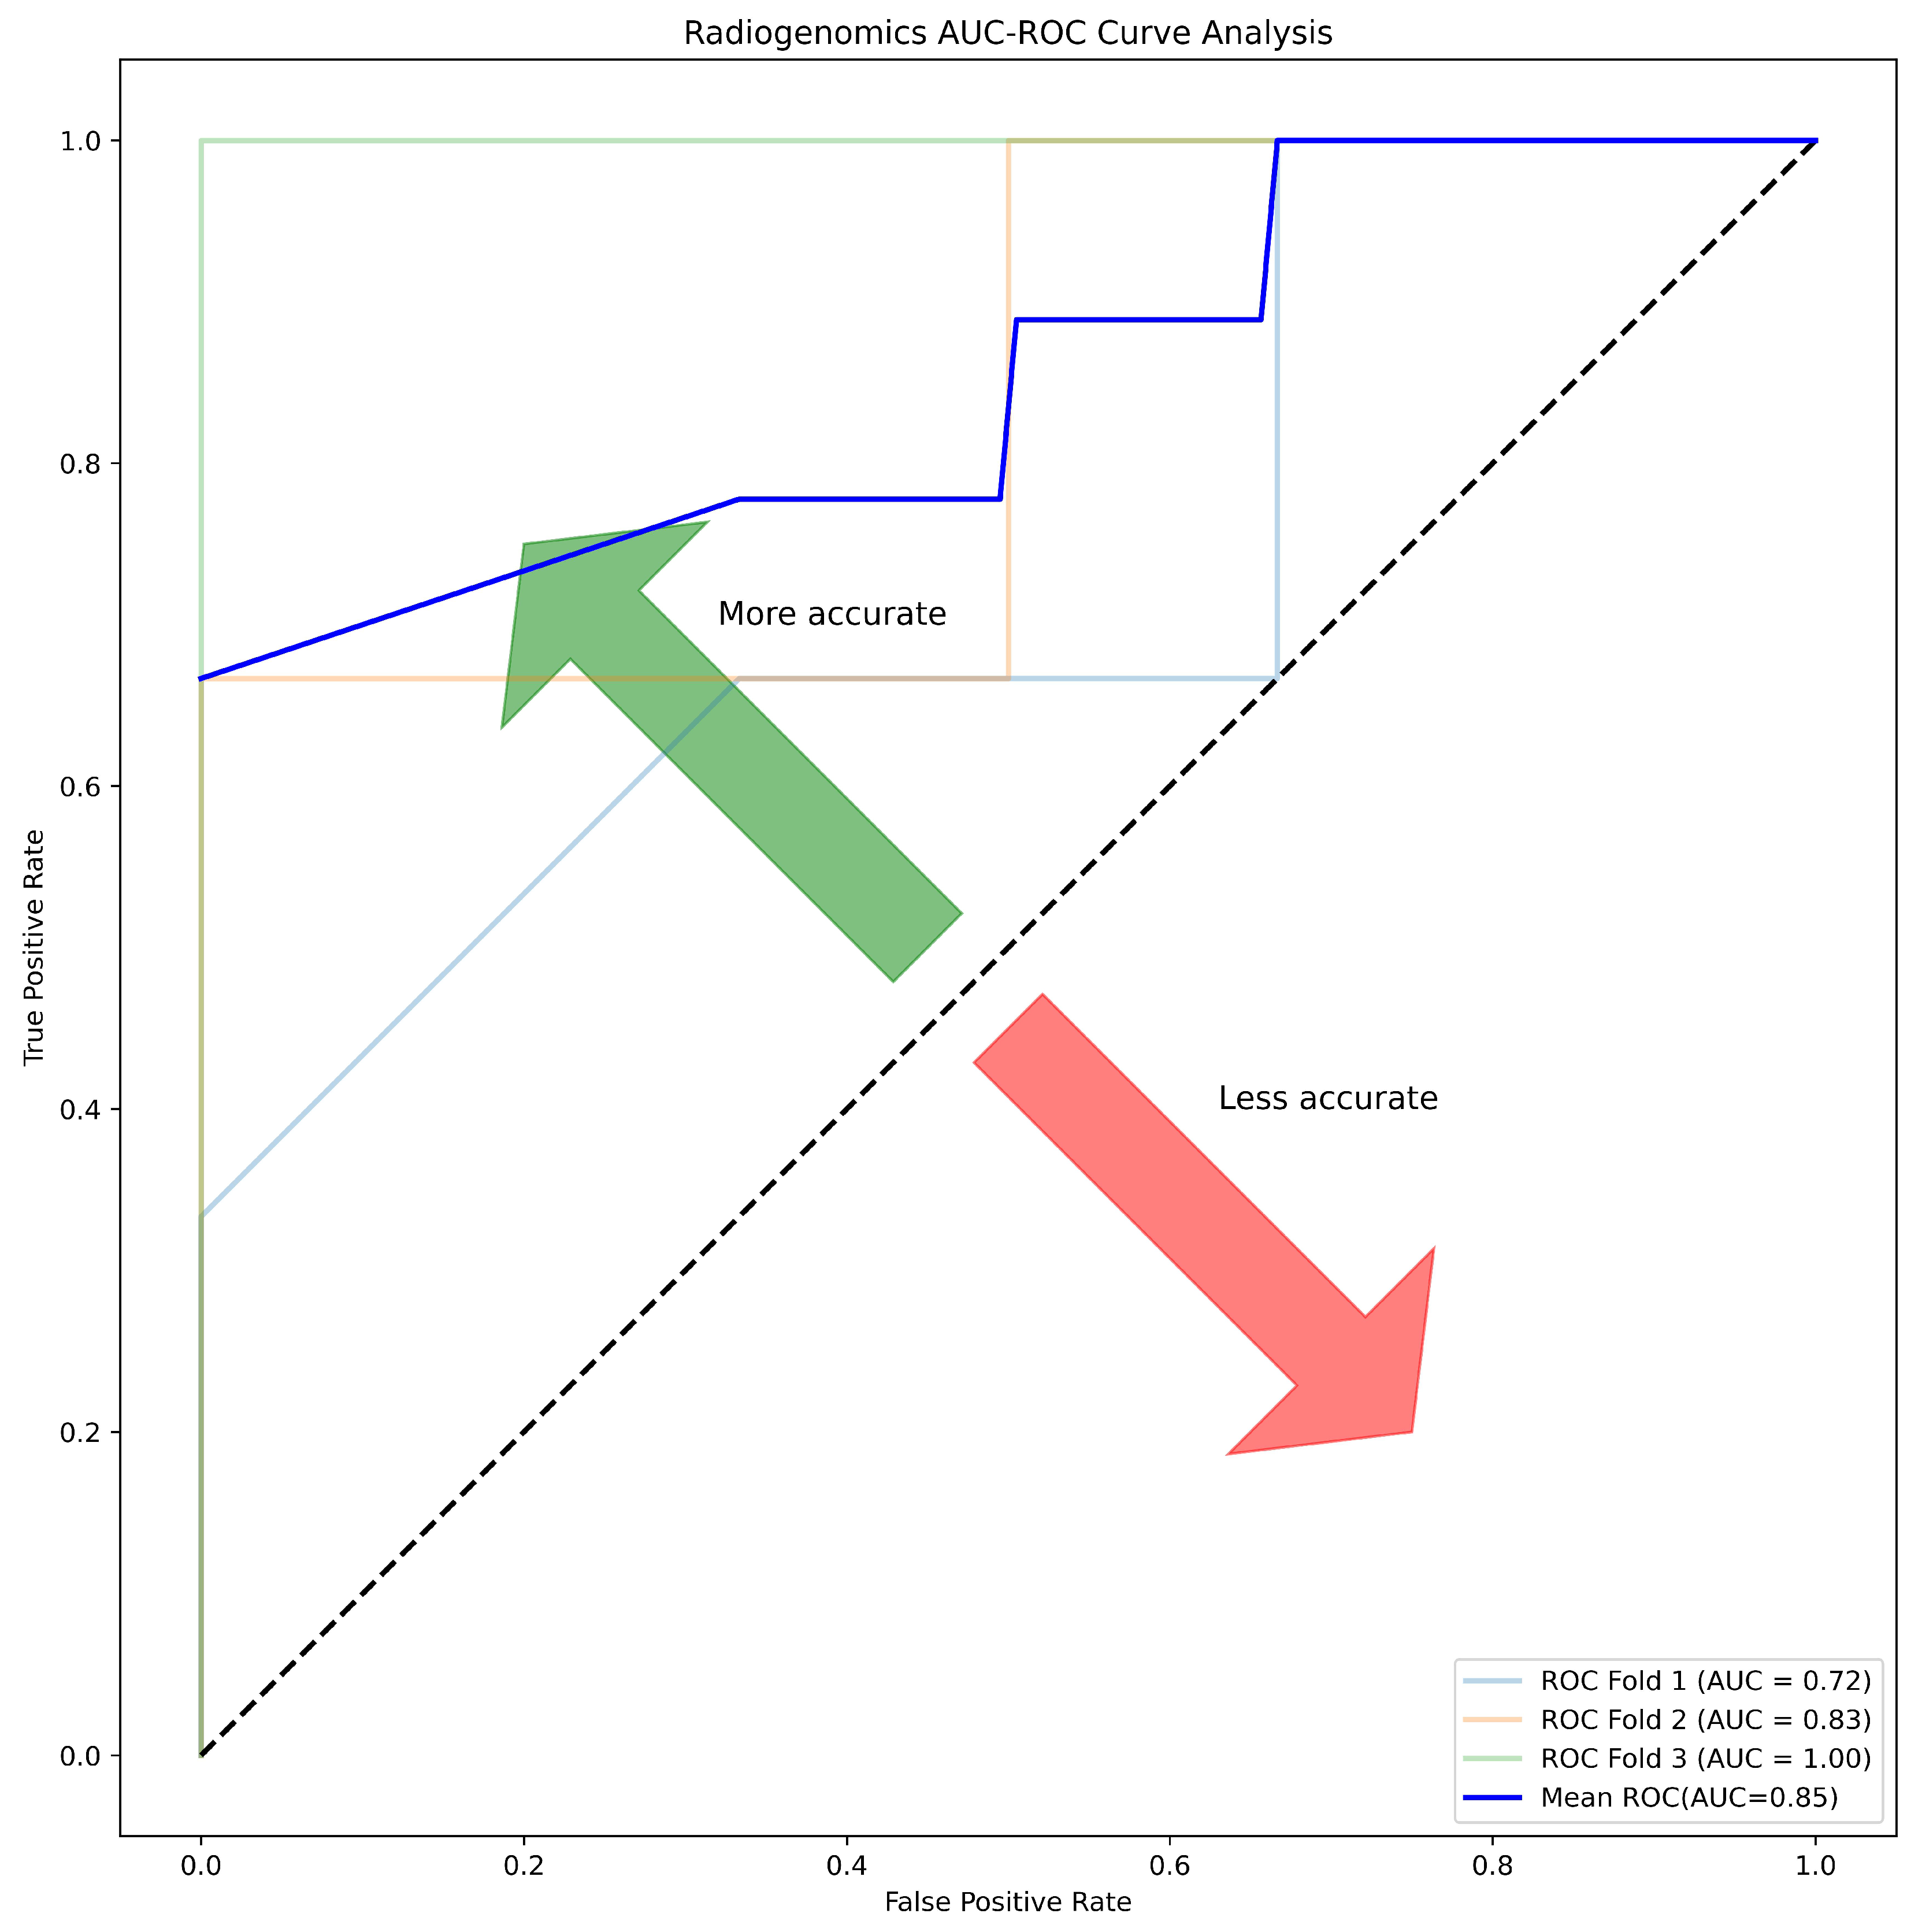
| Patients Characteristics | ||||
|---|---|---|---|---|
| Variable | RO | ChRCC | p-Value | |
| Age (Mean ± SD) | 63.5±8.67 | 61.40±7.13 | 0.653 | |
| tumour Size | 3.60±1.47 | 3.80±1.09 | 0.791 | |
| Gender | 1 | |||
| Male | 6 (42.86%) | 7 (50.0%) | ||
| Female | 0 (0%) | 1 (7.14%) | ||
Disclaimer/Publisher’s Note: The statements, opinions and data contained in all publications are solely those of the individual author(s) and contributor(s) and not of MDPI and/or the editor(s). MDPI and/or the editor(s) disclaim responsibility for any injury to people or property resulting from any ideas, methods, instructions or products referred to in the content. |
© 2024 by the authors. Licensee MDPI, Basel, Switzerland. This article is an open access article distributed under the terms and conditions of the Creative Commons Attribution (CC BY) license (http://creativecommons.org/licenses/by/4.0/).


