
Submitted:
21 October 2024
Posted:
22 October 2024
You are already at the latest version
Abstract
There are different audit methods for analysing operational facts and identifying deficiencies in business process management. However, financial data and transactions indirectly relate to physical objects and their attributes, resulting in distinct characteristics for their analysis and auditing methods. It is important to find new methods for finding a process extraction solution based on the financial audit data space to increase the efficiency of the auditors' work by reducing their time costs and increasing the possibility of detecting financial anomalies in large amounts of financial data. The research presents discussed different financial data space (FDS) methods, and process mining (PM) that include related classifications of financial data and external and internal factors that can influence data behavior (value changes) and the peculiarity of FDS is that it includes not only the characteristics of financial data but also other operational characteristics (events, environmental and internal changes, business location) that may be related to the change in financial objects (FO) values. The authors of the paper discuss the prototypes of specific elements in financial data analysis that were developed using the Process Mining software tool Disco and present the conclusions of the effectiveness of the financial processes cube defined to increase the analytical possibilities of the auditor's work with large amounts of data, introducing more flexible functionality for the analysis of financial activities.
Keywords:
financial data
; process mining
; process cube
; composite dimensions
; financial process
1. Introduction
Enterprise software systems store substantial volumes of performance-related information, yet often lack a comprehensive understanding of their operational processes. Audit methods serve to analyse operational facts and identify deficiencies in business process management. Financial data and transactions indirectly relate to physical objects and their attributes, resulting in distinct characteristics for their analysis and auditing methods. Auditing, evolving over a century, remains a dynamic discipline inspecting an organisation’s accounts, but how significantly have analytical methods evolved in the past decade to aid auditors?
One of the novel analytical methods introduced is process mining by Aalst (Van Der Aalst, 2010, 2011, 2013). Process mining (PM) is a data analytics technology aiming to extract a process model, depicting a sequence of activities linked to specific real-world or virtual (information) entity types (cases). PM focuses on analysing a company’s historical activity data, outlining a sequence of events along the time axis captured in event logs (Van Der Aalst, et al., 2010; Adriansyah & Buijs, 2013; Alrefai, 2019). Numerous process mining technologies, tools, and applications are available, offering fact-based solutions and supporting process enhancements (Das & Schneider, 2007; Earley, 2015; Debreceny & Gray, 2010; Amani & Fadlalla, 2017; Gailly & Geerts, 2014; Gehrke, 2010; Gepp, et al., 2018; Mamaliga, 2013; Jans, et al., 2013).
The novelty of this work is related to the multidimensional cube describing the properties of financial data of operational processes, the structure of which increases the possibilities of multidimensional data research, creating a user-friendly semantic framework-a multidimensional model of financial data intended for the formulation of tasks of analyzing operational processes and related data.
Enterprise activity data is contained in large data warehouses of enterprise application systems (e.g., ERP systems), where complex dependencies between different types of entities are formed, which are linked to several dimensions of enterprise activity, which makes it difficult to determine the dependencies of entity attributes and analyze changes in their values over time periods.
The article describes how A Multi-Dimensional Financial Data model is used to formulate Process Mining task specifications in a user-friendly style in order to extract the actual business process model from data warehouse records. PM technology allows you to visualize process models, obtained dependencies of processes and their attributes, and calculate process parameters.
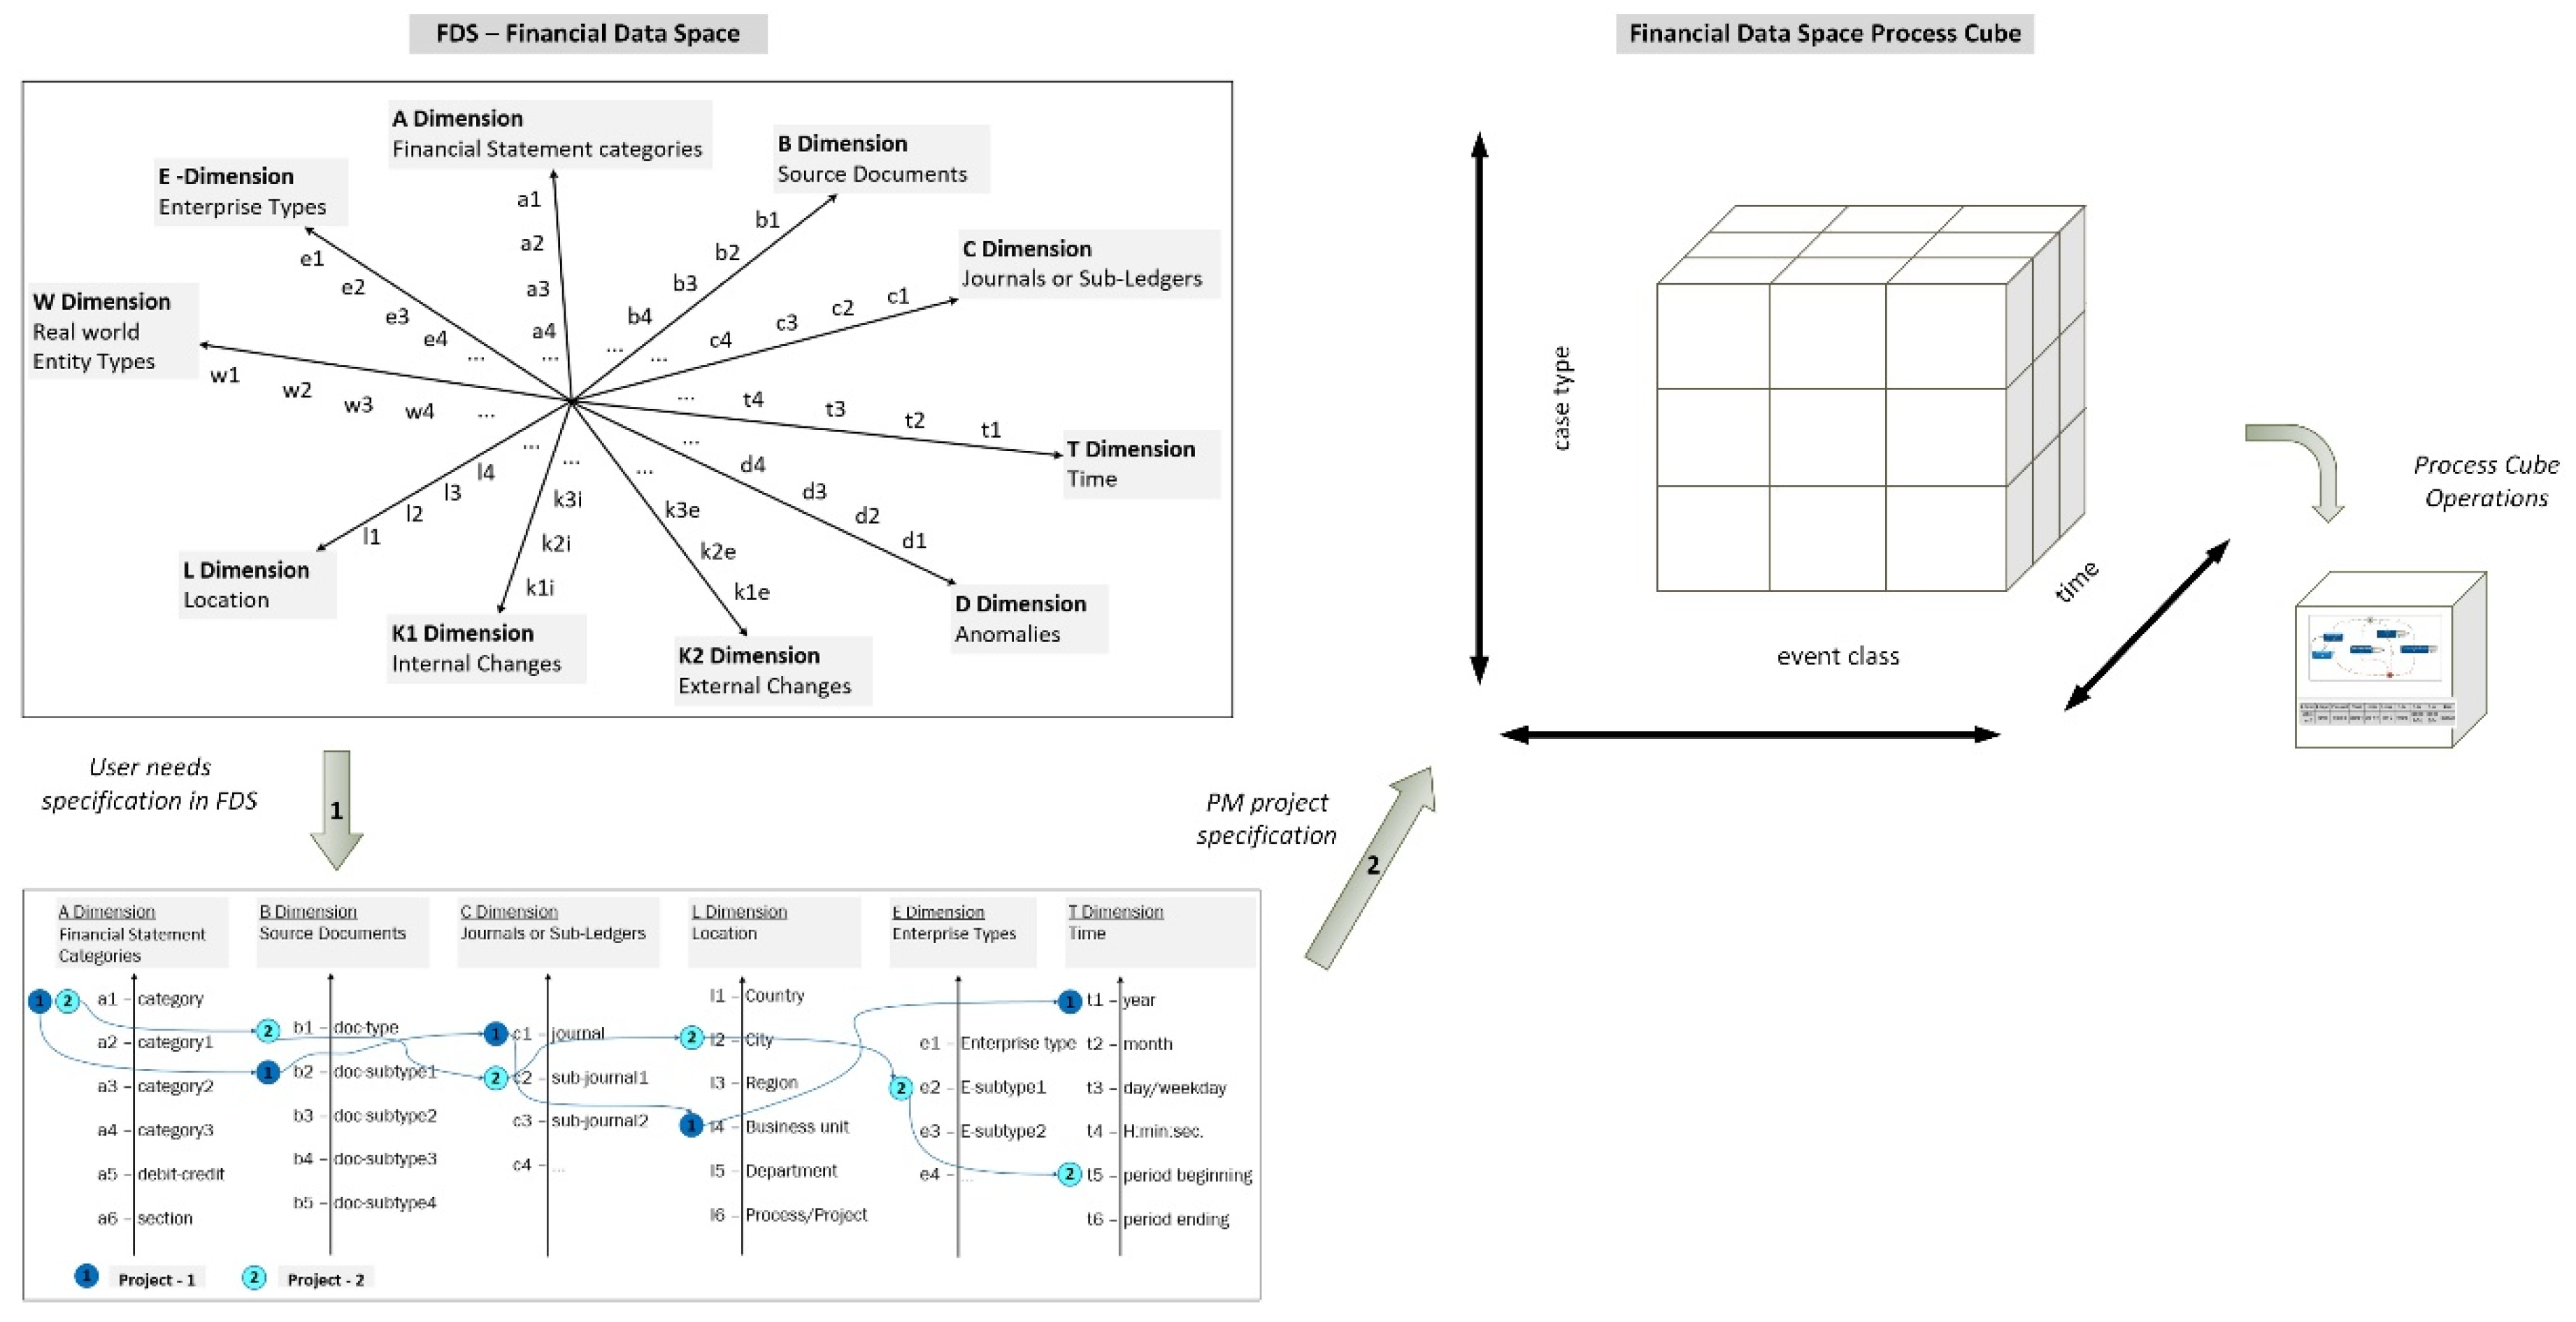
This article introduces a semantic user interface solution for integrating financial data analysis systems with process mining technology. Data analysis needs are articulated within a multidimensional semantic space, rooted in the classification of financial concepts and encompassing factors impacting financial data. Initially, the analyst outlines the financial data analysis task in the financial data space using typical financial terms. The multidimensional financial data space (FDS) serves as the foundation for a user-friendly interface for finance experts, ensuring a semantically clear declaration of financial data analysis requirements. It aids in transforming finance experts’ needs into process mining project specifications. Subsequently, the financial expert formulates the process mining task based on the declared financial data concepts. This way, the process mining task is specified within the financial data space, and the process mining project is translated into the appropriate financial process cube, implementing process mining operations. Expressing finance expert requirements in the FDS visually enhances the efficiency of auditors working with extensive multidimensional financial data. The subsequent stage involves transforming the description of the financial data analysis task within the FDS into the process mining project specification and mapping it to the relevant financial process cube. Financial process cube technology facilitates the utilisation of standard multidimensional data/process analysis operations (Slice, Dice, etc.), while visually presenting analysis results to the user.
This research describes the core components of a financial data analysis system (3-tier architecture) based on the financial data space framework (at the UI layer) and PM technology (at the Business logic layer), inclusive of the process cube (at the data layer). However, financial data and transactions possess distinct characteristics as they are indirectly linked to physical objects and their attributes, presenting specific challenges in analysis methods. This article introduces a financial data analysis solution that integrates process mining technology. The analysis requirement is first defined within the financial data space (FDS) and then refined into a process mining (PM) project specification. FDS serves as a semantically clear arena for analysing financial data and processes, comprising common concepts in financial activities. Its user-friendly visual interface enables analysts to create and modify process mining tasks online.
The PM project specification is generated by creating requirements for the analysis task in the A Multi-Dimensional Financial Data Cube (FPC), whose dimension semantics (structure of the cube) is well understood by auditors or managers. The use of FPC makes it possible to improve PM technologies (and Data MIning technologies), specifically-the style of the user interface (UI style) when working with multidimensional data.
The article is structured as follows: Section 2 discusses related work, encompassing challenges in financial data analysis and the benefits of process mining. Section 3 introduces the financial data space, a multidimensional semantic space organizing financial data and defining their dependencies. Section 4 elucidates the fundamental concepts of the financial process cube. Section 5 is dedicated to conclusions summarising the essential aspects of the described method.
2. Literature Review
2.1. Financial Data Analysis
Business process management, and enterprise data analysis are chiefly conducted through process-aware information systems such as enterprise resource management, accounting, and finance management systems. These software application systems compile process related data and events in the enteprise database (Adriansyah & Buijs, 2013; Debreceny & Gray, 2010; Gailly & Geerts, 2014; Werner, 2017).
Data analysis technique related to business processes–process mining is an expanding field of research focused on revealing the characteristics (various indicators) of business processes by analyzing data sets (Van Der Aalst, 2013; Alrefai, 2019; Gehrke, 2010; editor, 2021).
Process mining technology’s primary aim is to automatically construct a process model describing the sequence of events linked to a chosen entity, documented in an event log stored within the organisation’s information system. This technology centres on analysing historical process implementation data in the form of event logs (Van Der Aalst, 2010, 2011, 2013). Numerous process mining tools and applications offer fact-based support for process improvements and solutions, though it remains relatively new in accounting literature. PM viewpoint in the field of financialdata analysis presents challenges, particularly in fraud and anomaly detection by different authors (Adriansyah & Buijs, 2013; Alrefai, 2019; Das & Schneider, 2007; Earley, 2015; Amani & Fadlalla, 2017; Gailly & Geerts, 2014). Recent discoveries in process mining enable the discovery, analysis, and enhancement of business processes based on event data. However, the upsurge in event data also introduces new challenges in data management, preparation, and adaptation for further analysis (Gepp, et al., 2018; Jans, et al., 2013). Financial data analysis is inherently complex yet crucial for evaluating a company’s performance and identifying potential trends. The primary data sources include annual reports, financial statements, balance sheets, and/or general ledgers. This data characterises company processes and can be collected using diverse tools and information systems. Analysts can focus on various analysis aspects, such as summary data, trend analysis, data comparison, composition, variation mapping, and deviations from thresholds. The choice depends on collected data content and financial analysis objectives (Van Der Aalst, 2011; Alrefai, 2019; Gepp, et al., 2018; Jans, et al., 2013). Process mining (PM) stands out as a promising technology for analysing data changes and uncovering hidden relationships. PM, implemented using process cube technology akin to data cube applications in OLAP systems, organises events and process models using comprehensible dimensions. While a data cube operates on numerical values, each cell of a process cube corresponds to a set of events, allowing the discovery of process models (Van Der Aalst, 2013; Mamaliga, 2013; Bolt & Van Der Aalst, 2015). The process cube’s key dimensions relate to process case types, event classes, and a time axis (Van Der Aalst, 2013; Mamaliga, 2013; Bolt & Van Der Aalst, 2015; Werner, et al., 2012). Analysing process cube information poses challenges, hence the use of typical operations like slice, dice, roll-up, and drill-down for efficient process model discovery and analysis.
2.1. Financial Process Mining Solutions
Reinkemeyer (2020) presents process mining as used not only in classical administration processes but also in production, production control, development, financial services, and sales processes. Therefore, Process Mining fits into all areas, where IT is implemented “end to end” and cross-functional. Aals & Carmona (2022) discuss process mining aims to improve operational processes through the systematic use of event data. By using a combination of event data and process models, process mining techniques provide insights, identify bottlenecks and deviations, anticipate and diagnose performance and compliance problems, and support the automation or removal of repetitive work. Process mining techniques can be backwards-looking (e.g., finding the root causes of a bottleneck in a production process) or forward-looking (e.g., predicting the remaining processing time of a running case or providing recommendations to lower the failure rate). Moreover, process mining is an umbrella term for all data-driven process analysis techniques. It brings together the disciplines of data mining and BPM to gain insights into business processes. Process mining allows analysing a set of data, in particular, to better understand operational processes and enterprise activities (Jans & Laghmouch, 2023). Werner et al. (2021) discusses process mining as a novel data analysis technique which has been receiving increased attention in the audit practice. Process mining makes it possible to analyse business processes in an automated manner and the presented study investigates how process mining can be integrated into contemporary audits by reviewing the relevant audit standards and incorporating the results from a field study. However, Werner et al. (2021) declares that the audit of financial statements is a complex and highly specialised process. Digitalization and the increasing automation of transaction processing create new challenges for auditors who carry out those audits. New data analysis techniques offer the opportunity to improve the auditing of financial statements and to overcome the limitations of traditional audit procedures when faced with increasingly large amounts of financially relevant transactions that are processed automatically or semi-automatically by computer systems. Jans et al. (20210) identified the sources of value added of process mining when applied to auditing, which are as follows: (1) process mining analyses the entire population of data and not just a sample; (2) critically that data consists of meta-data—data entered independently of the actions of auditee—and not just data entered by the auditee; (3) process mining allows the auditor to have a more effective way of implementing the audit risk model by providing effective ways of conducting the required walkthroughs of processes and conducting analytical procedures; (4) process mining allows the auditor to conduct analyses not possible with existing audit tools, such as discovering the ways in which business processes are actually being carried out in practice, and to identify social relationships between individuals. If process mining is used in financial audits the generated models are used to discover incompliant behaviour. The provided process models should therefore be as precise and fitting as possible. If the produced process models are over-fitting certain behaviour recorded in the event log is not represented in the process model. The auditor would therefore assume that no incompliant behaviour has occurred (Werner& Gehrke, 2015). Specifically, process mining affords (1) perceiving end-to-end process visualisations and performance indicators, (2) sense-making of process-related information, (3) data-driven decision making, and (4) implementing interventions (Badakhshan et al. 2022). Moreover, Martin et al. (2021) declare that process mining include techniques for checking conformance between a control-flow model and an event log (Carmona et al. 2018), gaining insights in the involvement of resources in a process, or connecting PM to other techniques such as simulation and predictive process monitoring. Imran et al. (2023) presented a systematic literature review focused on the research area of process audits and explores the potential of process mining techniques for their enhancement. Traditional process audits, being manual and sample-based, heavily rely on auditors’ expertise and preferences.
3. Materials and Methods
Financial data space is introduced to systematise the data of financial transactions in the multidimensional semantic space, data preparation for deep analysis. One of the important practical goals of such analysis is the detection of anomalies in the values of financial data and anomalies in the variation of values. By analysing financial data using process mining techniques, financial institutions can gain insights into their operations and identify areas for improvement, leading to increased efficiency and profitability. We are focusing on two aspects, i.e., (1) multidimensional financial data space and (2) process mining aspects in financial data.
3.1. Basic Concepts of Financial Data Space
Enterprise activities-related data records are stored in the enterprise application software (EAS) databases. A company databases contain a set of files, each record of which consists of attributes linked to some real world entities and enterprise activities. Some subset of enterprise database content is financial data linked to source documents and financial statement reports, e.g., accounts payable, accounts receivable, customers, creditors, suppliers, etc. The concept “Financial Accounting Object” (FO) meets any field name (i.e., attribute) in a file record, such as the name of a column in an Excel spreadsheet, except for time attributes. Attributes describing time values (year, month, day,...) are not considered as financial accounting objects, but are mandatory time attributes related to FO. In our approach an abstract multidimensional space of financial accounting concepts is constructed that accommodates all FO types (associated financial data clusters or views) and financial data analysis views (external and internal factors) that can influence the behaviour of the data (change in value). The financial data space (FDS) is a semantic space (Figure 1) because it consists of a set of dimensions with meaningful names that correspond to essential aspects of the accounting and analysis of financial transactions (Gepp, et al., 2018). A FDS is fully characterised by a set of dimensions, each dimension having its own hierarchy of dimension members: FDS = {A, B, C, D, E, K1, K2, L, T, W}
Identified by: dimension A “Financial Statement Categories”, dimension B “Source Documents”, dimension C “Journals”, dimension D “Anomalies”, dimension E “Enterprise types”, dimension K1 “Internal Changes”, dimension K2 “External Changes”, dimension L “Location”, dimension T “Time”, dimension W “Real World Entity types”. FDS dimensions are hierarchical structures consisting of dimension members that specify a detailed classification of the FO type. Dimension member corresponds to the field (attribute) in a database record such as quantity, name, value, location, document, code, and so on. Financial data records on all activities and entities of the enterprise (accounts payable, accounts receivable, customers, creditors, suppliers, etc.) are located in the Financial Data Space. However, the FO type is related to the perspective of financial accounting or the aspect of financial data analysis. According to the needs of the financial analysis, only part of the FDS can be used in a specific task (project). Only a few FO dimensions can be included in a financial data analysis task; it depends on the requirements of the experts making the FO classification. Different FDS dimensions can be linked if the members of their dimension have at least one common attribute (identifier) in the database record. A brief description of the FDS dimensions is given in Figure 1 as a spider diagram:
- Dimension A (Financial statement categories) includes the hierarchy of basic financial statement (FS categories): a1-category, a2–category1 (sub-category), a3–category2 (sub-sub-category), a4–category3, a5–debit-credit, a6-section code. Examples of FDS A dimension members: a1-FS report types: Balance Sheet, Income Statement, Statement of Cash Flow,…; a2–category1: Assets–Property, Liabilities, Equity;…; a3–category2: MVA, IVA,..., OMZ, WIV,..; a4–category3: INCVR, DEB, CRE,…, etc. The categories of financial statements (FS taxonomy) depend on the laws of the particular country or the specifics of the company’s financial reporting system (Financial Statement Classification).
- Dimension B (Source documents) contains the hierarchy of document types, from documents with the most aggregated data to documents with the most detailed information. Examples of FDS B dimension members: doc-type (b1), doc-subtype (b2), doc-subtype2 (b3), etc. Examples of the B dimension members: doc-type (b1): Quotes, Orders, Invoices, Doc-subtype1 (b2): Vendors quote, Sales (credit) quote, Purchase (vendors) invoice,…;
- Dimension C (Journals or Sub-Ledgers) contains the hierarchy of special journals and subsidiary ledgers for recording transactions: Journal (c1), Sub-Journal (c2), Sub-subjournal (c3), etc. Examples of the C dimension members: Journal (c1): Starting Balance, Adjustment Ledger, Inventory and Item Ledger. Sub-journal (c2): Inventory accounting, Fixed asset accounting.
- Dimension D (Anomalies) contains the classification of types of inadequate data assessments: Anomaly type (d1), A-sub-type1 (d2), An-subtype2 d3), An-sub-type3 (d4), etc. Examples of D dimension members (anomaly types): (d1) Sum anomaly, (d2) Time parameters anomaly, (d3) Anomalies of sum and time, etc.
- Dimension E (Enterprise Types) contains the classification of enterprises (according to accepted standards): Enterprise Type (e1), E-SubType1 (e2), E-SubType2 (e3), etc.
- Dimension L (Location) includes the classification of geographic locations (according to accepted standards): Country (l1), City (l2), Region (l3), Business Unit (l4), Department (l5), Process /Project /(l6), etc.
- Dimension T (Time periods) is the classification of time intervals (periods) required in financial accounting, e.g., year (t1), month (t2), Day / week day (t3), Day: Hour: min: sec (t4), Hour: min: sec (t5), Period Beginning (t6), Period-Ending (t7).
- Dimension K (Changes) includes the classification of internal and external change types and can be divided into two axes:
-
Dimension K1 (Internal Changes-IC) includes the classification of internal change types (changes within the organisation) that may have an impact on financial activities: IC types (k1), IC-subtype1 (k2), IC-subtype2 (k3), etc.
- o Dimension K2 (External Changes-EC) includes the classification of the types of (external) changes in the organisation’s environment that may have an impact on financial activities: EC types (k1e), EC-subtype1 (k2e), EC-subtype2 (k3e), etc.
- o Dimension W (Real-world entity types) can be used to link financial data (financial objects) to real-world entities (objects, processes, infrastructure, purchases, devices, resources, other physical objects etc.).
The peculiarity of FDS lies in its incorporation of not just the attributes of financial data but also other operational characteristics (events, environmental and internal changes, business location) that might influence the alteration in FO values.
3.2. Process Mining Aspects in Financial Data
The process mining technology aims to discover a process model of a related entity (object) from data records named Eventlog. This discovered process model reveals a sequence of events (activities) along the time axis associated with a set of attributes of the entity (object). The specification of a Financial process mining project significantly differs from traditional Process Mining due to the specific nature of financial data and financial processes (operations, transactions). In this context, financial processes refer to the actions taken by the Finance Office to record and analyse the content of financial transactions. Typically, these processes include, but are not limited to: accounting, budgeting, planning, and other procedures categorised according to the company’s financial policies. Financial transactions are stored as a set of financial data records in the company’s database. The sequence and steps of these transactions can be discovered, visualised, and statistically described using Process Mining (PM) technology. Given that the finance department has defined mandatory procedures for documenting financial transactions, process mining tools assist in analysing financial data consistency within a time axis. This can be executed across any required cross-section, i.e., for any event log attribute. With PM tools, actual maps of financial activities such as FO dependency graphs and FO workflow diagrams are created, and various statistics (e.g., process frequency, duration) can be calculated. The use of PM technology discloses tangible information that aids in understanding data dependencies, the sequence of tasks (transactions), and the personnel (departments) involved. Key concepts of PM are summarised as follows:
- Financial (accounting) object (FO): Any name of the data record field (attribute, e.g., a column name of the Excel sheet), excluding time attributes. Any specific FO has a defined value, meaning, or code in the data record.
- FOs are classified, including types of financial statements, types of source documents, ledgers, and sub-ledgers (journals, etc.).
- The current financial analysis problem is defined as a process mining project aimed at revealing the behaviour of a specific FO type along the time axis, i.e., modelling the behaviour of FO-related data values and their differences across time periods.
- Source data for PM: A subset of financial data records, with each record comprising financial object values, meanings, or codes. This dataset in a PM project is considered as an event log.
- An event is one financial data record in an event log consisting of the following fields: at least one field being a time parameter value (time stamp), and all other fields are called financial objects (having a specified value or code).
- Three essential attributes define a PM project: Case ID, Activity ID, and Time window (Time stamp).
- Case-a sequence of activities related to a specific finance object (defined by Case ID) compiled from event log entries.
- Case ID-any selected finance object or a composition of a few finance objects from the financial data record, except those included in the Activity ID.
- Activity ID-any selected finance object or a composition of a few finance objects (data record fields), except those included in the Case ID.
The result of the financial data PM project-the behavioural model of the financial object (process model) and statistics describing the interactions between different FOs (process indicators).
The analysis of financial data using PM technologies has distinctive features, which are briefly outlined in the scheme of the Process Mining project structure in Figure 2.
Typically, a PM project specification is tailored to analyze specific financial aspects within enterprise activities, such as sales, purchasing, or asset management. The raw data structure in PM can be envisioned as a record comprising a set of FOs: FO(1), FO(2),..., FO(i),..., FO(n). Each FO(i) could be likened to an attribute, much like column names in an Excel table. The central elements of a PM project specification (Figure 2) encompass Case ID, Activity ID, and Timestamp. In essence, a chosen FO(i) is assigned the role of “Case” (represented in the table column “Case ID”), which correlates with another FO(j) designated as “Activity” (found in the table column “Activity ID”) along the temporal axis (indicated in the table column “Timestamp”). The objective lies in uncovering the “trajectory” of a selected FO (defined as a “case”) within data records along a timeline, relating it to another FO (defined as an “activity”) also recorded within the same dataset. Consequently, the “points” on the FO trajectory, representing a “case,” are instances of another FO (defined as an activity) positioned along the temporal axis. Generally, a PM project aims to unveil the “trajectory” of a real-world entity, such as an order for goods or services, by tracing the sequence of events tied to that entity (events linked to actions, locations, or organizational roles) recorded in a dataset. It’s reasonable to designate only certain fields in a data record as “case,” as others might lack real-world significance. Financial process mining holds distinct characteristics owing to the unique nature of financial data. As FO represents a feature of a business process (an informational entity) indirectly linked to physical objects through document content, any FO (be it a financial indicator, code, or document type) can be designated as either a “case” or an “activity,” unlike in real-world process mining. This flexibility provides diverse and broader prospects for shaping PM specifications.
3.3. Methods
3.3.1. Process Mining Project Specification Using Financial Data Space in Two Different Projects
We present a user-friendly way to specify data analysis needs and PM projects using FDS dimensions and dimension members from Figure 1. The needs for data analysis are first identified in the FDS. Depending on the specific needs of the expert, the required subset of FDS dimensions is selected, and required dimension members are indicated. An example of data analysis view specifications (Project-1 and Project-2) in the FDS is presented in Figure 3. In the second step, this initial task is refined, and a PM project specification is formed, specifying the Case ID, Activity ID, and Timestamp. A relevant financial process cube will be constructed on the basis of the PM project specification.
Depending on the capabilities of the PM tools used, the different cases s of the PM project specifications are available on the basis of the same data analysis needs specification in the FDS projects 1 and 2
Project 1. Process mining tool allows simple IDs
In this case, we specify a PM project with the Case ID and Activity ID consisting of one dimension member as depicted in Figure 4a. This is illustrated by the PM specification of Project-1 in Figure 3 which includes combination of dimensions (A-B-C-L-T): Case ID = < a1 > & Activity ID = < b2 > &TimeStamp < t1 > & Attributes ID = < c1, l4 >.
Figure 4a. Process Mining specifications: different complexity of Case ID and Activity ID (Simple IDs).
Figure 4b. Process Mining specifications: different complexity of Case ID and Activity ID (Complex IDs).
Project 2. Projects with complex IDs including different dimensions
In this case, you can specify the PM project with the Case ID and Activity ID consisting of multiple FDS dimensions and dimension members, as depicted in Figure 4b. For example, the PM tool Disco (Fluxicon, n.d.) provides the ability to create composite keys (IDs). The specification of Project-2 in Financial Data Space (Figure 3) is further refined by creating a Process Mining project with complex Case ID and Activity ID (see Figure 4b). The defined Case ID and Activity ID are complex because each of them includes not one but several FDS dimensions: Case ID = <a1 + b2> & Activity ID = <c2 + l4> &TimeStamp < t5> & Attributes ID = <e2>.
3.3.2. Participants
The main users of the proposed solution are auditors or experts involved in external or internal financial audits.
3.3.3. Procedure
According to FDS criteria (Figure 1), a case specification (Figure 2) is created, on the basis of which, using the PM methodology, the process model of the analysed subject area is formed according to the criteria chosen by an auditor. FDS-based semantic process mining system interface is presented in Figure 11. By using a process model generated for a specific case, an auditor gains an advantage in the efficiency of the analysis process, compared to working in a traditional way using primary data sources (i.e., log files).
3.3.4. Data Collection and Analysis
Data collection is carried out using data submission templates pre-agreed with a specific organisation, which provides the raw data (log files) necessary for the audit. By applying data analysis algorithms, raw data is processed by evaluating data quality criteria (such as Accuracy, Validity, Uniqueness, Completeness, Consistency, Timeliness, Integrity), data suitable for the audit process is prepared, which the auditor analyses according to the FDS based analysis criteria required for each case.
This article illustrates the practical application of FDS using the Disco PM tool, but in practice, auditors can use any PM tool capable of generating a process model.
The experimental part aims to demonstrate the suitability of FDS for the analysis of any subject area, the result of which is to create a Process model using the PM tool (in this case Disco tool) and visualize it in a dependency map diagram.
4. Results
4.1. PM Projects’ Specifications and Results
A small dataset was created for the experiment, the structure of which (a header) and snippet of data records is in Figure 5. The first line corresponds to the required FDS axes, which will be transformed into process cube dimensions. The second line specifies the required dimension elements that define the specific boundaries of the process cube to be filled with data, pre-processed to perform PM operations. This dataset is structured so that it can be used to illustrate the versions of the process mining specification shown in Figure 4a,b.
Figure 5 shows an example of the dataset structure that will be used in the following experiment. The test data provided for this experiment uses 27 source documents of 5 different types for a particular period of time specified using Timestamp.
This fragment of depersonalised data for the ongoing experiment is taken from a real data set used by the internal financial auditors of a particular organisation to identify financial anomalies. Typically, financial auditors work with sets of hundreds of thousands or millions of records, but this type of data sample will be quite sufficient to create a process model, which is a component of the proposed solution. We will run the first PM task that uses elementary Case ID and Activity ID. PM specification of Project-1 includes simple IDs (see Figure 4a):
- ‘Report ID /category-a1’ → Case ID
- ‘Doc-subtype1-b2’ → Activity ID
- ‘Financial Year’ → Timestamp (Pattern: ‘yyyy’)
- Other attributes: ‘Report type’, ‘Sub-journal-c4’, ‘Business_Unit-l4’, ‘Region-e2’, ‘Financial Period (Start Date)’, ‘Financial Period (End Date)’, ‘Transaction Count’.
An example of the discovered dependency graph (map) of PM Project-1 is presented in Figure 6.
PM specification of Project-2 includes complex IDs (see Figure 4b). We will construct two different PM specifications for the same initial data and examine the resulting process discovery results. The first PM specification (version 1) using complex IDs according to Project-2 data analysis requirements is as follows:
- ‘Report ID /category-a1’ → Case ID
- ‘Doc-subtype1-b2’ → Case ID
- ‘Sub-journal-c2’ → Activity ID
- ‘Business_Unit-l4’ → Activity ID
- ‘Financial Year’ → Timestamp (Pattern: ‘yyyy’)
- Other attributes: ‘Report type’, ‘Region-e2’, ‘Financial Period (Start Date)’, ‘Financial Period (End Date)’, ‘Transaction Count’
An example of the discovered dependency graph (map) of PM Project-2 is presented in Figure 7 where Case ID = (Category (a1) + Doc-subtype (b2)) and Activity ID = (Sub-journal (c2) + Business_unit (l4)) are complex IDs.
The discovered dependency graph of PM Project-2 (Version 1) reveals:
- a set of cases, where a case is a pair (FS category (a1), Doc-subtype (b2)),
- a set of events where an event (activity) is a pair (sub-journal (c2), business_unit (l4)) and
- a set of traces of events (activities) for each case.
An example of the trace (process flow) generated by PM tool for Case ID (Report No.2, Sales (credit)) quote) is presented in Figure 8.
The second PM specification (version 2) using complex IDs according to Project-2 requirements is as follows:
- ‘Report ID /category-a1’ → Case ID
- ‘Doc-subtype1-b2’ → Case ID
- ‘Business_Unit-l4’ → Activity
- ‘Sub-journal c2’ → Activity
- ‘Financial Year’ → Timestamp (Pattern: ‘yyyy’)
- Other attributes: ‘Report type’, ‘Region e2’, ‘Financial Period (Start Date)’, ‘Financial Period (End Date)’, ‘Transaction Count’.
An example of the discovered different dependency graph (map) of PM Project-2 is presented in Figure 9 where complex Case ID = (Category (a1) + Doc-subtype (b2)) is the same, but complex Activity ID is different: Event ID= (Business_unit (l4) + Sub-journal (c2)).
Discovered dependency graph of PM Project-2 (Version 2) reveals:
- a set of cases, where a case is a pair (FS category (a1), Doc-subtype (b2)),
- a set of events where an event (activity) is a pair (Business_unit (l4), sub-journal (c2)) and
- a set of traces of events (activities) for each case.
An example of the trace (process flow) generated by PM tool for Case ID (Report No.2, Sales (credit)) quote) is presented in Figure 10.
Process flow models in Figure 8 and Figure 10 are examples of different process mining views of the same event dataset. The process flow model in Figure 8 reveals a sequence of events where more important is the tracing of the source document type (sub-journal (c2)) and, next-location (Business_unit (l4)). The view of process flow model in Figure 10 is different, where more important is the tracing of location (business_unit (l4) and, next-source document type (sub-journal (c2)). Different process models (dependency graphs and process flow models) can be obtained from the same raw dataset when different process mining view is defined, i.e., different Case ID and Activity ID are specified in the PM project specification. Using Composite IDs (Case ID and Activity ID) it is possible to create Case ID and Activity ID as combinations of several different FO values (FO(1), FO(2), FO(3),...FO(n)) and retrieve their causal dependencies (process models), make different combinations and get different dependence maps (different process models). Such an analytical capability reveals hidden causal dependencies between different FOs and required combinations of FOs. This is a novel technological basis for conducting audits, as it is possible to investigate very complex dependencies between FOs using PM tools online. One of the promising directions of application of this method is the detection of anomalies in financial data and their behaviour assessment, using behavioural change indicators (Lopata, et al., 2022). This task has new opportunities when applying PM, examining dependency graphs, process flow models and statistical indicators.
5. Discussion
5.1. Design Implication on Basic Concepts of Financial Process Cube
The notion of a process cube is related to the OLAP (Online Analytical Processing) data cubes, adapting the OLAP paradigm to process mining technology based on the event data records analysis (Research and technology, n.d.). A process cube is a multidimensional space where the event data is presented and organised using different dimensions. Each cell in the process cube corresponds to a set of events that can be transformed into the process model by any process mining technique. Process mining assumes the existence of an event log-a collection of data records (entries) with a set of attributes, which will be used to specify the PM project. An initial event log is a set of events that have certain attributes (properties), but no attributes are defined as cases and activities.
According to the specific requirements of the expert, a financial process cube is created that clearly shows the mapping of the required dimensions of the Financial Data Space (see Figure 1) to the Process Cube axes (Case type, Event class, and Time window). An example of the Financial Process Cube includes only few a axes of the Financial Data Space:
- Case type = A dimension (Financial statement categories)
- Event class = B dimension (Source documents) and
- Time window = T dimension (Time)
In this case, financial process cube dimensions are related to FDS axes: vertical dimension Case type = FS categories; horizontal dimension Event class = Source documents, diagonal dimension Time window = year. The Financial Process Cube is defined as follows: FPC = (Case type = A dimension: FS categories), Event class = B dimension: Source documents), Time window = T dimension: Financial Period). All other axes of the financial data space are not shown because these axes are not included as mandatory PM Project-1 parameters Case ID and Event ID, they only play the role of other attributes in the event log entries. In the next step PM project specification must be declared indicating three attributes of the event record as mandatory identifiers (Case ID, Event ID and Time stamp). Other attributes of the same event record are optional elements of the PM specification, i.e., extra information, for example, resources, people, or data elements recorded with the event. However it is necessary to prepare financial data for every cell in the process cube-to create an event log and specify the PM task (project) with the parameters Case ID, Activity ID and Time ID (Van Der Aalst, 2011, 2013). Thus, an event log can be seen as a list of cases (a multiset of traces) and each case can be seen as a sequence of activities laid out on the axis of time. There is sample process mining demonstrated by Project-1 and Project-2 specifications (see Figure 3) in the relevant Process Cube environment. In general, the PM project specification is defined as follows: PM-project = {Case ID, Activity ID, Timestamp, Attributes (a1-ID, a2-ID,…, a99-ID,…)}. The defined Financial Process Cube includes only required FDS axes out of the available ones. The specification of Project-1 in the FDS (Figure 3) is transformed to the specification of process mining Project-1 in the Financial Process Cube as follows:
- Case type: Case ID = FS Report (a1)
- Event class: Activity ID = doc-subtype1 (b2)
- Time window: Financial period = year (t1)
- Attributes = {journal (c1), business unit (l4), E-subtype (e2)}
The data set (event records) of the PM project specified in this way will be in the sub-cube of the Process Cube (Case type, Event Class, Time window) whose coordinates are (Category (a1), Doc-subtype (b2), Financial period (t1-year)). By definition, each cell in the Process Cube corresponds to some event log (sub-log) containing financial transaction entries (financial data records) and is associated with the process model (derived by PM or given as input, i.e., predefined model). In general, the Case type and Event class axes of the Financial Process Cube can be composite. This can be explained by the specific nature of the financial data. Financial indicators, their accounting document types are information subjects (FO-financial objects). An example of a more complex Process Space is developed for the specification of process mining Project-2 (Figure 3). The specification of process mining Project-2 in Figure 3 requires to use complex IDs as follows:
- Case ID = {category1 (a2) + doc-type (b1)}
- Activity ID = {sub-journal (c2) + city (l2)}
- Time stamp = {period beginning (t5)}
- Attributes = { E-subtype (e2)}
Such a PM project specification requires the construction of a more complex process cube covering more than three FDS dimensions. In this case, the Case type and Event class axes of the process cube can be composite. The Case type axis is composite because it includes members of two FDS dimensions (A dimension and B dimension): Case ID = {category1 (a2) + doc-type (b1)}. The Event class axis is composite because it includes members of two FDS dimensions (C dimension, and L dimension): Activity ID = {sub-journal (c2) + city (l2)}. Thus, the PM Project-2 specification requires the construction of a five-dimensional Process Cube that includes FDS dimensions (A, B, C, L) and a time dimension (T). Financial objects (information entities) can be linked to real-world entities (physical objects) only through their source document identifiers, which can contain RW object codes or names or other parameters. However, real-world entities (RW objects) are not involved in financial transactions. Due to this feature, financial transactions are separated from the properties of physical objects, which does not limit the various (logical) connections between FOs. Therefore, in general cases, different types of FOs existing in the Financial Data Space (Figure 1) can be combined if they are meaningful for the analysis of financial data. For example, a process cube with composite dimensions Case type and Event class can be defined, where: the composite dimension Case type consists of two internal dimensions (A dimension, B dimension) and the composite dimension Event class consists of two internal dimensions (C dimension, L dimension).
A single case of a Process Cube with composite dimensions that meets the needs of PM described in Project-2. In such a process cube with composite dimensions Case type and Event class, complex PM tasks can be formulated when combinations of different internal dimension values in Case type and / or Event class dimensions are formed. In such a process cube with composite dimensions Case type and Event class, a set of complex PM tasks can be formulated by combining internal dimension values by defining a Case type ID and, independently, by combining internal dimension values by defining an Event class ID. Consider an example of defining a set of complex PM tasks. Let us define the process cube with the composite axis Case type including three (abstract) dimensions Q1 = (q11, q12, q13, q14), Q2 = (q21, q22, q23) and Q3 = (q31, q32, q33, q34, q35): Case type = {Q1, Q2, Q3}
The number of different complex Case IDs available for PM project is calculated as a number of combinations of Q1, Q2 and Q3 dimensions members and the number of Case IDs is 60: Case ID(1) = (q31, q11, q21), Case ID(2) = (q31, q12, q21), …, Case ID(49) = (q35, q11, q21 Case ID (60) = (q35, q14, q23).
This shows the number of different Case IDs available in PM project specifications for the financial data analysis in the process cube with composite dimensions (Q1, Q2 and Q3 as defined above). Similarly, a complex Event class dimension of the process cube can be constructed using a few FDS axes (P1, P2, P3,…): Event class = {P1, P2, P3,...}.
A set of different Event class ID specifications can be created: Event class ID(1), Event class ID(2), …., Event class ID(m), where the value of m depends on the number of dimensions (P1, P2, P3,....) and the number of members of each of the dimensions. In general, a financial process cube FPC* with composite dimensions is defined as follows: FPC* = (Case type = { Q1, Q2,..., Qn}, Event class = {P1, P2,… Pk}, Time window = (T: Financial Period)). However, the technological realization of such a process cube with complex Case type and Event class axes is a separate challenging issue.
5.2. User-Friendly Interface with Process Mining Environment
The vision of the Financial Data analysis system is presented in Figure 11. The basic idea is to create a user-friendly semantic interface of the financial data analysis system with process mining capability.
Figure 11.
A semantic interface with process mining system using FDS.
Such a system would be able to transform the financial data analysis requirement defined in the FDS into a PM project specification in a user-friendly way. With the help of such a transformation, a wireframe of the convenient (friendly) user interface for a financial expert is presented in Figure 12. To create and navigate in the process cube space, financial expert can use the common financial accounting concepts and standard operations Slice, Dice, Drill Down (Roll Down) and Drill Up (Roll Up) described in (Van Der Aalst, 2013; Bolt & Van Der Aalst, 2015). With the help of these operations, a financial expert can perform online data research: form the necessary subsets of data, search for hidden dependencies between FOs, detect anomalous behaviour of FO values. Moreover, a financial expert can change the specification of a PM project online (using the FDS framework-based user interface (PM dashboard), thus exploring various options for data analysis using PM modelling tool capabilities.
Process cube operations are based on classic OLAP operations and are performed in the context of the Financial Process Cube. Next, we consider the classical OLAP operations in the context of the Financial Process Cube. We describe the two main operations SLICE, DICE and ROLL UP (DRILL UP) in detail due to limited scope.
The SLICE operation. The vertical dimension of Financial Process Cube FPC = {(Case ID = FS Categories), Time = Financial Year), (Event ID = Source documents)} denotes Case type = FS Categories. The hierarchy members (increasing granularity) of the vertical dimension FS Categories are (Section (a6), Debit-Credit (a5), Category3 (a4), Cate-gory2 (a3), Category1 (a2), Category (a1). The SLICE operation produces a new sub-cube view by filtering specific values for attributes within one of the selected dimensions while removing other dimension members from the visible part of the process cube. Example of SLICE operation. Let us say, the requirement for financial processes and data analysis relates to an FS Category member (debit-credit-a6) only. Specification of SLICE operation: SLICE on {FS Category (Case type = (debit-credit-a6)}. The result of the SLICE operation is a new sub-cube corresponding to a reduced volume data set including only Case type = debit-credit (a6), the other axes remaining unchanged. The data set specified in this way by the financial analyst will be in the sub-cube of the Process Cube (Case type, Event Class, Time window) whose coordinates are (Category (a5), Doc-subtype (b2), Financial period (t1-year)). This results in a subset of the data that includes only annual periodicity data, i.e., shorter periods are not taken into account.
If data is required only for the year 2020, another SLICE operation specification is drawn up as follows: SLICE on {Time window (year-t1 = 2020)}. In the next step, the PM project could be specified by declaring Case ID, Event ID, and Time ID relevant for the needs of audit or financial accounting analysis:
- ‘Report ID /category-a1’ → Case ID
- ‘Doc-subtype1-b2)’ → Activity ID
- ‘Financial Year’ → Timestamp (Pattern: ‘yyyy’)
- Other attributes: ‘Report type’, ‘Journal (sub-journal-c4)’, ‘Business_Unit-l4’, ‘Region-e2’, ‘Financial Period (Start Date)’, ‘Financial Period (End Date)’, ‘Transaction Count’
The DICE operation. The DICE operation produces a subcube by allowing the analyst to filter (pick) specific values for one or more dimensions. The result of the DICE operation is a new sub-cube corresponding to a reduced-volume data set. Example of DICE operation. Let us say, that the financial processes and data analysis relate to the process cube. Given a Cube where Dimensions = {(Case type = FS Categories, Event class = Source documents, Time window = Financial period)}. The user requirements relate to Case type dimension (FS Categories) member Debit-Credit (a6), Event class dimension (Source documents) member doc-subtype2 (b3), and the Time Window (Financial Year (t1)). Specification of DICE operation: DICE on {FS Categories) member Debit-Credit (a6) AND Document Type = (doc-subtype2 (b3)) AND Financial Period = (Financial Year (t1 = (2021, 2022)} The result of DICE operation is a new sub-cube corresponding to a reduced-volume data set. This results in a subset of the data that only includes data for 2021 and 2022 related to debit-credit (a6) transactions and doc-subtype2 (b3). Next, the PM project is specified in a new FPC of a higher level of granularity by selecting Case ID, Activity ID, and Time ID relevant for the audit or financial accounting analysis.
The Roll Up (Drill Up) operation. In terms of data set, the Roll Up (Drill Up) operation forms a subset of generalised financial accounting data (increases their granularity) that meets user requirements. Aggregated Financial Process Cube is a new FPC of a higher level of granularity (without Case type dimension member a6-Section). The Roll Up (Drill Up) operation is based on expert knowledge-financial accounting rules implemented in the code of operation. Roll Up operations performed in the Financial Data Space along the hierarchy of Dimension A (FS statements: FS reports (a1), category (a2), sub-category (a3),…) are described in Table 1. In summary, using semantically easy-to-understand typical Process Cube operations, a financial expert can form the required subset of domains in a user-friendly style. In the next step, the PM project is specified on the received dataset (i.e., sub-cubes), as described in the article above.
In terms of data set, the Roll Up (Drill Up) operation forms a subset of financial accounting data (a subset of records) that meets user requirements. The Roll Up (Drill Up) operation is based on expert knowledge-financial accounting rules implemented in the code of operation. Another PM project is specified in the new FPC of a higher level of granularity by selecting Case ID, Activity ID, and Time ID relevant for the audit or financial accounting analysis.
6. Conclusions
The paper presents a UX design-based approach to designing the user interface (UI) of process mining systems and data mining systems and is based on a conceptual semantic model named Financial Data Space (FDS). The Financial Data Space (FDS) presented in the study is a semantic space that includes the required dimensions of financial data and may also include external and internal factors that may affect data behavior (changes in FO value). The peculiarity of FDS is that it includes not only financial data characteristics but also other operational characteristics (entity types, types of events, environmental and internal changes, business location) that may be related to changes in FO values.
The dimensions K1 (internal changes), dimension K2 (external changes), dimension L (location) and dimension E (enterprise type) describe the characteristics of the activity type. In addition, Real-world entity types (Dimension W) can be used to link financial data (financial objects) to real-world entities (objects, processes, infrastructure, purchases, devices, resources, other physical objects, etc.). Process mining technology is used to extract the actual financial data value flow from event log records, visualise the resulting dependencies between financial data-related activities, and analyse the resulting statistical attributes.
The described system transforms the PM project specification into a corresponding Financial Process Cube, in which typical process cube operations (slice, dice, drill down, roll up) are implemented. The Financial Processes Cube is defined in such a way as to increase the analytical possibilities of the auditor’s work with large amounts of data, introducing more flexible functionality for the analysis of financial activities.
The process cube dimensions are constructed as compilation of the definite dimensions selected from the Financial Data Space. The three typical dimensions of the process cube, process case types, event classes and time window, allow creating semantically clear space for process mining of financial data by choosing the required process and data analysis views and data granularity. The presented method is the basis for the creation of an AI-powered process mining system, because the virtualized Financial Data Space is a semantic internal model of reality (it is stored in the knowledge base) that corresponds to the user experience, so it can evaluate and direct the user’s actions when the user formulates a PM task (PM project specifications).
The conducted research revealed the peculiarity of financial data analysis, which makes it possible to form complex Process Cube dimensions. The complex Process Cube dimension is formed as a combination of several FDS axes (a combination of members of different axes), which has a financial significance. Using composite Case ID and Activity ID it is possible to create combinations of several different FO values (FO(1), FO(2), FO(3),...FO(n)) and retrieve their causal dependencies (process models). Such an analytical capability reveals hidden causal dependencies between different FOs and required combinations of FOs. This is a new technological basis for conducting audits, as it is possible to investigate very complex dependencies between FOs using PM tools online.
A user-friendly UI based on financial concepts allows the analyst to create process mining tasks in the process cube environment and modify them online using common process cube operations. Prototypes of individual elements of financial data analysis were created using process mining software tool Disco (Fluxicon, n.d.). Conducted experiments show that the presented principles allow user-friendly monitoring of data behaviour in time, revealing non-trivial relationships of financial objects and detecting anomalous changes or value gaps based on process models.
Author Contributions
Conceptualization, A.L., R.B., V.R. S.G. and I.V.; methodology, A.L., S.G.; D.G, validation, A.L., R.B., I.V. V.R. and S.G.; formal analysis, I.V., D.G. A.L.; investigation, A.L., R.B., V.R., S.G., D.G. and I.V.; resources, A.L., R.B., V.R., S.G., D.G. and I.V.; data curation, A.L. I.V., S.G.; writing—original draft preparation, A.L., R.B., V.R., S.G., D.G. and I.V.; writing—review and editing, D.G., R.B., A.L, I.V.; visualization, A.L., I.V..; supervision, A.L.; All authors have read and agreed to the published version of the manuscript.
Funding
This research received no external funding.
Data Availability Statement
We use open or anonymized data.
Conflicts of Interest
The authors declare no conflicts of interest
References
- Adriansyah, A. A., & Buijs, J. J. “Mining Process Performance from Event Logs”. In Springer eBooks (pp. 217–218). (2013). [CrossRef]
- Alrefai, A.: “Audit focused process mining: the evolution of process mining and internal control”. Ph.D. thesis (2019). https://rucore.libraries.rutgers.edu/rutgers-lib/60514/PDF/1/play/.
- Amani, Farzaneh A., and Adam M. Fadlalla. “Data mining applications in accounting: A review of the literature and organizing framework.” International Journal of Accounting Information Systems 24 (2017): 32-58. [CrossRef]
- Badakhshan, Peyman, Bastian Wurm, Thomas Grisold, Jerome Geyer-Klingeberg, Jan Mendling, and Jan Vom Brocke. “Creating business value with process mining.” The Journal of Strategic Information Systems 31, no. 4 (2022): 101745.
- Bolt, Alfredo, and Wil MP van der Aalst. “Multidimensional process mining using process cubes.” In International Workshop on Business Process Modeling, Development and Support, pp. 102-116. Cham: Springer International Publishing, 2015. [CrossRef]
- Carmona J, van Dongen B, Solti A, Weidlich M (2018) “Conformance checking”. Springer, Heidelberg.
- Das, Kaustav, and Jeff Schneider. “Detecting anomalous records in categorical datasets.” In Proceedings of the 13th ACM SIGKDD international conference on Knowledge discovery and data mining, pp. 220-229. 2007. [CrossRef]
- Debreceny, Roger S., and Glen L. Gray. “Data mining journal entries for fraud detection: An exploratory study.” International Journal of Accounting Information Systems 11, no. 3 (2010): 157-181. [CrossRef]
- Earley, Christine E. “Data analytics in auditing: Opportunities and challenges.” Business horizons 58, no. 5 (2015): 493-500. [CrossRef]
- “Process Mining explained: techniques, applications, and challenges”. AltexSoft. 2021, June 11 [Accessed January 18, 2024]https://www.altexsoft.com/blog/process-mining/.
- Gailly, F., & Geerts, G. L. “Business process modeling: An accounting information systems perspective”. International Journal of Accounting Information Systems, 15(3) (2014), 185–192. [CrossRef]
- Gehrke, Nick. “Basic principles of financial process mining a journey through financial data in accounting information systems.” (2010).
- Gepp, Adrian, Martina K. Linnenluecke, Terrence J. O’Neill, and Tom Smith. “Big data techniques in auditing research and practice: Current trends and future opportunities.” Journal of Accounting Literature 40, no. 1 (2018): 102-115. [CrossRef]
- Jans, Mieke, and Manal Laghmouch. “Process Mining for Detailed Process Analysis.” Advanced Digital Auditing: Theory and Practice of Auditing Complex Information Systems and Technologies; Berghout, E., Fijneman, R., Hendriks, L., de Boer, M., Butijn, BJ, Eds (2023): 237-256.
- Jans, Mieke, Michael Alles, and Miklos Vasarhelyi. “The case for process mining in auditing: Sources of value added and areas of application.” International journal of accounting information systems 14, no. 1 (2013): 1-20. [CrossRef]
- Imran, Mohammad, Suraya Hamid, and Maizatul Akmar Ismail. “Advancing Process Audits with Process Mining: A systematic review of trends, challenges, and opportunities.” IEEE Access (2023).
- Lopata, Audrius, Saulius Gudas, Rimantas Butleris, Vytautas Rudžionis, Liutauras Žioba, Ilona Veitaitė, Darius Dilijonas, Evaldas Grišius, and Maarten Zwitserloot. “Financial data anomaly discovery using behavioral change indicators.” Electronics 11, no. 10 (2022): 1598.
- Mamaliga, Tatiana. “Realizing a process cube allowing for the comparison of event data.” Master’s thesis, TU Eindhoven (2013).
- Martin, Niels, Dominik A. Fischer, Georgi D. Kerpedzhiev, Kanika Goel, Sander JJ Leemans, Maximilian Röglinger, Wil MP van der Aalst, Marlon Dumas, Marcello La Rosa, and Moe T. Wynn. “Opportunities and challenges for process mining in organizations: results of a Delphi study.” Business & Information Systems Engineering 63 (2021): 511-527.
- Process mining and automated process discovery software for professionals - Fluxicon Disco. (n.d.). https://fluxicon.com/disco/ [Accessed January 18, 2024].
- Reinkemeyer, Lars. “Process mining in action.” Process Mining in Action Principles, Use Cases and Outloook (2020).
- Van Der Aalst, W. M. P. Process mining. In Springer eBooks. (2011). [CrossRef]
- Van Der Aalst, Wil MP. “Process cubes: Slicing, dicing, rolling up and drilling down event data for process mining.” In Asia Pacific Business Process Management: First Asia Pacific Conference, AP-BPM 2013, Beijing, China, August 29-30, 2013. Selected Papers 1, pp. 1-22. Springer International Publishing, 2013. [CrossRef]
- Van Der Aalst, W. M. P., Van Hee, K., Van Der Werf, J. M. E. M., & Verdonk, M.. Auditing 2.0: Using process mining to support tomorrow’s auditor. IEEE Computer, 43(3) (2010), 90–93. [CrossRef]
- Van der Aalst, Wil MP, and Josep Carmona. Process mining handbook. Springer Nature, 2022.
- Werner, Michael. “Financial process mining-Accounting data structure dependent control flow inference.” International Journal of Accounting Information Systems 25 (2017): 57-80. [CrossRef]
- Werner, Michael, Nick Gehrke, and Markus Nuttgens. “Business process mining and reconstruction for financial audits.” In 2012 45th Hawaii International Conference on System Sciences, pp. 5350-5359. IEEE, 2012. [CrossRef]
- Werner, Michael, Michael Wiese, and Annalouise Maas. “Embedding process mining into financial statement audits.” International Journal of Accounting Information Systems 41 (2021): 100514.
- Werner, Michael, and Nick Gehrke. “Multilevel process mining for financial audits.” IEEE Transactions on Services Computing 8, no. 6 (2015): 820-832.
Figure 1.
Basic Dimensions of Financial Data Space.
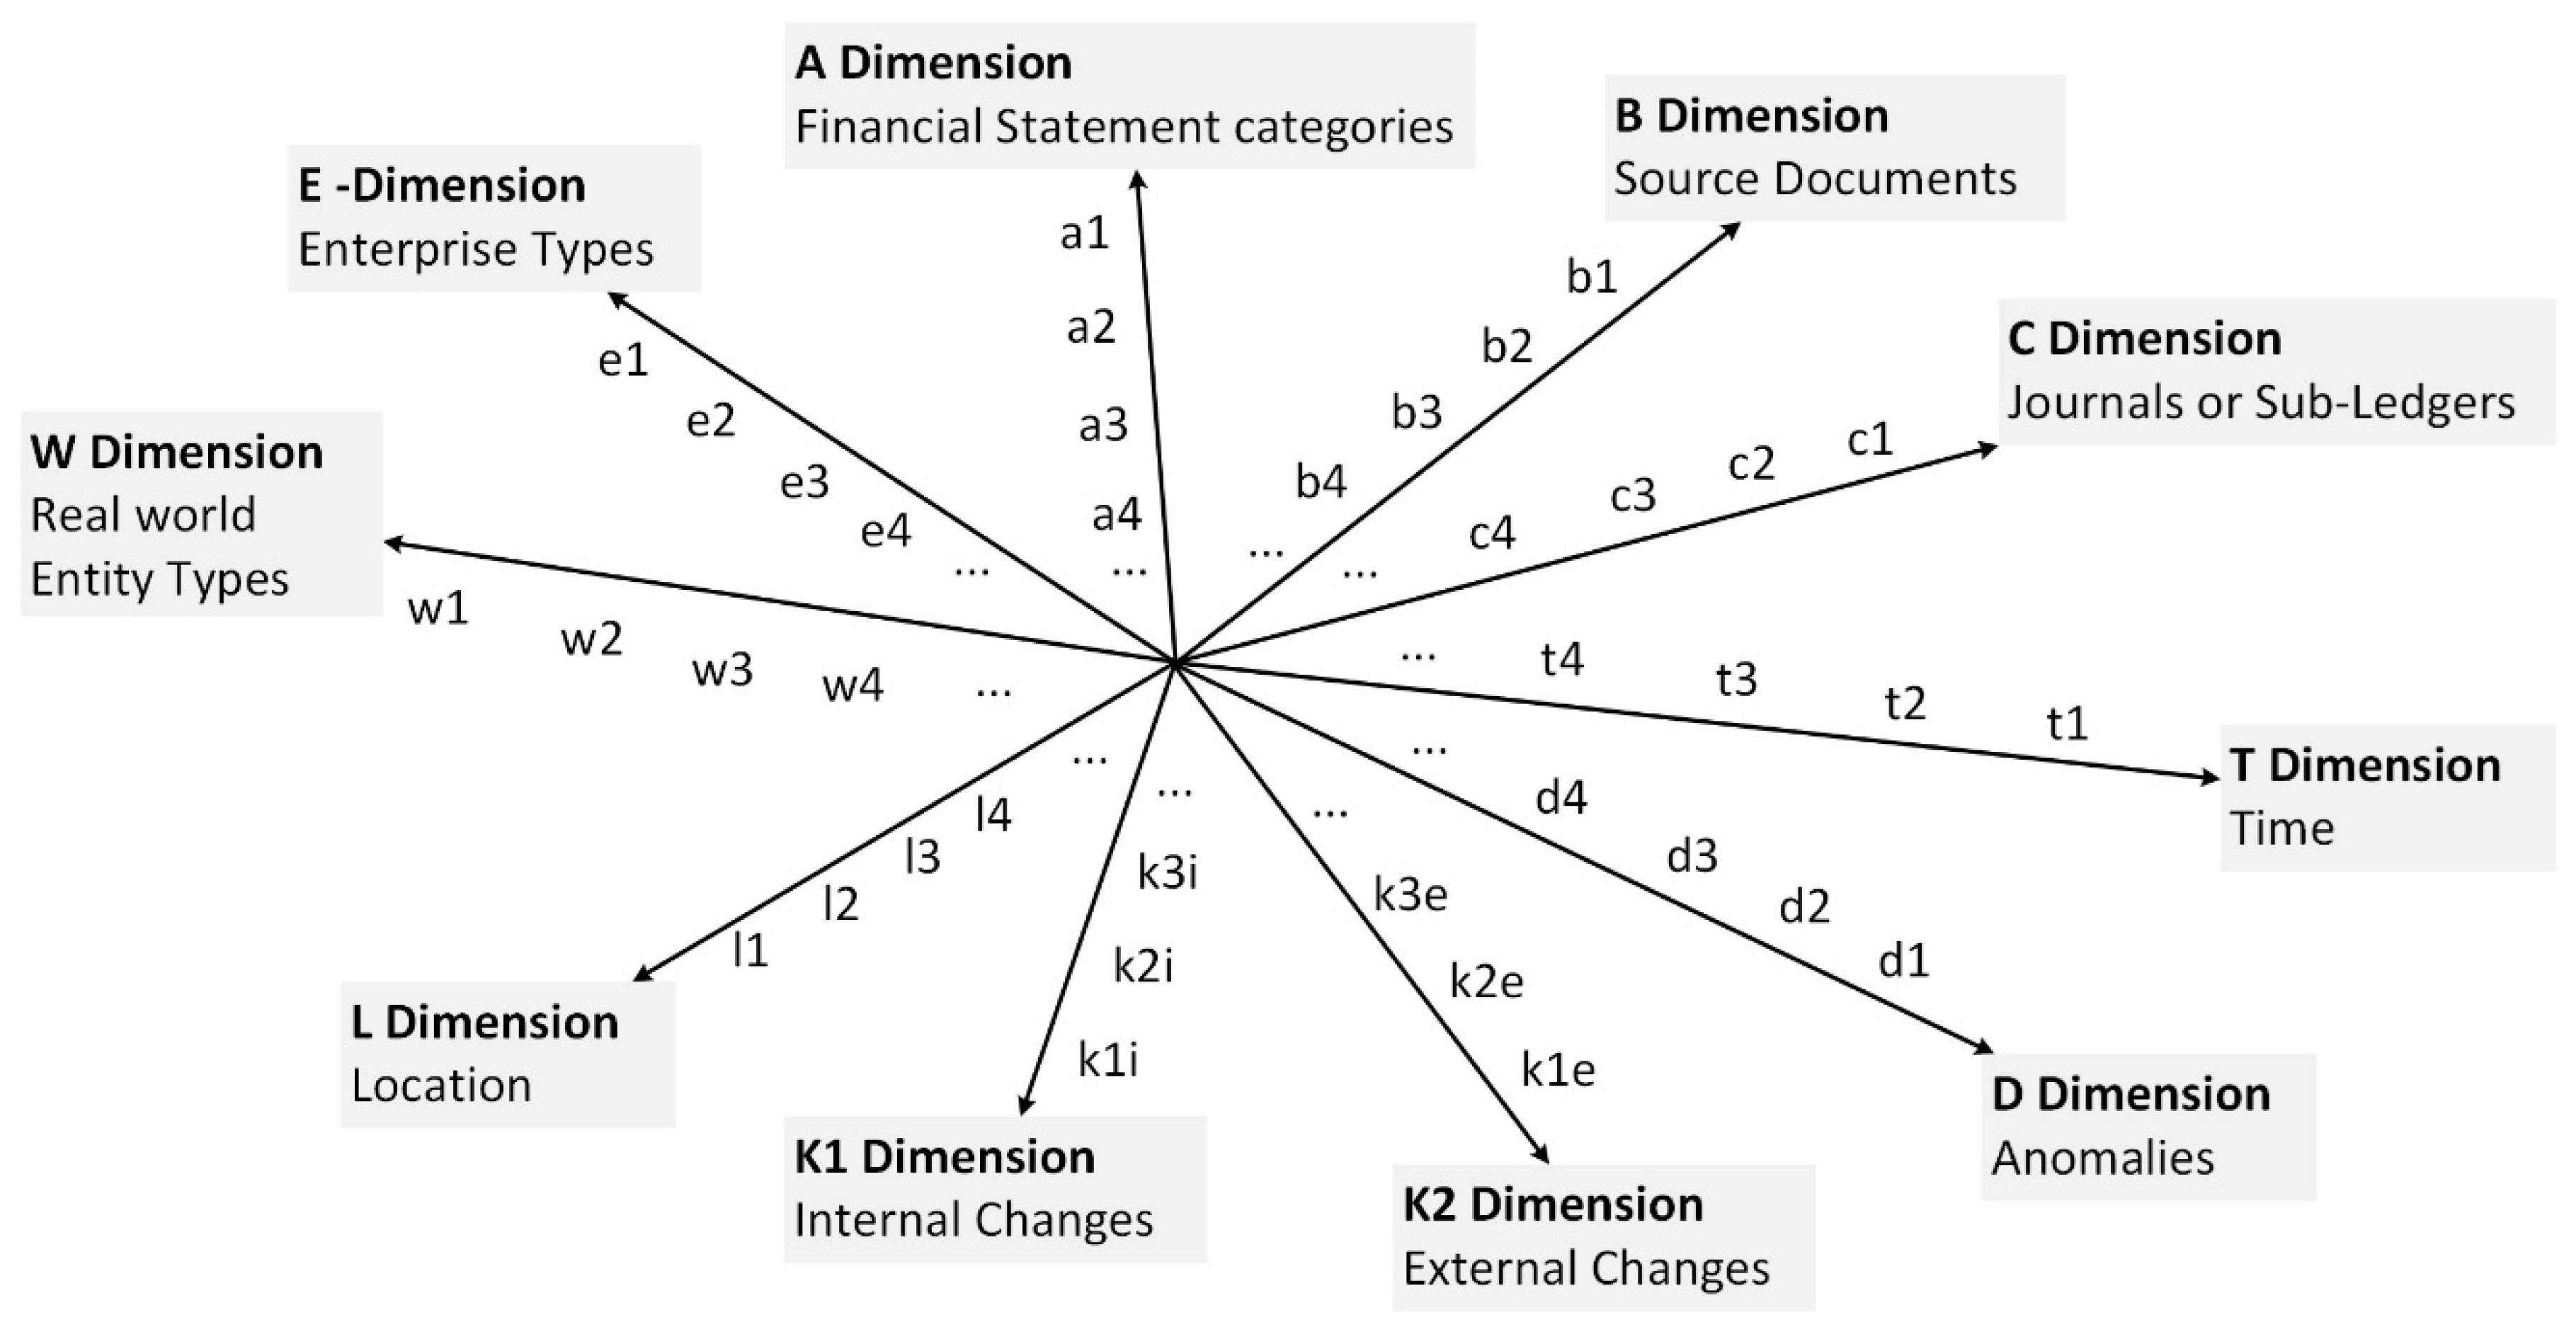
Figure 2.
Process mining project specification structure.
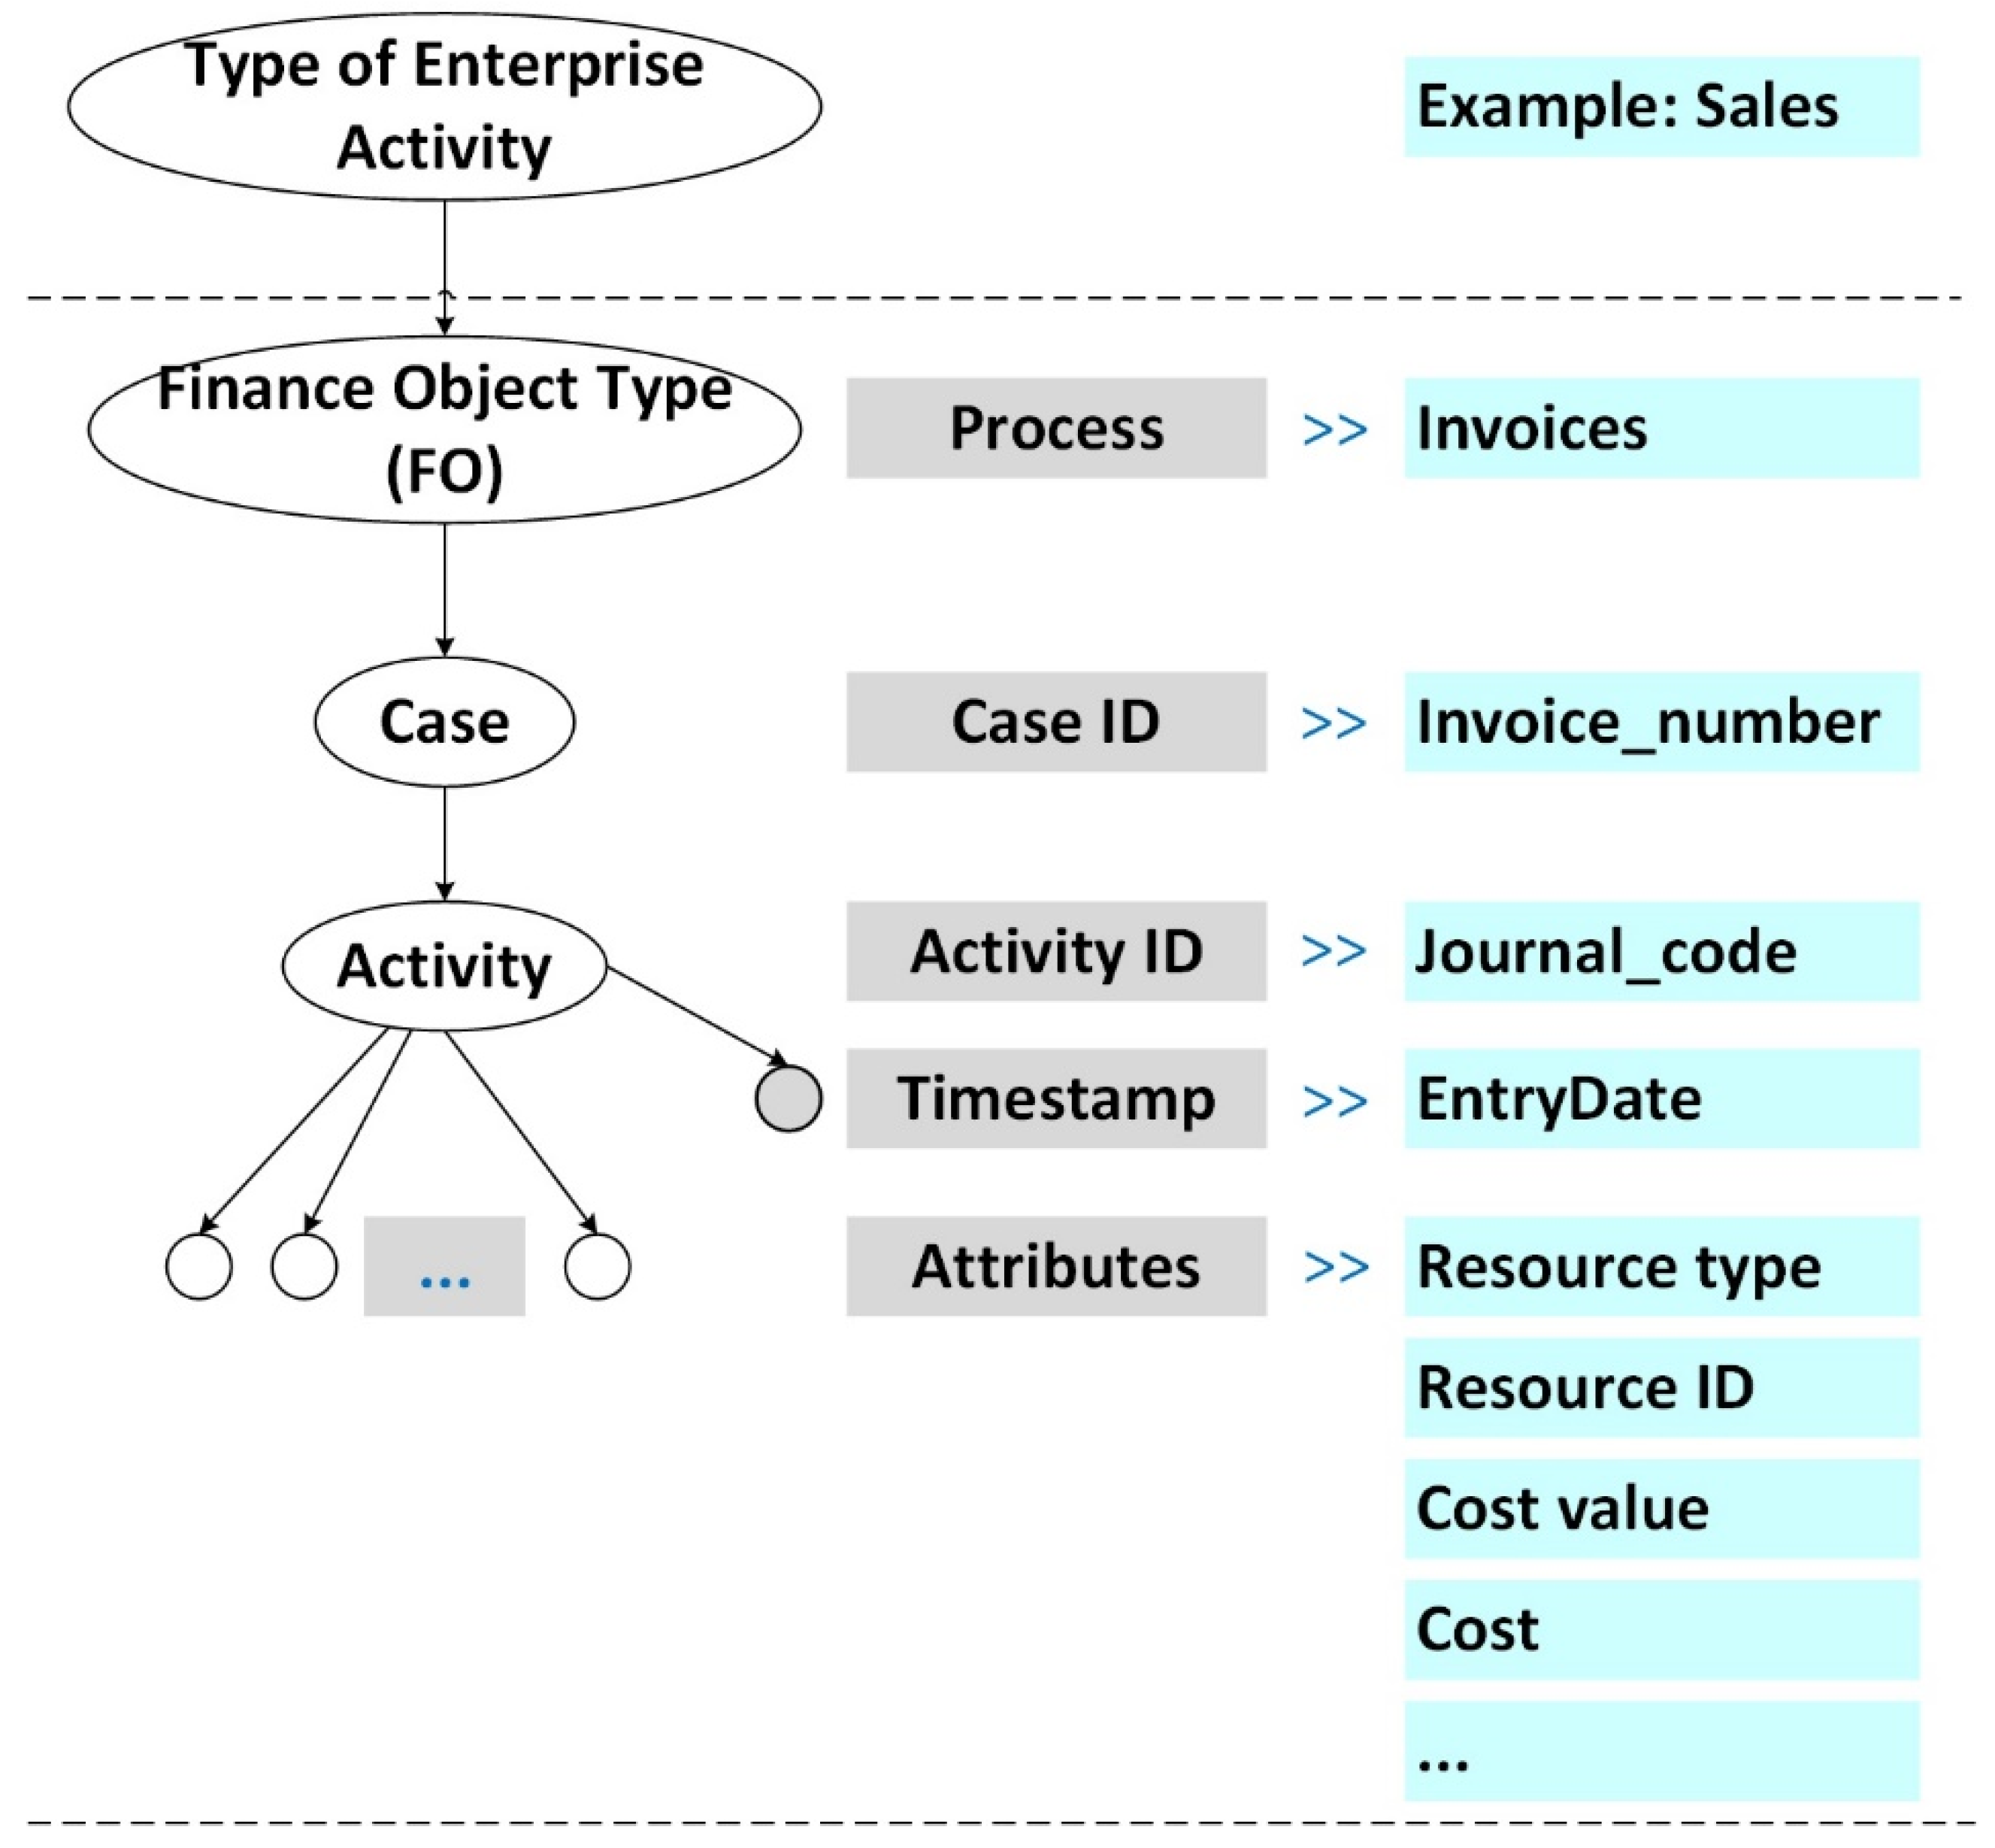
Figure 3.
Examples of data analysis view specification in the FDS.
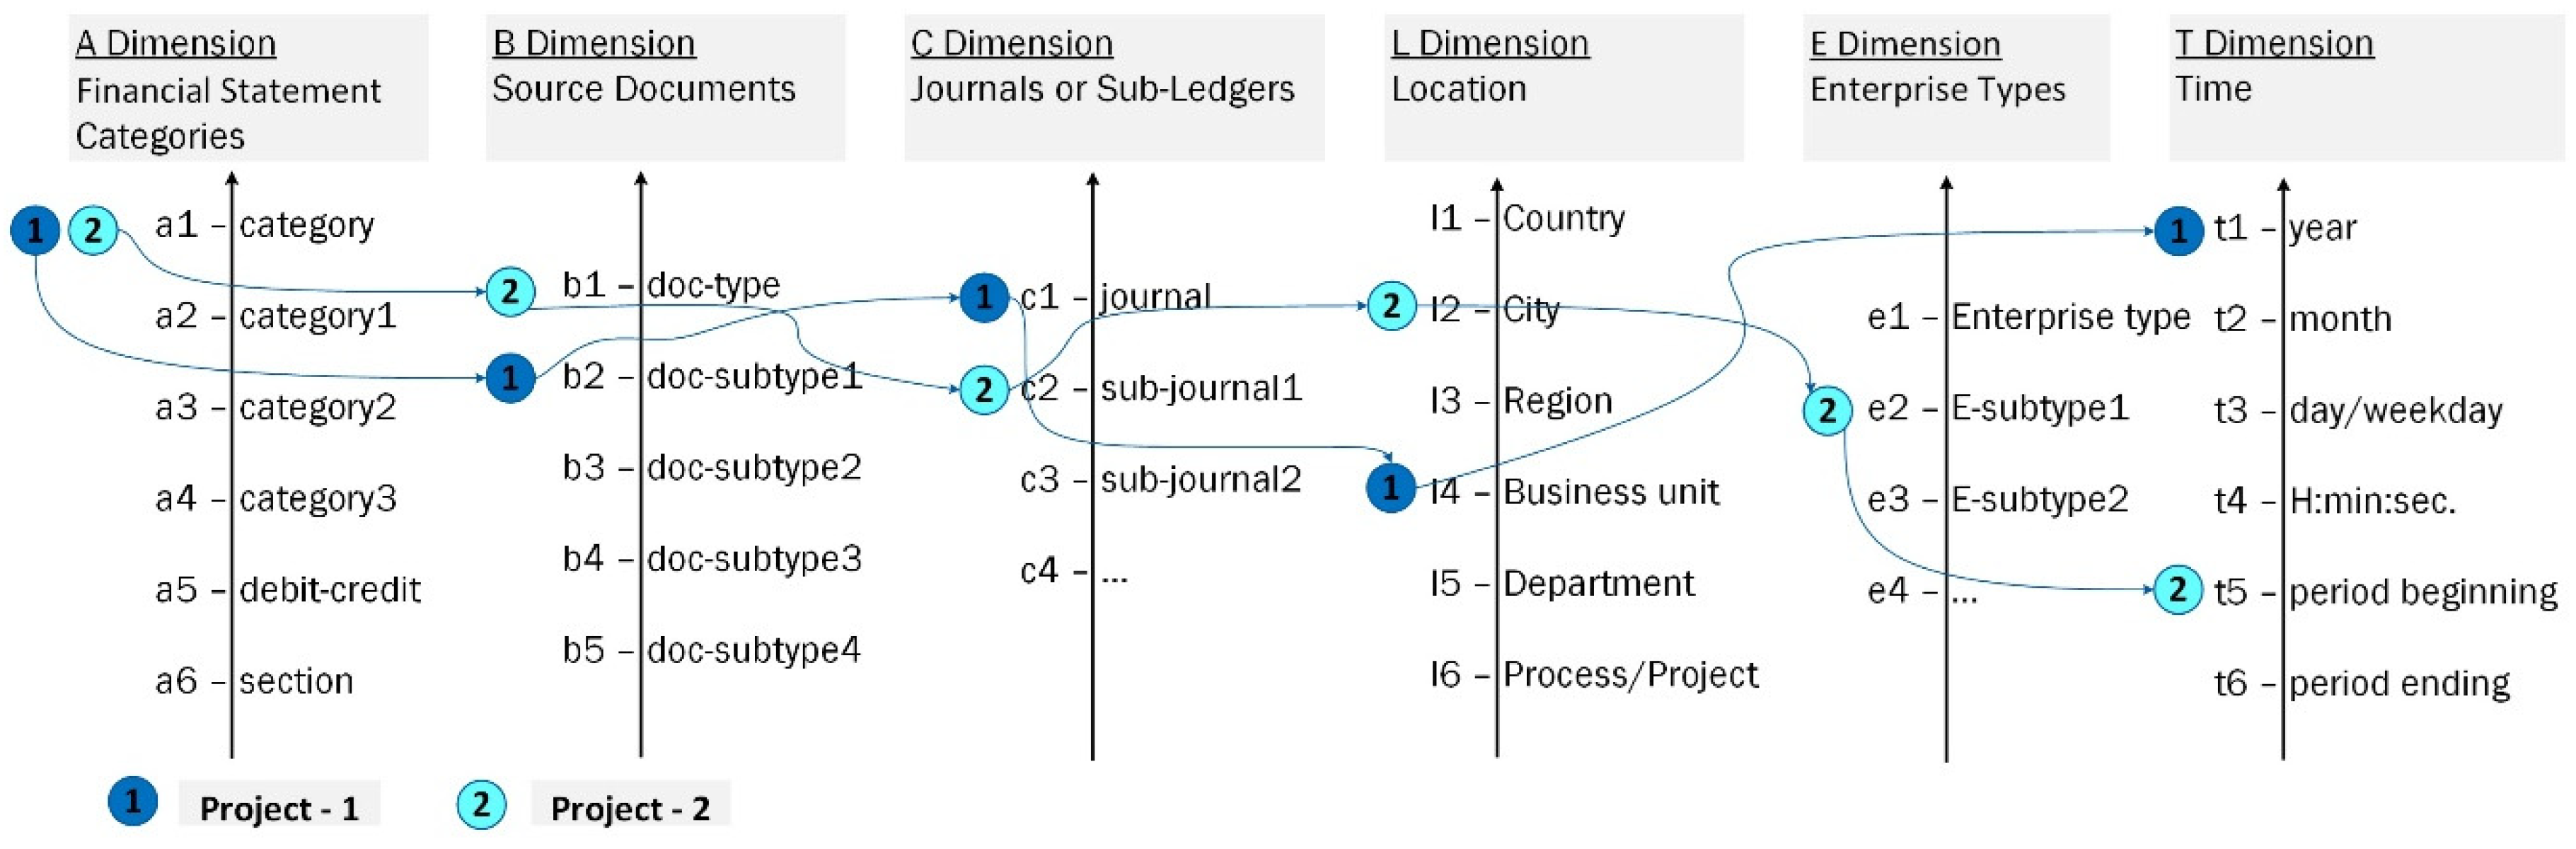
Figure 4.
(a). The process mining specification of project 1. (b). The process mining specification of project 2.
Figure 4.
(a). The process mining specification of project 1. (b). The process mining specification of project 2.
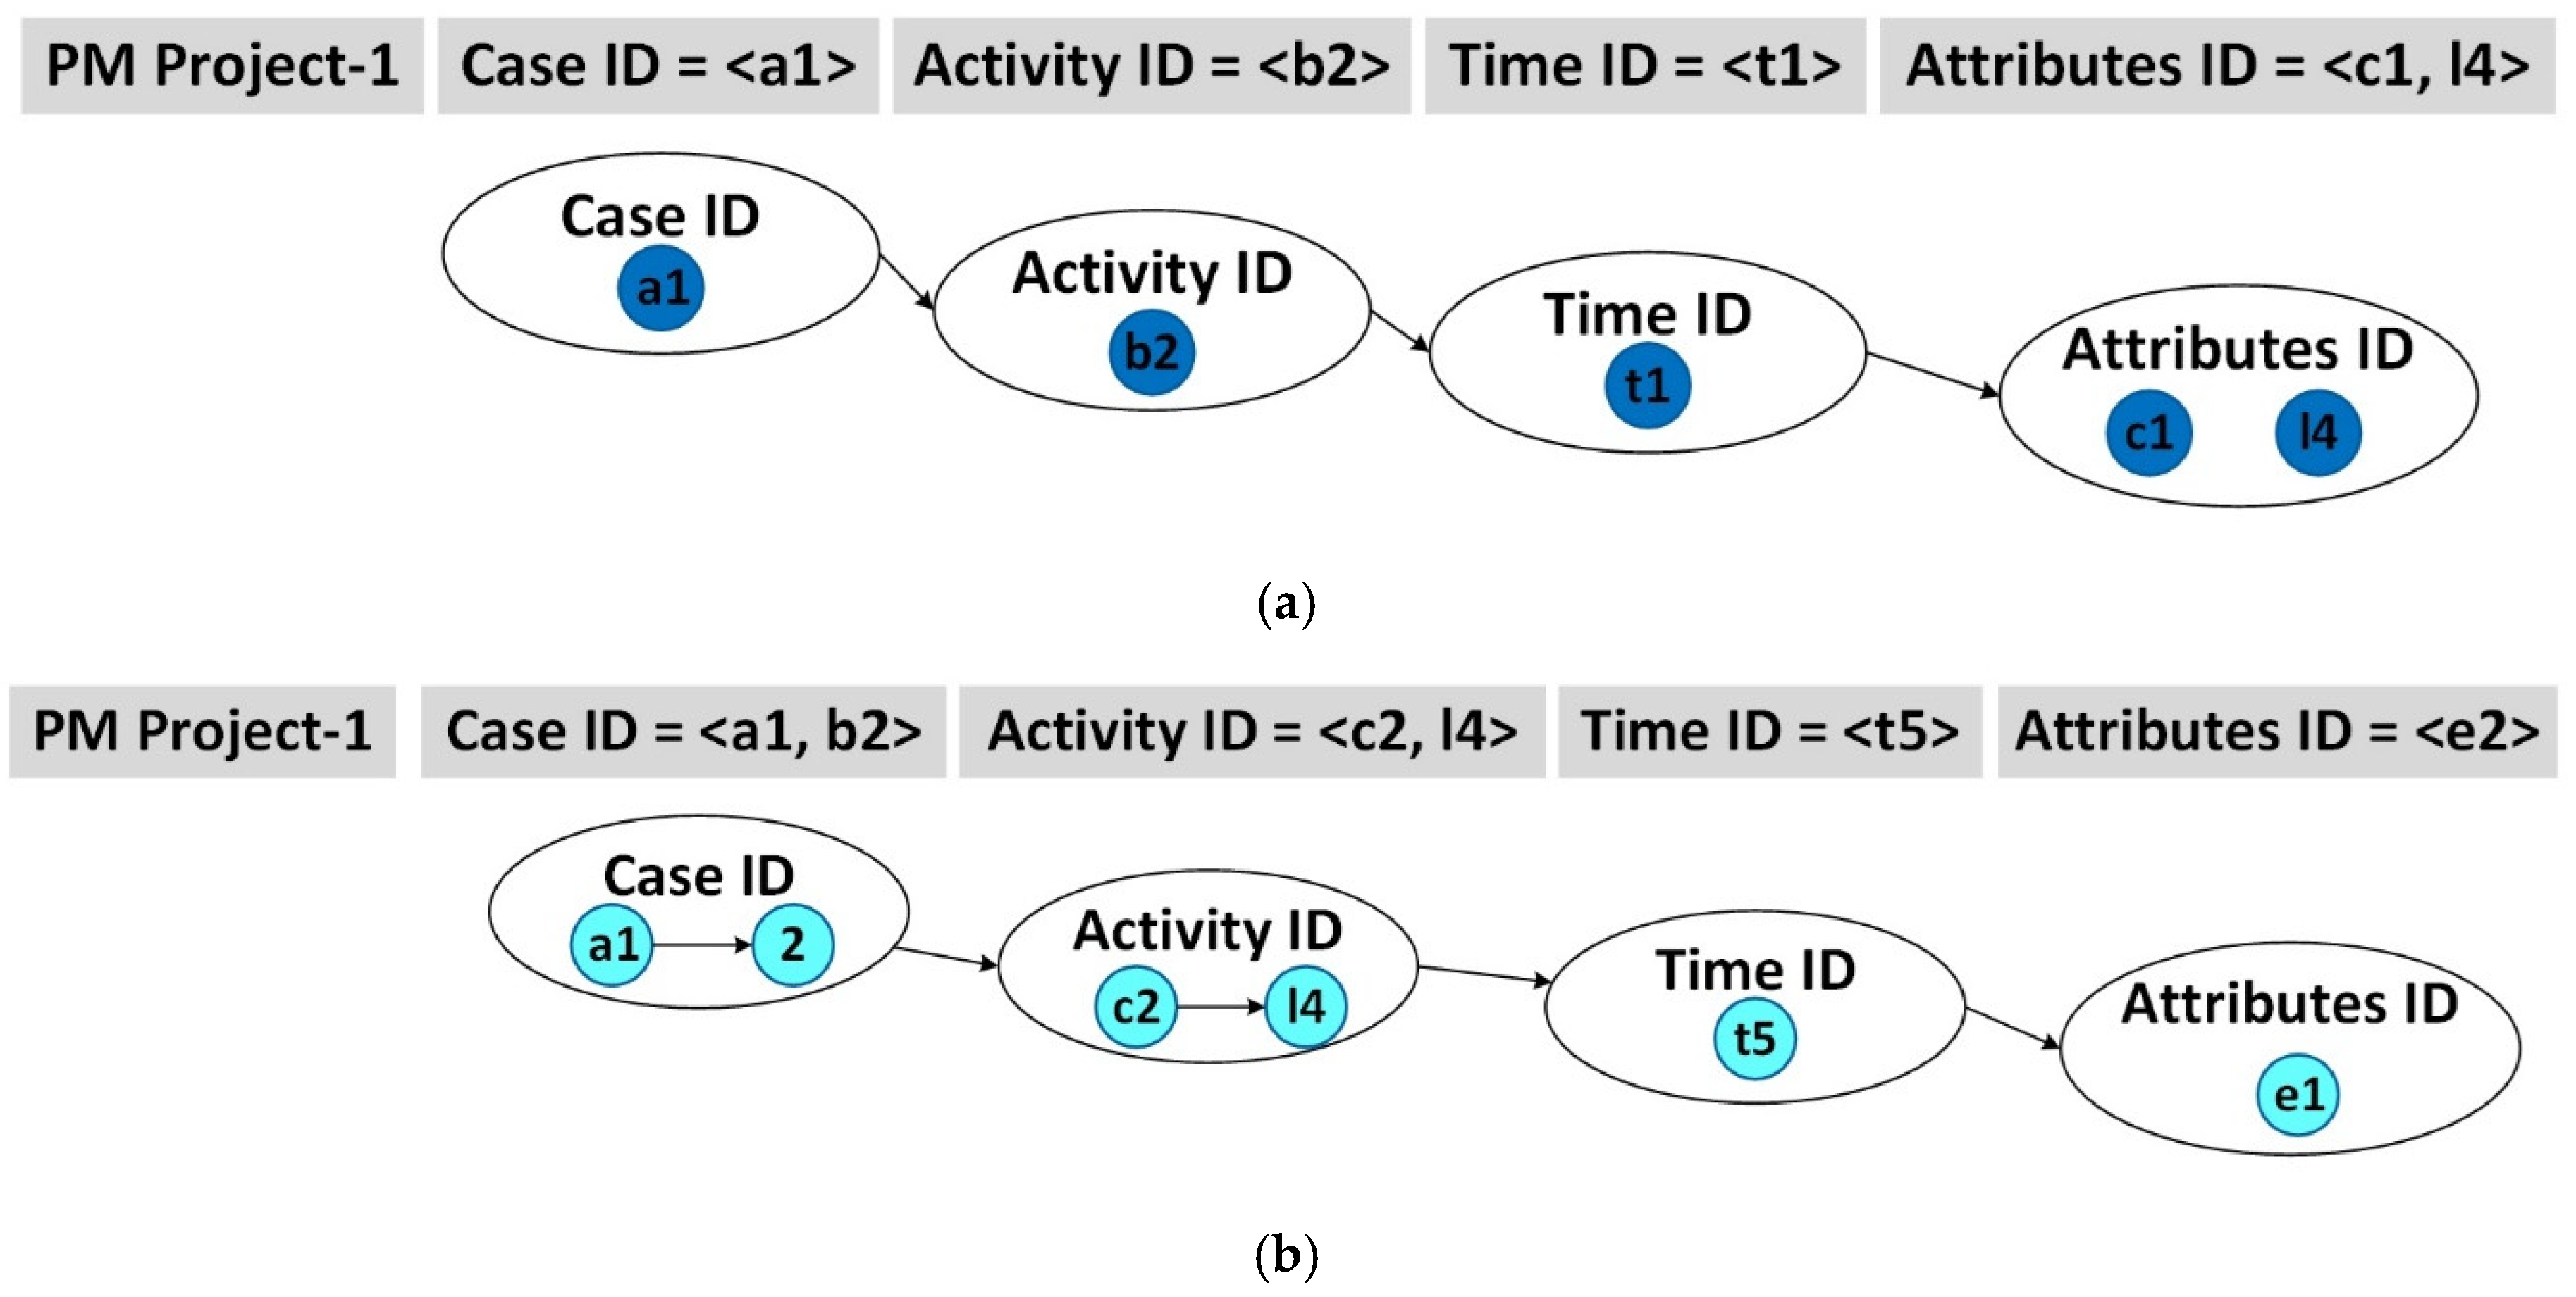
Figure 5.
Experiment dataset: structure (header) and snippet of data records.
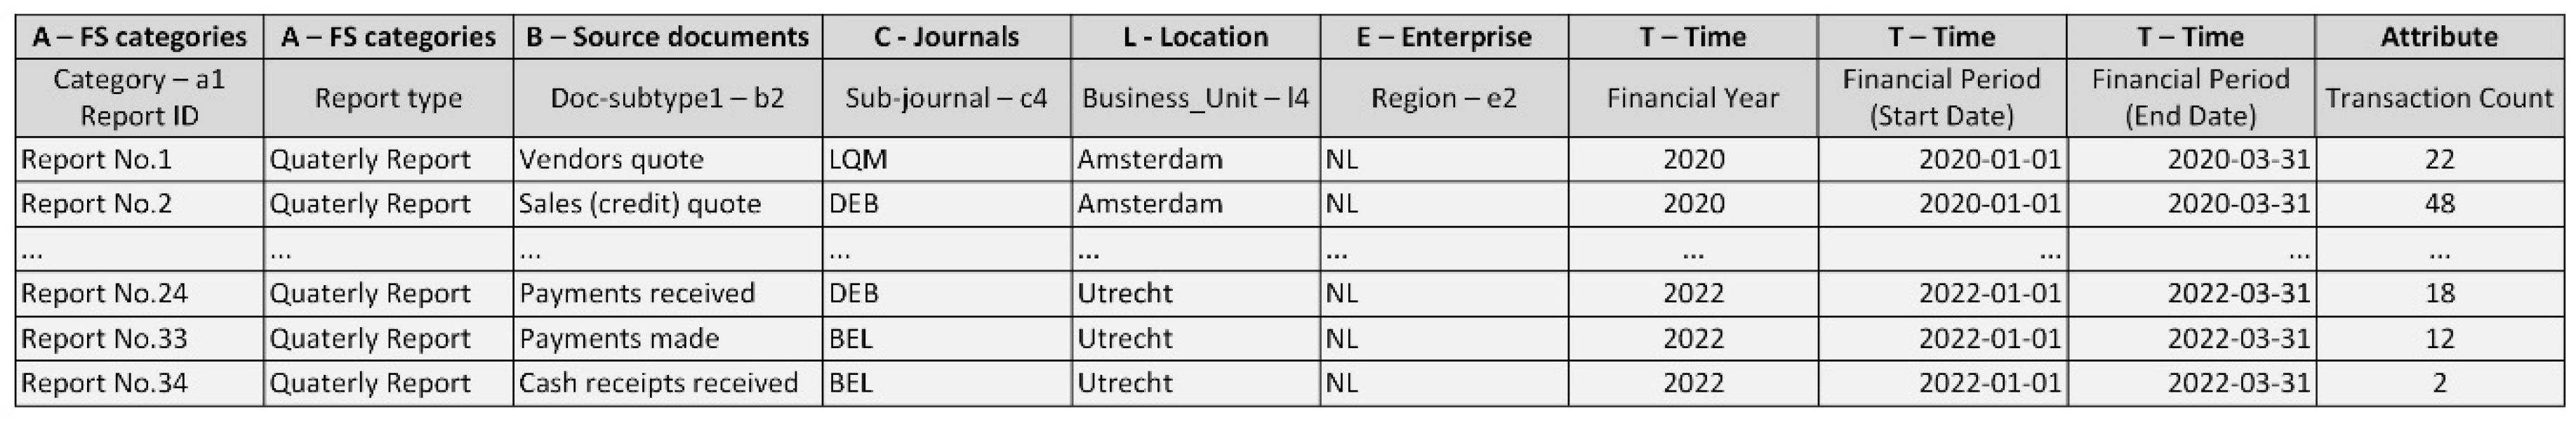
Figure 6.
Example of the dependency graph (map) of PM Project-1.
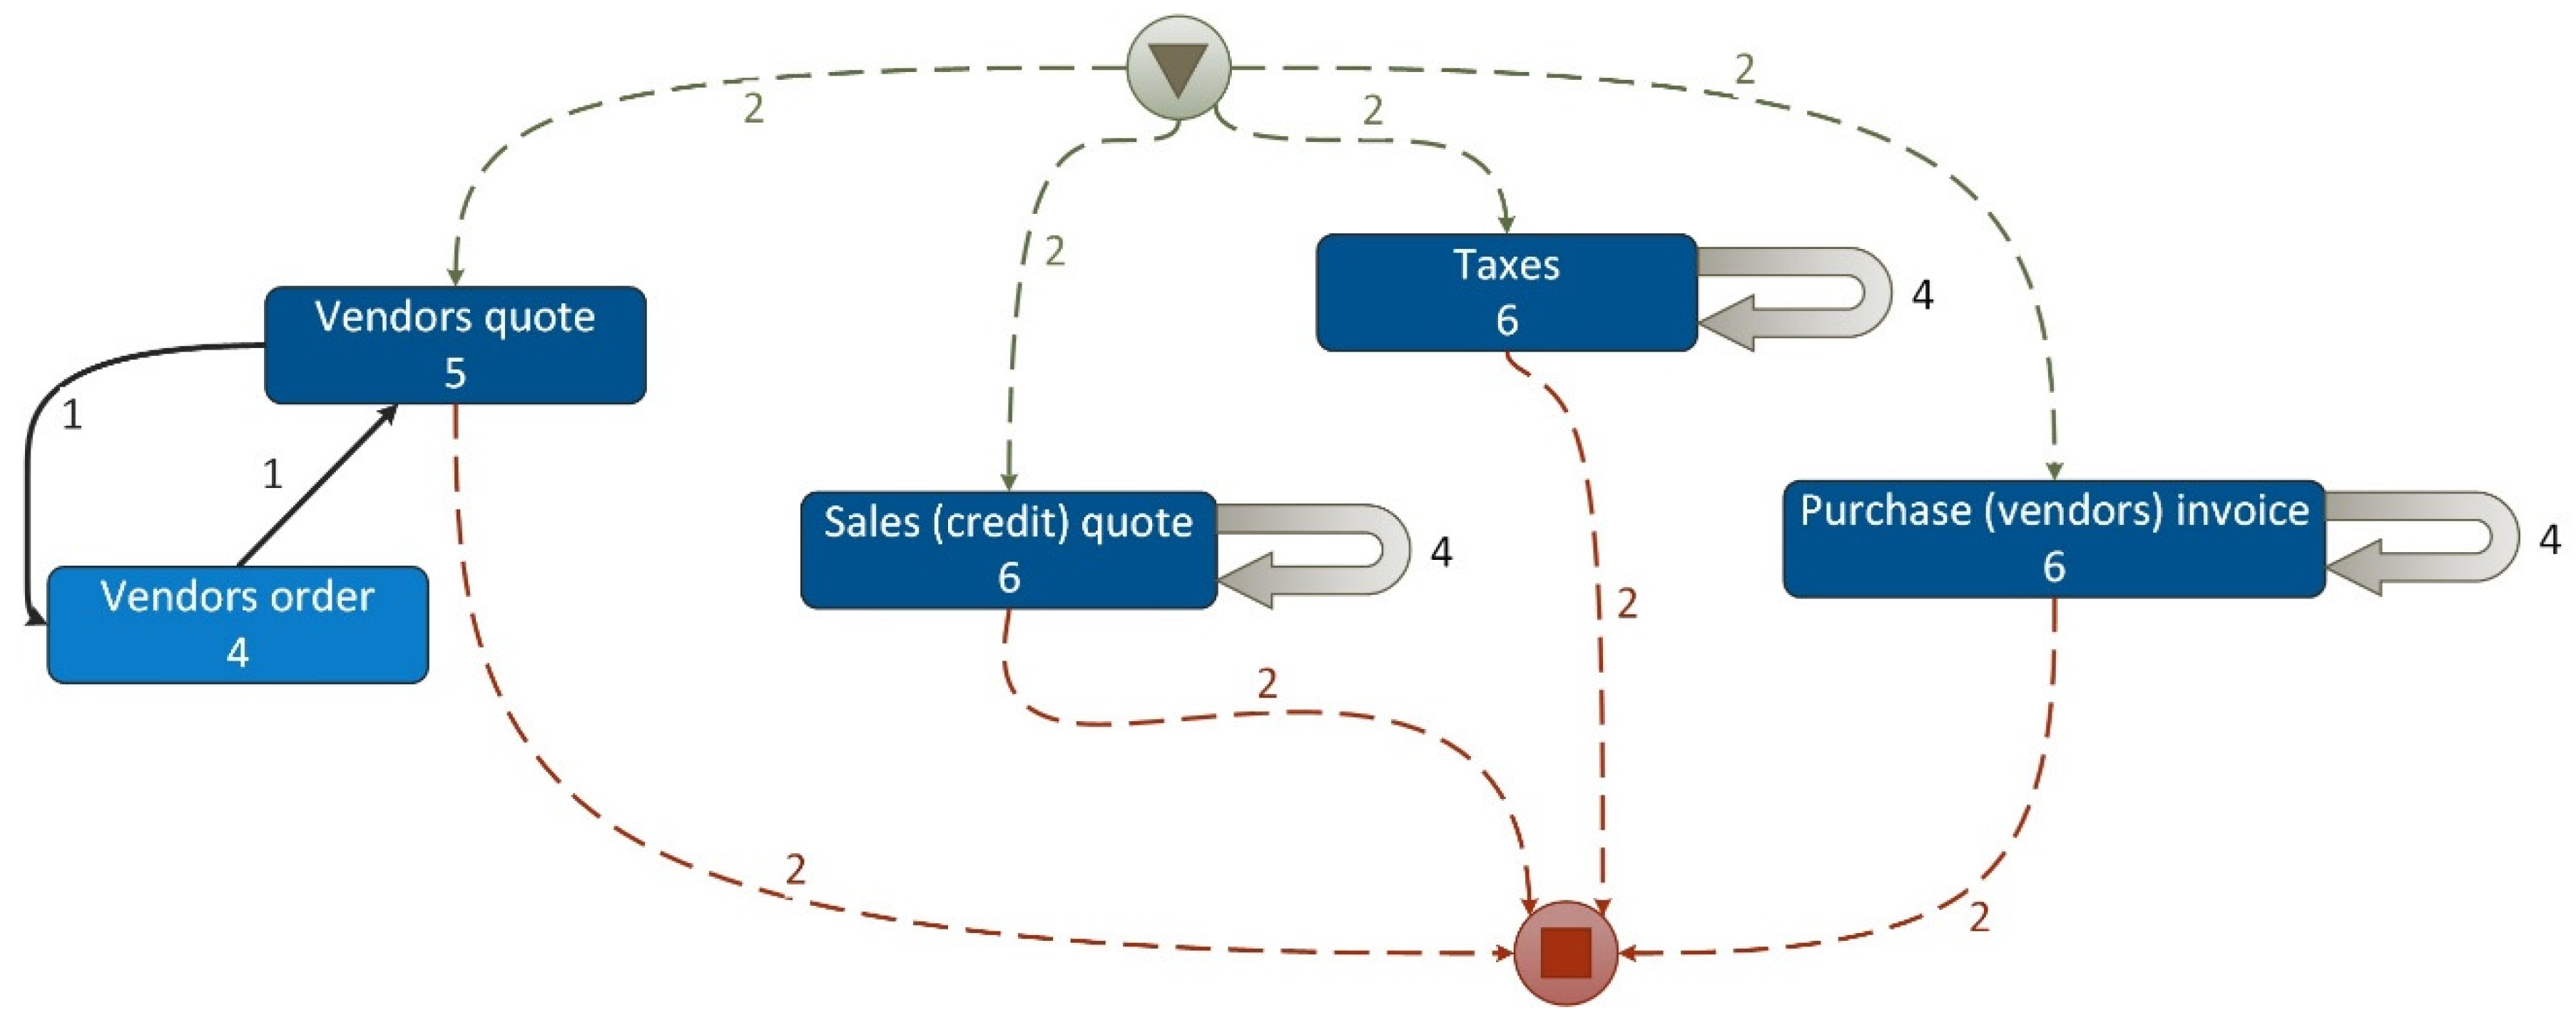
Figure 7.
Example of the dependency graph (map) of PM Project-2 (version 1).
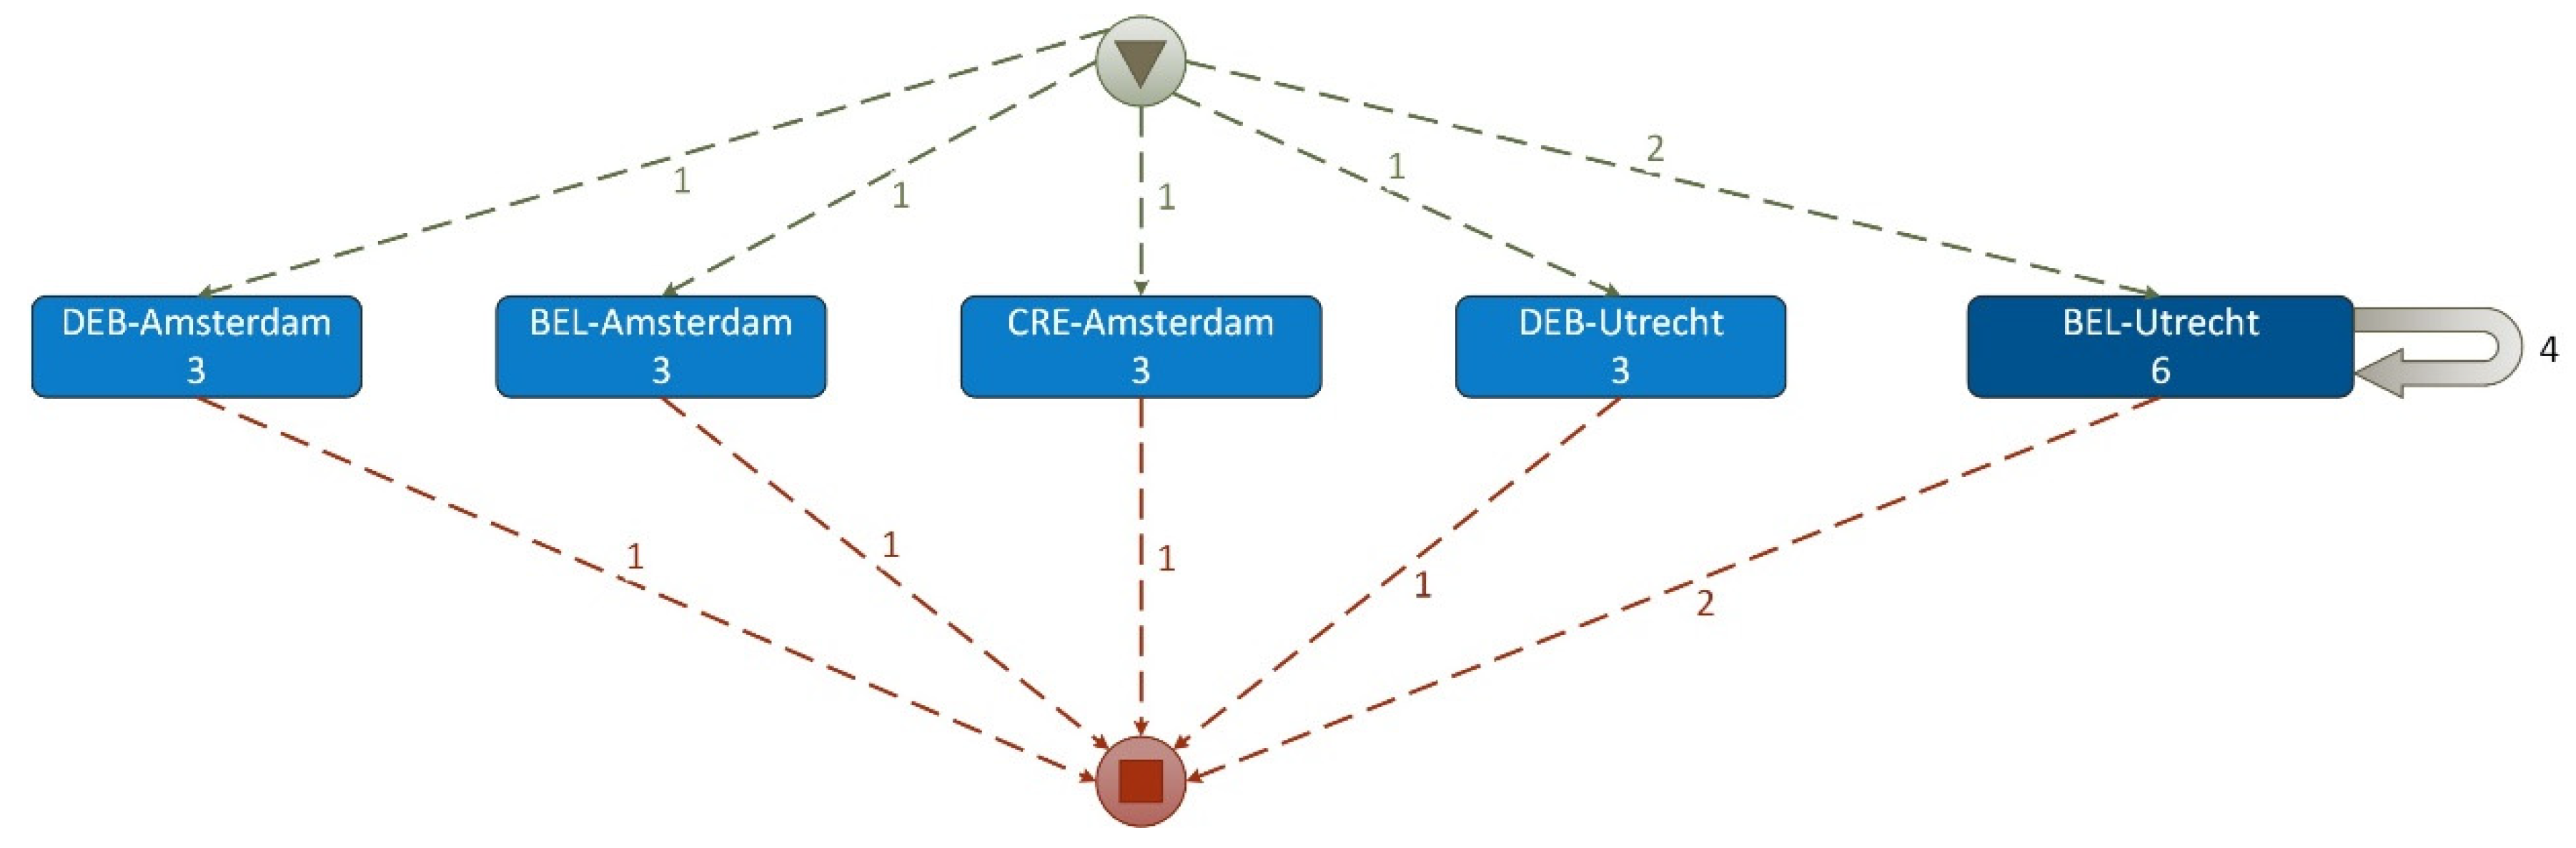
Figure 8.
An example of trace for Case ID (Report No.2, Sales (credit)) quote) and Activity ID (sub-journal (c2), business_unit (l4)).
Figure 8.
An example of trace for Case ID (Report No.2, Sales (credit)) quote) and Activity ID (sub-journal (c2), business_unit (l4)).
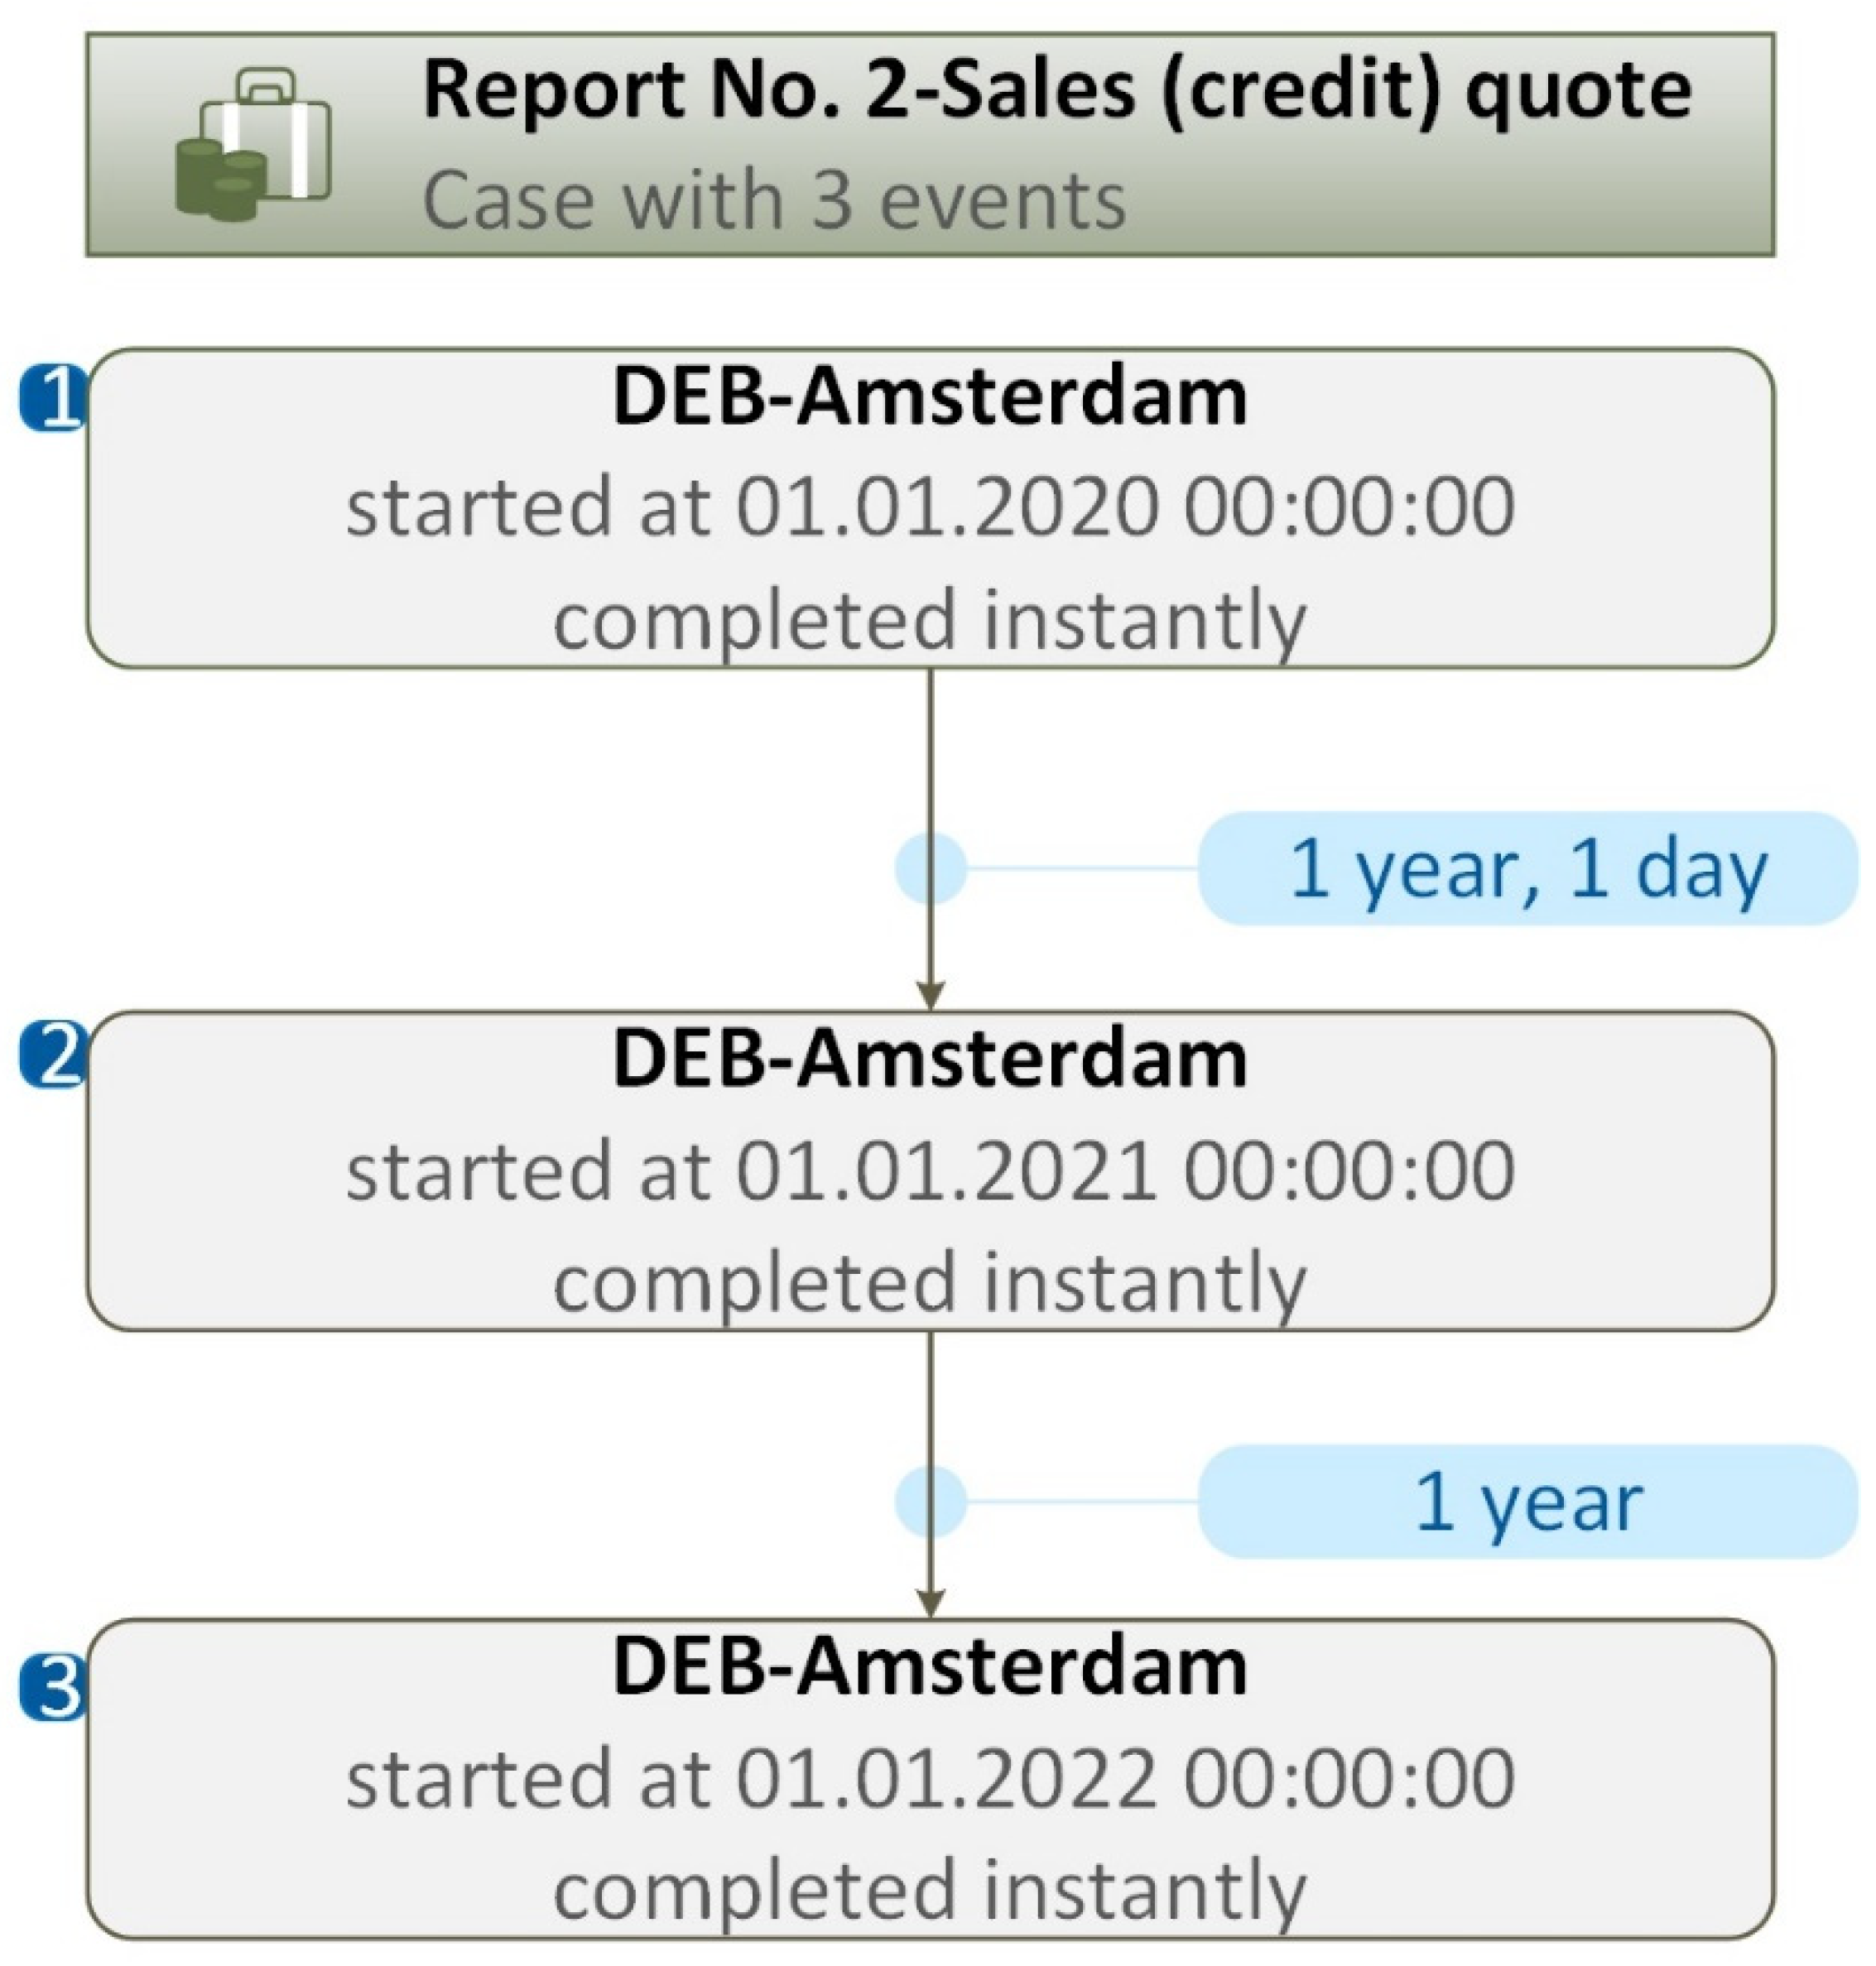
Figure 9.
Example of the dependency graph (map) of PM Project-2 (version 2).

Figure 10.
Example of the process flow of Case ID (Report No.2, Sales (credit)) quote) and Activity ID (Business_unit (l4), sub-journal (c2)).
Figure 10.
Example of the process flow of Case ID (Report No.2, Sales (credit)) quote) and Activity ID (Business_unit (l4), sub-journal (c2)).
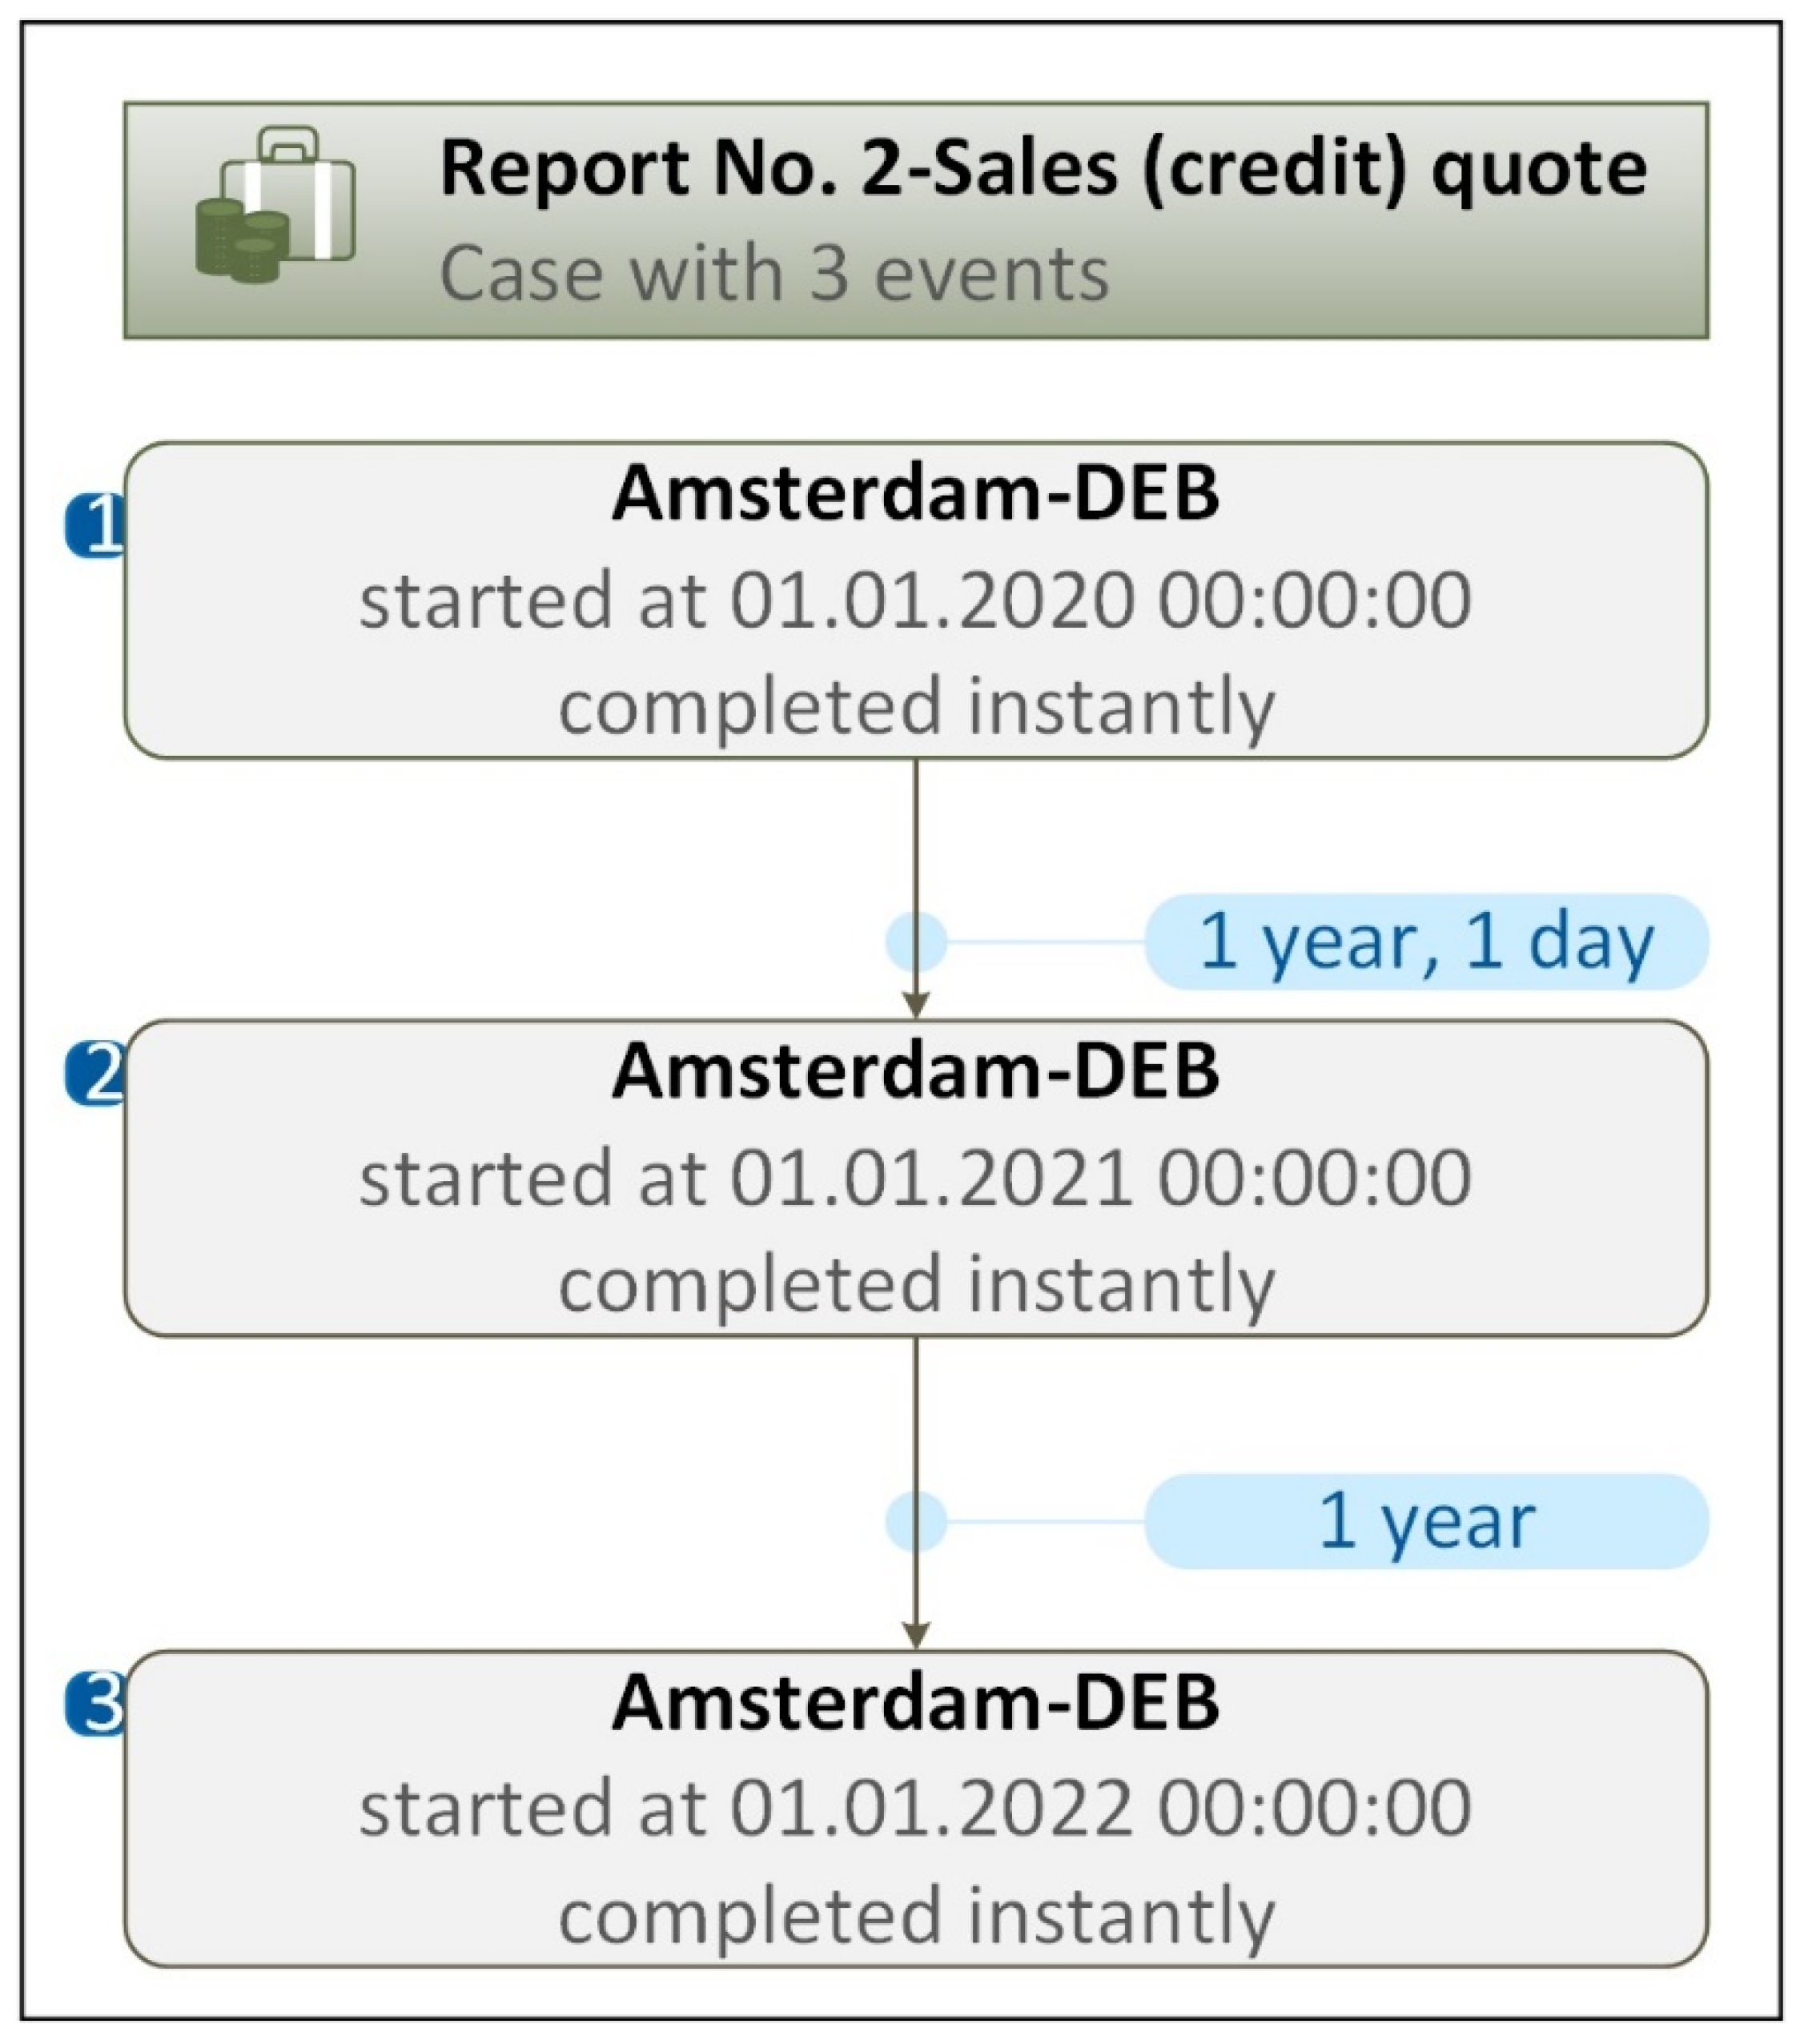
Figure 12.
Wireframe of UI prototype: Process cube design and operations.
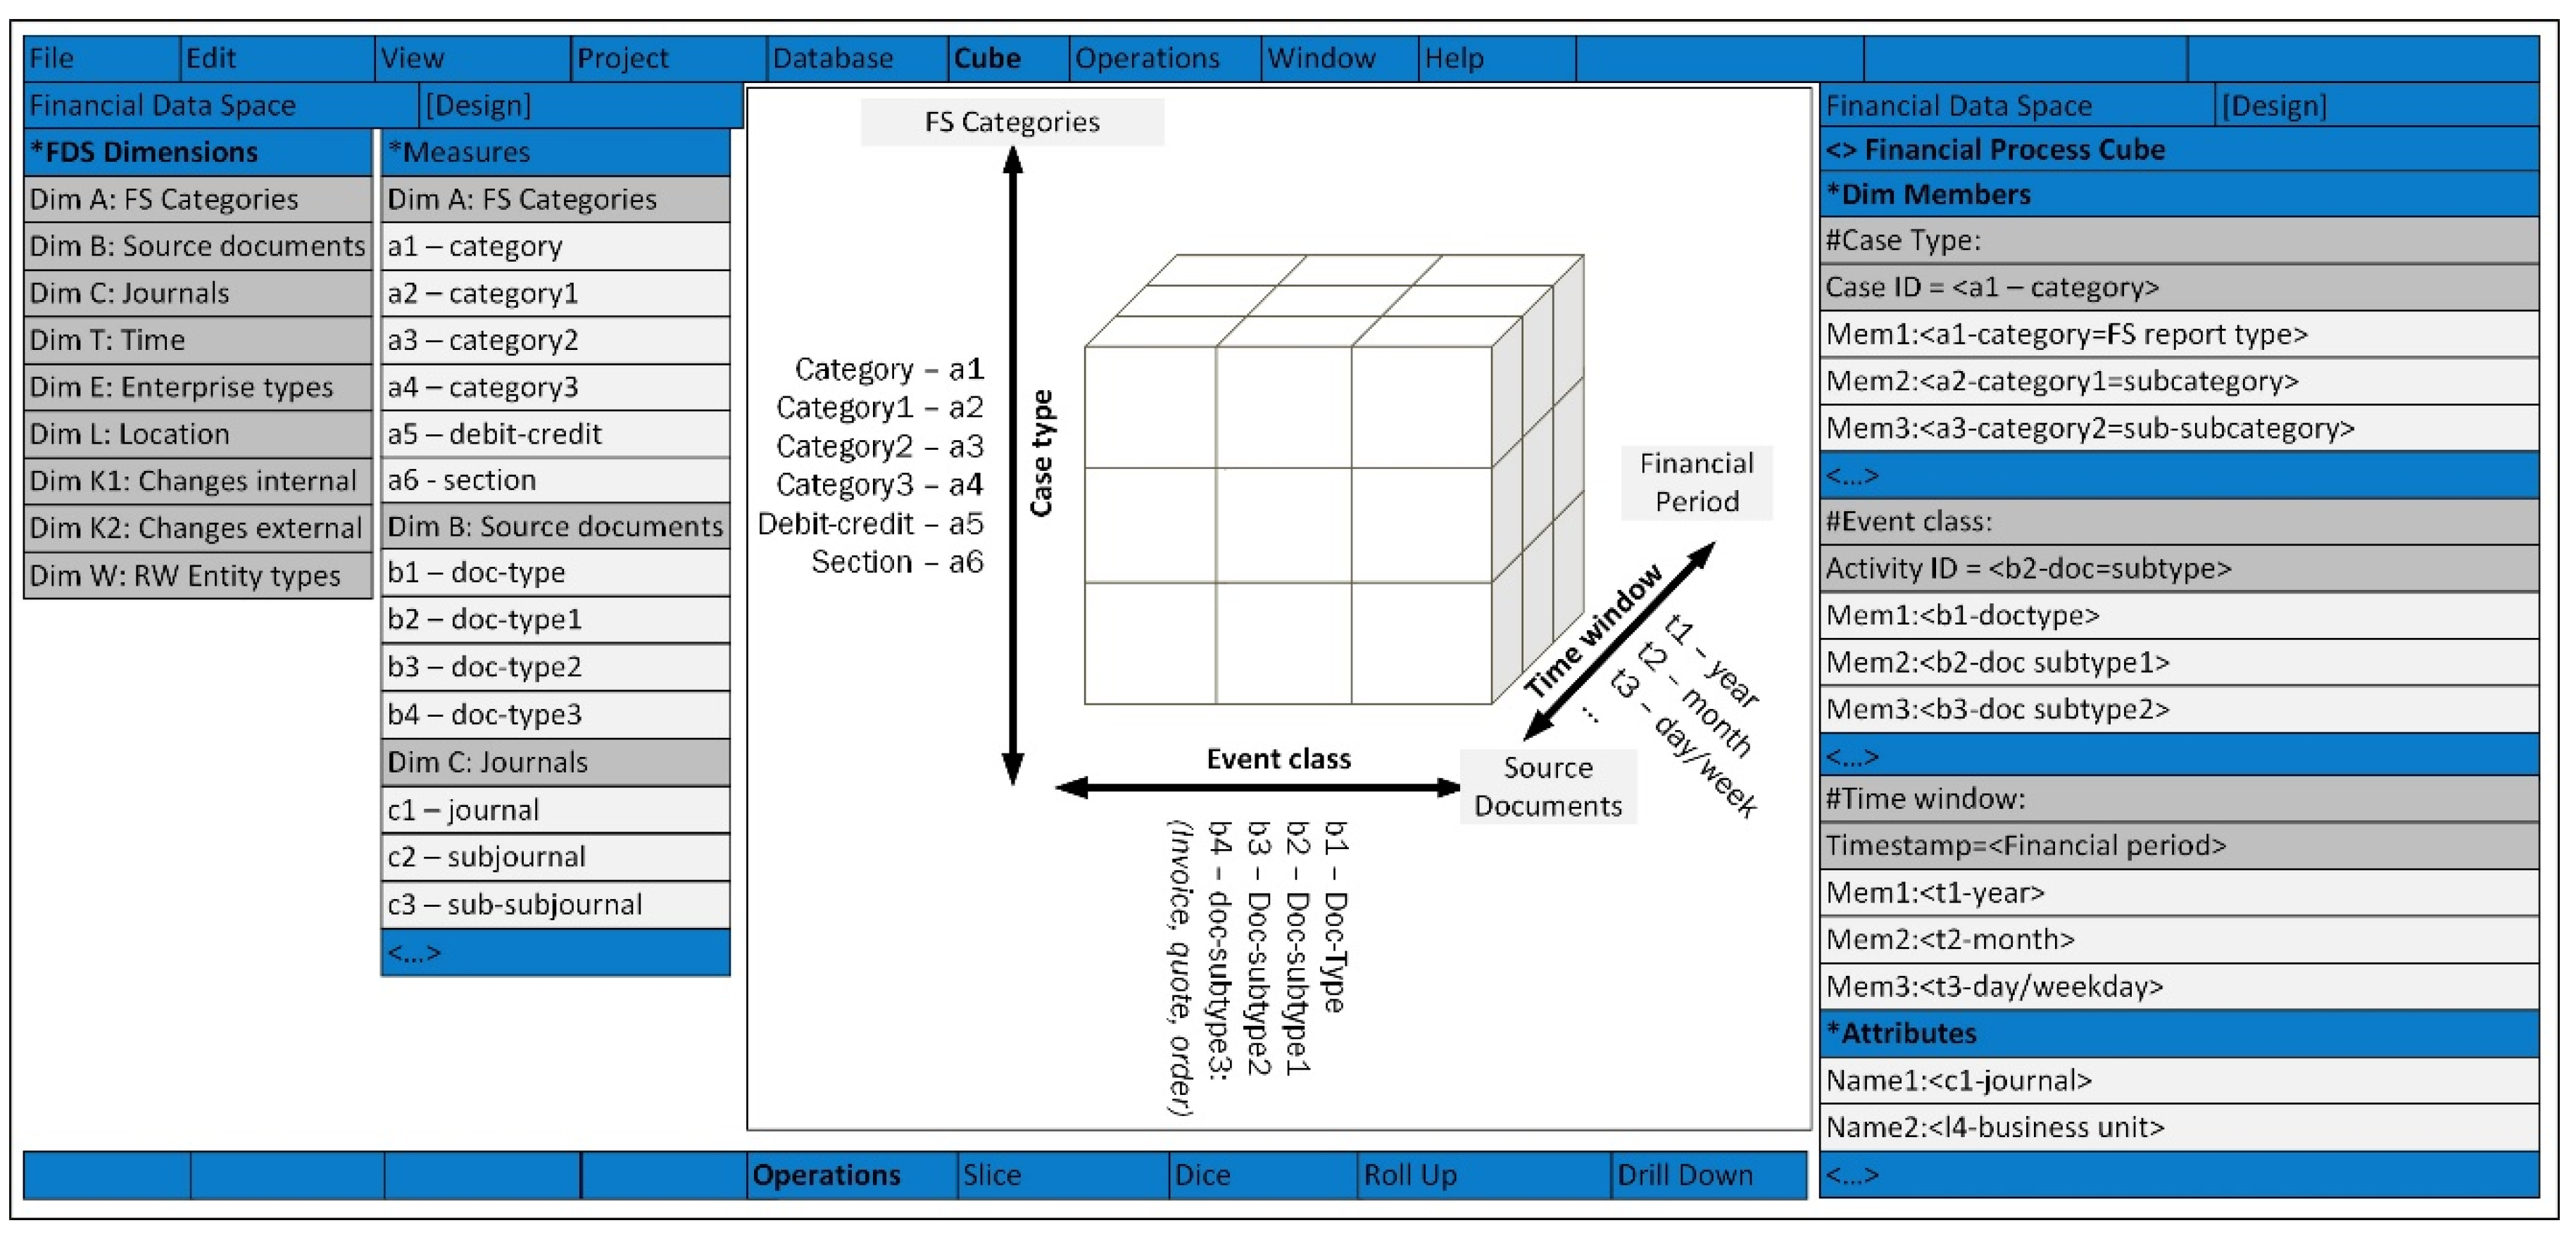

Table 1.
Roll Up operations along Dimension A.
| Financial data aggregation level | Financial Statement categories | ||
|---|---|---|---|
| A dimension | A dimension | A dimension | |
| Aggregated data (a1) | a1- FS Report | BS–Balance Sheet |
P&LS–Profit and Loss Statement |
| Roll Up (a2 to a1) | Roll Up (a2= Equity to a1= BS); Roll Up (a2= Liabilities to a1= BS); Roll Up (a2= Assets to a1= BS); |
Roll Up (a2= Sales and Revenues & Expenses Equity to a1=P&LS); |
|
| Aggregated data (a2) | a2–category | Assets-Property, Liabilities, Equity | Sales and Revenues, Expenses |
| Roll Up (a3 to a2) | Roll Up (a3= Fixed Assets Current Assets to a2= Assets); Roll Up (a3= Short-term Liabilities & Provisions & Long-term debt Current Liabilities to a2= Liabilities); |
Roll Up (a3= OMZ, WIV) to a2=Sales and Revenues); Roll Up (a3=KPR, PRVS, PER, AFS, WVI, BWV, OVB, OVT, VHE, FWA) to a2= Expenses); |
|
| Aggregated data (a3) | a3–sub-category | Fixed Assets, Current Assets | OMZ, WIV, |
| Roll Up (a4 to a3) | Roll Up (a4=(MVA, IVA, FVA) to a3= Fixed Assets); Roll Up (a4=(VRD, OHP, EFF, LQM, LIQ, VOR,VAS) to a3= Current Assets); |
Roll Up (a4=(FIN, BEL, RDN, AAD, NER, MFO) to a3= FWA); |
|
| Aggregated data (a4) (Double-entry accounting) | a4–Debit-Credit (Double-entry) | Double-entry record sets < D–C > |
Double-entry record sets <D–C> |
| Roll Up (a5 to a4) | Roll Up (a5= (DEB, OW) to a4= VOR); Roll Up (a5= INCVR to a4= VRD); Roll Up (a5= (CRE, TAX, OVS, GRP) to a4= SCH); |
Roll Up (a5= FIN, BEL, RDN, AAD, NER, MFO) to a4= WFA); |
|
| Raw data records (JournalEntry) | a5–section | MVA, IVA, FVA, VRD, OHP, EFF, LQM, LIQ, VOR, VAS, VRZ, SCH, LLS, CRE, BEL, EVM | FIN, BEL, RDN, AAD, NER, MFO |
| a6-sub-section | INCVR, DEB, OW, CRE, TAX, OVS, GRP | ||
Disclaimer/Publisher’s Note: The statements, opinions and data contained in all publications are solely those of the individual author(s) and contributor(s) and not of MDPI and/or the editor(s). MDPI and/or the editor(s) disclaim responsibility for any injury to people or property resulting from any ideas, methods, instructions or products referred to in the content. |
© 2024 by the authors. Licensee MDPI, Basel, Switzerland. This article is an open access article distributed under the terms and conditions of the Creative Commons Attribution (CC BY) license (http://creativecommons.org/licenses/by/4.0/).
Copyright: This open access article is published under a Creative Commons CC BY 4.0 license, which permit the free download, distribution, and reuse, provided that the author and preprint are cited in any reuse.


