Preprint
Article

Evaluation of Antiproliferative Potentials Associated with the Volatile Compounds of Lantana camara Flowers: A Selective In Vitro Activity

Altmetrics

Downloads

63

Views

54

Comments

0

A peer-reviewed article of this preprint also exists.

Submitted:

21 October 2024

Posted:

22 October 2024

You are already at the latest version

Alerts
Abstract
Contemporary analysis of the chemical composition of medicinal plants, and their biological activities, is important to find new potent therapeutic products. This study deciphers the chemical profiles of three essential oils (EOs) obtained from different flowers of Lantana camara, and evaluates their antioxidant and anticancer activities. The three flowers (white, pink, and orange) were collected, dried, ground, and further extracted by hydrodistillation to yield EO1, EO2 and EO3 respectively. Gas chromatography-mass spectroscopy was employed to identify existing chemical compounds in all samples. Their antioxidant activities were screened through DPPH (2,2-diphenyl-1-picrylhydrazyl) scavenging assay in addition to the FRAP (ferric reducing antioxidant power) assay. The anti-proliferative effects were evaluated on two different breast cancer cell lines, MCF-7 and MDA-MB-231, and compared to a normal human breast cell line MCF-10A, using MTT (3-(4,5-dimethylthiazol-2-yl)-2,5-diphenyltetrazolium) assay. The three EOs showed notable antioxidant potential attributed to the active phytochemical compounds. Results were supported by positive correlation between the antioxidant activity and the total phenolic and flavonoid content. Most notably, EO1 (from white flowers) exhibited a remarkable dose-dependent anti-proliferative effect in both breast cancer cell lines. Marked by a sharp reduction in cell proliferation after only 24 hours of treatment, EO1 reflects its potent role as anti-cancer agent. We suggest that this highly selective activity is associated with the presence of bicyclogermacrene and epi-bicyclosesquiphellandrene in its chemical composition.
Keywords: 
Subject: Chemistry and Materials Science  -   Medicinal Chemistry

1. Introduction

Known for its toxicity primarily due to the presence of lantadenes and other secondary metabolites [1], Lantana camara (L. camara) has a wide range of medicinal benefits [2] and biological activities [3,4]. In fact, this plant is one of the most noxious weeds in the world, while being toxic to animals and exerting allelopathic action on adjacent vegetation [5]. This dual-character perennial invasive shrub, originally native to the tropical regions of the Americas, is both an ornamental plant and a source of different bioactive compounds. Because of this, careful analysis of its chemical composition within the scope of the biological effects becomes of prime importance. On another note, the species is characterized by its vibrant and diverse flower colors including mostly pink, white, and yellowish orange, as well as its small blackish fruits. Studies on the phytochemical profile of L. camara have shown a diverse array of secondary metabolites such as essential oils (EOs), phenols, flavonoids, alkaloids, glycosides, saponins, and tannins [6]. Historically, the plant was used in folk medicine since ancient times, and correspondingly antioxidant, antimicrobial [7], antipyretic, and insecticidal [8] effects were reported by several groups recently, nevertheless with plant samples sourced from different geographical locations. Studies have shown a significant discrepancy in the chemical composition of the different extracts investigating L. camara’s biological activity [9]. While EOs are known for their complex mixtures of volatile compounds that contribute to their distinctive aroma and biological activities [6], their extraction and analysis have become crucial in identifying new bioactive compounds with potential therapeutic applications [10]. Comparably, some synthetic lantadenes which are pentacyclic triterpenoid derivatives obtained from the leaves of L. camara have been previously studied for their in vivo tumor inhibitory potentials by Sharma et al. [11,12], while other groups presented some preliminary investigations on the use of L. camara stem extracts as inhibitors for leukemia cancer cells [13] or tried to investigate the underlying mechanism for its anti-cancer effects [14]. This is particularly important as cancer is becoming a major global health issue, ranking as the second leading cause of death after cardiovascular diseases. It is marked by the uncontrolled growth of cells, leading to malignant tumors with the potential to spread throughout the body [15,16,17]. Typical treatments have involved chemotherapy, radiotherapy, cytotoxic drugs, and surgery [18,19]. While these methods have shown success in treating various cancer types such as colon, pancreatic, testicular, breast, ovarian, and certain lung cancers, their overall effectiveness is often compromised by drug resistance and harmful side effects [20,21], which occur when healthy cells are unintentionally damaged during treatment. This underscores the need for ongoing research into safer, more effective treatments [8]. Interestingly, herbal medicines have been used for centuries in many developing countries and continue to serve as a primary form of healthcare [22]. Research has demonstrated that plants offer a promising source for the development of new anticancer drugs that are both effective and safe [23].
On a side note, Gas Chromatography-Mass Spectroscopy (GC-MS) is a powerful analytical technique used to identify and quantify the components of EOs, providing insights into their chemical profiles. In this study, we explored and analyzed the chemical compositions of EOs extracted from Lebanese L. camara flowers, more specifically from white, pink, and orange varieties. We then assessed their antioxidant activities as well as their antiproliferative effects on two different breast cancer cell lines. To the best of our knowledge, this work represents the first study of EOs obtained from L. camara based on different flower colors. Moreover, we are not aware of any reports dealing specifically with the antitumor effects of such flower-derived EOs. The aim of our study to elucidate a potential correlation between chemical composition and the antitumor activity of EO, with the goal of advancing the development of new natural products with targeted therapeutic potential and possible clinical applications.

2. Results and Discussion

2.1. GC-MS Analysis Results and Yields of Extractions

Three different types of petals, namely, white, pink, and orange flowers from L. camara (Figure 1) were collected, dried, ground, and further extracted by hydrodistillation to yield the corresponding essential oils termed EO1, EO2, and EO3 respectively.
GC-MS analysis revealed that a major component of the three oils is caryophyllene, more precisely (−)-β-caryophyllene (BCP), a natural sesquiterpene which is also a cannabis-derived compound known to bind directly to endocannabinoid receptors in the body (Figure 2). Many studies have already reported caryophyllene as being a major constituent [24,25,26], while a more recent work pointed out that this chemical makes up ~70% of the EO of L. camara collected from India [27]. The white flowers’ EO1 contained additionally bicyclogermacrene and (+)-epi-bicyclosesquiphellandrene at 21.34% and 9.04% respectively. For EO2 (pink flowers) γ-elemene and α-muurolene are the other main components, while EO3 (orange flowers) is dominated by α-humulene, α-trans-bergamotene and α-phellandrene, along with the presence of BCP. Results of the GC-MS presented in Figure 2 (additional details are given in Supplementary Material) show that monoterpenes and sesquiterpenes are the sole components of the EOs of the collected flowers of L. camara. Such chemical compositions with profiles differing between each sample can explain the varying antioxidant and antiproliferative activities that will be presented herein. It is worth noting that β-Caryophyllene is reported in the literature to have several biological activities such as antimicrobial and anti-inflammatory, but most notably as an antioxidant [28]. Other compounds like bicyclogermacrene, (+)-epi-bicyclosesquiphellandrene, γ-elemene, α-muurolene, α-humulene, and α-trans-bergamotene are sesquiterpenes that have been linked to cytotoxic, anti-microbial, anti-tumor, and many other potential activities [29,30].
Compared to other studies on EOs of L. camara, our findings highlight the critical difference in chemical composition based on geographic origin/location. For example, in Egypt, α-curcumene (10.26%), β-copene (12.29%), davanone (23.27%), caryophyllene (22.96%), and humulene (14.32%) are the major components [31]. A non-exhaustive table that attempts to compile the major compounds in the EOs from different studies can be found in the Supplementary Information. Similarly, considering the yields of extraction, a study in Brazil showed that there are significant differences between extraction yields obtained even at different collection times [32]. The lowest yield (0.01%) was recorded at 7:00 a.m., and the highest one (0.09%) was obtained at 7:00 p.m. In another study, the yield of an oil obtained in India was found to be 0.032% (w/w) [33]. In Africa, one group reported that the yield of EO of L. camara ranged from 0.25 to 0.37% w/w [34]. Our obtained yields are slightly above 0.04%, which is similar to those obtained in Brazil and in India. In general, yields of EOs are very low in most studies and vary according to the extraction method, time of collection, climate, seasonal time, and geographic origins.

2.2. Total Flavonoid Content (TFC) and Total Phenol Content (TPC)

It is known that EOs do not often contain flavonoids, as here indeed an extremely low content between 2 and 5 mg per 1 gram of EO is observed. However, several reports in the literature have already indicated that some phenolic content can be well extracted with the essential oil [35,36]. In fact, the presence of phenolic terpenes or hydroxyl groups leads to the overestimation of the spectrophotometric test for TFC [37]. Meanwhile, the reason why flavonoids are not detected by GC-MS is due to the fact that they need derivatization in the sample preparation and the pre-injection step [38]. The analysis performed for TFC and TPC (as described in Section 3.4 and Section 3.5, and further in the Supplementary Material) showed that EO3 from orange flowers had the greatest amount of flavonoids at 5.12 mg of rutin equivalent RE per 1 g of extract, while EO1 and EO2, from white and pink flowers respectively, had contents of less than 3 mg of RE.g-1 (Table 1).
EO3 had also the highest amount of phenol content at 26.71 mg of GAE/g extract. EO2 showed a slightly lower TPC (24.63 mg of GAE/g extract), while that of EO1 was considerably low at 16.80 mg of GAE/g of extract (Table 1). A study reported in Madagascar revealed that the TPC of the flowers’ EO was 43.50 mg GAE/g of dry weight [39], while another study conducted in Nepal showed the highest phenol content to be 10.20 ± 0.34 mg GAE/g extract [40]. These findings further support our conclusion on the vast variability of phytochemicals contents with regard to the geographical location of this flowering plant species, in addition to other factors including the extraction method and the storage procedure.

2.3. Antioxidant Activities

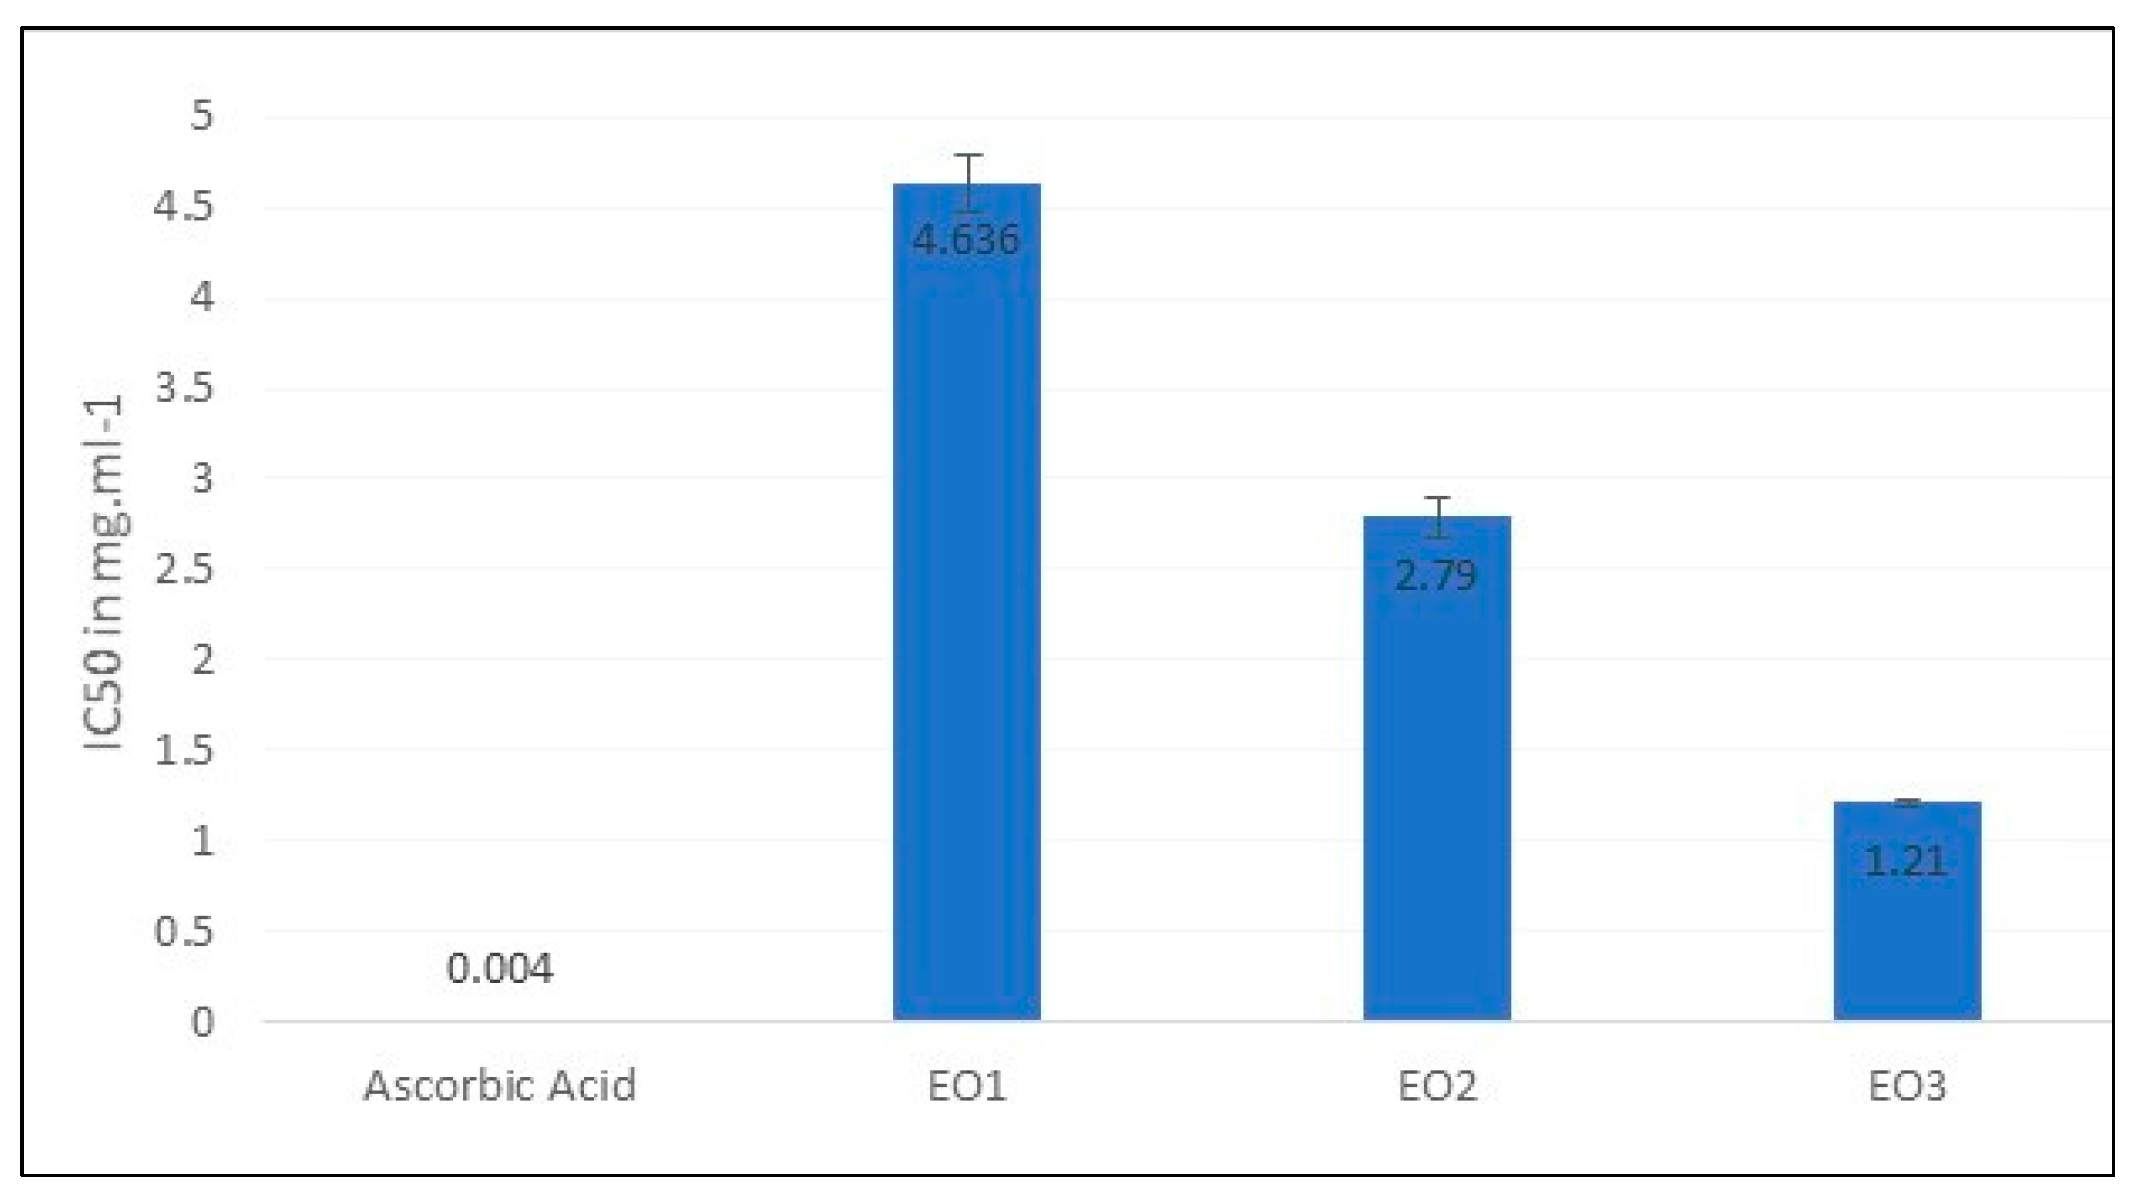
Given the fact that TPC and TFC are reported to be highly coupled to antioxidant capacity and are considered sources of natural antioxidants [41], we evaluated the in vitro antioxidant activities of the three EOs by both the; 2,2-diphenyl-1-picrylhydrazyl (DPPH) assay and the ferric reducing antioxidant power (FRAP) assay. Results obtained from the two tests were found to be dose-dependent. EO3 had the most potent antioxidant activity marked by its lowest IC50 = 1.21 mg.ml-1, followed by EO2 and EO1 which presented IC50 values of 2.79 mg.ml-1 and 4.64 mg.ml-1 respectively (Table 1). Nevertheless, all three EOs had a much lower antioxidant activity than that of ascorbic acid with IC50 = 0.004 mg.ml-1 (Figure 3). According to one study conducted in Egypt, IC50 values were found to be 55.43 and 48.36 µg.ml-1 for the EOs of leaves and flowers, respectively [42]. In another study carried out in Pakistan, the DPPH (IC50) value was found to be 5.45 μg.ml-1 [43], while in Malaysia the fruit extract showed an IC50 of 90.11 µg.ml-1 [44].
DPPH results were further validated by the FRAP assay whereby EO3 showed the highest antioxidant potential indeed, and EO1 showed the lowest (Figure SI.10 in Supplementary Material). This supports the reduction potential of the EOs transforming Fe3+ to Fe2+, and thus their electron donating ability. The differences in activity reported in the current work, and in the literature, can be ascribed to various factors. The difference in the chemical compositions of each sample is the most important among such factors. The higher antioxidant activity in EO3 is mostly due to the presence of trans-α-bergamotene, which is the predominant compound in this sample. The latter is a derivative of the bergamotene that has been shown to possess diverse biological activities such as antioxidant, anti-inflammatory, immunosuppressive, cytotoxic, antimicrobial, antidiabetic, and insecticidal effects [45]. The other major derivative, α-phellandrene, is known for its antioxidant and antibacterial activities, as well as being effective against liver cancer. Both molecules are not available in the other EOs, which may explain the potency of EO3 as an antioxidant [46]. In general, sesquiterpenes are reported to be responsible for several biological activities [47], a fact that can elucidate their high antioxidant effect. On a side note, differences in IC50 values can also be due to ecological factors; such as the age of the plant, humidity, height, temperature, and water, all which influence the quality and the quantity of the secondary metabolites, that are responsible for different biological activities, such as the phenols, flavonoids [48], monoterpenes and sesquiterpenes that are present in the EO of L. camara.

2.4. Reduction of MCF-7 and MDA-MB-231 Cell Proliferation in a Dose-dependent Manner

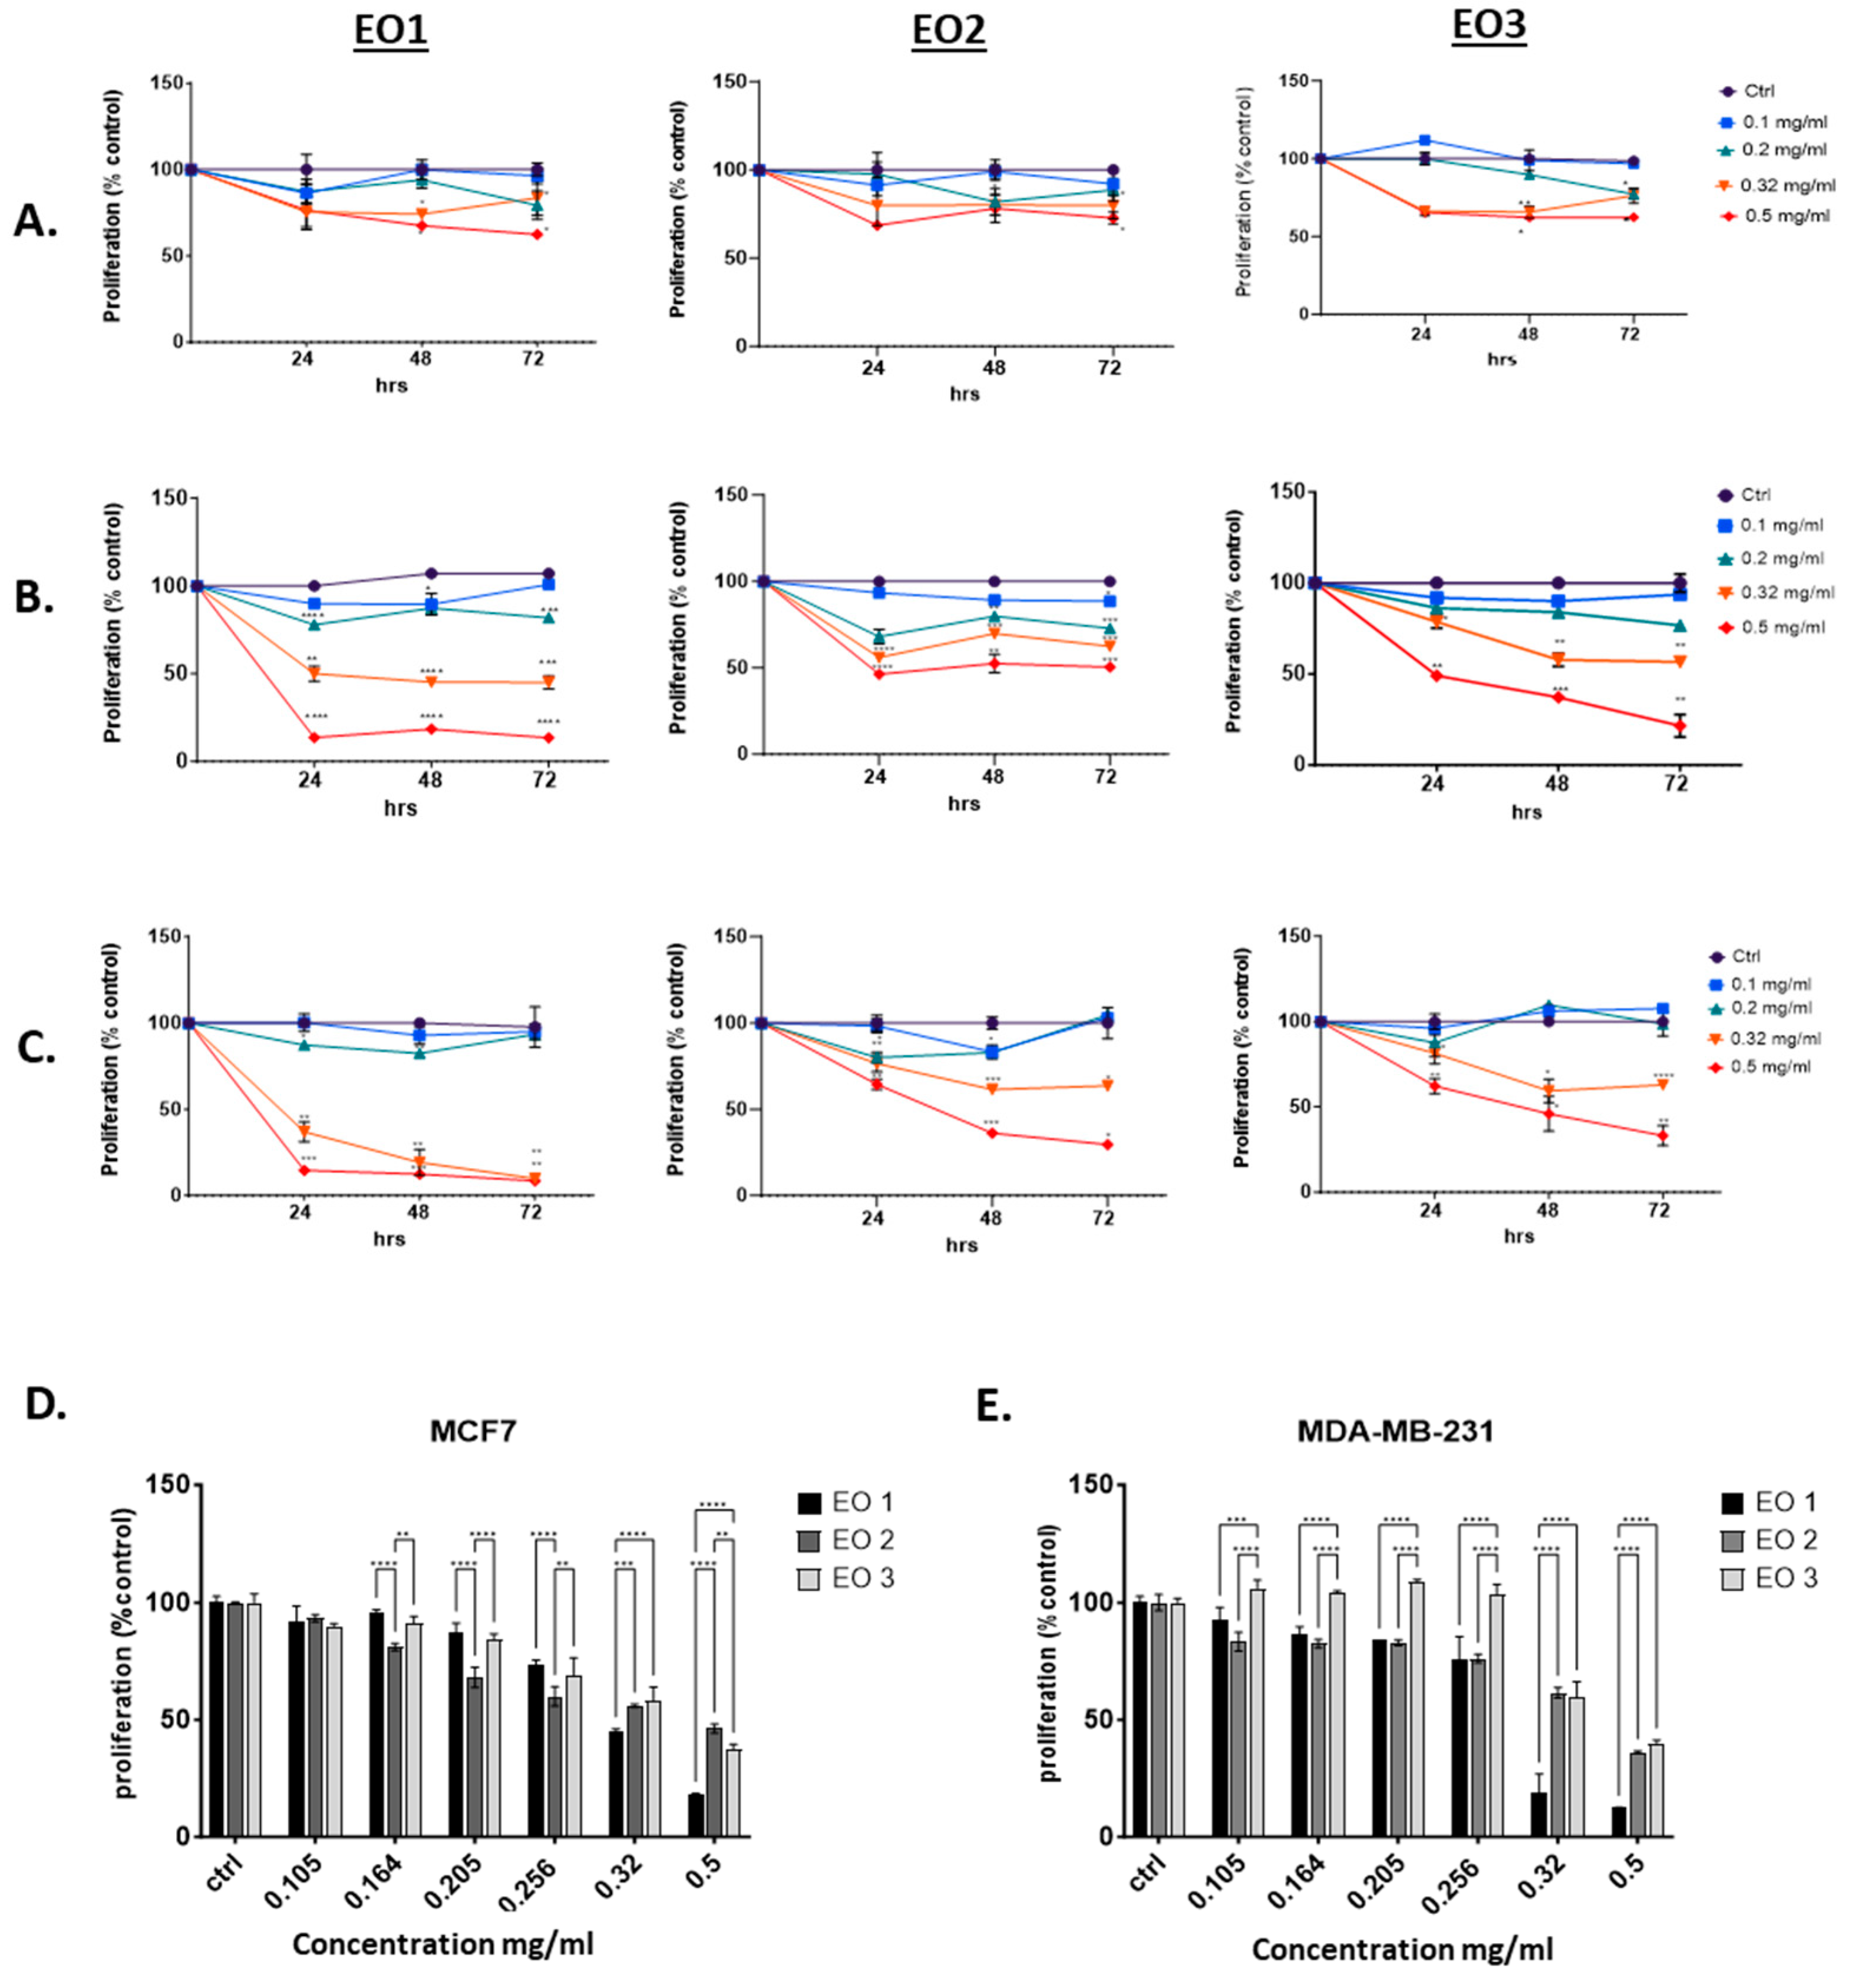
Antitumor activities were explored on two different breast cancer (BC) cell lines: MCF-7, a non-invasive ER+ PR+ cell line, and MDA-MB-231, an invasive triple negative BC cell line. At the same time, MCF-10A, an immortalized epithelial breast cell line, was used to assess toxicity on normal cells. As shown in Figure 4, both cancer cell lines displayed dose-dependent sensitivities to increasing concentrations of the three tested EOs. Interestingly, EO1 from white flowers exhibited the strongest antiproliferative effect on both cell lines 24 hours post-treatment. The calculation of the IC50 revealed an approximate value of 0.3 g.ml-1 in both cell lines and at all time-points. EO2 was significantly less potent in inhibiting proliferation particularly in MCF7 where cell proliferation remained greater than 50% even 72h post-treatment, while EO3 demonstrated an intermediate inhibitory potential compared to the other samples. Though EO3 showed greater potency than EO2, both were still significantly less effective than EO1, in particular at higher concentrations. Cytotoxicities are detailed in Figure 4 with dose-dependent inhibitory activities presented as a bar plot for each BC cell line. The results were further supported by the higher IC50 values for EO2 and EO3 at different time points, as shown in Table 2.
More importantly, all three EOs had a less significant cytotoxic effect on the normal human breast cell line MCF-10A proliferation, where the inhibitory effect was only noted when cells were treated with very high concentrations, up to 0.5 mg.ml-1. The calculation of the IC50 revealed estimated values higher than 1 mg.ml-1, which are at least 2-3 times greater than those observed in MCF-7 and MDA-MB-231 cells (Table 2), hence indicating the greater selectivity of these natural compounds against cancer cells.
Our findings conclude that the EO isolated from the white flowers of L. camara demonstrates selective antitumor activity against breast cancer, while showing no significant antiproliferative effect on normal cells. To the best of our knowledge, no study to date has explored the antitumor potential of an EO obtained from L. camara flowers. EOs from the leaves, however, have been shown to account for strong anticancer activity against U-266, A-549, HCT-116, SCC-4, MiaPaCa 2, and KBM-5 cancer cell lines [41].
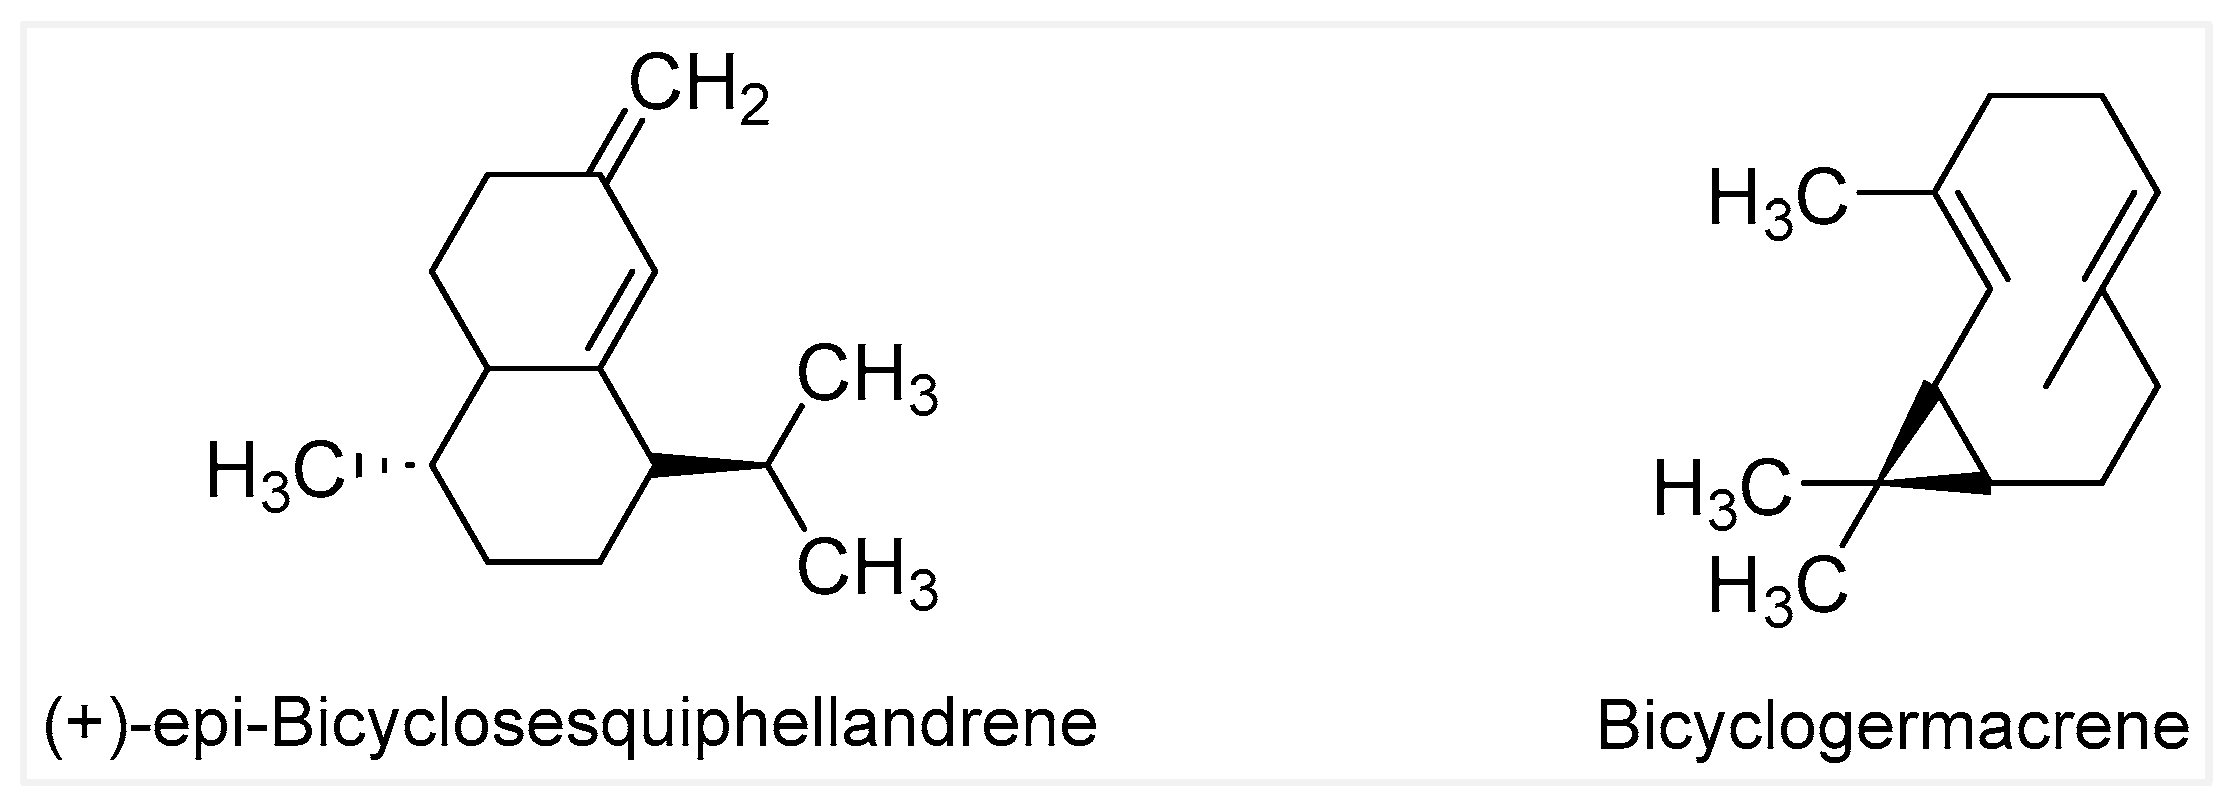
The differences in growth inhibitory effect could be explained by the results of GC-MS analysis which revealed distinct chemical profiles for each sample. We attribute the antiproliferative activity of EO1 against the two BC cell lines reported herein to the presence of epi-bicyclosesquiphellandrene (Figure 5) found exclusively, and in significant proportions, in the EO of white flowers. A study on the oily fractions of Teucrium alopecurus showed that the epi-bicyclosesquiphellandrene molecule had antitumor activity against colon cancer cells [49]. Another major component present exclusively in EO1 is bicyclogermacrene, which can also contribute to the significant antitumoral activity. Indeed, one research paper conducted in Brazil has shown that bicyclogermacrene plays a major role in the anticancer activity of the Myrcia genus plant against lung cancer cells [50].

2.5. Pearson’s Correlation Coefficient Analysis

The relationship between the TPC and TFC present in the EOs, and their in vitro antioxidant and antitumor activities, was expressed by adopting Pearson's correlation coefficients (PCC), also referred to as Pearson’s r, and is represented in Table 3.
PCCs of -0.9260 and -0.9617 imply a strong negative correlation between TFC / DPPH, and TPC / DPPH, respectively. In general, a sample with high levels of TFC and TPC gives a high level of DPPH where phenolic compounds are classified according to the hydroxyl groups attached to the benzene ring. Such hydroxyl groups are usually good hydrogen donors and can react and neutralize reactive oxygen such as DPPH [51,52]. Consequently, a high concentration of phenolic compounds in an extract is often followed by a high antioxidant activity. On the other hand, IC50 values of MCF-7, at 24h post-treatment, showed an extremely high positive correlation to the total flavonoid content (correlation coefficient: 0.99997), with a strong negative correlation with the IC50 of DPPH (correlation coefficient: -0.9286). Based on such findings, two conclusions can be suggested: first, flavonoids seem to be an important contributor to the anti-tumor effect against MCF-7, and, second, the radical scavenging mechanism follows a highly similar mechanism through which the anti-tumor effect against MCF-7 cells takes place. We note similarly that the content of phenols shows a strong positive correlation (0.9186) with the antitumor effect over MDA-MB-231 and its IC50 value at 24h post-treatment.

3. Materials and Methods

3.1. Collection of the Petals of L. camara

Three different flower colors of L. camara were collected freshly from the Lebanese University at Hadath, Beirut (33°49'39"N, 35°31'17"E) during June and July 2023. Everytime 100 to 150 g of fresh white, pink, or orange petals were collected and divided into three flasks of 1 L capacity in order to perform the extraction process.

3.2. Hydrodistillation with Clevenger

Ground flowers of the L. camara were subjected to hydrodistillation with the Clevenger apparatus under optimal operational conditions. 40 g of the flowers were mixed with 400 ml of distilled water. The distillation process was performed for 3 h, and the obtained essential oil was collected and dehydrated using anhydrous Na2SO4.

3.3. GC-MS analysis

GC-MS analysis was carried out using the electron ionization method. The GC capillary column used was an Agilent 19091S-433, HP-5MS with a 5% Phenyl Methyl Siloxane, film thickness of 0.25 μm, a length of 30 m, and an internal diameter of 250 µm. Helium was used as carrier gas with a column head pressure of 1.09 bar, flow rate of 1 ml.min-1, and 1 μL injections in split mode (1:50). The initial column temperature applied was 65°C, then increased to reach 450°C. The GC oven temperature program ranged between an initial temperature of 65°C and final temperature of 200°C, with a run time of 45 minutes. The mass spectrometer was operated in the EI mode at 70 eV with a mass scanning range of 50-500 and a source temperature of 230°C. The identity of each compound was achieved based on their retention indices, and by comparison of their mass spectral fragmentation patterns with those reported in the NIST library database (NIST). The quantitative analysis expressing the percentage of the identified components in each volatile oil was obtained by the integration of the peak areas. Only fully identified compounds are reported in this study.

3.4. TFC analysis

TFC was determined by the aluminum chloride colorimetric method [53]. In a test tube, 1 ml of the diluted plant extract solution and 1 ml of AlCl3.6H2O (2% solution) were mixed together and left in dark at room temperature for 30 min to react. After incubation, the absorbance of the developed yellow color was measured at λmax = 410 nm using a double beam UV-VIS spectrophotometer against a blank solution. The same procedure was done using rutin as a reference standard (0-0.09 mg.ml-1). A standard curve of absorbance versus different concentrations of Rutin was plotted. Results were reproduced in triplicate for each analytical trial, from which the mean and standard deviation values were calculated [54]. TFC was determined from the linear equation of a standard curve prepared with rutin and expressed in mg of Rutin Equivalent (RE) per g of plant extract using the following equation:
T F C = C   x   V   x   D F m
Where C is the concentration of Rutin calculated by the calibration curve regression equation in mg.ml-1, V is the volume of plant extract solution in ml, DF is the dilution factor, and m is the mass of extract in g used to prepare the plant extract solution.

3.5. TPC analysis

TPC was determined by the Folin-Ciocalteu reagent (FCR) method. In this procedure, 100 μL of the diluted plant extract was added to 500 µL of FCR and incubated for 5 min in the dark. Then, 2 ml of Na2CO3 was added and samples were shaken and left in the dark at room temperature for 30 min. The absorbance of the developed blue color was measured at 760 nm using a double beam UV-VIS spectrophotometer against a blank solution. The same procedure was done using gallic acid as a reference standard (0-0.27 mg.ml-1), then a standard curve of absorbance versus different concentrations of gallic acid was plotted [55]. The TPC was determined from the linear equation of a standard curve prepared with Gallic acid and expressed in mg Gallic acid Equivalent (GAE) per g of plant extract using the following equation:
x   = C   x   V   x   D F m
Where C is the concentration of gallic acid calculated by the calibration curve regression equation in mg.ml-1, V is the volume of plant extract solution in ml, DF is the dilution factor, and m is the mass of extract in g used to prepare the plant extract solution.

3.6. DPPH Assay

The free radical scavenging activity of the three samples and of the ascorbic acid solution was investigated using the DPPH method [56]. In this procedure 1 ml of the PE solution of different concentrations was added to 1 ml of the DPPH methanolic solution. A control consisting of 1 ml of DPPH solution with 1 ml methanol was also prepared. The mixtures were shaken vigorously then incubated in dark at room temperature for 30 min to reach steady state. The color change, from violet at low concentration to yellow at high concentration, was determined by measuring the absorbance at 520 nm against a Blank solution using a double beam UV-VIS spectrophotometer. The same procedure was done for ascorbic acid, a pure antioxidant compound, which was used as a standard reference [57]. The percentage of scavenging activity of each extract on DPPH radical was calculated as % inhibition of DPPH using the following equation:
%   s c a v e n g i n g = A   ( c o n t r o l ) A   ( s a m p l e ) A   c o n t r o l     x   100  
Where A(control) is the absorbance of DPPH alone, and A(sample) is the absorbance of DPPH with different concentrations of extracts. The concentration of the extract required to scavenge 50% of the DPPH free radical (IC50) was determined from the percentage curve of DPPH inhibitions versus extract concentration. Antioxidant activity of all samples and their IC50 was compared to that of ascorbic acid.

3.7. FRAP Assay

A serial dilution of extract solutions (0.35-2.1 mg.ml-1) and ascorbic acid (0.015-0.15 mg.ml-1) was prepared in ethanol. 200 μL of each extract solution was mixed with 200 μL of 0.2 M phosphate buffer (pH 6.6) and 200 μL of potassium ferricyanide (1%). The reaction mixtures were incubated at 50°C for 20 min. After cooling, 200 μL of trichloroacetic acid (10%) were added and the mixtures centrifuged at 1,000 rpm for 8 min. The upper layer (800 μL) was mixed with 800 μL of distilled water and 160 μL of ferric chloride (0.1%). After a 10 min reaction time, the spectrometric absorbance was recorded at 700 nm and compared with ascorbic acid as the positive control. The absorbance values were plotted against the concentration, and a linear regression analysis was carried out. Higher absorbance readings indicate higher reducing power [58].

3.8. Cell Culture

The human breast cancer MCF-7 and MDA-MB-231 cell lines were purchased from the American Type Culture Collection (ATCC). MCF-7 and MDA-MB-231 were cultured as previously described [59,60]. MCF-10A cells were cultured in DMEM-F12 supplemented with horse serum (5%), hydrocortisone (0.5 μg.ml-1), EGF (20 ng.ml-1), insulin (10 μg.ml-1), 100 U.ml-1 of penicillin and 100 μg.ml-1 of streptomycin. Cells were either left untreated (control) or treated with different concentrations of EOs for 24, 48, and 72 hours.

3.9. Cell Proliferation Assay

The anti-proliferative effect of the EOs was assessed using MTT (3-(4,5-dimethylthiazol-2-yl)-2,5-diphenyltetrazolium bromide) assay (Sigma-Aldrich). This assay determines the cell viability by measuring the amount of formazan dye that is produced upon cellular reduction of MTT by metabolically active cells. MCF-7, MDA-MB-231, and MCF-10A cells were seeded in triplicates for each condition in 96-well plates at a density of 7x10³ cells/0.1 ml, 5x10³ cells/0.1 ml, and 10x103 cells/0.1 ml respectively. After adherence, cells were left untreated or treated with a concentration range of 0-500 mg.ml-1 of EO1, EO2, or EO3 for 24, 48, and 72 hours. At each time-point, 10 μL/well of MTT reagent (5 mg.ml-1) was added, and cells were incubated at 37℃ for 3h. The reaction was stopped and the formazan crystals were dissolved by adding 100 μL of 10% SDS in 0.01 N HCl. Absorbance was measured at 570 nm using a Varioskan Flash plate reader (Thermo Fisher Scientific). Cell proliferation was represented as the mean percent control plotted against the log of concentration and incubation time of three independent experiments repeated for each sample. IC50 values were generated from the non-linear regression with variable slope dose-response curves.

3.10. Statistical Analyses

Statistical analyses were performed using the GraphPad Prism 5 software (GraphPad, San Diego, CA, USA). Values are expressed as mean ± SD (standard deviation). Differences between control and treated- groups were assessed for statistical significance by the two-way ANOVA test followed by the post hoc Tukey test for multiple comparison analysis. Each experiment was repeated at least three times and each condition was done in triplicate.

4. Conclusion and Outlook

In a nutshell, we are reporting on the first study of EOs obtained from the L. camara flowers based on their distinct blossom color. The work deals specifically with the antitumor effect of such flower-derived samples. GC-MS analysis revealed different chemical profiles for the EOs of white, pink, and orange flowers. EO1 (white flowers) was shown to be distinctively rich in (+)-epi-bicyclosesquiphellandrene and bicyclogermacrene, both of which are known for their anti-tumor activities. Interestingly, EO3 (orange flowers) showed the highest antioxidant activity in comparison to a very low performance for EO1. On the other hand, a highly potent anticancer activity of the latter was perceived on MCF-7 and MDA-MB-231 breast cancer cell lines. EO1 exhibited such strong activity by significantly inhibiting the cell proliferation at lower concentrations, while selectively targeting cancer cells over normal breast cells. This study underscores the importance of exploring detailed chemical diversity of plant-derived essential oils in relation to their biological activities, paving the way for the discovery of new bioactive compounds with potential clinical applications. However, further research is needed to isolate and characterize the specific active compounds and to elucidate their mechanisms of action in cancer therapy. Additionally, we are interested in the evaluation of the antioxidant and antitumor effects of some commercially-available compounds that are components of the three EOs and that could be tested in their pure form.

Supplementary Materials

The following supporting information can be downloaded at the website of this paper posted on Preprints.org.

Author Contributions

J.E.-H. Investigation, Writing - Original Draft; L.K. Investigation, Formal analysis; A.J. Conceptualization, Methodology, Project administration, Writing - Review & Editing; E.C. Resources, Supervision; E.A. Resources, Writing - Review & Editing; P.H.K. Data Curation, Supervision, Writing - Review & Editing; J.-N.I. Data Curation, Supervision, Writing - Review & Editing.; A.Y. Conceptualization, Project administration, Validation, Writing - Original Draft, Funding acquisition.

Funding

This research was in part funded by the Lebanese American University, President's Intramural Research Fund PIRF, grant number I0042.

Data Availability Statement

The original contributions presented in the study are included in the article/supplementary material, further inquiries can be directed to the corresponding authors.

Dedication

This paper is dedicated to the loving memory of Mariam Hussein Kobeissy (2021-2024).

Conflicts of Interest

The authors declare no conflicts of interest.

List of Abbreviations

The following is a list of abbreviations in the sequence of their appearance. EO: essential oils; DPPH: 2,2-diphenyl-1-picrylhydrazyl; FRAP: ferric reducing antioxidant power; MTT: 3-(4,5-dimethylthiazol-2-yl)-2,5-diphenyltetrazolium; L. camara: Lantana camara; GC-MS: Gas Chromatography-Mass Spectroscopy; BCP: (−)-β-caryophyllene; TFC: Total Flavonoid Content; TPC: Total Phenol Content; BC: breast cancer; PCC: Pearson's correlation coefficients; RE: Rutin Equivalent; FCR: Folin-Ciocalteu reagent; GAE: Gallic acid Equivalent; ATCC: American Type Culture Collection; SD: standard deviation.

References

  1. H. A. Parimoo, R. Sharma, R. D. Patil, V. Patial, Comp. Clin. Pathol., 2015, 24, 1541–1552. [CrossRef]
  2. S. Kalita, G. Kumar, L. Karthik, K.V.B. Rao, Research J. Pharm. and Tech. 2012, 5, 6, 711-715.
  3. B.S. Nayak, S.S. Raju, M. Eversley, A. Ramsubhag, Phytother. Res. 2009, 23, 241–245. [CrossRef]
  4. T. Ganesh, S. Saikat, E. Thilagam, G. Thamotharan, T. Loganathan, R. Chakraborty, International Journal of Research in Pharmaceutical Sciences, 2010, 1, 3, 247–252.
  5. O.P. Sharma, H.P. Makkar, R.K. Dawra, Toxicon, 1988, 26, 11, 975-987. [CrossRef]
  6. M. Shah, H. F. Alharby, K. R. Hakeem, Letters in Applied NanoBioScience, 2020, 9, 3, 1199–1207. [CrossRef]
  7. A. Mansoori, N. Singh, S. K. Dubey, T. K. Thakur, N. Alkan, S. N. Das, A. Kumar, Front. Agron., 2020, 2, 582268. [CrossRef]
  8. K. Aisha, N. U. Visakh, B. Pathrose, N. Mori, R. S. Baeshen, R. Shawer, Molecules 2024, 29, 344. [CrossRef]
  9. F. Nea, D. Kambiré, M. Genva, E. Tanoh, E. Wognin, H. Martin, Y. Brostaux, F. Tomi, G. C. Lognay, Z. Tonzibo, M.-L. Fauconnier, Molecules 2020, 25, 2400;. [CrossRef]
  10. S. El Kantar, A. Yassin, B. Nehmeh, L. Labaki, S. Mitri, F. Naser Aldine, A. Hirko, S. Caballero, E. Monck, A. Garcia-Maruniak, E. Akoury. Sci. Rep. 2022, 12, 15489. [CrossRef]
  11. M. Sharma, P.D. Sharma, M.P. Bansal, J. Singh, Chem. and Biodivers., 2007, 4, 5, 932–939. [CrossRef]
  12. M. Sharma, P.D. Sharma, M.P. Bansal, J. Nat. Prod., 2008, 71, 7, 1222–1227. [CrossRef]
  13. V.B. Babar, P.R. Khapale, S. Nagarale, Journal of Pharmacognosy and Phytochemistry, 2019, 8, 5, 2524-2527.
  14. E. B. Han, B. Y. Chang, Y. S. Jung, S. Y. Kim, Pathol. Oncol. Res., 2015, 21, 325–331. [CrossRef]
  15. H. Wang, T.O. Khor, L. Shu, Z.-Y. Su, F. Fuentes, J.-H. Lee, A.-N. T. Kong, Anticancer Agents Med Chem. 2012, 12, 10, 1281–1305. [CrossRef]
  16. D. Ochwang’i, C. Kimwele, J. Oduma, P. Gathumbi, J. Mbaria, S. Kiama, J. Ethnopharmacol. 2014, 151, 3, 1040-1055. [CrossRef]
  17. M. Greenwell, P.K.S.M. Rahman, Int. J. Pharm. Sci. Res. 2015, 6, 10, 4103–4112. [CrossRef]
  18. P. Aiello, M. Sharghi, S.M. Mansourkhani, A. P. Ardekan, L. Jouybari, N. Daraei, K. Peiro, S. Mohamadian, M. Rezaei, M. Heidari, I. Peluso, F. Ghorat, A. Bishayee, W. Kooti, Oxid. Med. Cell. Longev. 2019, 2019, 2075614. [CrossRef]
  19. M. S. O'Reilly, T. Boehm, Y. Shing, N. Fukai, G. Vasios, W. S. Lane, E. Flynn, J.R. Birkhead, B.R. Olsen, J. Folkman, Cell, 1997, 88, 2, 277-85. [CrossRef]
  20. The American Cancer Society medical and editorial content team: Chemotherapy Side Effects. Retrieved from https://www.cancer.org/cancer/managing-cancer/treatment-types/chemotherapy/chemotherapy-side-effects.html Accessed on 07.10.2024.
  21. G.M. Cragg, D.J. Newman, J. Ethnopharmacol. 2005, 100, 1-2, 72-9. [CrossRef]
  22. R. Sivaraj, P. Rahman, P. Rajiv, S. Narendhran, R. Venckatesh, Spectrochim. Acta A Mol. Biomol. Spectrosc. 2014, 129, 255-258. [CrossRef]
  23. B. Hassan, Plants and Cancer Treatment, Medicinal Plants - Use in Prevention and Treatment of Diseases. IntechOpen, 2020. [CrossRef]
  24. Nea, F.; Kambiré, D.A.; Genva, M.; Tanoh, E.A.; Wognin, E.L.; Martin, H.; Brostaux, Y.; Tomi, F.; Lognay, G.C.; Tonzibo, Z.F.; et al. Molecules 2020, 25, 2400. [CrossRef]
  25. S. Zoubiri, B. Aoumeur, Journal of Essential Oil Research 2012, 24.4, 377-383.
  26. J. U. Chowdhury, N. C. Nandi, I. Nazrul, M. N.I. Bhuiyan, Bangladesh Journal of Botany, 2007, 36.2, 193-194.
  27. K. Aisha, N.U. Visakh, B. Pathrose, N. Mori, R.S. Baeshen, R. Shawer, Molecules 2024, 29, 2, 344. [CrossRef]
  28. L. Gushiken, F. Beserra, M. Hussni, M. Gonzaga, V. Ribeiro, P. Fernanda de Souza, J. Campos, T. Massaro, C. Hussni, R. Takahira, P. Marcato, J. Bastos, C. Pellizzon, Oxidative Medicine and Cellular Longevity, 2022, 2022, 9004014. [CrossRef]
  29. J.-H. Wang, F. Luan, X.-D. He, Y. Wang, M.-X. Li, Journal of Traditional and Complementary Medicine, 2018, 8, 1, 24-38. [CrossRef]
  30. A.R. Do, S.A. Emami, M. Akaberi, Phytochem. Rev. 2024. [CrossRef]
  31. Sundufu, A.J., Shoushan, H., Flavour and Fragrance Journal, 2004, 19, 3, 229-232. [CrossRef]
  32. E.O. Sousa, A.V. Colares, F.F.G. Rodrigues, A.R. Campos, S.G. Lima, J.G.M. Costa, Records of Natural Products, 2010, 4, 1, 31-37.
  33. R. Singh, B. Tiwari, U. Sharma, S. Singh, Asian Journal of Chemistry, 2012, 24, 12, 12.
  34. R. Liambila, J. Wesonga, C. Ngamau, W. Wallyambillah, Afr. J. Agric. Res. 2021, 17, 9, 1198-1208. [CrossRef]
  35. A.N. Mamadaliev, Kh.Kh. Kushiev, Z.R. Abdullaeva, Austrian Journal of Technical and Natural Sciences, 2022, 5-6, 3. [CrossRef]
  36. C.A. Semeniuc, M.-I. Socaciu, S.A. Socaci, V. Mureșan, M. Fogarasi, A.M. Rotar, Molecules, 2018, 23, 9, 2261. [CrossRef]
  37. A.M. Shraim, T.A. Ahmed, M. Rahman, Y.M. Hijji, LWT, 2021, 150, 111932. [CrossRef]
  38. K. Zhang, Y. Zuo, J. Agric. Food Chem. 2004, 52, 2, 222–227. [CrossRef]
  39. A.E. Al Snafi, Asian Journal of Pharmaceutical and Clinical Research, 2019, 12, 12, 10-20. [CrossRef]
  40. J. Kapali, K.R. Sharma, J. Med. Plants 2021, 20, 80, 102-116. [CrossRef]
  41. M. Li, P.W. Paré, J. Zhang, T. Kang, Z. Zhang, D. Yang, K. Wang, H. Xing, Rec. Nat. Prod. 2018, 12, 239–250. [CrossRef]
  42. G.S. El Baroty, H.M. Goda, E.A. Khalifa, H. H. Abd El Baky, Der Pharma Chemica, 2014, 6, 6, 246-255.
  43. A. Sajid, Q. Manzoor, M. Imran, F. Aslam, T.A. Gondal, R.S. Ahmad, et al. Sains Malaysiana, 2021, 50, 10, 2923-2936. [CrossRef]
  44. A. Mahdi-Pour, S.L. Jothy, L.Y. Latha, Y. Chen, S. Sasidharan, Asian Pacific Journal of Tropical Biomedicine, 2012, 2, 12, 960-965. [CrossRef]
  45. H. Annaz, K. El Fakhouri, W. Ben Bakrim, I. Mahdi, M. El Bouhssini, M. Sobeh, Critical Reviews in Food Science and Nutrition, 2024, 64, 21, 7343-7362. [CrossRef]
  46. M. Radice, A. Durofil, R. Buzzi, E. Baldini, A.P. Martínez, L. Scalvenzi, S. Manfredini, Life 2022, 12, 1602. [CrossRef]
  47. B. Ivanescu, A. Miron, A. Corciova, J. Anal. Methods Chem., 2015, 2015, 247685. [CrossRef]
  48. Prithviraj Karak, International Journal of Pharmaceutical Sciences and Research, 2019, 10, 4, 1567-1574. [CrossRef]
  49. F. Guesmi, A.K. Tyagi, S. Prasad, A. Landoulsi, Oncotarget. 2018, 9, 32305-32320. [CrossRef]
  50. M.M. Montalvão, F.B. Felix, E.W. Propheta dos Santos, et al., BMC Complement. Med. Ther. 2023, 23, 139.
  51. R.P. Pereira, R. Fachinetto, A. de Souza Prestes, et al., Neurochem. Res. 2009, 34, 973–983. [CrossRef]
  52. R. San Miguel-Chávez, Phenolic Compounds-Biological Activity, 2017, 8, 54-79.
  53. A. Jaber, R. Soukariyeh, A. Khalil, F. Abdel-Sater, E. Cheble, Int. J. Pharm. Sci. Rev. Res., 2020, 61, 1, 70-77.
  54. D. Barreca, G. Laganà, U. Leuzzi, A. Smeriglio, D. Trombetta, E. Bellocco, Food Chemistry, 2016, 196, 493-502. [CrossRef]
  55. V.L. Singleton, R. Orthofer, R.M. Lamuela-Raventós, Methods in Enzymology, 1999, 299, 152-178. [CrossRef]
  56. N. Awada, A. Ayoub, A. Jaber, F. Ibrahim, N. El Ghotmi, E. Cheble, Pharm Sci. 2023, 29, 3, 384–394. [CrossRef]
  57. M. Oyaizu, Jpn. J. Nutr. Diet., 1986, 44, 6, 307-315. [CrossRef]
  58. Balouiri M, Sadiki M, Ibnsouda SK, Journal of Pharmaceutical Analysis, 2016, 6, 2, 71-79. [CrossRef]
  59. J. Semaan, S. El-Hakim, J.-N. Ibrahim, R. Safi, A. Elnar, C. El Boustany, Breast Cancer 2020, 27, 696–705. [CrossRef]
  60. J.-N. Ibrahim, S. El-Hakim, J. Semaan, S. Ghosn, H. El Ayoubi, A.A. Elnar, N. Tohme, C. El Boustany, Biomedicines 2024, 12, 1779. [CrossRef]
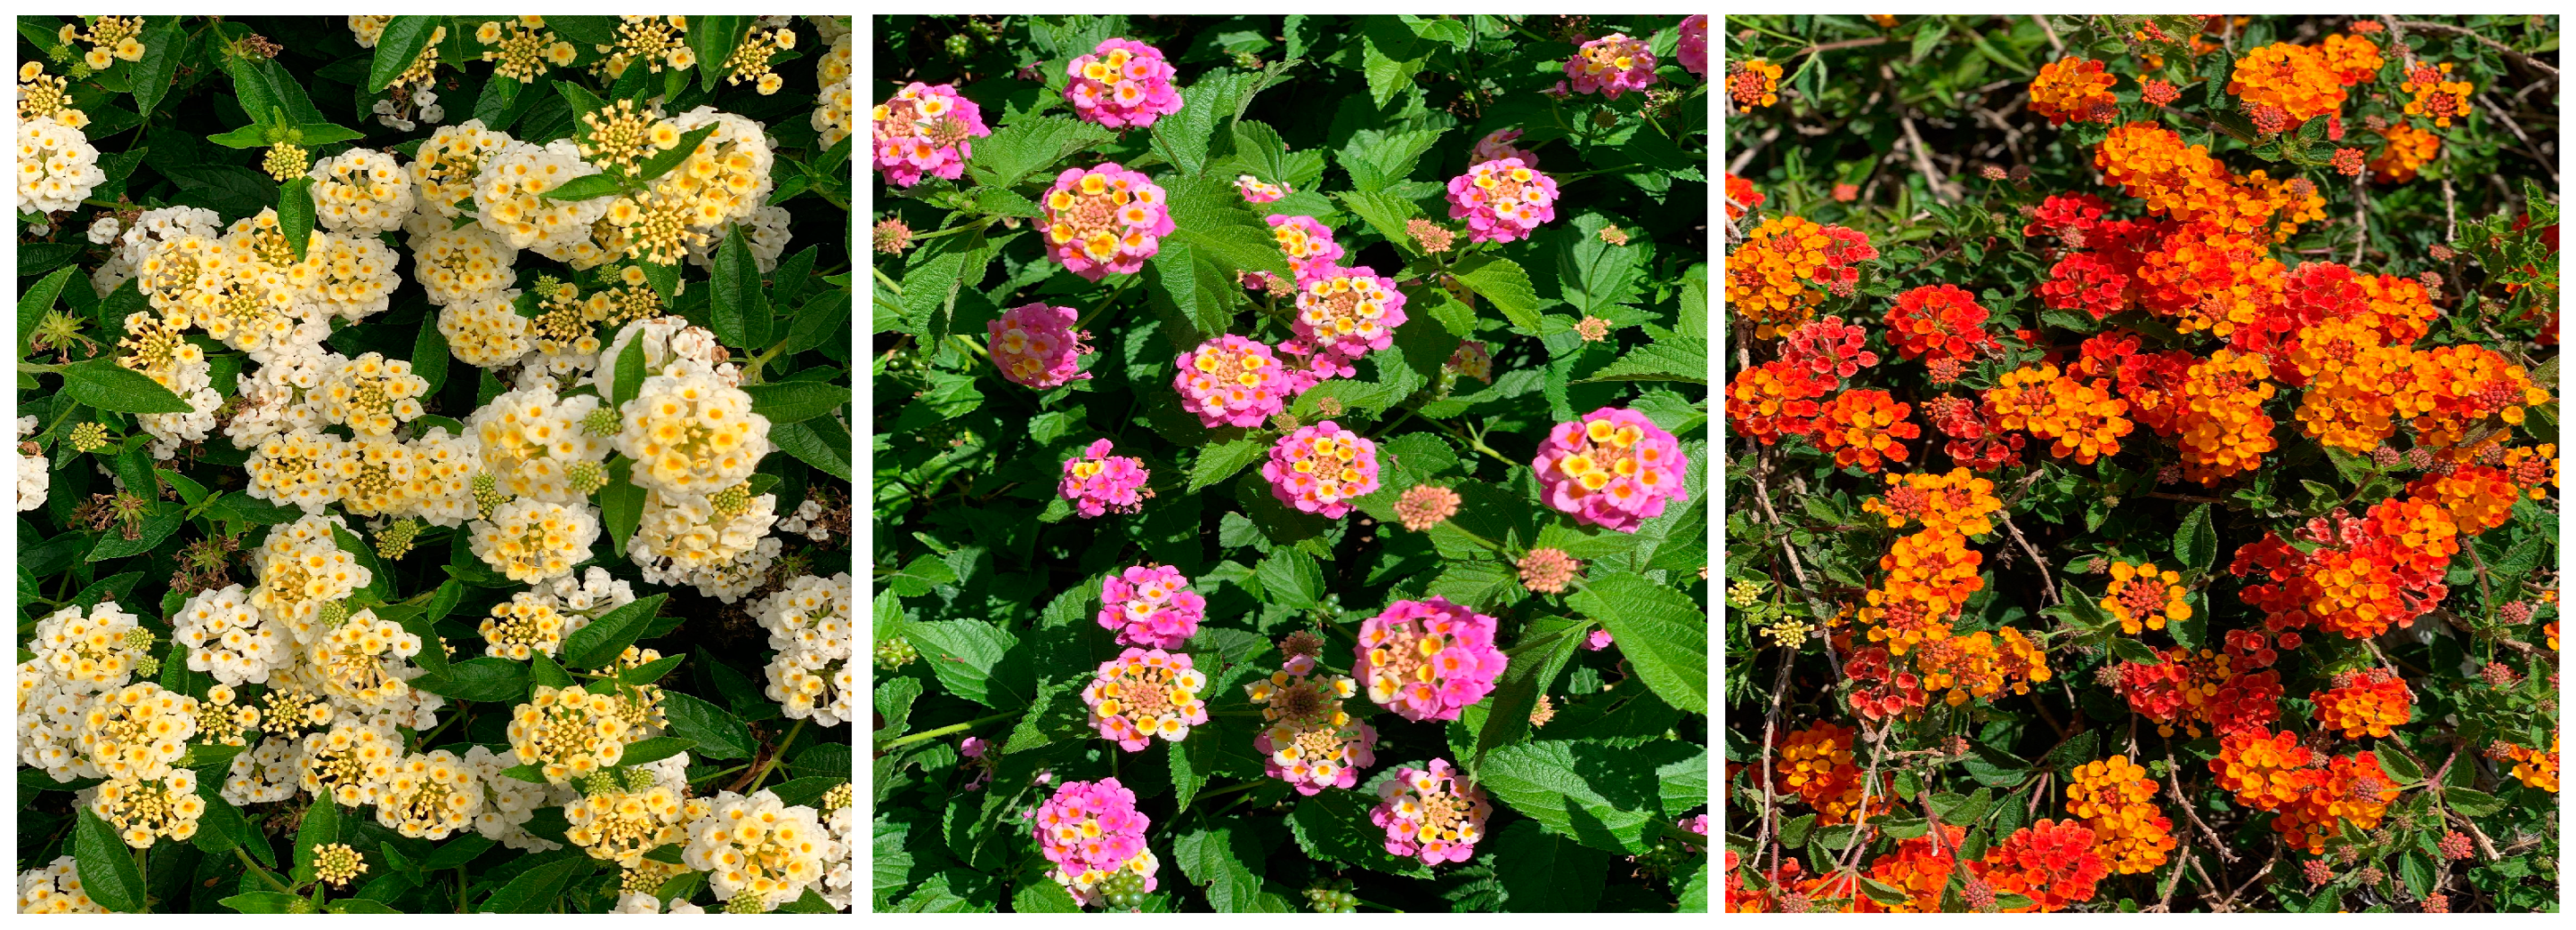
Figure 1. The three flowers of L. camara (white, pink, and orange) as collected.
Preprints 121912 g001
Figure 2. A, B, C: Main constituents of the EOs of L. camara obtained from GC-MS analysis. D: Yields of extraction of the three samples. E: Chemical structures of the different compounds.
Preprints 121912 g002
Figure 3. Results of IC50 of the three EOs as compared to ascorbic acid.
Preprints 121912 g003
Figure 4. In vitro cytotoxic activity of EO1, EO2, and EO3 on the MCF-7, MDA-MB231, and MCF-10A cell lines. Representative graphs of the time-dependent cytotoxic effect of different concentrations of the oils on MCF-7 (A), MDA-MB231 (B), MCF-10A (C) cells. Dose-dependent inhibitory activity for EO1, EO2, and EO3 48 hours post-treatment on MCF-7 (D) and MDA-MB-231 (E) is presented as a bar plot. Data are presented as mean ± SD (n = 3) with all treatments compared to each other by a two-way ANOVA test followed by the post hoc Tukey test for multiple comparison analysis; *p < 0.05, ** p < 0.01, *** p < 0.001, **** p < 0.0001.
Preprints 121912 g004
Figure 5. Chemical structures of the possible antitumor-active phytochemicals in EO1.
Preprints 121912 g005
Table 1. Results of the TFC, TPC, and IC50 of the three sample with a dilution factor DF = 1.
Sample TFC
(mg of RE/g of extract)
TPC
(mg of GAE/g of extract)
IC50
(mg/ml) 1
EO1 2.41 16.80 4.64
EO2 2.93 24.63 2.79
EO3 5.12 26.71 1.21
1 Ascorbic acid value = 0.004
Table 2. Mean IC50 values of EOs on MCF-7, MDA-MB-231, and MCF-10A cell lines at 24-, 48-, and 72-hours post-treatment.
Cell line Time
(hours)
IC50 (g.ml-1)
EO1 EO2 EO3
MCF-7
(BC)
24 0.3061±0.091 0.3630±0.057 0.5927±0.03
48 0.3021±0.043 0.4101±0.109 0.3937±0.09
72 0.3179±0.002 0.4144±0.09 0.3397±0.027
MDA-MB-231
(BC)
24 0.3099±0.001 0.7398±0.012 0.6473±0.005
48 0.2820±0.022 0.4015±0.01 0.4150±0.06
72 0.2800±0.023 0.3931±0.058 0.3951±0.08
MCF-10A
(normal)
24 > 1 > 1 > 1
48 > 1 > 1 > 1
72 > 1 > 1 > 1
Table 3. Pearson's correlation coefficients for TFC, TPC, DPPH, MCF-7, and MDAMB-231 in the three EOs under consideration.
TFC TPC DPPH MCF-7 MDA-MB-231*
TFC 1
TPC 0.7869 1
DPPH -0.9260 -0.9617 1
MCF-7 0.99997 0.7913 -0.9286 1
MDA-MB-231 0.4790 0.9186 -0.7750 0.4853 1
* Relevant IC50 values at 24 h post-treatment.
Disclaimer/Publisher’s Note: The statements, opinions and data contained in all publications are solely those of the individual author(s) and contributor(s) and not of MDPI and/or the editor(s). MDPI and/or the editor(s) disclaim responsibility for any injury to people or property resulting from any ideas, methods, instructions or products referred to in the content.
Copyright: This open access article is published under a Creative Commons CC BY 4.0 license, which permit the free download, distribution, and reuse, provided that the author and preprint are cited in any reuse.
Prerpints.org logo

Preprints.org is a free preprint server supported by MDPI in Basel, Switzerland.

Subscribe

© 2024 MDPI (Basel, Switzerland) unless otherwise stated