Preprint
Article

Comparative Assessments of Low- and Medium-Pressure CO2 Transport At-Sea and Inland

This version is not peer-reviewed.

Submitted:

21 October 2024

Posted:

22 October 2024

You are already at the latest version

A peer-reviewed article of this preprint also exists.

Abstract
Developing cost-efficient systems for transporting CO2 is key to accelerate the deployment of carbon capture and storage. The present work explores the impact of reducing the pressure of tank-based inland and at-sea transport on their techno-economic performance. The study uses established techno-economic models for CO2 transport, adjusted with the most up-to-date knowledge on costs of low-pressure containment and transport. Particularly, the impact of cargo tank material and design on the transport costs shows that low-pressure cargo tank systems can be 50% less expensive than medium-pressure systems if materials with similar price and strength can be used. This results in reductions in transport costs as high as 30% for long distances. This is partly driven by the currently suggested size limitation on medium-pressure shipping which limits its economies of scale. If this limitation is alleviated, the cost advantage of low-pressure shipping compared to medium-pressure is more limited (10-20%) although it remains advantageous. The same scaling effects on capacity were not found for truck and barge inland transport, thus yielding 1-10% cost reductions of low- relative to medium-pressure transport. These results imply that future systems may combine medium-pressure inland and low-pressure at-sea transport, and that efficient solutions connecting the two must be investigated.
Keywords: 
Subject: 
Engineering  -   Energy and Fuel Technology

1. Introduction

Carbon capture and storage (CCS) is a key technology to reach the ambitious target of net-zero emissions by 2050 set globally and by the European Union (EU). The deployment target involves that 230-430 MtCO2/yr should be captured, transported and stored globally by 2030 [1], but in 2023, this amount was only 50 MtCO2/yr [2]. There are several key steps to overcome the gap: reducing costs of CCS, as well as developing clear economic frameworks [3], financing mechanisms, and supporting infrastructure. Intensified efforts have resulted in the development of more efficient capture and storage technologies [4,5,6,7]. However, moving towards practical implementation has unravelled critical aspects related to the long transport distances from inland CO2 emitters to socially acceptable, permanent storage sites. CCS implementation thus require the development and deployment of suitable transport solutions. Several studies have highlighted the cost-efficiency of pipeline-based transport for large transport capacity and short to medium distances [8,9,10]. However, considering the long construction time, the cost inefficiency of pipeline-based transport for small transport capacity and long distances, tank-based solutions (ship, barge, train, trucks) are likely to play a key role in both the short- and long-term deployment of CCS [11,12,13]. As a result, more research effort has been put on different aspects of tank-based solutions ranging from fundamental modelling [14,15], process and system modelling [16,17,18], techno-economic evaluation [19,20,21], environmental aspects [22], contribution to large-scale deployment [23,24], to safety and legal aspects [25,26].
In tank-based CO2 transport systems, the CO2 is typically transported in the liquid phase (LCO2). Transport of LCO2 is in commercial operation at small scales for food-grade CO2. The first large-scale projects transporting CO2, e.g. the Longship project in Norway, will soon be operational. In these projects, CO2 is transported at conditions commonly referred to as "medium pressure" (MP), i.e. at 12-19 bar and temperatures of -20 to -35°C. Over the past decades, it has been suggested that transport conditions commonly referred to as low pressure (LP) may be more cost-efficient, i.e. 5-10 bar and -45 to -55°C. Roussanaly et al., Roussanaly et al. performed an in-depth comparison of shipping of CO2 at MP and LP to understand if transitioning to LP shipping could reduce cost. They concluded that LP shipping could enable significant cost saving compared to MP shipping due to two main factors. First, LP pressure ships are significantly cheaper than MP ships at equal ship capacity. Second, the reduced pressure enables larger cargo tanks, which has been suggested to enable maximum ship sizes of 50-100 ktCO2/ship at LP while MP ships are limited to 10 ktCO2/ship [27].
Although informative to industry, a shortcoming of the study was that it relied on literature data for ship costs [28], which may deviate from costs attained from shipbuilders. Additionally, the capacity of the MP ships was limited to 10 ktCO2/ship1 while industrial actors have indicated, but not concluded [31,32], that MP ships with higher capacities can be built. Finally, Roussanaly et al. focused solely on at-sea transport, whereas LP transport is also relevant for inland applications for which Oeuvray et al., Oeuvray et al. and Becattini et al., Becattini et al. have shown that tank-based transport on ship, barge, train and truck can be expected to play a key role in Europe on both a short and a long time horizon.
In the present study, we seek to enhance the confidence of the techno-economic comparisons of LP and MP shipping through the use of up-to-date ship construction costs developed specifically for large-scale transport of CO2 together with an engineering actor with strong expertise in ship construction. Furthermore, the study re-evaluates the impact that the current, assumed limitation on the MP ship capacity has on the transport cost comparison relative to large-scale LP shipping. Finally, the knowledge developed for the comparison of LP and MP shipping is adapted to also compare LP and MP transport of inland transport and the resulting implications.

2. Materials and Methods

In order to perform the comparison of MP and LP transport pressure for both at-sea and inland transport of CO2, two approaches are used to evaluate the transport supply chains. In the case of the shipping, the techno-economic assessments were performed with the in-house tool iCCS [27,34], developed by SINTEF Energy, while techno-economic assessments of inland transport were based on the transport model of ETH Zurich [13].

2.1. Shipping

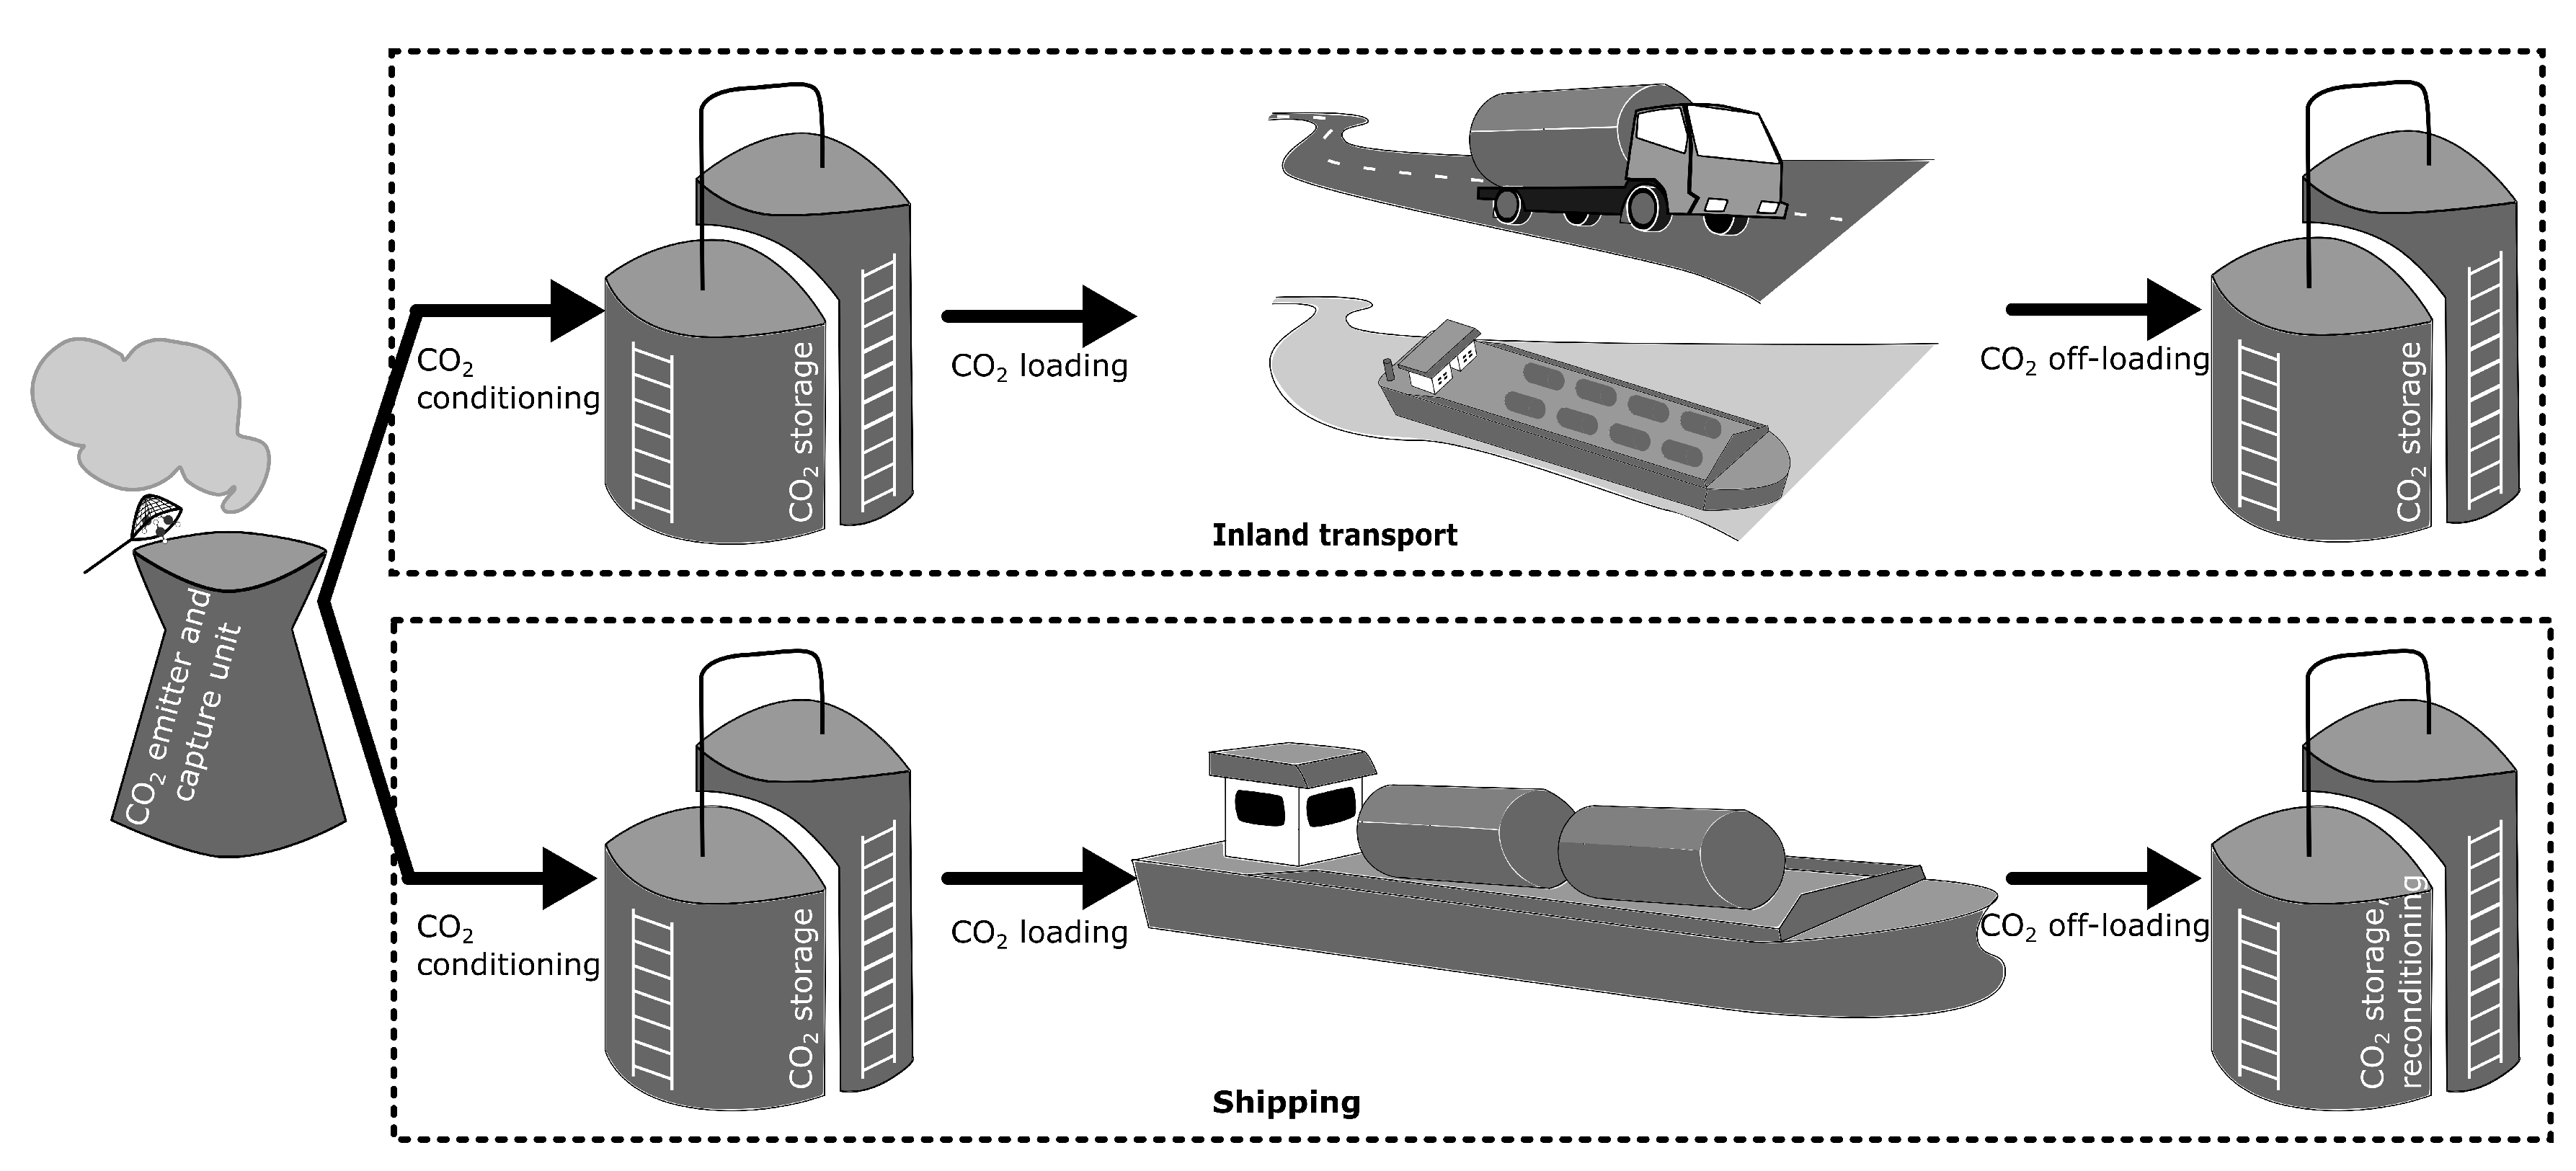
The techno-economic assessments of the shipping transport chain, performed in iCCS, are described in detail in Roussanaly et al.. Essentially the assessments account for all the steps in the shipping value chain, including 1) liquefaction of CO2, 2) supplying terminal with buffer storage and loading systems, 3) shipping, and 4) receiving terminal with offloading systems, buffer storage and reconditioning. The system boundaries are illustrated in Figure 1.
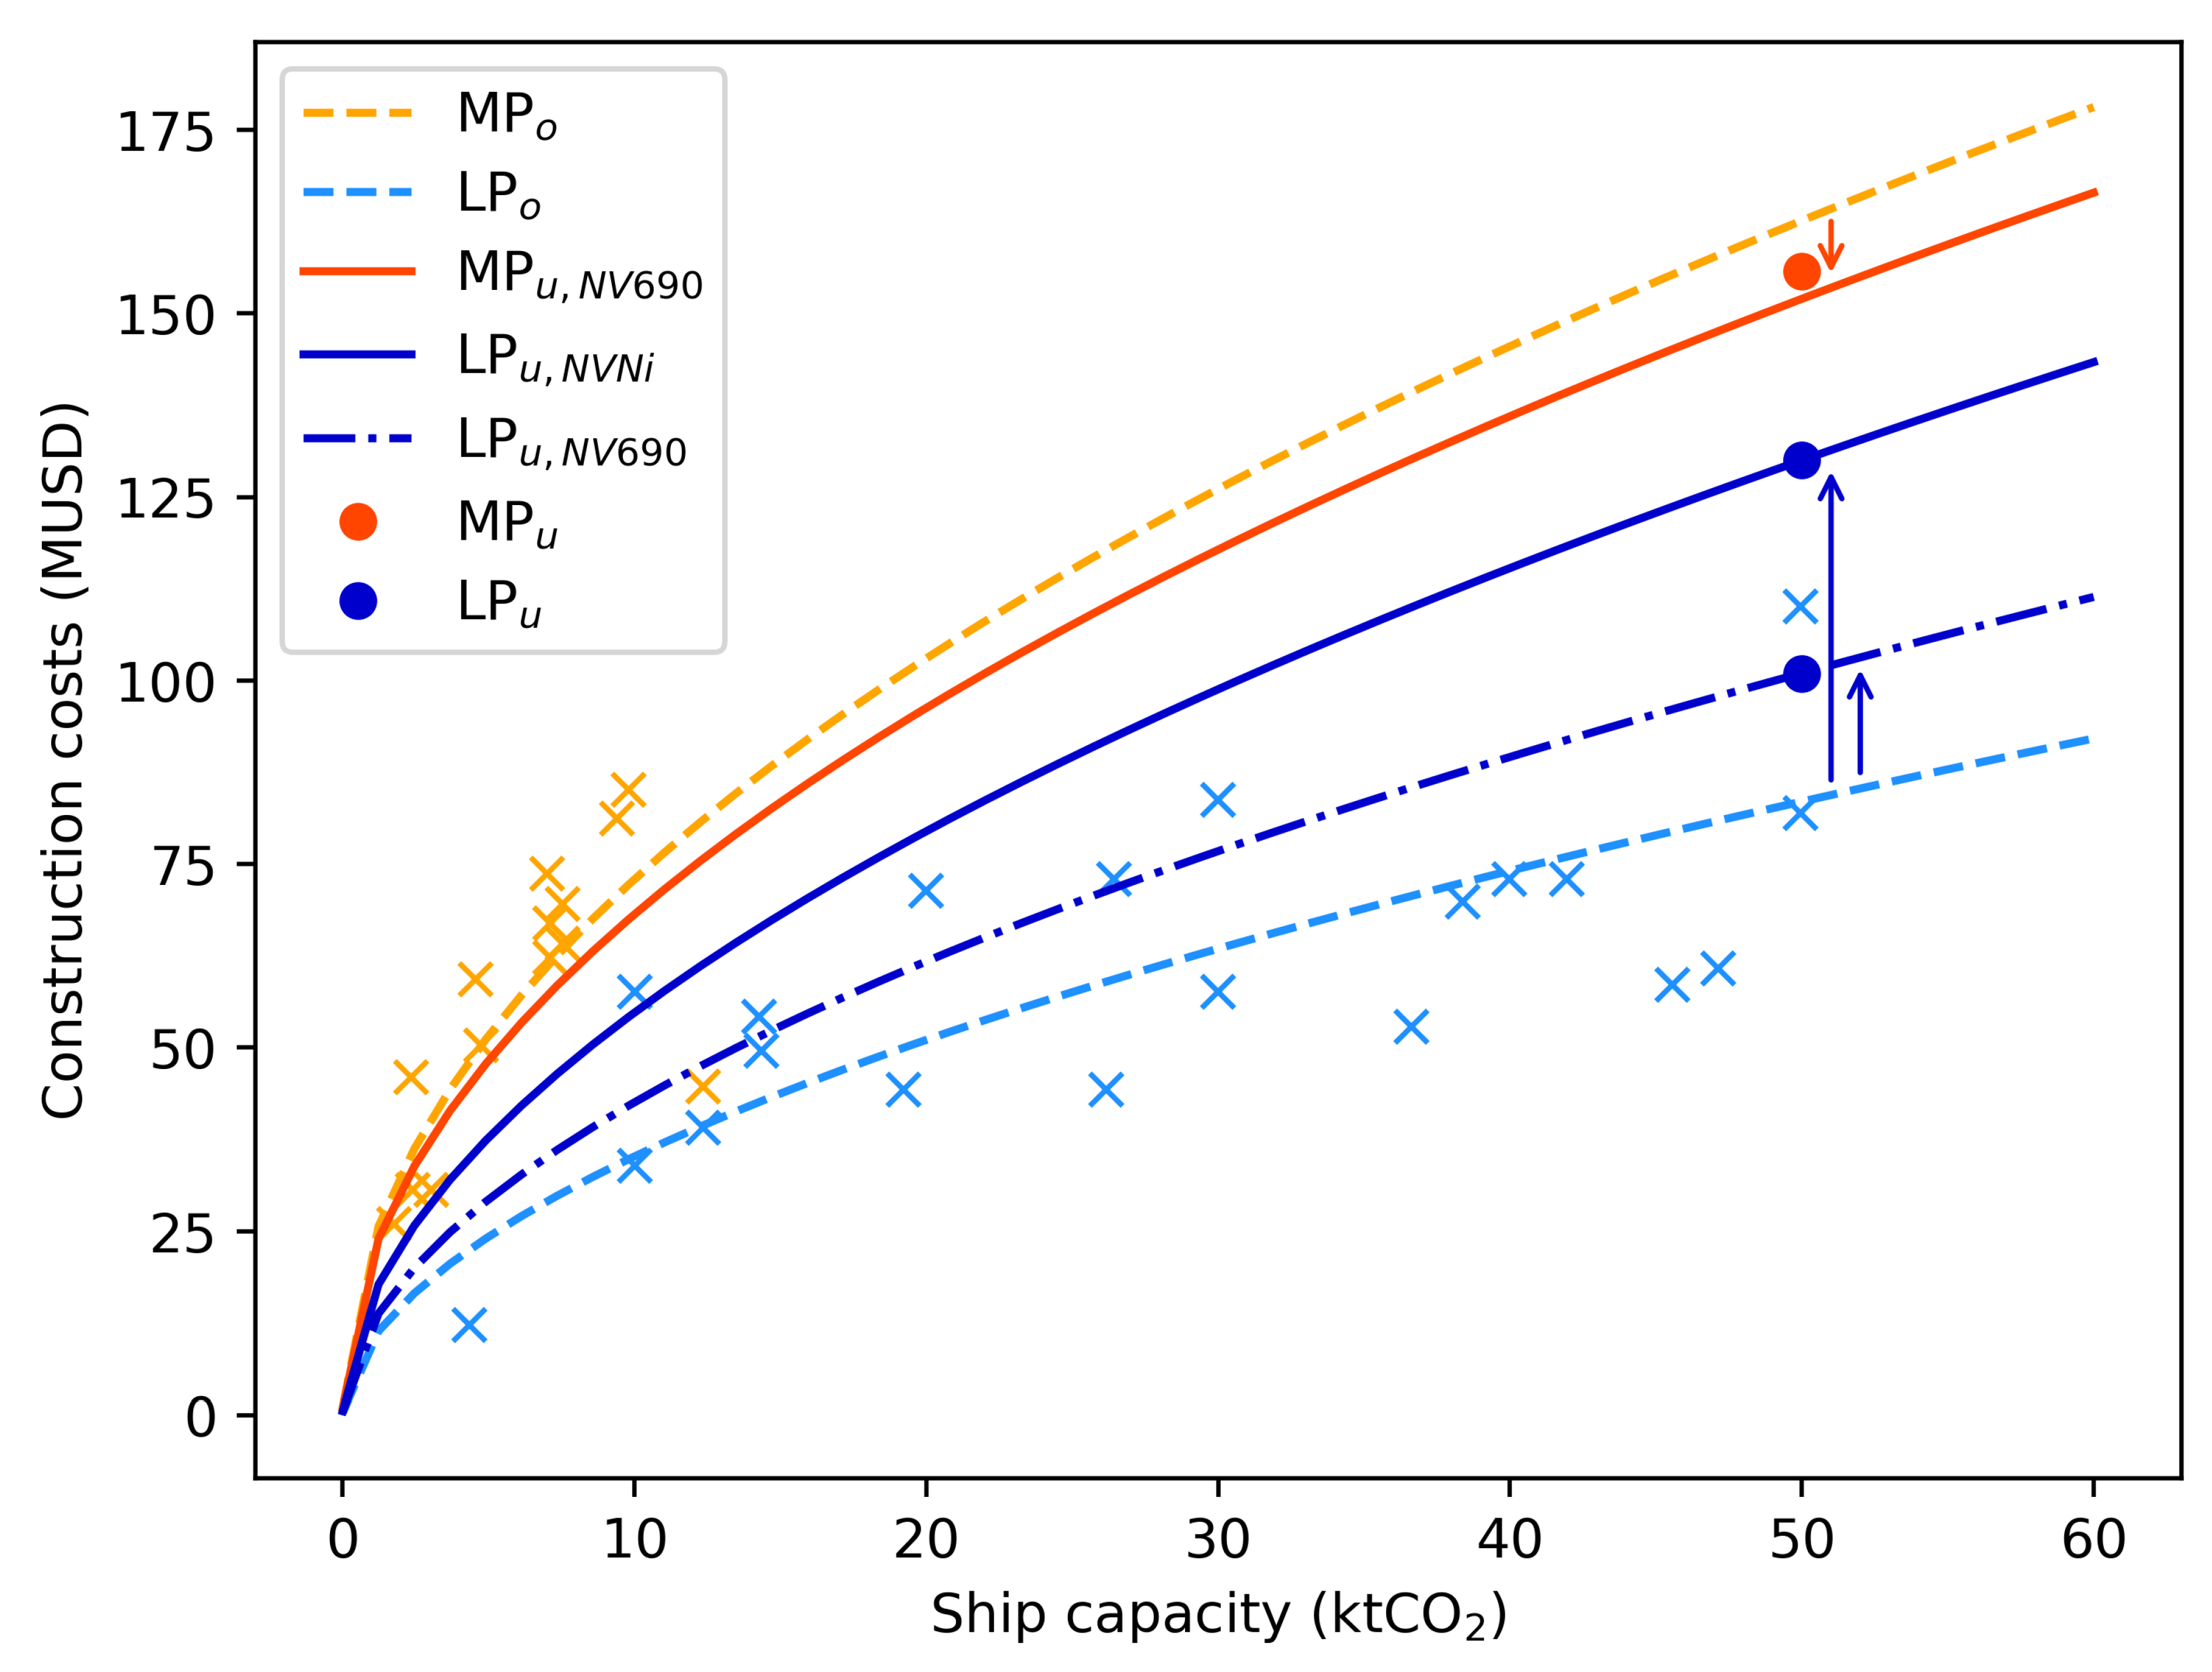
To evaluate the impact of shipping construction costs and capacity limits on the overall design and costs of the shipping value chain, we have kept the costs of steps 1, 2 and 4 as detailed in Roussanaly et al.. For step 3, we have updated the construction costs curves for LP and MP ships based on construction costs obtained from the shipping industry. A key driver for these ship costs is the material used to build the CO2 tanks. For the MP transport, tanks made of a high strength austenitic carbon steel shorted NV690 is used while a high nickel steel shorted NVNi is used in the LP tanks. The NVNi is, however, weaker and more expensive that the NV690 and similar materials typically used for containment at temperatures above -30 °C (i.e. MP conditions). Therefore, a LP ship cost scenario utilizing "low-cost" materials was also developed. NV690 was chosen to represent the low cost material since it is investigated for containment at LP conditions in the CETO project. Although the CETO project preliminary conclude that further investigations are necessary before the NV690 can be used in low-temperature applications, NV690 represents a realistic alternative for a LP tank material in terms of material properties and costs [35]. Thus, the NV690 LP ship cost scenario can help uncover the impact of finding less costly and stronger materials for LP LCO2 containment. The two LP ship cost scenarios are illustrated as a function of ship capacity in Figure 2 along with the MP ship cost curve. Here, the ship costs follow the same scale affect with ship capacity as in Durusut and Joos, Durusut and Joos, but were corrected to fit the cost resulting from the abovementioned, new industrial ship costs for MP ships with NV690 tank material and LP ships with NVNi and NV690 tank materials. Notice that ship prices generally depend on technical specifications and market conditions for the shipbuilding industry, including price fluctuations of materials and equipment, as well as financing and other aspects. Thus, prices taken from specific projects should be extrapolated with care, and only relative LP and MP costs are used in the present study.
The techno-economic assessments were then performed for the two LP cost scenarios with NVNi and NV690 tank material and the MP scenario (with NV690) for transport distances ranging from 50 to 2000 km, and for annual volumes transported ranging from 0.2 to 20 MtC O 2 /year. For each of these cases, the ship size considered, LP and MP, is optimised as in Roussanaly et al.. Another key uncertainty for the comparison is the maximum ship size for which MP ship can be built. Recent studies [28] and feedback from the industry indicate that ship capacities greater than 10 ktCO2/ship are most likely unfeasible for MP ships with conventional tank configurations, whereas capacities of at least up to 50 ktCO2/ship are foreseen for LP ships [27]. Reflecting the current consensus, base case evaluations consider a maximum ship size of 10 ktCO2/ship for MP ships. Nonetheless, two additional scenarios (15 and 30 ktCO2/ship) are considered to explore the impact of increased MP ship capacity. Table 1 shows the specifications of the different scenarios. Here, the base case (BC) is the case of shipping between harbours from Roussanaly et al., to which the results are compared. Furthermore, all cases of LP and MP shipping were compared to the costs of pipeline transport for the same distances and annual volumes. Details on the pipeline assessments can also be found in Ref. [27].

2.2. Inland Transport

The techno-economic approach of the inland transport assessments is described in detail in Oeuvray et al.. In short, the generalized cost assessment is based on connections and quotes for six specific emitters studied in the DemoUpCARMA [36] and ACCSESS [37] projects. In the present work, the techno-economic assessments were performed for two inland transport modes, truck and barge, on connections from the emitters to harbours on the coast of the North Sea. It is worth noting that due to their similar capacity with trucks, trains are not explicitly modelled in this study. For the last stage from the harbours to a permanent storage site in the North Sea, we refer to the analyses in the previous section. The overall costs of transport include capital investment, maintenance and operational costs, intermediate storage and loading stations [13]. No conditioning nor reconditioning along the inland value chain was included as illustrated in Figure 1. Furthermore, the costs of transport were assessed for the specific annual volume of each emitter, and the transport distances following the infrastructure available to that emitter. Together, this gave a map of the overall transport costs as a function of the annual volumes and transport distances ranging up to 1.6 MtCO2/year and up to 1200 km, respectively.
Only the medium-pressure inland transport was assessed in Oeuvray et al.. In this work, the costs of LP and MP cargo tanks for the trucks and barges were estimated using the relations between the transport pressure, tank diameter and length, and tank wall thickness displayed in Equation (A5) and Equation (A6) in Appendix A. Similar to the shipping assessments, two material cost scenarios for the LP cargo tanks were evaluated; one using a manganese steel, shorted NV400Mn, qualified for use at temperatures below - 45 °C2, and one using the same material as in the MP cargo tanks, namely NV690. The relative costs of the LP versus the MP transport were then assessed using the techno-economic framework of ETH described briefly above. In these assessments, the LP and MP tank sizes were equal and the same as in Oeuvray et al., meaning that the truck tank volume was 26 tCO2 and the barge tank volume was 380m3.
In the second part of the inland assessments, we explored the impact of increased size of the cargo tanks on the inland transport. The aim of these assessments was to investigate if LP vessels can hold larger cargo tanks, and thus potentially have higher capacities, than the MP vessels, thereby reducing the costs of the LP inland transport. Since no difference between the MP and LP barges were found in the analyses, the details and results of the tank assessments are included and discussed in the Appendix B.

3. Results and Discussions

3.1. Shipping

The different scenarios of LP and MP shipping displayed in Table 1 are compared to shed light on the mechanisms that impact the costs of the two transport modalities. Since the techno-economic comparisons are performed for a wide range of transport distances and annual volumes, the results are presented as a series of cost comparison heat maps, where the cost difference between the LP and MP shipping is calculated as:
δ d , V = LC L P d , V LC M P d , V LC M P d , V
Here, the LC is the levelized cost of CO2 transport, including conditioning, as commonly used in literature at the given annual volume (V) and transport distance (d). The dotted lines in the heat maps represent the limit to the left of which pipeline transport is more economical than shipping.

3.1.1. Impact of Tank Material in Shipping

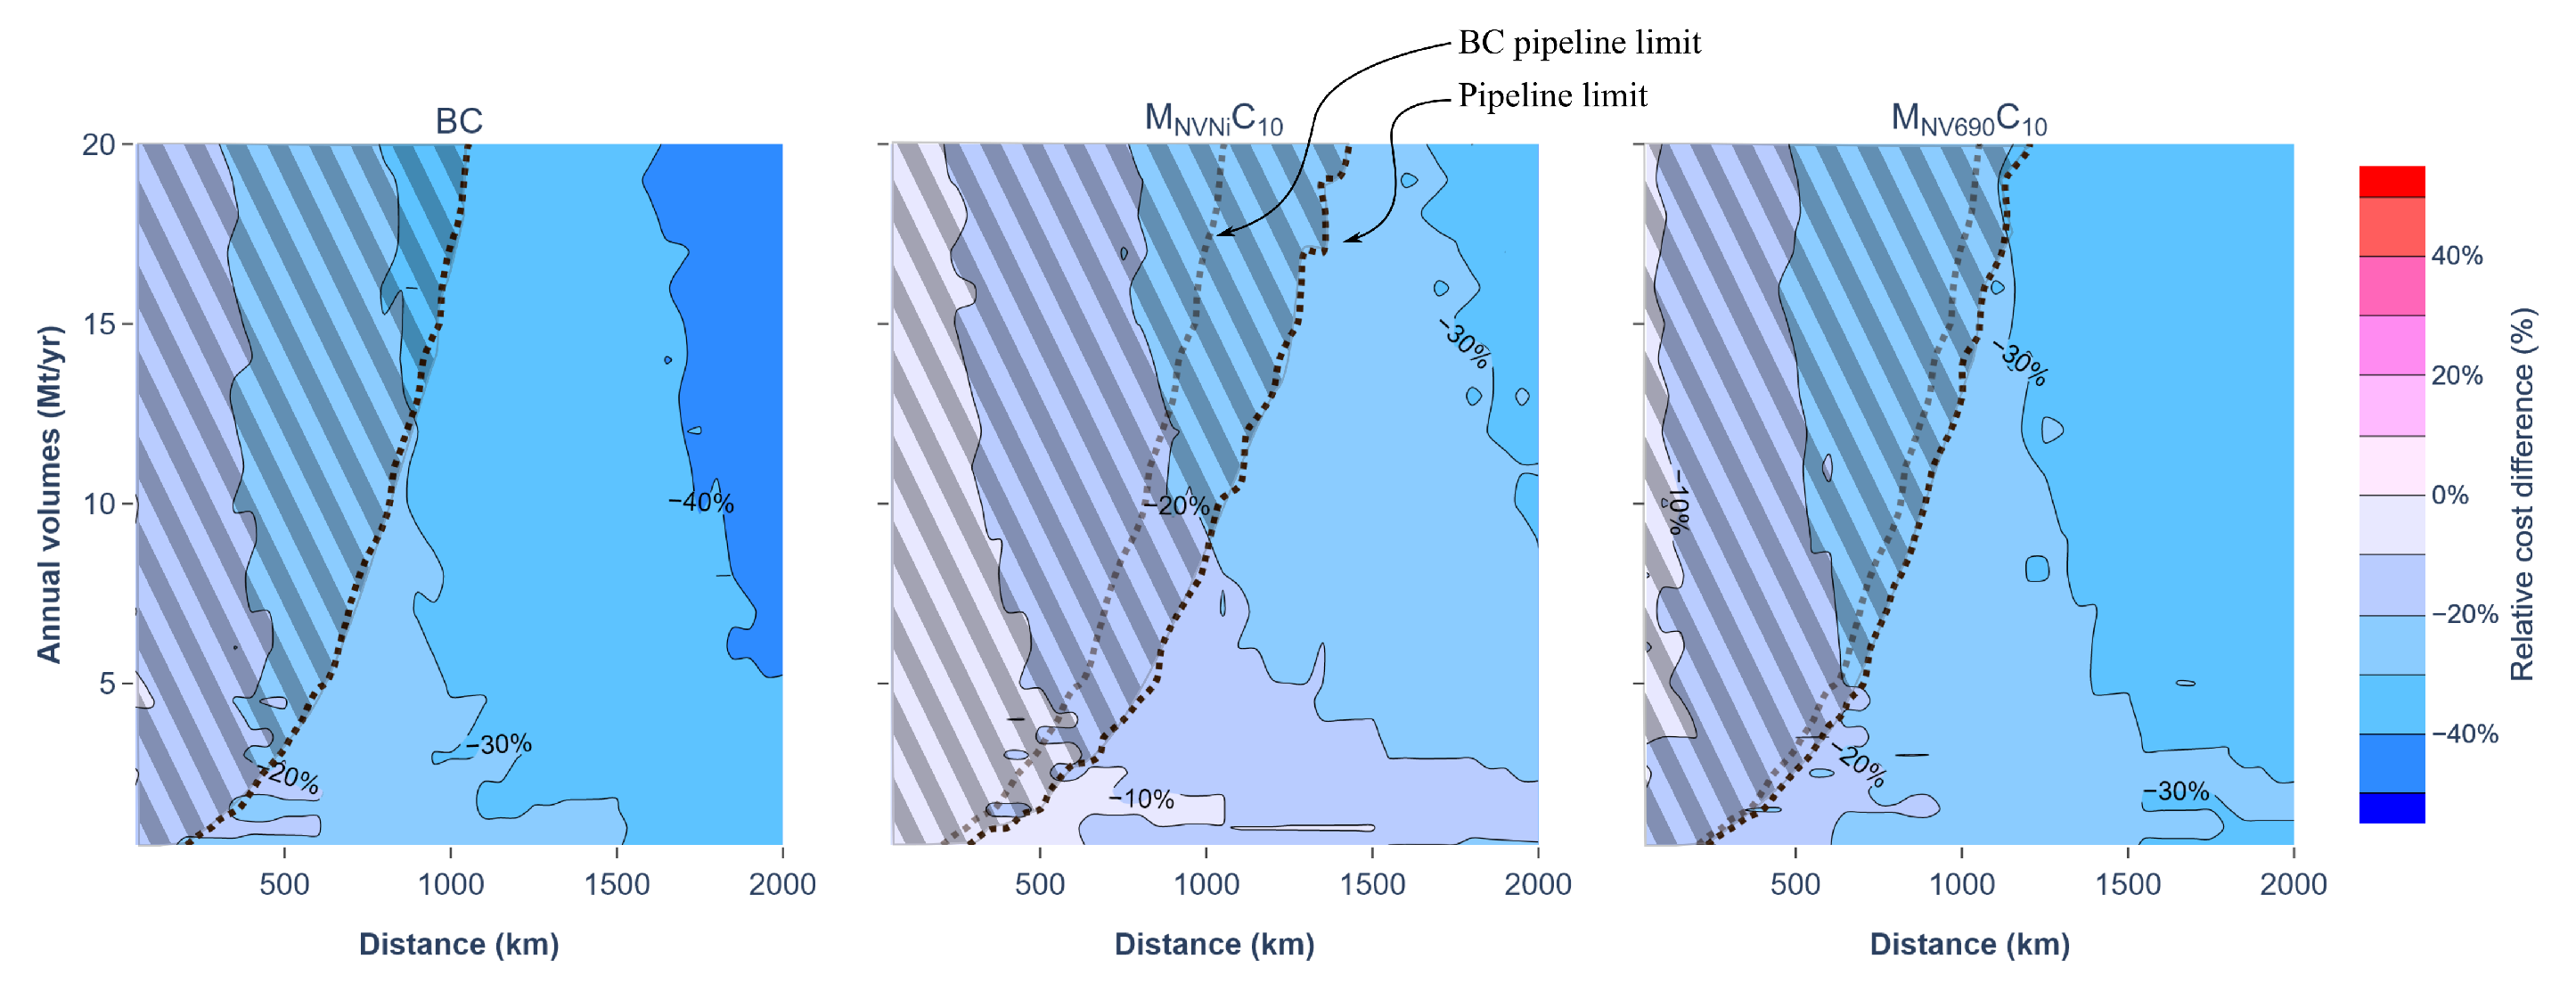
Figure 3 shows the relative costs of LP versus MP shipping for two different cargo tank materials in the LP ships and maximum MP ship capacity at 10 ktCO2. The cost difference between LP and MP is smaller in the present study than in the BC of Roussanaly et al. in line with the shift up in LP and down in MP ship costs illustrated in Figure 2. Nevertheless, the LP shipping remains less expensive than MP shipping for all annual volumes and transport distances. In the NVNi scenario, cost reduction up to and larger than 20% is achievable in most relevant cases (i.e. where pipeline is not economically preferred).
By qualifying lower-cost materials, such as NV690, for LP containment, the costs of shipping can be further reduced as seen in the rightmost panel of Figure 3. In this scenario, cost reductions for long distances and large annual volumes at more than 30 % can be achieved.
Another consequence of qualifying less expensive materials for LP containment, is that the area in which LP shipping is more economic than pipeline transport increases. This is illustrated by the reduction in the scratched area in the M NV 690 C 10 (right panel) compared to M NVNi C 10 (middle panel) in Figure 3, and highlights the importance of material development and qualification for the the long-term relevance of (LP) shipping compared to pipeline transport.

3.1.2. Impact of the Maximal Capacity for Medium Pressure Ship’s Cargo

In the previous section, the MP ship’s cargo capacity was kept at 10 ktCO2 in accordance with the BC and with common practice. However, the MP capacity limit arises from engineering and mechanical features of the ship construction and design, and it is still uncertain if this constrain could in the future be relaxed. Therefore, we have analysed the impact of increasing the MP ship’s cargo capacity on the cost difference between LP and MP shipping. We emphasise that analyses of the feasibility of larger MP ships are beyond the scope of the presented work.
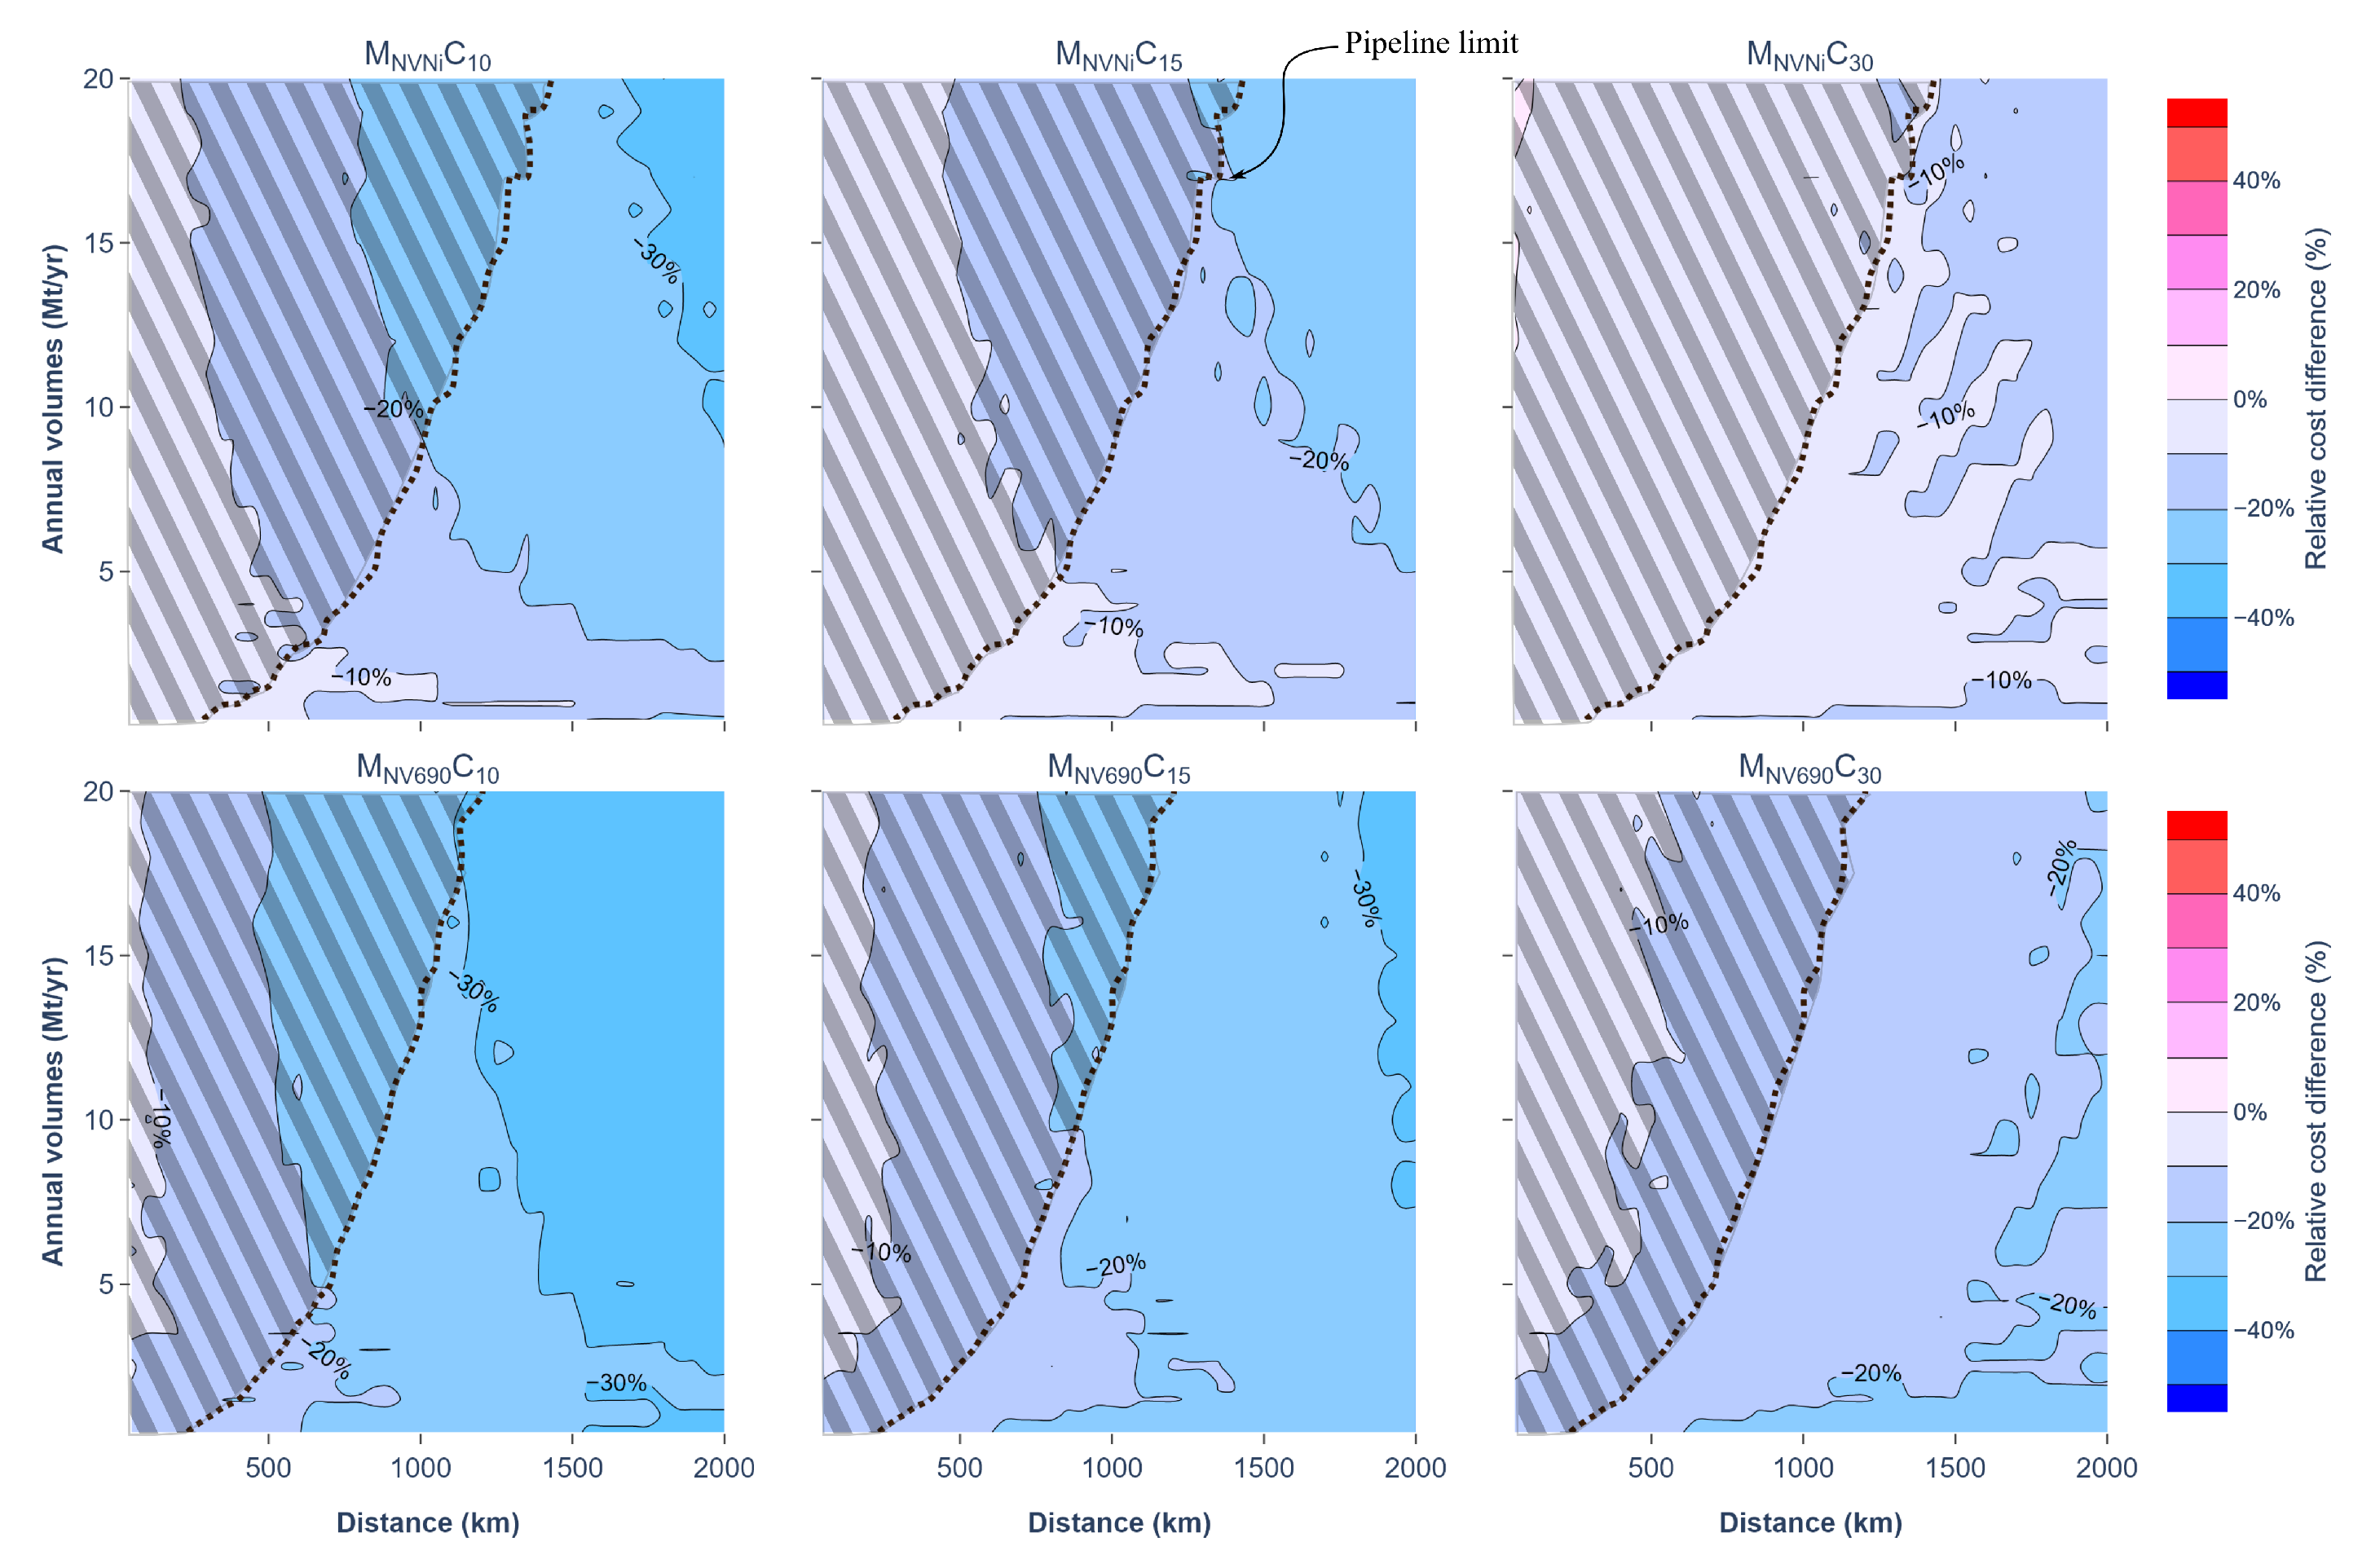
Figure 4 shows the relative cost difference between LP and MP shipping with maximum cargo capacities of (from left to right) 10, 15 and 30 ktCO2/ship for the NVNi (upper) and NV690 (lower) material scenarios. The figure clearly illustrates the decrease in cost difference as the MP ship’s cargo capacity is increased. This effect arise from the fact that the number of vessels needed in the MP fleet decreases as the MP ship’s cargo capacity approaches that of the LP ship. Thus, the cost difference relays increasingly on the difference in construction costs of single ships, which accounts only for a part of the total transport costs. Nevertheless, LP shipping remains less expensive than MP shipping in all scenarios because the construction costs of LP ships are smaller than those of MP ships, as depicted in Figure 2. Naturally, increasing the difference in construction costs of the LP compared to the MP ships by qualifying less expensive materials for LP containment, increases the difference in overall costs of transport between LP and MP shipping, as illustrated in the lower compared to the upper row of Figure 4.

3.2. Inland Transport

To also shed light on the impact of transport pressure on two key inland transport modalities, trucks and barges, this work compared LP and MP-based transport based on the scenarios displayed in Table 2. The relative costs of LP versus MP modalities are calculated using Equation (1).

3.2.1. Truck Transport

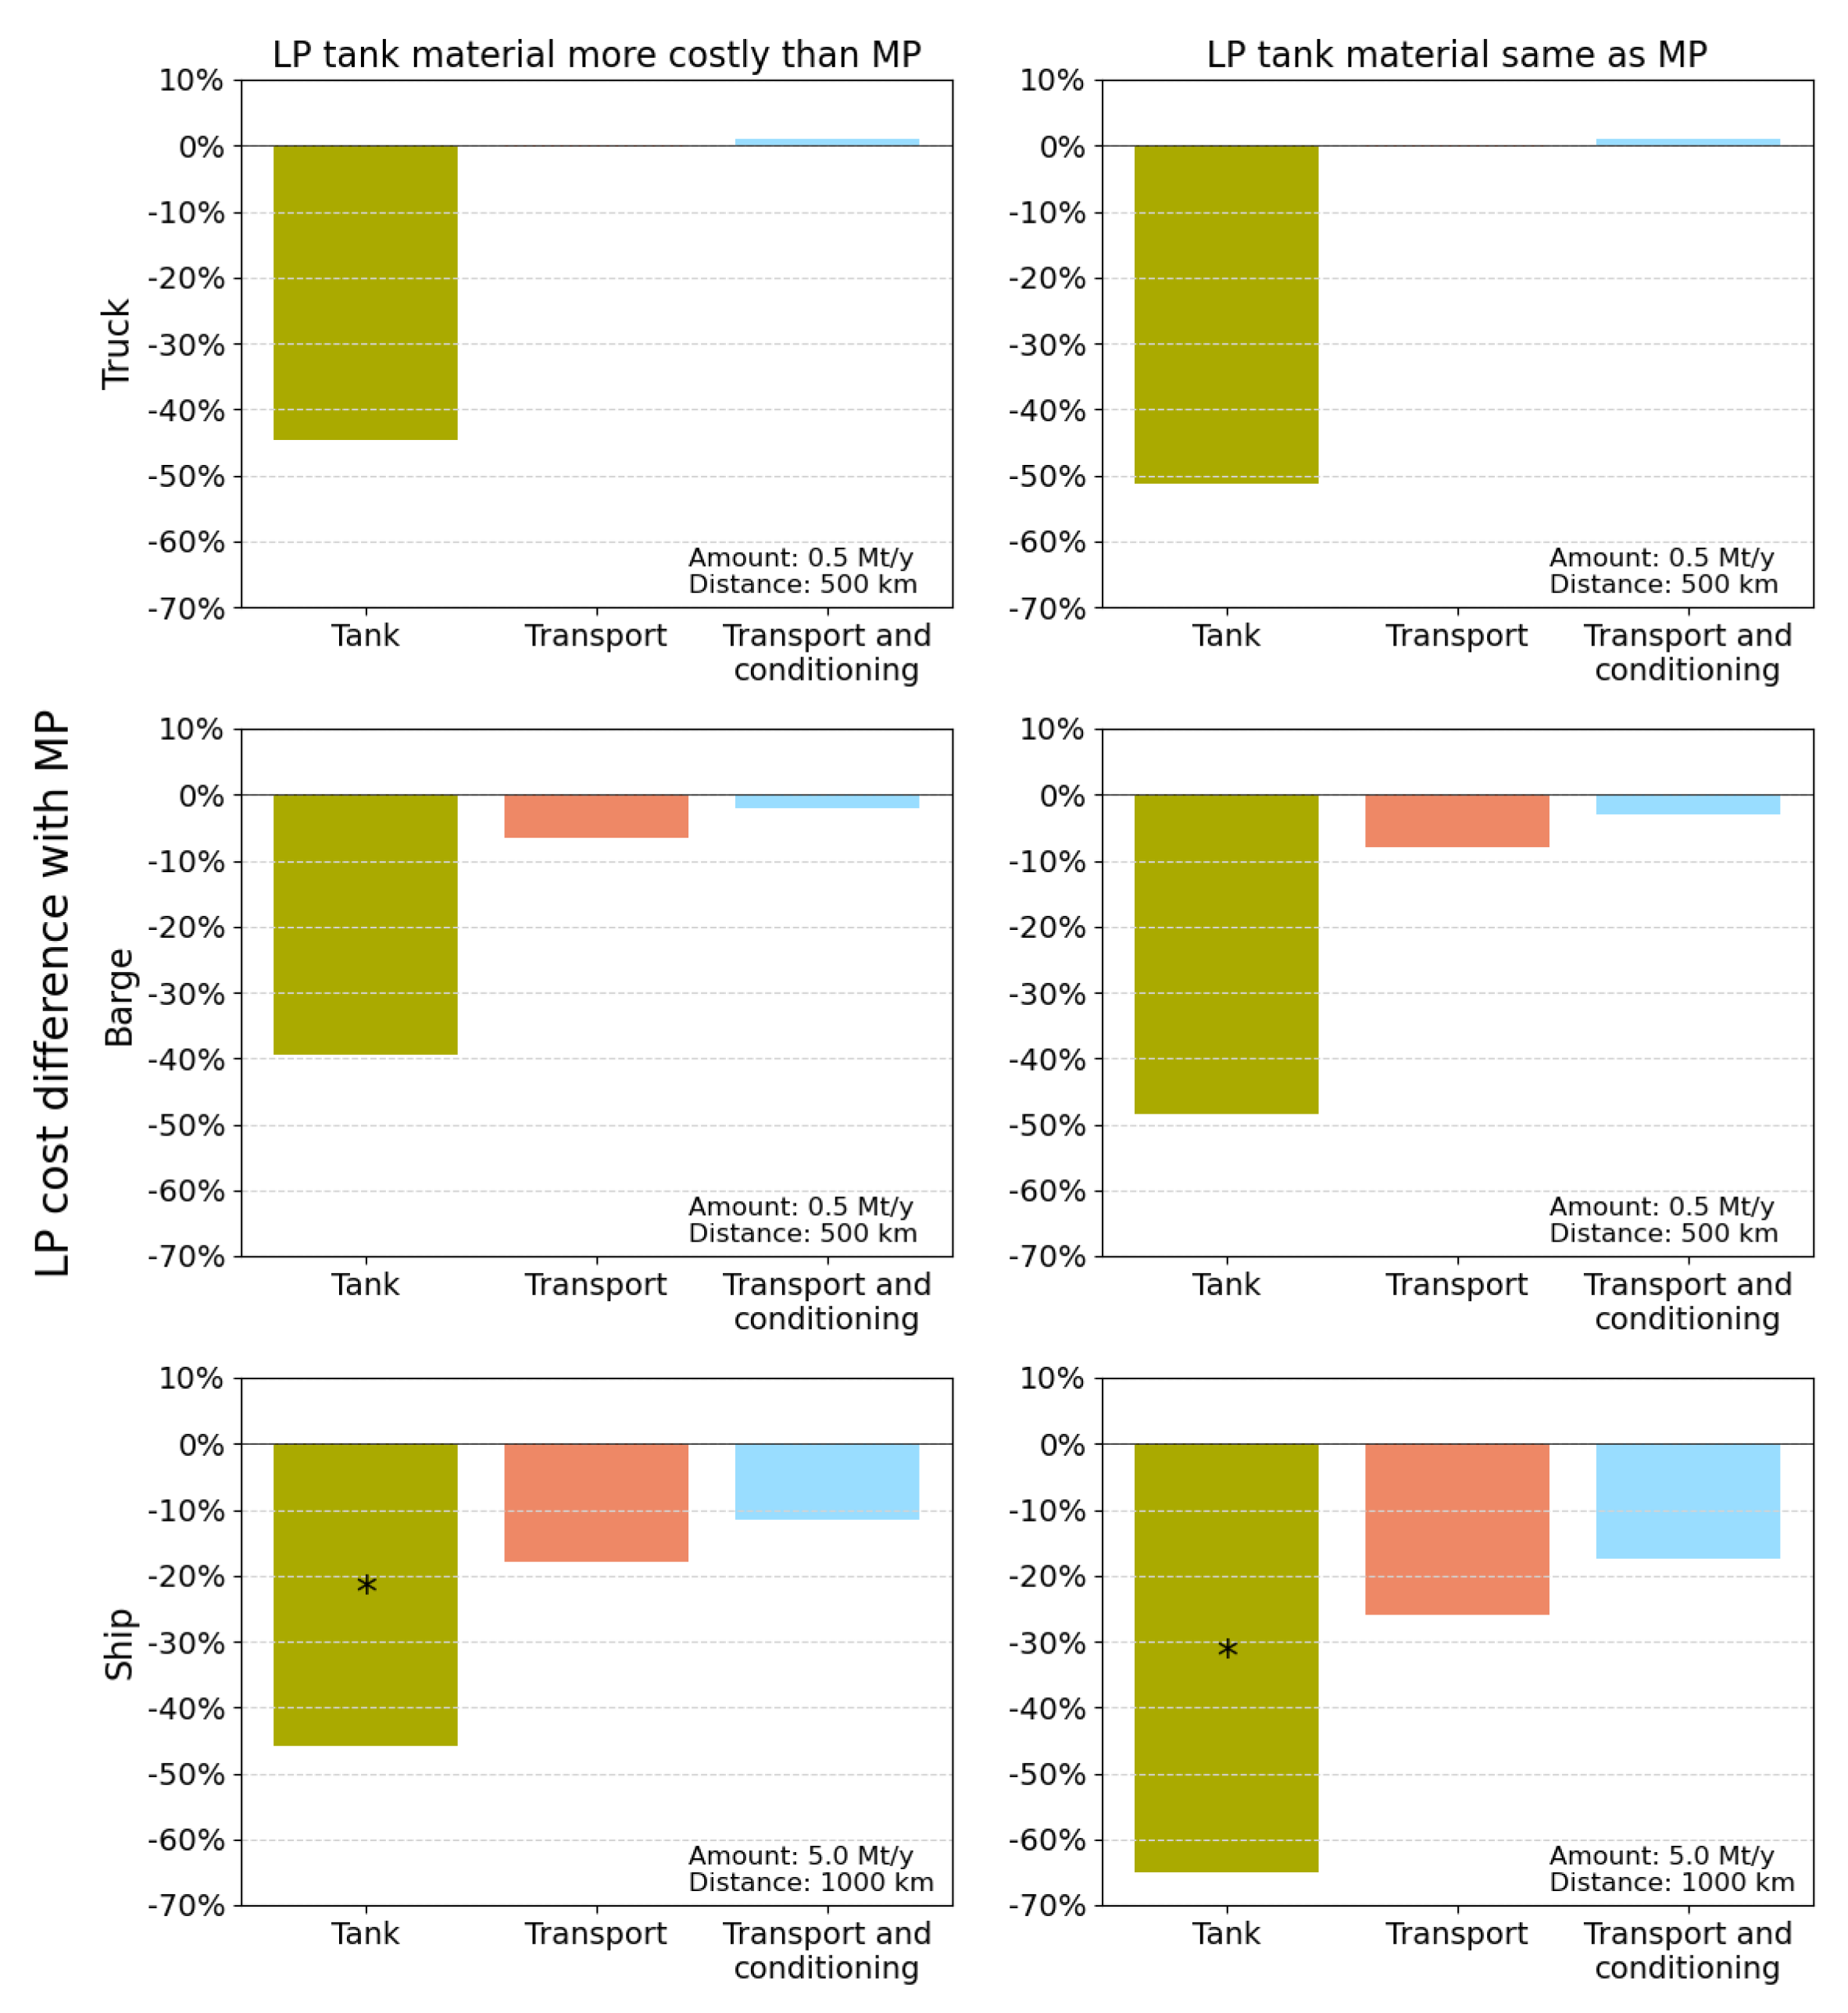
In the case of truck transport, the cargo capacities of the LP and MP trucks are equal at 26 tCO2, and the LP and MP trucks differ only in the material used and the tanks’ wall thickness. Figure 5 shows the relative levelized costs of the cargo tank, transport without liquefaction and transport with liquefaction for truck (upper), barge (middle) and ship (lower) transport. The difference in wall thickness between the LP and MP truck tanks yields a 46 % reduction in the tank material costs when the NV690 steel is used both for LP and MP containment. Nevertheless, the overall cost reduction was found to be less than 1 %, contrasting to the results for the shipping assessments. This key difference between the behaviour observed for truck and ship-based transport is linked to the tank dimensions in the truck case, which are limited by road constrains, restricting the economies of scale accessible by truck transport. Additionally, the ratio between OPEX and CAPEX is proportionally larger for trucks than ships, reducing the impact of the tank costs.

3.2.2. Barge Transport

Barges can transport larger volumes of CO2 compared to trucks and can access the scales lacking in truck transport to make LP less expensive than MP transport. The middle row of Figure 5 shows the cost difference between LP and MP tanks, and the resulting difference between the LP and MP barge transport costs with and without liquefaction. In these barge assessments, the tank configurations are kept equal for the LP and MP barges, meaning that the LP and MP barge transport only differ in terms of tank costs. Similar to the truck assessments, the tank material cost differences were at 39 % for NV400Mn and 46 % for NV690 scenarios. The resulting difference in transport costs at 5-10 % are higher than for truck, but significantly lower than for ship transport. This is due to the higher capacity of the barges compared to the trucks, resulting in a relatively higher contribution from the tank costs to the overall costs. Nevertheless, the cost difference between LP and MP barge transport remains marginal as long as the capacity of the LP and MP barge is equal. The barge capacity was explored in the present study, and the results reported in Appendix B.2, but little potential for expanding the capacity of the LP barge beyond that of the MP was found.

3.3. Implications on the Transport Chains from Capture to Storage

The above results highlight that while it is likely that moving to lower shipping pressure for transport at sea could significantly reduce cost, there is little benefit in moving to lower pressure for inland transport (truck and barge) compared to the current commercial MP approaches. However, many of the current and future CCUS projects require transport both inland 3 and at-sea 4, at least in mainland Europe. Considering this, three main situations may arise.
  • Firstly, MP continues to be used for both at-sea and inland transport. This could be the case if large MP ships can be manufactured and cost-efficient materials for LP shipping are not qualified, or if experience with and trust in currently commercial technologies prevail over the cost reduction potential of the novel technologies.
  • Secondly, both inland and at-sea tank-based transport move from MP to LP. This would correspond to a situation in which at-sea shipping moves to low-pressure due to significant cost savings and inland-based transport transitions to similar conditions to ease the overall transport integration as the transport pressure has little bearing on the cost.
  • Finally, another possibility is that at-sea transport transitions to LP shipping due to the significant associated cost savings, whereas inland-based transport continues to operate at MP. This could especially be the case if different actors are involved for the at-sea and inland planning and operations or if both systems (LP at-sea and MP inland) can be smoothly integrated together.
The first two situations are likely to lead to a smooth integration of at-sea and inland operations. However, the third situation, which is also more likely in the near future, raises some questions that would need to be addressed to reach implementation. The following subsections discuss two of these.

3.3.1. Integration MP Inland and LP at-Sea Transport: How to Design Safe, Reliable and Cost-Efficient Hubs

A key element of integrating a MP inland system and a LP at-sea system is a safe, reliable, and cost-efficient hub between the two systems. This hub needs to ensure that the reception of the MP CO2, transition from MP to LP, temporary storage, and loading of the LP CO2 are performed safely and efficiently to ensure the continuous operation of both systems.
One of the challenges in a hub connecting MP inland and LP at-sea transport is to develop buffer storage system(s) compatible with both LP and MP conditions, either by having one (joint) system or by separating the LP and MP buffer storage systems (i.e. having two systems in the hub). Specifically for the joint system, the material selection is difficult since unalloyed steels, such as NV690, typical for MP containment often become brittle at temperatures around and below -30 °C[38]. The alloyed steel alternatives for LP containment, such as NV400Mn and NVNi, represent both a decrease in strength and an increase in material costs, making them little attractive for MP containment. Thus, the easiest option from a supply chain point-of-view is to implement separate buffer storage for LP and MP. This system redundancy ensures that the storage always operates within its range, but at the cost of the double system expenses.
Single buffer storage systems can be achieved in three ways, where the first two involve that the entire hub is either operated at MP or at LP. The buffer storage will then be tailored to the specified pressure- and temperature-level, saving the costs of the double storage system. Disadvantage of the first case are that the MP is significantly more costly than the LP storage [27], and that LP CO2 cannot be received without adding compression/expansion facilities to the hub. Vice versa, the LP storage in the second case may be less expensive than the MP, but MP CO2 cannot be loaded from the hub without adding the same costs of compression. In the latter case, there is an added uncertainty related to whether the cooling from the decompression of MP CO2 received to the hub is sufficient to cool the mixture to the LP target temperature. If not, costs from reconditioning and liquefaction must be added.
The third solution involves a buffer storage system that can handle both LP and MP CO2. This requires that LP tank materials are used, but with tank wall thicknesses appropriate for MP containment (i.e. thicker walls than in tanks used solely at LP). Needless to say, this involves a high cost in the current situation where only expensive materials can be used for LP containment. The alternative becomes more attractive, however, if the NV690, or a similarly less expensive, steel can be used safely at temperatures below -30 °C, retaining the same flexibility in terms of conditions on the received and loaded CO2 as in the dual system, but at a smaller cost.
While "any" material cost-competitive with those used for MP containment will enable the above alternative, qualifying the current MP tank materials for LP conditions has the additional benefit of enabling reuse of facilities for MP reception, storage and loading, which are deployed or under deployment now. In the light of the recent findings in the CETO project, it is apparent that further investigations into if and how current MP tank materials can be repurposed to LP containment are required, along with efforts to find less expensive materials for CO2 containment.

3.3.2. Handling of Impurities in Combined Low- and Medium Pressure Transport Chains

Another challenge with combining MP and LP transport chains is related to impurities. The impact of impurities has attracted much attention in the CCS field recently[39], and the efforts have uncovered a wide range of impacts depending on types of impurity, concentrations, and conditions in the specific part of the value chain in question. Corrosive species (e.g., H2, SOx, NOx) can lead to significant corrosion in the presence of water, but the corrosivity depends greatly on the conditions in and composition of the mixture[40]. Similarly, non-condensable impurities such as Ar, H2, N 2 , O 2 and C H 4 must be limited in order to prevent undesired events such as two-phase flow and pressure build-up during the operation of the CCUS value chains. Again, permitted levels of the impurities depend on the conditions and composition. In particular, lower thresholds are allowed for LP compared to MP conditions. To ensure safe operation of the CO2 transport value chains, emitters are currently required to purify their captured CO2 mixture to levels appropriate for the point in the value chain with the lowest resistance to impurities. This is sensible when the conditions throughout the transport value chain are similar, e.g. when LCO2 is transported at MP from the emitter to the permanent storage. At varying conditions, however, this requirement could lead to an unfair distribution of the costs of purification. Especially, this is the case for systems with MP inland and LP at-sea transport, where the purity requirements may be more relaxed in the first part of the transport system (at MP) than the latter, and where parts of the costs and responsibilities of purification could be transferred from the emitters to the hub connecting the LP and MP transport. The disadvantage of such an arrangement is that the risk of cross-contamination between emitters, transport vessels and hubs increases, and that the cost reductions from the reduced need of purification at the emitter does not compensate for the added costs of handling of impurities in the hub. Future studies towards optimising impurity levels will thus be required in order to identify the best strategies to cost-efficiently handle impurities when considering MP inland and LP at-sea transport.

4. Conclusions

This study investigates the impact of transport pressure on the techno-economic performance of CO2 transport of tank-based inland and at-sea transport (ship, barge, truck). The study builds on established techno-economic models for inland [13] and at-sea [27] CO2 transport, updated to integrate the most up-to-date knowledge on costs of low-pressure containment for CO2 transport developed in collaboration with industrial actors. Particularly, the present study has investigated the impact of the cargo tank material and design on the overall transport costs. Different cargo tank materials were investigated for low-pressure containment; high-nickel and high-manganese steel alloys, which are currently qualified for use in low-temperature CO2 tanks, as well as an austenitic high-strength carbon steel, which is a material used for commercial medium pressure CO2 containment. Although the latter is not currently qualified for low-temperature applications, it was included to investigate the impact of less expensive and stronger materials for low-pressure and -temperature containment.
The transport pressure and the material chosen for the cargo containment system can have a significant impact on the costs of the system. Lower transport pressures, along with less expensive and stronger materials (such as carbon steel), reduce the costs of the cargo tanks by up to 50 % compared to equal-sized medium-pressure cargo tanks. A major contributor to the tank cost reduction is the reduced wall thickness required at lower pressures, which has the additional effect of enabling construction of larger low-pressure cargo tanks compared to medium-pressure ones. The larger dimensions of the low-pressure tanks enable in turn the construction of transport vessels with larger capacities, which is key in the comparative assessments of low- and medium-pressure shipping.
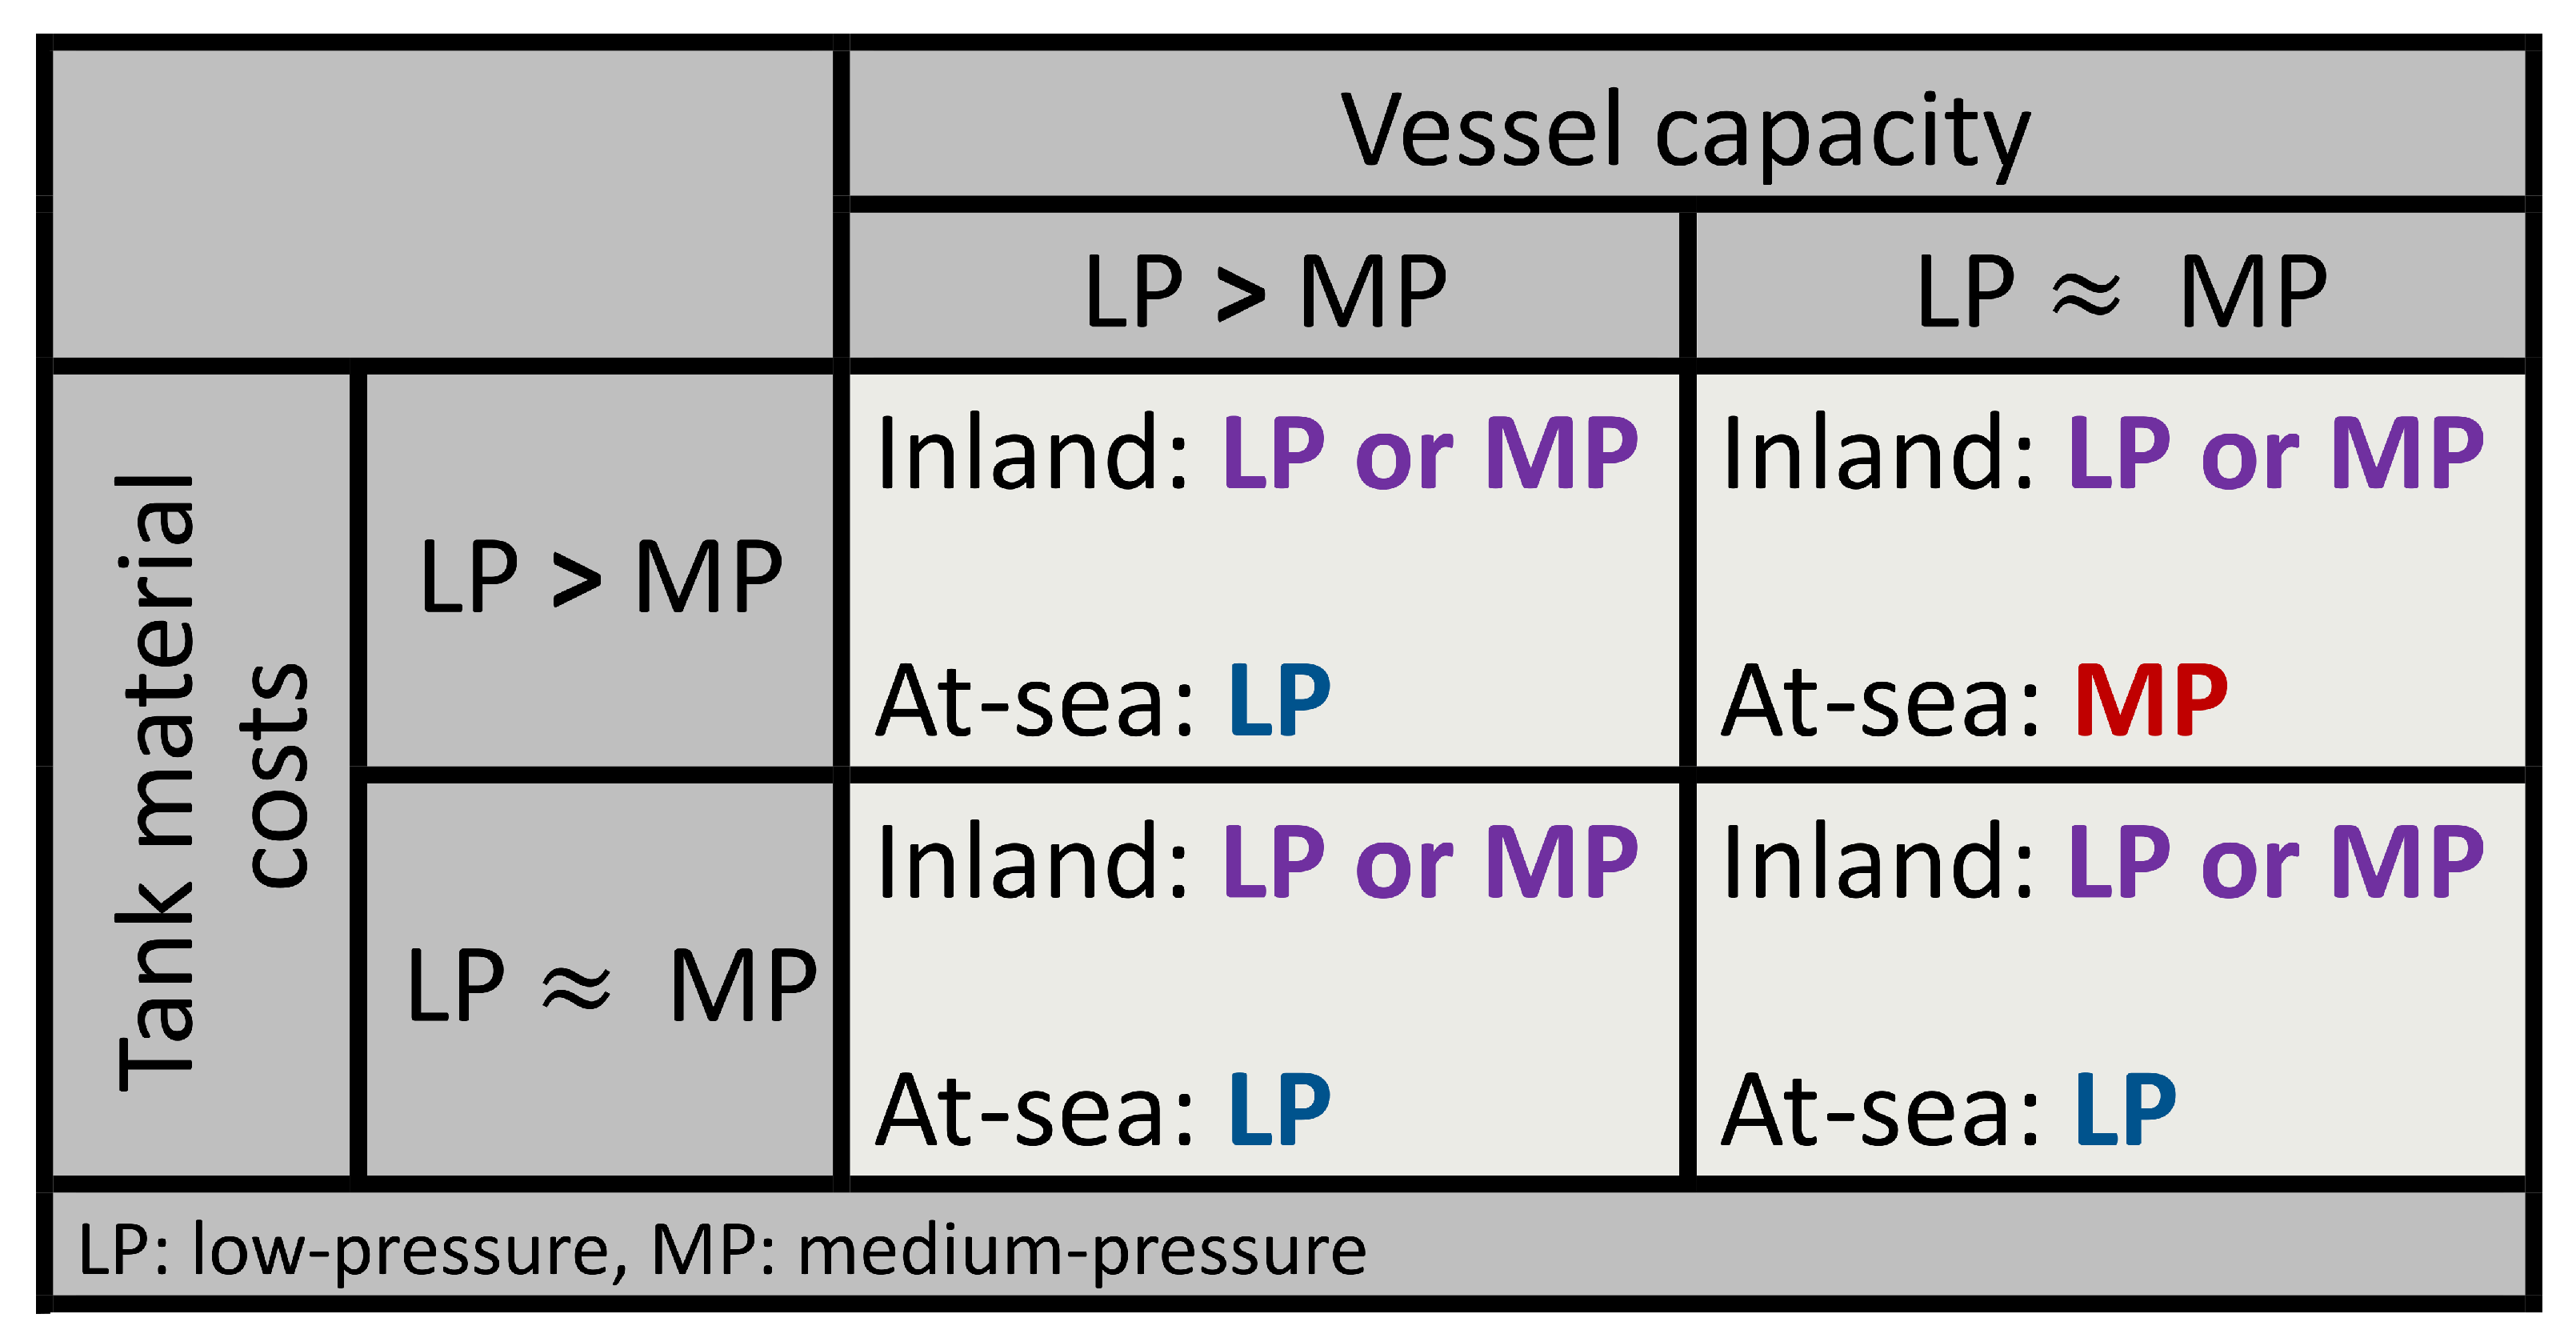
In at-sea shipping, the results highlight that low-pressure shipping can reduce costs up to 30 % for long distances if high nickel steel is used. This result is not only driven by the reduction in material costs at equivalent tank design, but also by the limitation on the capacity of the medium-pressure ship, which traditionally has been at 10 ktCO2/ship. The latter plays a stronger role in the overall cost reduction. Consequently, the cost reduction enabled by low-pressure shipping falls to around 5-10% if larger medium-pressure ships up to 30 ktCO2/y can be built and assuming the same cost trends as today, thus limiting the value of transitioning to low-pressure shipping. On the other hand, if materials with low cost and high strength, such as unalloyed steel, are qualified for low-pressure and -temperature containment, low-pressure shipping becomes even more cost-attractive than medium-pressure. In fact, cost reductions up to and beyond 30% can be achieved if the medium-pressure ship capacity remains limited. Even if large medium-pressure ship can be manufactured, low-pressure shipping involves at least 10% cost reduction. Hence, low-pressure shipping would likely become predominant independently of whether larger medium-pressure ships can be manufactured. In conclusion, and as illustrated in Figure 6, medium-pressure shipping may remain a key element only if larger medium-pressure ships can be constructed with the same costs trends as indicated for these ships today, and less expensive materials for low-pressure and -temperature containment cannot be used.
On the contrary, the techno-economic analyses for inland transport chains (truck and barge) indicate that low-pressure transport would only provide limited cost-reduction compared to medium-pressure. In particular, the cost reductions are insignificant for truck-based transport while for barge-based transport they are in the range of 5-10 %. The strong differences with at-sea shipping are linked to the fact that the tank dimensions are constrained by the maximum dimensions of the trucks and barges, which limited some of the scale effects observed in the at-sea case. Medium-pressure transport is therefore likely to remain the main transport condition for barge and truck transport as schematised in Figure 6.
A consequence of these results is that while inland transport may remain at medium pressure, at-sea transport is likely to transition to low-pressure shipping. In that case, there are still open questions associated with the connecting hubs and the handling of impurities, and more detailed investigations are required to identify safe, reliable, and cost-efficient solutions for connecting the transport of CO2 from inland emitters all the way to the selected offshore storage.

Author Contributions

Conceptualization, Ingeborg Treu Røe and Simon Roussanaly; Formal analysis, Ingeborg Treu Røe, Pauline Oeuvray, Marco Mazzotti and Simon Roussanaly; Funding acquisition, Marco Mazzotti; Methodology, Ingeborg Treu Røe, Pauline Oeuvray and Simon Roussanaly; Project administration, Ingeborg Treu Røe and Marco Mazzotti; Visualization, Ingeborg Treu Røe and Pauline Oeuvray; Writing – original draft, Ingeborg Treu Røe, Pauline Oeuvray and Simon Roussanaly; Writing – review & editing, Ingeborg Treu Røe, Pauline Oeuvray, Marco Mazzotti and Simon Roussanaly.

Funding

This publication has been produced with support from the project ACCSESS, which has received funding from the European Union’s Horizon 2020 research and innovation programme under grant agreement No 101022487, the project DemoUpCARMA, which has received funding from the Swiss Federal Office of Energy and Federal Office for the Environment, and NCCS Centre performed under the Norwegian research program Centres for Environment-friendly Energy Research (FME) and its partners [Aker Solutions, ANSALDO Energia, CoorsTek Membrane Sciences, Gassco, Equinor, KROHNE, Larvik Shipping, Lundin, Norcem, Norwegian Oil and Gas, Quad Geometrics, TOTAL, Vår Energi and the Research Council of Norway (257579/E20)].

Acknowledgments

The authors acknowledge Moss Maritime for their support and contributions to the presented work.

Conflicts of Interest

The authors declare no conflicts of interest.

Abbreviations

The following abbreviations are used in this manuscript:
CCS Carbon Capture and storage
EU European Union
LCO2 Liquid CO2
LP Low-Pressure
MP Medium-Pressure

Appendix A. Tank Geometry and Cost Calculations

In the following, we describe the calculations of the tank geometries and costs used in the inland transport assessments in the presented work. We have considered cylindrical tanks with spherical end caps with wall thickness limited to 50 mm[41]. The wall thickness limit determines the maximum size and volume of the tank together with the design pressure and the tank material strength. The tank design pressure of a tank with length, L, and diameter, D, is calculated as:
P e q = P 0 + P g d
where P 0 and P g d is the maximum overpressure and the maximum liquid pressure, respectively. The maximum overpressure is taken as the largest value of either the allowed overpressure of the tank design or the minimum vapour pressure, P 0 , m i n . The minimum vapour pressure is given by:
P 0 , m i n = 0.2 + A C ( ρ r ) 1.5
A = 0.00185 ( σ m / σ A ) 2
C = m a x ( D , 0.45 L )
The maximum liquid pressure, P g d , depends on the liquid height and the vessel’s acceleration. Assuming that the vessel’s acceleration in the x- and y- directions are independent of one another, the acceleration vector is a = a x x + a y y + ( g + a v ) y . The liquid height in the xz- and yz-plane, Z x y , can be calculated along the perimeter of the tank using:
Z β y = z · c o s β + y · s i n β + D / 2
Z β x = z · c o s β + x · s i n β + D / 2
where β [ 0 , β m a x marks the boundaries of the tank.The liquid pressure is then taken as the maximum pressure in any of the planes according to:
P g d = m a x ( a β y Z β y ρ ; a β x Z β x ρ )
where a + b e t a y / x and Z β y / x are the acceleration and corresponding liquid height in the z-x/y-plane, and ρ is the density of the LCO2. The equilibrium pressure in eq. A1 influences the plate thickness, w, together with the diameter, D, of the tank and the material strength. The material strength is respresented by the manimum allowable stress, σ m , and the joint efficiency, v. The resulting minimum wall thickness for the cylindrical, w c y l , and spherical, w s p h , parts of the tank are:
w c y l P e q D 20 σ m v + P e q
w s p h P e q D 40 σ m v + P e q
In this work, we assume that the joint efficiency is 1.0. Based on equations A5, the total cost of the tank is given as:
c t a n k = ( 4 π w s p h ( D 2 ) 2 + π D ( L D ) w c y l ) ρ s t e e l c s t e e l
where ρ s t e e l and c s t e e l is the density and costs of the steel material used for the tanks.

Appendix B. Impact of Changing Tank Sizes and Configurations on the Inland Transport Assessments

A second part of the inland transport assessments were conducted to investigate if if there is a difference in the cargo tank size that can be transported by LP compared to MP vessels. The aim of these evaluations was to explore if the costs of LP versus MP inland transport are different due to different tank sizes and cargo capacities. In the following, we discuss the methodology of and results from the cargo tank calculations for the inland transport.

Appendix B.1. Methodology

To explore if there is a difference between the tank size that LP and MP inland vessels can transport, the tank size was increased within the outer boundaries of the vessel. That is, the total length(s) and diameter(s) of the tank(s) were restricted so that they did not exceed the length and diameter of the vessel. For the truck transport, the single tank was already maximized with respect to the truck’s dimensions, and no further expansion of the tank size was possible. The tank calculations were thus only performed for the barge transport.
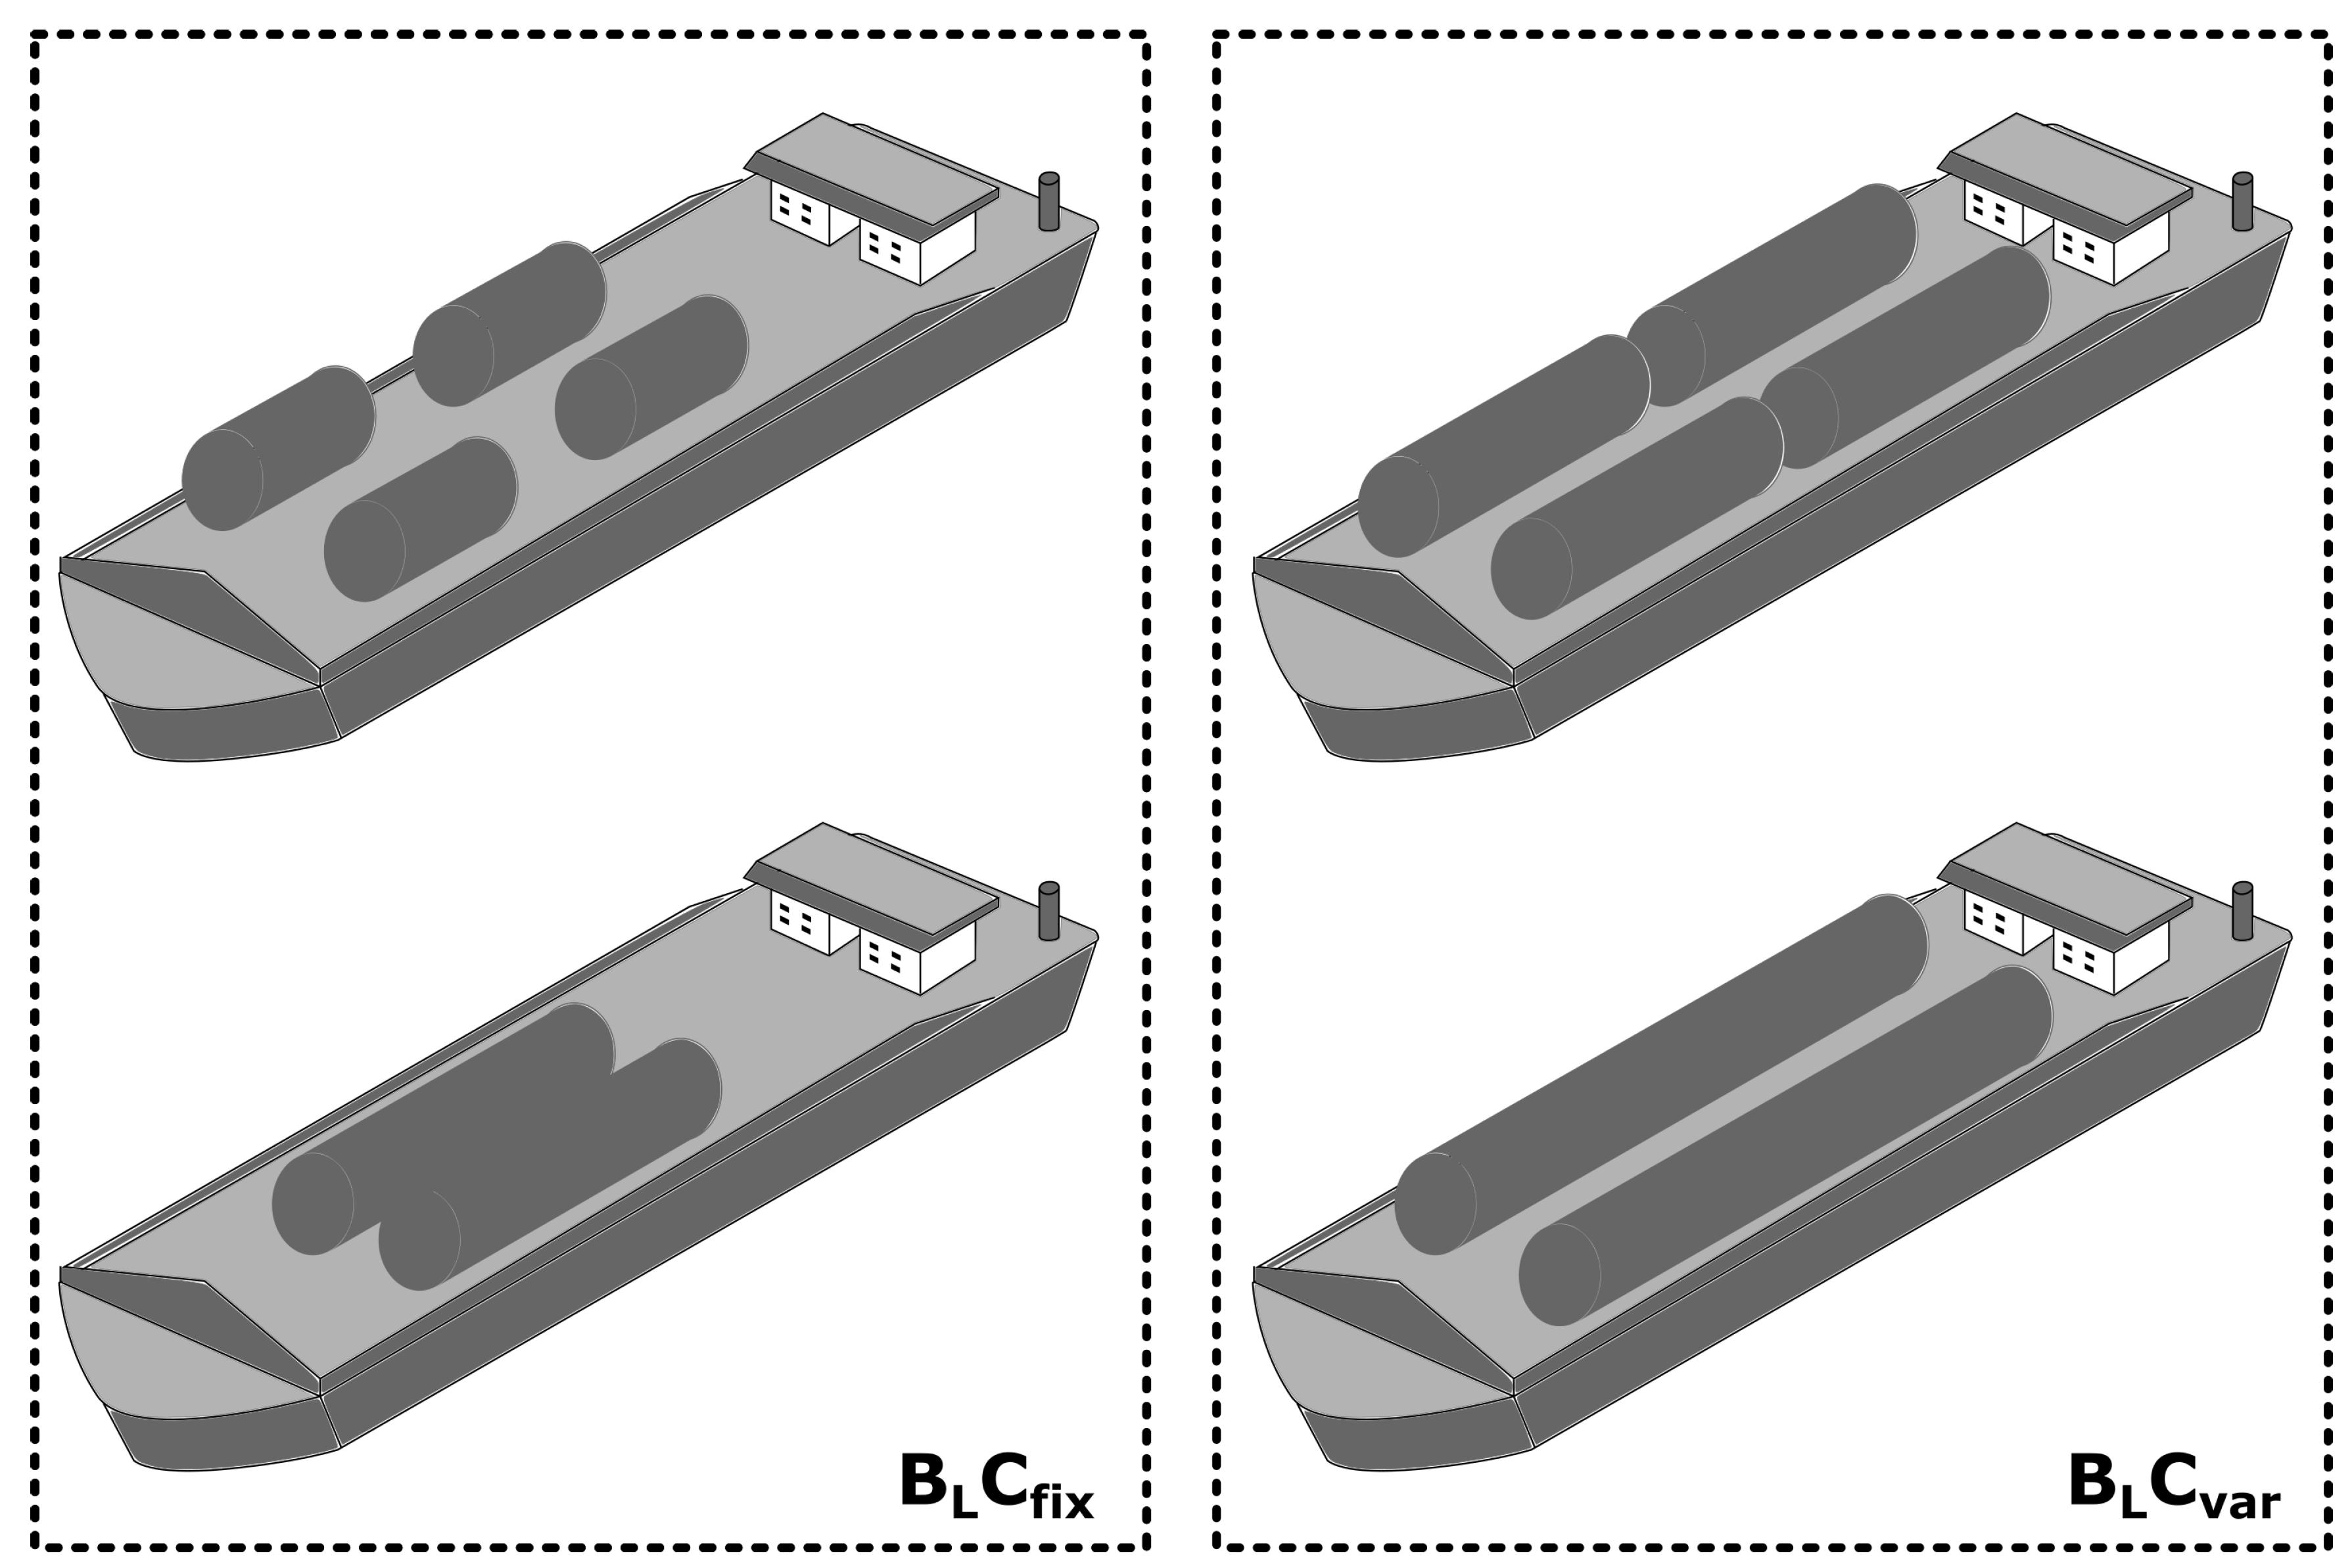
Increased cargo tank sizes were explored for the largest barge (Barge L) with length 135 m and width 17.5 m. Reducing the number of tanks on the barge, frees space for increased volume of the tanks. Thus, the number of tanks on the barge was reduced step-wise from 12 (the number of tanks reported in [13]) to 2. As a first approach, the volume of the tanks were maximized within the available space on the barge, but with the limitation that the total volume of the tanks did not exceed the (original) capacity of the barge at 4650m3. For each configuration of the tanks, the required wall thickness and minimum vapour pressure were calculated according to Equation (A5) and Equation (A2) for materials and pressures relevant for both LP (7 bar pressure and steel materials NV400Mn and NV690) and MP containment (15 bar and steel material NV690). Both configurations (LP and MP) where then controlled against two criteria:
  • The wall thickness of the tanks, calculated using Equation (A5), must be less than 50 mm [41].
  • The minimum vapour pressure, calculated using Equation (A2), must not exceed the design pressure set to 10 and 22 bar for LP and MP tanks, respectively.
and the configurations violating these were "disqualified". The point here is to investigate if for a certain tank configuration (i.e. certain number of tanks and corresponding tank dimensions), the MP tanks violate one or more of the criteria while the LP does not.
In the approach described above, there is space on the barge not utilised since the tank sizes are limited by the original capacity of the barge (at 4650m3) In a second approach, this constraint was removed. That is, the tank volumes was maximized completely within the limits of the barge dimensions, also allowing for an increase in the barge capacity. Again, the aim was to investigate if the MP tanks are more constrained in size than the LP tanks. However, no considerations of the feasibility of the barge, such as the increase in draft, were included. Additionally, it was assumed that the barge design (the width, length and depth) would not change despite the increased capacity.
Figure A1. Illustration of the two approaches for the barge tank calculations performed herein. The approach with constrained barge capacity (left) is termed B L C fix , and the unconstrained barge capacity (right) termed B L C var . In each approach, there are multiple tank configurations, where the number of tanks on the barge varies from 10 and 2. The barge capacity in the B L C v a r approach varies between 2570;18000m3. Each configuration was evaluated for MP and LP transport, and in the LP transport regime, both the NV400Mn and the NV690 steel were assessed. The illustration is not to scale.
Preprints 121880 g0a1
The two approaches are illustrated schematically in Figure A1 with the capacity constrained scenarios to the left in the figure, termed B L C fix , and the unconstrained scenarios, termed B L C var , in the panel to the right. The costs of each cargo tank configuration was calculated according to Equation (A6) relative to the cost of the MP tanks on the (original) Barge L with 12 tanks, each with the volume 380m3.

Appendix B.2. Results and Discussions

In the following the results from the barge tank calculations are discussed, first for the approach where the barge capacity was constrained to 4650m3, and then for the approach with unconstrained barge capacity.

Appendix B.2.1. With Barge Capacity Constraint
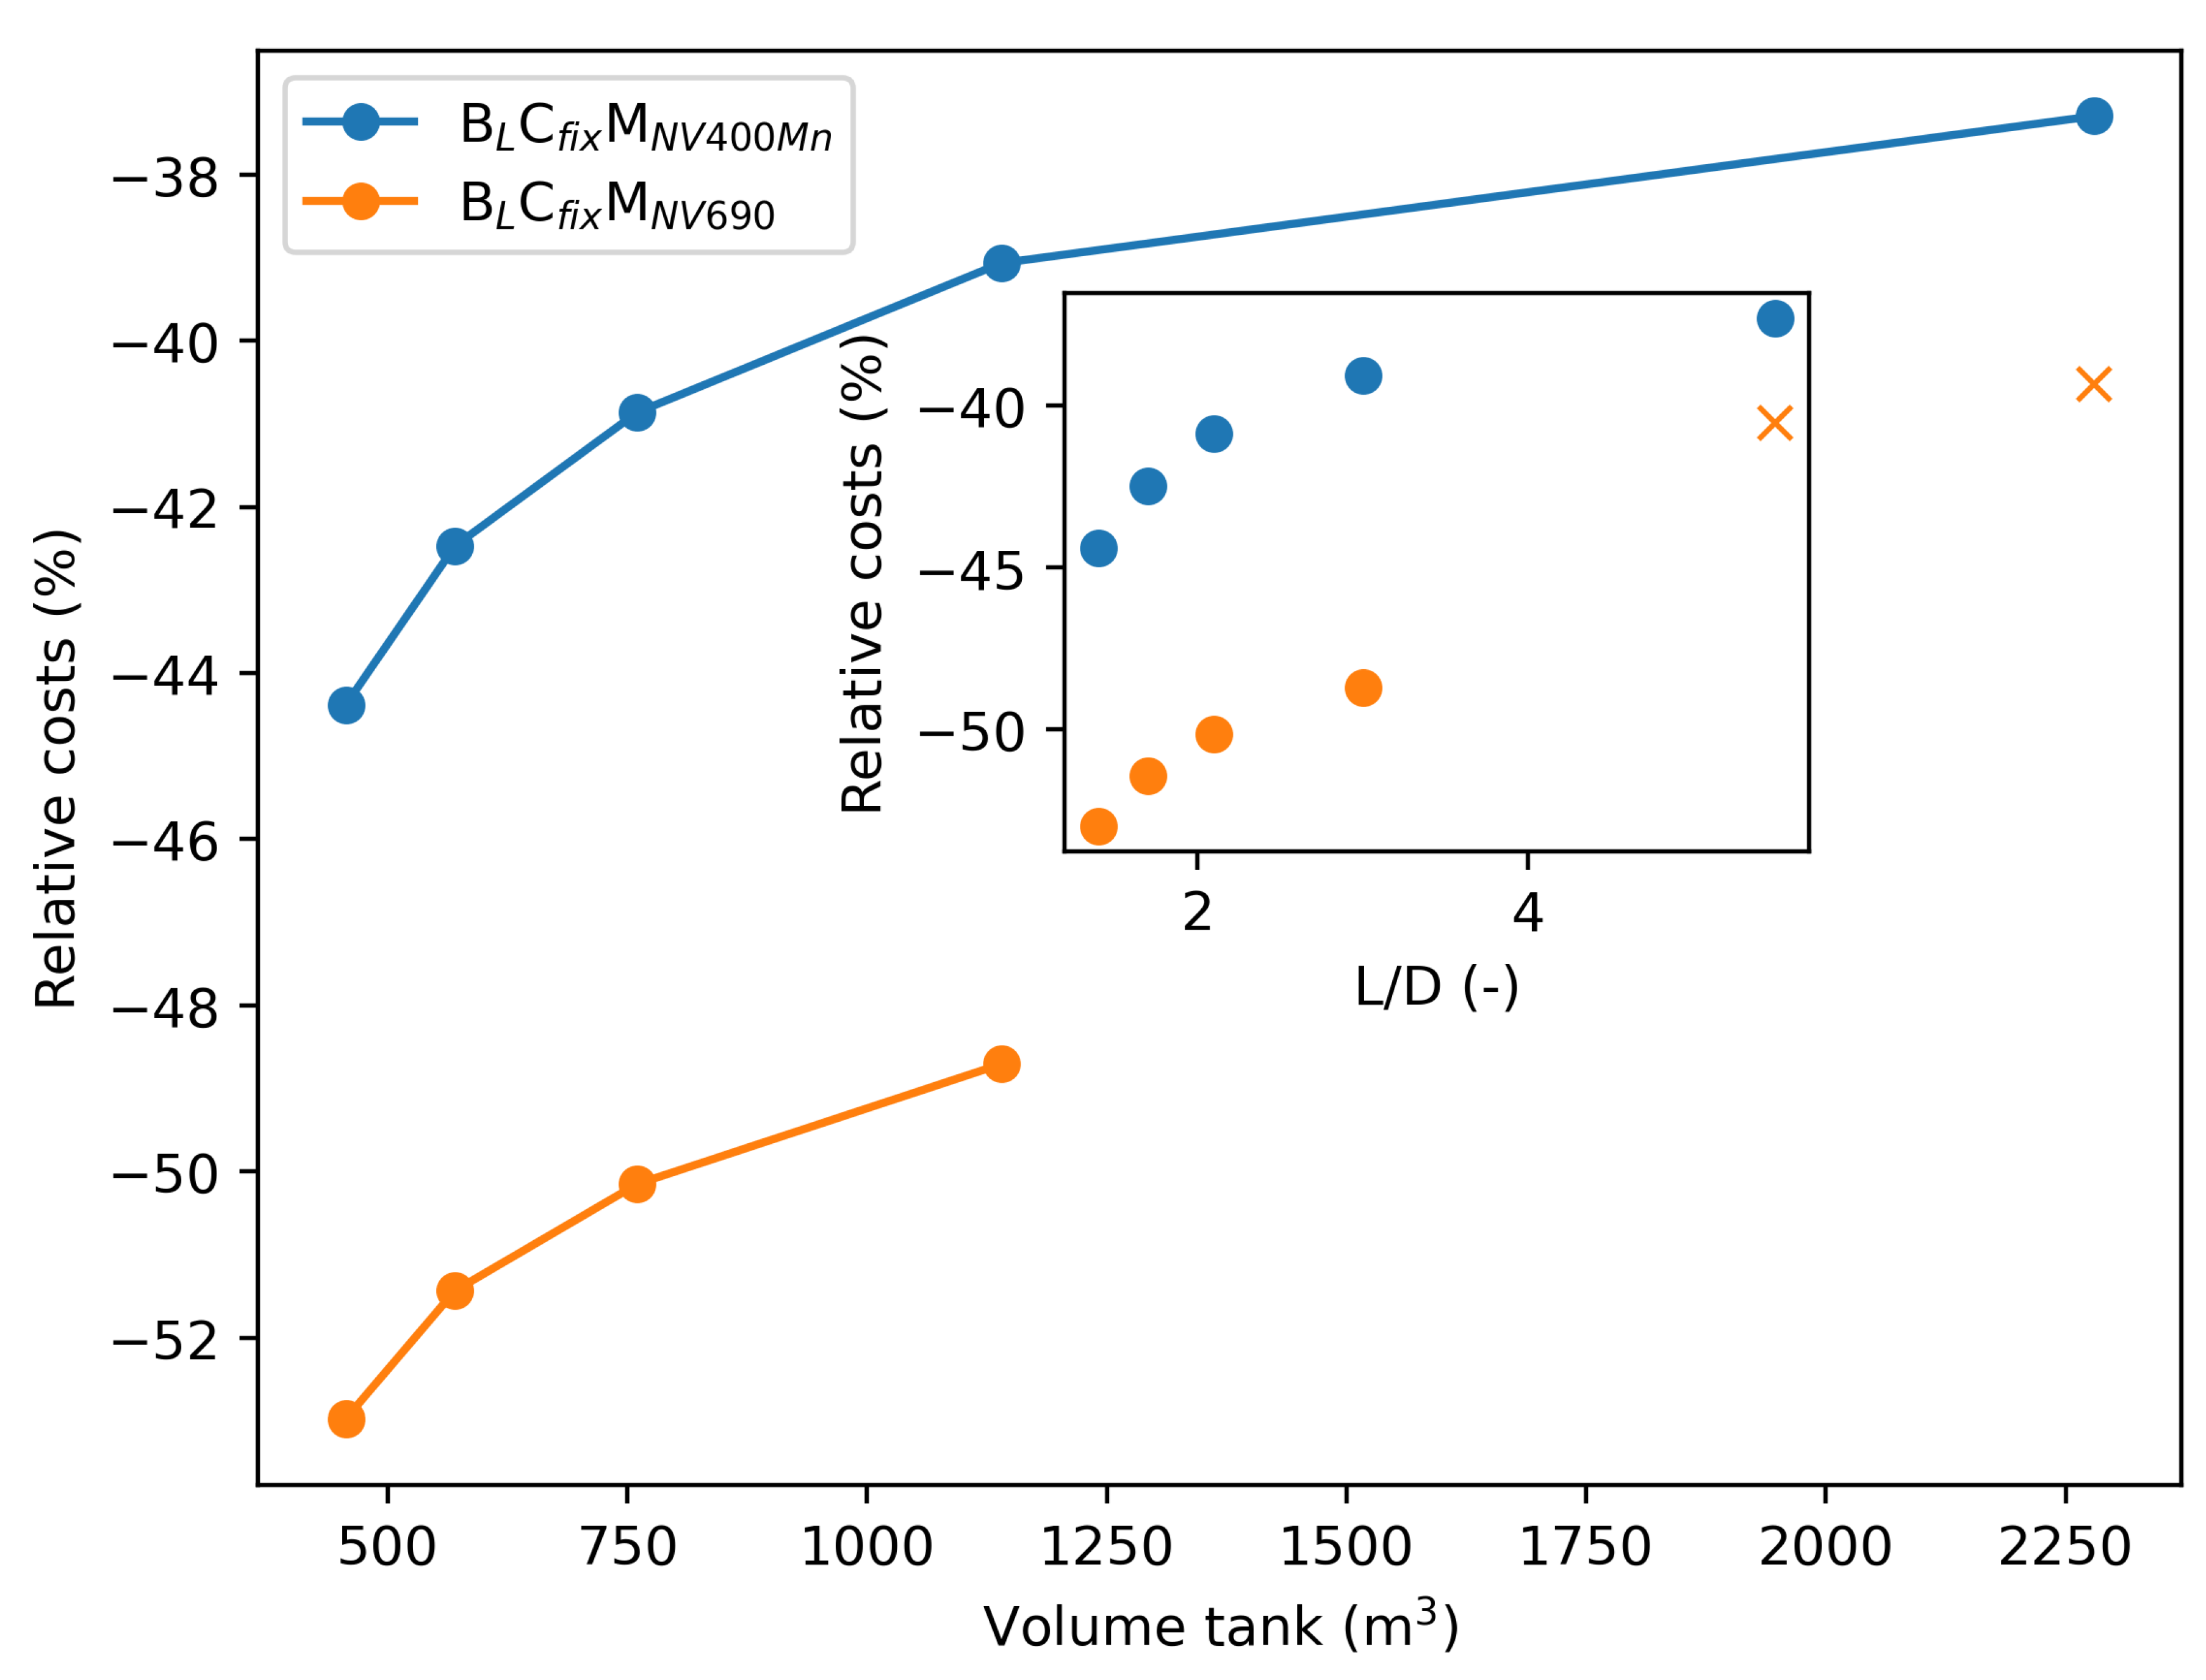
Figure A2 shows the relative costs of the LP cargo tanks in the B L C f i x approach as a function of the volume of each tank. Recall that the tank volume increases as the number of tanks decreases. This increase in volume is enabled by the increase in the length-to-diameter (L/D)-ratio of the tanks. The relation between the LD-ration and the relative costs are shown in the inset. Three observations can be made in Figure A2: 1) LP tanks are less expensive than MP tanks, both when NV400Mn and NV690 are used, 2) The costs of the tanks increase with increased volume, 3) All configurations are valid for both LP and MP apart from the largest tank volume and the use of the NV690 steel in the LP tank (which is excluded for LP). The consequence of these observations is that the overall barge transport costs cannot be reduced by increasing the tank sizes, neither for LP nor MP barges.
Figure A2. Costs of LP barge cargo tanks as a function of the cargo tank volume in the B L C f i x scenarios with NV400Mn (in blue) and NV690 (in orange) tank materials relative to the tank costs of the MP barge in the B L C o r i g scenario. The inset shows the relative costs as a function of the L/D-ratio. The crosses mark tank configurations where the minimum vapour pressure exceeds a reasonable design pressure, assumed to be at 10 bar for LP and xx for MP.
Preprints 121880 g0a2
The fact that the tank costs increases with increasing tank volume is counter-intuitive. This can be explained by the increase in L/D-ratio associated with increased tank volume (and decreased number of tanks). The increased L/D-ratio implies that the cylindrical part of the tank increases. Since the wall thickness of the cylindrical part is larger than the spherical as seen in eq A5, the total material consumption per tank is not linear with the tank volume. In fact, the inset in Figure A2 shows that there is a strong relation between relative tank costs and the L/D-ratio, meaning that the optimal tank configuration is not necessarily the one that maximizes single tank volume, particularly when the diameter is restricted more than the length of the tanks, as is the case for Barge L.

Appendix B.2.2. Without Barge Capacity Constraint
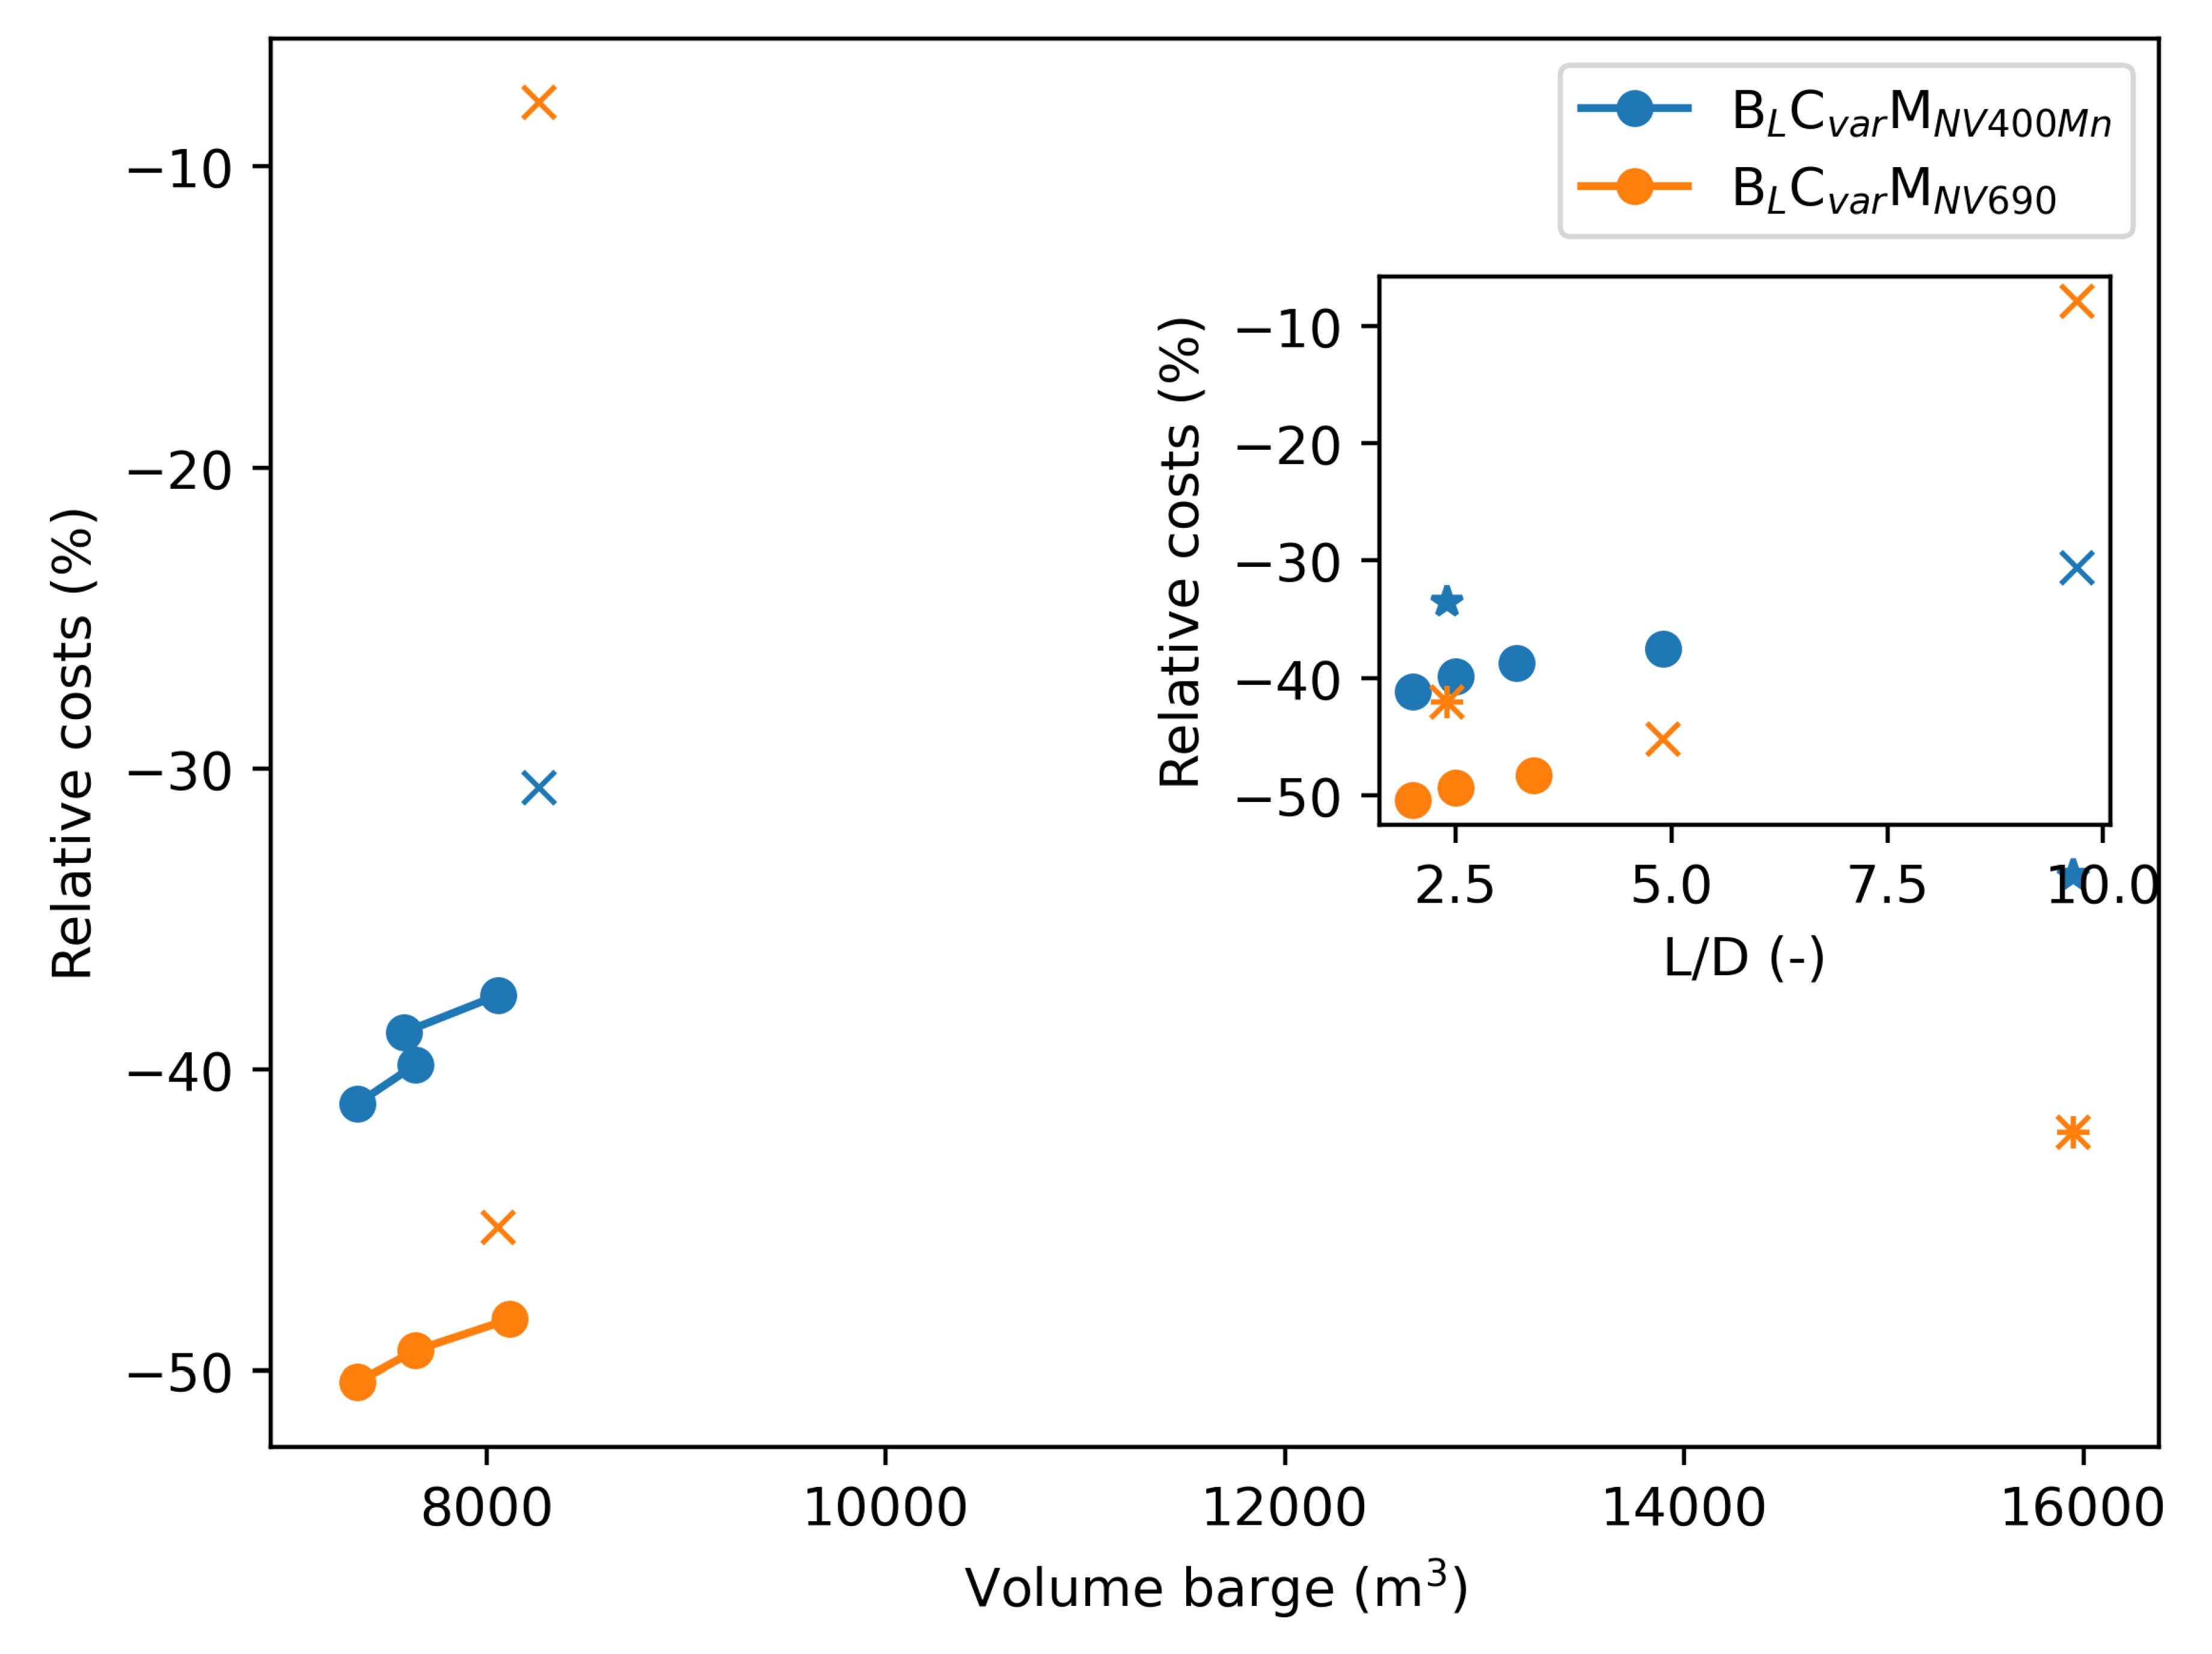
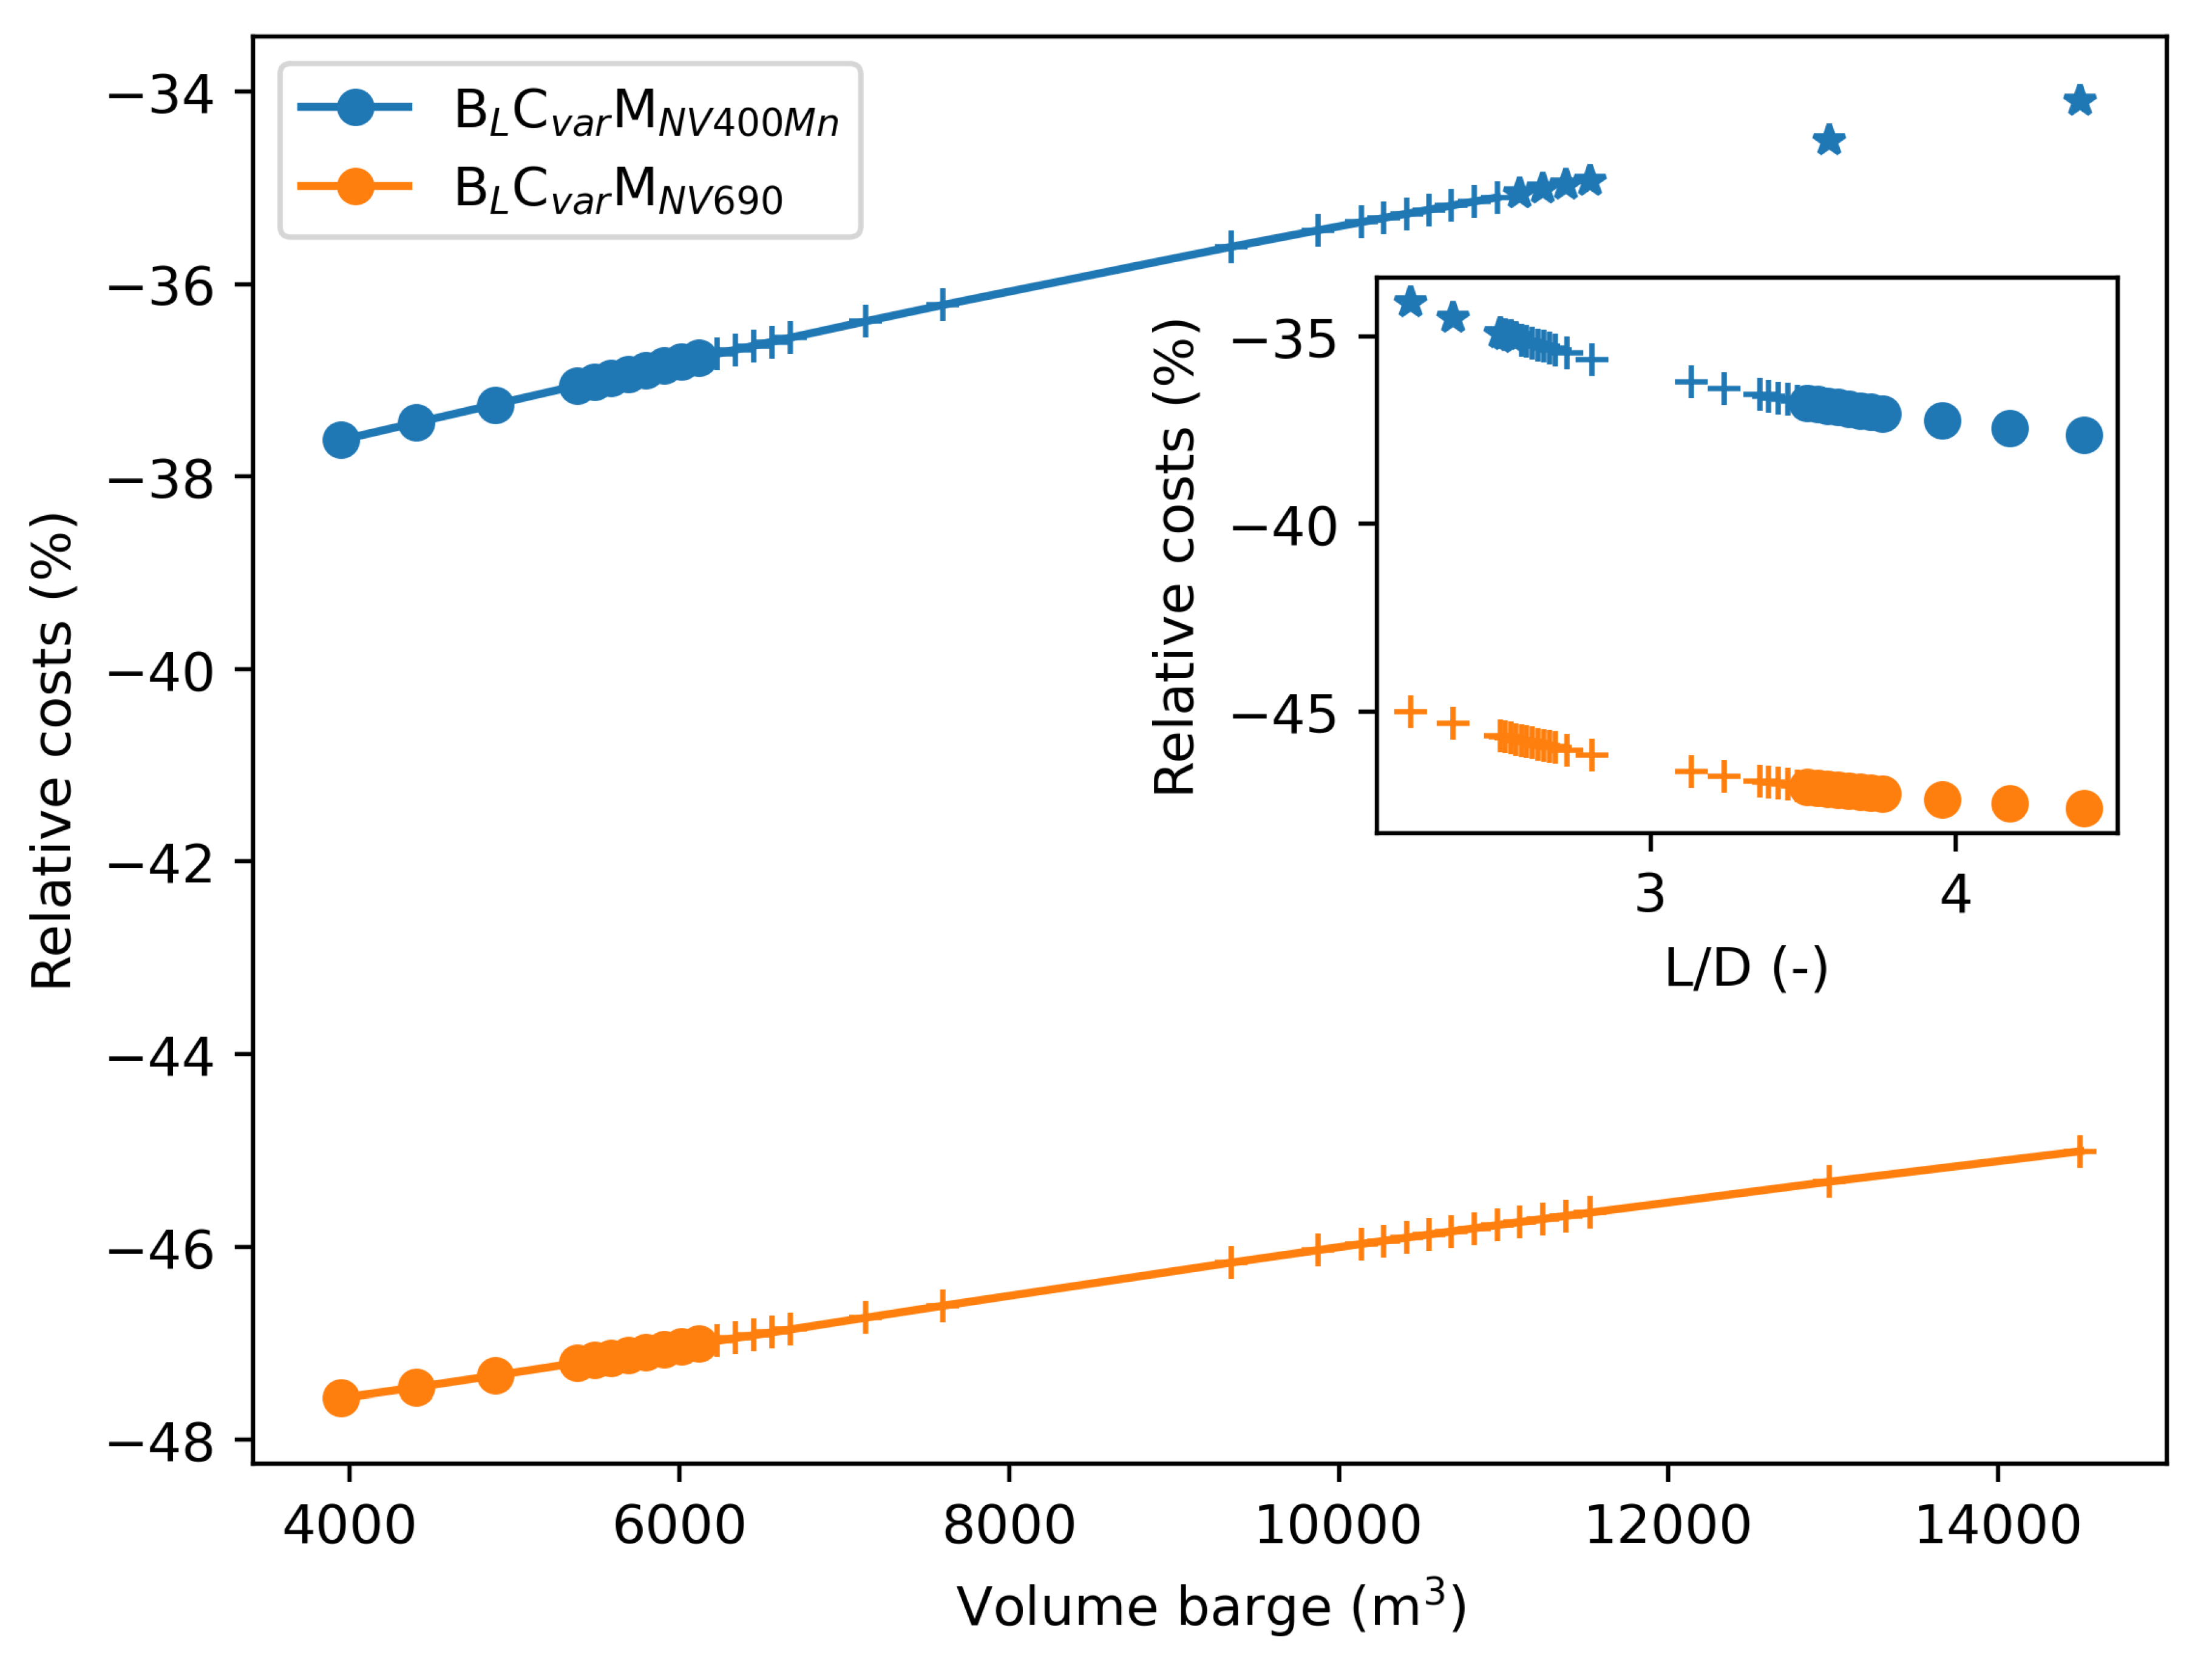
In the calculations where the total capacity of the barge was not constrained to the capacity of the original Barge L at 4650 m3, the barge capacity increased to 16000 m3 as the number of tanks were reduced to two. Figure A3 shows the relative costs of the LP cargo tanks in the B L C v a r approach as a function of the barge capacity.
Figure A3. Levelized costs of LP barge cargo tanks as a function of the barge total volume in the B L C v a r scenarios with NV400Mn (in blue) and NV690 (in orange) tank materials relative to the levelized tank costs of the MP barge in the B L C o r i g scenario. The inset shows the relative costs as a function of the L/D-ratio. The crosses mark tank configurations where the minimum vapour pressure exceeds a reasonable design pressure, assumed to be at 10 bar for LP and xx for MP. The stars mark points where the wall thickness exceeds 50 mm.
Preprints 121880 g0a3
As in the previous approach (with constrained barge capacity), the costs of the cargo tanks increases with increased volume. The increase in volume is associated with an increase in L/D-ratio, as in Figure A2 for all configurations that are not excluded because they either violate the minimum vapour pressure requirements or the wall thickness limit. We notice that one configuration, the one with largest capacity and largest individual tank volumes, is excluded due to the wall thickness in the MP configuration (and the LP configuration using NV400Mn tank material), but only due to the minimum vapour pressure in the LP configuration using the NV690 material. The minimum vapour pressure is controlled by the L/D-ratio as seen in Equation (a2), and can be reduced by reducing this ratio closer to 2.22. The configuration with two tanks and unconstrained barge capacity was therefore assessed closer with slightly reduced lengths (L) of the tanks5. Reducing the length of the LP NV690 tank by 8 % reduces the minimum vapour pressure of the to within the restriction at 10 bar. We now have a tank configuration for which the barge capacity exceeds that of Barge L (4650m3), but is slightly smaller than the maximum capacity for configurations with two tanks. Figure A4 shows the relative total costs of the two tanks on the barge as a function of the barge capacity. The barge capacity is here varied by varying the diameter of the two tanks. As visualized by + in the figure, there is a range of barge volumes above 6000 m 3 for which the both the LP cargo tanks is allowed while the MP cargo tanks exceed the wall thickness limit. Similar to the previous scenarios, the relative costs of the tanks increase with increased barge capacity, however, by less than 2 % points for an almost double barge capacity, yielding a possibility for reducing the overall transport costs for LP compared to MP barges.
Figure A4. Levelized costs of LP barge cargo tanks as a function of the barge total volume in the B L C v a r scenario with 1x2 configuration and tank length 8 % smaller than the maximum allowed length. The levelized costs are calculated for tanks with NV400Mn (in blue) and NV690 (in orange) tank materials relative to the levelized tank costs of the MP barge in the B L C o r i g scenario (i.e. the MP barge capacity is 4560 m 3 ). The inset shows the relative levelized costs as a function of the L/D-ratio. The crossed points mark tank configurations that are within the limitations of the Barge L dimensions and the wall thickness, but where the minimum vapour pressure exceeds a reasonable design pressure for the LP cargo tanks, assumed to be at 10 bar.
Preprints 121880 g0a4
Although the analyses above showed that increased barge capacities in the LP compared to the MP Barge L can be achieved in the case of a 1x2 cargo tank configuration, no studies were performed on the technical feasibility of such a barge. Increasing the capacity naturally changes the requirements to the barge itself; its design and consequently its construction and operational costs. A barge capacity increase of more than 32 % is necessary to reach cargo tank volumes allowed only for LP and not for MP. The increased barge capacity is accompanied by a load increase which can impact the design of the barge, e.g. the barge depth and the draft, significantly. One of the main assumptions in the inland transport assessments performed herein is that the barge design and costs are not affected by changes in cargo tank configuration. Increasing the barge capacity more than 32 % is likely to affect the width and depth of the barge design, and may violate this core assumption. Therefore, the possibility for reducing overall barge transport costs are only indicated, but detailed inland transport assessments are not performed for the 1x2 tank configurations. Further investigation into the technical feasibility of barges with capacities above 6000 m 3 and their associated construction and operational costs are necessary before associated inland transport techno-economic assessments are performed.
To conclude the investigations, there was not found any general indications that varying the tank sizes and volumes can impact the relative transport costs of LP versus MP barge transport. Neither was a great potential for increasing the barge capacity of LP compared to MP barges found.

References

  1. Butnar, I.; Cronin, J.; Pye, S. Review of Carbon Capture Utilisation and Carbon Capture and Storage in future EU decarbonisation scenarios Final report prepared for. Technical report, UCL Energy Institute, 2020.
  2. Budinis, S.; Fajardy, M.; Greenfield, C. Tracking Clean Energy Progress 2023. Technical report, IEA, 2023.
  3. Gallego Dávila, J.; Aagesen, M. How to accelerate CCS deployment in the Cement Industry? Assessing impacts of uncertainties on the business case. International Journal of Greenhouse Gas Control 2024, 137, 104197. [CrossRef]
  4. Kearns, A.; Liu, H.; Consoli, C. Technology Readiness and Costs of CCS Technology. Technical report, Global CCS Institute, 2021.
  5. Lu, G.; Wang, Z.; Bhatti, U.H.; Fan, X. Recent progress in carbon dioxide capture technologies: A review. Clean Energy Science and Technology 2023, 1. [CrossRef]
  6. Chowdhury, S.; Kumar, Y.; Shrivastava, S.; Patel, S.K.; Sangwai, J.S. A Review on the Recent Scientific and Commercial Progress on the Direct Air Capture Technology to Manage Atmospheric CO <sub>2</sub> Concentrations and Future Perspectives. Energy & Fuels 2023, 37, 10733–10757. [CrossRef]
  7. Yang, B.; Shao, C.; Hu, X.; Ngata, M.R.; Aminu, M.D. Advances in Carbon Dioxide Storage Projects: Assessment and Perspectives. Energy & Fuels 2023, 37, 1757–1776. [CrossRef]
  8. Coussy, P.; Roussanaly, S.; Bureau–Cauchois, G.; Wildenborg, T. Economic CO2 network optimization model COCATE European Project (2010-2013). Energy Procedia 2013, 37, 2923–2931. [CrossRef]
  9. Roussanaly, S.; Bureau-Cauchois, G.; Husebye, J. Costs benchmark of CO2 transport technologies for a group of various size industries. International Journal of Greenhouse Gas Control 2013, 12, 341–350. [CrossRef]
  10. Weihs, G.F.; Kumar, K.; Wiley, D. Understanding the Economic Feasibility of Ship Transport of CO2 within the CCS Chain. Energy Procedia 2014, 63, 2630–2637. [CrossRef]
  11. Roussanaly, S.; Jakobsen, J.P.; Hognes, E.H.; Brunsvold, A.L. Benchmarking of CO2 transport technologies: Part I—Onshore pipeline and shipping between two onshore areas. International Journal of Greenhouse Gas Control 2013, 19, 584–594. [CrossRef]
  12. Roussanaly, S.; Brunsvold, A.L.; Hognes, E.S. Benchmarking of CO 2 transport technologies: Part II – Offshore pipeline and shipping to an offshore site. International Journal of Greenhouse Gas Control 2014, 28, 283–299. [CrossRef]
  13. Oeuvray, P.; Burger, J.; Roussanaly, S.; Mazzotti, M.; Becattini, V. Multi-criteria assessment of inland and offshore carbon dioxide transport options. Journal of Cleaner Production 2024, 443. [CrossRef]
  14. Al Baroudi, H.; Wada, R.; Ozaki, M.; Patchigolla, K.; Iwatomi, M.; Murayama, K.; Otaki, T. Real-scale investigation of liquid CO2 discharge from the emergency release coupler of a marine loading arm. International Journal of Greenhouse Gas Control 2022, 118, 103674. [CrossRef]
  15. Chen, F.; Morosuk, T. Exergetic and Economic Evaluation of CO2 Liquefaction Processes. Energies 2021, 14, 7174. [CrossRef]
  16. Trædal, S.; Stang, J.H.G.; Snustad, I.; Johansson, M.V.; Berstad, D. CO2 Liquefaction Close to the Triple Point Pressure. Energies 2021, 14. [CrossRef]
  17. Lee, J.; Son, H.; Oh, J.; Yu, T.; Kim, H.; Lim, Y. Advanced process design of subcooling re-liquefaction system considering storage pressure for a liquefied CO2 carrier. Energy 2024, 293, 130556. [CrossRef]
  18. Bjerketvedt, V.S.; Tomasgard, A.; Roussanaly, S. Optimal design and cost of ship-based CO2 transport under uncertainties and fluctuations. International Journal of Greenhouse Gas Control 2020, 103, 103190. [CrossRef]
  19. Calvillo, C.; Race, J.; Chang, E.; Turner, K.; Katris, A. Characterisation of UK Industrial Clusters and Techno-Economic Cost Assessment for Carbon Dioxide Transport and Storage Implementation. International Journal of Greenhouse Gas Control 2022, 119, 103695. [CrossRef]
  20. Roussanaly, S.; Holm, S.E.; Subramanian, A. Can subsea shuttles be a cost-competitive solution for CO2 transport? Carbon Capture Science & Technology 2024, 13, 100246. [CrossRef]
  21. Imran Abdul-Majid.; Chris Armes.; Trevor Crowe.; Jeff Davison.; Baris Dolek.; Martin Edwards.; Kathryn Emmett.; Yunzhe He.; Jasper Heikens.; Phil Hinton.; Tomoki Inoue.; Anton Malakhov.; Clément Merat.; Stavros Niotis.; Gabriel Otaru.; Ian Phillips.; Alistair Tucker.; Luke Warren.; Matt Wilson.; Aaron Wu. Achieving a European market for CO2 transport by ship. Technical report, ZEP, 2024.
  22. Burger, J.; Nöhl, J.; Seiler, J.; Gabrielli, P.; Oeuvray, P.; Becattini, V.; Reyes-Lúa, A.; Riboldi, L.; Sansavini, G.; Bardow, A. Environmental impacts of carbon capture, transport, and storage supply chains: Status and the way forward. International Journal of Greenhouse Gas Control 2024, 132, 104039. [CrossRef]
  23. d’Amore, F.; Bezzo, F. Economic optimisation of European supply chains for CO 2 capture, transport and sequestration. International Journal of Greenhouse Gas Control 2017, 65, 99–116. [CrossRef]
  24. d’Amore, F.; Romano, M.C.; Bezzo, F. Carbon capture and storage from energy and industrial emission sources: A Europe-wide supply chain optimisation. Journal of Cleaner Production 2021, 290, 125202. [CrossRef]
  25. Frattini, L.; Becattini, V.; Mazzotti, M. Main current legal and regulatory frameworks for carbon dioxide capture, transport, and storage in the European Economic Area. International Journal of Greenhouse Gas Control 2024, 136, 104172. [CrossRef]
  26. Weber, V. Are we ready for the ship transport of CO2 for CCS? Crude solutions from international and European law. Review of European, Comparative & International Environmental Law 2021, 30, 387–395. [CrossRef]
  27. Roussanaly, S.; Deng, H.; Skaugen, G.; Gundersen, T. At what Pressure Shall CO2 Be Transported by Ship? An in-Depth Cost Comparison of 7 and 15 Barg Shipping. Energies 2021, 14. [CrossRef]
  28. Durusut, E.; Joos, M. Shipping CO2 - UK cost estimation study. Technical report, Element Energy, London, 2018.
  29. Altera Infrastructure.; Moss Maritime.; TGE Marine Gas Eng..; APL Norway.; Sevan SSP.; DNV. Stella Maris Concept Study: Climit-Demo, 2019.
  30. Altera Infrastructure.; Moss Maritime.; TGE Marine Gas Eng..; APL Norway.; Sevan SSP.; DNV. Stella Maris: Climit-Demo, 2020.
  31. Gassnova. Feasibility study for full-scale CCS in Norway Contents. Technical report, Ministry of Petroleum and Energy, 2016.
  32. Equinor.; Gassnova.; Shell.; TotalEnergies. Northern Lights Project Concept report. Technical report, Equinor, 2019.
  33. Becattini, V.; Gabrielli, P.; Antonini, C.; Campos, J.; Acquilino, A.; Sansavini, G.; Mazzotti, M. Carbon dioxide capture, transport and storage supply chains: Optimal economic and environmental performance of infrastructure rollout. International Journal of Greenhouse Gas Control 2022, 117, 103635. [CrossRef]
  34. Jakobsen, J.P.; Roussanaly, S.; Brunsvold, A.; Anantharaman, R. A Tool for Integrated Multi-criteria Assessment of the CCS Value Chain. Energy Procedia 2014, 63, 7290–7297. [CrossRef]
  35. Notaro, G.; Nyseth, H.; Torbergsen, L.E. CETO: Technology Qualification of Low-Pressure CO2 Ship Transportation. Technical report, Equinor Energy AS, Gassco AS, TotalEnergies EP Norge, Shell Global Solutions International, 2024.
  36. ETH Zurich. DemoUpCARMA, 2021.
  37. SINTEF Energy. EU Horizon 2020 Project ACCSESS, 2021.
  38. Sutton, I. Hazards identification. In Process Risk and Reliability Management; Elsevier, 2010; pp. 79–190. [CrossRef]
  39. Span, R.; Brown, A.; Tlatlik, H. Interoperable CO2 Transport Network-Towards Specifications for the Transport of Impure CO2’. Technical report, Zero Emissions Platform, 2023.
  40. SONKE, J.; Morland, B.; Moulie, G.; Franke, M. Corrosion and chemical reactions in impure CO2. International Journal of Greenhouse Gas Control 2024, 133, 104075. [CrossRef]
  41. DNV. Liquefied gas carriers. Technical report, DNV, 2016.
1
This is significantly smaller than what is projected for LP shipping due to the low steel weight and flexible ship arrangement enabled by the lower pressure [29,30]
2
It is worth noting that the material used for the LP truck tanks is different from the LP ship tank. This is due to the different geometries of the tanks, making different LP materials suitable.
3
As many CO2 emitters are located far from the coast
4
As CO2 storage take place offshore due to the lack of social acceptability of onshore storage
5
This means that the tank volume was not maximized relative to the available space on the barge.
Figure 1. Illustration of the system the boundaries considered in the two techno-economic models applied in the present study.
Preprints 121880 g001
Figure 2. The construction costs as a function of the ship capacity for LP (blue) and MP (orange) ship transport. The dashed lines are the original (o) cost curves fitted to the data points (×) from Durusut and Joos , Durusut and Joos . The values from Durusut and Joos are adapted to USD 2023 costs by a factor of 1.2648. Filled circles • are the updated (u) construction costs of the LP (dark blue) and MP (red) ships evaluated by the shipping industry. The resulting updated cost curves used in the present study are depicted for MP (red line), L P NVNi (blue line) and L P NV 690 (blue dotdashed line). The arrows illustrate the shift in construction costs from Durusut and Joos to the present study.
Preprints 121880 g002
Figure 3. The relative cost difference of LP and MP shipping as a function of transport distance and annual volumes CO2 for (from left to right) the base case, the NVNi tank material and the NV690 tank material scenario. The maximal MP ship capacity is 10 ktCO2/ship in all three cases. The dotted brown lines show the pipeline cost limit compared to the LP case (i.e. compared to the LP BC, M NVNi C 10 and M NV 690 C 10 in the left, middle and right panels, respectively). The transparent dotted lines in the middle and right panels show the pipeline cost limit in the LP BC. Pipelines are more economical than LP shipping left of the dotted lines. For clarity, this area is scratched out to highlight that the area is less relevant for shipping.
Preprints 121880 g003
Figure 4. The relative cost difference of LP and MP shipping as a function of transport distance and annual volumes C O 2 for (from left to right) 10, 15 and 30 ktC O 2 /ship in the NVNi (upper) and NV690 (lower) material scenario.The dotted lines show the pipeline cost limit compared to the LP shipping scenario. To the left of the dotted lines are the volume-distance regions where pipelines are more economic than LP shipping. For clarity, this area is scratched out to highlight that the area is less relevant for shipping.
Preprints 121880 g004
Figure 5. Comparison of relative levelized costs between LP and MP of the tanks, transport without liquefaction and transport with liquefaction for truck (upper), barge (middle) and ship (lower) transport. The comparison is shown for a representative distance and annual volume for inland (0.5 MtCO2 and 500 km) and at-sea (5 MtCO2 and 1000 km). The asterix (*) marks that the ship tank costs are normalized over the tank volume. The maximum ship capacity for LP and MP shipping is 50 ktCO2 and 10 ktCO2.
Preprints 121880 g005
Figure 6. Summary and take-home messages from the inland and at-sea transport assessments. Low-pressure (LP) at-sea transport is more economic than medium-pressure (MP) in all cases except for when the ship capacity is similar for LP and MP (vessel capacity: LP ≈ MP) and the tank material of LP tanks is more expensive than that of MP (tank material: LP > MP). LP and MP inland transport are equivalent in all cases.
Preprints 121880 g006
Table 1. The specifications of the scenarios for transportation by ship evaluated in the present study. In all scenarios, liquefaction and conditioning of CO2 after capture is performed for pure CO2 at 1 bar(a) and 40 °C.
Scenario Tank material scenario Max ship capacity (ktCO2/ship)
LP MP LP MP
BC UND [28] UND [28] 50 10
MNVNiC10 NVNi NV690 50 10
MNVNiC15 NVNi NV690 50 15
MNVNiC30 NVNi NV690 50 30
MNV690C10 NV690 NV690 50 10
MNV690C15 NV690 NV690 50 15
MNV690C30 NV690 NV690 50 30
Table 2. Overview of the inland transport scenarios.
Transport Scenario Capacity ( m 3 ) Number tanks LP material MP material
Truck Truck M NV 400 Mn 26 t 1 NV400Mn NV690
Truck M NV 690 26 t 1 NV690 NV690
Barge S B S M NV 400 Mn 3040 8 NV400Mn NV690
B S M NV 690 3040 8 NV690 NV690
Disclaimer/Publisher’s Note: The statements, opinions and data contained in all publications are solely those of the individual author(s) and contributor(s) and not of MDPI and/or the editor(s). MDPI and/or the editor(s) disclaim responsibility for any injury to people or property resulting from any ideas, methods, instructions or products referred to in the content.
Copyright: This open access article is published under a Creative Commons CC BY 4.0 license, which permit the free download, distribution, and reuse, provided that the author and preprint are cited in any reuse.
Alerts
Prerpints.org logo

Preprints.org is a free preprint server supported by MDPI in Basel, Switzerland.

Subscribe

© 2025 MDPI (Basel, Switzerland) unless otherwise stated