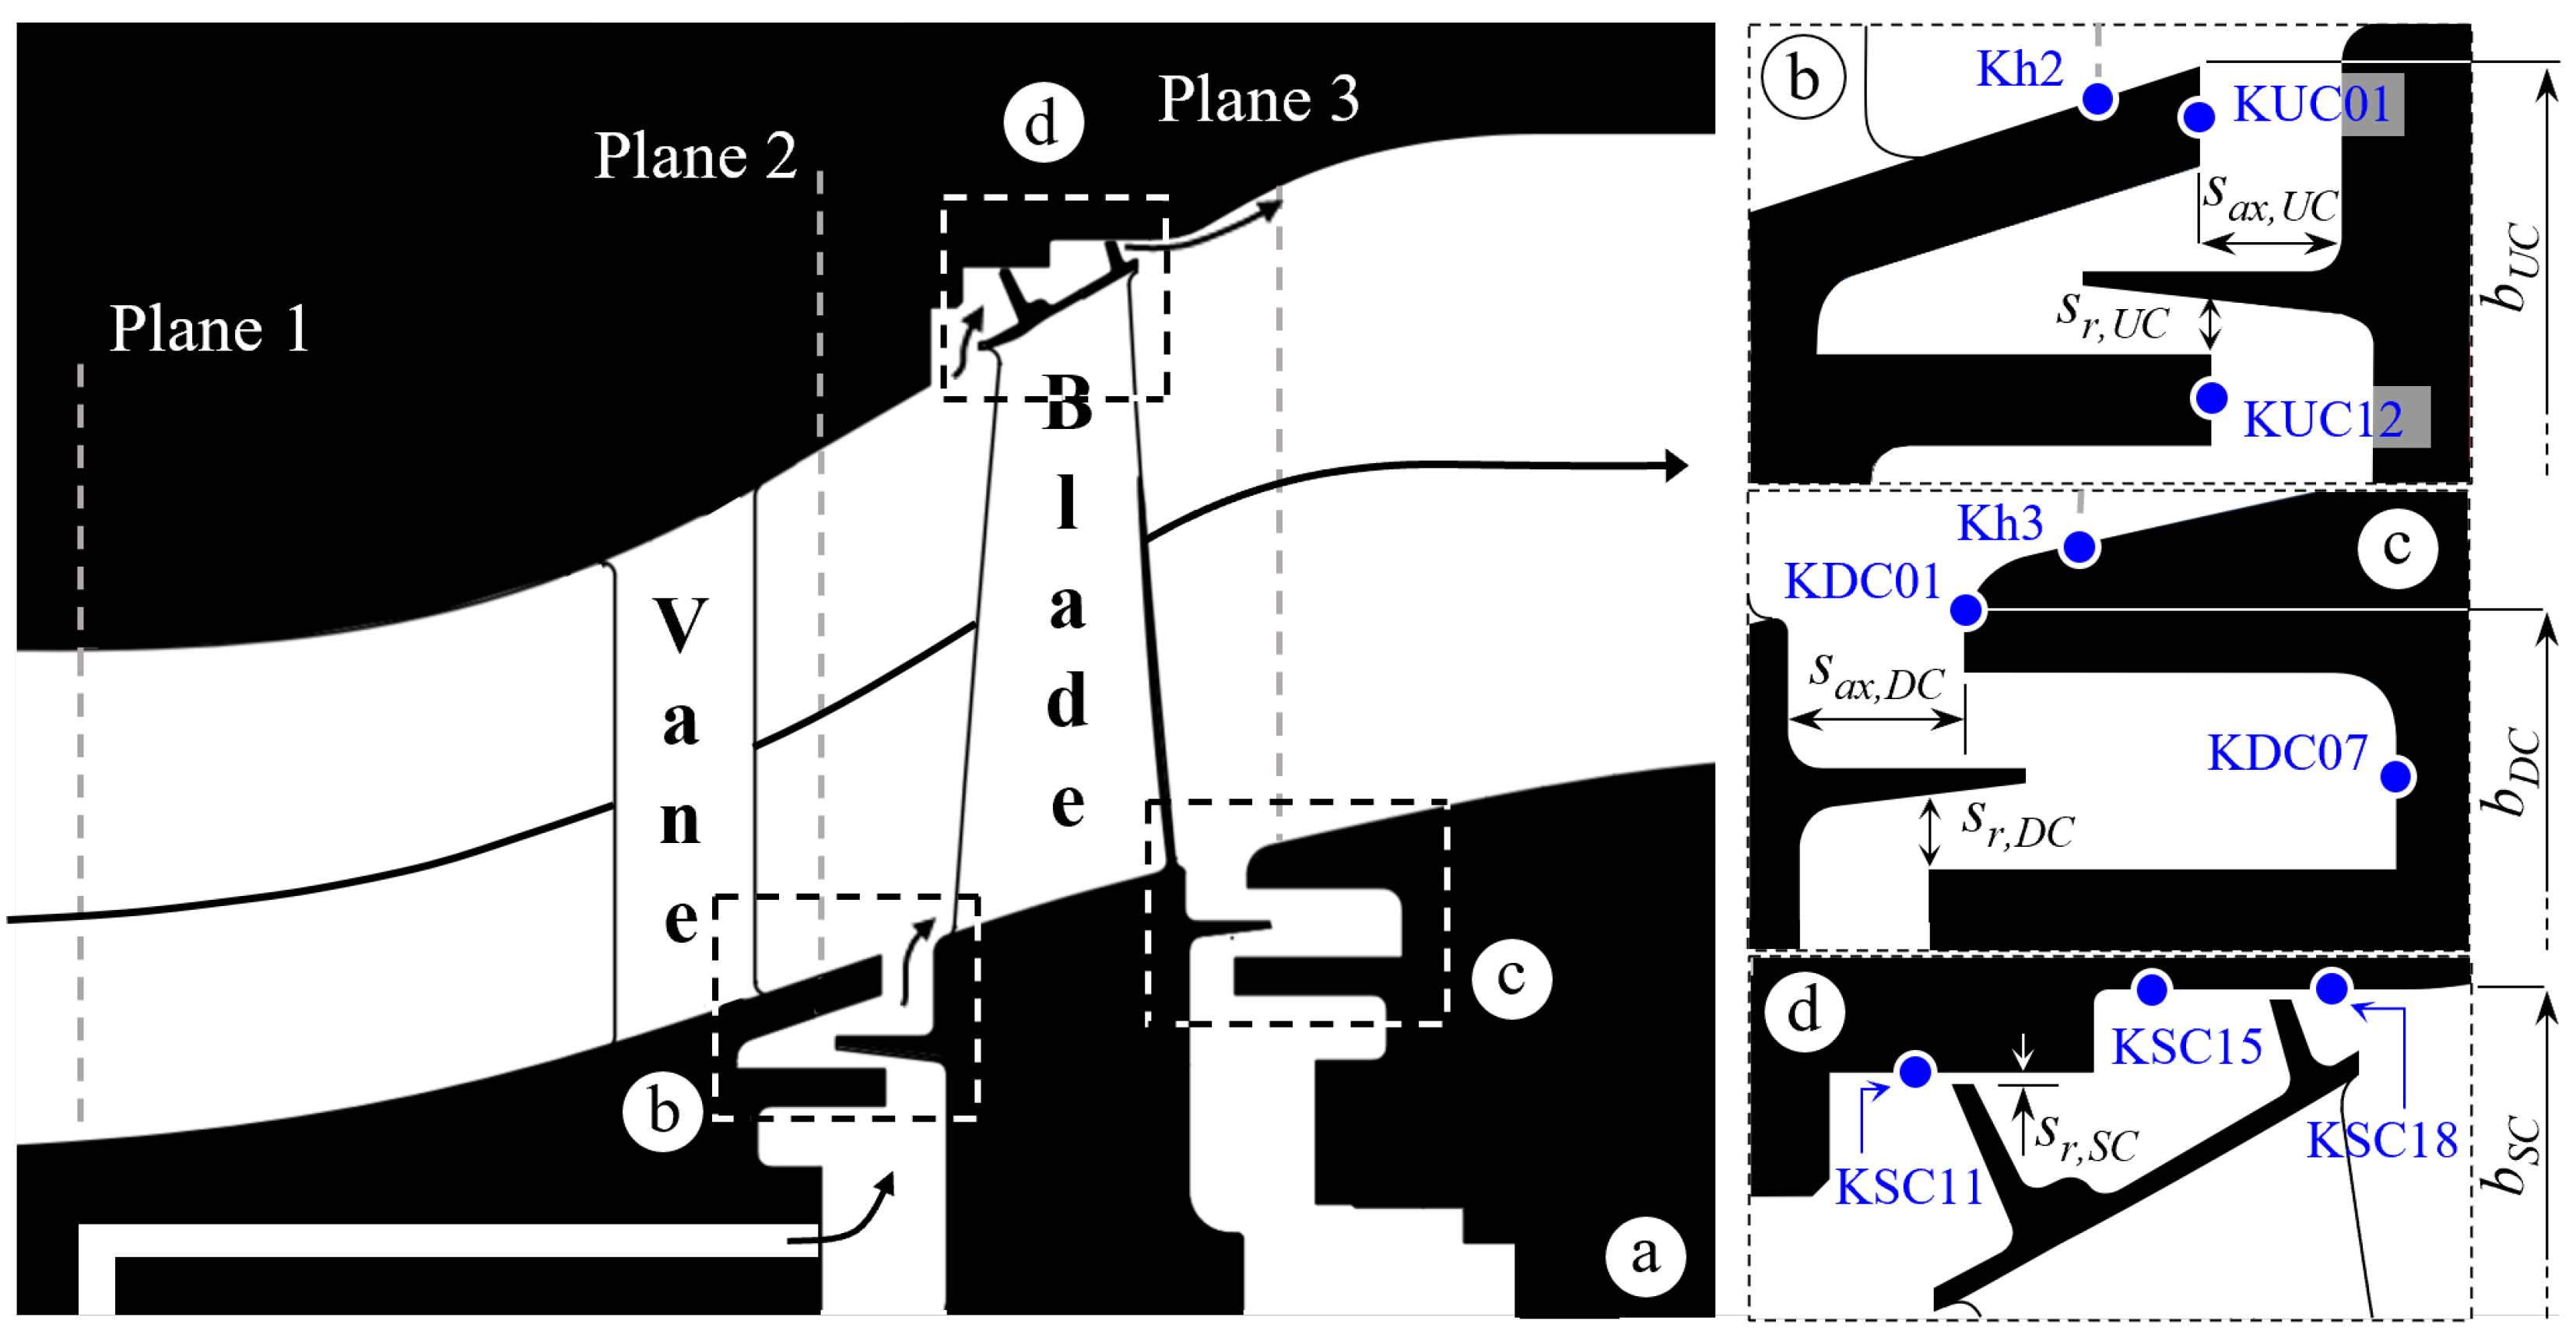
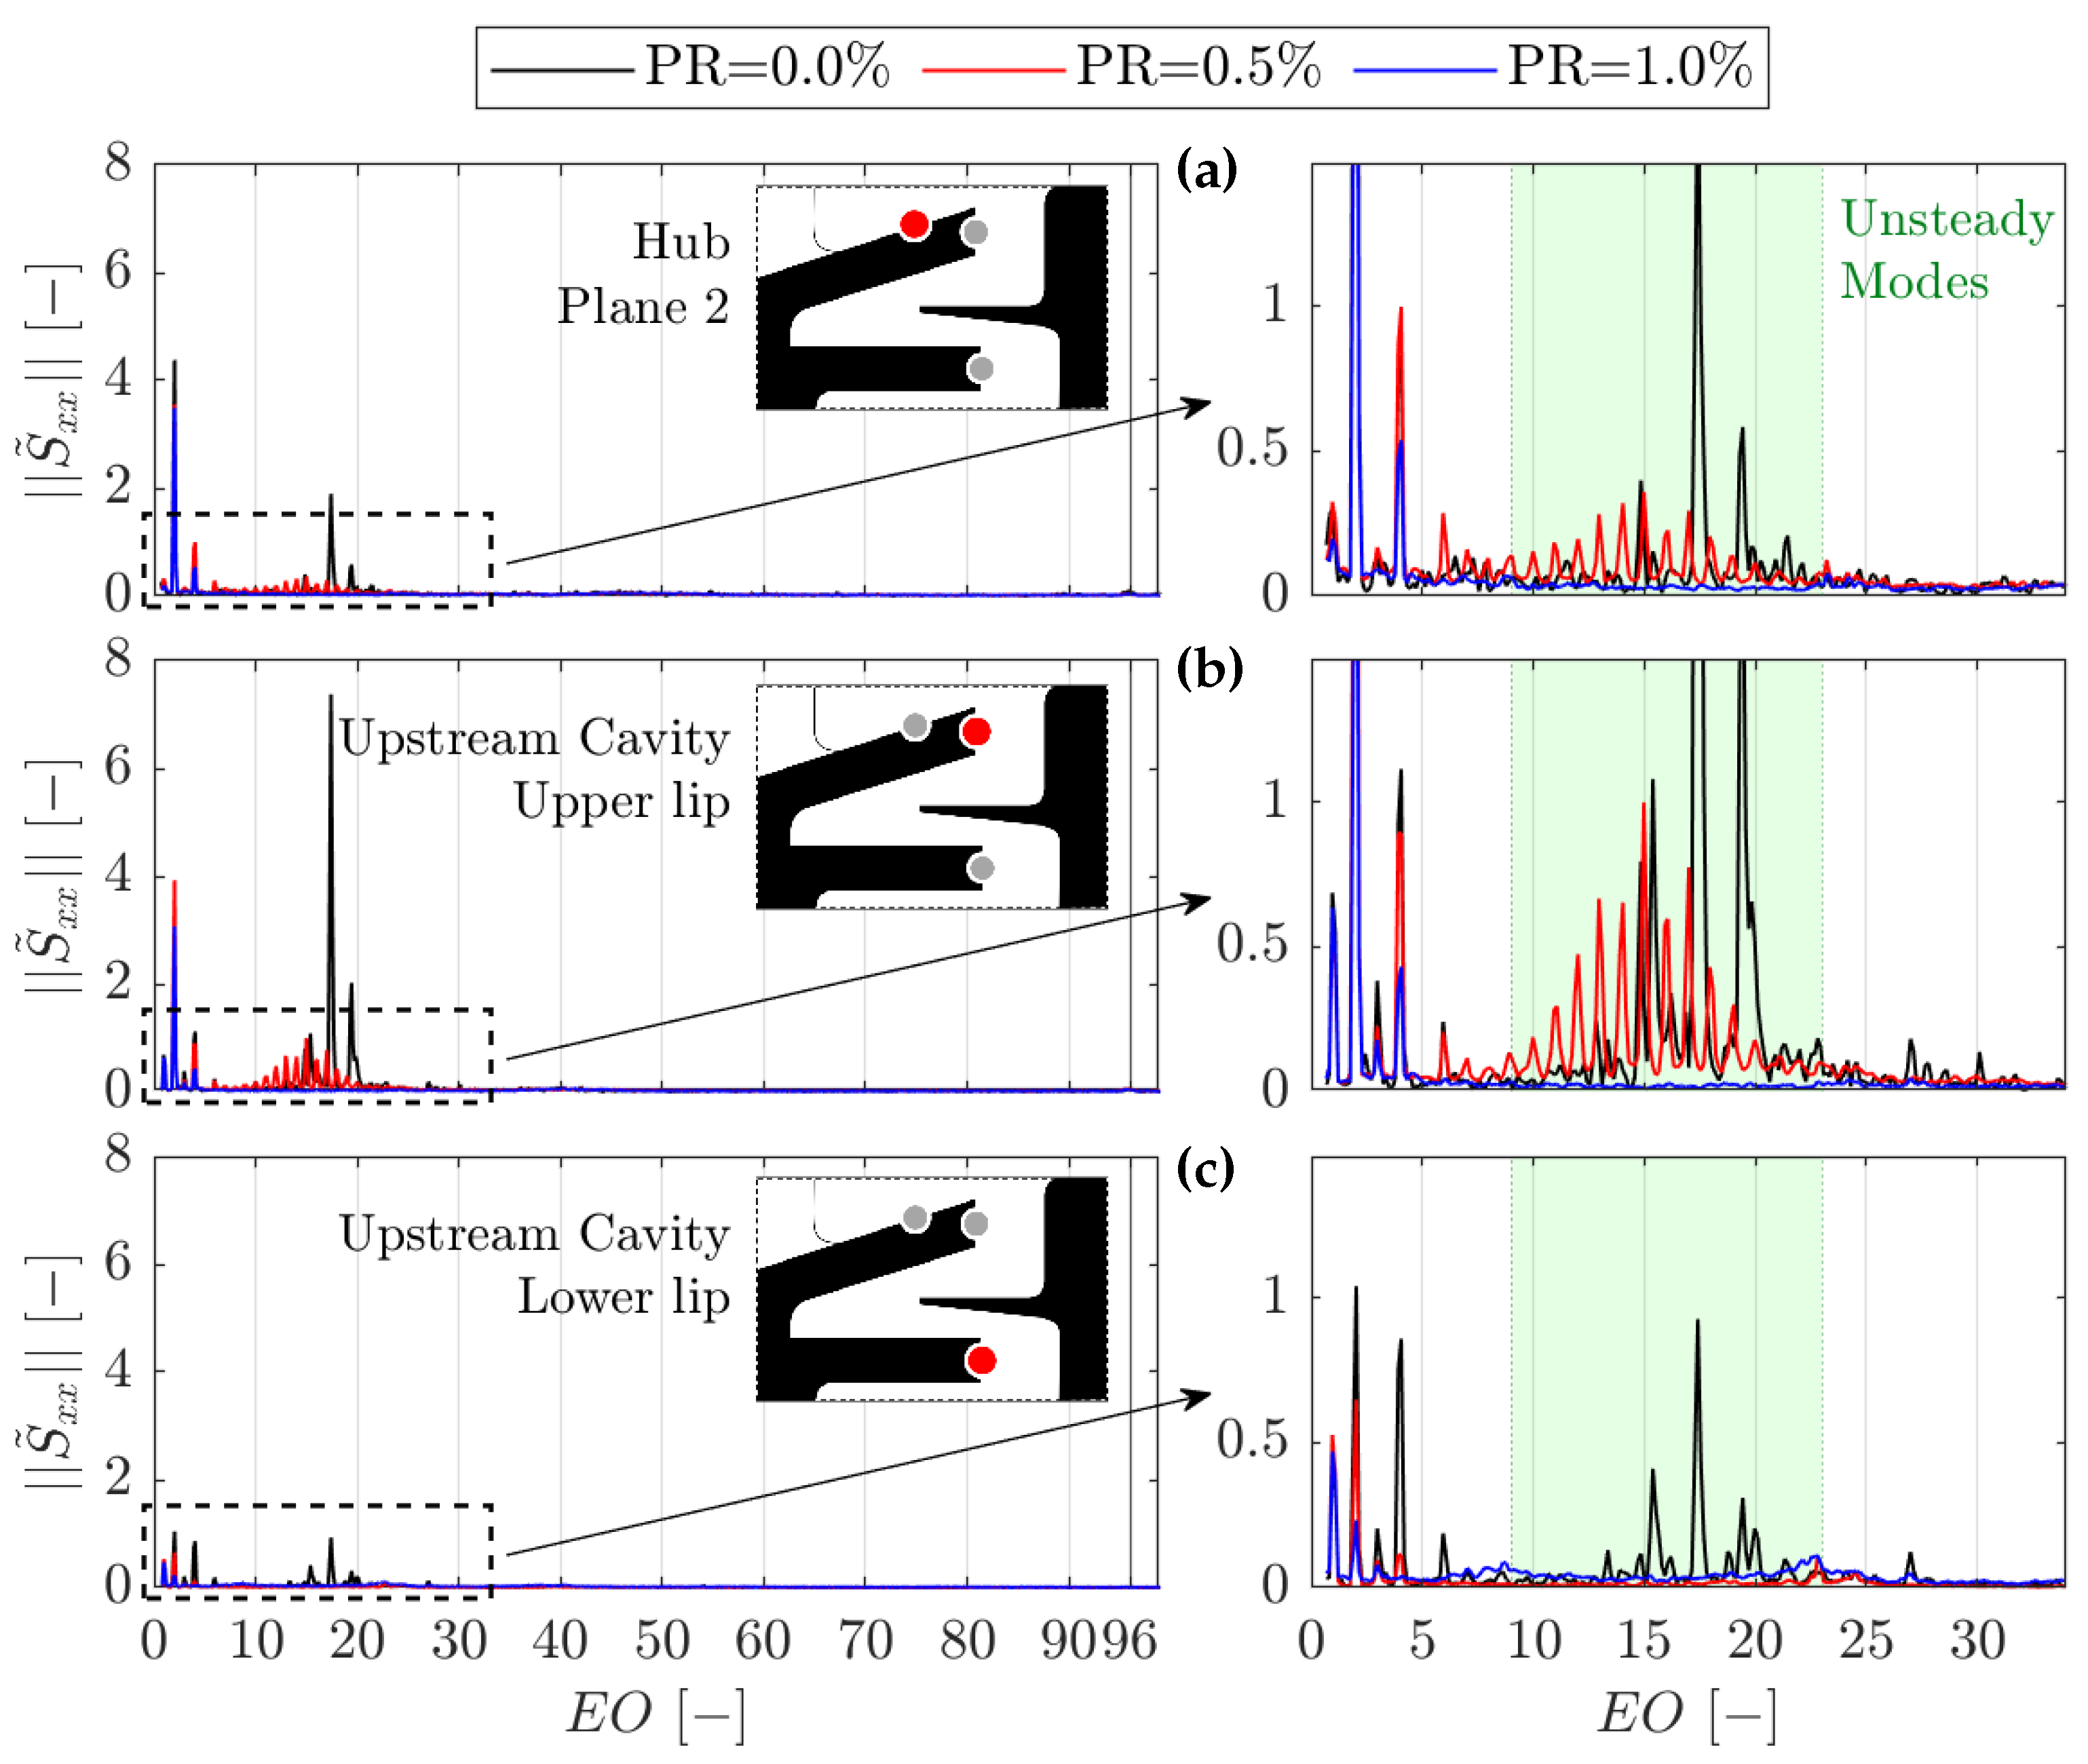
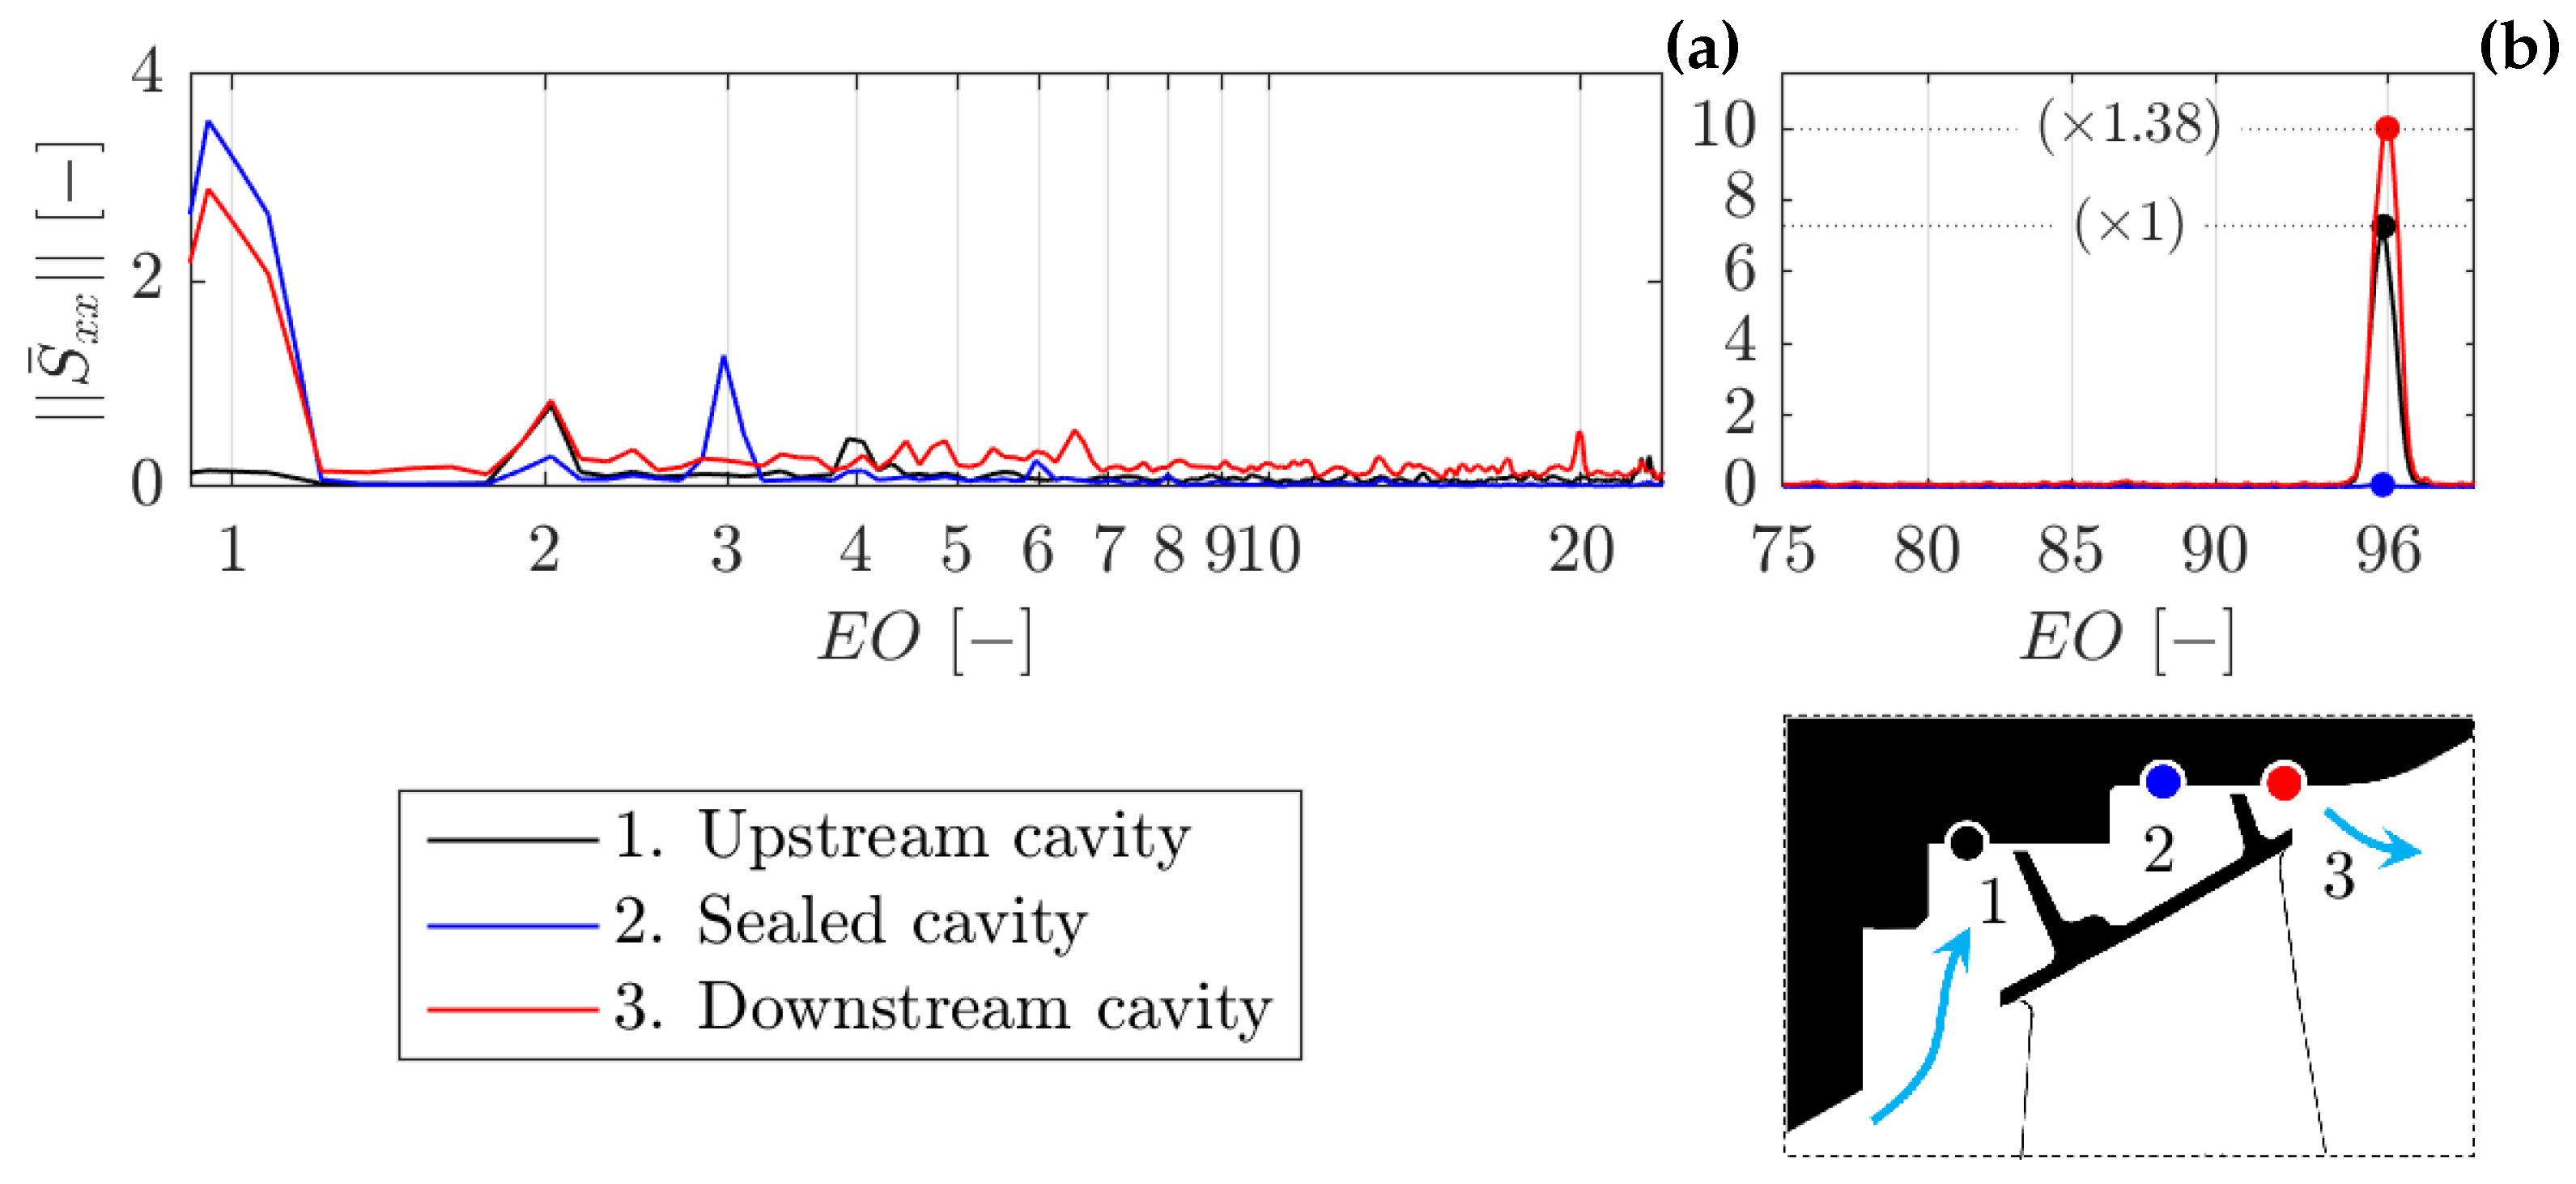
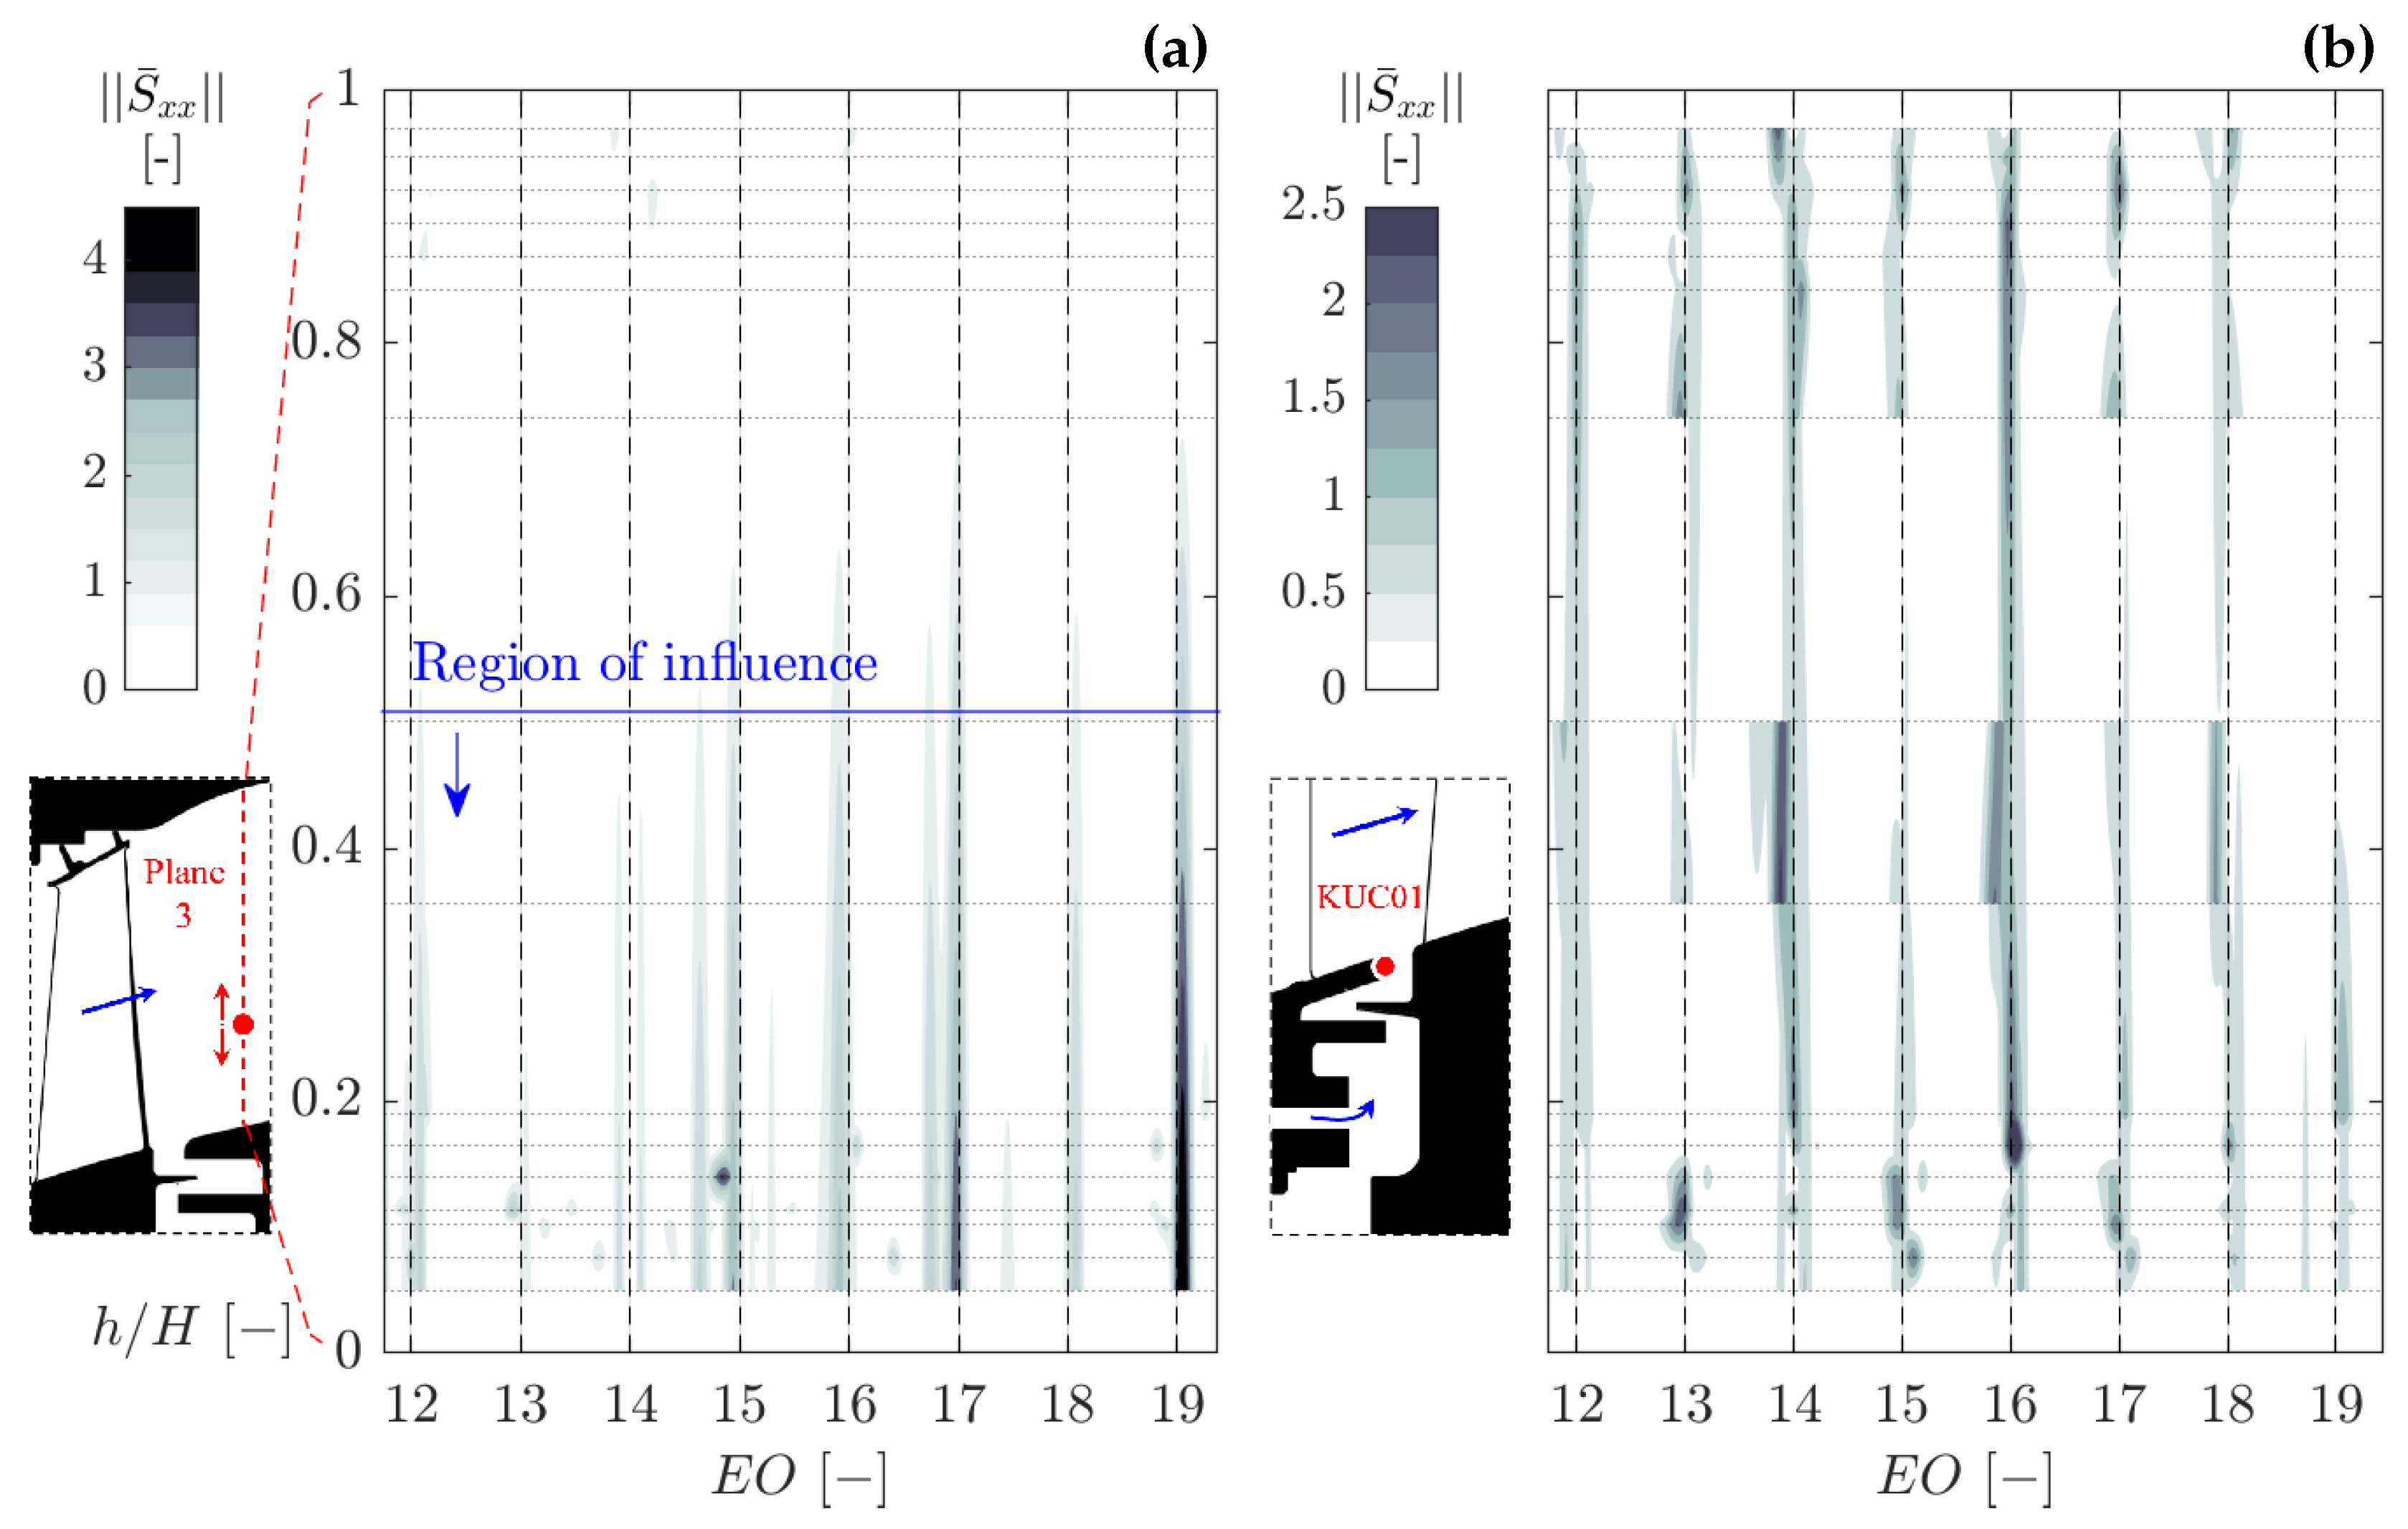
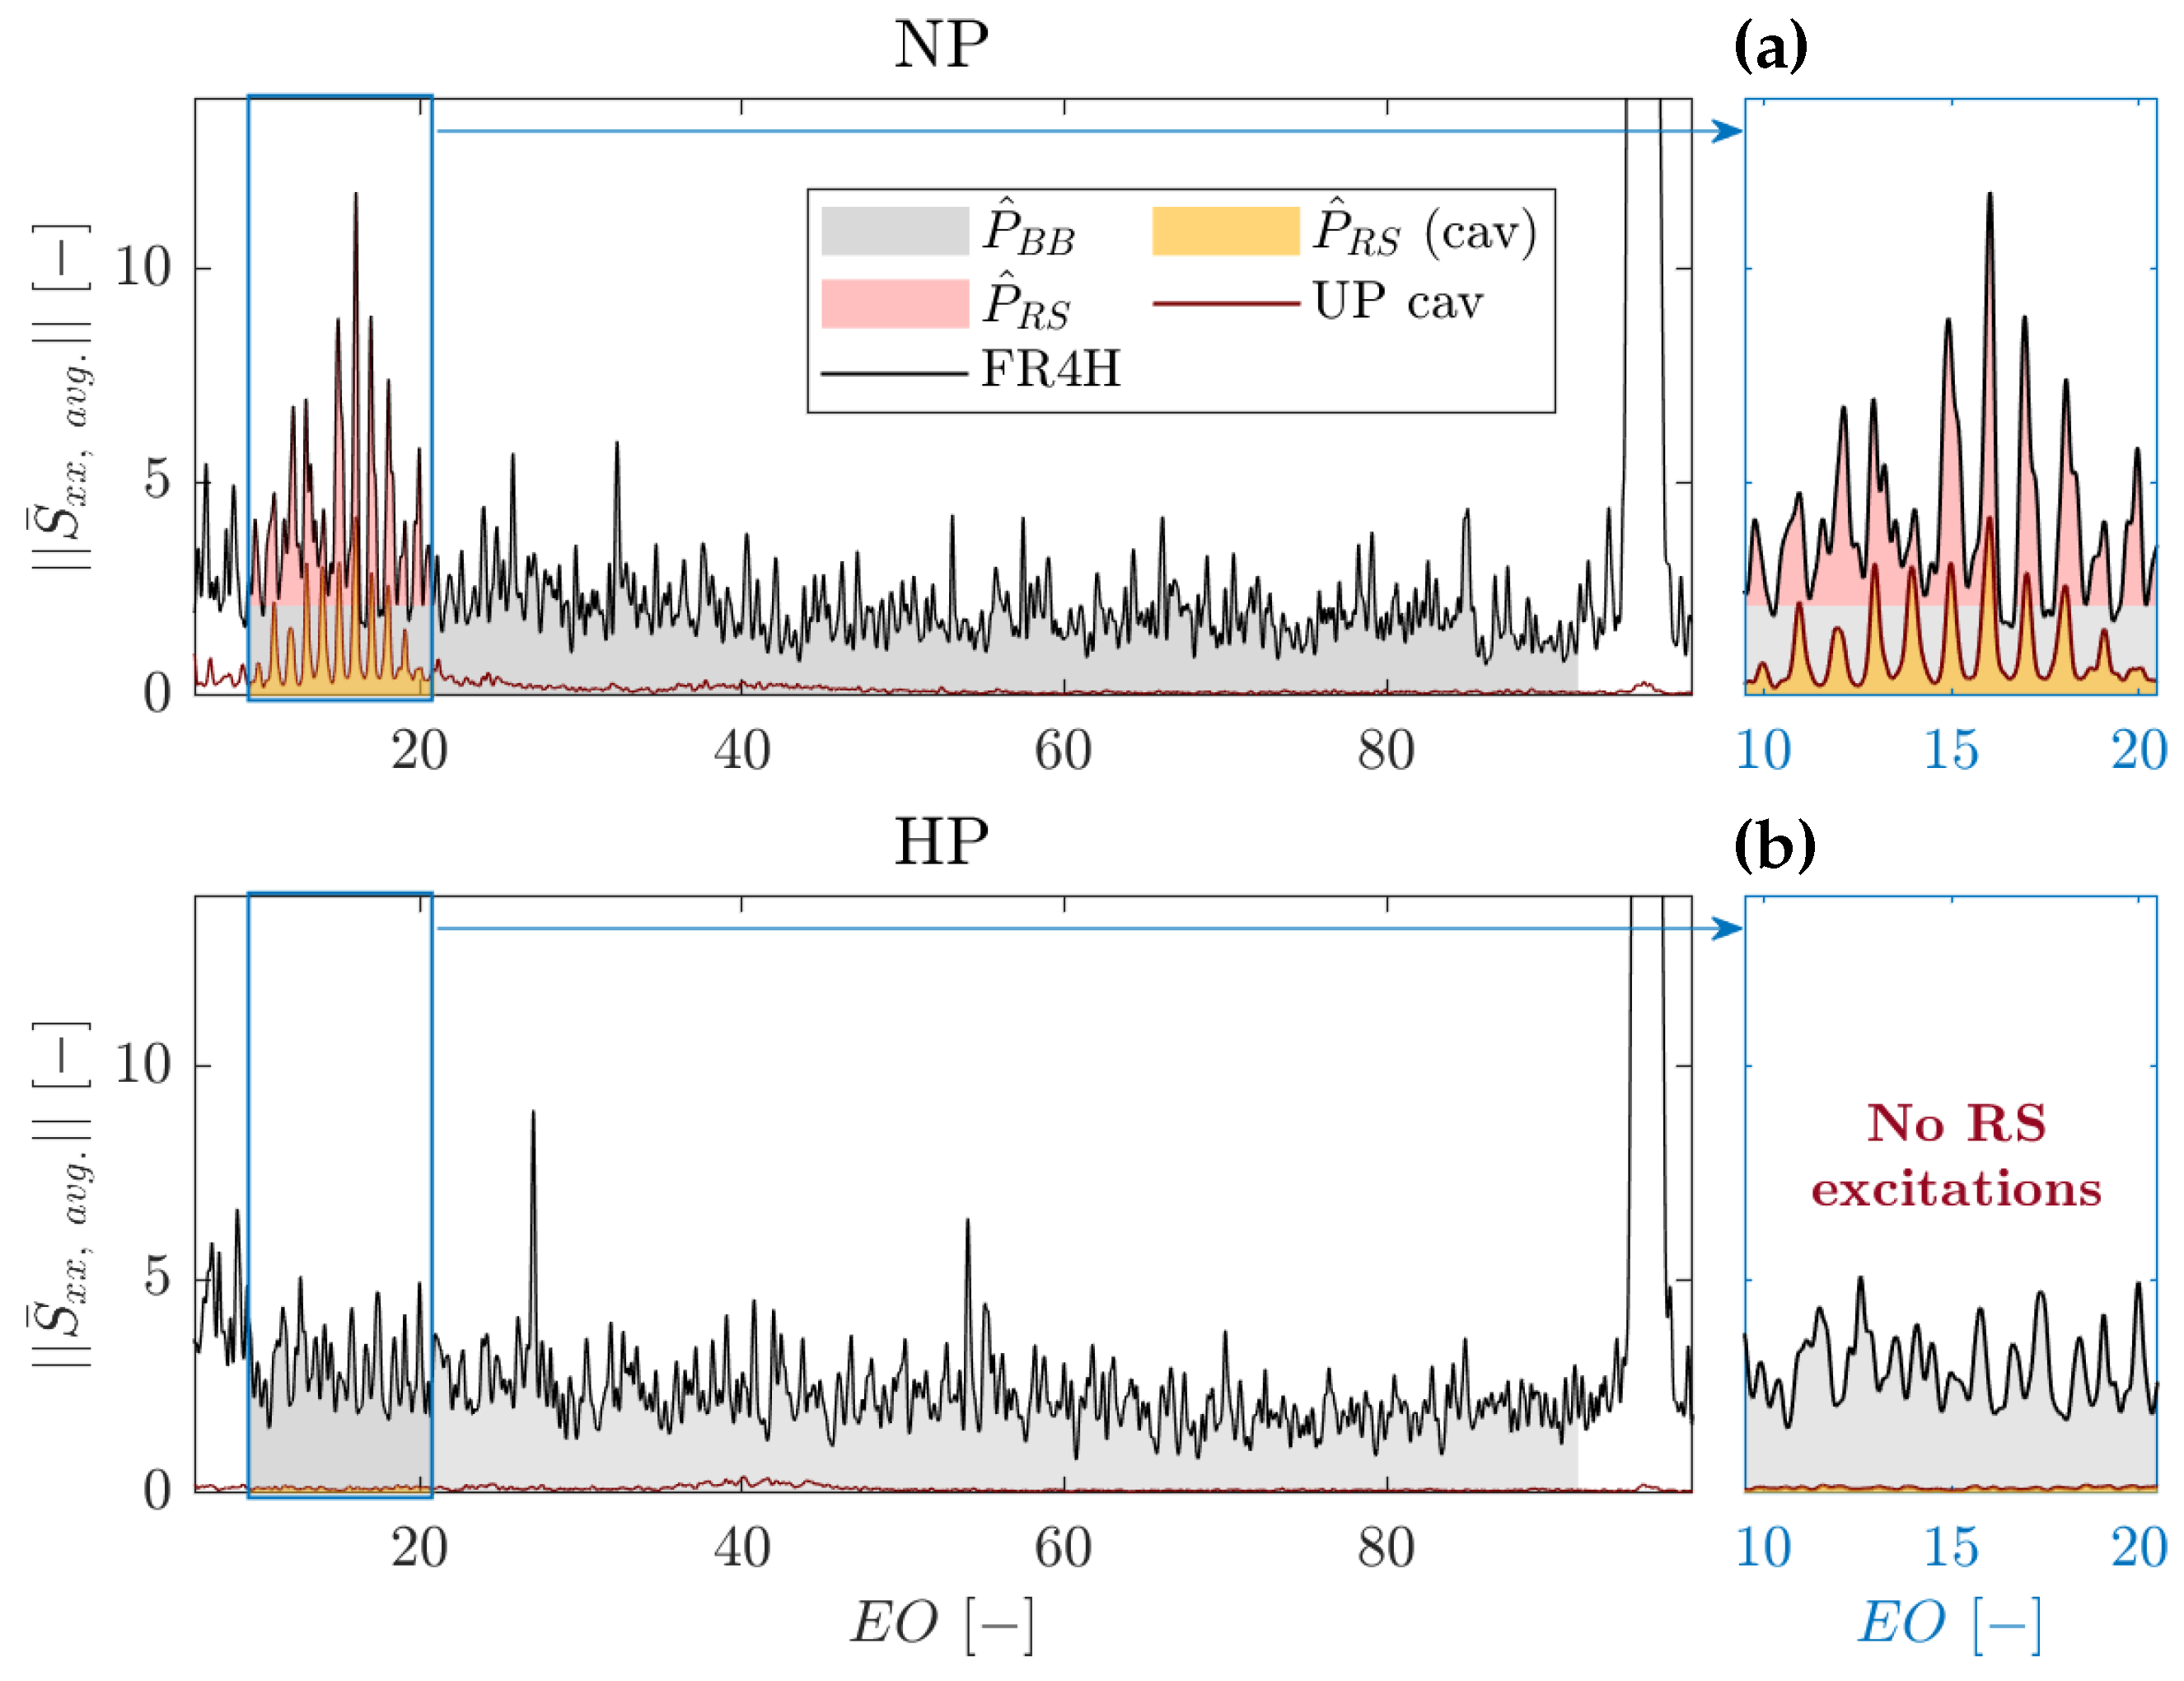
The investigation of rim-seal instabilities is performed at the three measurement locations of the upstream purge cavity. This analysis covers the two purge conditions (NP and ZP) under which these instabilities manifest. The HP case is excluded as it does not exhibit significant rim-seal instabilities. CPSD and cross-correlation methods are applied to the upper lip measurements to determine and compare their accuracy. Concurrently, the behavior of the rim-seal instability is examined, and the insights gained are used to optimize the implementation of both procedures. Finally, the nature of the rim-seal instabilities is discussed in view of existing literature.
4.2.1. Frequency-Domain Analysis
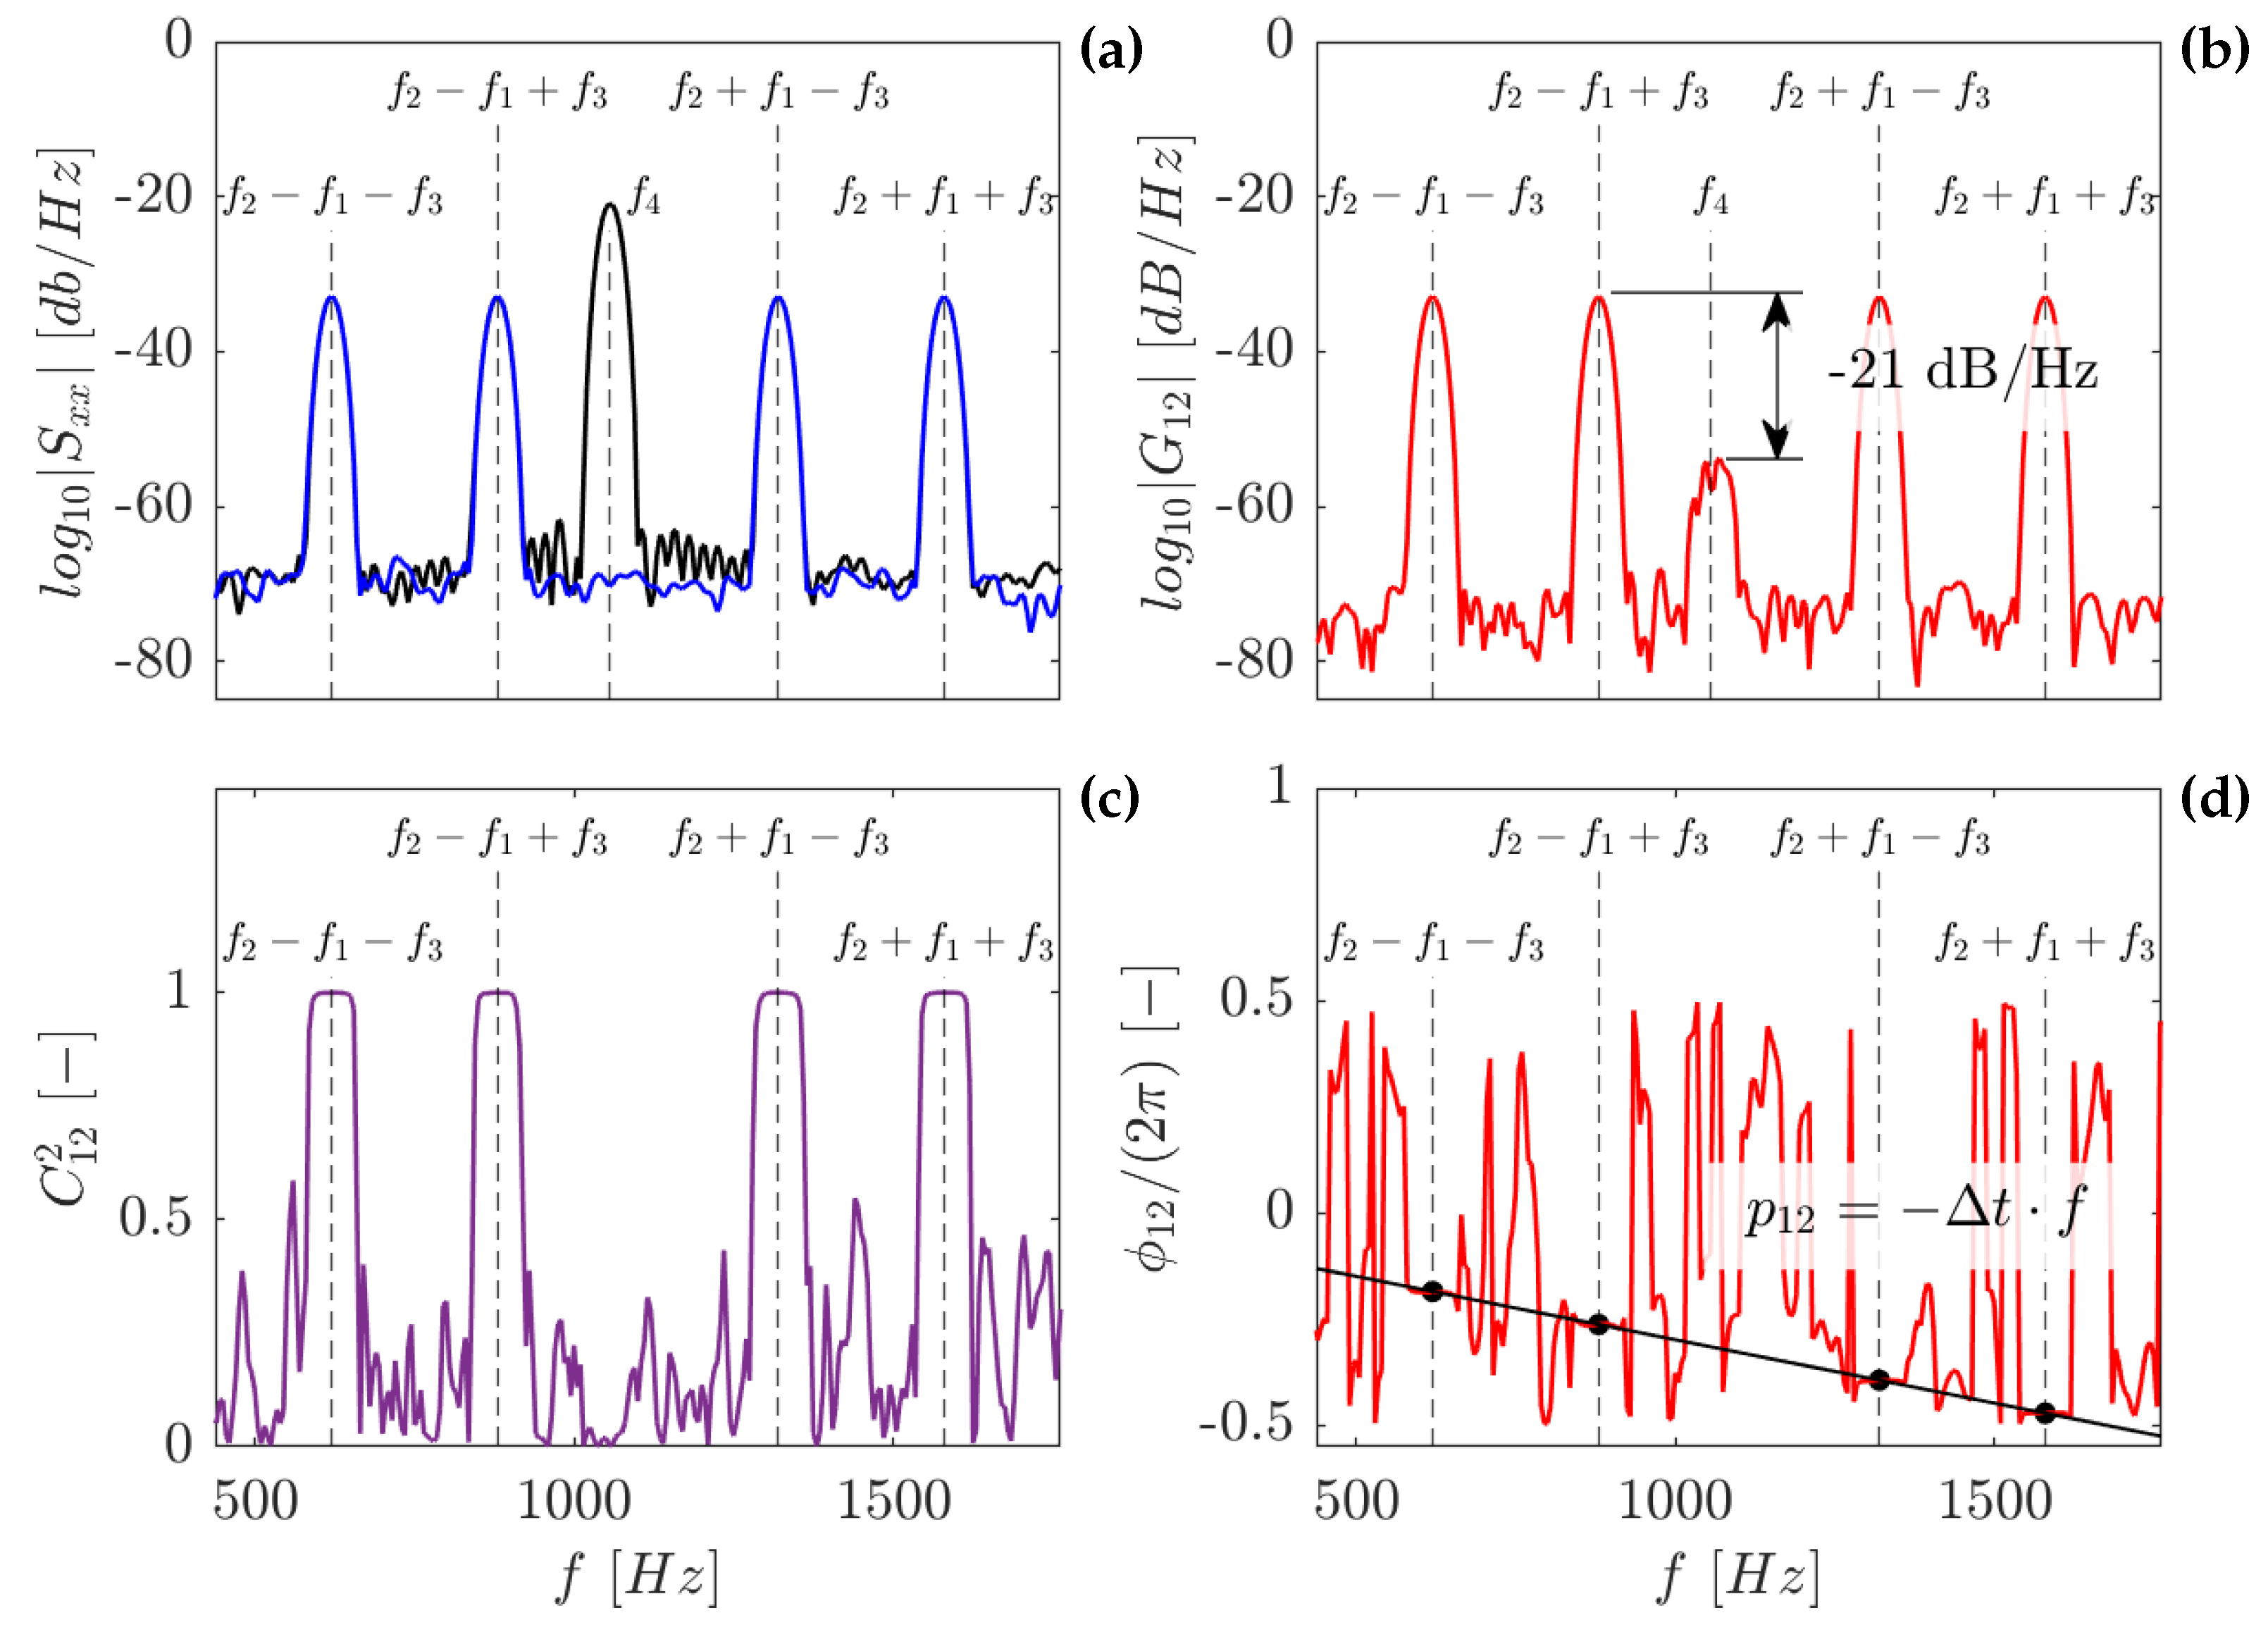
Figure 9 show modulus and phase of the CPSD distribution computed between two sensors on the upper lip for a single turbine test. The CPSD, similarly to the PSD, is highly repeatable between different sensor combinations. This is true for all tests. Therefore, the plots in
Figure 9 are representative of a test under nominal purge conditions.
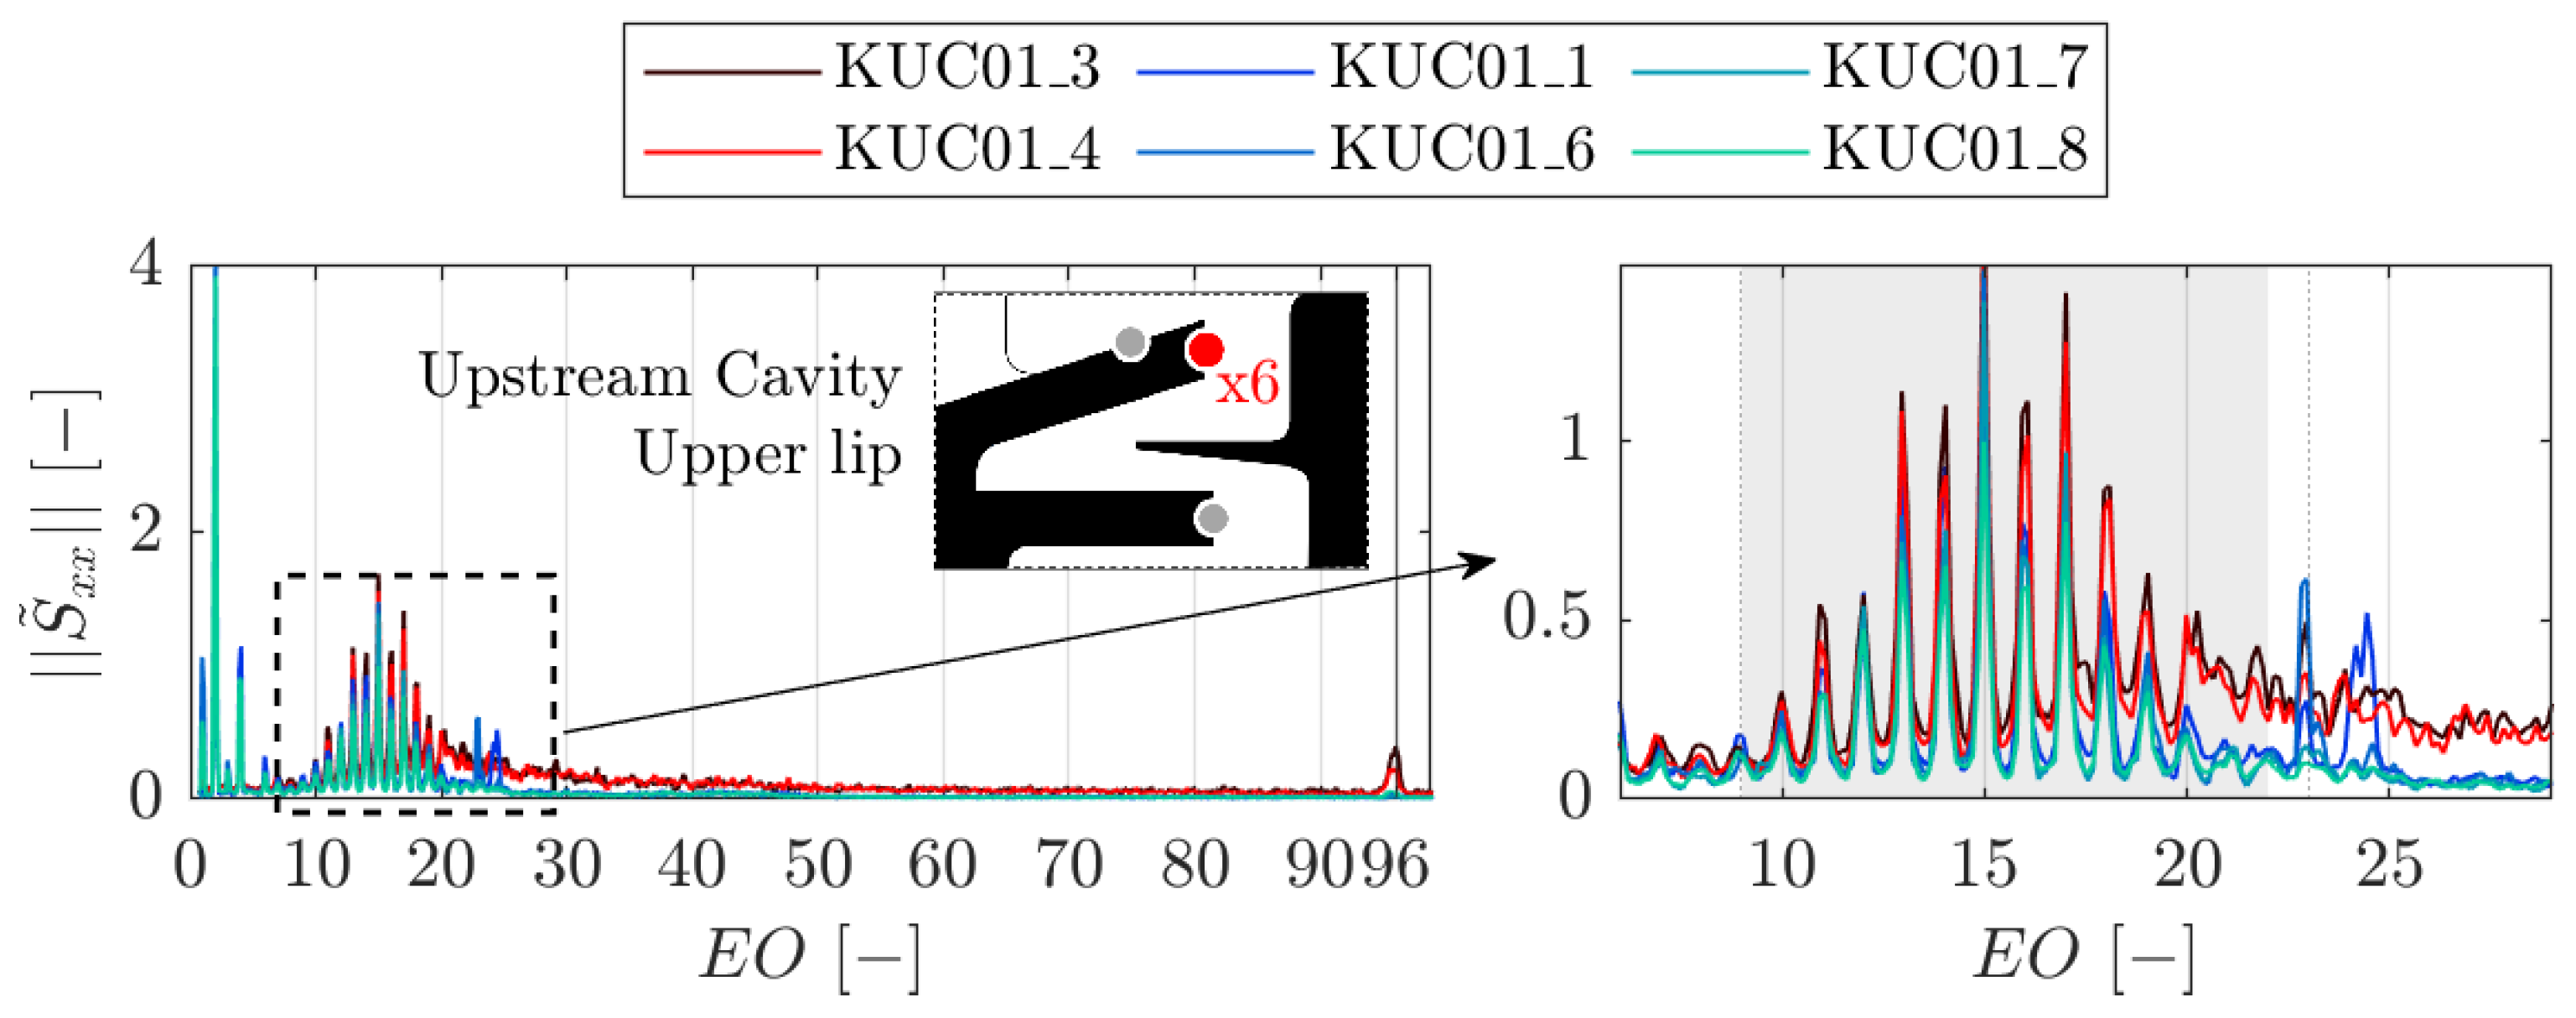
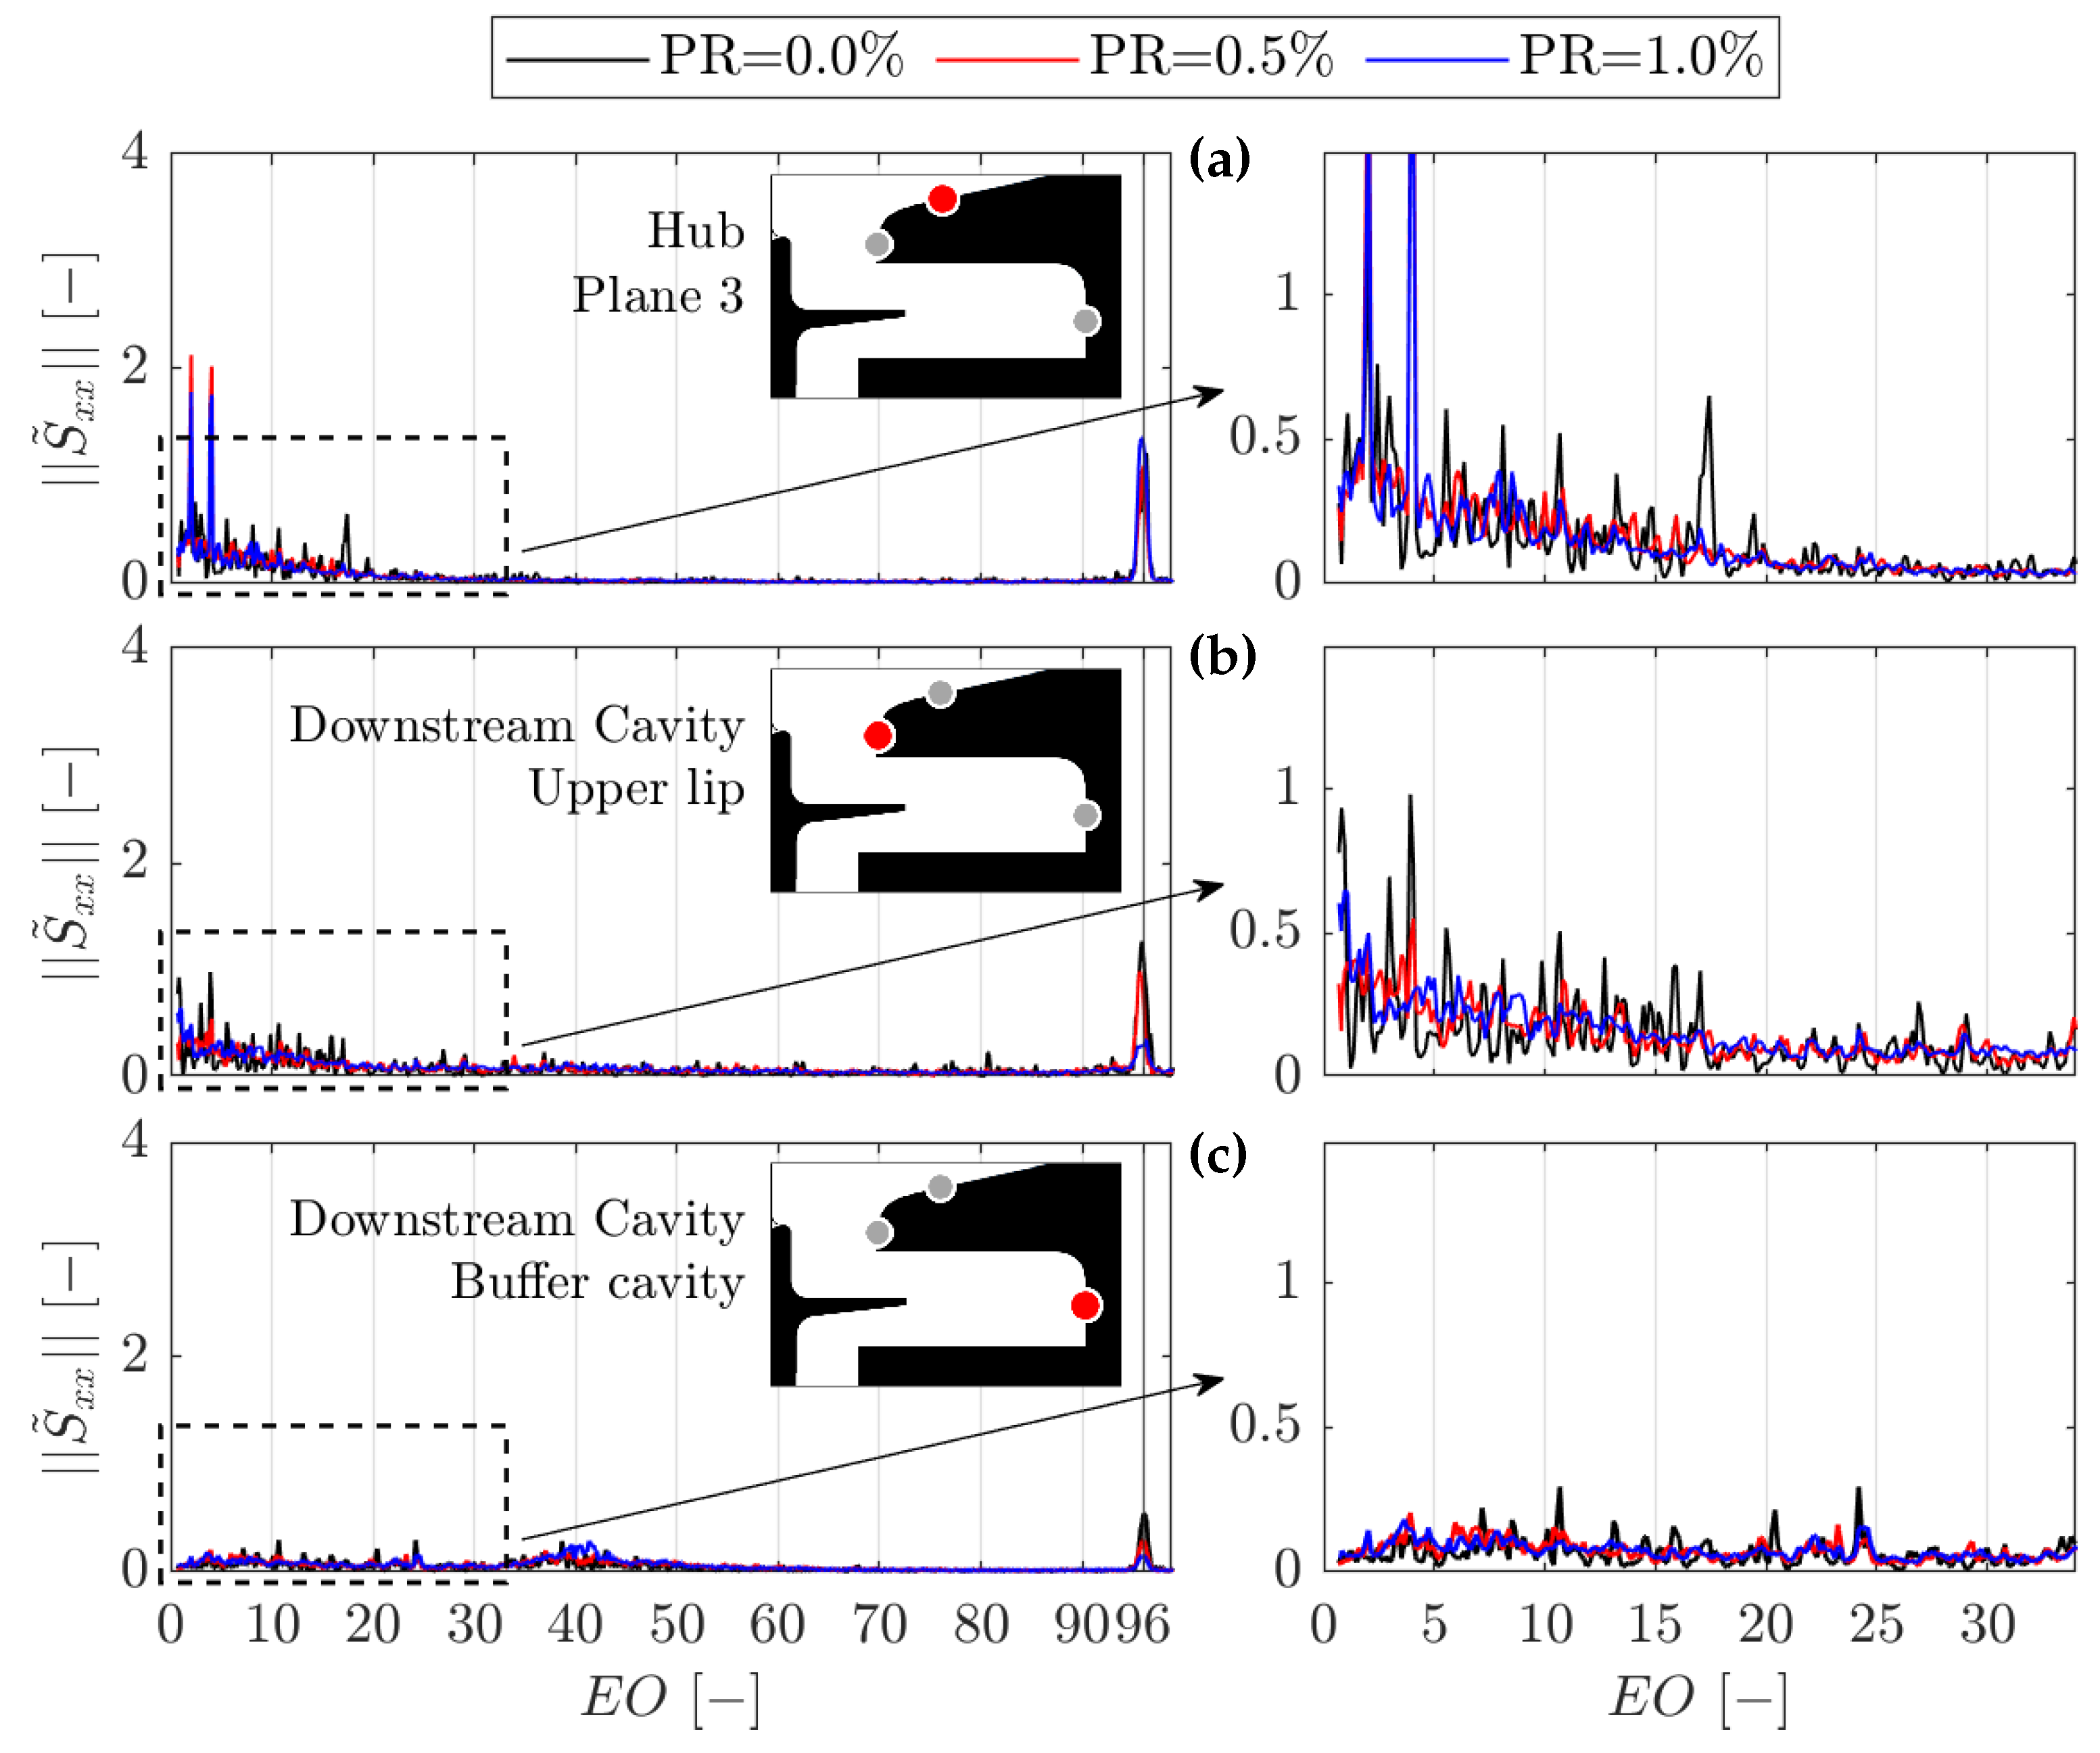
The modulus reveals a reduced number of peaks compared to the average spectra in
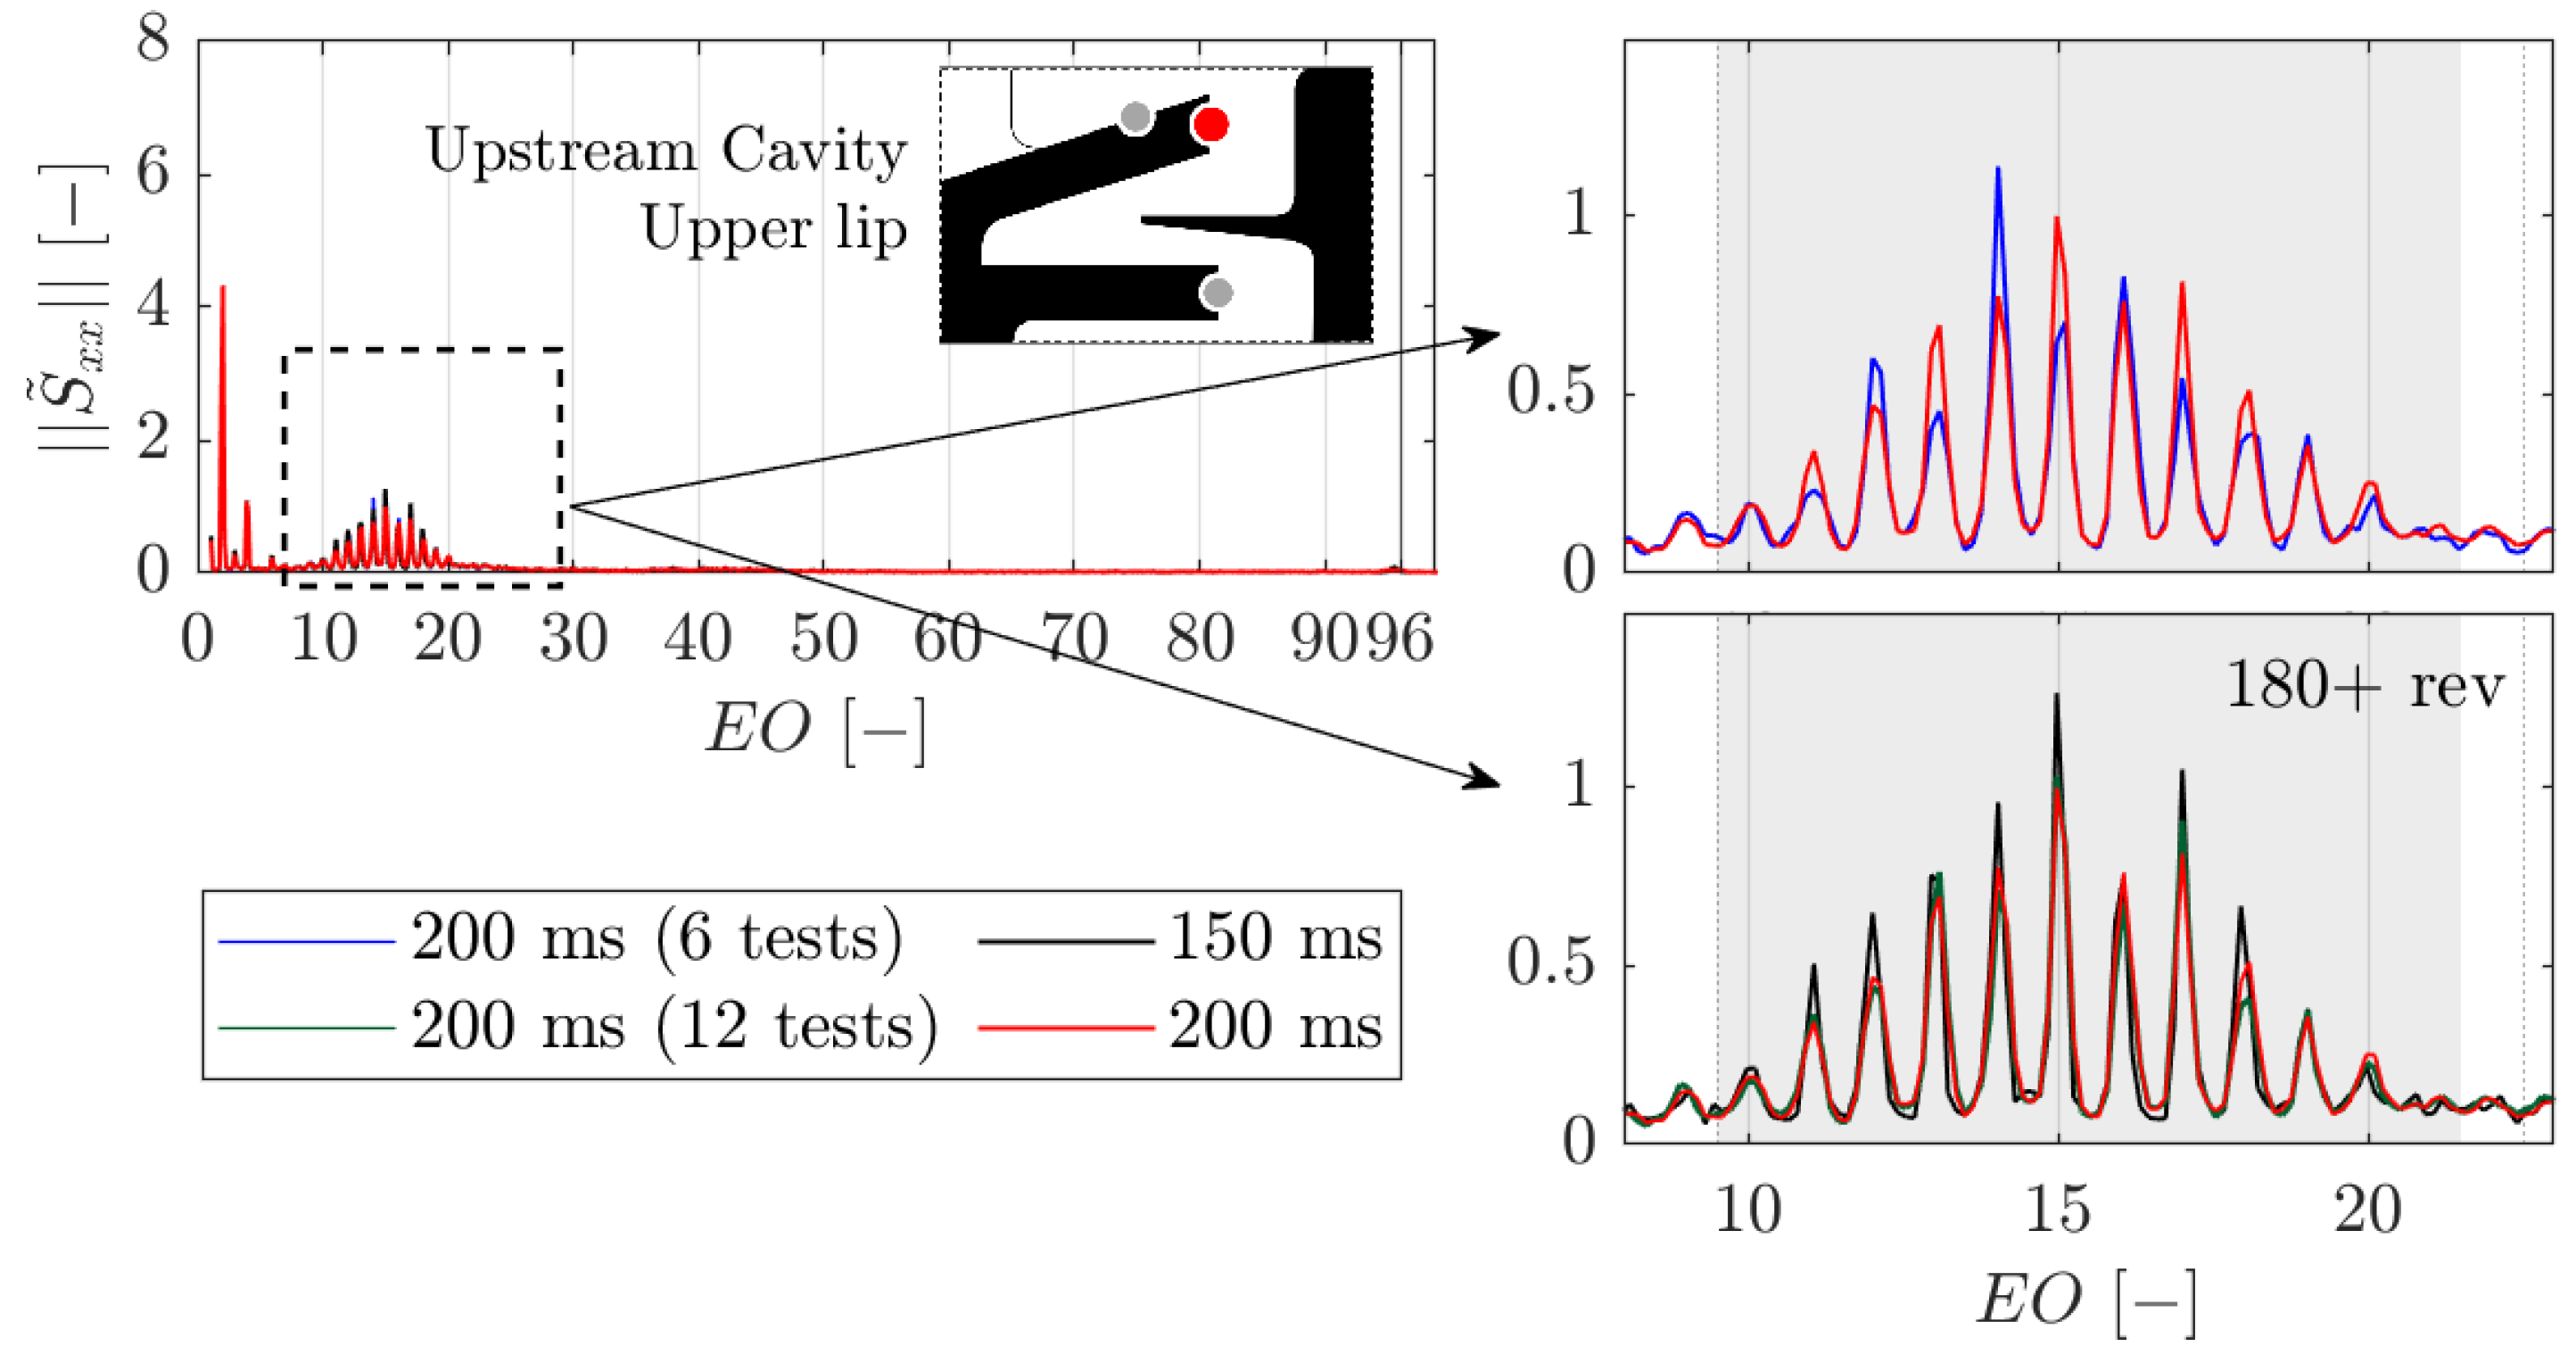
Figure 8. This observation is confirmed by the PSD distributions of the two sensors, as shown in
Figure 10d. When present, the peaks appear at the same locations as in the average PSD distributions in
Figure 8, indicating consistency. This explains why the average PSD distribution is influenced by the number of revolutions (i.e., tests) considered.
In
Figure 9b the phase is aligned at the locations of the strongest peaks (red markers), hinting at a scenario similar to the synthetic example (
Figure 5d). This suggests that each state of the unsteady modes is rotating at the same speed, as the pressure fluctuation requires the same time interval (
) to travel from position 1 to position 2.
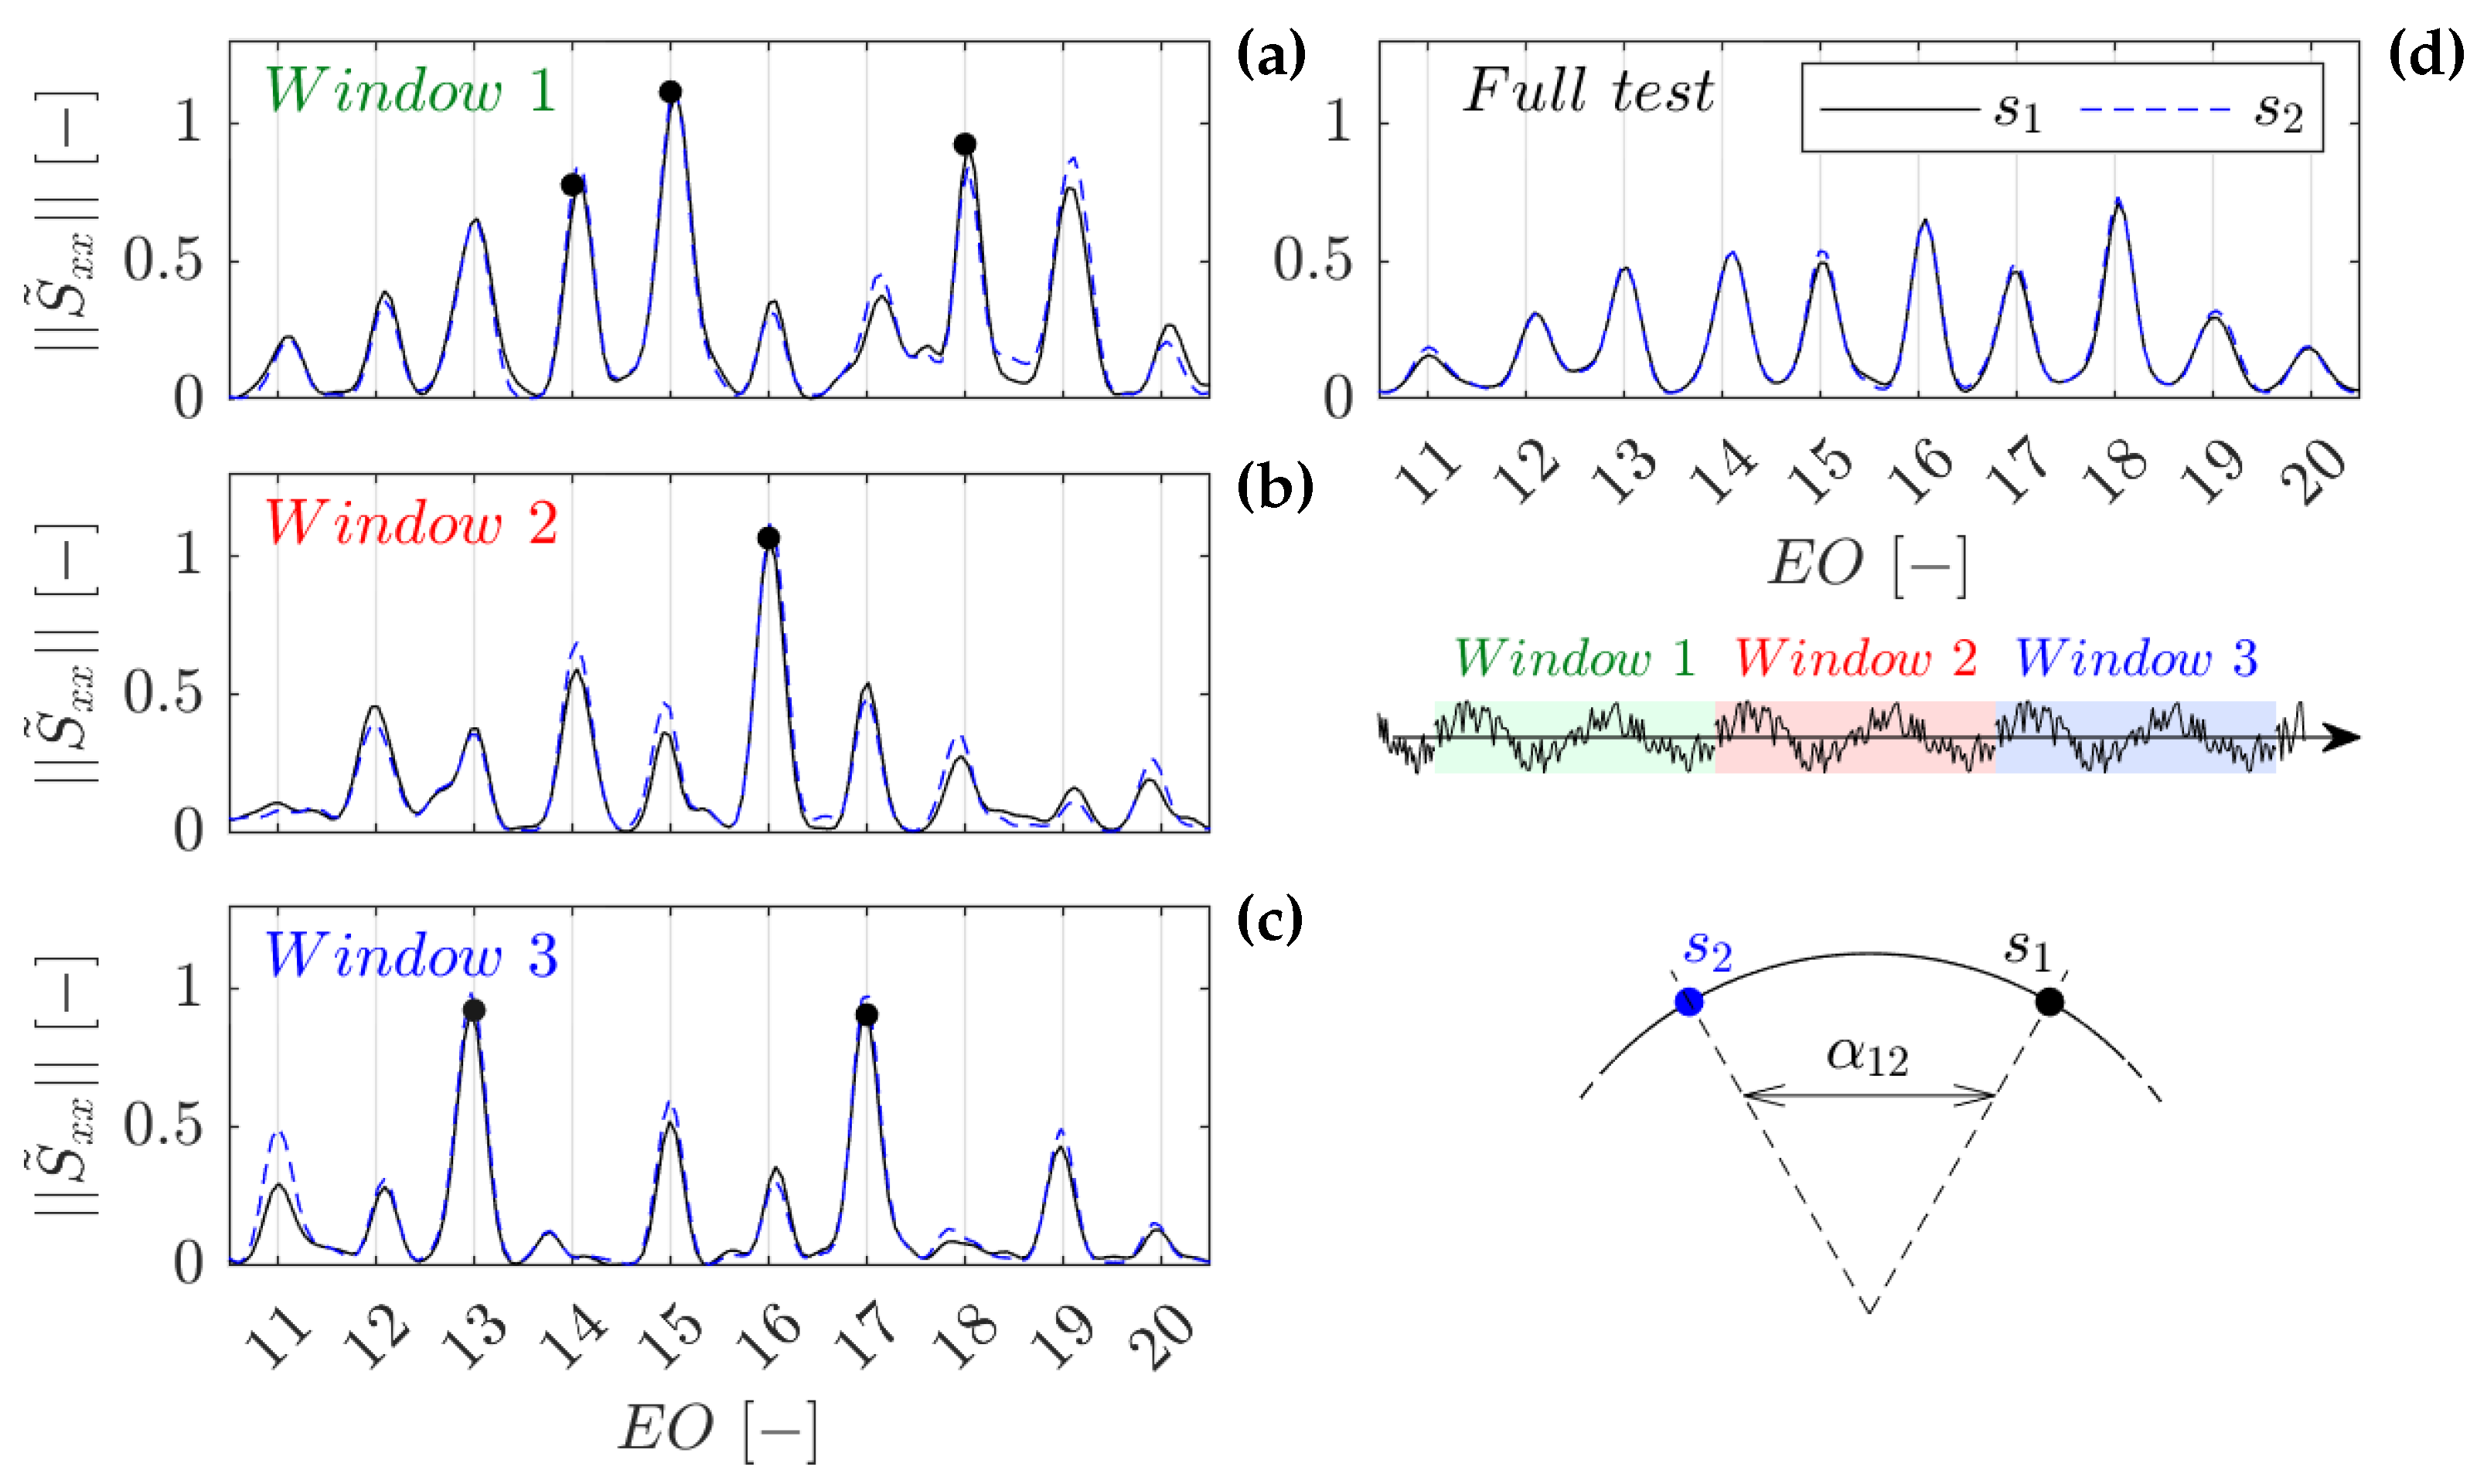
Further insight can be gained by examining the evolution of the PSD distributions in
Figure 10a–c, generated by splitting the testing time into three sub-windows. As indicated by the black dots, the number and location of the peaks change, suggesting that the state of the instability is evolving during the test. Despite this, the total power of the structure remains constant for the duration of the test. This quantity can be computed by integrating the PSD over the range of rim-seal instability. An analysis including all available tests (not presented for brevity) shows that most sub-windows remain within ± 15% from the mean for each sensor. This is consistent with the results of the study on the asymptotic behavior of the mean PSD distribution.
This leads to the conclusion that the modes are not solely corotating; instead, they are manifestations of an evolving "structure," transitioning from one state (peak) to another.
Despite the evolution of the flow structure, the effect of sub-window size (i.e., number of revolutions) on the average PSD modulus and CPSD phase is less pronounced. In those cases, the reliability of the average distributions is mainly determined by the number of revolutions included in the averaging process. In fact, although the coherent structure changes over time, it is "stable" when looking at the frequency domain. There, each state (or mode) corresponds to a specific frequency and phase lag, determined by the number of lobes and the angular distance, respectively.
In the PSD, it is the power of the rim-seal instabilities that is maintained across the tests. Hence, the peaks in the average distribution will reflect not only the mode intensity but also its duration. This explain the difference in amplitude between the peaks in
Figure 10a–c, and in
Figure 10d. Ultimately, the strongest peaks will also be indicative of the most "stable" state of the rim-seal instability.
Differently, the CPSD phase is the result of averaging the signal’s portions where the mode is developed, with others where the mode is not found. In the latter, the phase is highly noisy for the reasons discussed when analyzing
Figure 5d, thus affecting the quality of the distribution. The employment of Welch’s estimator allows us to effectively reduce the impact of this source of error. However, a trade-off between frequency resolution and phase accuracy is still required to minimize the dispersion of the data.
This effect is recognizable in
Figure 9b, showing points not perfectly aligned with the phase law despite the clear presence of a trend. As a consequence, the reliability of the phase lag plots for each test is not sufficient to compute the modes characteristics with low uncertainty. This precludes the use of the CPSD methodology as presented for the BPF case. Furthermore, not all tests develop all the states of unsteadiness, hence limiting the use of this technique for a comprehensive analysis.
These impediments are overcome by reducing the window considered to detect the single-phase delay, by including all tests available in the computation of the phase law, and by interpolating the phase delay at the frequencies of the peak in the modulus. Reducing the window addresses the "averaging" effect issues, while also increasing the number of phase measurements performed per test. Considering all the tests increases the number of measurements, and reinforces the computation of the phase law by including all the possible states of the instability. Lastly, the definition of an average phase law facilitates the determination of a singular and robust value of the phase lag for each . This minimizes noise effects, increases the accuracy, and enables the computation of the instability characteristics for each detected state.
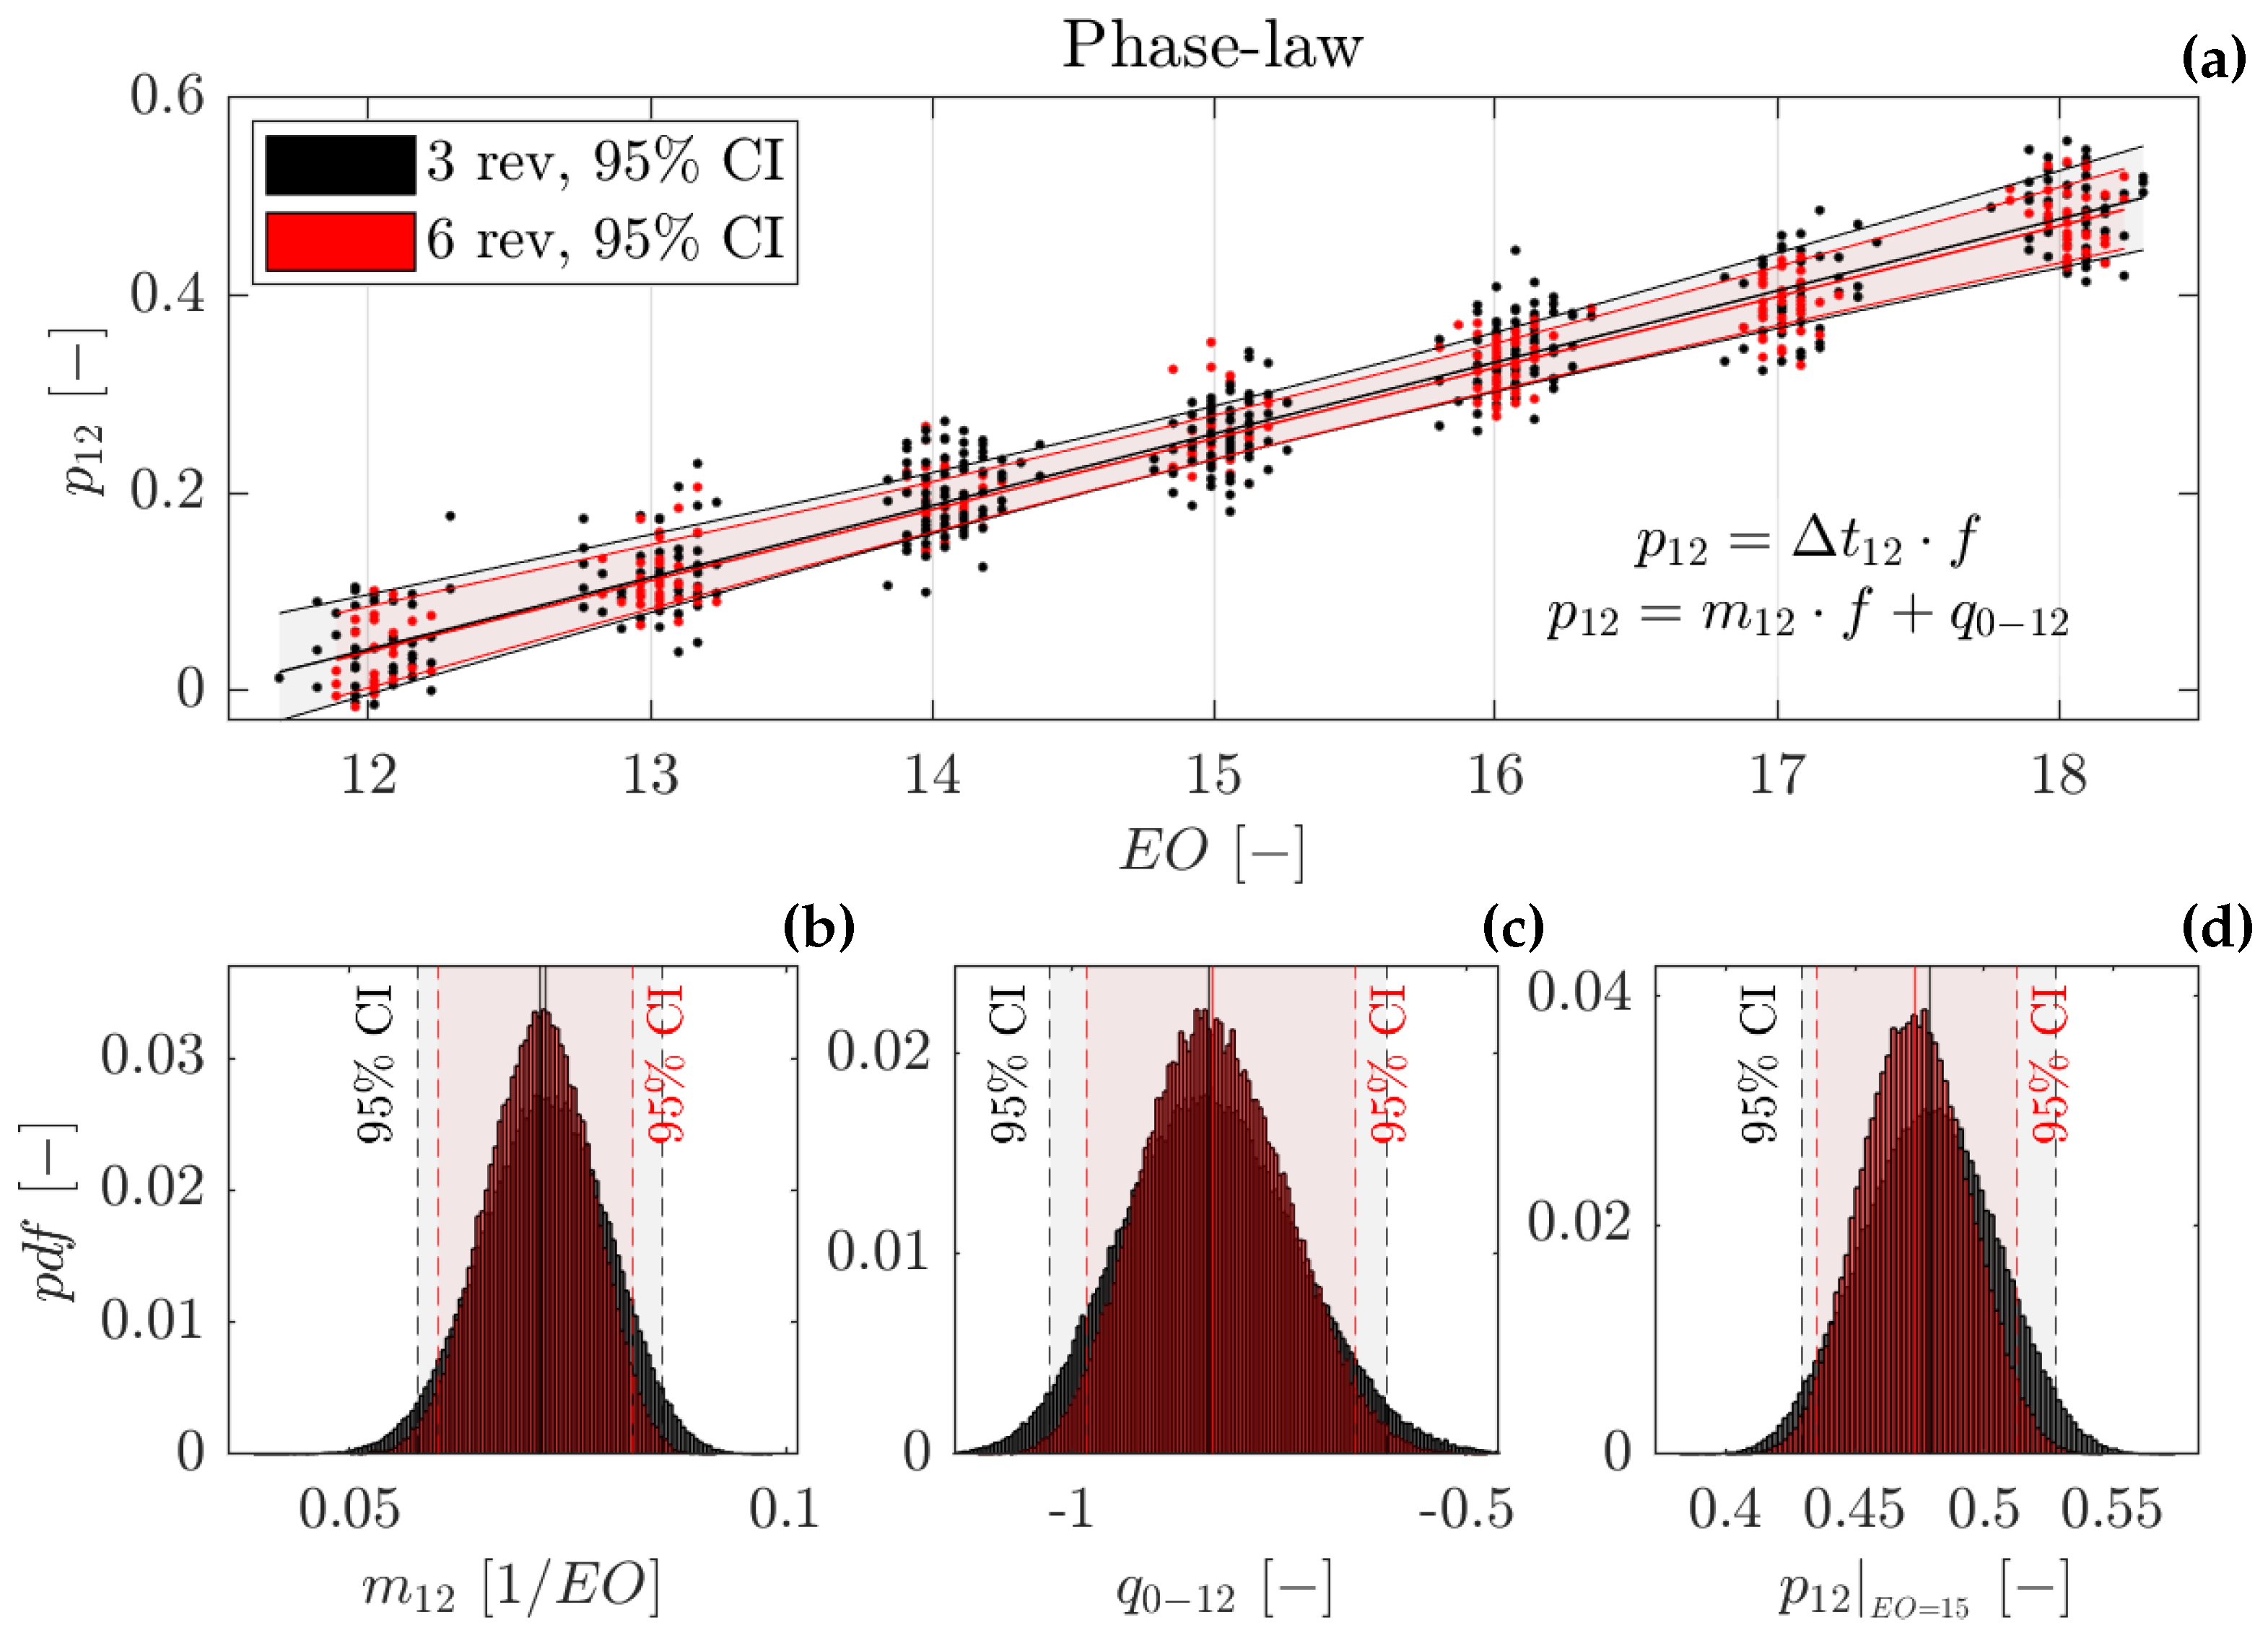
Figure 11a shows an example of the CPSD phase at the location of the modulus peaks, measured between two sensors for all available tests. The figure displays the results when sub-windows long three (black) and six (red) revolutions are considered for the computation of the phase law. The six-revolutions dataset is populated including the first seven most energetic peaks while imposing a minimum cut-off equal to 20% of the maximum peak. The seven peaks are selected considering the characteristics of the average PSD distributions, while the cut-off is applied to maintain only the most energetic peaks and to exclude peaks induced by spectral leakage. Then, the dataset is further filtered to maintain, for each combination of sensors, the most energetic 60 percentile of the peaks. The three-revolutions dataset is generated considering the five most energetic peaks (20% cut-off), also filtered to keep the 60 percentile. These parameters are selected to minimize the uncertainty of the measurements while maintaining a sufficiently representative database.
Figure 11b,c show the probability density function (pdf) of the phase law regression coefficients computed applying a bootstrap technique [
38]. The bootstrapping is performed by randomly extracting a single-phase measurement from each of the seven clusters of points. Each cluster is a representation of one state of the instability. All clusters are rotating at the same velocity and are subject to the same phase law, which should be determined to guarantee the alignment at each position. Therefore, a point from each cluster is included to maximize the "information" and reinforce the computation of the best regression. This approach improves the robustness of the regression and minimizes the uncertainty of the phase law for the central (and more stable/energetic) positions of the instability band. This is highlighted in
Figure 11a by the 95% CI limits of the phase law.
Figure 11d shows the pdf computed using the bootstrap dataset at the most energetic peak (15 EO).
The comparison between the six- and three-revolution datasets shows a higher data dispersion in the latter, translated into a broader probability function distribution of the phase law. This is consistent with the loss of frequency resolution due to the window size reduction. Nevertheless, the effect on the mean value remains negligible, demonstrating the robustness of the methodology. For longer windows, the precision of the measurements does not improve significantly. However, the size of the dataset decreases, affecting the reliability of the bootstrapping technique. Therefore, the six-revolution window was selected for the data analysis.
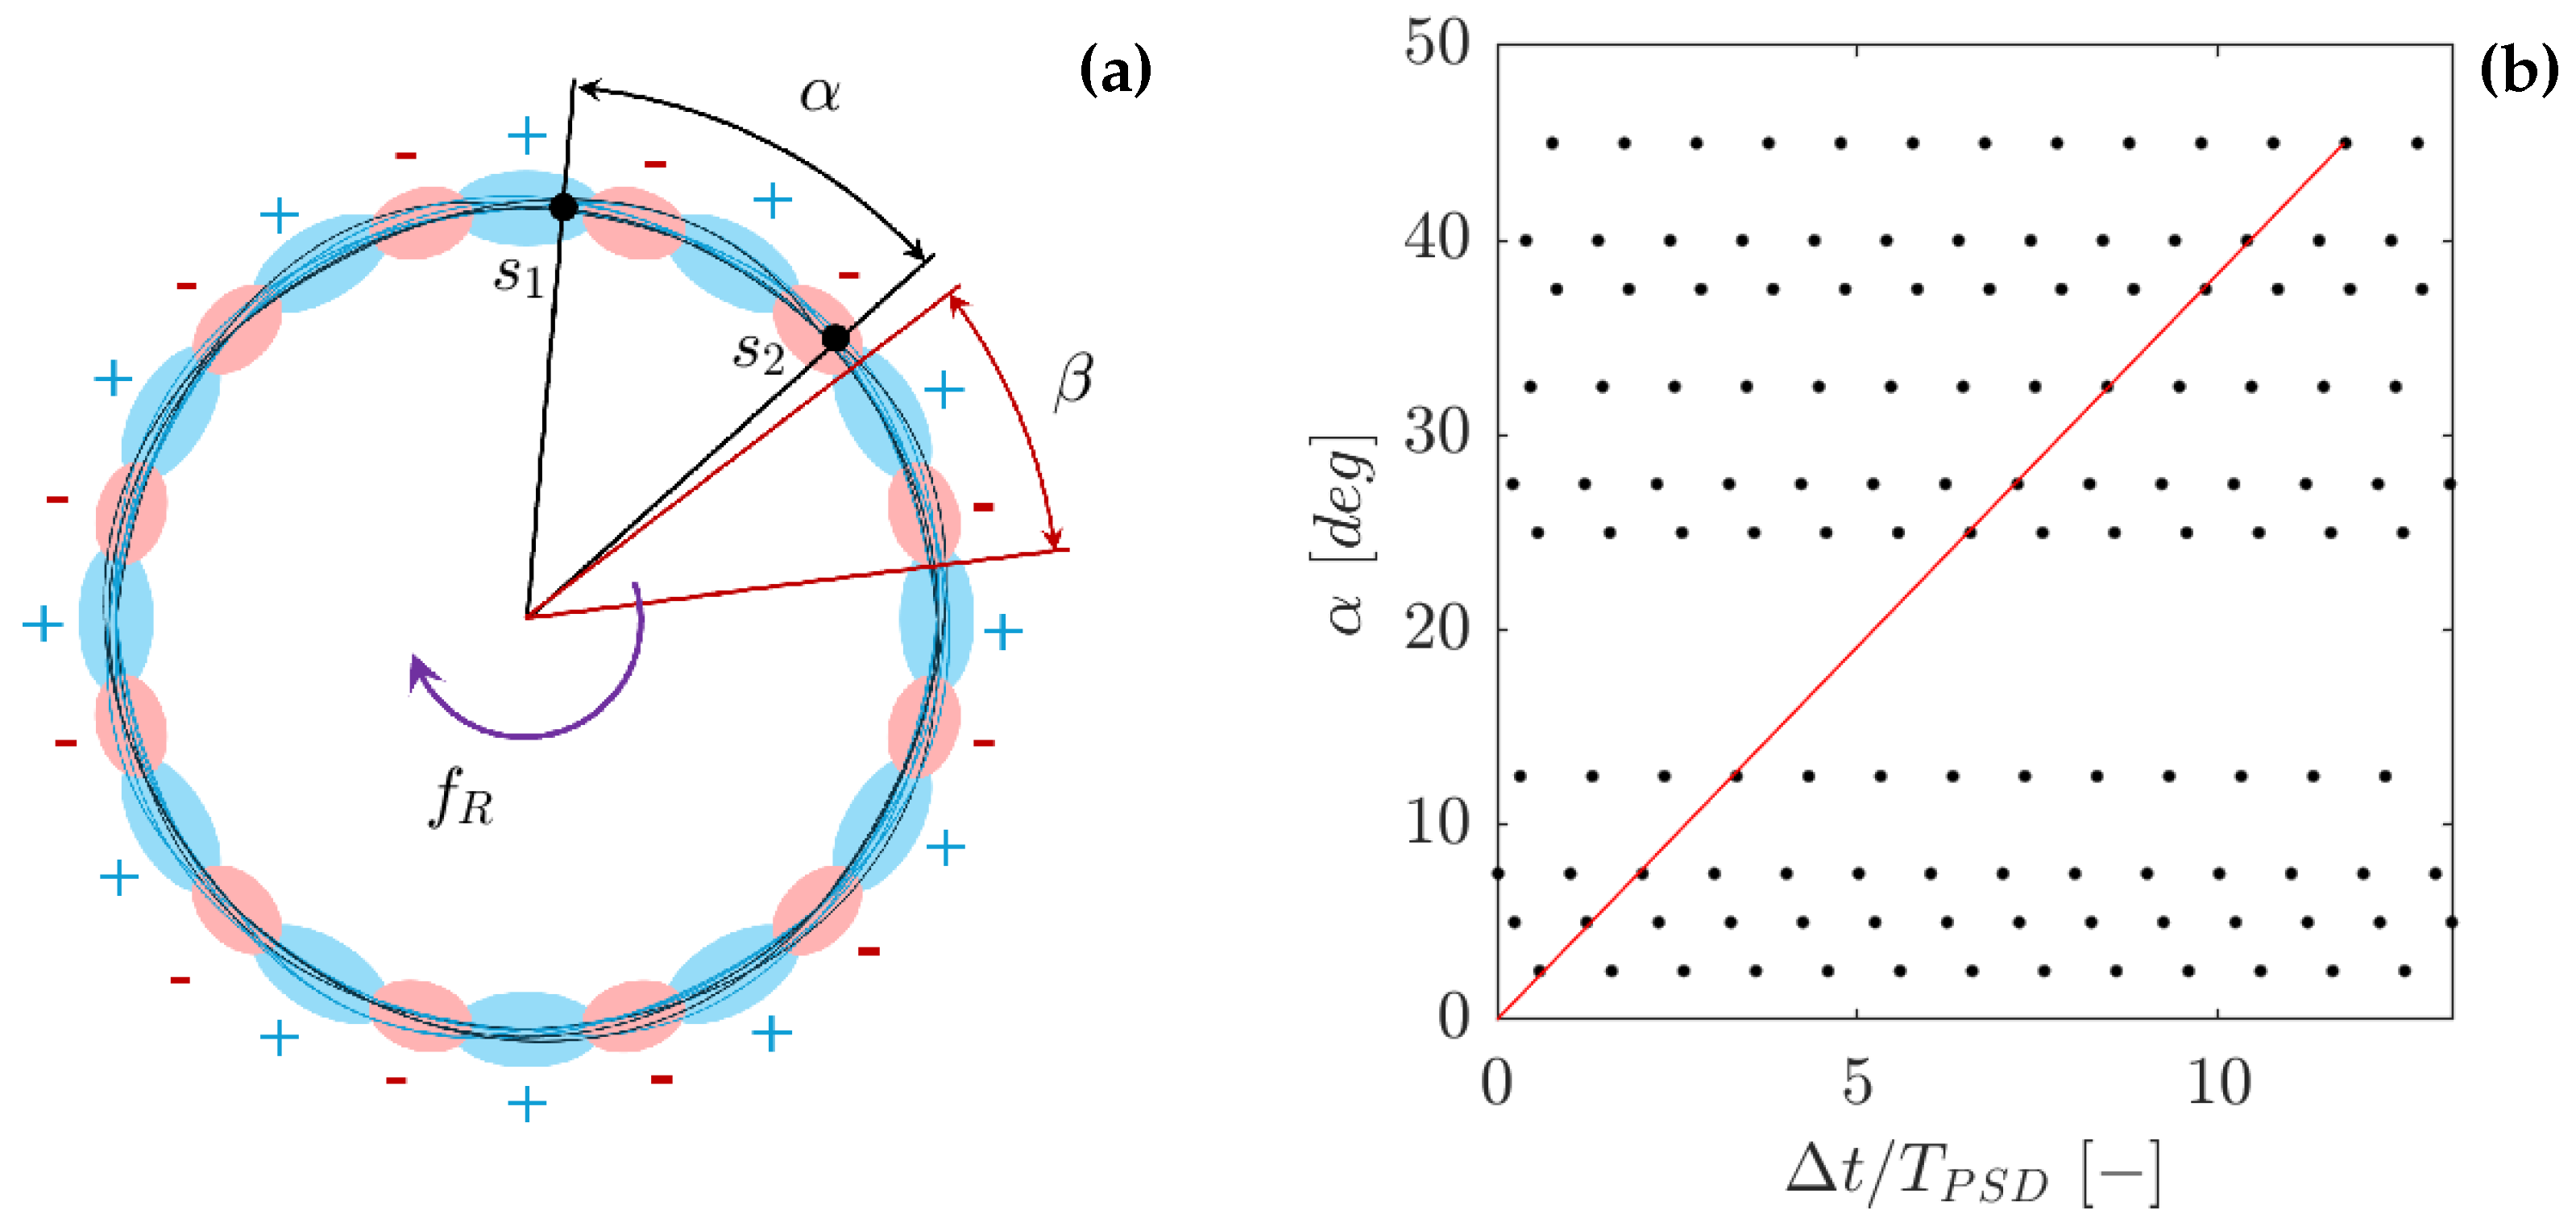
Once the phase law and the phase pdf are determined, the phase lag plot can be populated following the same procedure described for
Figure 6a. This is repeated for each state of the instability, and
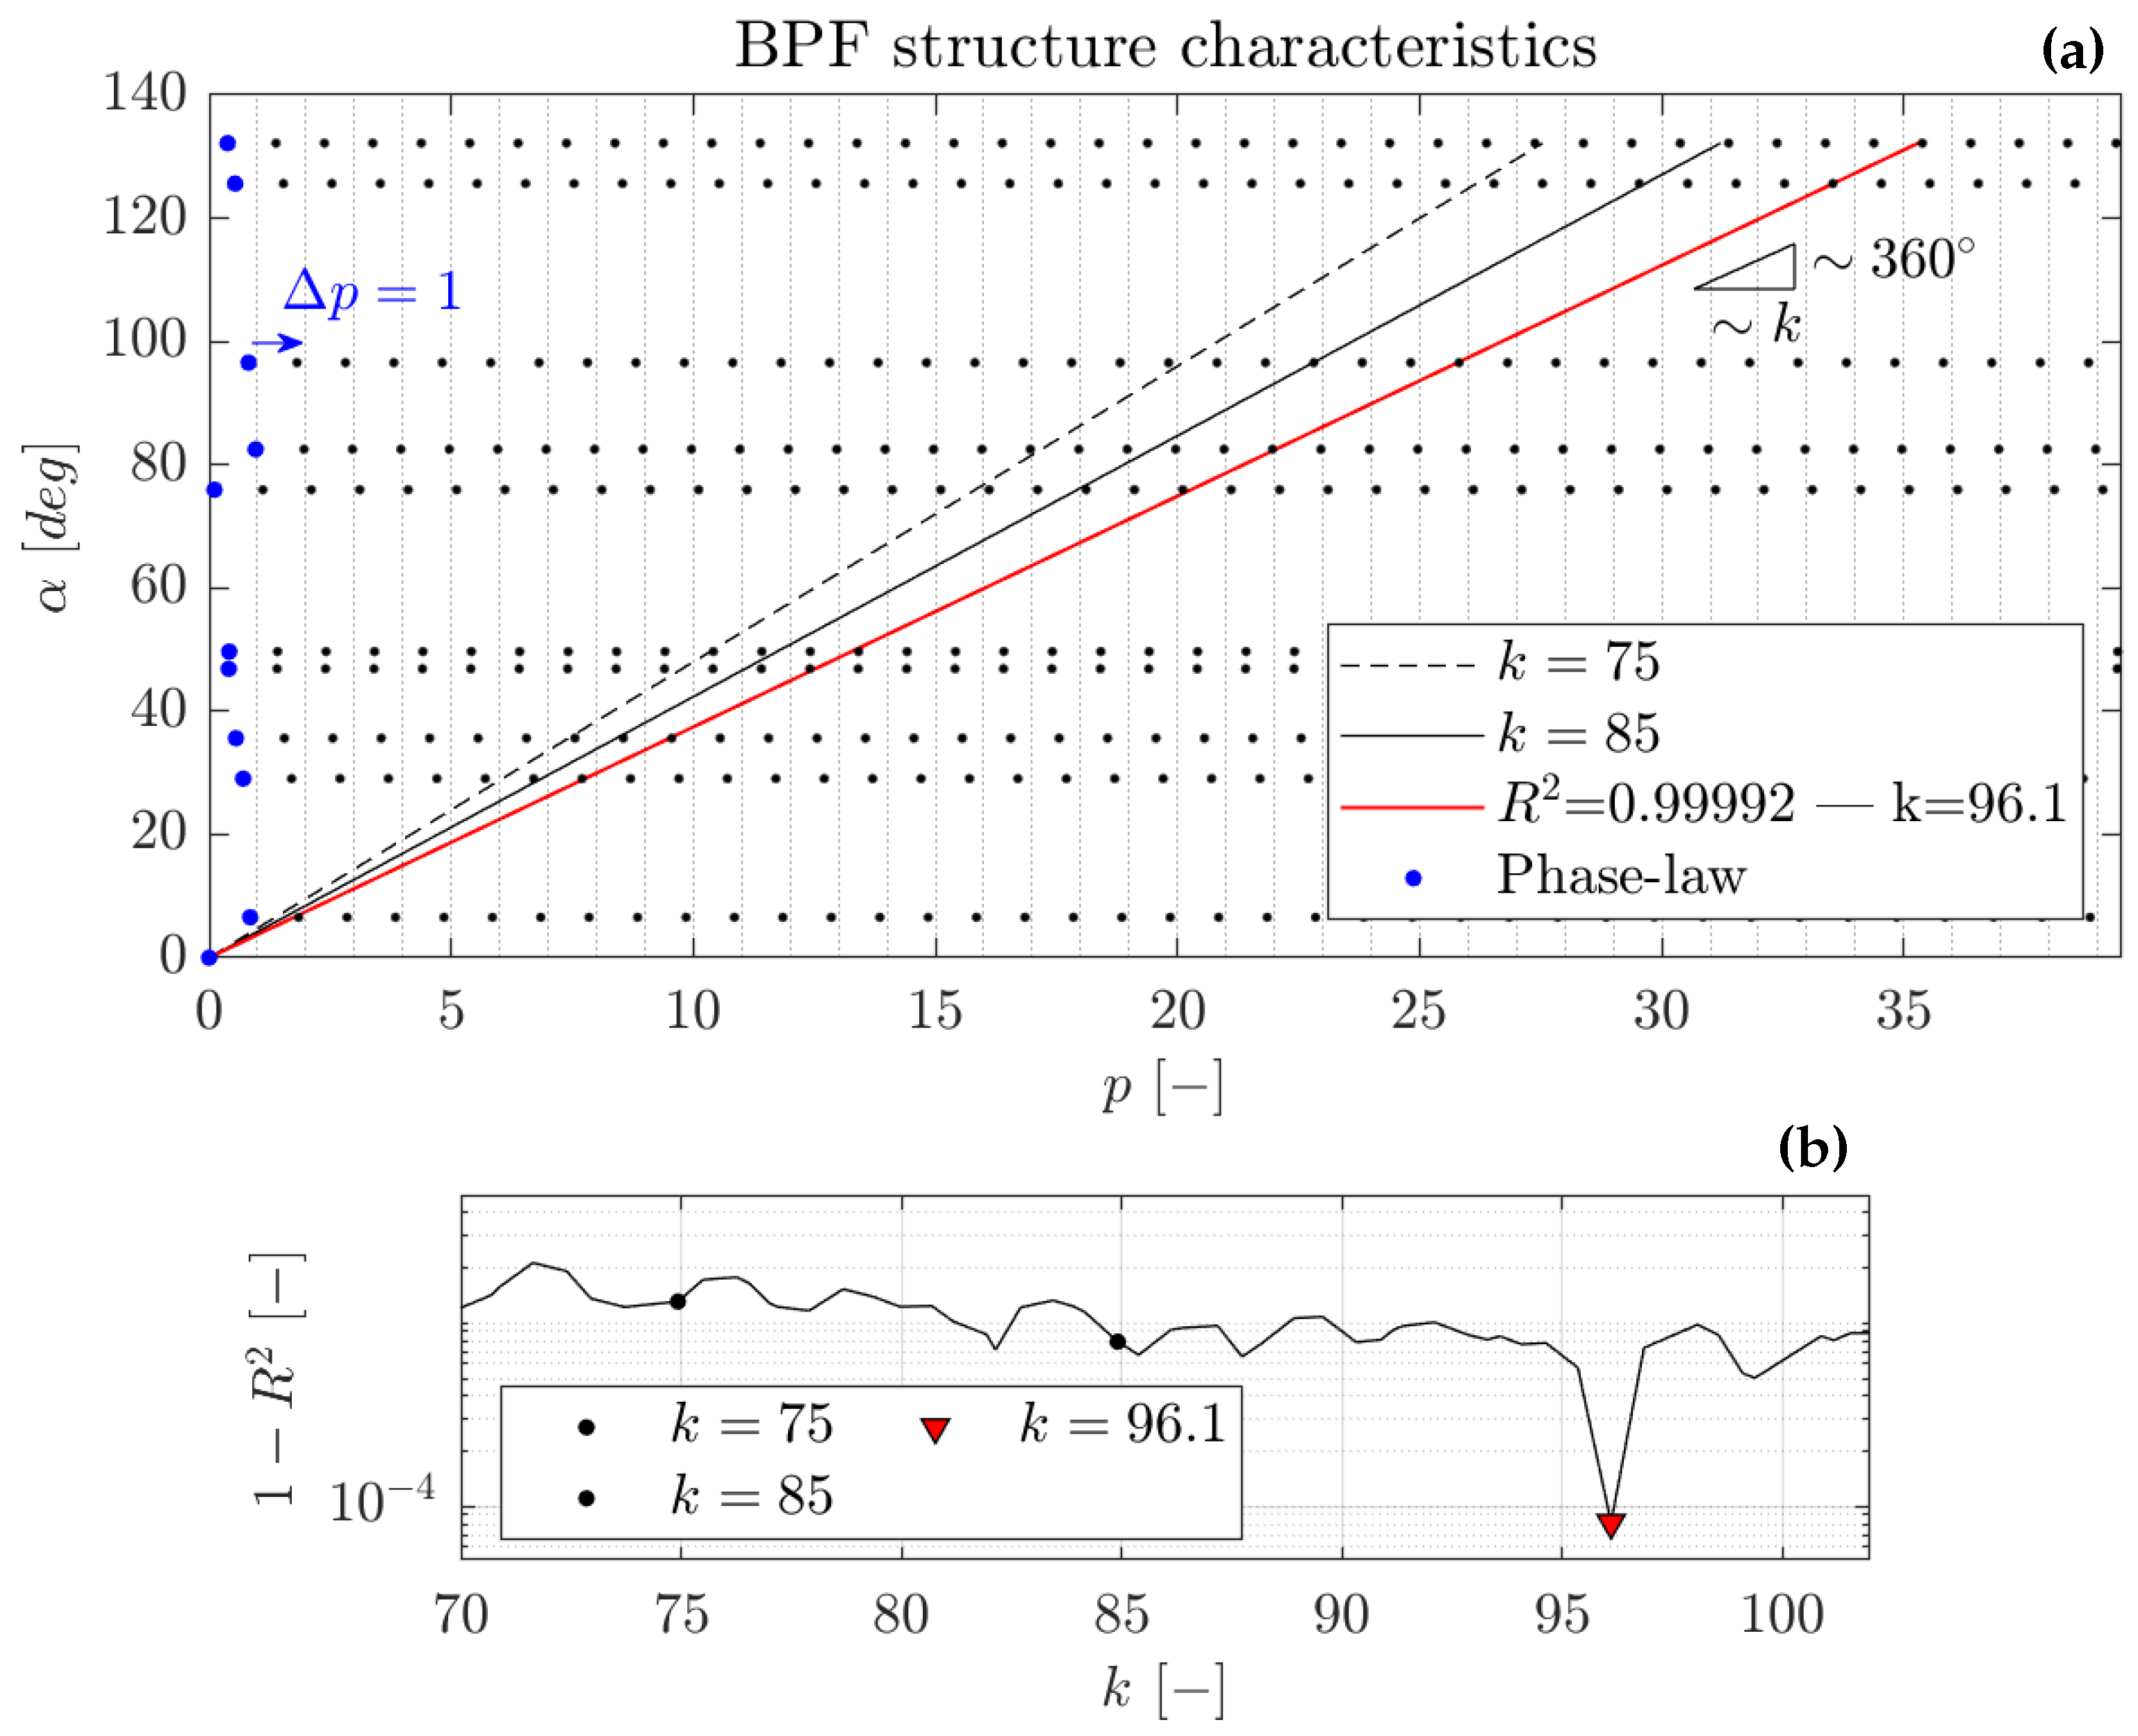
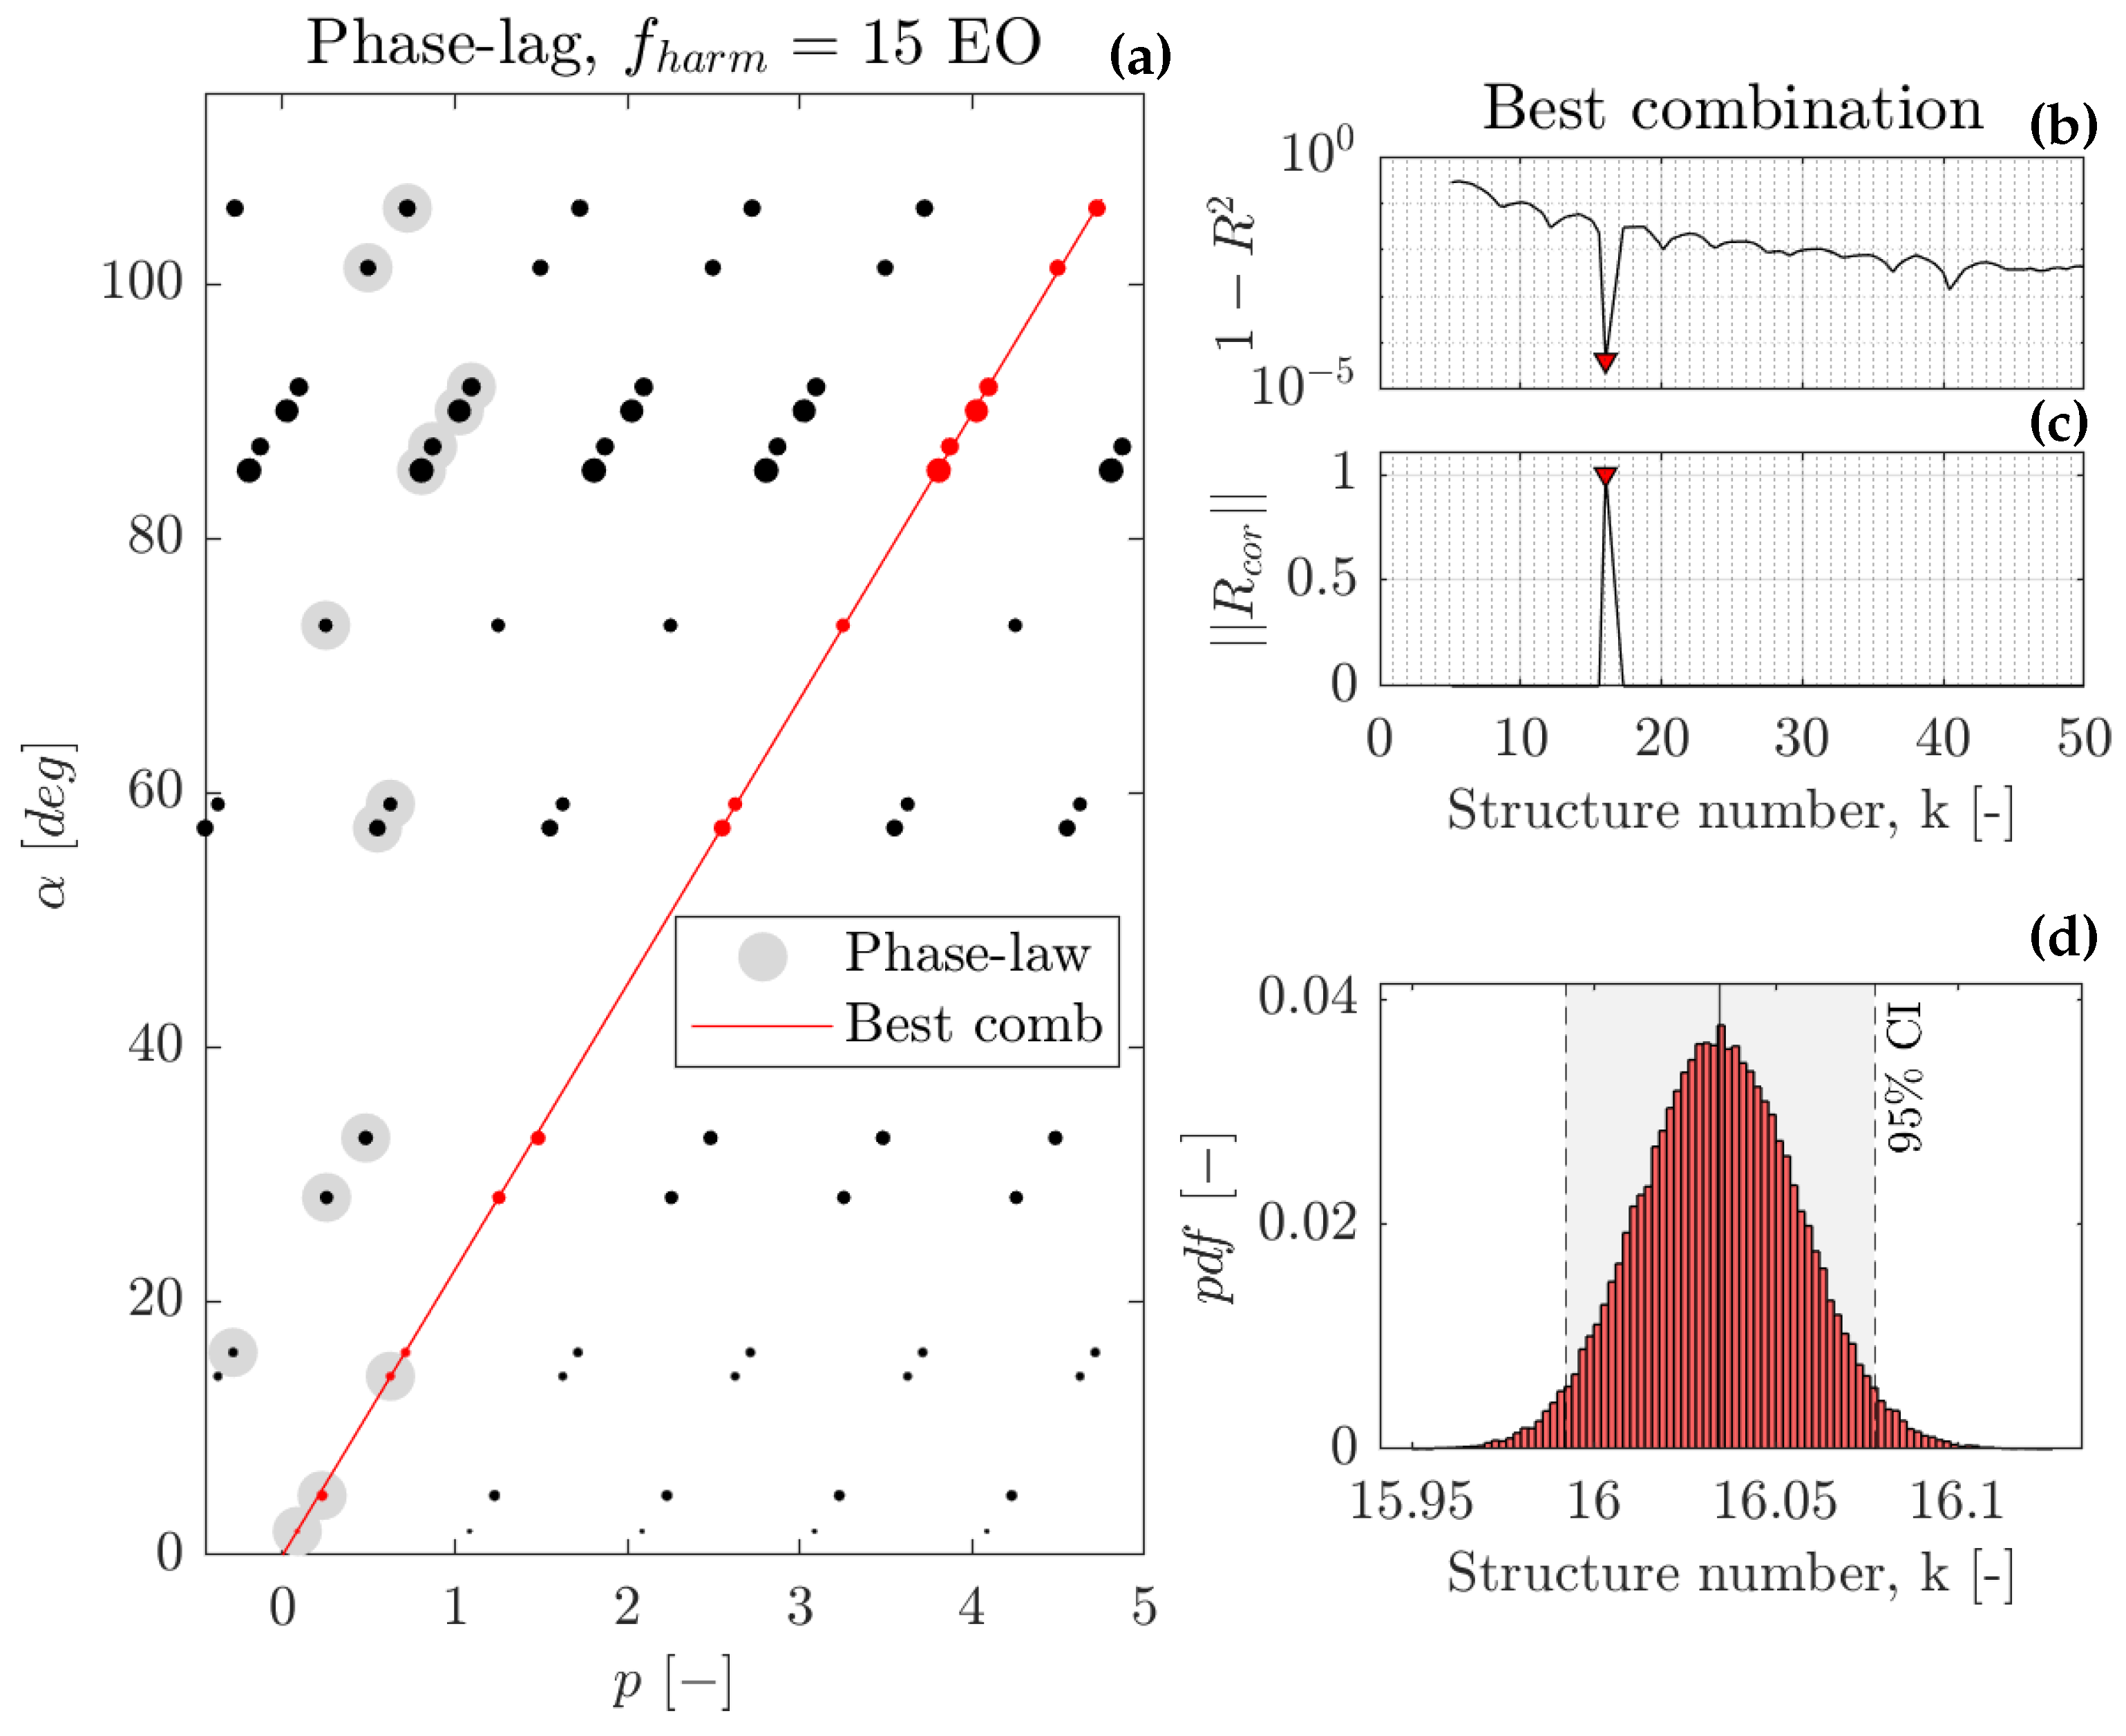
Figure 12a shows the plot for the 15 EO peak. The size of black and red points are representative of the phase lag pdf (95% CI). Notably, the dispersion is not magnified when populating the plot, since each phase delay is, by definition, equally spaced by
. The original points determined by the phase law are highlighted in grey, while red identifies the combination that minimizes the regression error.
The best combination is determined following the same procedure illustrated for
Figure 6. Due to the definition of
, for a dataset in which the angular spacing is not uniform, the search for the best combination leads to favorite lines with lower slopes. This trend is already recognizable in
Figure 12b, where
slowly decreases for higher lobes count (i.e., lower slopes). To solve this issue, the
quantity is defined as it follows:
, differently from
, does not reward combinations spreading over a wide range of phase delay (i.e., low slope’s regressions) and clearly isolate the best combination as displayed in
Figure 12c. Ultimately, this definition should be preferred for "extreme" applications where sensors are organized in groups separated by a wide angle.
Once the optimum combination is identified, a new bootstrap procedure is applied to identify the probability density function of the slope. The bootstrap sampling is performed considering the pdf obtained from the phase laws, including one sample for each angular distance since all points should be aligned. Similarly to the phase law, this leads to and increase of the regression robustness and minimizes the uncertainty of the slope measurement.
Figure 12d displays the result expressed in terms of lobes count,
. The narrowness of the pdf highlights the precision of the measurement, which identifies 16 lobes rotating at 94% of the rotor speed.
4.2.2. CPSD Method Performance
The performance of the CPSD methodology is benchmarked against the cross-correlation method, revised to maximize its accuracy for this application.
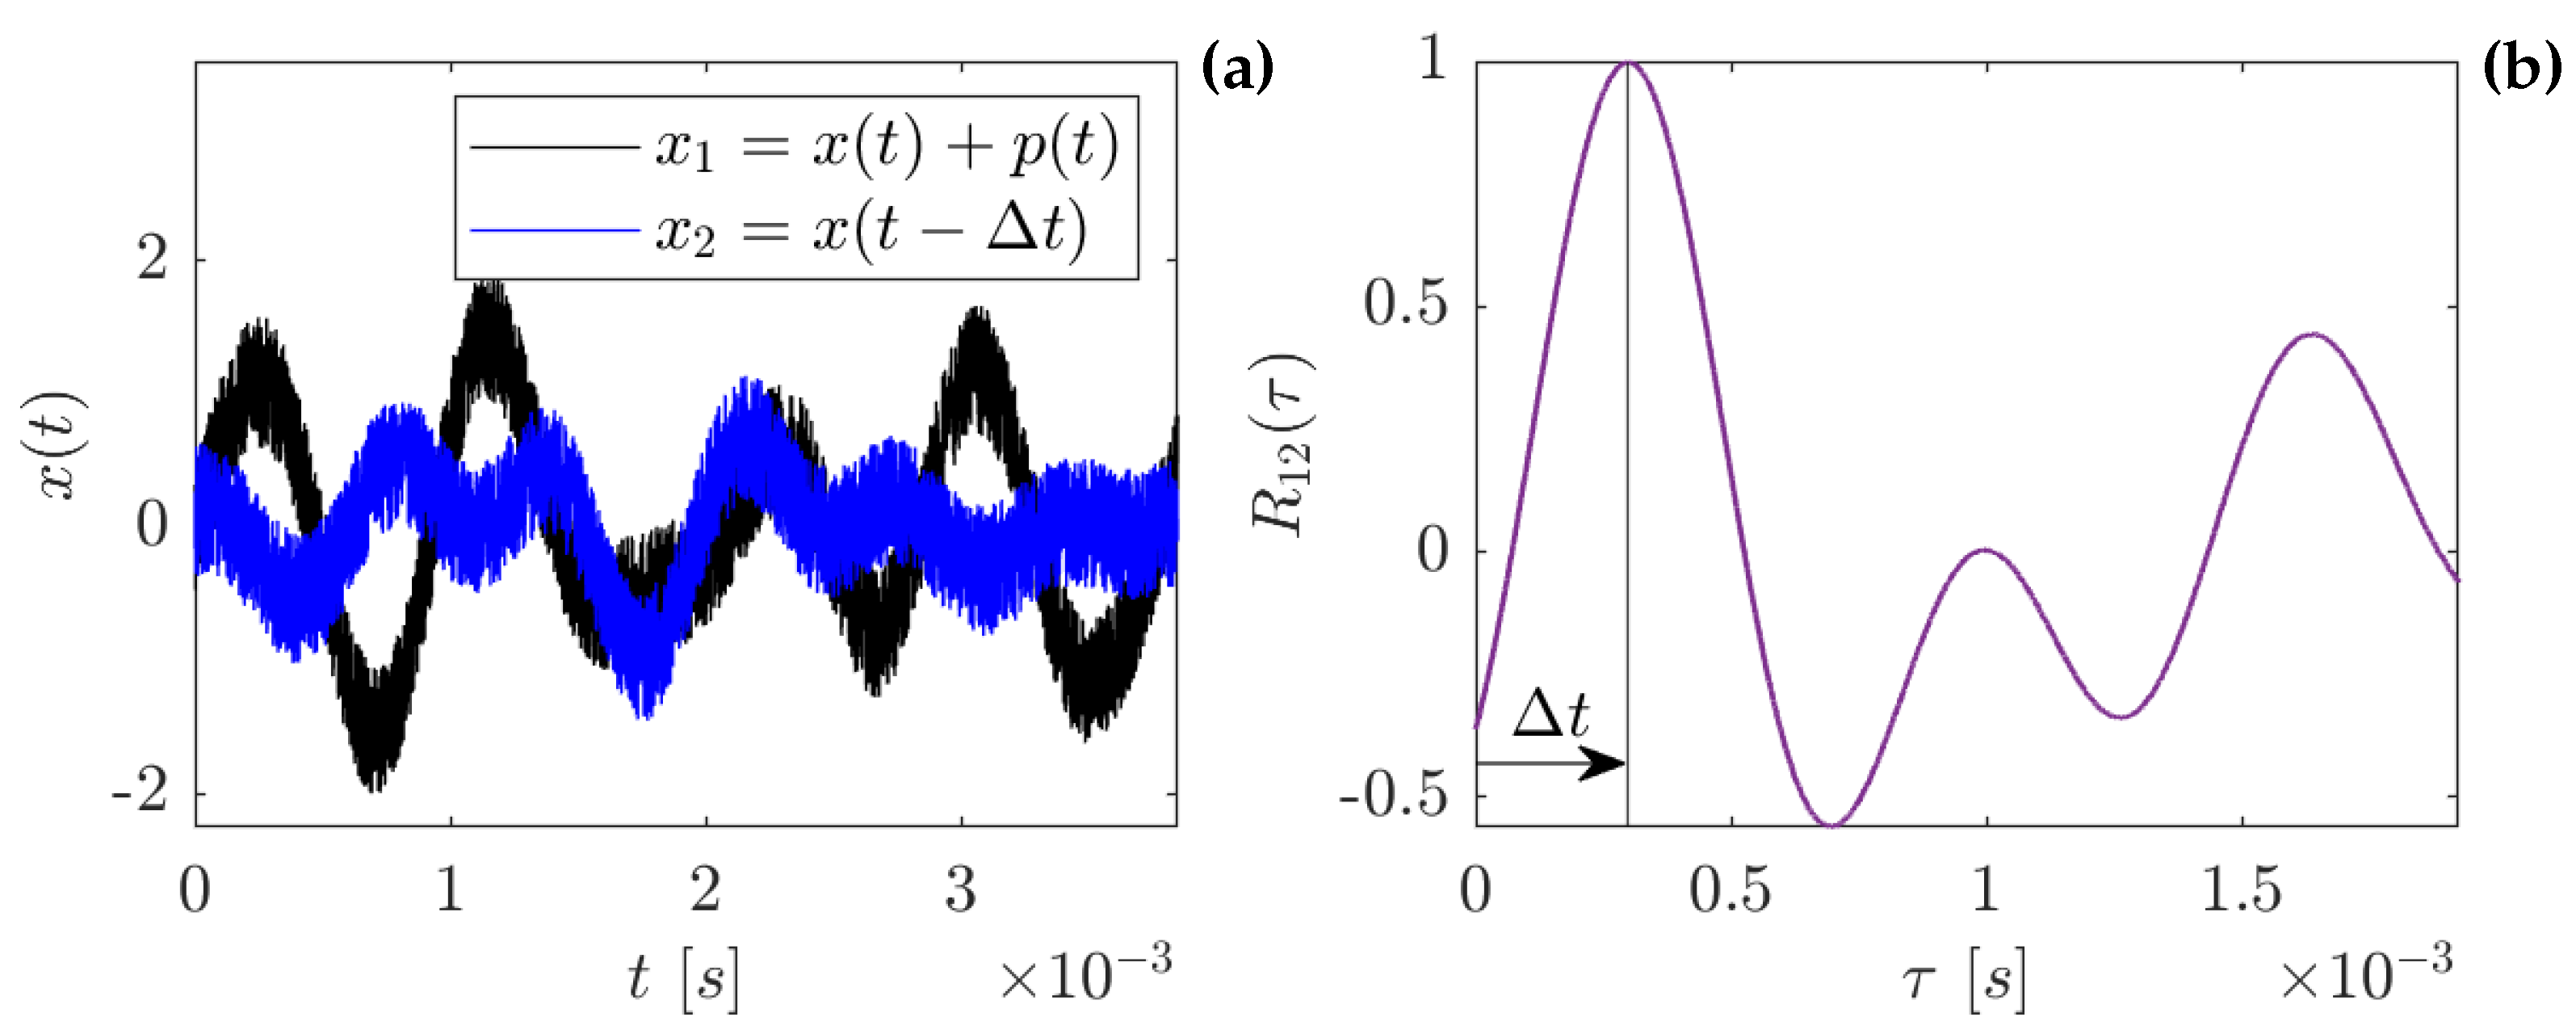
Figure 13a shows the time history of two sensors (band-pass) filtered to isolate the rim-seal unsteadiness. The plot highlights the portion of the signals equivalent to one full rotor revolution, while
Figure 13b displays the result of their cross-correlation.
The evolution of the pressure fluctuation, passing from one state to another while rotating, is easily recognizable in
Figure 13a. This translates to a cross-correlation with a complex periodicity and a significant (high-magnitude) isolated peak at the position of the signals’ time delay. This behavior differs from the ideal case of a simple periodic fluctuation (i.e., a single peak in the PSD distribution) in which the most energetic peak must be, by definition, within the first period
. However, this is consistent with the findings of the frequency-domain analysis, as the continuous evolution of the structure characteristics is the cause of the complex periodicity. Intuitively, the evolution of the structures produces time signals with a specific trace producing high values of the cross-correlation only in correspondence with the exact time delay.
Typical applications of the method would require selecting all the peaks of the cross-correlation or, equivalently, the first peak and then assuming a separation of one period (
). As stated in the methodology section, this is not possible as the rim-seal instabilities occupy a wide range of frequencies. Additionally, the significance of the first peak is not guaranteed, as it could be the result of the complex periodicity.
Figure 13b. is an example of this behavior.
Ultimately, the only reliable peaks are the most energetic ones, regardless of their position.
Figure 14a,b show the time lag plots populated by the single and two most energetic peaks in the cross-correlations. The figures are generated for rim-seal measurements, computing the cross-correlation over a single revolution, and including all tests available.
In both cases, most points accumulate in clusters that form normal distributions. The most populated clusters fall under the red line that identifies the best combination according to the procedure applied in
Figure 12a. Other clusters are also generated in their proximity, separated by one periodicity.
Figure 14b shows that when including the second most energetic peak, a series of points not uniformly spaced starts to populate the time lag plot. This is a direct consequence of the evolution of the structures, proving that only the most energetic peaks should be included in the time lag plot, as the others are not representative of any real time delay between the two signals.
Extending the number of peaks considered produces an increase in the dispersion of the clusters determining the best combination. The increase is relatively small, as the points composing these clusters are usually the first or second most energetic peaks. Therefore, the additional time delays, which in theory are less reliable for the reasons above, exert a minimal, yet present, influence on their final probability distribution. Ultimately, the two-peak plots are selected to ensure statistical convergence and precise pdfs.
Once the clusters constituting the best combination are identified, their pdfs are used in the bootstrapping procedure to determine the probability function of the optimum regression. The same procedure described for the CPSD methodology is applied, although in this case the slope is directly linked to the rotating velocity instead of the lobes’ count. Therefore, calculating the number of structures requires inferring .
Notably, this approach is not capable of discerning the different peaks in the spectrum per se. Typically, the number of lobes is computed assuming
equal to the central frequency. This is valid for applications where the instability is contained in a narrow band with only one predominant state. If this is not verified, this decision comes with the implicit assumption that the instability is rotating at the same speed in all its possible states. This has been proven during the frequency domain analysis, and finds further evidence in the alignment of the clusters of points in
Figure 12. Otherwise, spurious peaks would appear aligned with a different regression, superimposed to the first one, as the two states would coexist at the same time. Therefore, its absence is proof that, at least in the region of the pass-band filter, this is not occurring.
Table 5 summarizes the results of the CPSD and cross-correlation methods, applied to the rim-seal measurements (upper lip). Due to the adjustments to their standard implementations, both methods are able to measure the characteristics with high precision. The cross-correlation approach provides a direct link between the best regression slope and the rotating speed, while the cpsd approach links the slope and the number of lobes. Therefore, the comparison of the two methods should focus on these quantities.
Despite the adjustments to the cross-correlation method, the CPSD method demonstrated superior precision under both NP and ZP conditions. For NP, the presence of multiple states becomes an advantage in determining the phase law, as it can rely on more clusters of points. Intuitively, this can be seen as increasing the number of points in a calibration. This advantage is reduced, but still present, for ZP conditions, under which the number of peaks decreases. In contrast, the cross-correlation method cannot make use of this situation, as it is bound only to the central peak of the spectra (15 EO). Due to this limitation, the comparison focuses only on the central and most energetic peak in the average PSD distribution.
The analysis of the hub measurements under nominal conditions confirms the conclusions of
Table 5.
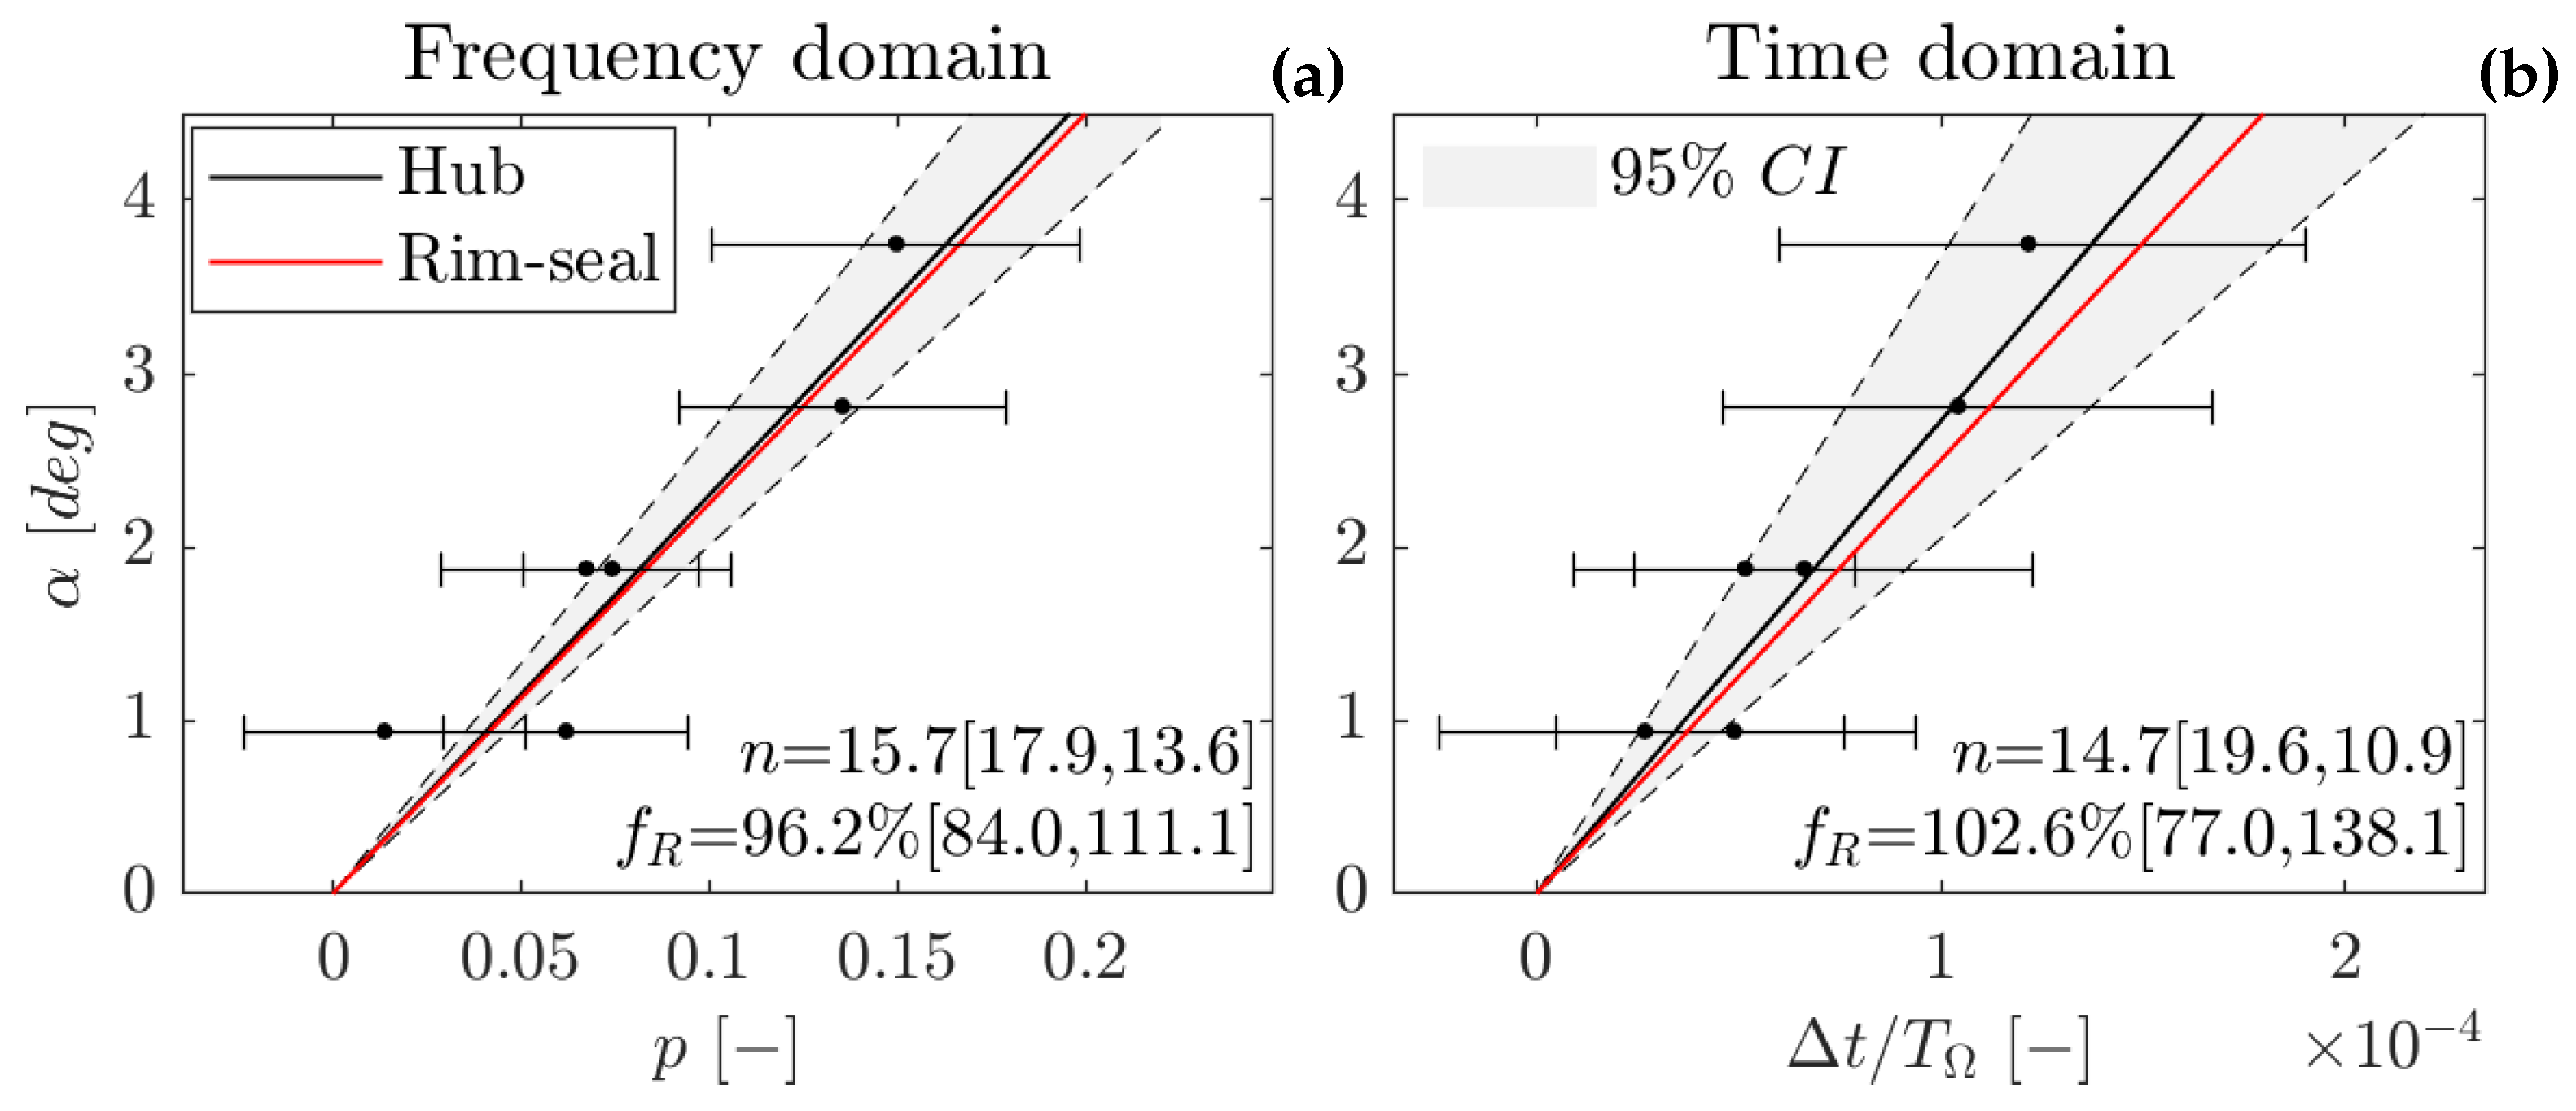
Figure 15a,b show, respectively, the results of the frequency and time domain analyzes. Both plots highlight a significant increase in uncertainty in the determination of the slope. The first cause of this behavior is the small spacing between the available sensors, which magnifies the effect of the phase/time lag uncertainty. The second is the lower intensity of the pressure fluctuation, which is translated into larger uncertainties on the lags.
The higher precision of the CPSD method is evident and is projected directly into the confidence interval (in brackets, at 95 %) of the count and velocity of the lobes. Furthermore, the comparison with the rim-seal measurement (red line in the two plots) shows a significant improvement in the measure of both quantities for the CPSD method.
4.2.3. Nature of the Rotating Instability
Table 6 summarizes the characteristics of the rotating instabilities for each operating condition. These values are measured at the upper lip of the rim-seal cavity, where the data is most accurate, and align with the measures at the other meridional positions when the instability is present (e.g.,
Figure 15a). This result confirms the observations of the spectral analysis and proves that the instability characteristics are maintained across the rim seal.
For NP conditions, the phase law is determined based on the seven most energetic states, and the instability characteristics are delineated for each of these states. For ZP conditions, the phase law includes the two most energetic peaks, but only the most dominant state is analyzed because of its prevalence in the spectra.
The states of the instability, identified from the spectral analysis, are summarized in
Table 6. Each of them is associated with a rotating velocity
, a lobe count
n, and their respective uncertainties
and
. The term
is determined from the pdf of
n, while
is calculated from
through Taylor expansion [
39], assuming for
the CPSD discretization error.
For ZP conditions, the lack of tests (only 2) affects the uncertainty of the measurements, causing an increase compared to NP. However, the strength of the peaks and the high signal-to-noise ratio partially compensate for this shortage.
Under NP conditions the minimum variance of the pdfs is recorded at the central peaks. These are the most energetic states and benefit the most from the bootstrapping procedure. In the lateral positions, the number of lobes is no longer an integer, and the rotating frequency diverges from the central value 94%. This trend matches the increase of the measures uncertainty, thereby preserving the nearest integer value of n within its range. The same situation is verified for the values calculated for ZP conditions.
This behavior is the result of a loss of precision of the phase law induced by multiple factors. The accuracy of the CPSD phase and the effect of the CPSD discretization, approximately 6.7% of the EO, affect both the position and the value of the phase in the CPSD plots. The variation of rotor speed within the useful time window, approximately 4.5% of the EO, is also another source of uncertainty. These factors impact the shape of the clusters in the CPSD phase, which ultimately cover a region of ±10-15% EO around the selected peak, as shown in
Figure 11a. The area occupied by the clusters has a direct impact on the uncertainty of the phase law, particularly in the lateral positions.
Figure 11a provides an example of this behavior. For the central peaks, the pdf of the phase law is lower than the variance of the original cluster. In contrast, the lateral points exhibit similar ranges. This affects every combination of sensors in similar terms, resulting in a wrong estimation of the phase lags and, consequently, of
n and
.
These observations explain the discrepancies between the values in
Table 6, the results of the PSD analysis, and the conclusions of the CPSD study, attributing them to the measurement uncertainty. In short, the variance of the cluster of points in the CPSD phase is such that it is impossible to be more precise in the evaluation. However, it is important to emphasize that the CPSD methodology is capable of capturing this "variance", projecting it into the uncertainty of
n and
, thus proving the reliability of the method. Moreover, the precision achieved for each of the possible states is higher than that achieved by the cross-correlation method for the average state of the instability (
Table 5).
In conclusion, the values shown in
Table 6 represent the average states of the rim-seal instability. The position of
at multiples of the EO suggests a possible link, and potentially the onset of fluid dynamic instabilities due to EO-related perturbations. However, given the uncertainties, this connection cannot be conclusively established. Therefore, a deeper understanding of the developed rim-seal instability requires proper contextualization within the existing literature.
For analogous geometries and flow conditions, the nature of the CMs is typically associated with Kelvin-Helmholtz or Taylor-Couette instabilities. However, this test case exhibits distinctive features that have been proven to influence the development of the modes. This includes the rim-seal design (angel wing seal with double lip), the high number of airfoils (96:96), and engine-representative transonic speed in the mean path.
Looking at the spectral analysis, similar shapes of the spectra can be found in Iranidokht et al. [
21], in Horwood et al. [
18,
20], in Graikos et al. [
26], and in Camci et al. [
40] which all associate these fluctuations to unsteady ingress-egress mechanisms, and specifically to rotating modes onset by shear layer interactions.
Many authors document the stabilizing effect induced by the purge rate for various sealing geometries and purge flow conditions. Horwood et al. [
20] and Graikos et al. [
26] confirm this trend for a single lip geometry over a wide range of sealing flow parameters, encompassing the three operating conditions investigated in this work. The effects of disk rotational speed [
20], annulus flow coefficient [
26], and rotor blades’ presence [
26] on the purge rate modulation are also analyzed, concluding that, although the spectral distributions are affected, the stabilizing trend is verified independently from these parameters. Savov et al. [
41] describe the modulation of the rim-seal instability as an effect of the purge rate on the size of the Gap Recirculation Zone (GRZ). For high purge rates, it is hypothesized that the GRZ is blown out from the rim seal, explaining the suppression of the unsteady modes.
Horwood et al. [
18] also documented the modulation effect by investigating these instabilities on a chute rim-seal geometry. However, contrary to the measurements presented here, the fluctuations were absent at zero purge conditions. This underlines the importance of the rim-seal geometry that is, as extensively documented in the literature review by Chew et al. [
12], closely linked to the mechanisms developing at the interface with the annulus flow. Unsteadiness modulation is also detected by Schadler et al. [
8] for a rim-seal geometry conceptually similar to the SPLEEN test case. However, the maximum fluctuation intensity was found at a PR of 0.4%.
Despite the significantly different operating conditions and cavity designs, Iranidokht et al. [
21] also documented frequency spectra with multiple peaks separated by approximately 1 EO. They identified Kelvin-Helmholtz instabilities as the main drivers of these modes, linking each frequency peak to superimposed structures. Their analysis revealed lobes ranging from 14 to 21, each rotating at about 96% of the disk speed. They observed that the rotational velocity of these lobes increased proportionally with the hub tangential velocity, indicating a dependence on the shear layer gradient. Notably, they were able to predict the location of the most energetic mode (central peak) by employing the results of the velocity profile stability analysis of Michalke et al. [
42].
Similar modes characteristics are found by Schadler et al. [
8], who detect 22 lobes rotating at 93% of the rotor speed for a rim-seal geometry conceptually similar to the SPLEEN test case. Horwood et al. [
20] show evidence of Kelvin-Helmholtz instabilities through the analysis of unsteady RANS simulations for a single lip rim-seal. From the experimental data, they measure 23-26 lobes rotating at 93-103% over a wide range of operating conditions. The relevance of the annulus flow tangential component, and so of the shear layer, is also underlined by Graikos et al. [
26], who detect rotating structures composed by 24-32 lobes (depending on the operating condition) and rotating at 85-120% of the disk speed.
Analogous considerations are also made by Savov et al. [
27], who analyzed the sealing effectiveness and CMs for two rim-seal geometries with and without rotor blades, identifying Kelvin-Helmholtz instabilities as the main driver of the modes. The dependence on the sealing geometry is also underlined in Town et al. [
24], who show how large unobstructed clearances would develop less (in number) but larger (in size) structures and vice versa. These findings align with the results summarized in
Table 6, and the conclusions of the spectral analysis in
Table 4, which locates the development of the instability at the rim-seal interface and highlights the influence of the shear layer. This constitutes initial evidence of Kelvin-Helmholtz’s instabilities developing under representative engine conditions for a modern high-speed LPT design.
More evidence is provided by applying the results of the stability analysis presented by Michalke et al. [
42] to the test case. Michalke et al. identified the wavelength
of the Kelvin-Helmholtz modes amplified by the velocity profile as
, where
is related to the thickness of the shear layer,
, by the relation
. For the 16-lobe structure, which corresponds to the most dominant (stable) peak of the spectra,
becomes 8.9 mm. This value is equal to the gap
, and falls between the thickness of the upper lip (5.4 mm) and the depth of the sealing region (11.4 mm), the two geometric quantities that affect the most
. Similar considerations apply to the other states of the instability, for which the equivalent shear layer thicknesses range between 10.1 mm (14-lobes) and 7.9 mm (18-lobes).
