1. Introduction
Plant functional traits refer to the morphological, physiological, biochemical, and behavioral characteristics of plants in ecosystems. These characteristics are closely related to ecosystem functions and reflect the strategies used by plants to cope with environmental changes [
1,
2]. As an important aspect of plant functional traits, leaf traits are not only closely related to plant growth, development, and reproduction but are also affected by the external environment and phylogenetic development. It is a bridge between plants and the environment, showing the adaptability and self-regulation ability of plants to complex habitats [
3,
4,
5]. Under environmental stress, plants usually improve their adaptability by adjusting their leaf functional traits. In addition, as the main organ of photosynthesis and material production, leaves are key to material exchange and energy conversion in plants [
6]. Leaf traits directly reflect the photosynthetic capacity of plants and their strategies of resource acquisition, utilization, and distribution [
7,
8]. Therefore, it is important to understand the changes in leaf functional traits in different environments to explore the environmental adaptability of plants. This helps to reveal the ecological adaptation mechanisms of plants and provides an important scientific basis for the maintenance and management of ecosystem functions.
With the intensification of global environmental change, research on variations in leaf functional traits and their adaptation mechanisms has attracted attention. Studying the changes in plant functional traits with environmental factors is helpful for understanding the physiological and ecological mechanisms of plants under climate change conditions and is of great significance for understanding the survival and distribution of plants [
9]. Additionally, climate change and other environmental factors have significant effects on leaf functional traits [
10,
11,
12,
13,
14,
15,
16]. The variation in leaf functional traits is not only the result of the interaction of environmental factors and phylogenetic history, but also shows dynamic changes in geographical distribution patterns and time scales at global, regional, and local scales [
17,
18,
19]. The relationship between traits and the environment reflects the optimal adaptation principles for plant growth and adaptation under natural conditions [
20]. Therefore, leaf functional traits provide information on environmental changes in the process of plant adaptation to such changes as well as directly reflecting the survival strategies of plants to adapt to environmental changes.
The economic spectrum of plant functional traits reveals an important relationship among plant functional traits. Plant leaf traits are not isolated but are closely related to many other traits [
21,
22]. Recently, researchers have proposed various theories and methods regarding plant trait networks (PTNs) [
23]. By quantifying the complex relationships between multiple leaf traits, a multidimensional network was constructed to explain the relationships between different leaf traits. The study of plant trait networks can comprehensively, multi-dimensionally, and visually analyze and evaluate the relationship between traits, network topology, and hub traits [
24]. This allows researchers to explore the key traits of plants in different environments and their relationships with the environment and provide a new way to reveal the adaptation and response mechanisms of plants to environmental and resource changes. The purpose of this study was to explore how the leaf trait network of
P. euphratica along the main stream of the Tarim River responds to environmental change. By analyzing the spatial variability and driving factors, the adaptive strategies of
P. euphratica leaf traits in its environment are revealed.
The environment of the main stream of the Tarim River in Xinjiang is complex and varied. It is a typical ecologically fragile area with strong environmental sensitivity, water shortages, sparse vegetation, and severe soil and wind erosion. There are vast desert riparian forests on both sides of the river, and the vegetation is dominated by
P. euphratica. It is an important tree species in the Salicaceae family. It has strong stress resistance and can adapt to harsh environments such as drought, wind erosion, and saline-alkali soil [
25]. It plays an active role in regulating the climate, preventing wind and sand erosion, preventing desert expansion, and protecting oases. Understanding the interactions between
P. euphratica leaves and the environment is of great significance for revealing the mechanisms of plant adaptation to drought-prone environments. In a previous study [
26], the relationship between leaf traits and the environment of
P. euphratica was been studied. The influence of the climate drought index and river water flow on the leaf trait network of
P. euphratica was explored using the plant trait network analysis method by determining leaf morphology and functional traits of
P. euphratica along the main stream of the Tarim River. The lower stratum corneum (LSC), upper stratum corneum (USC), and midvein vascular bundle (MVB) were the central traits of the leaf trait network of
P. euphratica. It optimizes resource utilization and improves drought resistance by adjusting its leaf traits, thereby exhibiting a high degree of environmental adaptability. However, there are a few reports on the complex relationship network between the multiple leaf traits of
P. euphratica and their relationships with the environment.
This study used the P. euphratica forest on the desert bank of the main stream of the Tarim River in Xinjiang as the research object, and used the leaf trait network and principal component analysis (PCA), variance decomposition analysis (VPA), and other analysis methods to construct the P. euphratica leaf trait network along the main stream of the Tarim River. The spatial pattern of the leaf trait network in the entire basin and its relationship with environmental factors, such as climate and soil, were analyzed. The purpose of this study was to analyze how P. euphratica adapts to the environment of the main stream of the Tarim River through the integration of leaf traits and adjustment of the relationship between traits, to reveal the adaptation strategy of P. euphratica to the environment, ultimately protecting wild P. euphratica forests along the Tarim River.
5. Conclusions
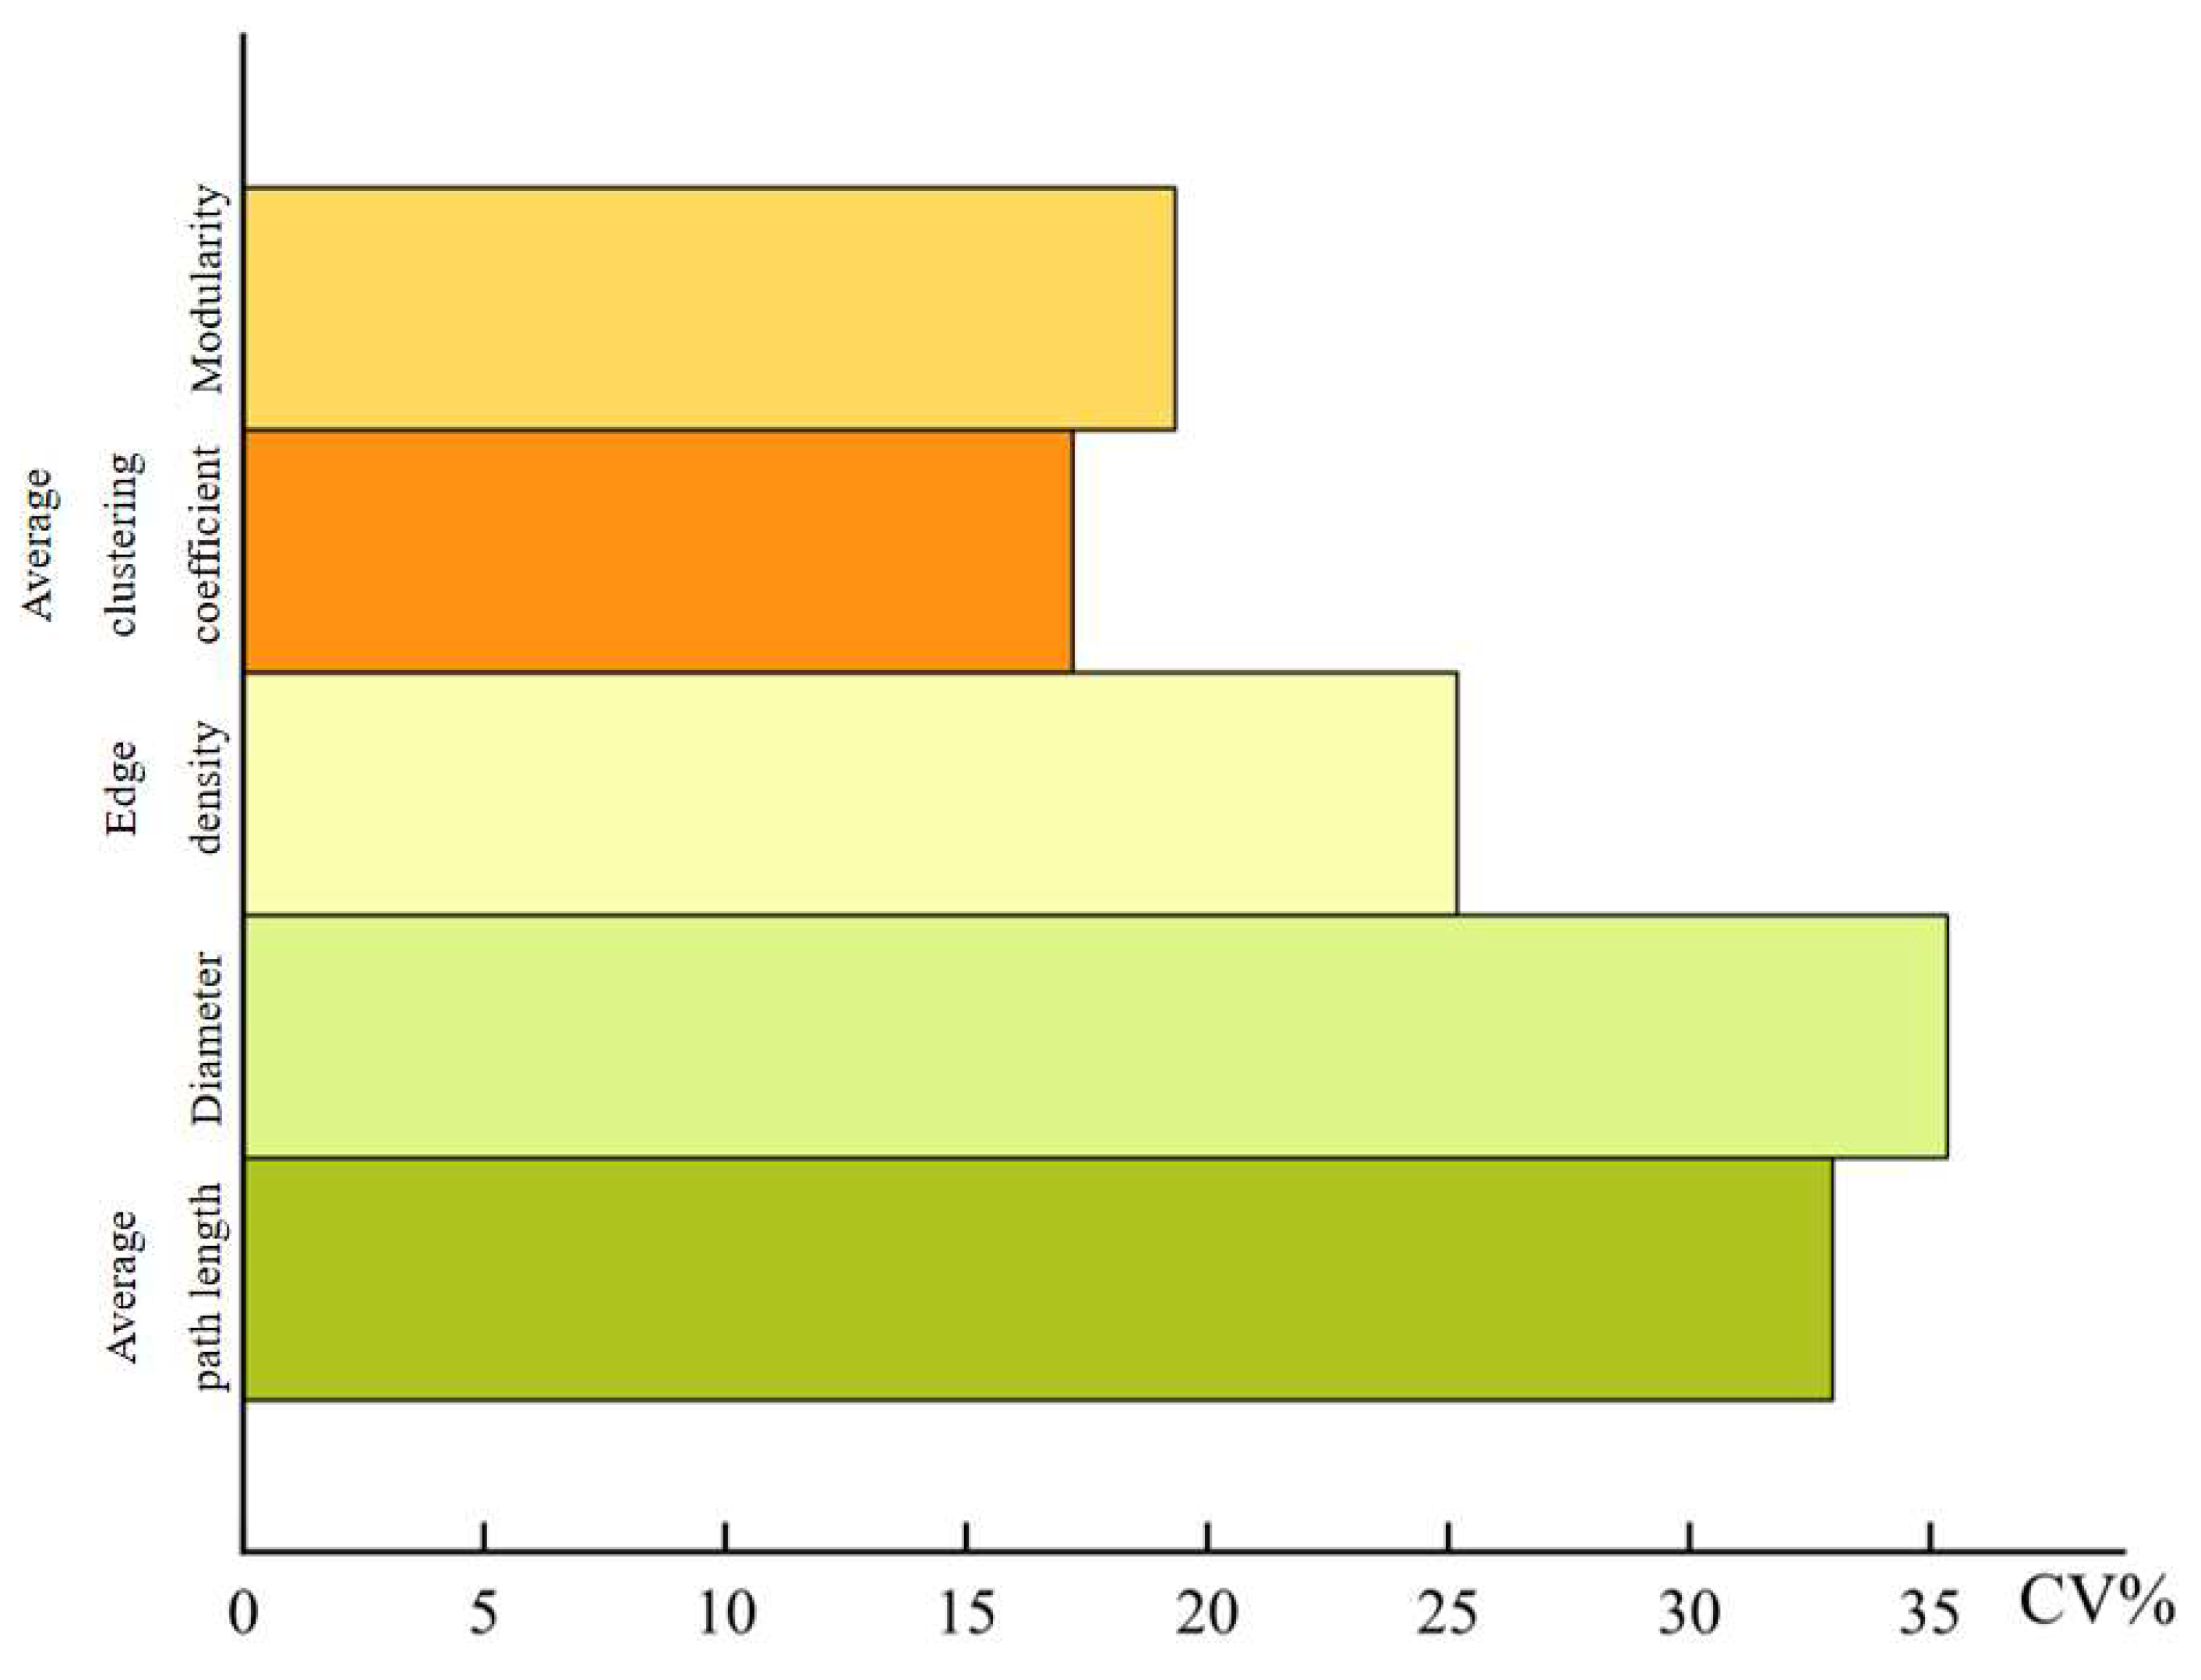
The average path length, diameter, and edge density in the leaf trait network of P. euphratica in the main stream of the Tarim River had a large degree of variation between 20 sampling points, and the overall leaf network parameters had a large spatial variability. Under the influence of different soil and climatic factors, the leaf trait network is promoted to form a closer or more dispersed network structure, thereby maximizing resource utilization efficiency.
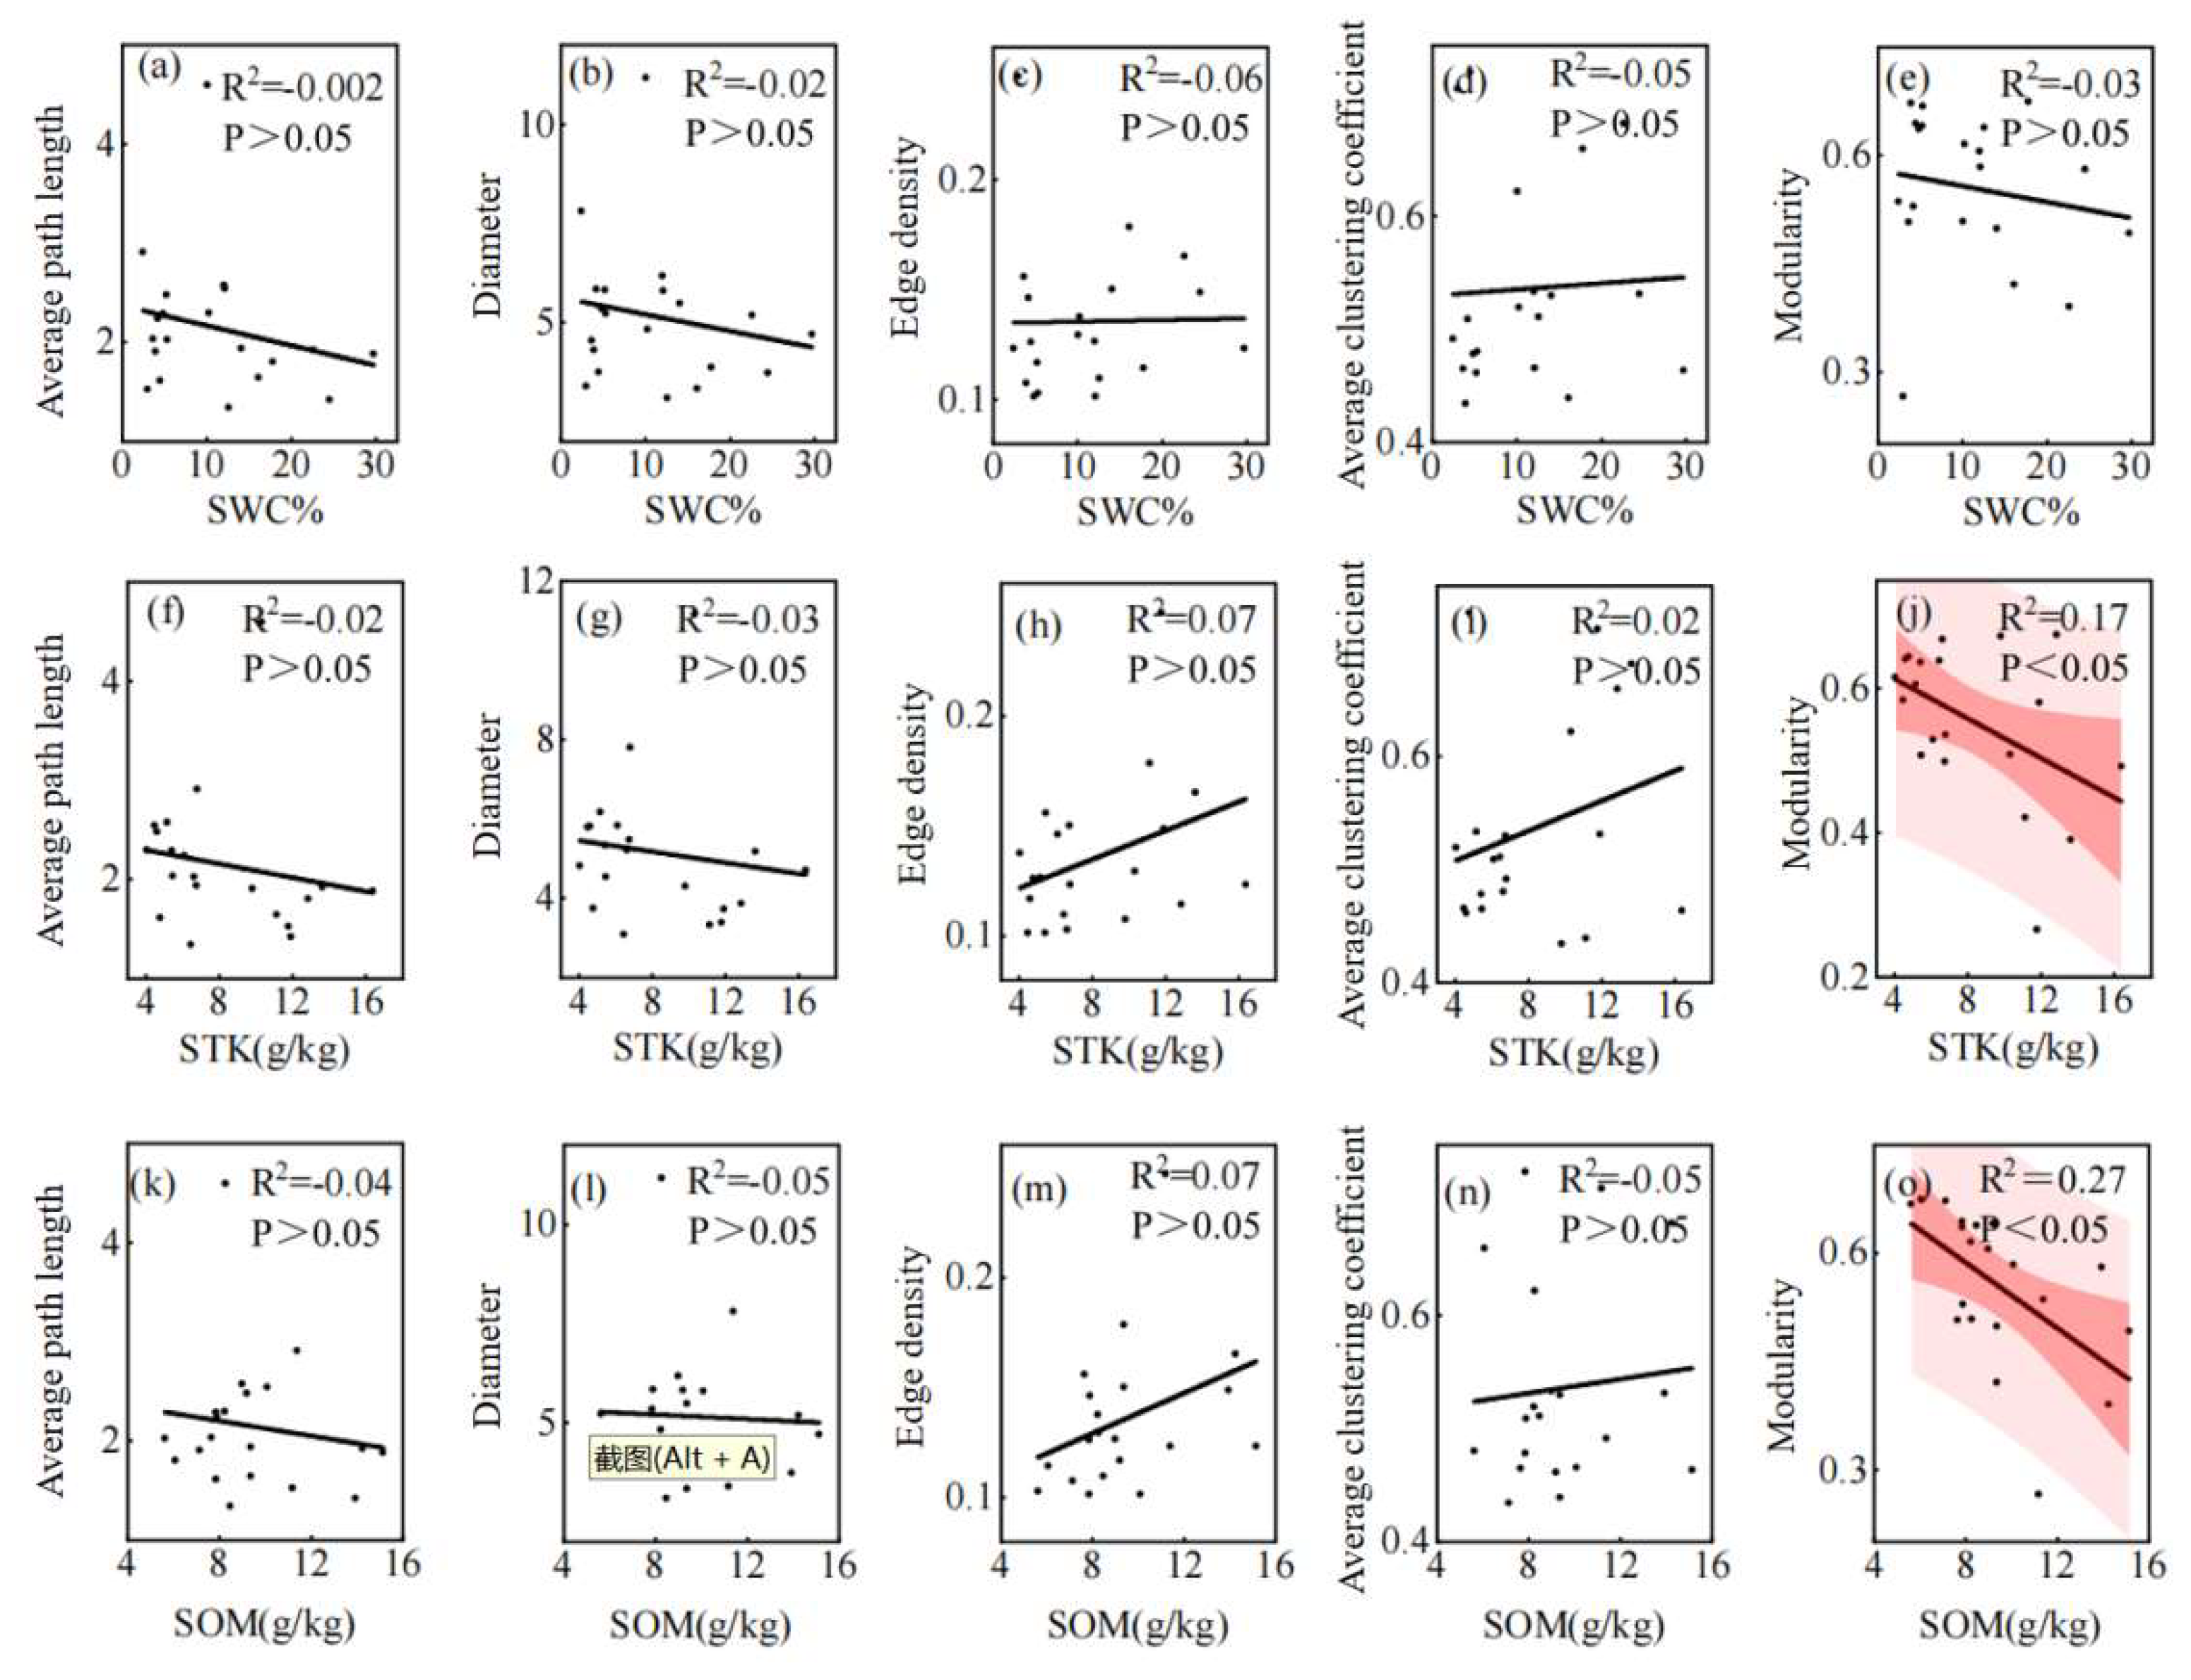
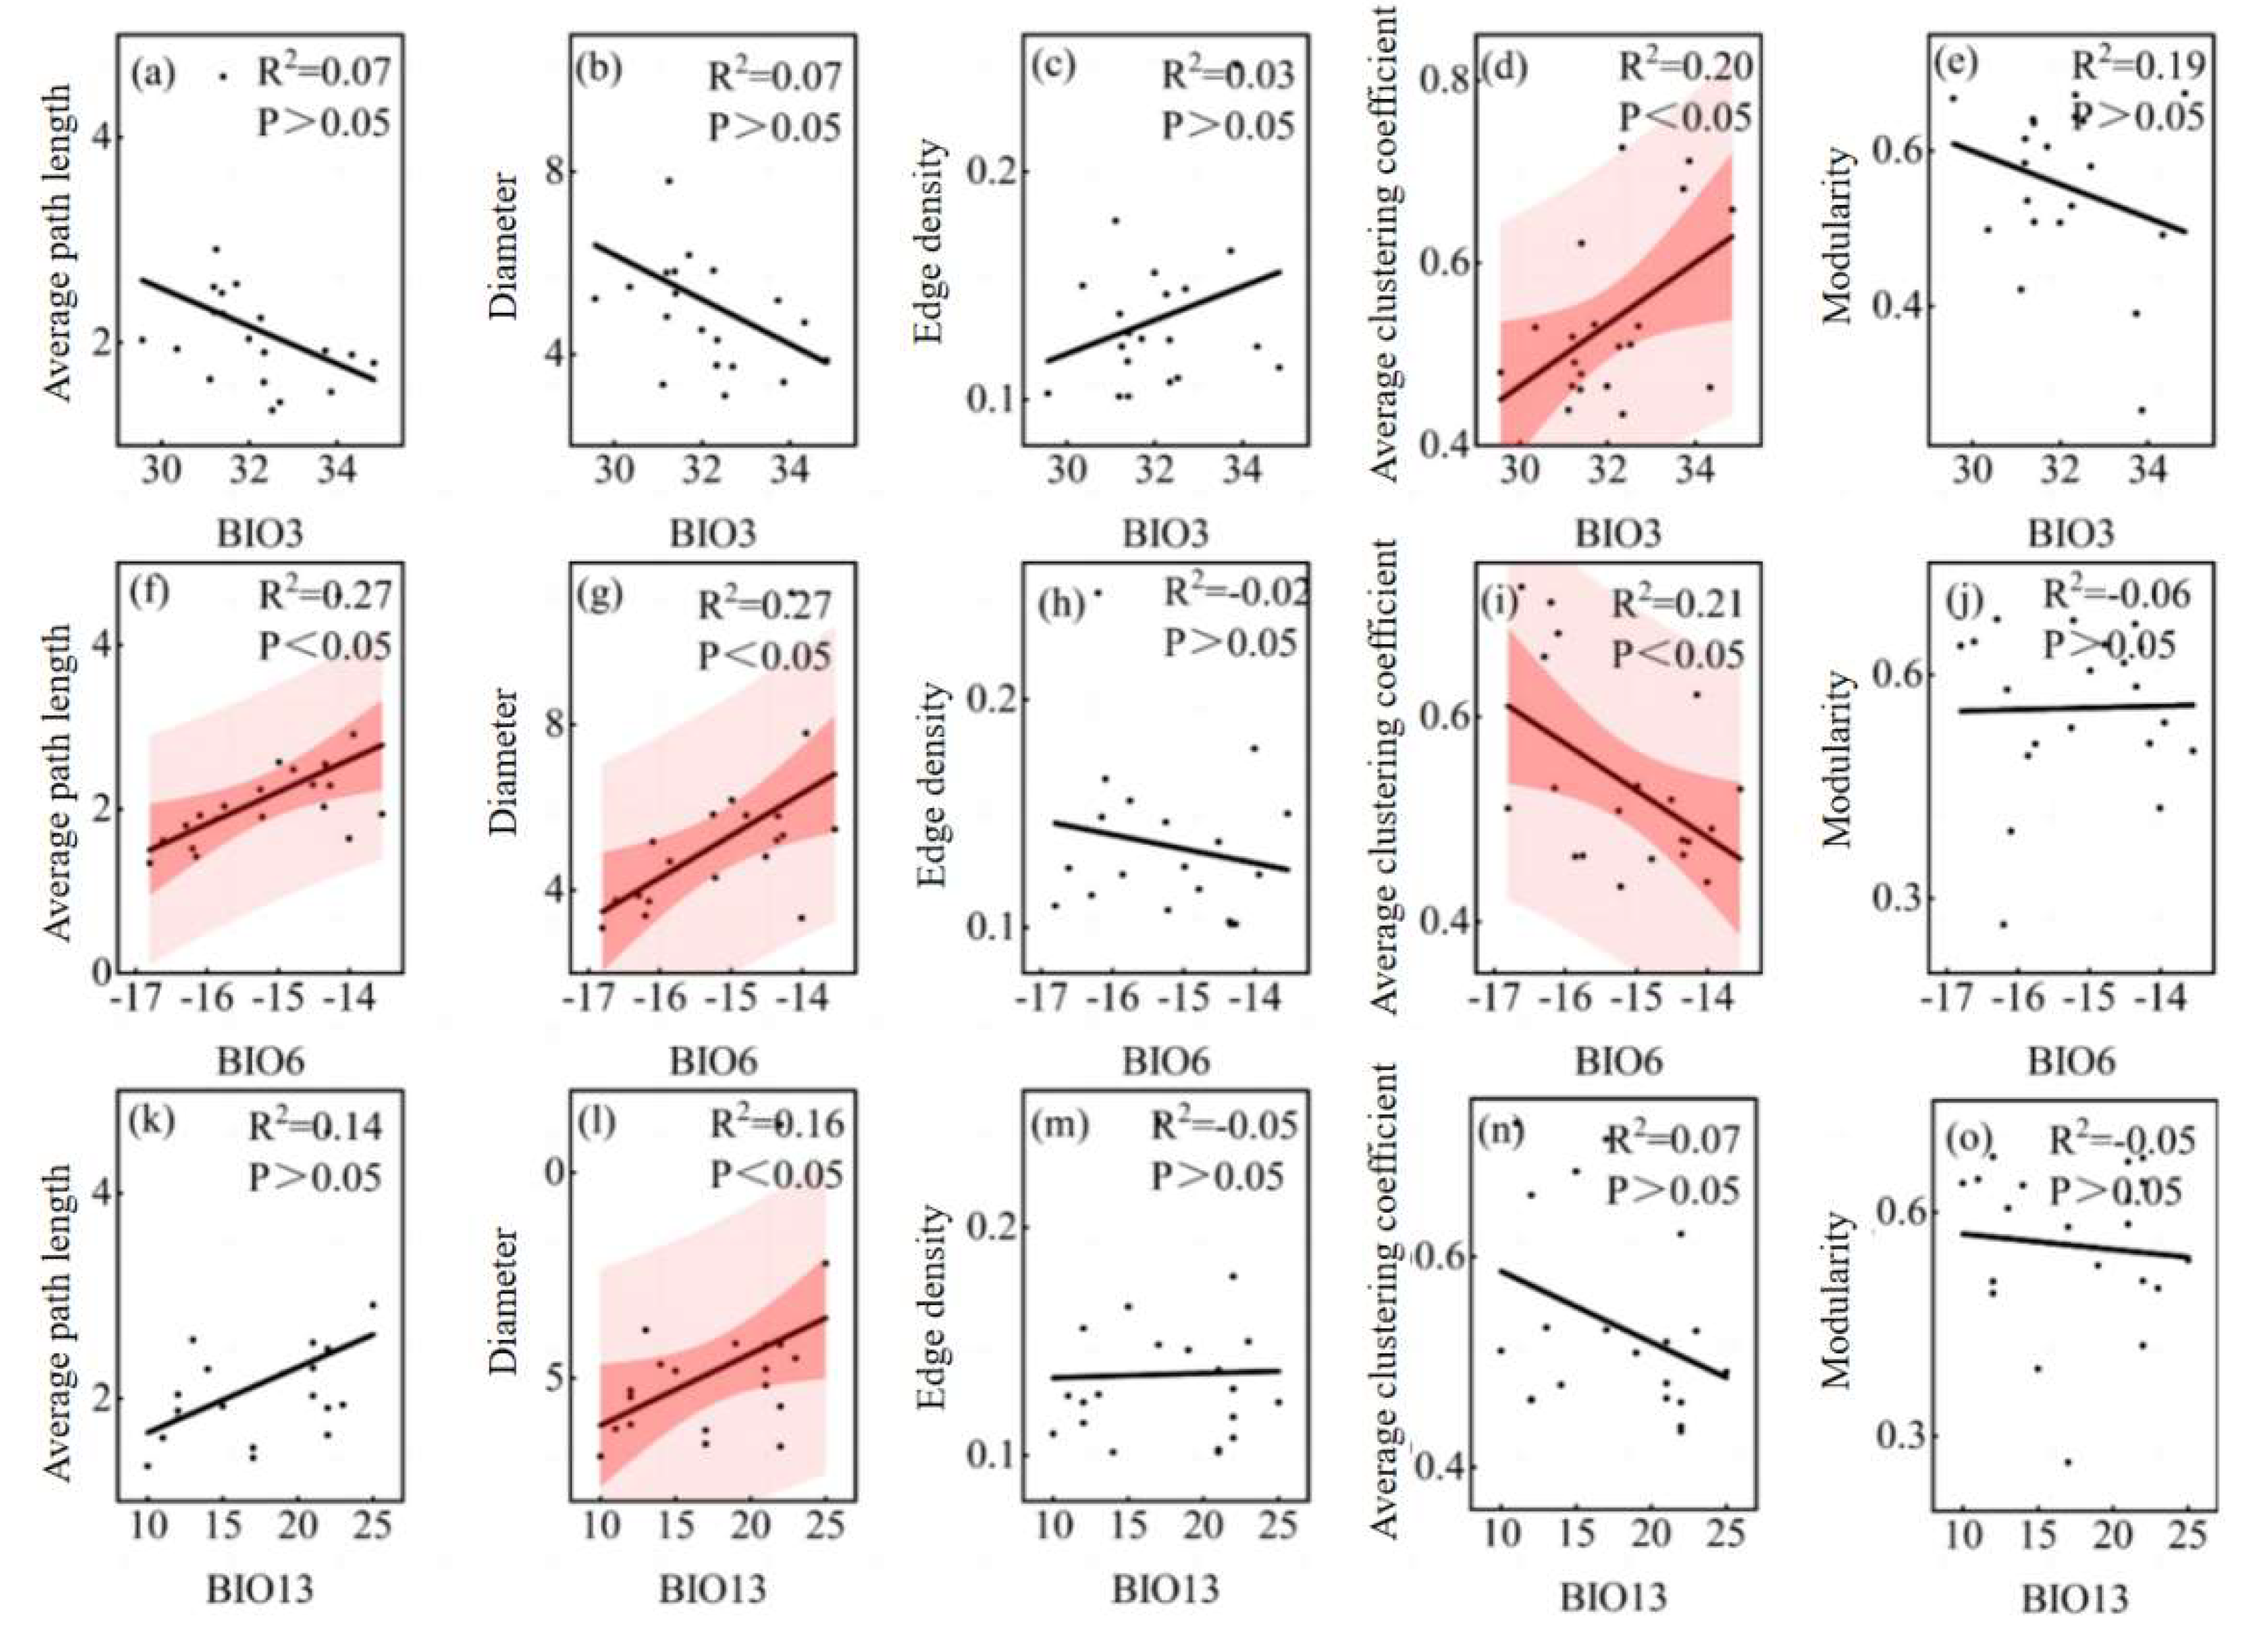
Leaf trait networks were significantly affected by environmental factors. Average path length, diameter, and modularity were negatively correlated with water content, soil total potassium, and soil total organic matter, whereas edge density and average clustering coefficient were positively correlated with these soil factors. The negative correlations between modularity and soil total potassium and soil total organic matter were significant. In addition, these leaf trait network parameters were also related to climatic factors, among which average path length, diameter, and modularity were negatively correlated with isothermality and positively correlated with min temperature of coldest month. In contrast, the edge density and average clustering coefficient were positively correlated with isothermality but negatively correlated with min temperature of coldest month, and the correlation between the average clustering coefficient and these two climatic factors was significant. The average path length, diameter, and edge density of the leaf trait network were positively correlated with precipitation of wettest month, whereas the average clustering coefficient and modularity were negatively correlated with precipitation of wettest month, and the diameter was positively correlated with precipitation of wettest month.
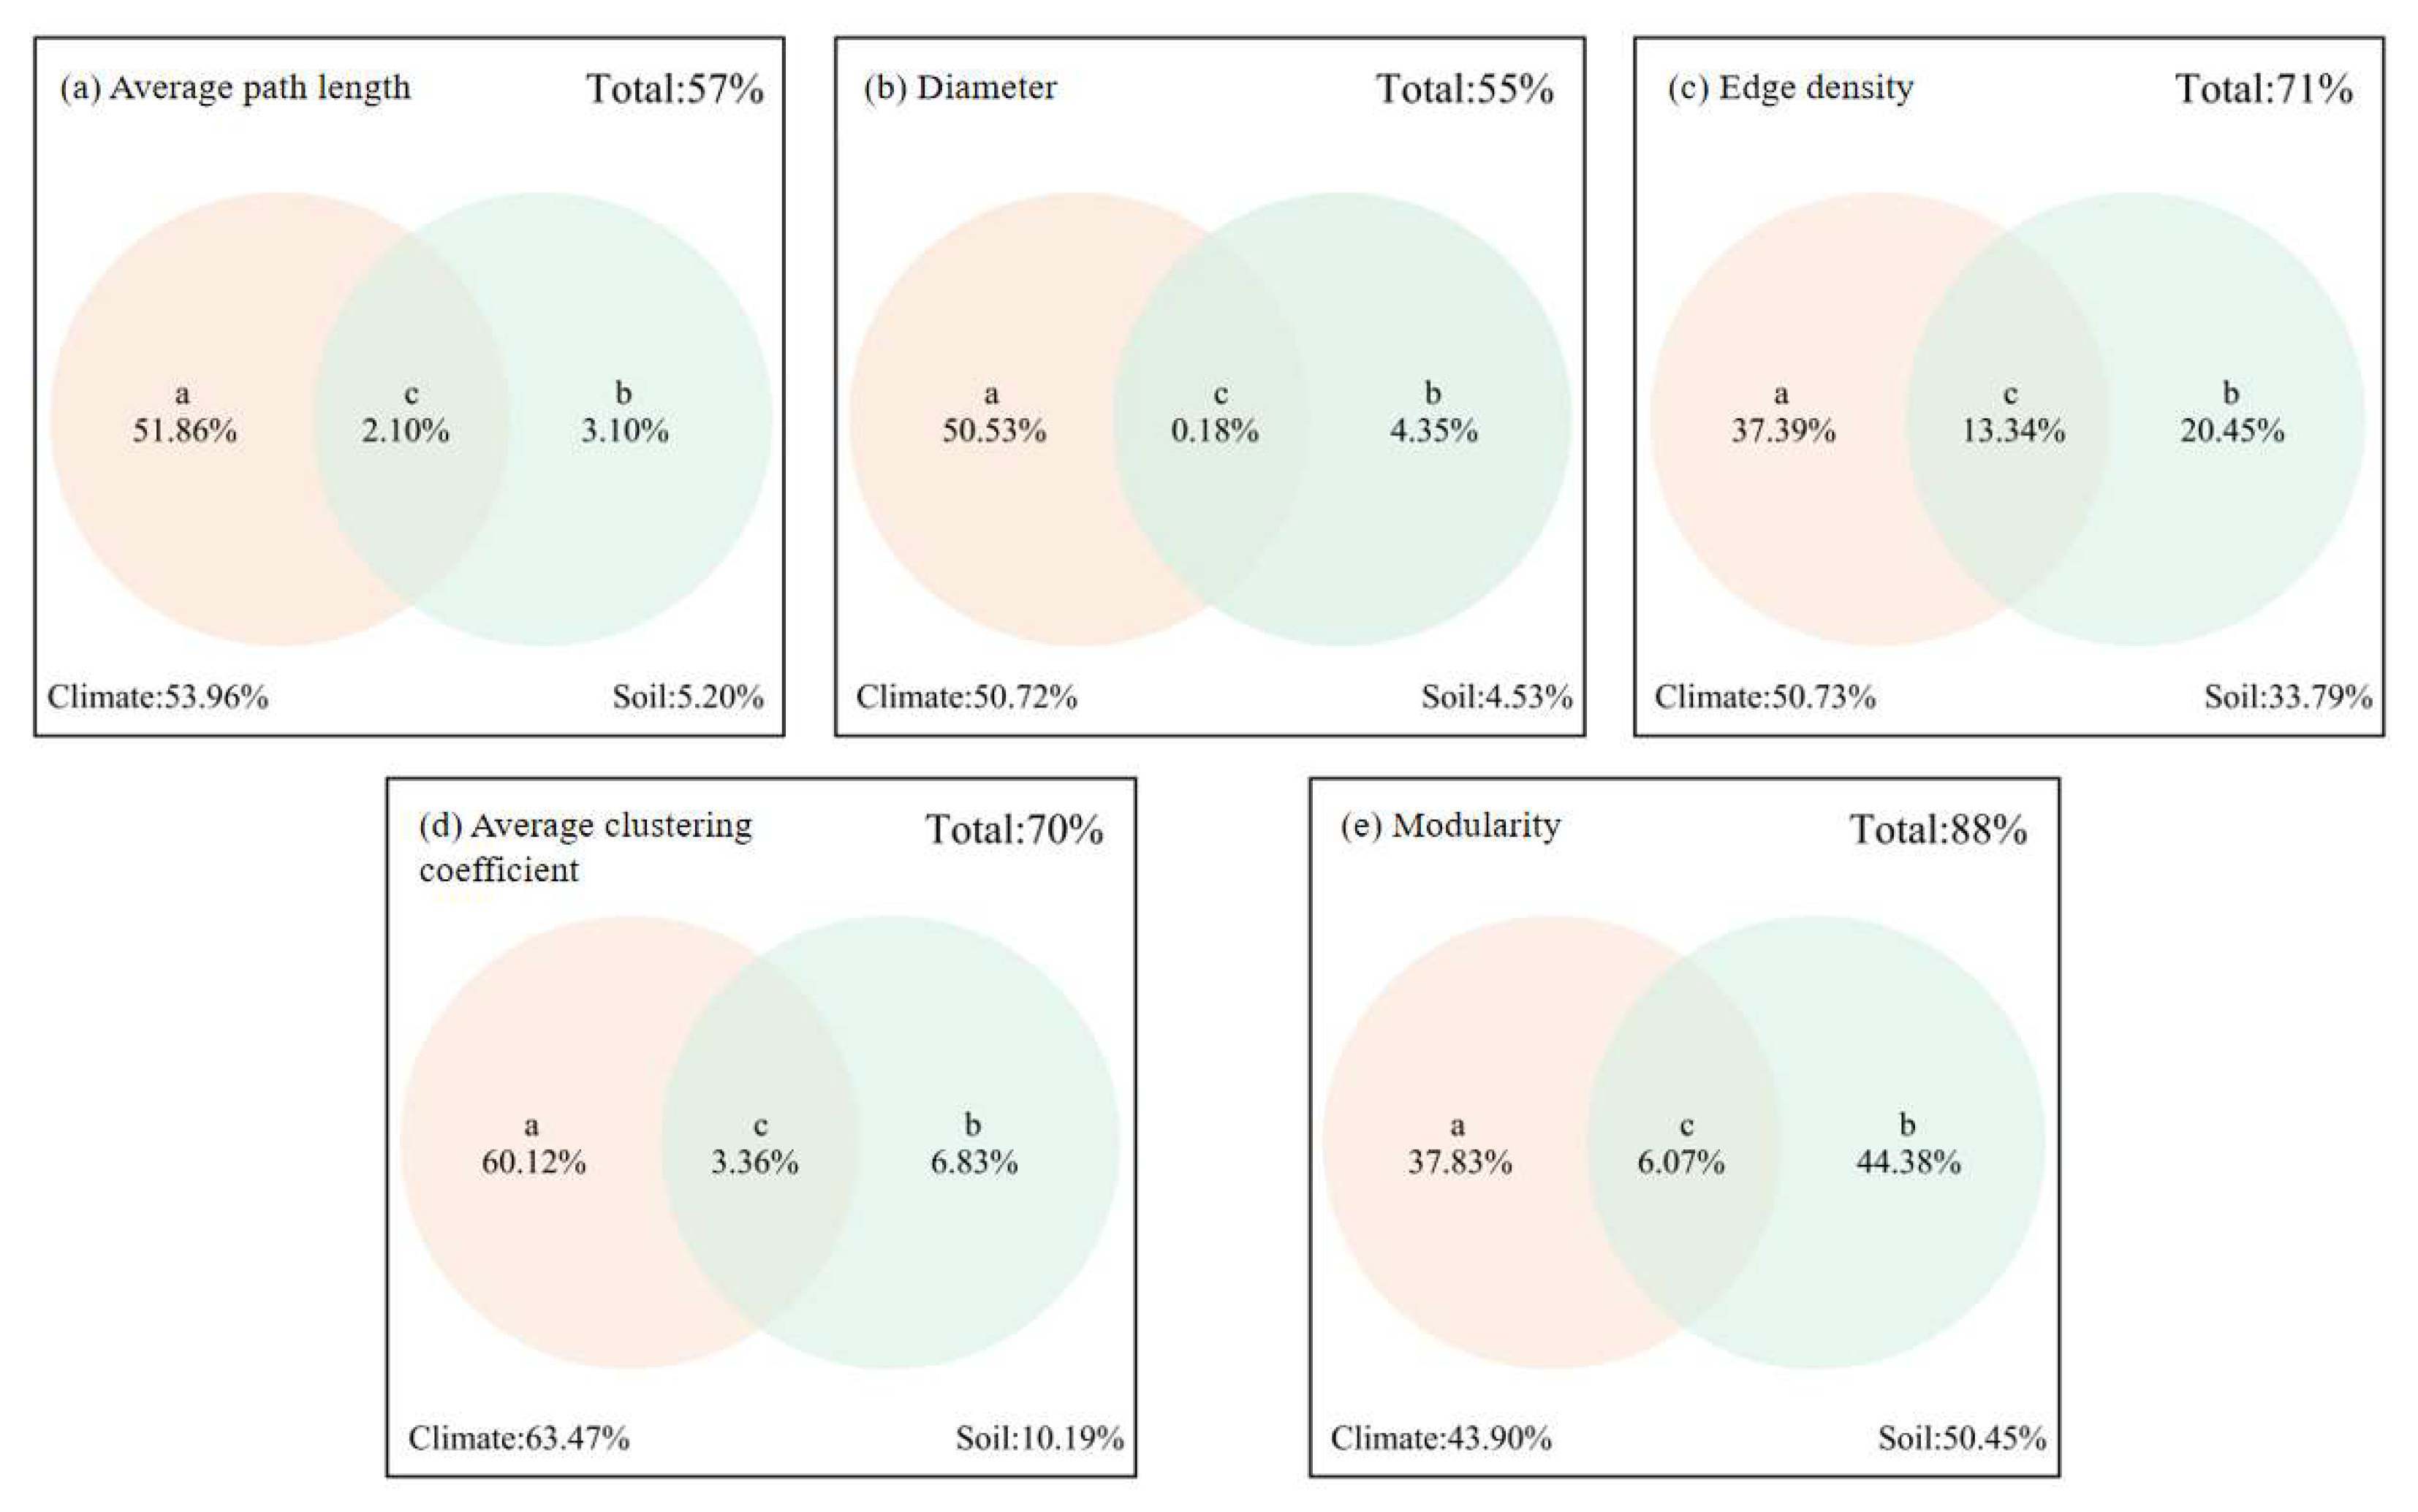
Climatic factors play a decisive role in shaping the network structure of leaf traits and are the main environmental factors affecting the network parameters of leaf traits of P. euphratica. The degree of interpretation of individual effects was generally higher than that of the soil factors; However, soil factors had the greatest influence on the modularity when acting alone. The interactions between soil and climatic factors contributed to all leaf trait network parameters. Although the interpretation was relatively small, climatic and soil factors alone did not affect the leaf trait network. Interactions between these factors also shaped the spatial variability of leaf traits to a certain extent. However, compared to soil factors, climatic factors can significantly change the structure of the leaf trait network. Crucially, the variation in the P. euphratica leaf trait network was mainly driven by environmental factors.
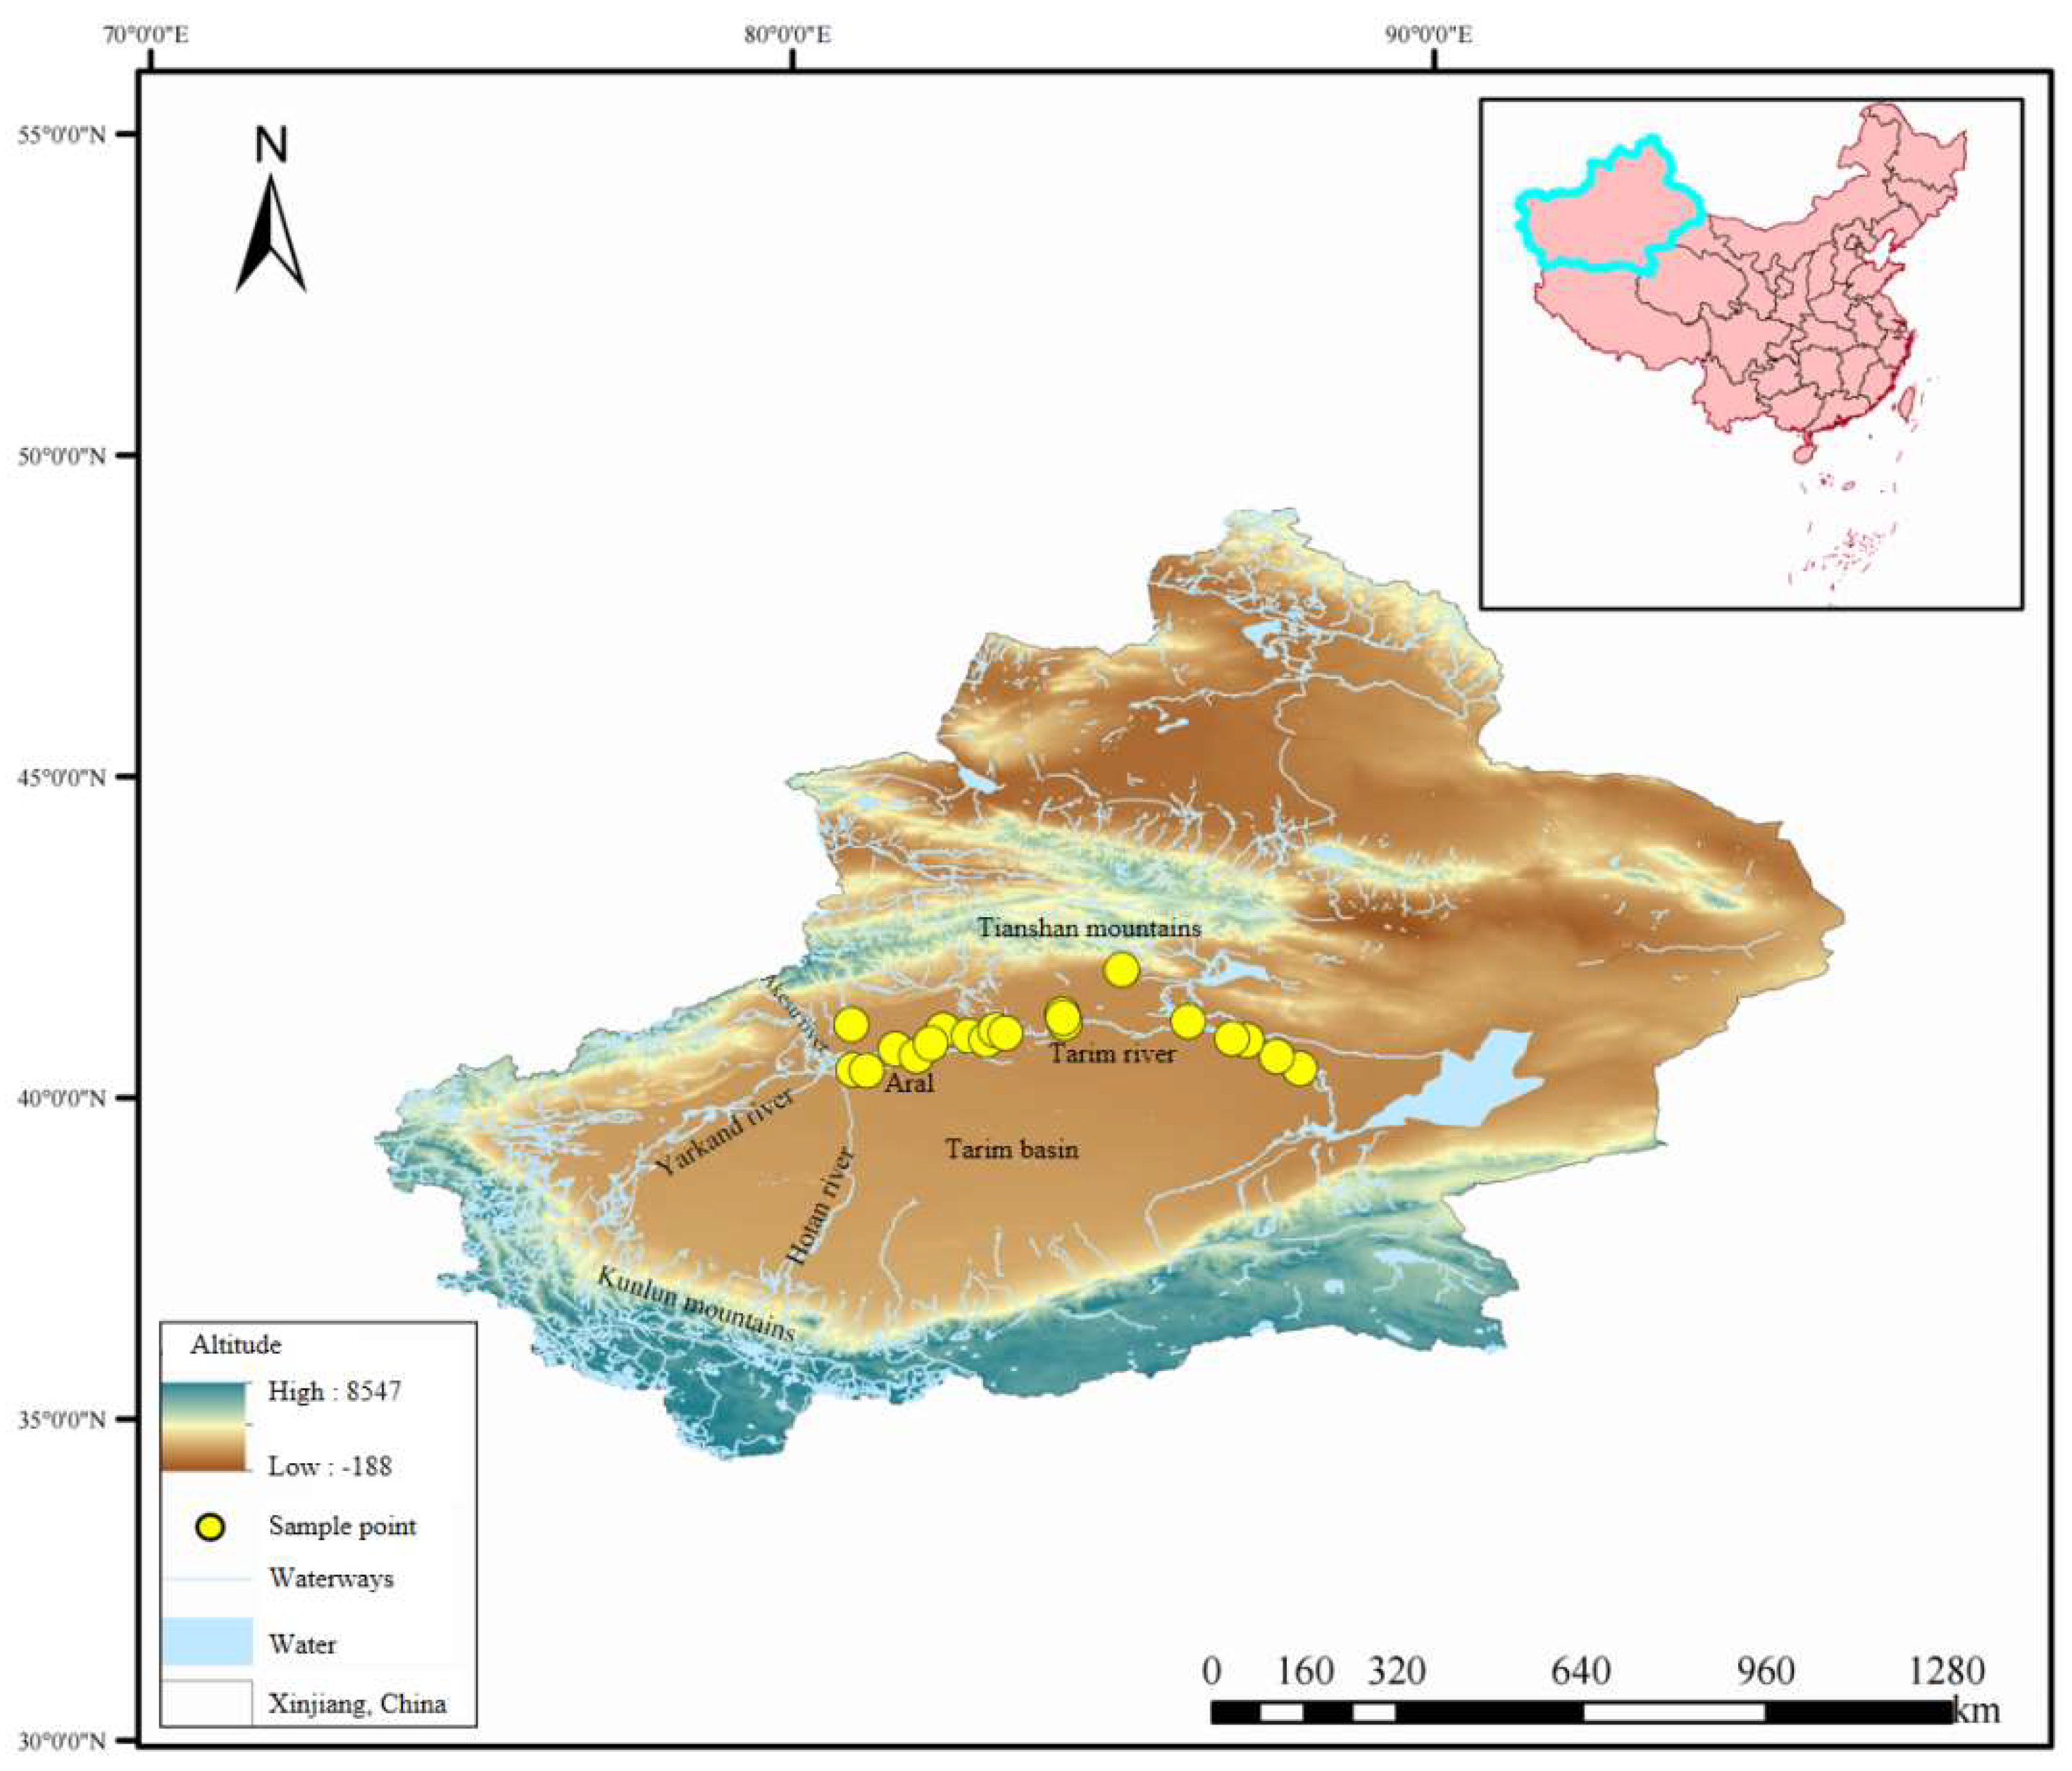
Figure 1.
Map of the sampling points.
Figure 1.
Map of the sampling points.
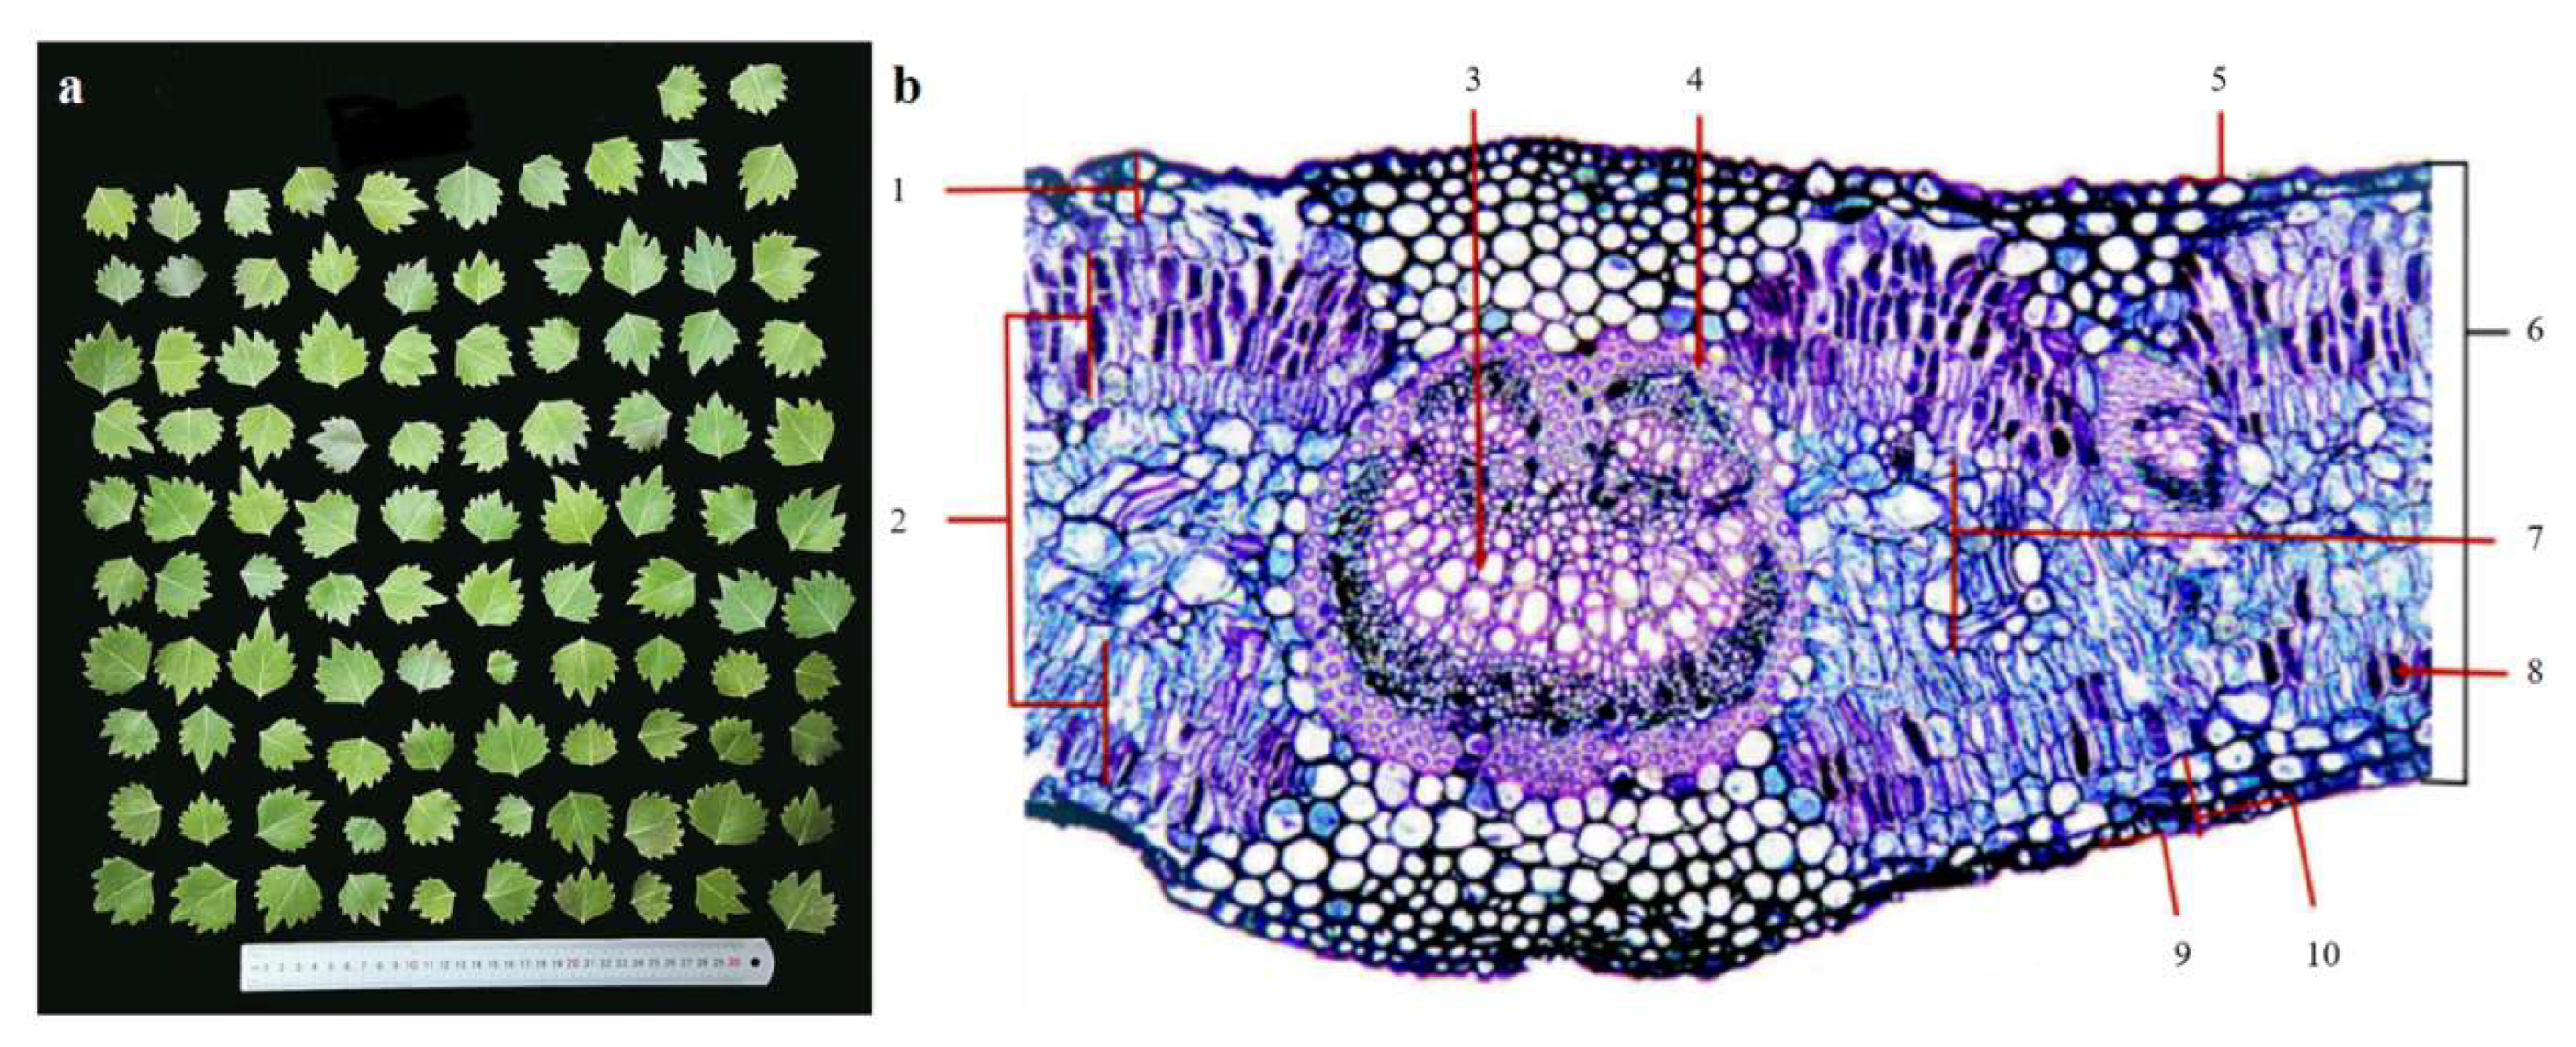
Figure 2.
Leaf morphology and leaf anatomical structure. (a) Leaf morphology. (b) Leaf anatomical structure: (1) Upper epidermis; (2) Palisade tissue; (3) Vascular bundle; (4) Sclerenchyma; (5) Upper stratum corneum; (6) Leaf thickness; (7) Spongy tissue; (8) Mucous cells; (9) Lower stratum corneum; (10) Lower epidermis.
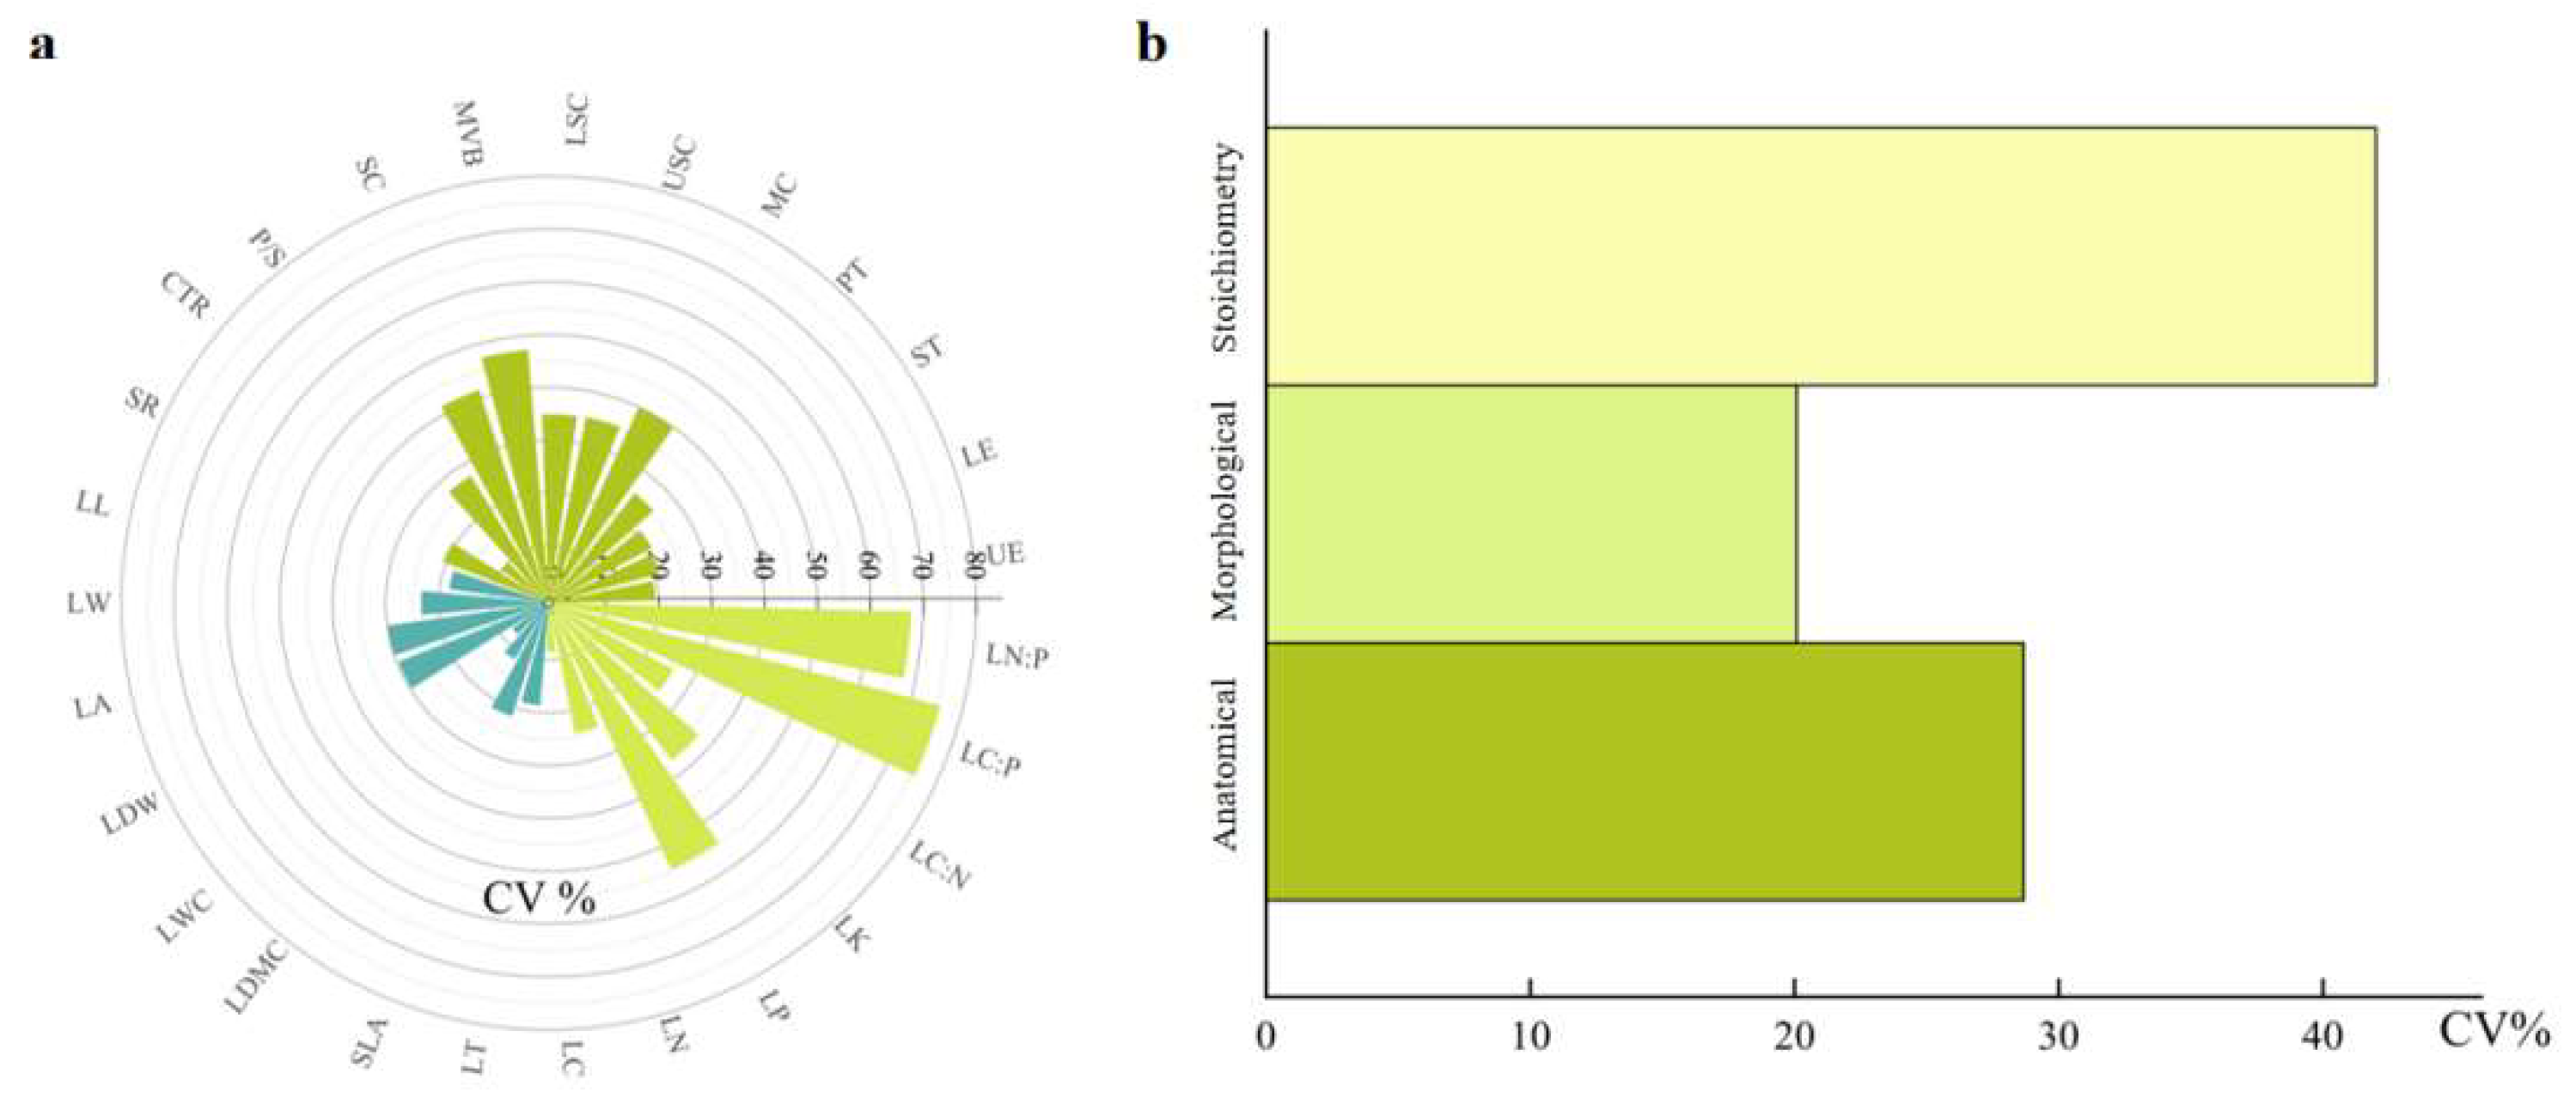
Figure 3.
The coefficient of variation of 27 leaf traits and the overall variation characteristics of the three types of leaf traits. (a) The coefficient of variation for the 27 leaf traits. (b) The overall variation characteristics of three types of leaf traits. (CTR: Cell tension ratio, P/S: The ratio of palisade tissue to sponge tissue, SC: Sclerenchyma, MVB: Median vascular bundle, LSC: Lower stratum corneum, USC: Upper stratum corneum, MC: Mucous cells, PT: palisade tissue, ST: Spongy tissue, LE: Lower epidermal thickness, UE: Upper epidermal thickness, LN:P: Leaf nitrogen to phosphorus ratio, LC:P: Leaf organic matter to phosphorus ratio, LC:N: Leaf organic matter to nitrogen ratio, LK: Leaf total potassium, LP: Leaf total phosphorus, LN: Leaf total nitrogen, LC: Leaf total organic matter, LT: Leaf thickness, SLA: Specific leaf area, LDMC: Leaf dry matter content, LWC: Leaf water content, LDW: Leaf dry weight, LA: Leaf area, LW: Leaf width, LL: Leaf length, and SR: Spongy ratio).
Figure 4.
Leaf trait network and whole leaf trait network of P. euphratica in 20 sampling sites (T1–T20) in the main stream of Tarim River. Note: Features with the same background color belong to the same module; the red line shows a positive correlation, the black line shows a negative correlation, the line width indicates the strength between traits, and the node size indicates the degree of the trait. K: Leaf total potassium, LDMC: Leaf dry matter content, PT: Palisade tissue, LT: Leaf thickness, CTR: Cell tension ratio, LWC: Leaf water content, P.S: The ratio of palisade tissue to sponge tissue, P: Leaf total phosphorus, UE: Upper epidermis thickness, SR: Spongy ratio, ST: Sponge tissue, LE: Lower epidermis thickness, LSC: Lower stratum corneum, USC: Upper stratum corneum, TWT: Sclerenchyma, N: Leaf total nitrogen, C.P: Leaf organic matter to phosphorus ratio, C: Leaf total organic matter, MVB: Midvein vascular bundle, LM: Leaf dry weight, SLA: Specific leaf area, C.N: Leaf organic matter to nitrogen ratio, N.P: Leaf nitrogen to phosphorus ratio, MC: Mucilage cells, LA: Leaf area, LW: Leaf width, and LL: Leaf length.
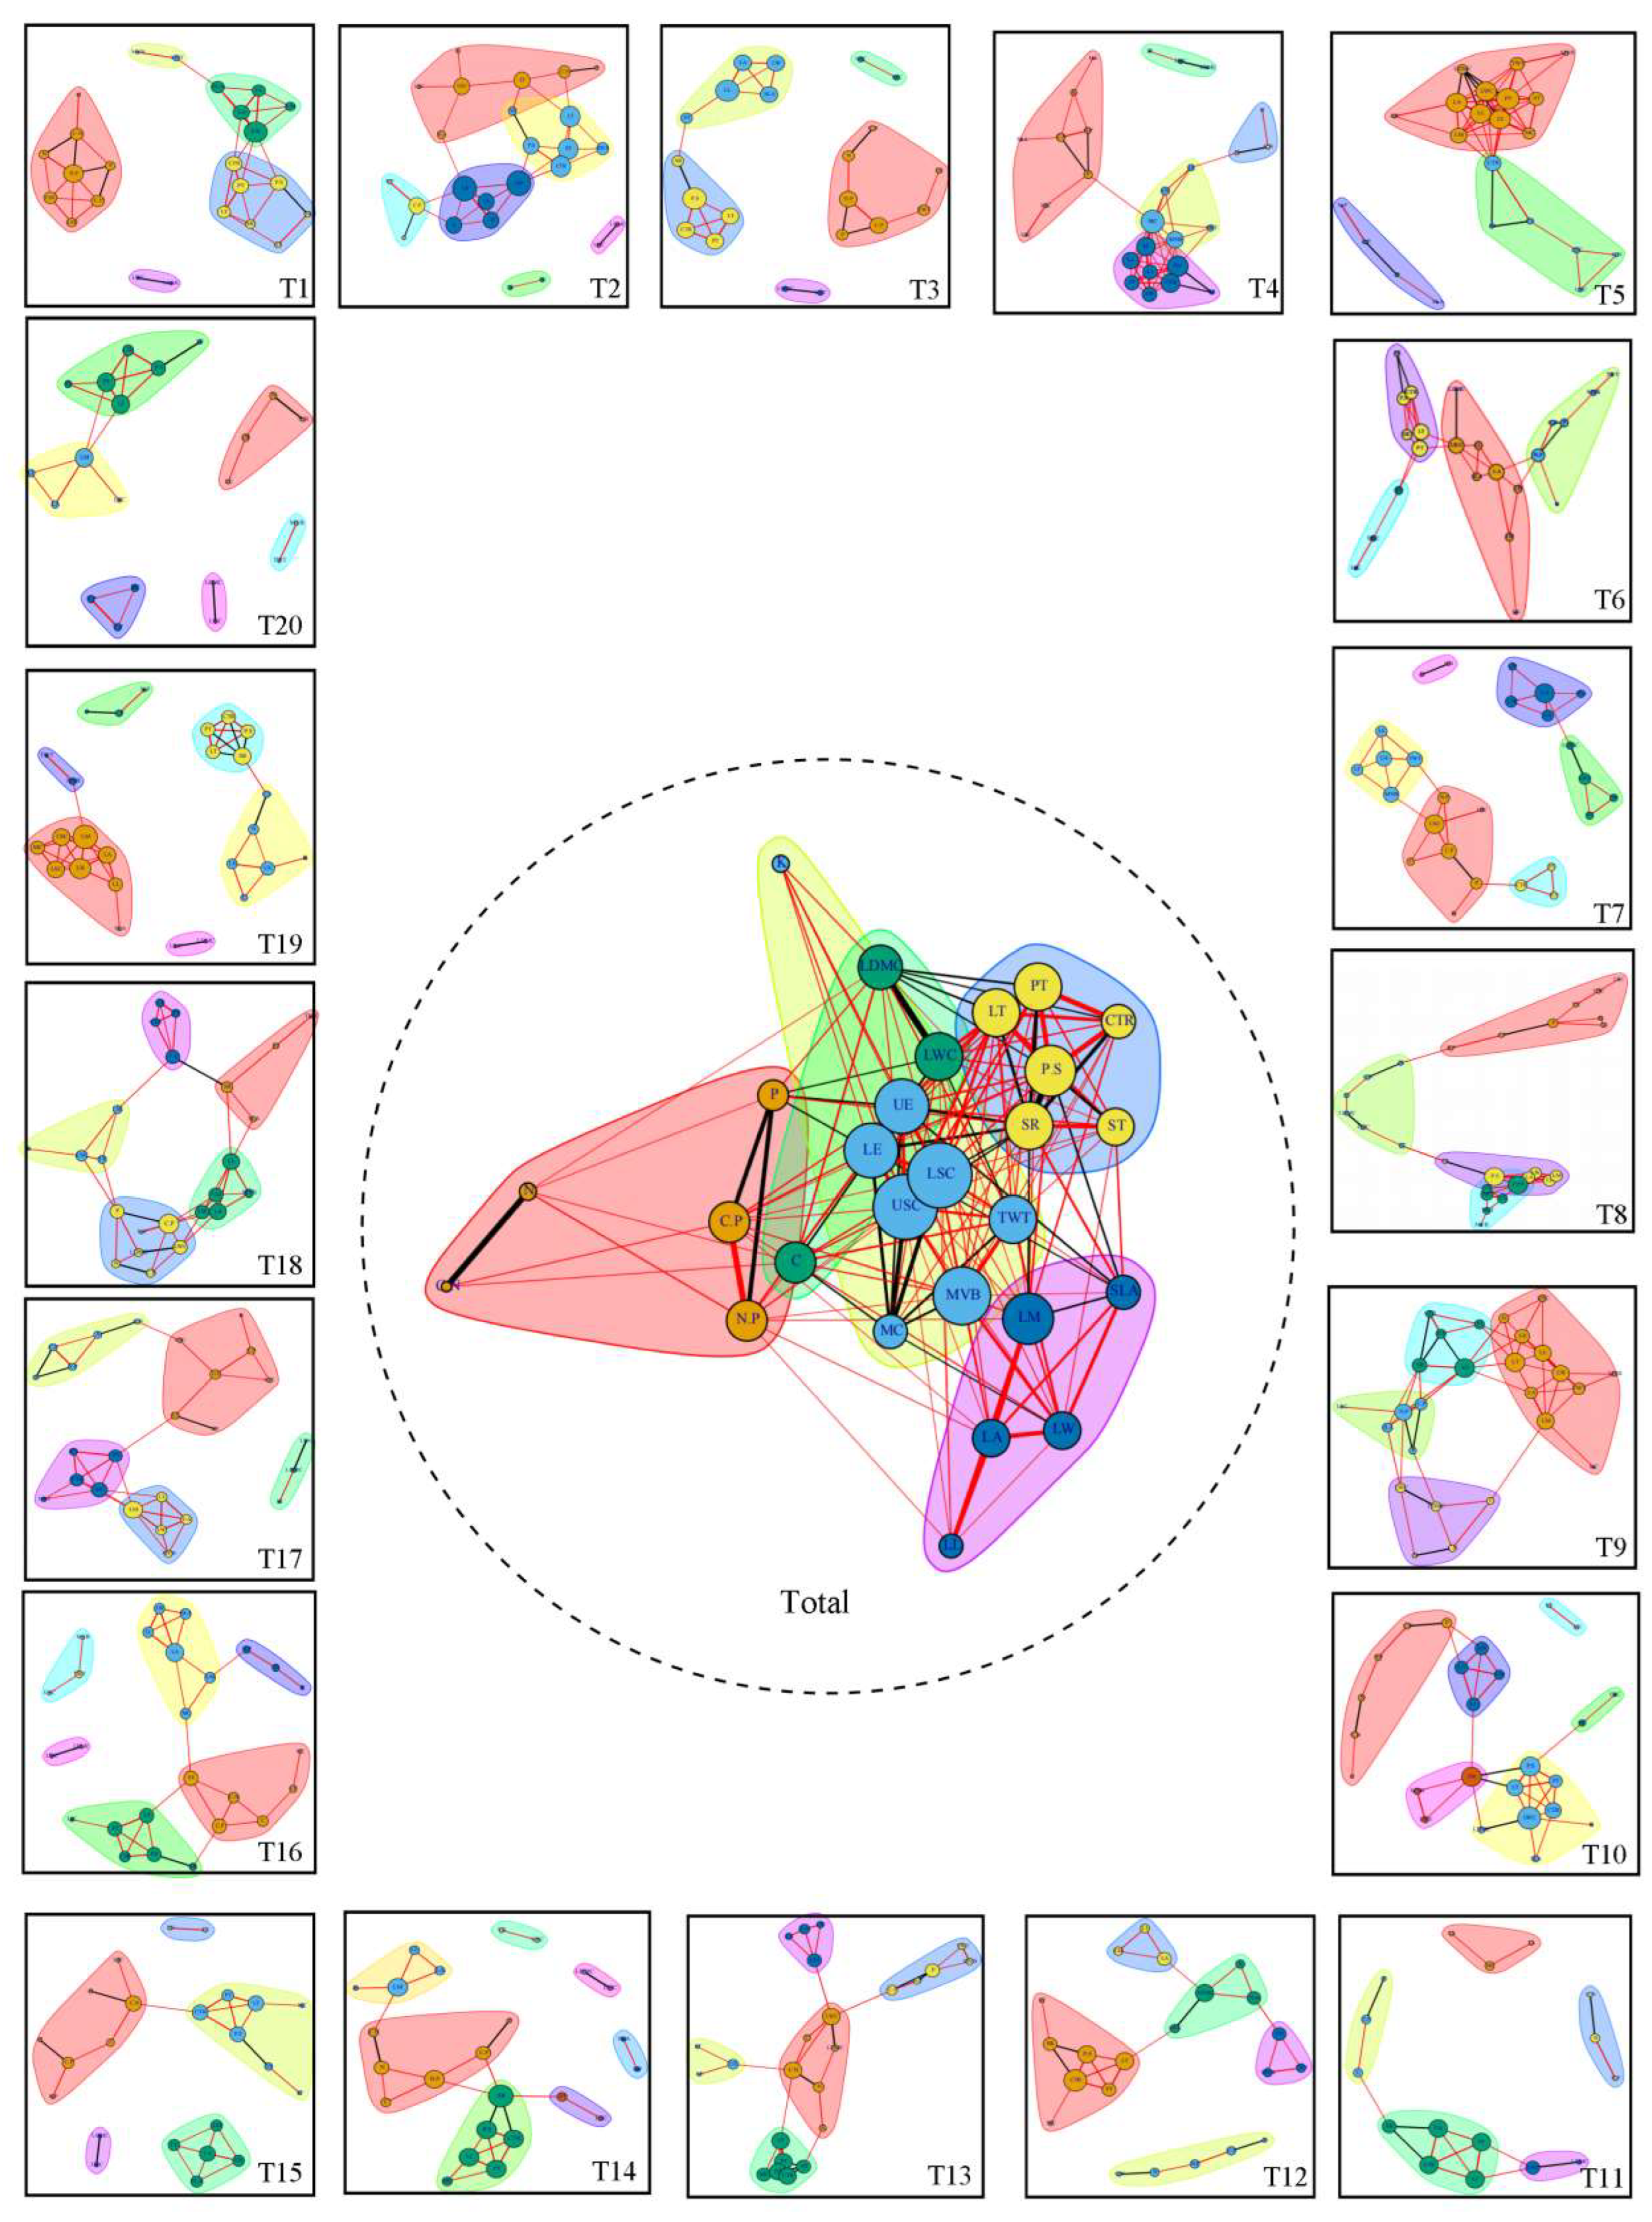
Figure 5.
The variability of network parameters in the main stream of Tarim River.
Figure 5.
The variability of network parameters in the main stream of Tarim River.
Figure 6.
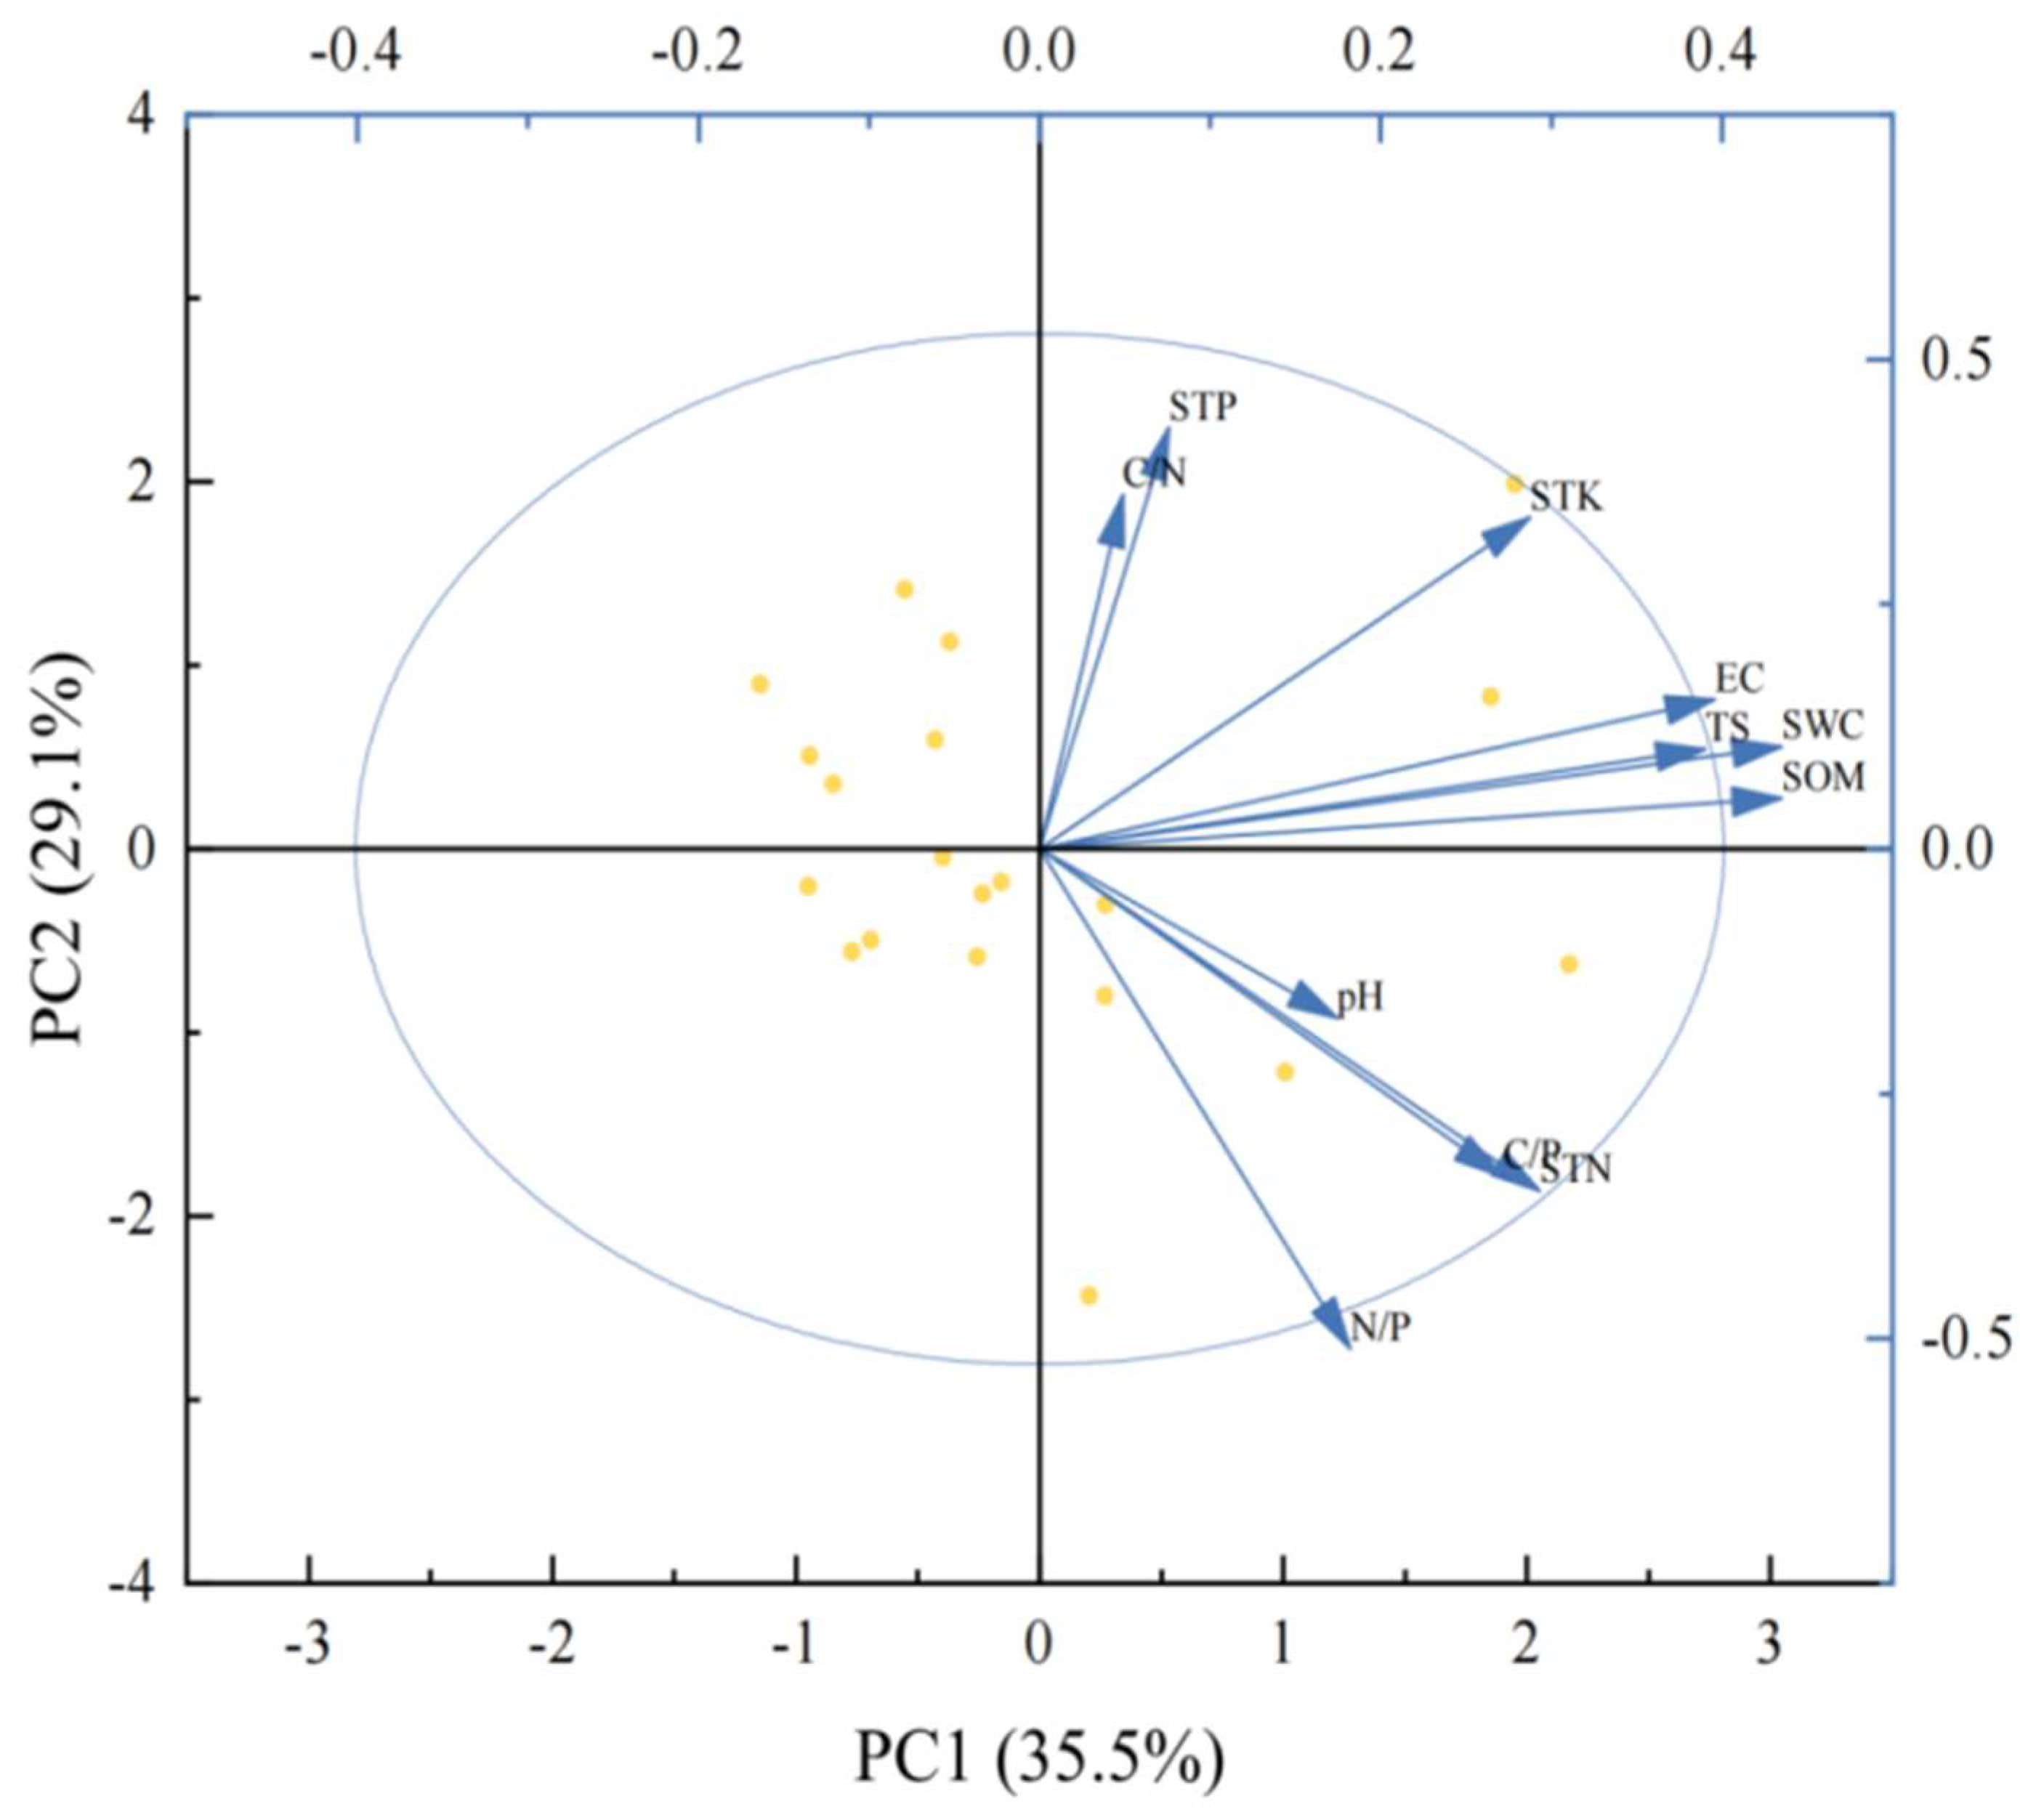
PCA analysis of soil factors. Note: C/N: Soil organic matter to nitrogen ratio, STP: Soil total phosphorus, STK: Soil total potassium, EC: Electrical conductivity, TS: Total salt, SWC: Water content, SOM: Soil total organic matter, pH: pH, C/P: Soil organic matter to phosphorus ratio, STN: Soil total nitrogen, and N/P: Soil nitrogen : phosphorus ratio.
Figure 7.
The relationships between overall parameters of leaf traits network and soil factors. Note: The shaded red area represents the 95% confidence interval and the black line represents the linear regression fit. SWC: Water content, STK: Soil total potassium, SOM: Soil total organic matter.
Figure 7.
The relationships between overall parameters of leaf traits network and soil factors. Note: The shaded red area represents the 95% confidence interval and the black line represents the linear regression fit. SWC: Water content, STK: Soil total potassium, SOM: Soil total organic matter.
Figure 8.
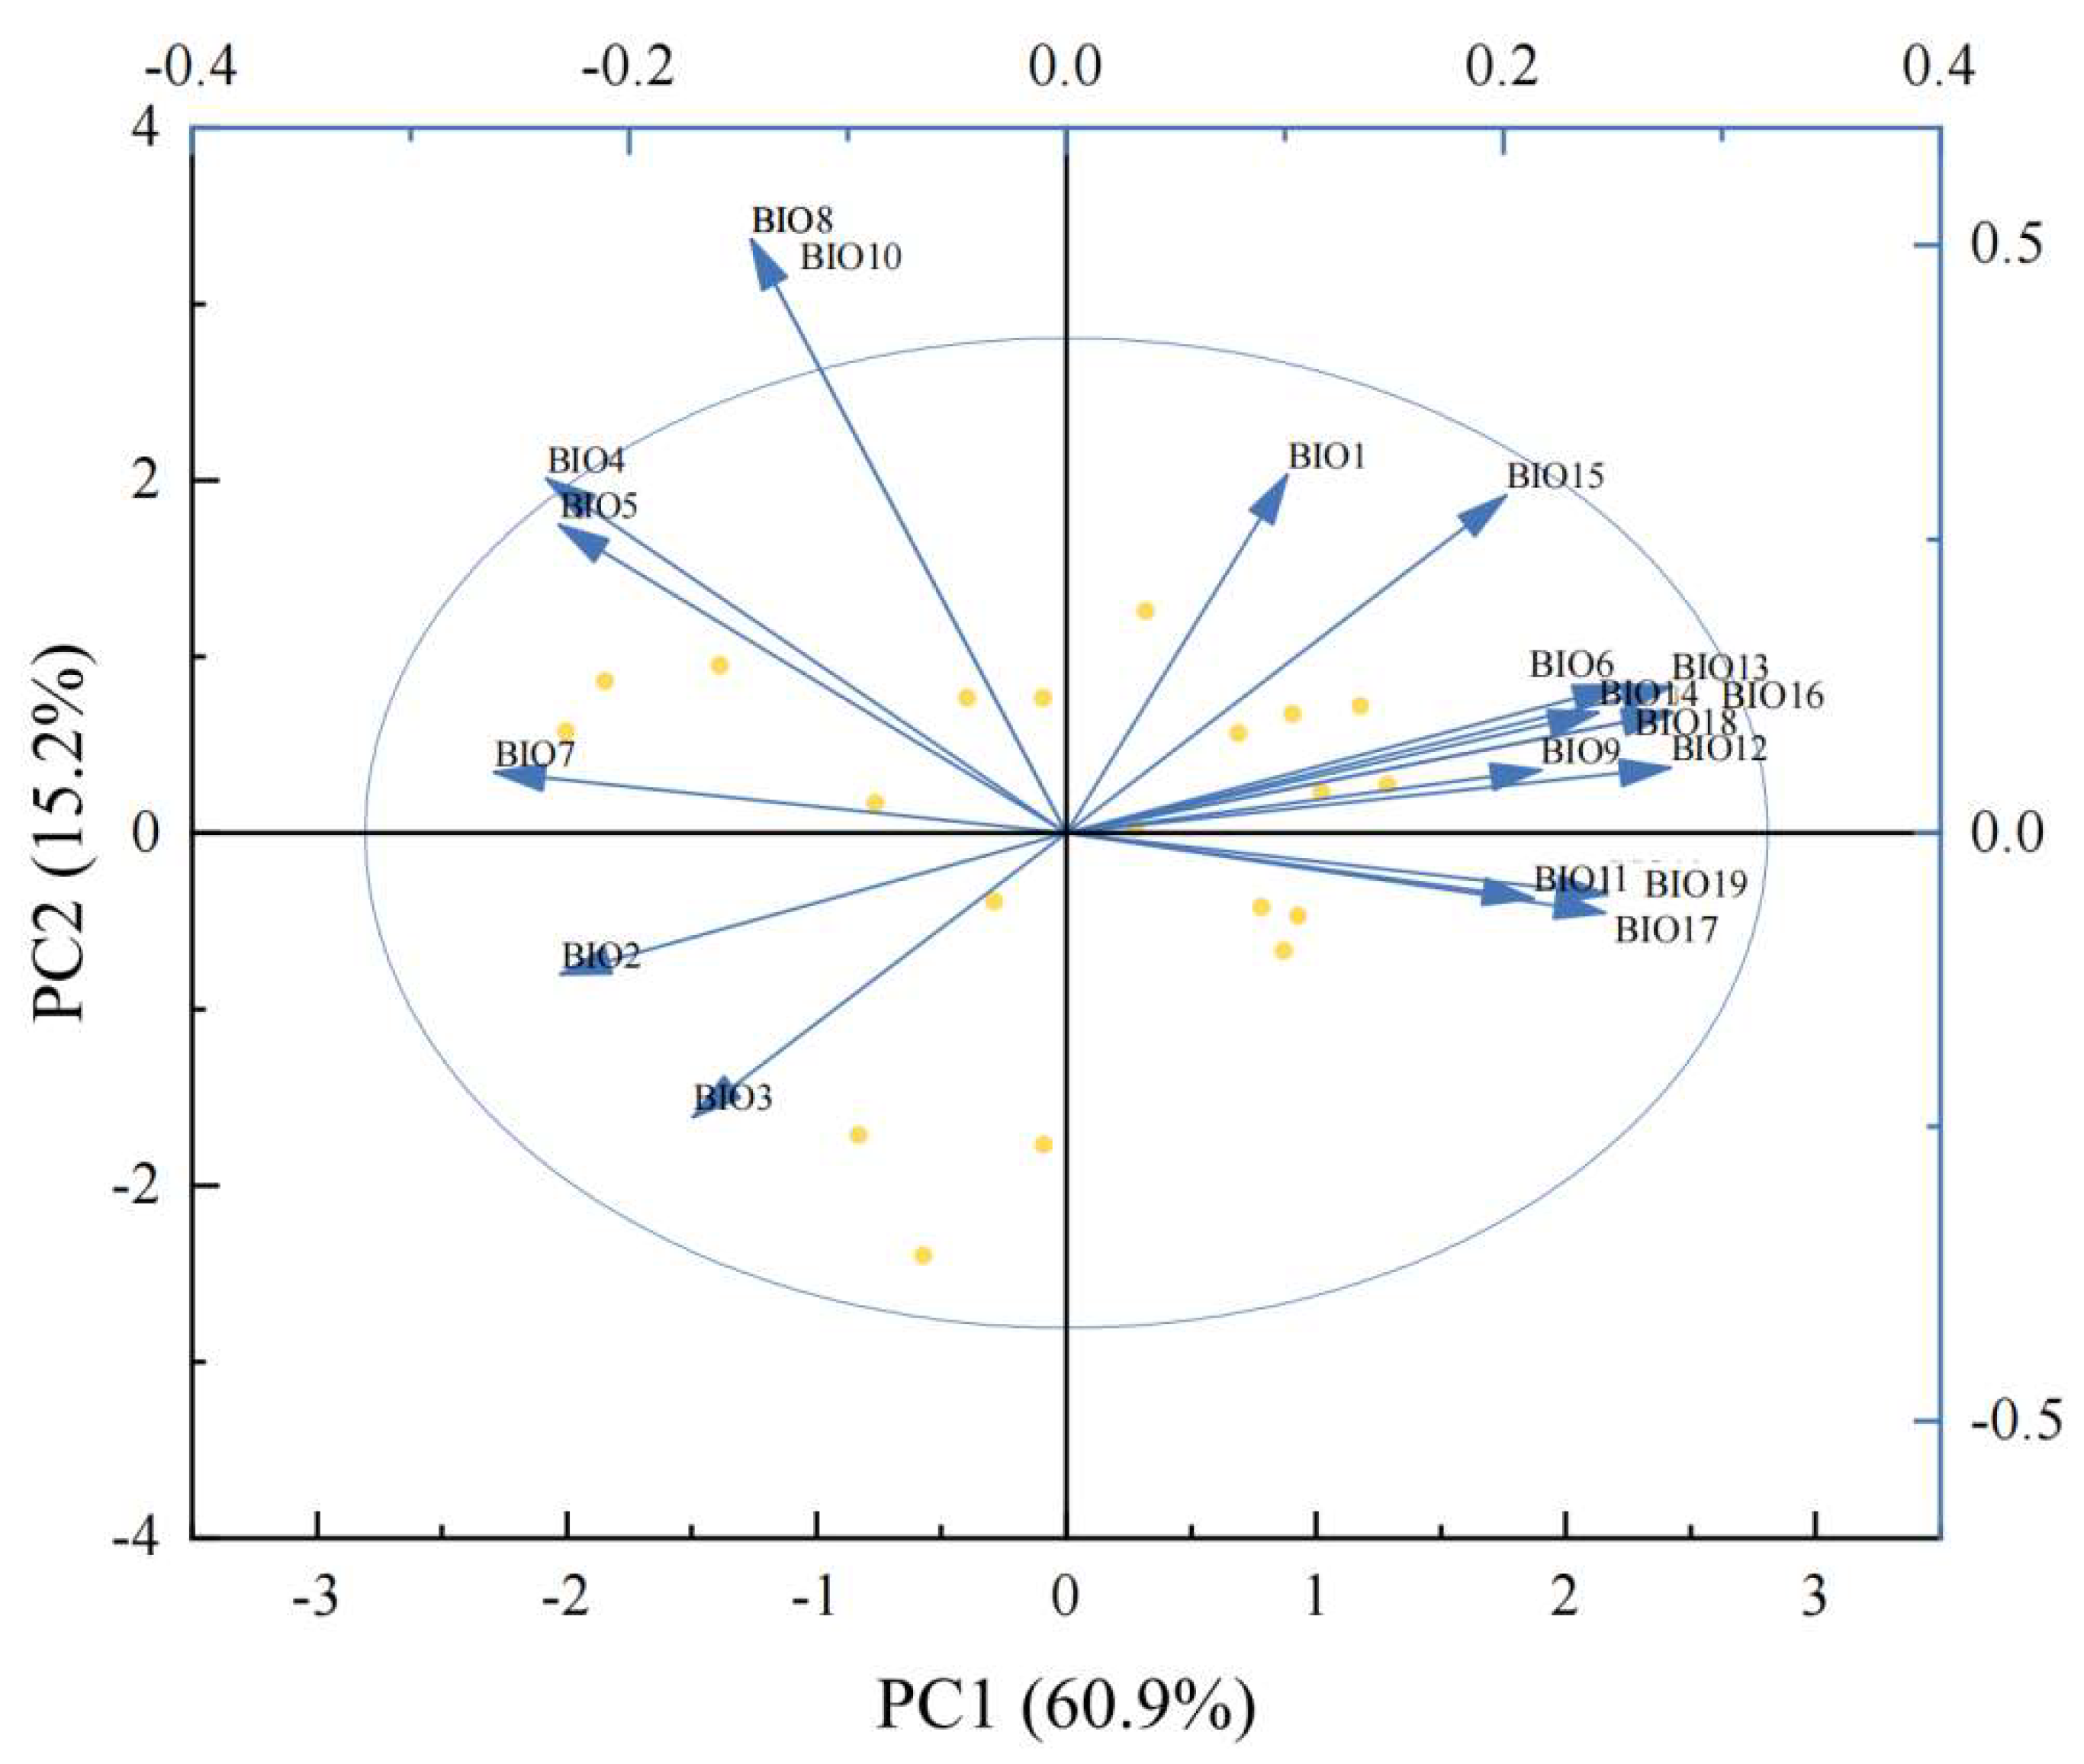
PCA analysis of climate factors. Note: BIO7: Temperature annual range, BIO5: Max temperature of warmest month, BIO4: Temperature seasonality, BIO8: Mean temperature of wettest quarter, BIO10: Mean temperature of warmest quarter, BIO1: Annual mean temperature, BIO15: Precipitation seasonality, BIO6: Min temperature of coldest month, BIO13: Precipitation of wettest month, BIO14: Precipitation of driest month, BIO16: Precipitation of wettest quarter, BIO18: Precipitation of warmest quarter, BIO9: Mean temperature of driest quarter, BIO12: Annual precipitation, BIO11: Mean temperature of coldest quarter, BIO19: Precipitation of coldest quarter, BIO17: Precipitation of driest quarter, BIO3: Isothermality, and BIO2: Mean diurnal range.
Figure 9.
Relationship between overall parameters of leaf traits network and climatic factors. Note: The shaded red area represents the 95% confidence interval and the black line represents the linear regression fit. BIO3: Isothermality, BIO6: Min temperature of coldest month, BIO13: Precipitation of wettest month.
Figure 10.
Interpretation degree of climate and soil to network parameters.
Figure 10.
Interpretation degree of climate and soil to network parameters.
