1. Introduction
Apples are the most widely grown fruit in temperate climate regions, leading in both cultivated area and consumption volume [
1]. Brazil is a major player in the global apple industry, producing approximately 1.38 million tons of apples annually, with 6.9% of this production being exported [
2,
3]. Apple cultivation ranks among the country’s top six fruit crops, predominantly grown in the southern regions, including the municipalities of Vacaria in Rio Grande do Sul, Fraiburgo and São Joaquim in Santa Catarina, and Palmas in Paraná [
4,
5].
In the realm of apple cultivation, rootstocks play a crucial role [
6]. They are employed for various purposes such as reducing plant vigor, providing resistance to pests and diseases, adapting to different soil conditions, inducing early fruiting, and enhancing orchard productivity. In recent decades, advancements in clonal rootstocks developed through genetic improvement have revolutionized the apple production chain [
7,
8,
9,
10].
In Brazil, the predominant rootstocks were Marubakaido [
11]. ‘Marubakaido’ rootstock is recognized for its vigor and resistance to crown rot and woolly aphid [
12]. Traditionally, apple rootstocks are propagated by stool layering [
13,
14]. This method is slow, yields low output, is labor-intensive, and requires extensive physical space [
13,
14,
15]. Additionally, it may inadvertently propagate materials with phytosanitary issues[
16,
17]
In vitro vegetative propagation has been researched to produce vegetative material for apples [
15,
18], aiming at mass multiplication of cultivars and production of pathogen-free plants [
14]. Also known as micropropagation, this technique involves the true-to-type reproduction of genetically valuable plants through the cultivation of plant segments in an artificial medium under aseptic conditions [
19,
20,
21,
22].
High mortality rates of seedlings during the acclimatization phase are common in in vitro propagation systems [
19,
20,
21,
22]. Therefore, strategies that modify the environment, especially during the final stages of micropropagation, are necessary to make the seedlings more robust and improve their survival in subsequent stages [
23,
24,
25]. To enhance the efficiency of in vitro propagation techniques, factors such as temperature, humidity, ventilation, and light should be optimized [
26]. Among these, light is the most important factor, capable of significantly regulating plant growth and development [
27].
In vitro plant growth rooms are typically equipped with artificial light sources, mainly fluorescent lamps [
28]. However, fluorescent lamps have undesirable characteristics such as high energy consumption and heat generation, along with varied wavelength peaks, some of which are not necessary for seedling development [
27].
Light-emitting diodes (LEDs) were introduced in 1960 for plant production in closed systems. From 1960 to 2024, significant advancements were made in the architecture, construction, and enhancement of these artificial light sources. In 1961, the first infrared LEDs were patented. LEDs are known for their high efficiency, high luminous intensity, low-intensity discharge of far-red and red light, and broad wavelength spectrum, which includes ultraviolet (250–380 nm), visible light (380–760 nm), and infrared light (760–1000 nm) [
29].
Light Emitting Diodes (LEDs) are being evaluated and have shown satisfactory results in plant tissue culture [
27,
30]. LEDs provide specific peaks within the range most favorable to plants [
31], and allow for the precise selection of desired wavelengths [
32]. They also offer other advantages, such as high luminous efficiency with minimal heating, long lifespan, absence of heavy metals, and low energy consumption [
27,
33].
Several studies have been conducted to investigate the effects of monochromatic lights, either alone or in combination (two or more colors), on the growth and morphogenesis of a wide variety of in vitro-cultivated seedling species [
27]. According to these studies, various characteristics are affected, such as vegetative seedling growth [
34], the formation of photosynthetic pigments [
26,
35], and stomatal development, among others [
36,
37].
This study aimed to evaluate the effect of using LEDs as light sources on the in vitro rooting of apple rootstocks of the Marubakaido cultivars.
2. Materials and Methods
Minicuttings approximately 15 mm in length, derived from in vitro pre-established seedlings of the Marubakaido apple rootstock cultivar, were used as explants. These were obtained from in vitro culture stocks representing five generations of clonal rootstock propagation originating from a living collection.
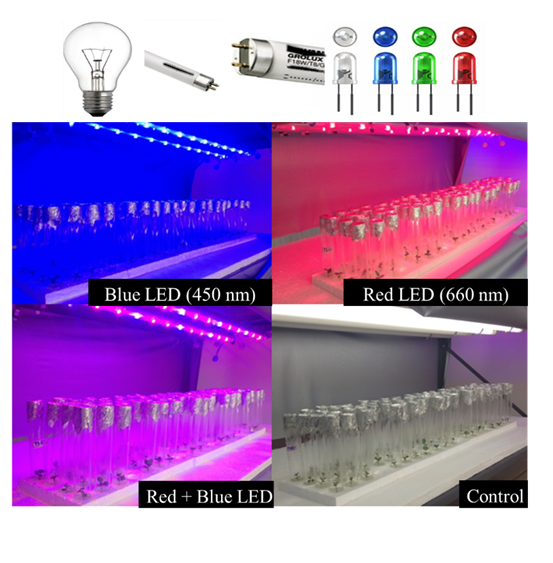
The experiments were conducted in a completely randomized design with four treatments. The treatments consisted of four lighting sources: blue LED (450 nm), red LED (660 nm), red + blue LED (10 diodes of 660 nm and 4 diodes of 450 nm), and fluorescent lamp (control). For the Marubakaido cultivar seedlings, variables such as height, number of leaves and roots, fresh and dry mass of the aerial part and roots, and chlorophyll and carotenoid content were evaluated. Five replications of eight seedlings each were used.
The culture medium used was MS [
38] with half the concentration of macronutrients and micronutrients, and iron chelate (FeEDTA) and ethylenediaminetetraacetic acid (EDTA), supplemented with 1.0 mg/L indoleacetic acid (IAA) and 30.0 g/L sucrose.
The culture medium was distributed in 6.0 mL aliquots into 50 cm³ test tubes. The tubes were sealed with 7.0 x 7.0 cm aluminum foil and sterilized by autoclaving at 121°C and 1.05 kg/cm² pressure for 15 minutes.
After disinfecting the Laminar Flow Hood with 70% ethanol and sterilizing it with UV light (100 to 280 nm) for 20 minutes, the explant inoculation process began. Using tweezers and scissors, the mini-cuttings were isolated and inoculated into the culture medium vertically in the tubes, ensuring each tube contained one explant.
In the growth room, the shelves were equipped with two tubular lamps each. The first shelf was equipped with blue LED lamps (Tecnal®, Tec-Lamp, 14 diodes of 450 nm, 28 W, 99.6 ± 20.4 µmol m-² s-¹, 900 mm), the second with red LED lamps (Tecnal®, Tec-Lamp, 14 diodes of 660 nm, 28 W, 82.2 ± 13.0 µmol m-² s-¹, 900 mm), the third with red and blue LED lamps (Tecnal®, Tec-Lamp, 10 diodes of 660 nm and 4 diodes of 450 nm, 28 W, 81.8 ± 14.3 µmol m-² s-¹, 900 mm), and the last with fluorescent lamps (Osram®, T8 FO 32W/640, 24.4 ± 4.4 µmol m-² s-¹, 1200 mm). Light-blocking curtains (Blackout®) were installed at the ends to prevent interference from other light sources.
The tubes containing the inoculated explants were transferred to the Growth Room, where they remained for 30 days under controlled environmental conditions: a temperature of 25 ± 2°C, a 16-hour photoperiod, and different lighting conditions. The environmental factors were monitored throughout the rooting period of the seedlings.
After removing the plant material from the test tubes, evaluations were conducted for height, number of leaves and roots, and fresh and dry mass of shoots and roots. Height was measured using a caliper, recording the distance between the collar region and the insertion of the last leaf. The number of leaves and roots was then counted. The shoots and roots were separated and weighed to obtain the fresh mass, then placed separately in paper bags and transferred to an oven for drying at 60°C. After 96 hours, the dry mass was measured.
Samples (approximately 150 mg of fresh mass) were randomly collected and ground in a mortar with a pestle. The macerate was filtered, and ethanol (NEON®, 95%) was added to make up 50 mL in a volumetric flask, previously wrapped with aluminum foil. The extract was analyzed using a UV-VIS spectrophotometer (Varian Cary 50) with readings at 664 nm for chlorophyll a, 648 nm for chlorophyll b, and 470 nm for carotenoids. The absorbance values obtained were substituted into LICHTENTHALER’s equations (1987), and the final values were expressed in milligrams per gram of fresh mass (mg/g).
2.1. Statistical Analysis
The data obtained from the four independent treatments were assessed for normality and homogeneity using the Shapiro-Wilk test and Bartlett’s test, respectively. When the data were both homogeneous and normally distributed, the four treatments were compared using a one-way ANOVA (a parametric test). If the data were not normally distributed, the treatments were compared using the Kruskal-Wallis test (a nonparametric test) [
39]. Hypothesis testing (one-way ANOVA and Kruskal-Wallis) was carried out at a 95% confidence level (p-value < 0.05). The Tukey test was used as the post hoc test following the one-way ANOVA, while the Dwass-Steel-Critchlow-Fligner pairwise comparisons were used with the Kruskal-Wallis test. All post hoc tests were conducted with a 95% confidence interval. These tests were performed using JAMOVI (version 2.3.28) [
40]. Boxplots with violin plots, created using JASP (version 0.18.3.0), were used to represent the data from the four independent treatments [
41,
42,
43,
44,
45]. Principal component analysis (PCA) was conducted using JAMOVI’s MEDA plugin [
44,
45].
3. Results and Discussion
The vegetative growth parameters measured for Marubakaido apple rootstock seedlings which were grown using LEDs and a florescent lamp, were provided in
Table 1.
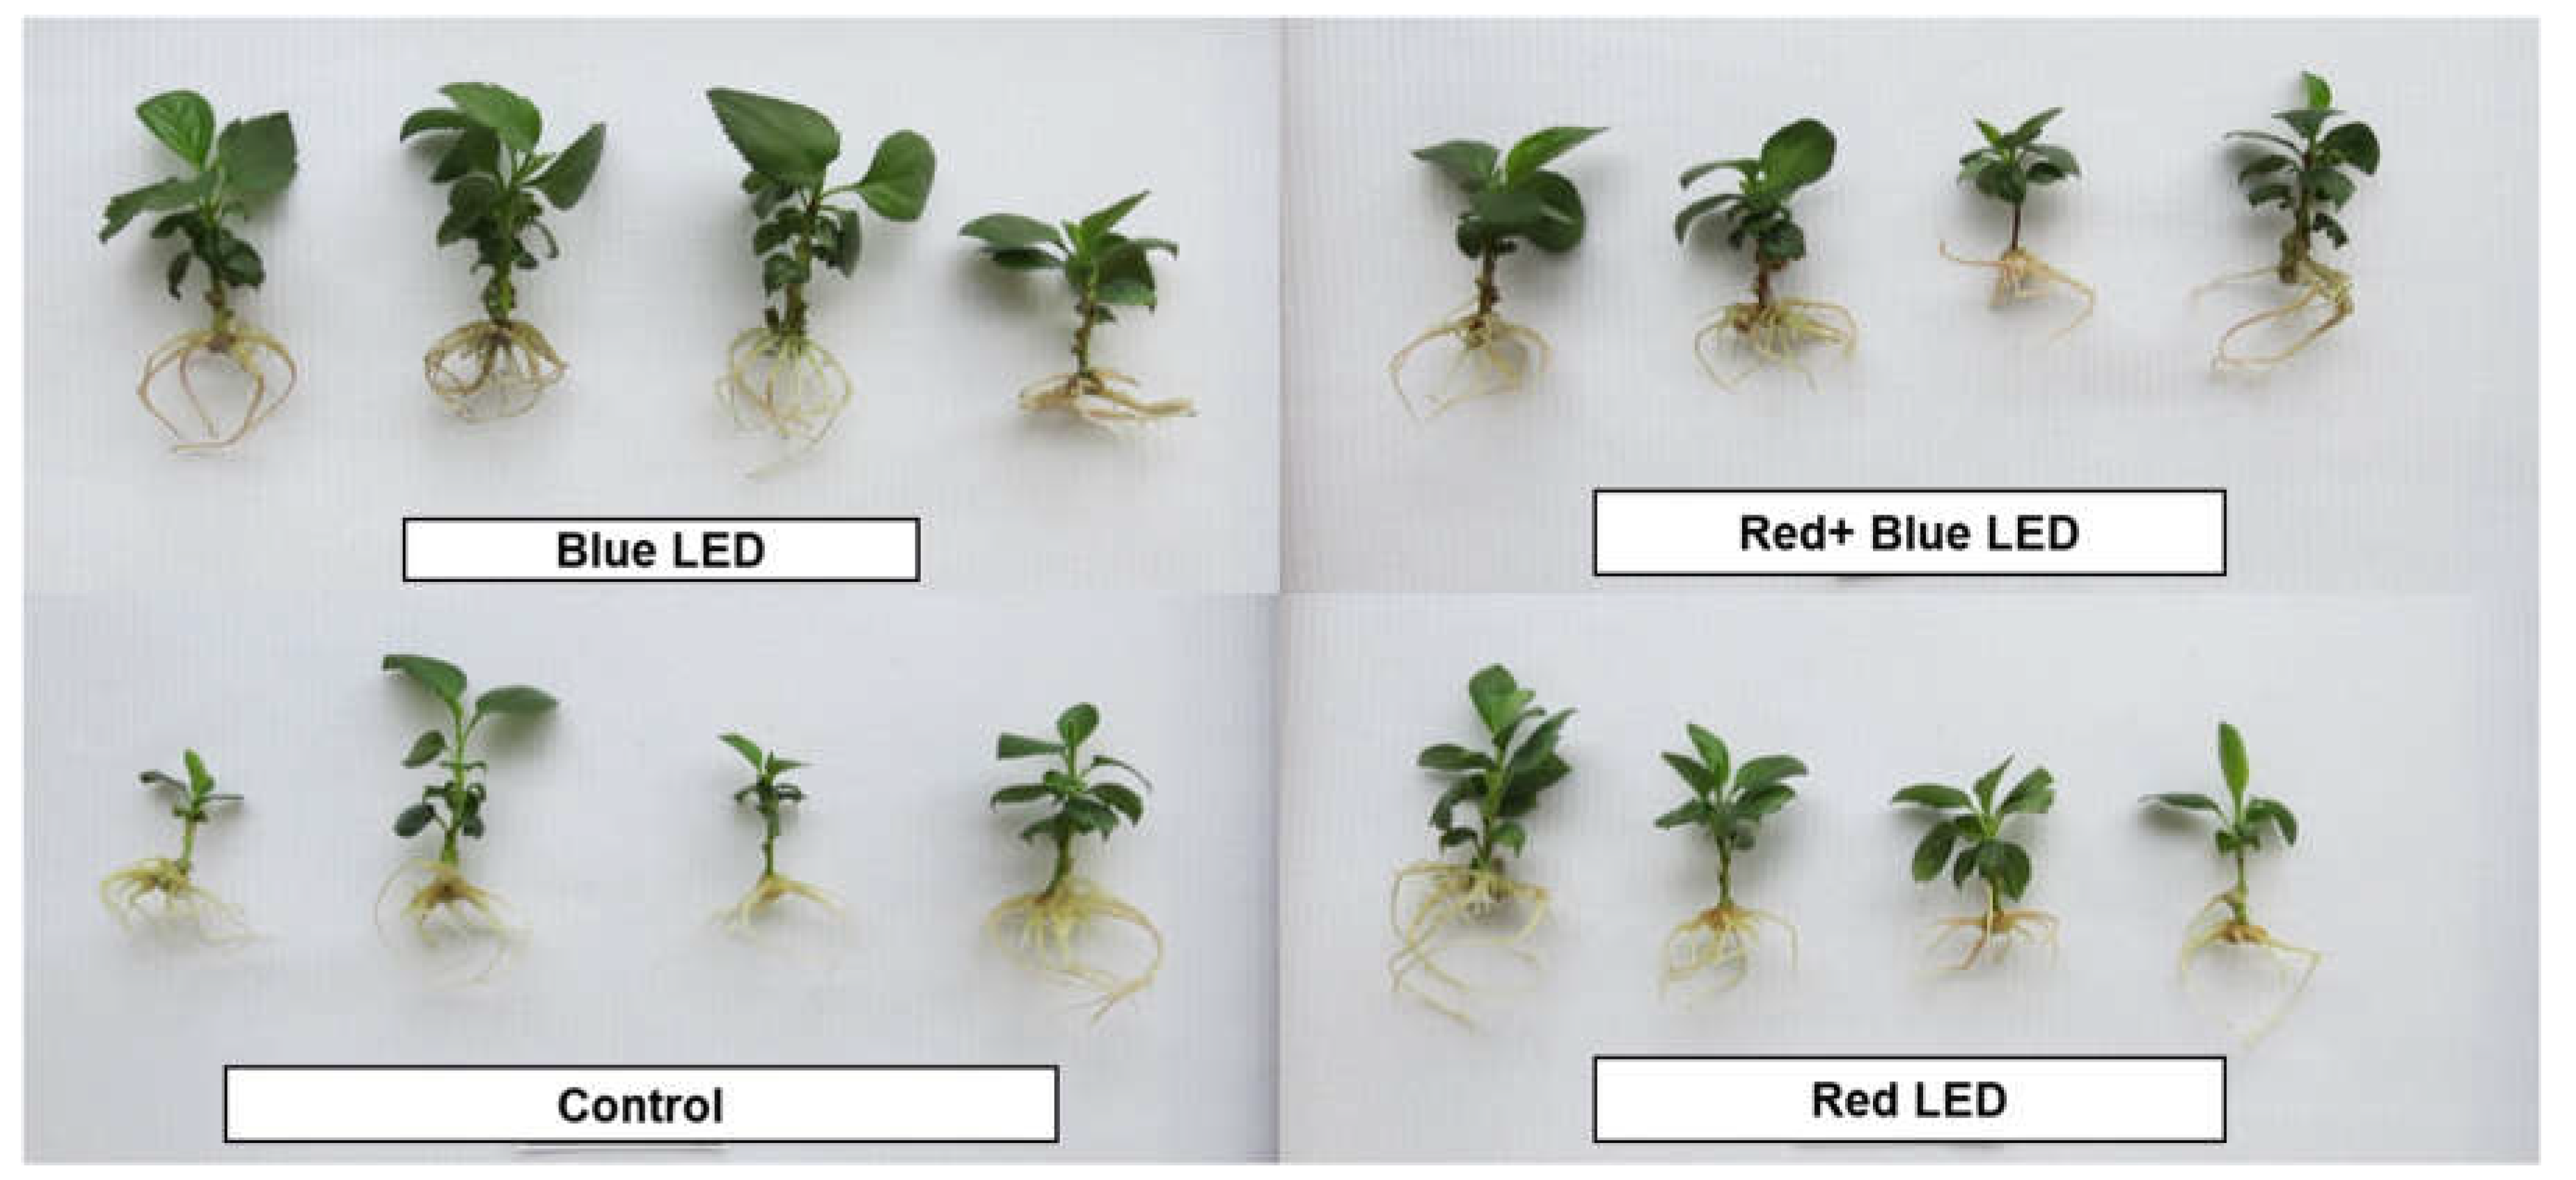
Figure 1 shows the Seedlings of the Marubakaido apple rootstock cultivar obtained using LEDs and a fluorescent lamp (control).
3.1. Height
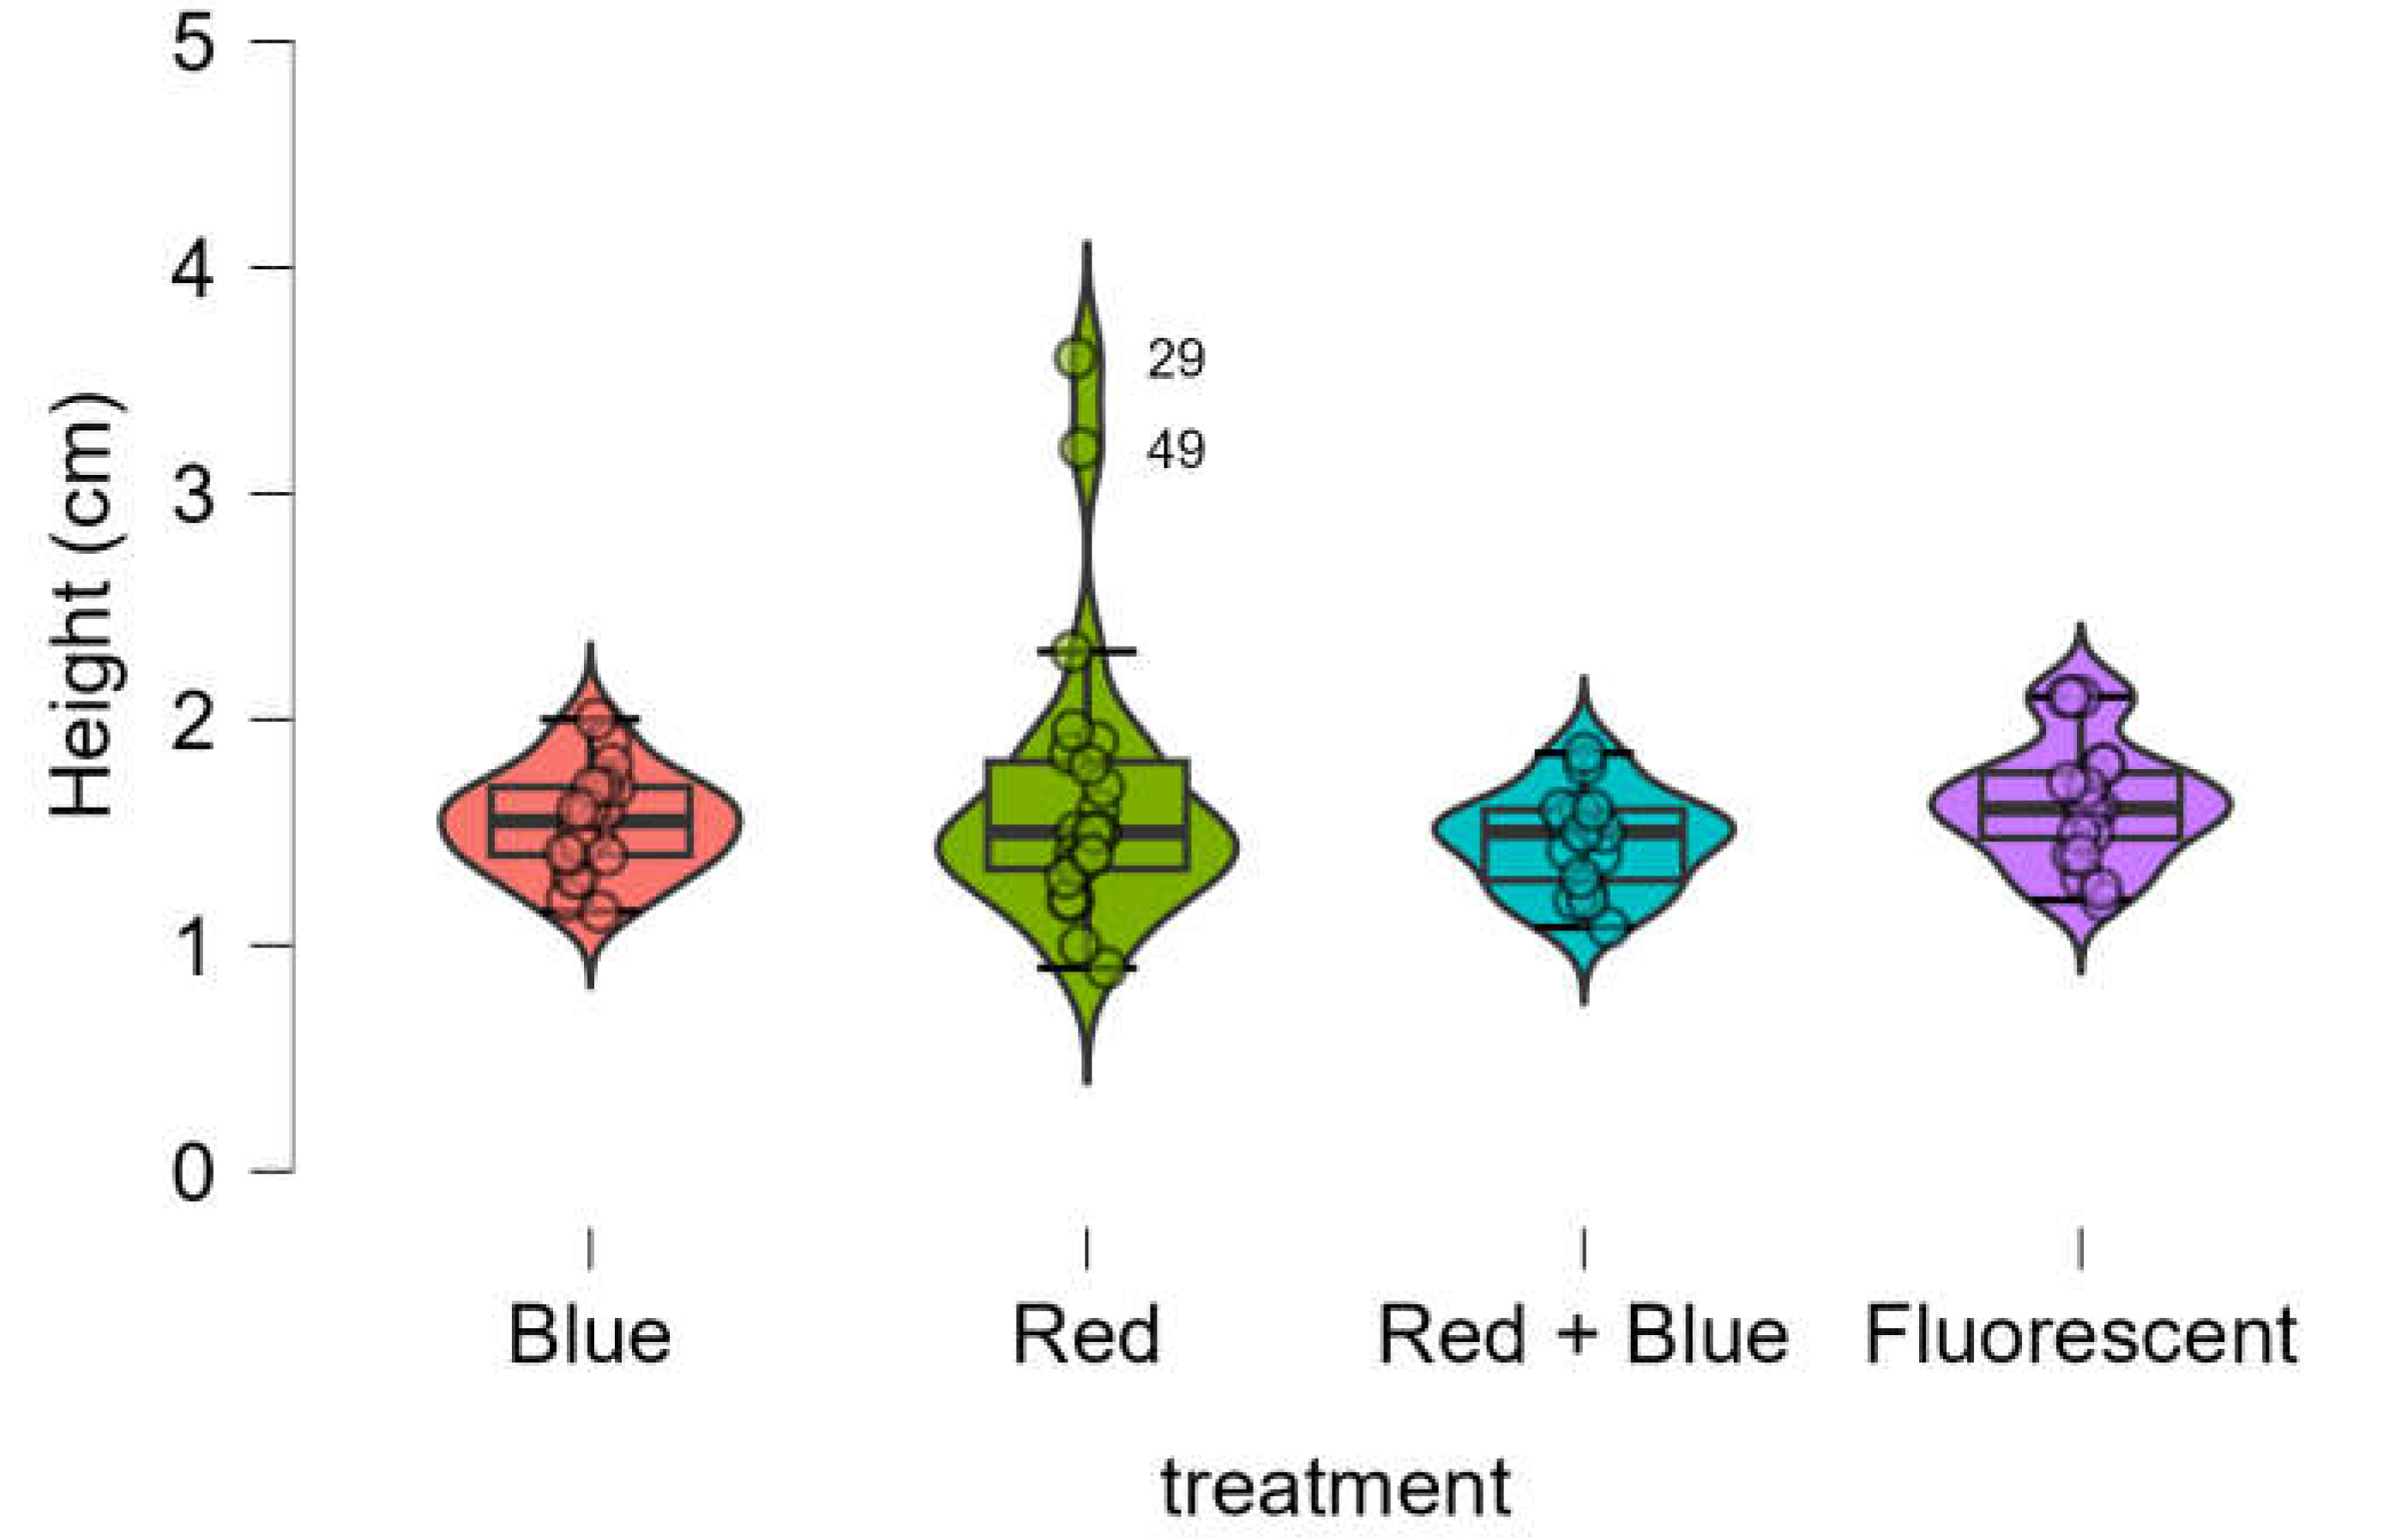
No significant differences were observed in the height of
Marubakaido apple rootstock seedlings among the four treatments, as all provided equivalent results (
Figure 2). The Shapiro-Wilk test indicated that the data was not normally distributed (p-value < 0.001). Consequently, the Kruskal-Wallis test was used and confirmed that the heights obtained from the four treatments were statistically equivalent (p-value = 0.304).
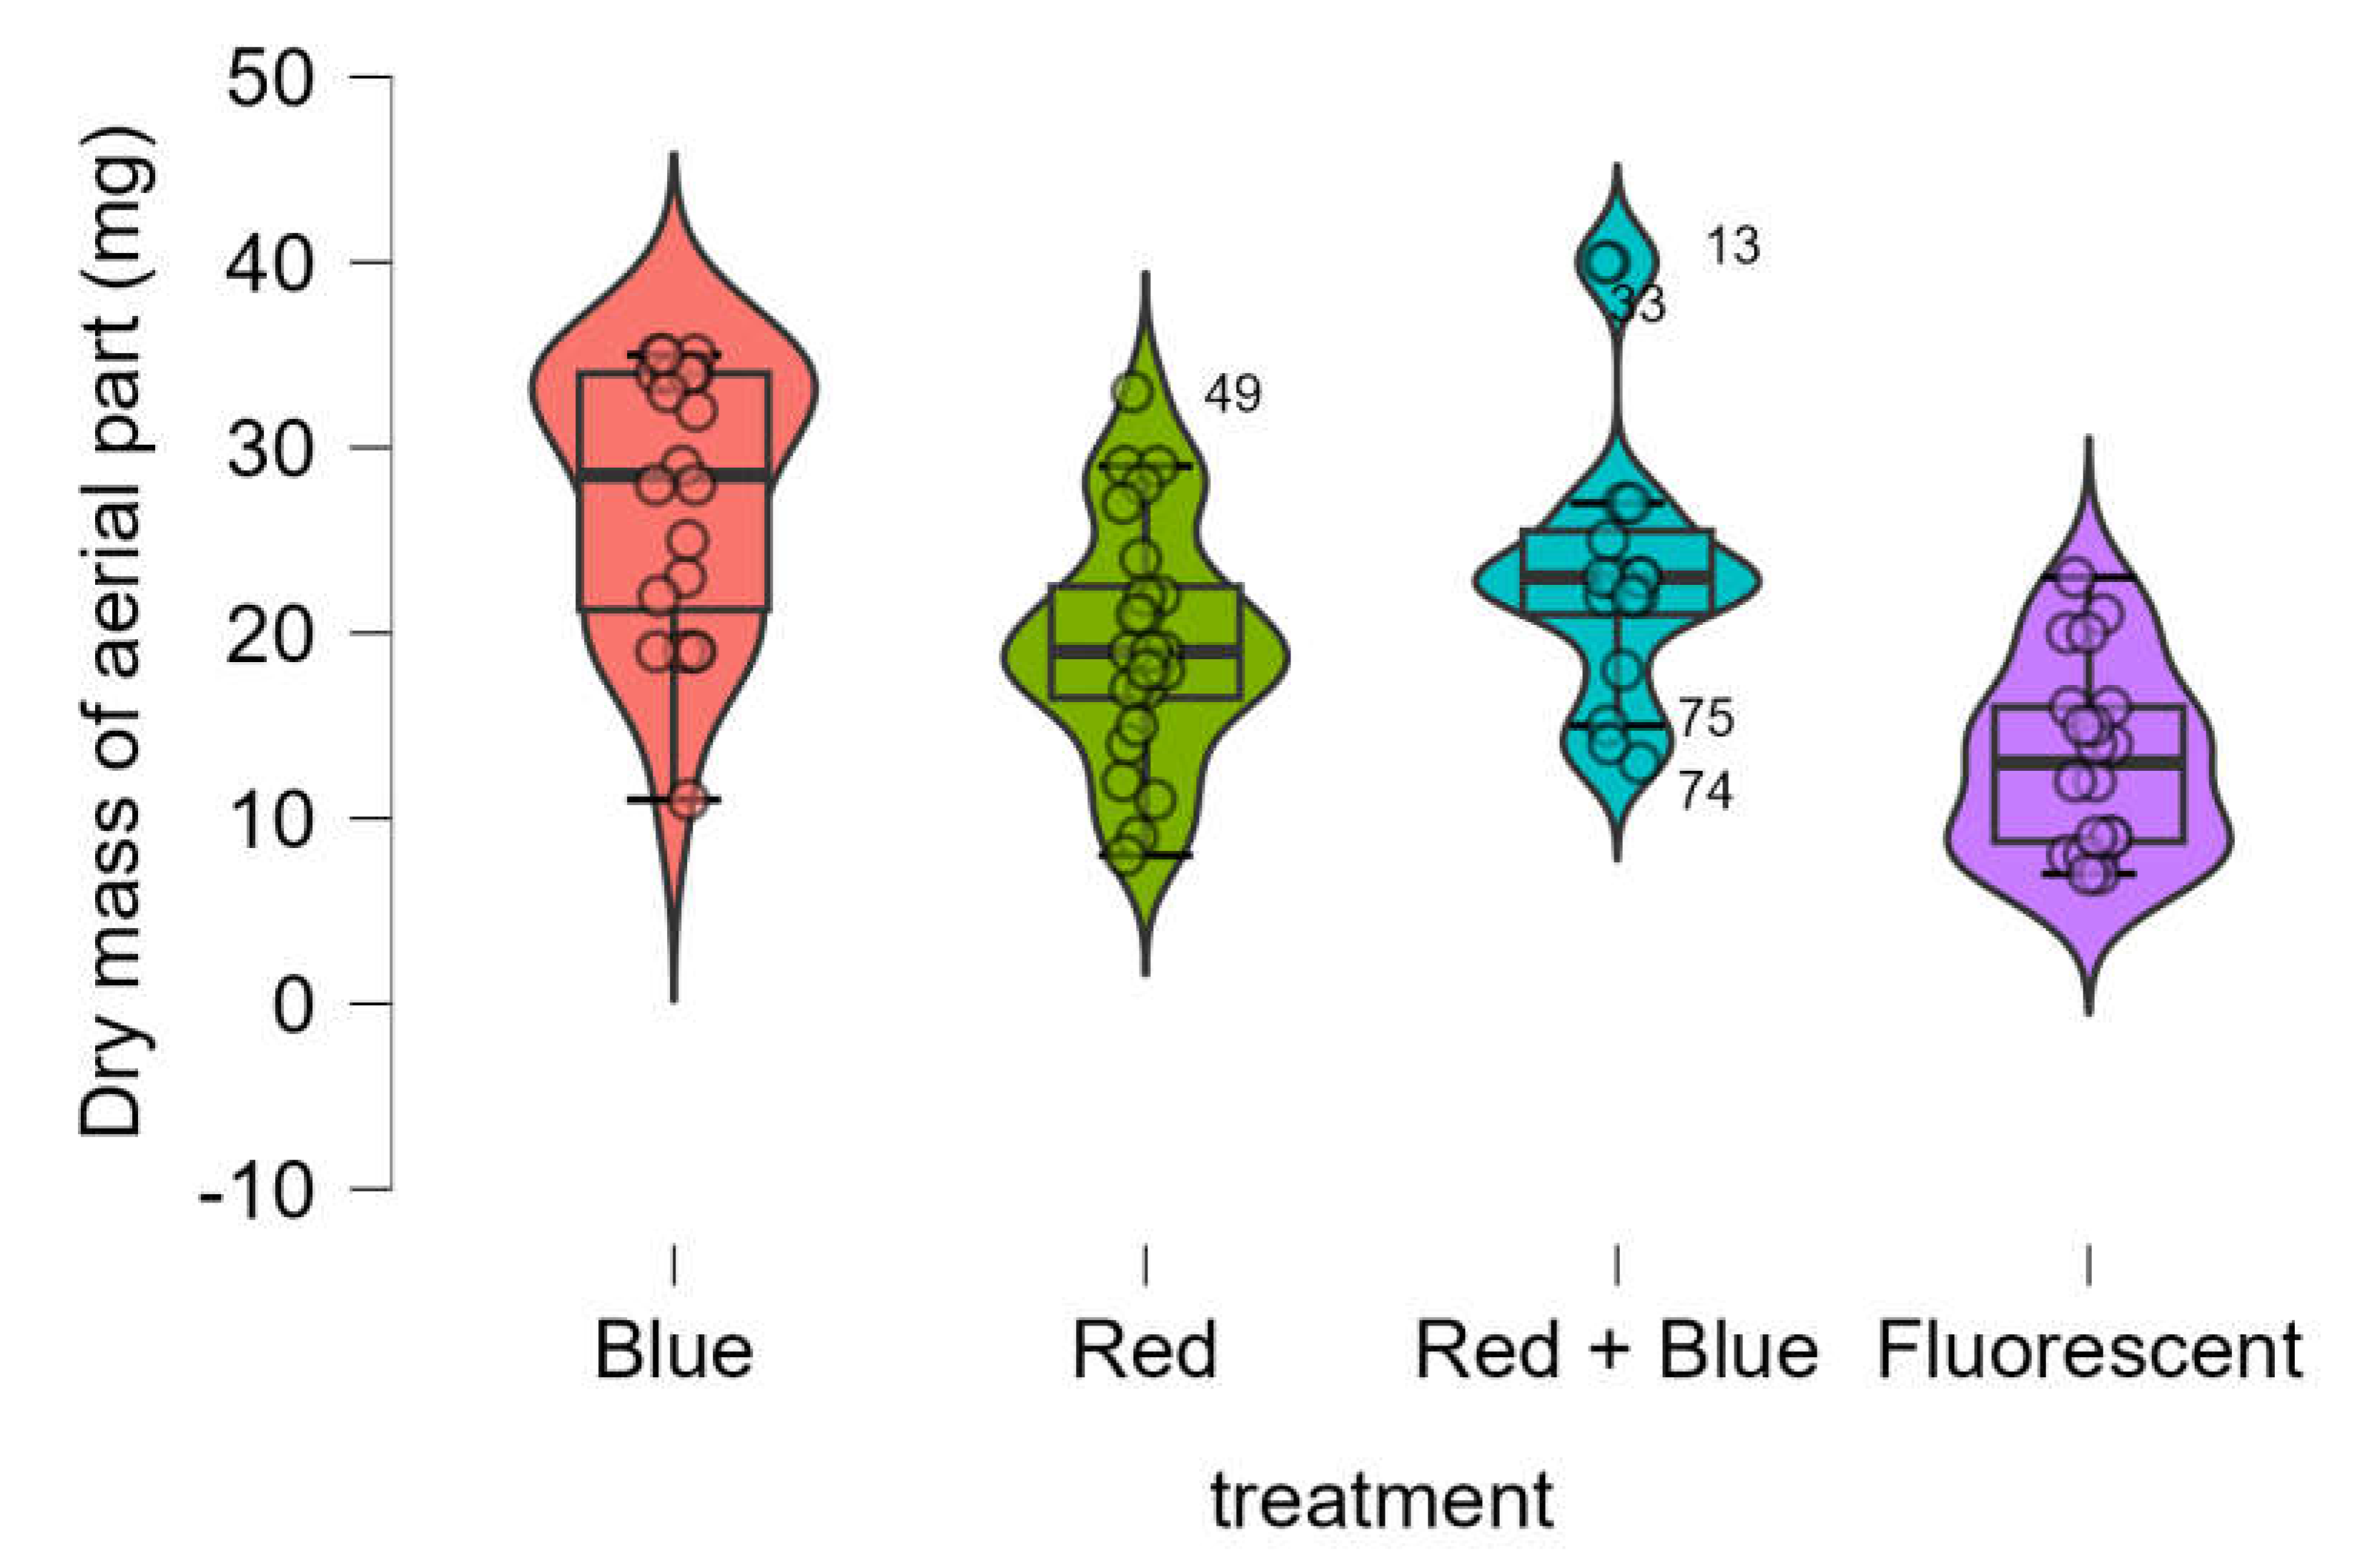
3.2. Dry and Fresh Mass of the Aerial Parts
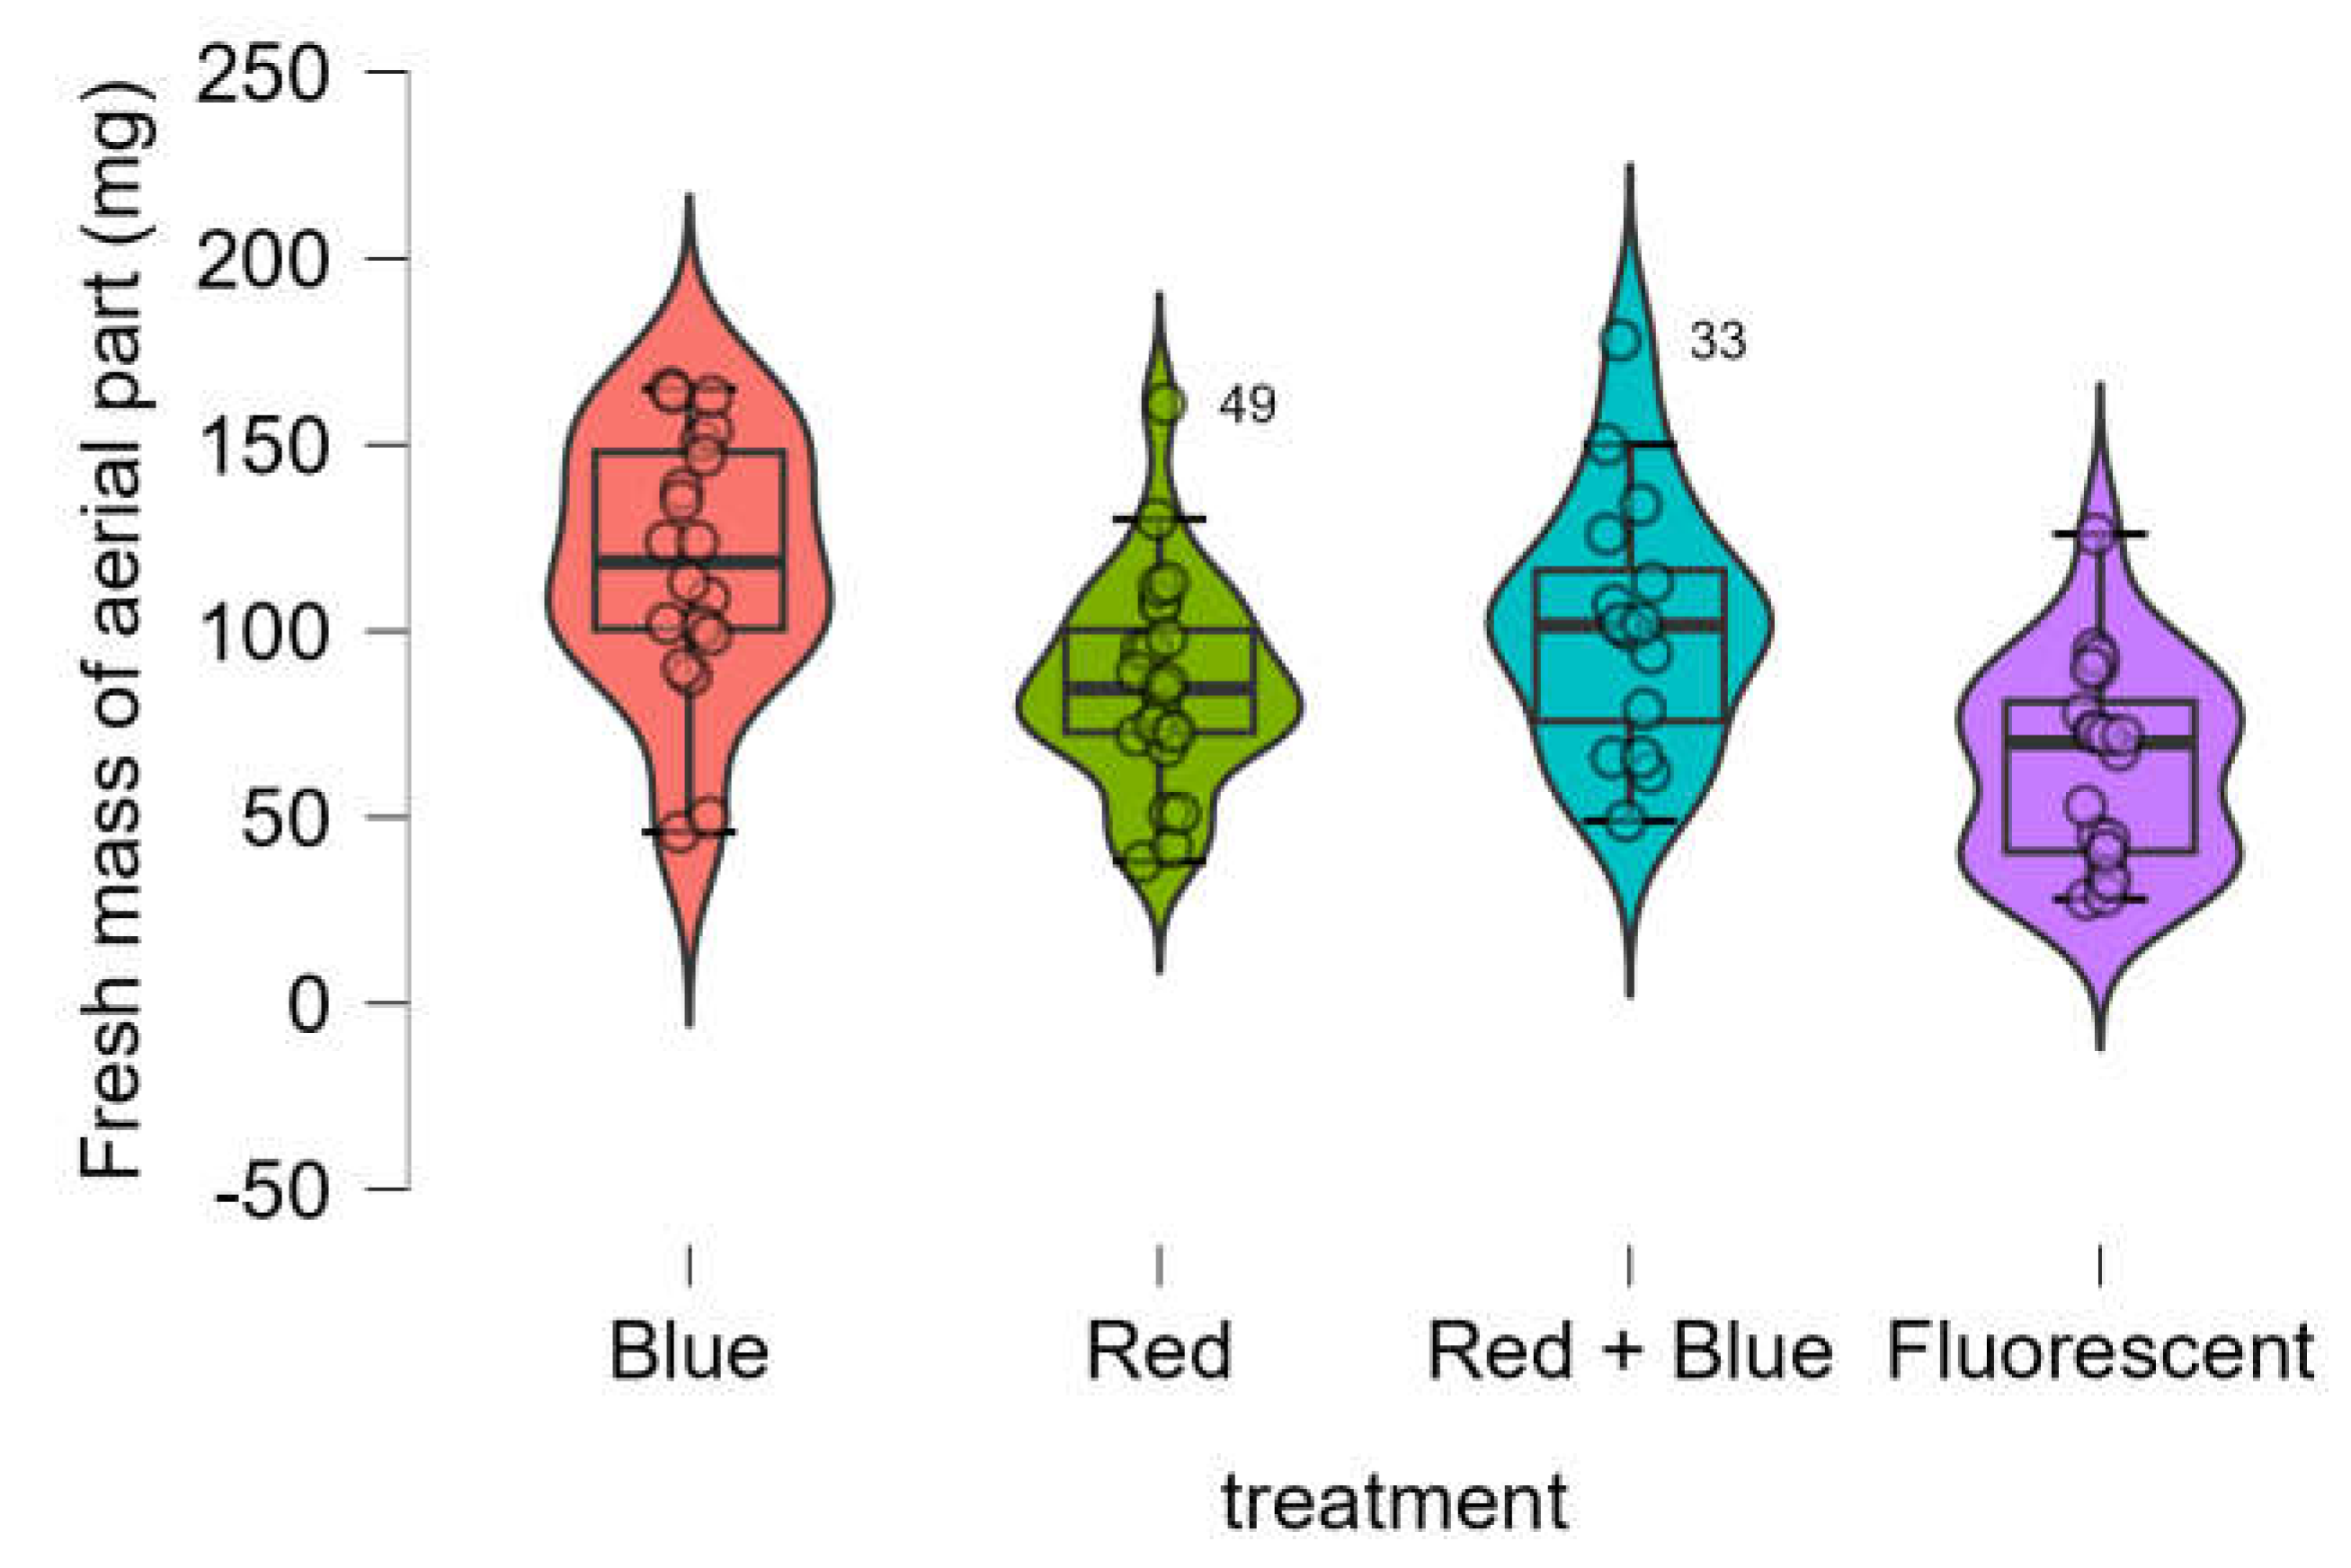
Treatments with blue LED and the combination of red + blue LED significantly increased both fresh and dry mass of the aerial parts compared to the treatment with fluorescent lamps (
Table 1).
The fresh mass of the aerial parts was notably higher in seedlings treated with LEDs than in those exposed to the control (fluorescent lamp) (
Figure 3). The Shapiro-Wilk test confirmed that the data was normally distributed (p-value = 0.600), while Bartlett’s test indicated that variances were equivalent (p-value = 0.904). One-way ANOVA revealed significant differences in fresh mass across the four treatments (p-value < 0.001).
Post hoc analysis using Tukey’s test (
Table 2) showed that the red LED and red + blue LED treatments resulted in statistically equivalent dry masses of the aerial parts (p-value = 0.255). However, the blue LED treatment produced a significantly larger dry mass of the aerial parts compared to the red LED treatment (p-value = 0.319).
The dry mass of the aerial parts was significantly higher in seedlings treated with LEDs compared to the control (fluorescent lamp) (
Figure 4). The Shapiro-Wilk test confirmed that the data followed a normal distribution (p-value = 0.615), and Bartlett’s test indicated homogeneity of variances (p-value = 0.432). One-way ANOVA revealed significant differences in dry mass among the four treatments (p-value < 0.001).
Tukey’s test (
Table 3) showed that the red LED treatment and the red + blue LED treatment resulted in statistically equivalent dry masses (p-value = 0.255). However, all LED treatments produced significantly larger dry masses than the control.
The light emission peaks in the blue and red wavelengths coincide with the maximum absorption of chlorophylls, thereby allowing photosynthesis to occur with maximum efficiency [
46,
47]. This effect may be related to the greater accumulation of dry mass in the seedlings exposed to blue LED and red + blue LED compared to those exposed to fluorescent lamps.
The results of the current experiment indicate that blue light (450 nm wavelength) positively influences the development of the aerial parts of Marubakaido apple rootstock seedlings. Beyond its role in photosynthesis, light is essential for regulating growth and morphogenesis processes. Plant responses to blue light are attributed to the presence of pigments such as phytochromes, cryptochromes, and phototropins. When stimulated, these pigments control the expression of certain genes, stomatal opening, flowering, and other processes [
48]. Blue light-induced stomatal opening enhances gas exchange during photosynthesis, directly impacting crop productivity [
47].
A similar effect was found by Shin et al [
48]. when cultivating orchids in vitro. They observed that seedlings grown under a combination of red and blue LEDs exhibited higher fresh and dry leaf mass compared to those grown under fluorescent lamps. In studies on Gossypium hirsutum L., Li et al [
49]. found that the red and blue light combination also resulted in greater fresh and dry seedling mass than fluorescent lamps. The increase in fresh and dry mass can help seedlings survive the acclimatization phase [
50], which is the most critical stage in micropropagation systems due to the high mortality rate of seedlings.
When used alone, red LED light (660 nm) produced results inferior to blue light but comparable to fluorescent lamps and the red + blue LED combination in terms of fresh and dry mass of the aerial part (). This indicates that red LEDs at 660 nm can also be used for in vitro cultivation of Marubakaido apple rootstock.
Similarly, Lin et al [
35]. revealed that fluorescent lamps and red LEDs were less efficient than blue LEDs, leading to lower shoot formation and dry mass in Dendrobium officinale explants cultivated in vitro. Liu et al [
51]. observed that Platycodon gradiflorum seedlings showed greater dry mass increase when grown under blue LEDs compared to red LEDs. Red light may induce starch accumulation in chloroplasts, which can inhibit photosynthesis in plants [
37]. According to SÆBØ et al [
52]. one response induced by exposure to red light is the reduction of photoassimilate translocation from leaves to other parts of the plant. This can lead to starch accumulation in chloroplasts and indirectly reduce the photosynthetic rate, potentially explaining the lower dry mass production in seedlings exposed to red light compared to blue light.
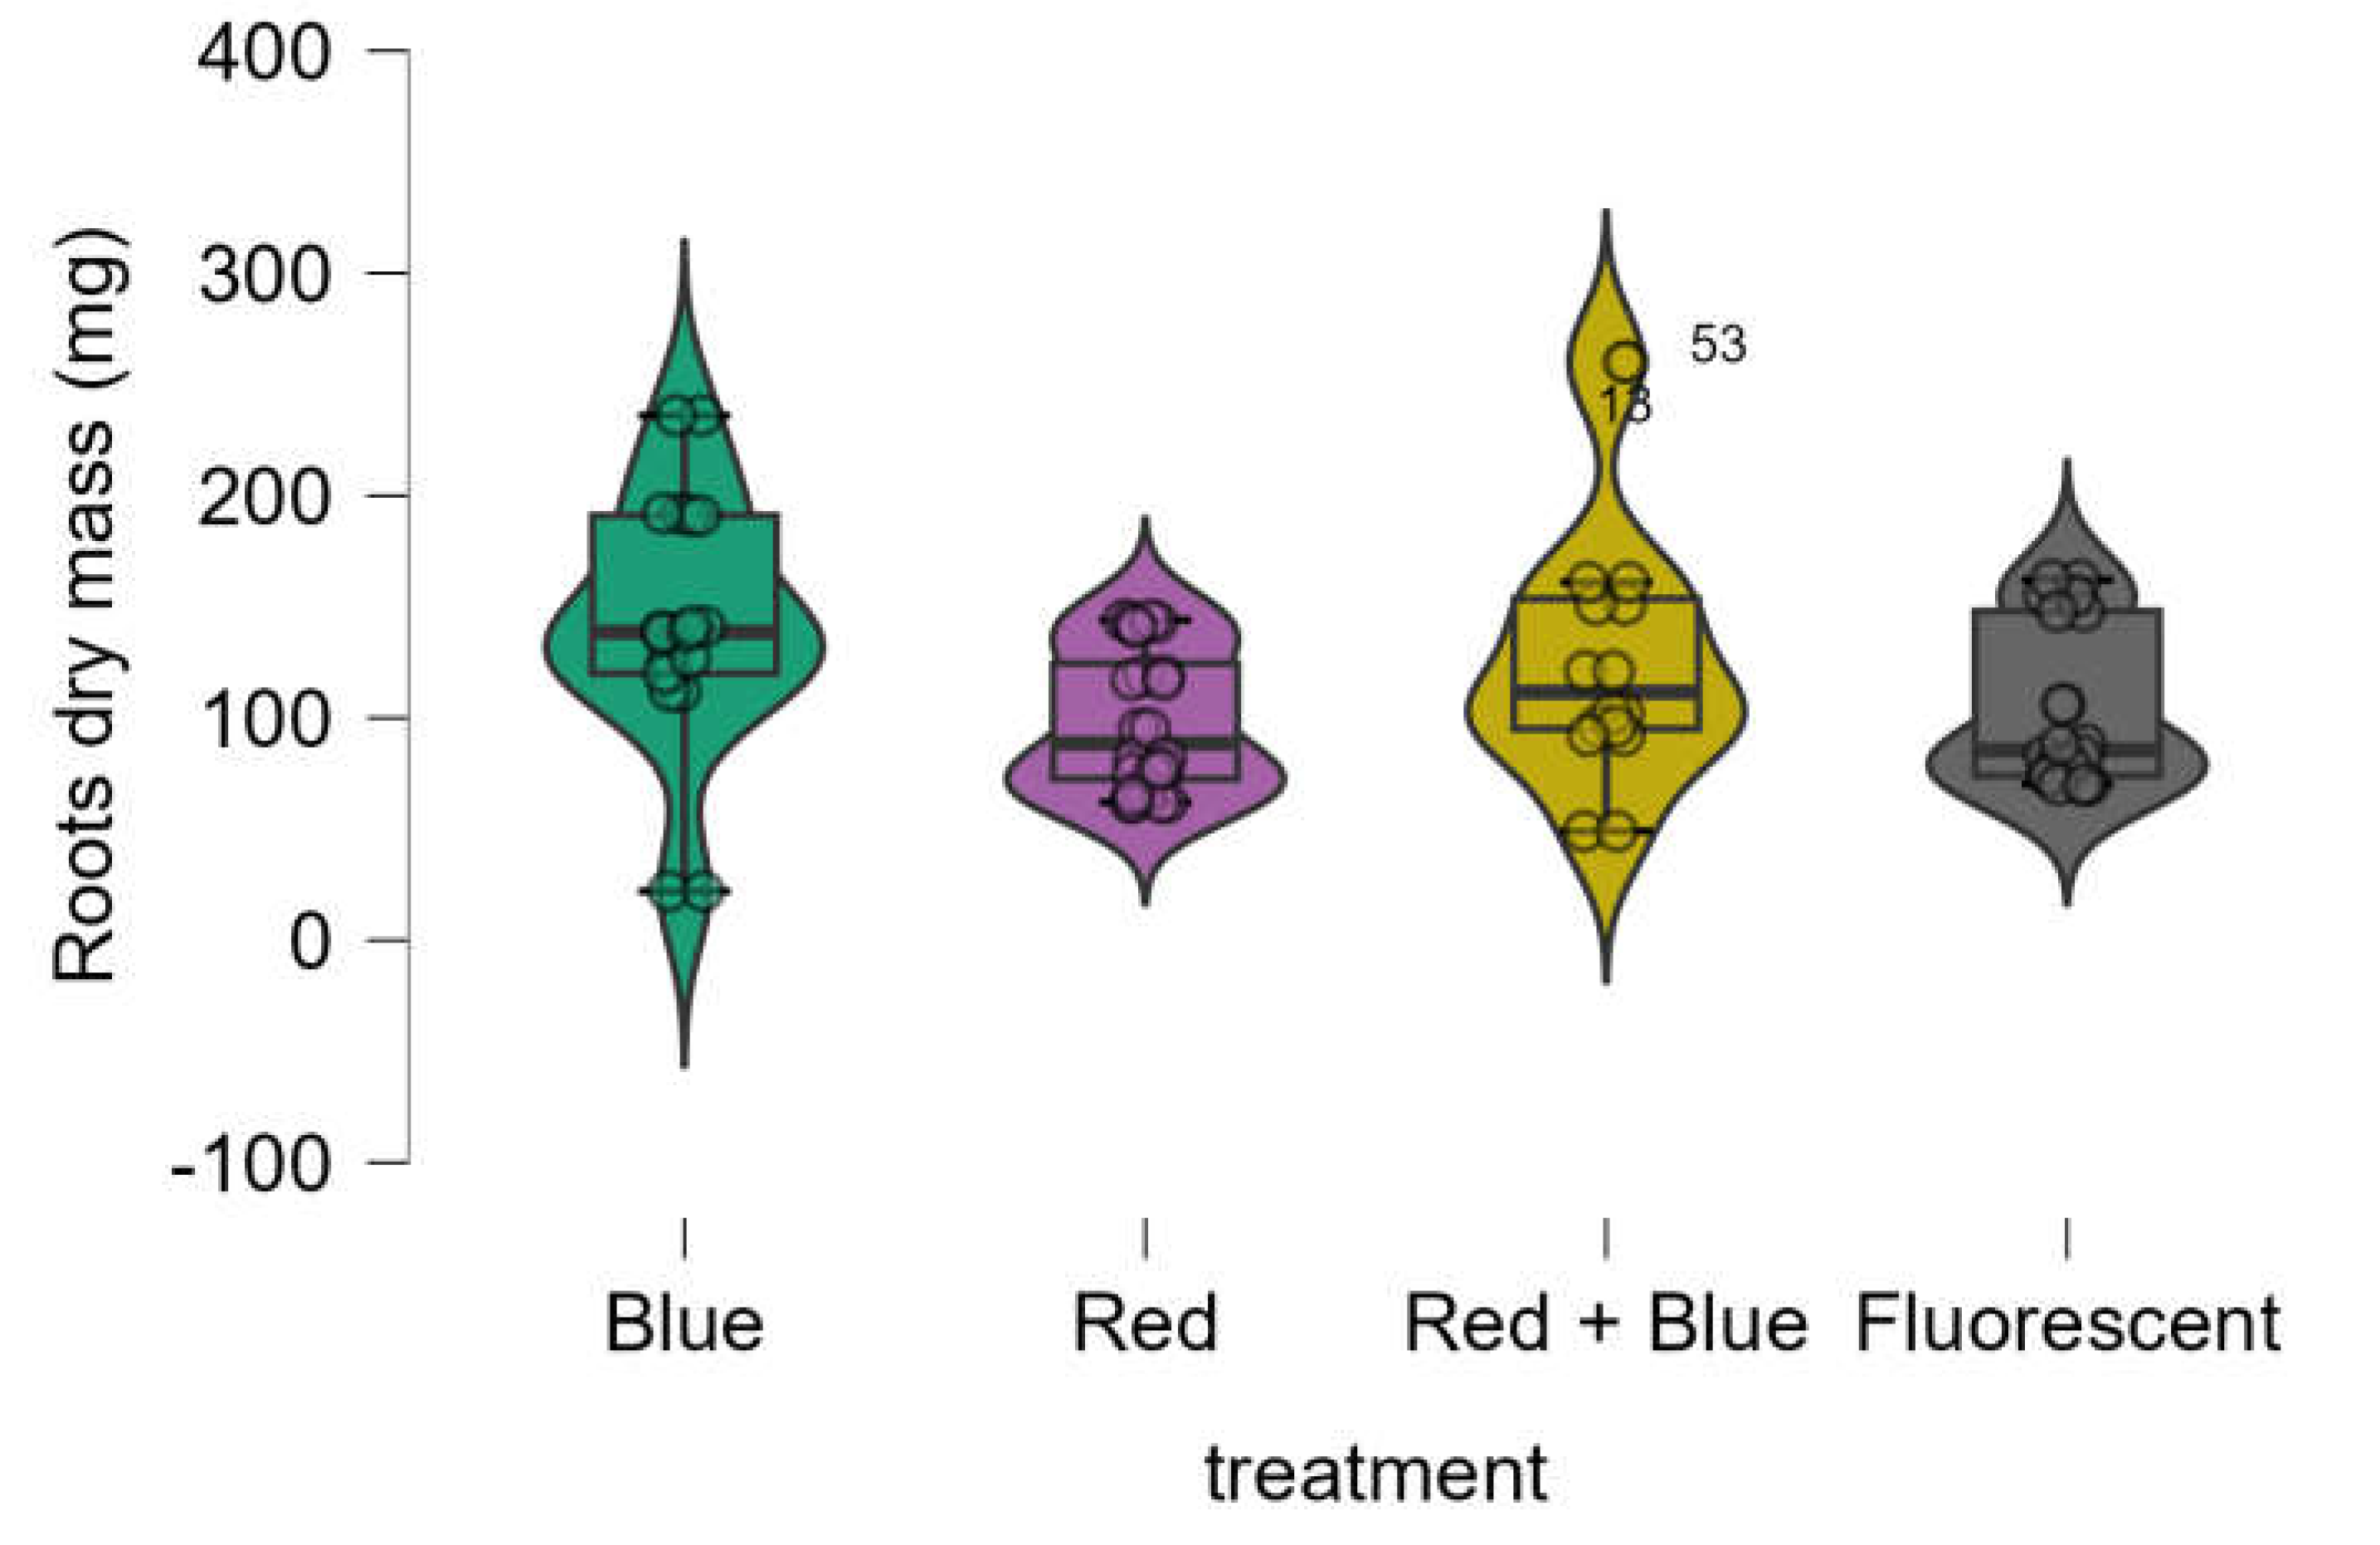
3.3. Roots Dry and Fresh Mass
The root dry mass obtained using LED treatments was equivalent to that obtained with the control (fluorescent lamp) (
Figure 5). The Shapiro-Wilk test indicated that the data was not normally distributed (p-value = 0.001), and Bartlett’s test revealed that variances were not homogeneous (p-value = 0.01). Consequently, the Kruskal-Wallis test was used, showing a significant difference among the treatments (p-value < 0.014). However, post hoc analysis using the Dwass-Steel-Critchlow-Fligner pairwise comparisons (
Table 4) confirmed that the root dry mass results from LED treatments were statistically equivalent to those of the control.
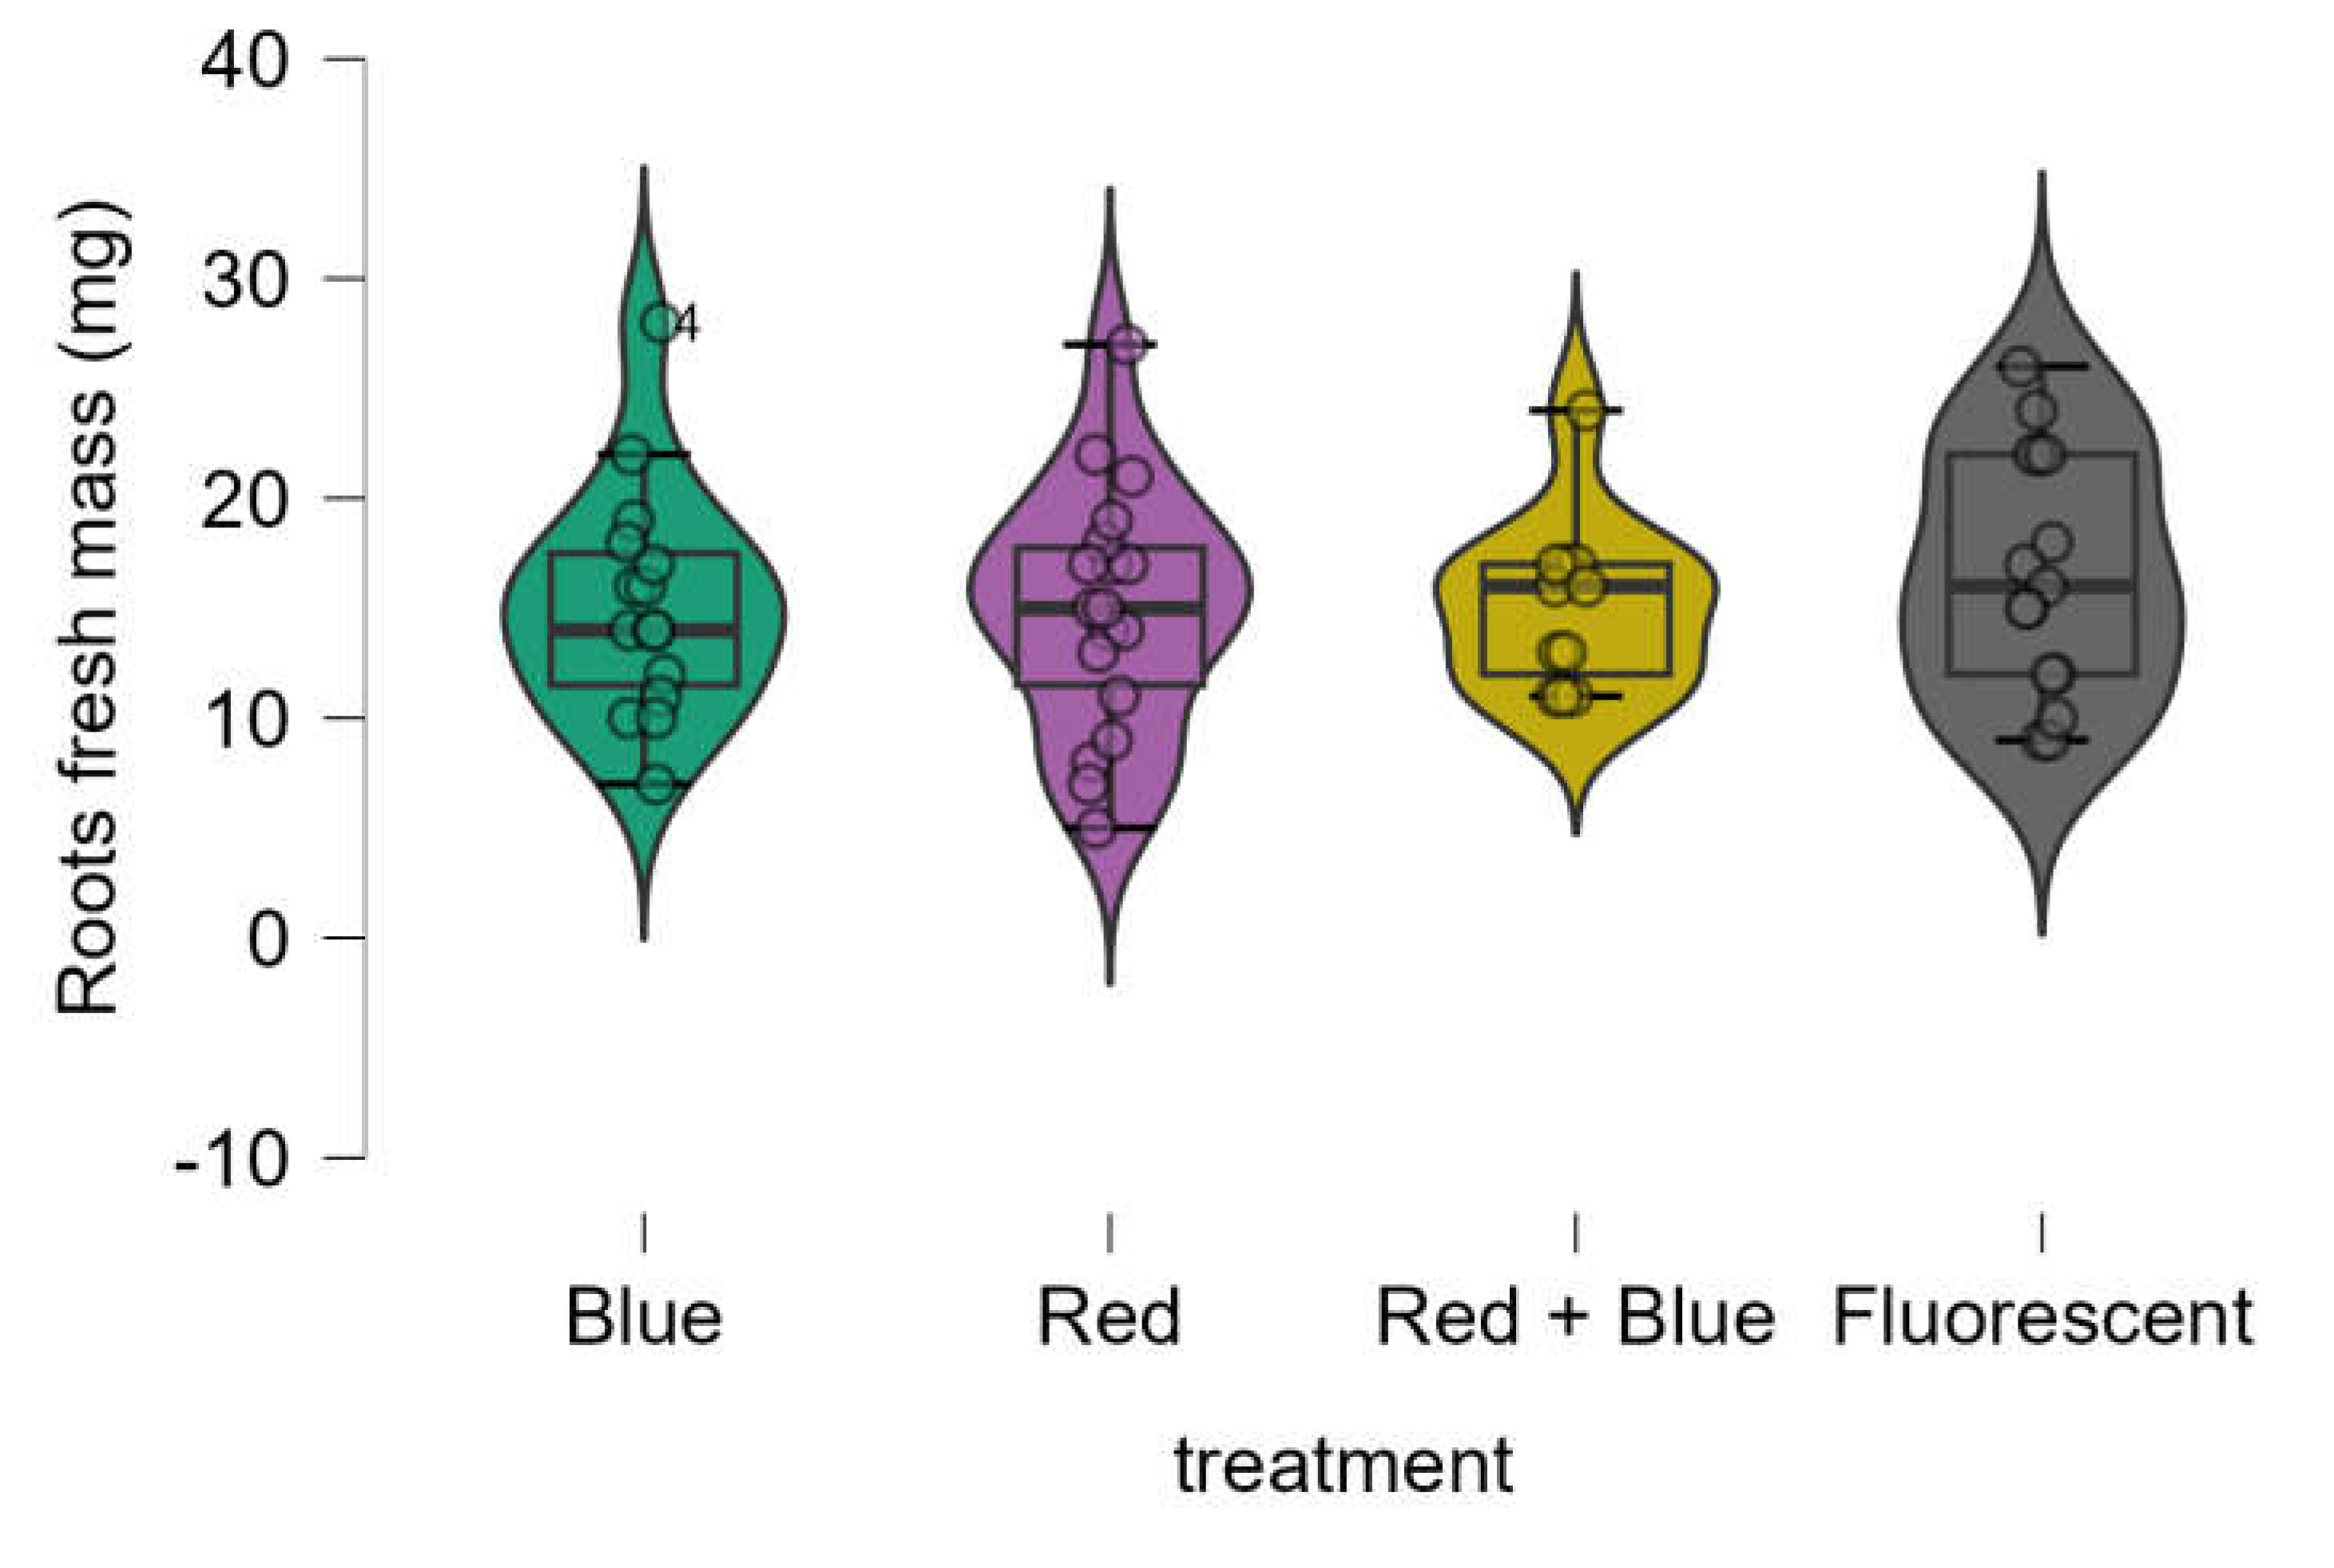
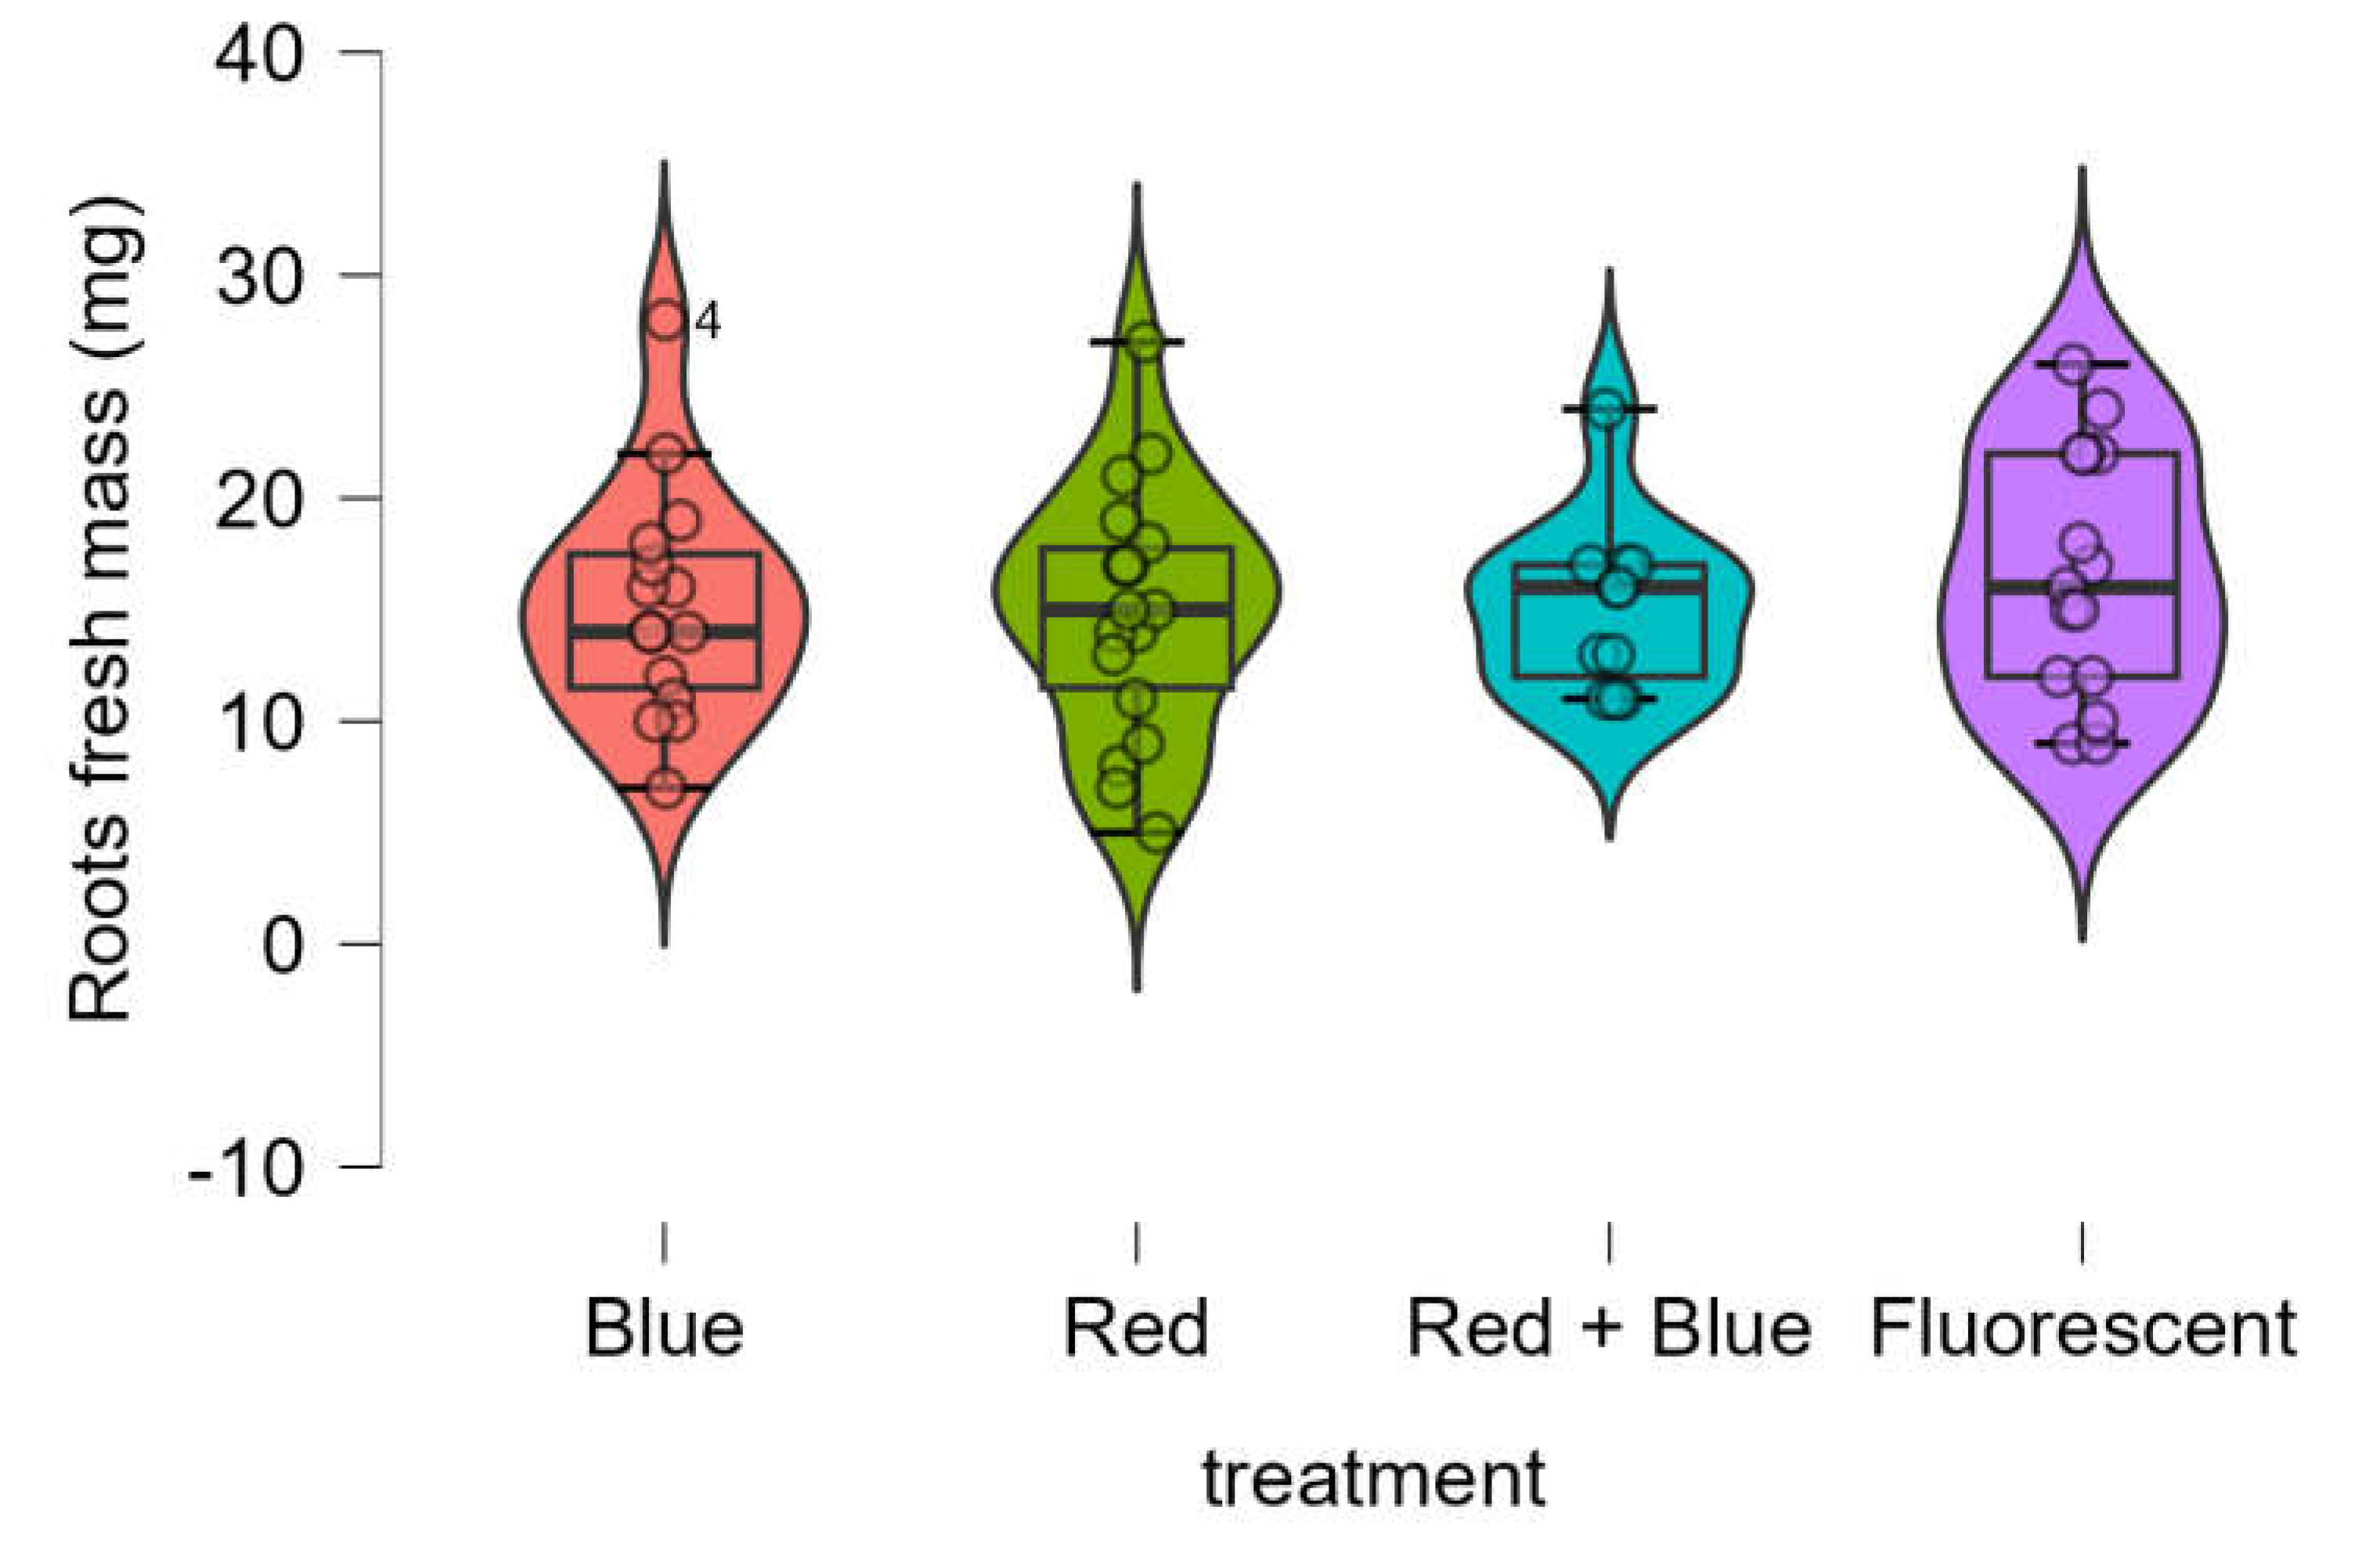
The root fresh mass obtained using LED treatments was equivalent to that obtained with the control (fluorescent lamp) (
Figure 6). The Shapiro-Wilk test confirmed that the data was normally distributed (p-value = 0.501), and Bartlett’s test indicated homogeneity of variances (p-value = 0.629). One-way ANOVA further demonstrated that there were no significant differences in root fresh mass among the four treatments (p-value = 0.835).
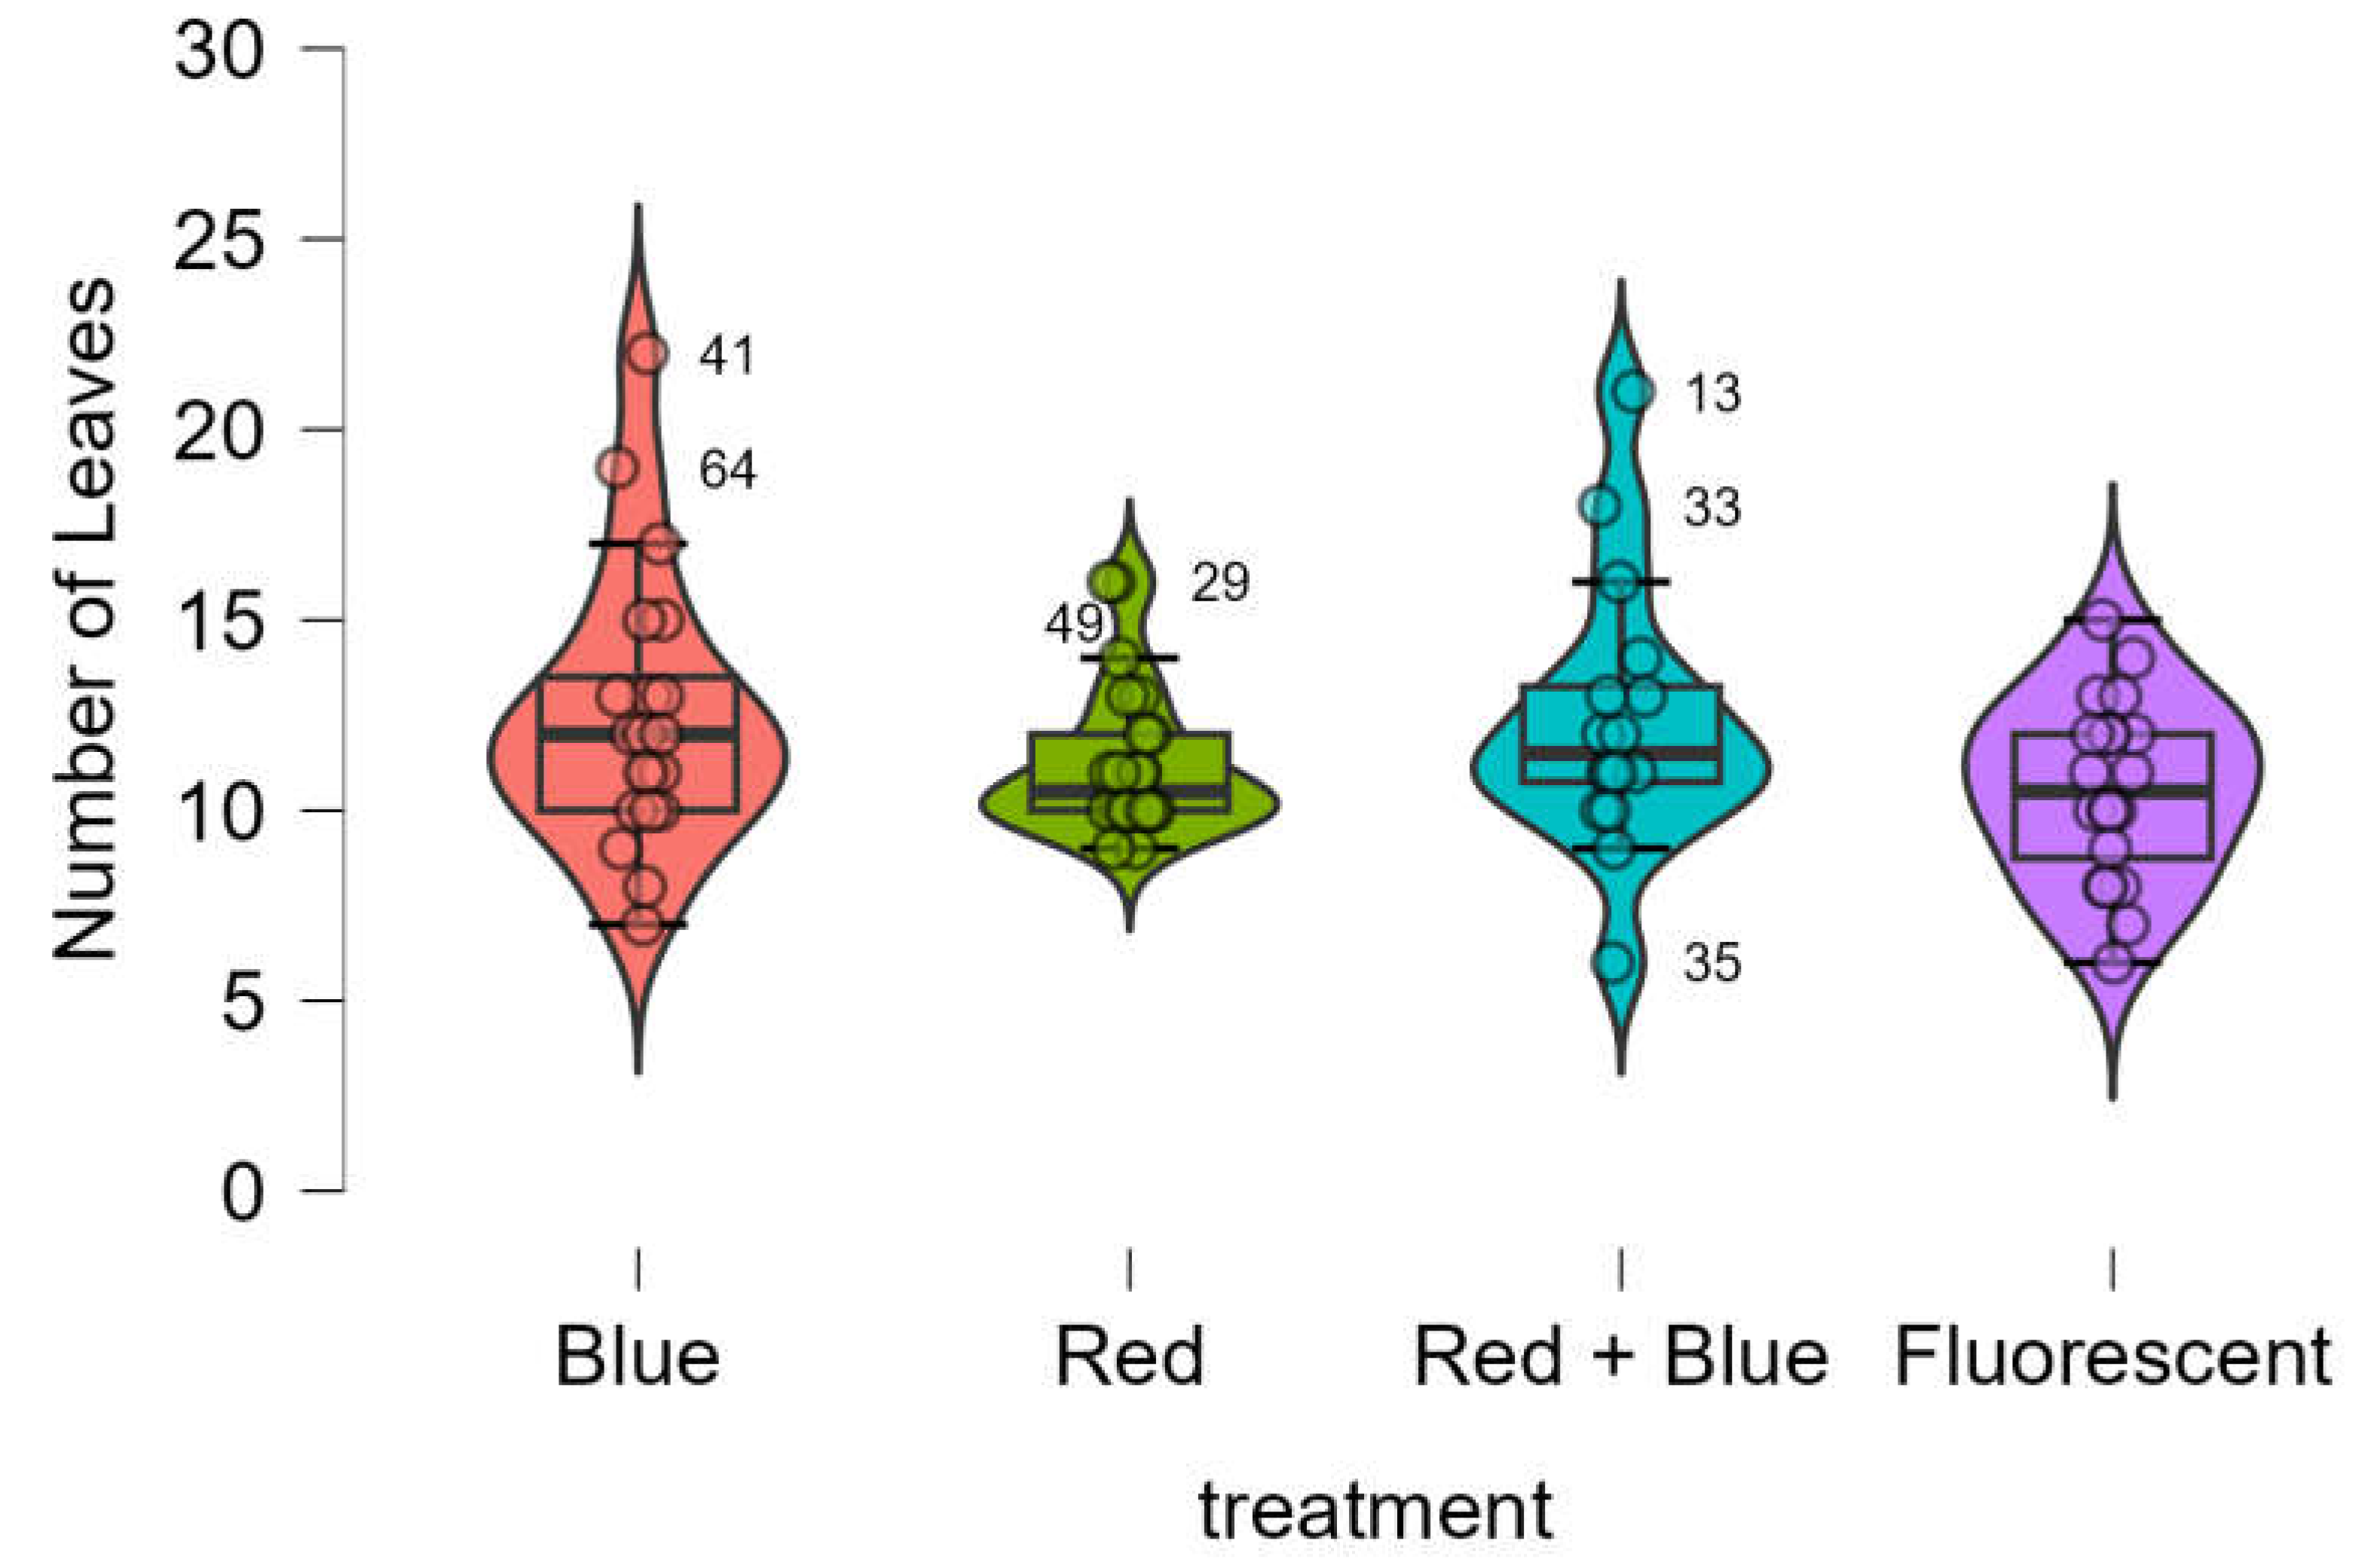
3.4. Number of Leaves and Roots
The number of leaves obtained using LED treatments were equivalent to those obtained using the control (
Figure 7). The Shapiro-Wik test showed that the data was not normally distributed (p-value = 0.001), the Bartlett’s test showed that variances were not equivalent (p-value = 0.012), the Kruskal-Wallis test showed that the four treatments provided equivalent results (p-value < 0.213).
The number of roots obtained using LED treatments were equivalent to those obtained using the control (
Figure 8). The Shapiro-Wik test showed that the data was normally distributed (p-value = 0.134), the Bartlett’s test confirmed data homogeneity (p-value = 0.999), the one-way ANOVA test showed that the four treatments provided equivalent results (p-value < 0.127).
Plant height (
Figure 2), number of leaves (
Figure 7), number of roots (
Figure 8), and fresh (
Figure 5) and dry root mass (
Figure 6) were not affected by the different light sources. According to Moon et al [
26]. light quality can influence plant morphology. For example, plant height can be promoted or inhibited depending on the different interactions between blue and red-light receptors and phytochromes [
53].
A similar result was obtained by Li et al [
49]. when they cultivated Brassica napus L. in vitro. The researchers observed that the stem length of seedlings treated with LEDs was comparable to those treated with fluorescent lamps.
The wavelength of light can affect the rooting of in vitro seedlings, varying according to the cultivated species [
26]. A study by Chée[
54] showed that blue LEDs had more promising effects on the rooting of grapevine seedlings compared to red LEDs. On the other hand, Moon et al [
26]. observed that the number of roots in Tripterospermum japonicum was induced by fluorescent lamps and the red + blue LED combination but inhibited by isolated red and blue LEDs. Shin et al [
48]. reported that the fresh and dry root masses of in vitro orchids increased when grown under the red + blue LED combination. However, Jao et al [
55]. found that Zantedeschia jucunda seedlings subjected to fluorescent lamps had greater dry root mass formation than those treated with LEDs.
3.5. Principal Component Analysis (PCA)
An analysis of vegetative growth was conducted using PCA [
56,
57], The score plot would be used to observe correlations and trends of the data [
39,
58,
59,
60]. The score plot (
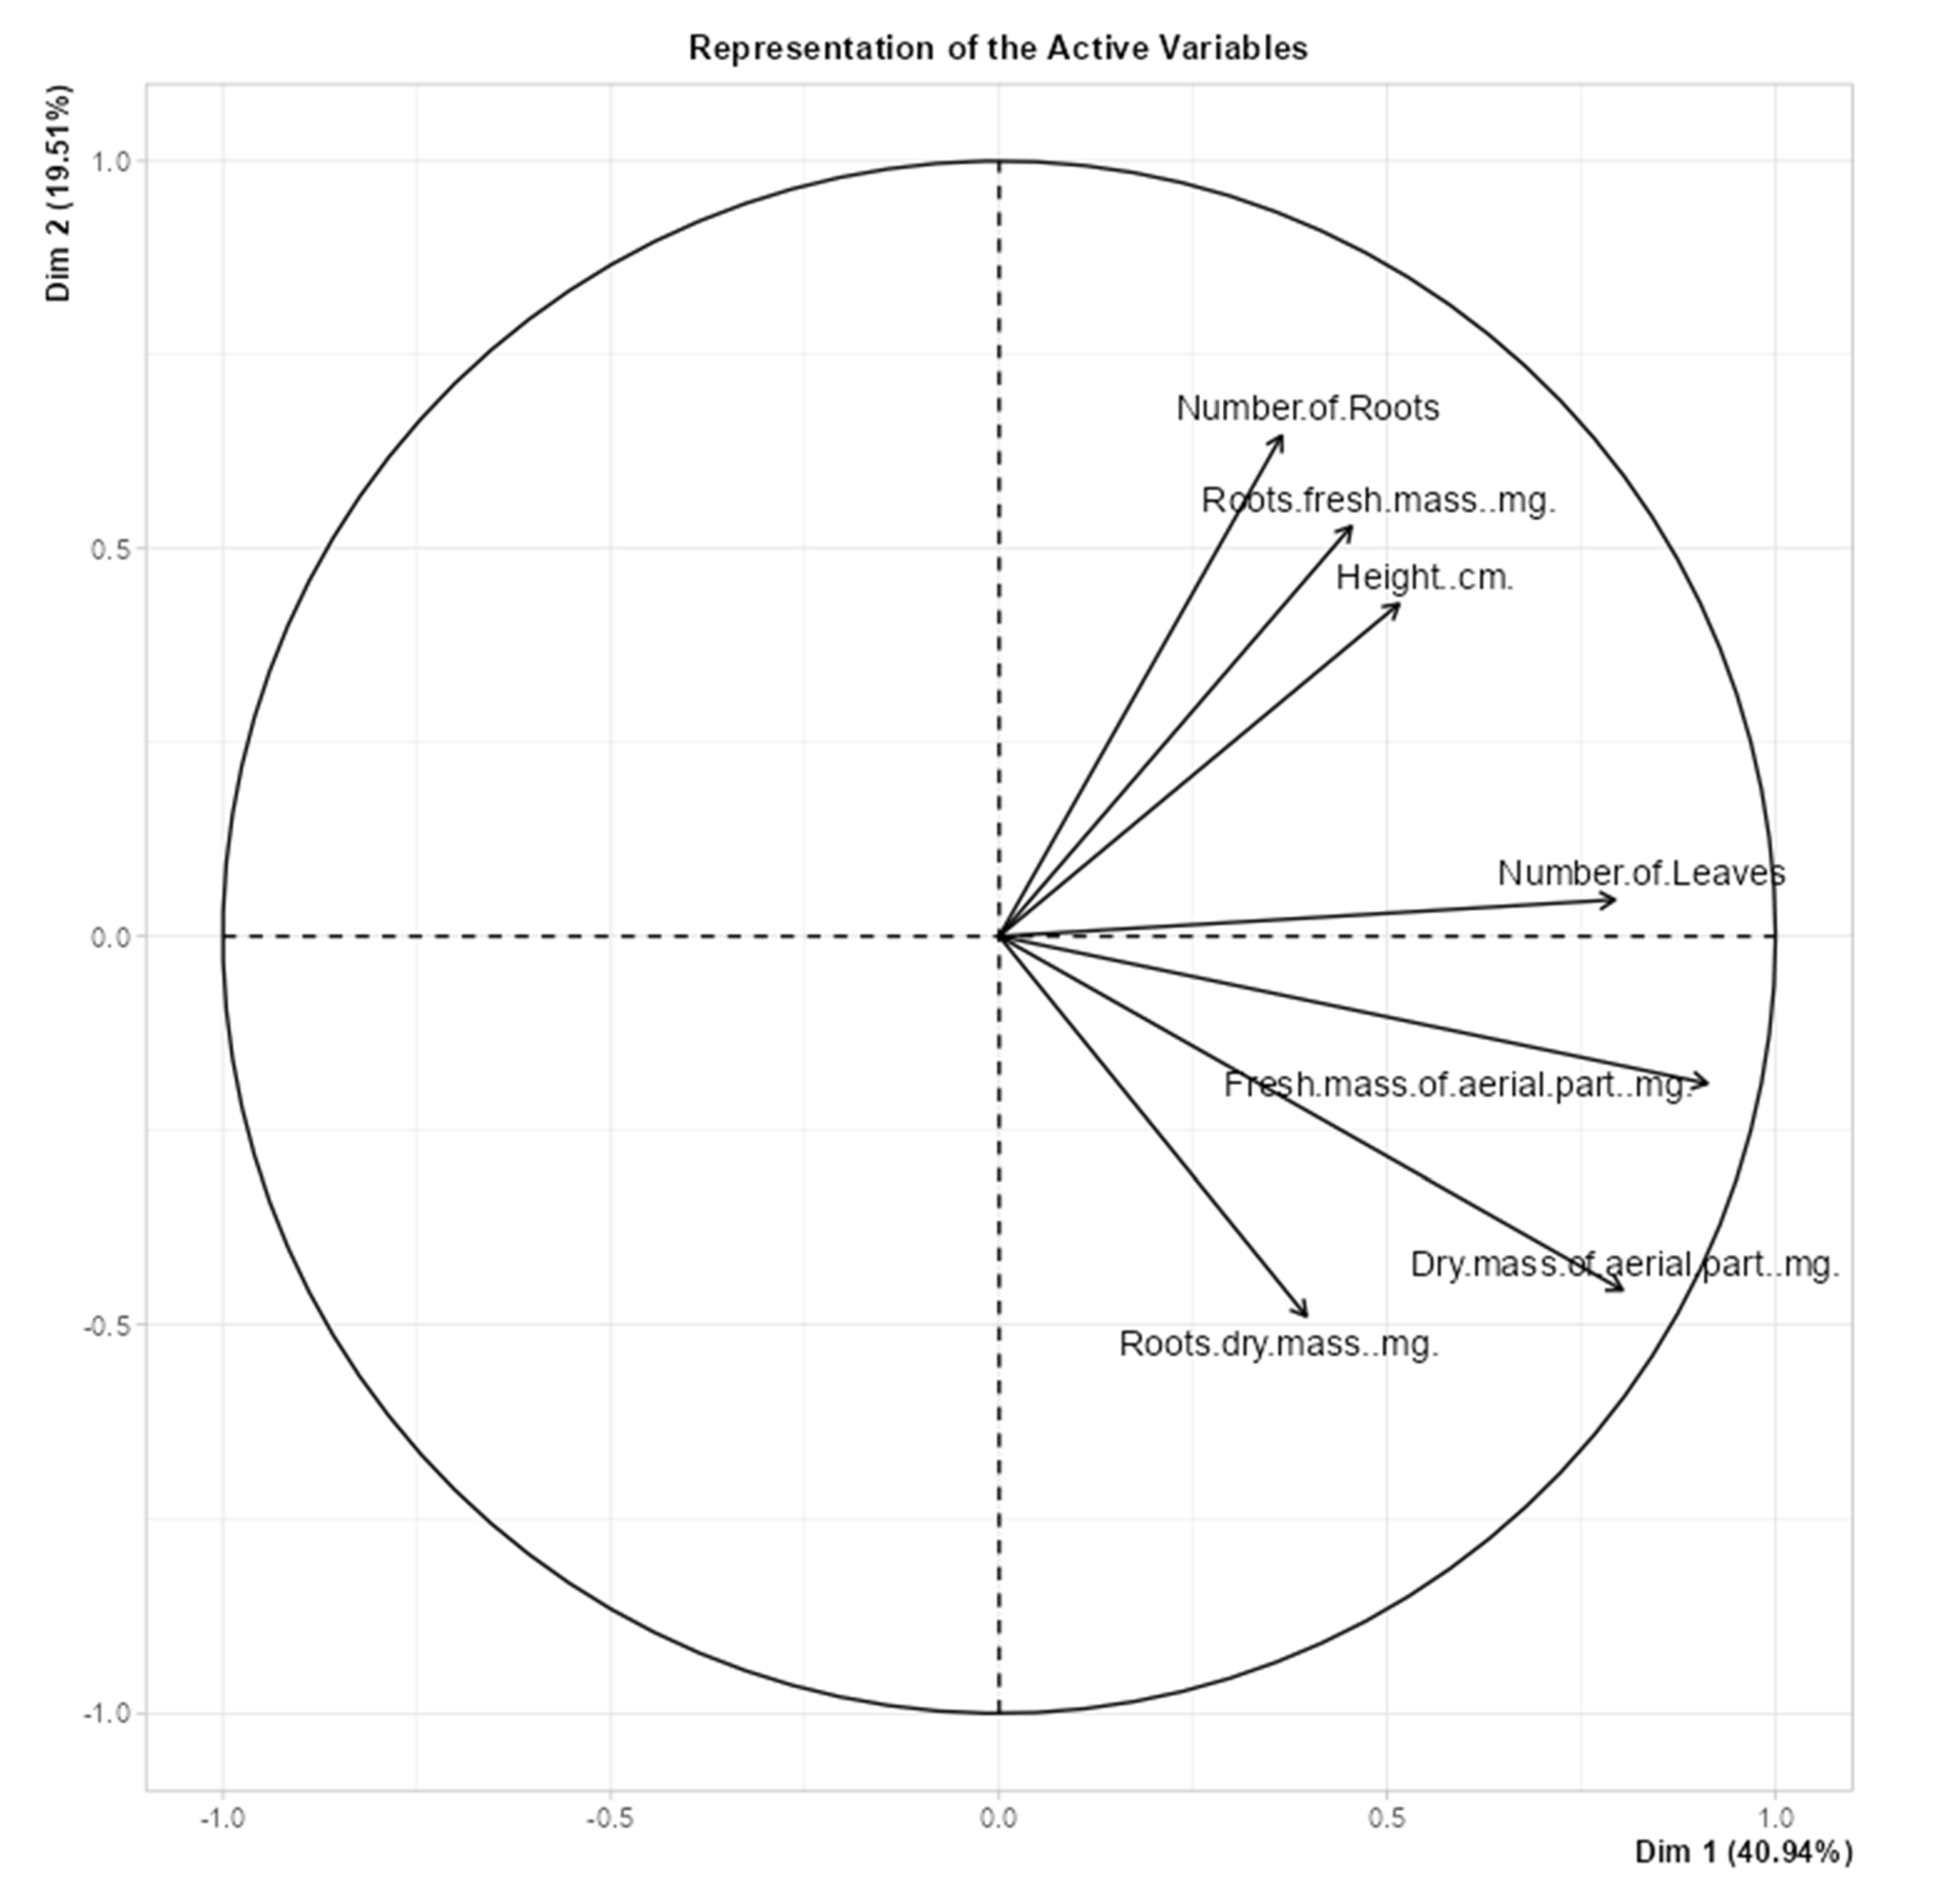
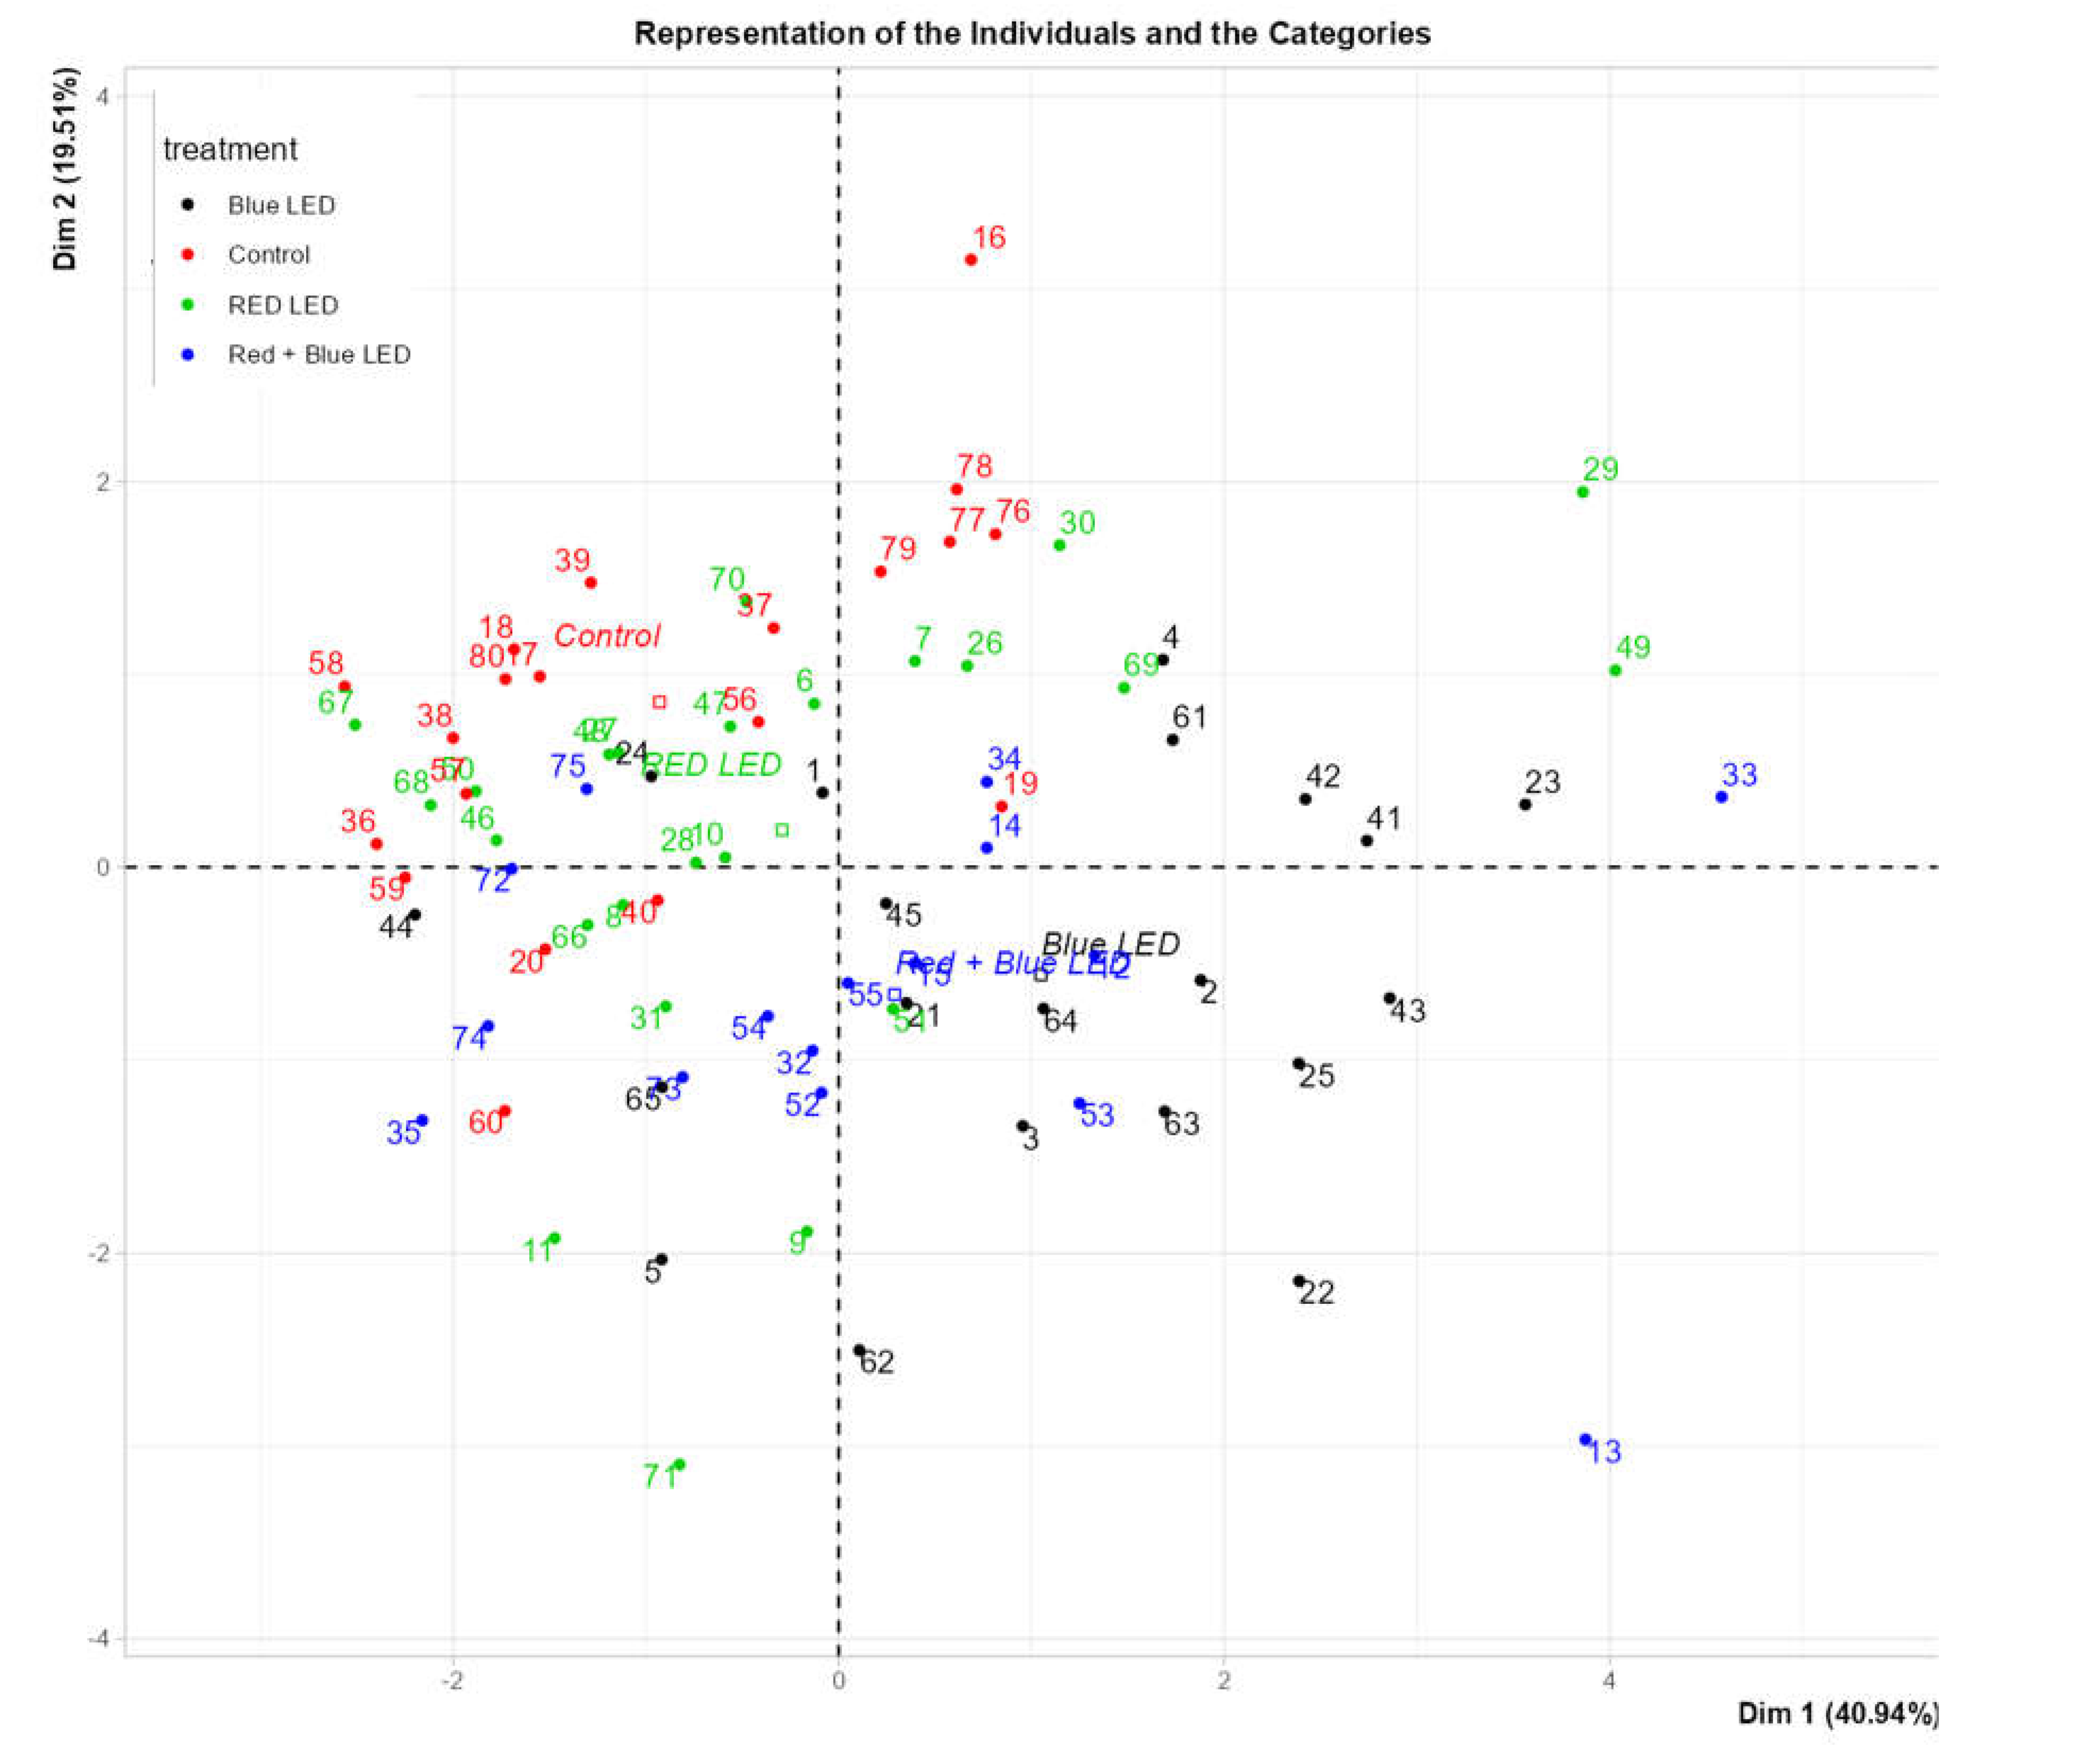
Figure 9) illustrates that the number of roots, root fresh mass, and height were positively correlated variables, with samples located at the top-right quadrant showing higher values for these parameters. Additionally, fresh mass of the aerial parts, dry mass of aerial parts, and root dry mass were correlated variables, with samples positioned in the bottom-left quadrant displaying higher values for these variables.
The loading plot (
Figure 10) reveals that
Marubakaido apple rootstock samples exhibiting greater vegetative growth were primarily located on the right side of the plot. Most of these samples were grown under blue LED light, indicating that this light source provided the best vegetative growth. Conversely, samples with smaller vegetative growth were predominantly located on the left side of the plot, representing control samples grown under fluorescent lamps. These results demonstrate that LED lights, particularly blue LEDs, were more efficient than fluorescent lamps in promoting vegetative growth.
3.6. Chlorophyll a, b, Total (a + b) and Carotenoids Content
Treatment with fluorescent lamps resulted in higher concentrations of chlorophylls a, b, total chlorophyll (a+b), and carotenoids in leaf samples compared to LED treatments. The different LED wavelengths did not show significant differences among themselves for pigment formation (
Table 5). Jao et al [
55]. cultivated Zantedeschia jucunda in vitro and reported that fluorescent lamps yielded more promising results for chlorophyll formation than LED treatments. Another study by Moon et al [
26]. showed that chlorophyll content in Tripterospermum japonicum was higher when seedlings were treated with fluorescent lamps and red + blue LED combinations but inhibited under isolated red and blue LEDs. However, Shin et al [
48]. observed that in vitro-cultivated Doritaenopsis plants under the red + blue LED combination had higher chlorophyll and carotenoid content than those grown under fluorescent lamps. These studies indicate that the synthesis of chlorophylls and carotenoids in plants exposed to different light sources may vary depending on the species.
Means followed by the same letter in the column do not differ statistically according to Tukey’s test at 5%.
Although carotenoids are known for their important role in protecting organisms from light-induced damage [
61,
62], both carotenoids and chlorophylls are involved in energy capture by plants [
63,
64,
65]. Light wavelengths play a crucial role in regulating photosynthesis, with blue and red LEDs being the most used for seedling growth. Their wavelengths, approximately 460 nm and 660 nm, respectively, represent the ranges of highest photosynthetic efficiency [
27].
Fluorescent lamps have wavelength peaks ranging from 350 to 750 nm in the electromagnetic spectrum, emitting light in a broad range of colors, many of which are unnecessary for seedling development [
27]. Plants exposed to white light preferentially absorb light in the blue, red, and part of the green spectra [
66,
67].
Alvarenga et al [
68]. showed that green LEDs induced greater synthesis of chlorophylls a, b, and total (a+b) and carotenoids in Achillea millefolium seedlings compared to blue and red LEDs. According to the same authors, the increase in pigment levels in plants when exposed to green light may be associated with stress in response to a lack of photosynthetically active light.
4. Conclusions
Blue LEDs and the red + blue LED combination, which resulted in greater dry and fresh mass of the aerial parts than fluorescent lamps, may be a promising alternative to fluorescent lamps for in vitro rooting of Marubakaido apple rootstocks. This would lead to more developed seedlings with a higher likelihood of survival during the acclimatization phase. Although red LEDs inhibit dry mass production compared to blue LEDs, they can still be used, as they produced similar dry mass levels to fluorescent lamps. Additionally, LEDs offer several advantages beyond their specific peaks within the favorable range for plants, such as high luminous efficiency, minimal heating, long lifespan, absence of heavy metals, and low energy consumption, enhancing profitability in in vitro plant propagation.
Fluorescent lamps induce a higher accumulation of chlorophylls and carotenoids compared to LEDs but result in lower dry mass production compared to blue LEDs and the red + blue LED combination in the in vitro rooting of Marubakaido apple rootstock seedlings.
Blue LEDs are more favorable than red LEDs and fluorescent lamps for dry mass accumulation in the in vitro rooting of Marubakaido apple rootstock seedlings.
Blue LEDs, red LEDs, and the red + blue LED combination can be used as alternatives to fluorescent lamps in the in vitro rooting of Marubakaido apple rootstock seedlings.
Author Contributions
EMB and MSM conceived and coordinated this project; AMTS performed the experiments with the help of RLV, BS, ELS. EMB and MSM analyzed data and wrote the manuscript. All authors have read and approved the final version of the manuscript.
Funding
The authors acknowledge financial support and fellowships from the Brazilian agencies FAPESC (Fundação de Amparo a Pesquisa do Estado de Santa Catarina), CNPq (Conselho Nacional de Desenvolvimento Científico e Tecnológico) and CAPES (Coordenação de Aperfeiçoamento de Pessoal de Nível Superior).
Institutional Review Board Statement
The study did not require ethical approval.
Informed Consent Statement
Not applicable. This study did not involve humans.
Data Availability Statement
The data that support the findings of this study are available upon request from the corresponding author.
Conflicts of Interest
The authors declare no conflicts of interest.
References
- Stanger, M.C.; Steffens, C.A.; Soethe, C.; Moreira, M.A.; do Amarante, C.V.T. Phenolic Content and Antioxidant Activity during the Development of ‘Brookfield’ and ‘Mishima’ Apples. J Agric Food Chem 2017, 65, 3453–3459. [Google Scholar] [CrossRef] [PubMed]
- Bueno, M.P.; Silva, A.C.; Nunes, A.L. de P.F.; Sardinha, A.C.; Lima, P.T. dos S.; Silva, J.F. Análise Da Comercialização Da Cadeia Produtiva Da Maçã Brasileira: Produção, Importação e Exportação No Período 2015 a 2019/ Analysis of the Commercialization of the Brazilian Apple Production Chain: Production, Import and Export in the Year 2015 to 2019. Brazilian Journal of Development 2021, 7, 34061–34078. [Google Scholar] [CrossRef]
- FAO FAOSTAT Crops and Livestock Production. FAOSTAT Analytical Brief 60 Agricultural production statistics 2000-2021 <b>2021</b>, 60. FAO FAOSTAT Crops and Livestock Production. FAOSTAT Analytical Brief 60 Agricultural production statistics 2000-2021 2021, 60.
- Purin, S.; Filho, O.K.; Stürmer, S.L. Mycorrhizae Activity and Diversity in Conventional and Organic Apple Orchards from Brazil. Soil Biol Biochem 2006, 38, 1831–1839. [Google Scholar] [CrossRef]
- Pertille, R.H.; Citadin, I.; Oliveira, L. de S. de; Broch, J. de C.; Kvitschal, M.V.; Araujo, L. The Influence of Temperature on the Phenology of Apple Trees Grown in Mild Winter Regions of Brazil, Based on Long-Term Records. Sci Hortic 2022, 305, 111354. [Google Scholar] [CrossRef]
- Marini, R.P. Experimental Designs and Statistical Analyses for Rootstock Trials. Agronomy 2024, 14, 2312. [Google Scholar] [CrossRef]
- Mahmud, I.; Kousik, C.; Hassell, R.; Chowdhury, K.; Boroujerdi, A.F. NMR Spectroscopy Identifies Metabolites Translocated from Powdery Mildew Resistant Rootstocks to Susceptible Watermelon Scions. J Agric Food Chem 2015, 63, 8083–8091. [Google Scholar] [CrossRef]
- Orazem, P.; Stampar, F.; Hudina, M. Fruit Quality of Redhaven and Royal Glory Peach Cultivars on Seven Different Rootstocks. J Agric Food Chem 2011, 59, 9394–9401. [Google Scholar] [CrossRef]
- Jin, Z.; Sun, H.; Sun, T.; Wang, Q.; Yao, Y. Modifications of ‘Gold Finger’ Grape Berry Quality as Affected by the Different Rootstocks. J Agric Food Chem 2016, 64, 4189–4197. [Google Scholar] [CrossRef]
- Liu, X.; Li, J.; Huang, M.; Chen, J. Mechanisms for the Influence of Citrus Rootstocks on Fruit Size. J Agric Food Chem 2015, 63, 2618–2627. [Google Scholar] [CrossRef]
- de Macedo, T.A.; da Silva, P.S.; Sander, G.F.; Welter, J.F.; Rufato, L.; de Rossi, A. Productivity and Quality of “Fuji Suprema” Apple Fruit in Different Rootstocks and Growing Conditions. Sci Hortic 2019, 256, 108651. [Google Scholar] [CrossRef]
- Santos da Silva, P.; de Lima, J.M.; dos Santos, M.F.S.; Petry, D.; Rufato, L.; Nerbass, F.R.; Bogo, A. Performance of ‘Gala Select’ and ‘Fuji Suprema’ Grafted on Geneva Series Rootstocks under Fallow Land and Replanting Conditions in Southern Brazil. Heliyon 2023, 9, e22125. [Google Scholar] [CrossRef]
- Marini, R.P.; Fazio, G. Apple Rootstocks. In Horticultural Reviews; Wiley, 2018; pp. 197–312.
- Jones, O.P.; Hopgood, M.E.; O’Farrell, D. Propagation in Vitro of M.26 Apple Rootstocks. Journal of Horticultural Science 1977, 52, 235–238. [Google Scholar] [CrossRef]
- Dobránszki, J.; Teixeira da Silva, J.A. Micropropagation of Apple — A Review. Biotechnol Adv 2010, 28, 462–488. [Google Scholar] [CrossRef] [PubMed]
- Luiz de Oliveira, J.; Ramos Campos, E.V.; Fraceto, L.F. Recent Developments and Challenges for Nanoscale Formulation of Botanical Pesticides for Use in Sustainable Agriculture. J Agric Food Chem 2018, 66, 8898–8913. [Google Scholar] [CrossRef] [PubMed]
- Di Serio, M.G.; D’Ascenzo, D.; Giansante, L.; Del Re, P.; Bendini, A.; Casadei, E.; Gallina Toschi, T.; Mori, N.; Di Giacinto, L. Effect of Halyomorpha Halys Infestation on the Physicochemical Composition and Sensory Characteristics of Olive Fruits and Olive Oils. ACS Food Science & Technology 2024, 4, 821–832. [Google Scholar] [CrossRef]
- Naz, B.; Afzal, A.; Ali, H.; Ahmad, N.; Fazal, H.; Ullah, R.; Ali, E.A.; Ali, M.; Ullah, Z.; Ali, A.; et al. Melatonin-Induced Stress Enhanced Biomass and Production of High-Value Secondary Cell Products in Submerged Adventitious Root Cultures of Stevia Rebaudiana (Bert.). ACS Omega, 2024. [Google Scholar] [CrossRef]
- Clemente, I.; Menicucci, F.; Colzi, I.; Sbraci, L.; Benelli, C.; Giordano, C.; Gonnelli, C.; Ristori, S.; Petruccelli, R. Unconventional and Sustainable Nanovectors for Phytohormone Delivery: Insights on Olea Europaea. ACS Sustain Chem Eng 2018, 6, 15022–15031. [Google Scholar] [CrossRef]
- Hussain, N.; Ali, H.; Mustafa, G.; Sarwar Khan, M.; Ali, B.; Ameer, S.; Zamir, S.; Iqbal, R.; Ali, B.; Khan, M.N.; et al. In Vitro Plant Regeneration from Petioles of Spinach (Spinacia Oleracea L.). ACS Agricultural Science & Technology 2024, 4, 57–62. [Google Scholar] [CrossRef]
- Ma, X.; Gang, D.R. Metabolic Profiling of Turmeric (Curcuma Longa L.) Plants Derived from in Vitro Micropropagation and Conventional Greenhouse Cultivation. J Agric Food Chem 2006, 54, 9573–9583. [Google Scholar] [CrossRef]
- Ashrafi, K.; Iqrar, S.; Saifi, M.; Khan, S.; Qamar, F.; Quadri, S.N.; Mishra, A.; Abdin, M.Z. Influence of Plant Growth Regulators on Glandular Trichome Density and Steviol Glycosides Accumulation in Stevia Rebaudiana. ACS Omega 2022, 7, 30967–30977. [Google Scholar] [CrossRef]
- Gulzar, B.; Mujib, A.; Qadir Malik, M.; Mamgain, J.; Syeed, R.; Zafar, N. Plant Tissue Culture: Agriculture and Industrial Applications. In Transgenic Technology Based Value Addition in Plant Biotechnology; Elsevier, 2020; pp. 25–49.
- Abdalla, N.; El-Ramady, H.; Seliem, M.K.; El-Mahrouk, M.E.; Taha, N.; Bayoumi, Y.; Shalaby, T.A.; Dobránszki, J. An Academic and Technical Overview on Plant Micropropagation Challenges. Horticulturae 2022, 8, 677. [Google Scholar] [CrossRef]
- Gutiérrez-Gamboa, G.; Alañón-Sánchez, N.; Mateluna-Cuadra, R.; Verdugo-Vásquez, N. An Overview about the Impacts of Agricultural Practices on Grape Nitrogen Composition: Current Research Approaches. Food Research International 2020, 136, 109477. [Google Scholar] [CrossRef] [PubMed]
- Moon, H.K.; Park, S.-Y.; Kim, Y.W.; Kim, C.S. Growth of Tsuru-Rindo (Tripterospermum Japonicum) Culturedin Vitro under Various Sources of Light-Emitting Diode (LED) Irradiation. Journal of Plant Biology 2006, 49, 174–179. [Google Scholar] [CrossRef]
- Dutta Gupta, S.; Jatothu, B. Fundamentals and Applications of Light-Emitting Diodes (LEDs) in in Vitro Plant Growth and Morphogenesis. Plant Biotechnol Rep 2013, 7, 211–220. [Google Scholar] [CrossRef]
- Sharma, A.; Hazarika, M.; Heisnam, P.; Pandey, H.; Devadas, V.S.; Wangsu, M.; Kartha, B.D. Factors Affecting Production, Nutrient Translocation Mechanisms, and LED Emitted Light in Growth of Microgreen Plants in Soilless Culture. ACS Agricultural Science & Technology 2023, 3, 701–719. [Google Scholar] [CrossRef]
- Sharma, A.; Pandey, H.; Nampoothiri Devadas, V.A.S.; Singh, D.; Kartha, B.D.; Wangsu, M. Regulations and Factors Affecting of Light Emitting Diodes Artificial Light in Crop Production under Soilless Culture. ACS Agricultural Science & Technology 2023, 3, 616–630. [Google Scholar] [CrossRef]
- Soltani, S.; Arouiee, H.; Salehi, R.; Nemati, S.H.; Moosavi-Nezhad, M.; Gruda, N.S.; Aliniaeifard, S. Morphological, Phytochemical, and Photosynthetic Performance of Grafted Tomato Seedlings in Response to Different LED Light Qualities under Protected Cultivation. Horticulturae 2023, 9, 471. [Google Scholar] [CrossRef]
- Yeh, N.; Chung, J.-P. High-Brightness LEDs—Energy Efficient Lighting Sources and Their Potential in Indoor Plant Cultivation. Renewable and Sustainable Energy Reviews 2009, 13, 2175–2180. [Google Scholar] [CrossRef]
- SCHUERGER, A. Anatomical Features of Pepper Plants (Capsicum AnnuumL.) Grown under Red Light-Emitting Diodes Supplemented with Blue or Far-Red Light. Ann Bot 1997, 79, 273–282. [Google Scholar] [CrossRef]
- Nacheva, L.; Dimitrova, N.; Koleva-Valkova, L.; Stefanova, M.; Ganeva, T.; Nesheva, M.; Tarakanov, I.; Vassilev, A. In Vitro Multiplication and Rooting of Plum Rootstock ‘Saint Julien’ (Prunus Domestica Subsp. Insititia) under Fluorescent Light and Different LED Spectra. Plants 2023, 12, 2125. [Google Scholar] [CrossRef]
- Geng, F.; Moran, R.; Day, M.; Halteman, W.; Zhang, D. In Vitro Shoot Proliferation of Apple Rootstocks ‘B.9’, ‘G.30’, and ‘G.41’ Grown under Red and Blue Light. HortScience 2015, 50, 430–433. [Google Scholar] [CrossRef]
- Lin, Y.; Li, J.; Li, B.; He, T.; Chun, Z. Effects of Light Quality on Growth and Development of Protocorm-like Bodies of Dendrobium Officinale in Vitro. Plant Cell, Tissue and Organ Culture (PCTOC) 2011, 105, 329–335. [Google Scholar] [CrossRef]
- Senger, H. THE EFFECT OF BLUE LIGHT ON PLANTS AND MICROORGANISMS. Photochem Photobiol 1982, 35, 911–920. [Google Scholar] [CrossRef]
- Li, H.; Xu, Z.; Tang, C. Effect of Light-Emitting Diodes on Growth and Morphogenesis of Upland Cotton (Gossypium Hirsutum L.) Plantlets in Vitro. Plant Cell, Tissue and Organ Culture (PCTOC) 2010, 103, 155–163. [Google Scholar] [CrossRef]
- Murashige, T.; Skoog, F. A Revised Medium for Rapid Growth and Bio Assays with Tobacco Tissue Cultures. Physiol Plant 1962, 15, 473–497. [Google Scholar] [CrossRef]
- Borges, E.M. Hypothesis Tests and Exploratory Analysis Using R Commander and Factoshiny. J Chem Educ 2023, 100, 267–278. [Google Scholar] [CrossRef]
- Navarro, D.J.; Foxcroft, D.R. Learning Statistics with Jamovi. Learning Statistics with Jamovi: A Tutorial for Psychology Students and Other Beginners 2022.
- Silva de Souza, R.; Borges, E.M. Teaching Descriptive Statistics and Hypothesis Tests Measuring Water Density. J Chem Educ 2023, 100, 4438–4448. [Google Scholar] [CrossRef]
- Marcel Borges, E. Data Visualization Using Boxplots: Comparison of Metalloid, Metal, and Nonmetal Chemical and Physical Properties. J Chem Educ 2023, 100, 2809–2817. [Google Scholar] [CrossRef]
- Love, J.; Selker, R.; Marsman, M.; Jamil, T.; Dropmann, D.; Verhagen, J.; Ly, A.; Gronau, Q.F.; Smíra, M.; Epskamp, S.; et al. JASP: Graphical Statistical Software for Common Statistical Designs. J Stat Softw 2019, 88. [Google Scholar] [CrossRef]
- de Souza, R.S.; Sequeira, C.A.; Borges, E.M. Enhancing Statistical Education in Chemistry and STEAM Using JAMOVI. Part 1: Descriptive Statistics and Comparing Independent Groups. J Chem Educ, 2024. [Google Scholar] [CrossRef]
- Sequeira, C.A.; Borges, E.M. Enhancing Statistical Education in Chemistry and STEAM Using JAMOVI. Part 2. Comparing Dependent Groups and Principal Component Analysis (PCA). J Chem Educ 2024, 101, 5040–5049. [Google Scholar] [CrossRef]
- Tanaka, M.; Takamura, T.; Watanabe, H.; Endo, M.; Yanagi, T.; Okamoto, K. In Vitro Growth of Cymbidium Plantlets Cultured under Superbright Red and Blue Light-Emitting Diodes (LEDs). J Hortic Sci Biotechnol 1998, 73, 39–44. [Google Scholar] [CrossRef]
- Hiyama, A.; Takemiya, A.; Munemasa, S.; Okuma, E.; Sugiyama, N.; Tada, Y.; Murata, Y.; Shimazaki, K. Blue Light and CO2 Signals Converge to Regulate Light-Induced Stomatal Opening. Nat Commun 2017, 8, 1284. [Google Scholar] [CrossRef] [PubMed]
- Shin, K.S.; Murthy, H.N.; Heo, J.W.; Hahn, E.J.; Paek, K.Y. The Effect of Light Quality on the Growth and Development of in Vitro Cultured Doritaenopsis Plants. Acta Physiol Plant 2008, 30, 339–343. [Google Scholar] [CrossRef]
- Li, H.; Tang, C.; Xu, Z. The Effects of Different Light Qualities on Rapeseed (Brassica Napus L.) Plantlet Growth and Morphogenesis in Vitro. Sci Hortic 2013, 150, 117–124. [Google Scholar] [CrossRef]
- Murashige, T. Plant Propagation Through Tissue Cultures. Annu Rev Plant Physiol 1974, 25, 135–166. [Google Scholar] [CrossRef]
- Liu, M.; Xu, Z.; Guo, S.; Tang, C.; Liu, X.; Jao, X. Evaluation of Leaf Morphology, Structure and Biochemical Substance of Balloon Flower (Platycodon Grandiflorum (Jacq.) A. DC.) Plantlets in Vitro under Different Light Spectra. Sci Hortic 2014, 174, 112–118. [Google Scholar] [CrossRef]
- SÆBØ, A.; Krekling, T.; Appelgren, M. Light Quality Affects Photosynthesis and Leaf Anatomy of Birch Plantlets in Vitro. Plant Cell Tissue Organ Cult 1995, 41, 177–185. [Google Scholar] [CrossRef]
- Kim, S.-J.; Hahn, E.-J.; Heo, J.-W.; Paek, K.-Y. Effects of LEDs on Net Photosynthetic Rate, Growth and Leaf Stomata of Chrysanthemum Plantlets in Vitro. Sci Hortic 2004, 101, 143–151. [Google Scholar] [CrossRef]
- Chée, R. In Vitro Culture of Vitis: The Effects of Light Spectrum, Manganese Sulfate and Potassium Iodide on Morphogenesis. Plant Cell Tissue Organ Cult 1986, 7, 121–134. [Google Scholar] [CrossRef]
- Jao, R.-C.; Lai, C.-C.; Fang, W.; Chang, S.-F. Effects of Red Light on the Growth of Zantedeschia Plantlets in Vitro and Tuber Formation Using Light-Emitting Diodes. HortScience 2005, 40, 436–438. [Google Scholar] [CrossRef]
- Lindemann, I. da S.; Lang, G.H.; Dittgen, C.L.; Rombaldi, C.V.; Elias, M.C.; Vanier, N.L. Effects of Preharvest Desiccation Using Glufosinate-Ammonium on Quality Attributes of Freshly Harvested and Long-Term Stored Soybeans. ACS Agricultural Science & Technology 2021, 1, 312–321. [Google Scholar] [CrossRef]
- Righini, H.; Tedeschi, P.; Maietti, A.; Francioso, O.; Quintana, A.M.; Zuffi, V.; Ciurli, A.; Roberti, R. Enhanced Growth and Nutritional Properties of Radish Sprouts Using Extracts from Anabaena Minutissima and Sargassum Vulgare. ACS Agricultural Science & Technology 2024, 4, 700–710. [Google Scholar] [CrossRef]
- Borges, E.M.; Gelinski, J.M.L.N.; de Oliveira Souza, V.C.; Barbosa Jr., F.; Batista, B.L. Monitoring the Authenticity of Organic Rice via Chemometric Analysis of Elemental Data. Food Research International 2015, 77, 299–309. [Google Scholar] [CrossRef]
- Sidou, L.F.; Borges, E.M. Teaching Principal Component Analysis Using a Free and Open Source Software Program and Exercises Applying PCA to Real-World Examples. J Chem Educ 2020, 97, 1666–1676. [Google Scholar] [CrossRef]
- Borges, E.M. How to Select Equivalent and Complimentary Reversed Phase Liquid Chromatography Columns from Column Characterization Databases. Anal Chim Acta 2014, 807, 143–152. [Google Scholar] [CrossRef]
- Zhou, J.; Wang, Y.; Zuverza-Mena, N.; Dimkpa, C.O.; White, J.C. Copper-Based Materials as an Effective Strategy for Improving Drought Resistance in Soybean (Glycine Max) at the Reproductive Stage. ACS Agricultural Science & Technology 2024, 4, 735–746. [Google Scholar] [CrossRef]
- Datta Majumdar, T.; Ghosh, C.K.; Mukherjee, A. Dual Role of Copper Nanoparticles in Bacterial Leaf Blight-Infected Rice: A Therapeutic and Metabolic Approach. ACS Agricultural Science & Technology 2021, 1, 160–172. [Google Scholar] [CrossRef]
- Neo, D.C.J.; Ong, M.M.X.; Lee, Y.Y.; Teo, E.J.; Ong, Q.; Tanoto, H.; Xu, J.; Ong, K.S.; Suresh, V. Shaping and Tuning Lighting Conditions in Controlled Environment Agriculture: A Review. ACS Agricultural Science & Technology 2022, 2, 3–16. [Google Scholar] [CrossRef]
- Perea-Brenes, A.; Garcia, J.L.; Cantos, M.; Cotrino, J.; Gonzalez-Elipe, A.R.; Gomez-Ramirez, A.; Lopez-Santos, C. Germination and First Stages of Growth in Drought, Salinity, and Cold Stress Conditions of Plasma-Treated Barley Seeds. ACS Agricultural Science & Technology 2023, 3, 760–770. [Google Scholar] [CrossRef]
- Tang, C.; Zhang, X.; Zhao, Y.; Li, L.; Wei, J.; Yang, Z.; Chen, X.; Zheng, H.; Zhou, Z.; Tang, W.; et al. Response of Chlorosis and Growth to Light Intensity in Rice Seedlings. ACS Agricultural Science & Technology 2024, 4, 234–243. [Google Scholar] [CrossRef]
- Garg, V.K.; Gupta, R.; Kumar, R.; Gupta, R.K. Adsorption of Chromium from Aqueous Solution on Treated Sawdust. Bioresour Technol 2004, 92, 79–81. [Google Scholar] [CrossRef]
- Shrivastava, A.; Gupta, V. Methods for the Determination of Limit of Detection and Limit of Quantitation of the Analytical Methods. Chronicles of Young Scientists 2011, 2, 21. [Google Scholar] [CrossRef]
- Alvarenga, I.C.A.; Pacheco, F.V.; Silva, S.T.; Bertolucci, S.K.V.; Pinto, J.E.B.P. In Vitro Culture of Achillea Millefolium L.: Quality and Intensity of Light on Growth and Production of Volatiles. Plant Cell, Tissue and Organ Culture (PCTOC) 2015, 122, 299–308. [Google Scholar] [CrossRef]
Figure 1.
Seedlings of the Marubakaido apple rootstock cultivar obtained after 30 days of in vitro rooting under different light sources.
Figure 1.
Seedlings of the Marubakaido apple rootstock cultivar obtained after 30 days of in vitro rooting under different light sources.
Figure 2.
Boxplot of height of Marubakaido apple rootstock seedlings obtained using four independent treatments.
Figure 2.
Boxplot of height of Marubakaido apple rootstock seedlings obtained using four independent treatments.
Figure 3.
Boxplot of fresh mass of aerial part of Marubakaido apple rootstock seedlings obtained using four independent treatments.
Figure 3.
Boxplot of fresh mass of aerial part of Marubakaido apple rootstock seedlings obtained using four independent treatments.
Figure 4.
Boxplots of dry mass of aerial part (mg) of Marubakaido apple rootstock seedlings obtained using four independent treatments.
Figure 4.
Boxplots of dry mass of aerial part (mg) of Marubakaido apple rootstock seedlings obtained using four independent treatments.
Figure 5.
Boxplot of roots dry mass (mg) of Marubakaido apple rootstock seedlings obtained using four independent treatments.
Figure 5.
Boxplot of roots dry mass (mg) of Marubakaido apple rootstock seedlings obtained using four independent treatments.
Figure 6.
Boxplot of roots fresh mass (mg) of Marubakaido apple rootstock seedlings obtained using four independent treatments.
Figure 6.
Boxplot of roots fresh mass (mg) of Marubakaido apple rootstock seedlings obtained using four independent treatments.
Figure 7.
Boxplots of number of leaves in Marubakaido apple rootstock seedlings obtained using four independent treatments.
Figure 7.
Boxplots of number of leaves in Marubakaido apple rootstock seedlings obtained using four independent treatments.
Figure 8.
Boxplot of the number of roots fresh mass (mg) of Marubakaido apple rootstock seedlings obtained using four independent treatments.
Figure 8.
Boxplot of the number of roots fresh mass (mg) of Marubakaido apple rootstock seedlings obtained using four independent treatments.
Figure 9.
Loading plot of the vegetative growth of seedlings of ‘Marubakaido’ apple tree rootstocks rooted in vitro under different sources of light.
Figure 9.
Loading plot of the vegetative growth of seedlings of ‘Marubakaido’ apple tree rootstocks rooted in vitro under different sources of light.
Figure 10.
Score plot of the vegetative growth of seedlings of ‘Marubakaido’ apple tree rootstocks rooted in vitro under different sources of light.
Figure 10.
Score plot of the vegetative growth of seedlings of ‘Marubakaido’ apple tree rootstocks rooted in vitro under different sources of light.
Table 1.
Vegetative growth of seedlings of ‘Marubakaido’ apple tree rootstocks rooted in vitro under different sources of light. IQR is the interquartile range.
Table 1.
Vegetative growth of seedlings of ‘Marubakaido’ apple tree rootstocks rooted in vitro under different sources of light. IQR is the interquartile range.
| |
|
Mean |
Std. Deviation |
IQR |
| Dry mass of aerial part (mg) |
Blue |
27.400 |
7.287 |
12.750 |
| Dry mass of aerial part (mg) |
Red |
19.583 |
6.494 |
6.000 |
| Dry mass of aerial part (mg) |
Red + Blue |
23.563 |
7.668 |
4.500 |
| Dry mass of aerial part (mg) |
Fluorescent |
13.150 |
5.060 |
7.250 |
| Height (cm) |
Blue |
1.540 |
0.224 |
0.300 |
| Height (cm) |
Red |
1.656 |
0.624 |
0.475 |
| Height (cm) |
Red + Blue |
1.459 |
0.215 |
0.313 |
| Height (cm) |
Fluorescent |
1.632 |
0.264 |
0.287 |
| Number of Leaves |
Blue |
12.500 |
3.663 |
3.500 |
| Number of Leaves |
Red |
11.208 |
1.933 |
2.000 |
| Number of Leaves |
Red + Blue |
12.375 |
3.594 |
2.500 |
| Number of Leaves |
Fluorescent |
10.550 |
2.395 |
3.250 |
| Number of Roots |
Blue |
7.450 |
3.268 |
5.000 |
| Number of Roots |
Red |
6.250 |
3.193 |
4.250 |
| Number of Roots |
Red + Blue |
5.188 |
3.209 |
5.000 |
| Number of Roots |
Fluorescent |
7.500 |
3.269 |
4.250 |
| Fresh mass of aerial part (mg) |
Blue |
118.250 |
34.865 |
47.500 |
| Fresh mass of aerial part (mg) |
Red |
85.833 |
27.998 |
27.500 |
| Fresh mass of aerial part (mg) |
Red + Blue |
101.813 |
34.083 |
40.500 |
| Fresh mass of aerial part (mg) |
Fluorescent |
63.850 |
27.017 |
40.250 |
| Roots dry mass (mg) |
Blue |
141.800 |
55.981 |
71.000 |
| Roots dry mass (mg) |
Red |
98.500 |
31.903 |
52.000 |
| Roots dry mass (mg) |
Red + Blue |
129.000 |
61.449 |
58.500 |
| Roots dry mass (mg) |
Fluorescent |
103.500 |
36.182 |
74.000 |
| Roots fresh mass (mg) |
Blue |
15.200 |
5.281 |
6.000 |
| Roots fresh mass (mg) |
Red |
14.944 |
5.620 |
6.250 |
| Roots fresh mass (mg) |
Red + Blue |
15.091 |
3.885 |
5.000 |
| Roots fresh mass (mg) |
Fluorescent |
16.600 |
5.604 |
10.000 |
Table 2.
Tukey Post hoc test for the fresh mass of aerial part (mg) obtained for the four treatments.
Table 2.
Tukey Post hoc test for the fresh mass of aerial part (mg) obtained for the four treatments.
| |
|
Mean Difference |
SE |
t |
ptukey |
| Blue |
Red |
7.817 |
2.009 |
3.890 |
0.001 |
|
| |
(Red + Blue) |
3.838 |
2.226 |
1.724 |
0.319 |
|
| |
Fluorescent |
14.250 |
2.099 |
6.790 |
< .001 |
|
| Red |
(Red + Blue) |
-3.979 |
2.142 |
-1.858 |
0.255 |
|
| |
Fluorescent |
6.433 |
2.009 |
3.202 |
0.011 |
|
| (Red + Blue) |
Fluorescent |
10.413 |
2.226 |
4.678 |
< .001 |
|
Table 3.
Tukey Post hoc test for the dry mass of aerial part (mg) obtained for the four treatments.
Table 3.
Tukey Post hoc test for the dry mass of aerial part (mg) obtained for the four treatments.
| |
|
Mean Difference |
SE |
t |
ptukey |
| Blue |
Red |
7.817 |
2.009 |
3.890 |
0.001 |
| |
(Red + Blue) |
3.838 |
2.226 |
1.724 |
0.319 |
| |
Fluorescent |
14.250 |
2.099 |
6.790 |
< .001 |
| Red |
(Red + Blue) |
-3.979 |
2.142 |
-1.858 |
0.255 |
| |
Fluorescent |
6.433 |
2.009 |
3.202 |
0.011 |
| (Red + Blue) |
Fluorescent |
10.413 |
2.226 |
4.678 |
< .001 |
Table 4.
Pairwise comparisons of Roots dry masses (mg) obtained using the four treatments.
Table 4.
Pairwise comparisons of Roots dry masses (mg) obtained using the four treatments.
| Treatment |
Treatment |
W |
p |
| Blue |
Fluorescent |
-3.371 |
0.120 |
| Blue |
Red |
-3.805 |
0.055 |
| Blue |
Red + Blue |
-3.515 |
0.094 |
| Blue |
Red + Blue |
-0.221 |
1.000 |
| Fluorescent |
Red |
-1.202 |
0.915 |
| Fluorescent |
Red + Blue |
-1.760 |
0.725 |
| Fluorescent |
Red + Blue |
3.531 |
0.091 |
| Red |
Red + Blue |
-1.863 |
0.681 |
| Red |
Red + Blue |
4.183 |
0.026 |
| Red + Blue |
Red + Blue |
2.760 |
0.290 |
Table 5.
Chlorophyll a, b, total (a + b) and carotenoids content in leaf samples of ‘Marubakaido’ apple tree rootstock seedlings rooted in vitro under different light sources.
Table 5.
Chlorophyll a, b, total (a + b) and carotenoids content in leaf samples of ‘Marubakaido’ apple tree rootstock seedlings rooted in vitro under different light sources.
| Treatments |
Chlorophyll a
(mg g-1) |
Chlorophyll b
(mg g-1) |
Total Chlorophyll (a+b)
(mg g-1) |
Carotenoids (mg g-1) |
| Blue LED |
2.37b
|
0.54b
|
2.9b
|
0.74b
|
| RED LED |
2.49b
|
0.63b
|
3.12b
|
0.78b
|
| Red+ Blue LED vermelho + azul |
2.59b
|
0.62b
|
3.21b
|
0.79b
|
| Control |
3.17a
|
0.83a
|
3.99a
|
0.94a
|
| RSD (%) |
7.7 |
8.1 |
7.7 |
6.9 |
|
Disclaimer/Publisher’s Note: The statements, opinions and data contained in all publications are solely those of the individual author(s) and contributor(s) and not of MDPI and/or the editor(s). MDPI and/or the editor(s) disclaim responsibility for any injury to people or property resulting from any ideas, methods, instructions or products referred to in the content. |
© 2024 by the authors. Licensee MDPI, Basel, Switzerland. This article is an open access article distributed under the terms and conditions of the Creative Commons Attribution (CC BY) license (http://creativecommons.org/licenses/by/4.0/).