Preprint
Article

Photoaging Protective Effects of Green Ball Apple Peel Isolated Quercitrin

This version is not peer-reviewed.

Submitted:

22 October 2024

Posted:

22 October 2024

You are already at the latest version

A peer-reviewed article of this preprint also exists.

Abstract
Premature skin aging, also known as photoaging, refers to the changes of the structure and function of the skin caused by chronic sun exposure. The ultraviolet radiation in the sunlight is one of the key factors that causes photoaging. Thus, MMPs, TGFB1, and NF-κB signaling can be an effective therapeutic strategy for UVB exposure. In this study, we used human dermal fibroblast and mouse macrophage cells to identify the mediators of skin photoaging. Quercitrin isolated from ‘Green Ball’ apple peel was treated to UVB-irradiated fibroblast cell and lipopolysaccharide (LPS)-induced macrophages to identify photoaging prevention effect of quercitrin. Genes that are associated with photoaging was determined by using ELISA, western blot, and qPCR. Quercitrin increased collagen biosynthesis in UVB-irradiated fibroblast cell via regulating MMPs, TIMP-1, TGFB1, HAS2, and COL1A2. In addition, quercitrin regulated p-65, iNOS, COX-2, and mediators (PGE2 and NO), in the NF-κB signaling process, and inhibited the production of cytokines in LPS-induced macrophages. These results indicates that quercitrin can improve photoaging damaged skin by regulating MMPs, TGFβ, and NF-κB signaling pathway modulators.
Keywords: 
Subject: 
Biology and Life Sciences  -   Aging

1. Introduction

Skin functions as a barrier to prevent the invasion of external threats such as pathogens [7]. Currently, the number of chronic skin diseases continues to increase due to lifestyle change, environmental pollution, and stress [12]. These skin diseases cause skin barrier dysfunction, which leads to pathogen invasion and cause itchiness [9]. This itchiness leads to scratching that damages the skin causing additional skin barrier dysfunction and infection. This process can cause severe disturbance on homeostasis of immune cell and fibroblast cell function [2,16].
Ultraviolet B (UVB) is one of the major stimulants in photoaging that can causes sunburns and skin cancer. Chronic exposure to UVB can damage the skin matrix by inducing matrix metallo-proteinases (MMPs) and inhibit transforming growth factor (TGF)-β/Smads activity which decrease the biosynthesis of procollagen fragments and collagen in the skin matrix [17]. Furthermore, UVB can cause skin moisture loss by affecting hyaluronic acid (HA), which is one of the key components in dermis. Accumulation of these damages in key components of skin matrix generates wrinkles in skin, which indicates skin aging. In addition to the effect of MMPs in fibroblast cells, it is also known to regulate nuclear factor-kappa B (NF-κB) signaling in immune cells and modulate the production of inflammatory cytokines [22]. The NF-κB signaling pathway is an inflammatory signaling pathway that promotes the production of inflammatory factors including cytokines, receptors, and mediators [6]. Thus, preventing damages in the skin matrix and its components along with maintaining homeostasis of inflammatory activity is the key to maintaining healthy skin.
Many studies have determined health beneficial effect of various bioactive compounds in apple, which includes carotenoids, phenolic compounds, and flavonoids [27]. Among those bioactives, flavonoids have shown to have anti-oxidation and anti-inflammation effect [1,14,18,24,28]. While many flavonoids have been studied, little is known about quercitrin. Thus, we have isolated quercitrin from newly breed Green Ball apple peels and determined photoaging inhibition effect [13].

2. Materials and Methods

2.1. Plant Material

Green Ball apple (‘Fuji’ × ‘Golden Delicious’) was developed in 2008 by the Apple Research Center (ARC) in Korea. Green Ball apples were harvested by ARC at Gunwi-gun, Daegu, Korea.

2.2. Green Ball ApplePpeelEextraction

Green Ball apple peel and fruit was dried by dry oven (45°C) for overnight and ground to 40 meshes. 290 g of apple powder was added to 5 L of 70% ethanol and extracted with shaking incubator (120 rpm) for 24 h at room temperature. Then the extract was filtered and stored at -20°C after lyophilization.

2.3. Isolation and Identification of Bioactive Substances

70% ethanol was added at a concentration of 10 folds or higher than the total sample volume, and the mixture was stirred twice at 4°C for 24 h. The extract was filtered with a filter paper (Hyundai Micro, Korea) and concentrated using a rotary vacuum evaporator (IKA RV 8, IKA, Germany), and stored in a refrigerator. The prepared powder was suspended in 10% methanol, filtered, and then separated using Middle pressure liquid chromatography. The concentration of H2O-MeOH in the column filled with ODS-SM-50B (50 μm, Yamazen, Japan) was increased from 0% to 100% [15]. 1H- and 13C-NMR were measured using Avance III HD 600 MHz (Bruker Biospin GmbH, Rheinstetten, Germany). Purified compound spectrum of 1H-NMR showed, δ: 7.36 (1H, brs, H-2'), 7.35 (1H, dd, J = 1.8, 8.4, H-6'), 6.93 (1H, d, J = 8.4, H-5'), 6.39 (1H, brs, H-8), 6.22 (1H, brs, H-6), 5.37 (1H, s, anomeric), 4.24 (1H, s, H-2''), 3.87 (1H, m, H-4''), 3.77 (1H, m, H-3''), 3.43 (1H, m, H-5''), 0.96 (3H, s, rha-CH3), 13C-NMR (150 MHz, MeOD) δ : 178.2 (C=O), 164.5 (C-7), 161.8 (C-5), 157.9 (C-2), 157.1 (C-9), 148.4 (C-4'), 145.0 (C-3'), 134.8 (C-3), 121.5 (C-1'), 121.4 (C-6'), 115.5 (C-2'), 114.9 (C-5'), 102.4 (C-10), 102.1 (C-1''), 98.4 (C-6), 93.3 (C-8), 71.8 (C-4''), 70.7 (C-2''), 70.6 (C-3''), 70.5 (C-4''), 16.2 (C-6''). The compound was identified as quercitrin (Figure 1).

2.4. Cell Culture and Maintenance

Human skin fibroblasts (CCD-986Sk) and mouse macrophages (Raw 264.7) cells were purchased from American Type Culture Collection (ATCC, No: CRL-1947, No: TIB-71). Each cells were cultured in Iscove’s Modified Dulbecco’s medium (IMDM) and Dulbecco’s modified Eagle’s medium (DMEM) supplemented with 10% fetal bovine serum (FBS) and 1% penicillin for 24 h or 48 h at 37°C.

2.5. Stimulation and Quercitrin Treatment

CCD-986sk cells and Raw cells were stimulated with UVB (30 mJ/cm2) and LPS (1 μg/mL) respectively. After stimulation, quercitrin was treated to each well. The well was incubated up to 48 h at 37°C [8].

2.6. Cytotoxicity Measurement by MTT Assay

Cell viability was measured by the method of Carmichael et al. [4]. Raw cells were plated in a 48-well plate at 5 × 10³ cells/mL concentration. Raw cells were cultured under condition of 5% CO₂ for 24 h. After samples were treated, cells were incubated for 24 h under the same conditions. Subsequently, 0.5 mL of MTT [3-(4,5-dimethylthiazol-2-yl)-2,5-diphenyltetrazolium bromide] solution was added and the cells were cultured for 4 h after when the culture solution was removed. Dimethyl sulfoxide (DMSO) 0.5 mL was added to each well, and incubated at room temperature for 10 min. The reacted solution was measured absorbance at 540 nm using an ELISA reader. For the control, the same amount of Dulbecco’s modified Eagle’s medium (DMEM) (-) as that in the sample was added and cultured under the same conditions. Cell viability (%) = (1 – O.D of sample / O.D of control) ×100.

2.7. Western Blot Assay

Stimulated CCD-986sk cells and Raw 264.7 cells with quercitrin treatment were lysed by 250 μL lysis buffer per well [25]. COL1A2, MMP-1, MMP-9, TIMP-1, iNOS, COX-2, GAPDH, and β-actin were used as primary and reacted overnight at 4°C. The membranes were washed three times in tris-buffered saline, 0.1% tween 20 detergent for 10 min. It was incubated with diluted secondary antibodies goat anti-mouse IgG1-HRP, mouse anti-rabbit IgG HRP, and bovine anti-goat IgG HRP at room temperature for 1 h. The band was developed by C-300 image analyzer (Azure Biosystems, Dublin, CA, USA).

2.8. Cytoplasmic and Nuclear Fractionation

Raw cells (2 × 10⁶ cells/mL) were seeded in culture dishes (100×20 mm) for 24 h [8]. The changed medium was treated with 1 μg/mL LPS, quercitrin in that order, and incubated for 30-60 min. The cells were collected and washed 2 times with cold phosphate buffer (PBS). Cytoplasmic and nuclear protein extractions were prepared with NE-PER according to the manufacturer's protocol.

2.9. Measurement of Nitric Oxide (NO) Production

NO was determined by determining the concentration of nitrate levels in cell supernatant using a Griess reagent system (Promega, USA). Cells with the concentration of 5×10⁴ cells/mL in 96-well plate were incubated at 37°C, 5% CO2-incubator for 24 h. After washing with PBS, supernatant was removed and serum-free medium was added. 1 μg/mL of LPS was added as the stimulant to all wells except the normal group. After samples were added, incubation for 24 h at 37°C, 5% CO₂-incubator. After 24 h, the supernatant was collected and reacted with Griess reagent and the absorbance was measured at 540 nm. The values are expressed in terms of NO production rate.

2.10. Measurement of Suppression of mRNA Expression by Real Time-PCR

Gene expression of UVB-irradiated CCD-986sk cells and LPS stimulated Raw cells were used. CCD-986sk cells (2-5 × 10⁶ cells/mL) and Raw cells (2-5 × 10⁶ cells/mL) were treated with quercitrin for each 48 and 24 h. After washing in PBS, RNA was extracted using GeneAll®Ribospin RNA extraction kit (GeneAll Biotechnology Co.) and prepared cDNA sample with qPCRBIO cDNA synthesis Kit (PCR Biosystems). Real time PCR was performed with PCRmax Eco 48 real-time PCR system (PCRmax) as described in Table S1 (Supplementary materials).
Table 1. Real-time PCR primer sequences.
Gene Accession primer Sequence (5' -3') Amplicon (bp)
COL1A2 NM_000089.3 Forward AGAAACACGTCTGGCTAGGAG 105
Reverse GCATGAAGGCAAGTTGGGTAG
MMP-1 NM_002421.4 Forward TGGGAGGCAAGTTGAAAAGC 135
Reverse CATCTGGGCTGCTTCATCAC
MMP-9 NM_004994.3 Forward CCTGGGCAGATTCCAAACCT 172
Reverse GTACACGCGAGTGAAGGTGA
HAS2 NM_005328.3 Forward GAGGACGACTTTATGACCAAGAGC 121
Reverse TAAGCAGCTGTGATTCCAAGGAGG
TGFB1 NM_000660.6 Forward CAATTCCTGGCGATACCTCAG 86
Reverse GCACAACTCCGGTGACATCAA
TIMP-1 NM_003254.3 Forward CTTCTGCAATTCCGACCTCGT 79
Reverse ACGCTGGTATAAGGTGGTCTG
TNF-α NM_001278601.1 Forward TCTACTGAACTTCGGGGTGA 87
Reverse AGGGTCTGGGCCATAGAACT
IL-1β NM_008361.4 Forward CAACCAACAAGTGATATTCTCCATG 152
Reverse GATCCACACTCTCCAGCTGCA
IL-6 NM_031168.2 Forward TAGTCCTTCCTACCCCAATTTCC 76
Reverse TTGGTCCTTAGCCACTCCTTC
MCP-1 NM_011333.3 Forward TTCCTCCACCACCATGCAG 64
Reverse CCAGCCGGCAACTGTGA
PTGES2 NM_133783.2 Forward CCGTGAGAAGGACTGAGATC 162
Reverse AAGTGATGACCTCTTCCAGG
GAPDH NM_008084.3 Forward TGCACCACCAACTGCTTAGC 87
Reverse GGCATGGACTGTGGTCATGAG
β-actin NM_007393.4 Forward CGTGCGTGACATCAAAGAGAA 137
Reverse GCTCGTTGCCAATAGTGATGA

2.11. Statistical Analysis

All data of this experiment are shown as mean ± standard deviation values. Statistical analysis was performed using SPSS 23 program (Statistical Package for Social Science, Chicago, IL, USA). Treatment was considered significant when p-values < 0.05 compared to control.

3. Results

3.1. MTT Assay of Quercitrin on CCD-986sk Cells and Raw 264.7 Cells

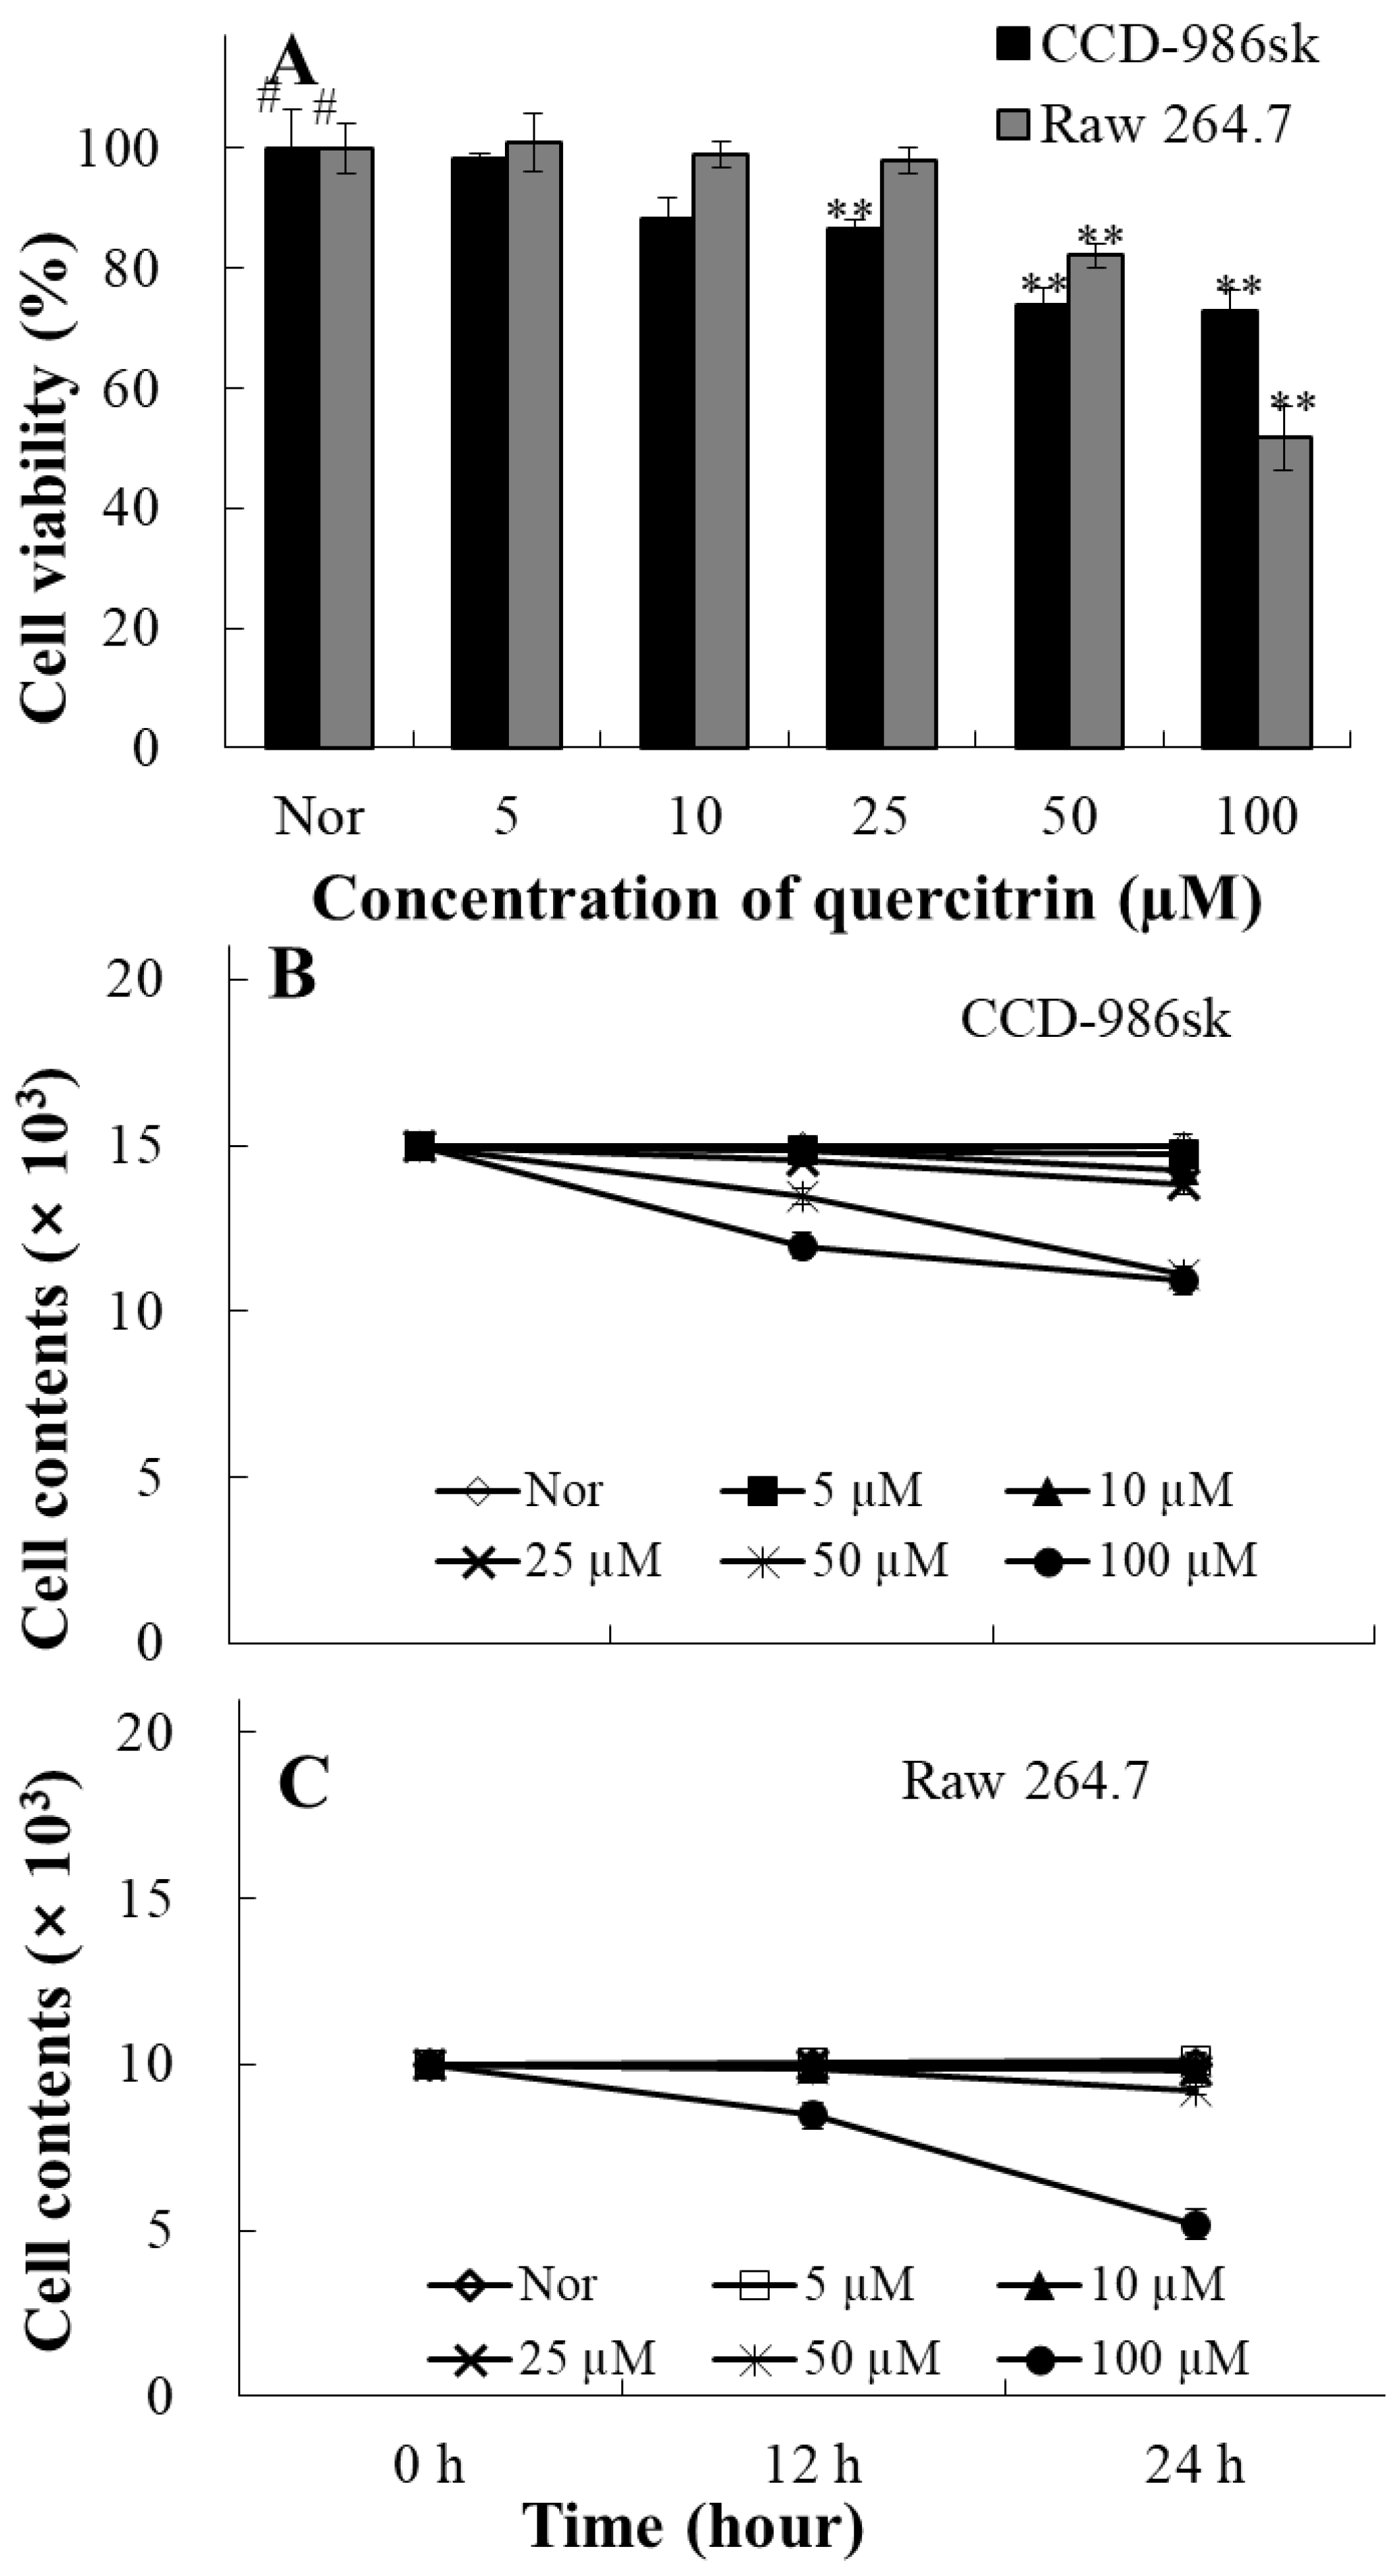
The cytotoxic effect of quercitrin was tested using MTT assay. In CCD-986sk cells, cell viability was 87% at 25 µM quercitrin while cell viability was 82% at 50 µM in Raw cells (Figure 2A). Additional test was performed to confirm toxicity for long term treatment. Quercitrin did not show toxicity on both CCD-986sk and Raw 264.7 cells in lower concentrations (Figure 2B,C). Thus, we have selected concentration based on these results.

3.2. Effects of Quercitrin on MMPs and TIMP-1 Expression in UVB-Irradiated CCD-986sk Cells

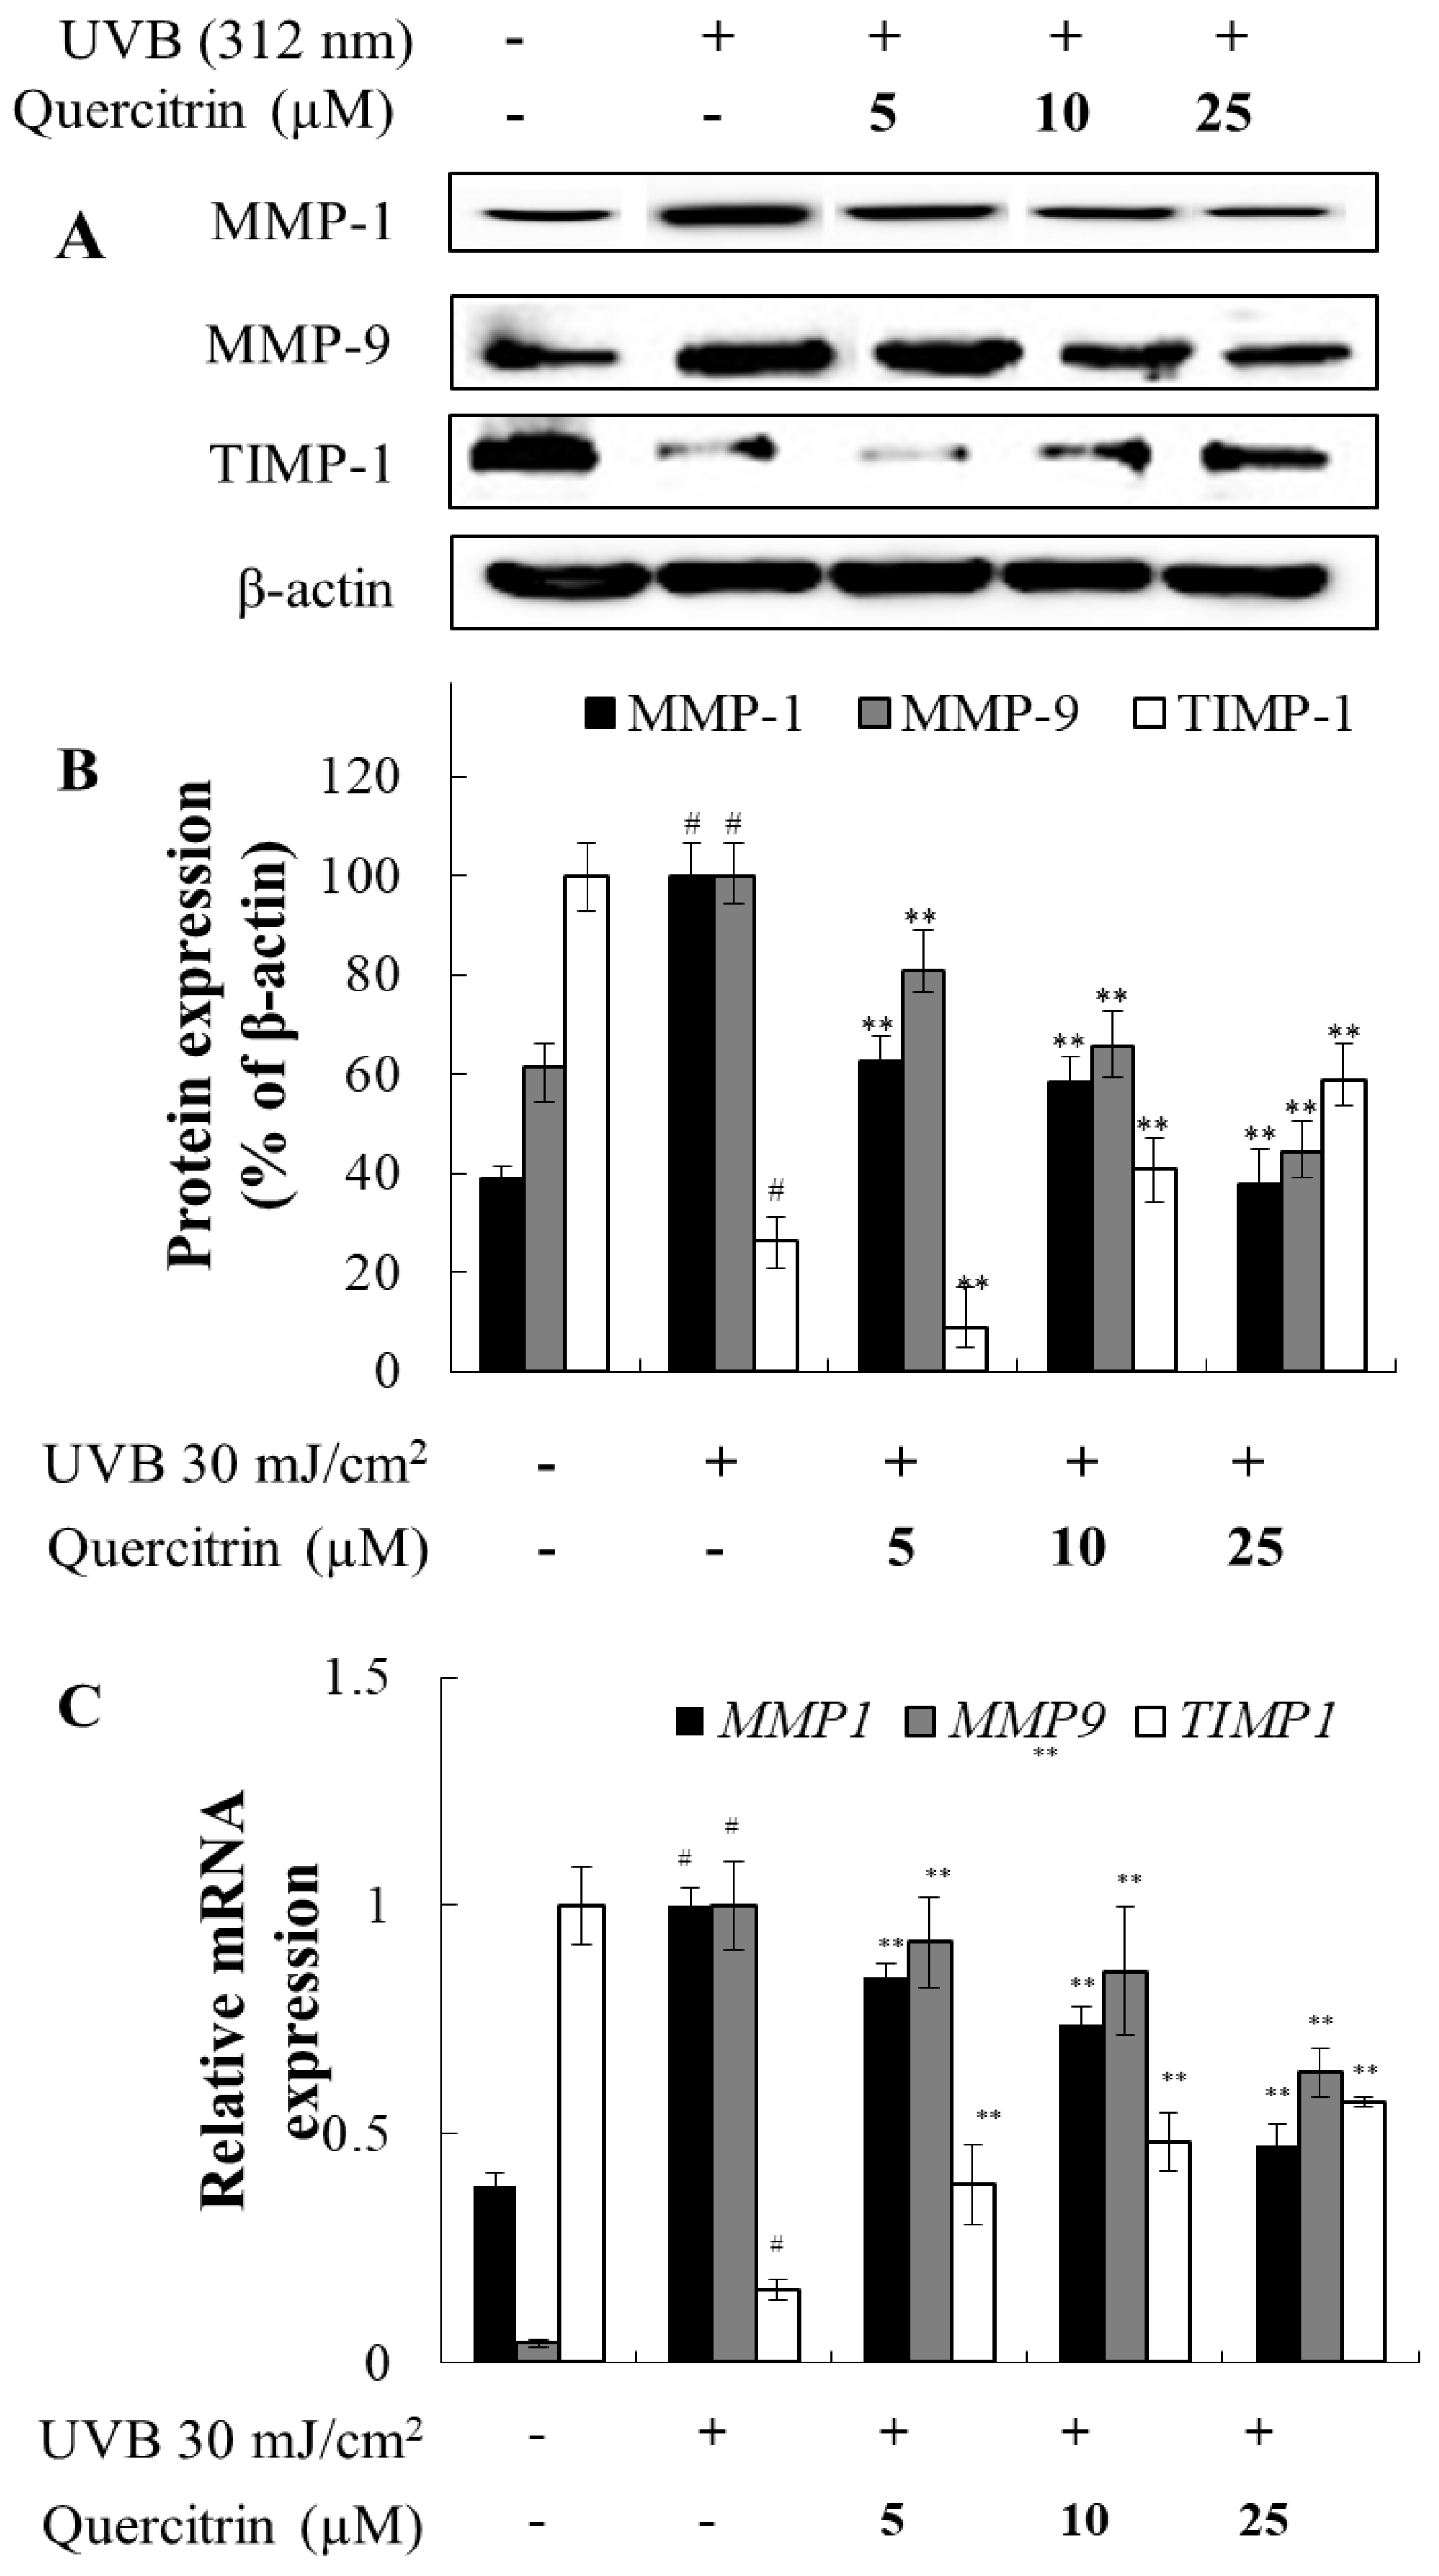
In CCD-986sk cell, UVB-irradiation significantly increased the production of MMP-1 and MMP-9 protein and gene in the control group (Figure 3). However, UVB-irradiated cells with quercitrin treatment significantly reduced the production of MMP-1 and MMP-9 protein and gene at all concentrations (Figure 3). TIMP-1, a glycoprotein and inhibitor of MMPs, is significantly reduced when cells were irradiated with UVB (Figure 3). Quercitrin at 10 and 25 µM showed significance improvement in TIMP-1 expression but not at 5 µM (Figure 3A,B). However, quercitrin treatment improved TIMP-1 mRNA expression in all concentrations (Figure 3C).

3.3. Effects of Quercitrin on COL1A2, HAS2, and TGFB1 Expression in UVB-Irradiated CCD-986sk Cells

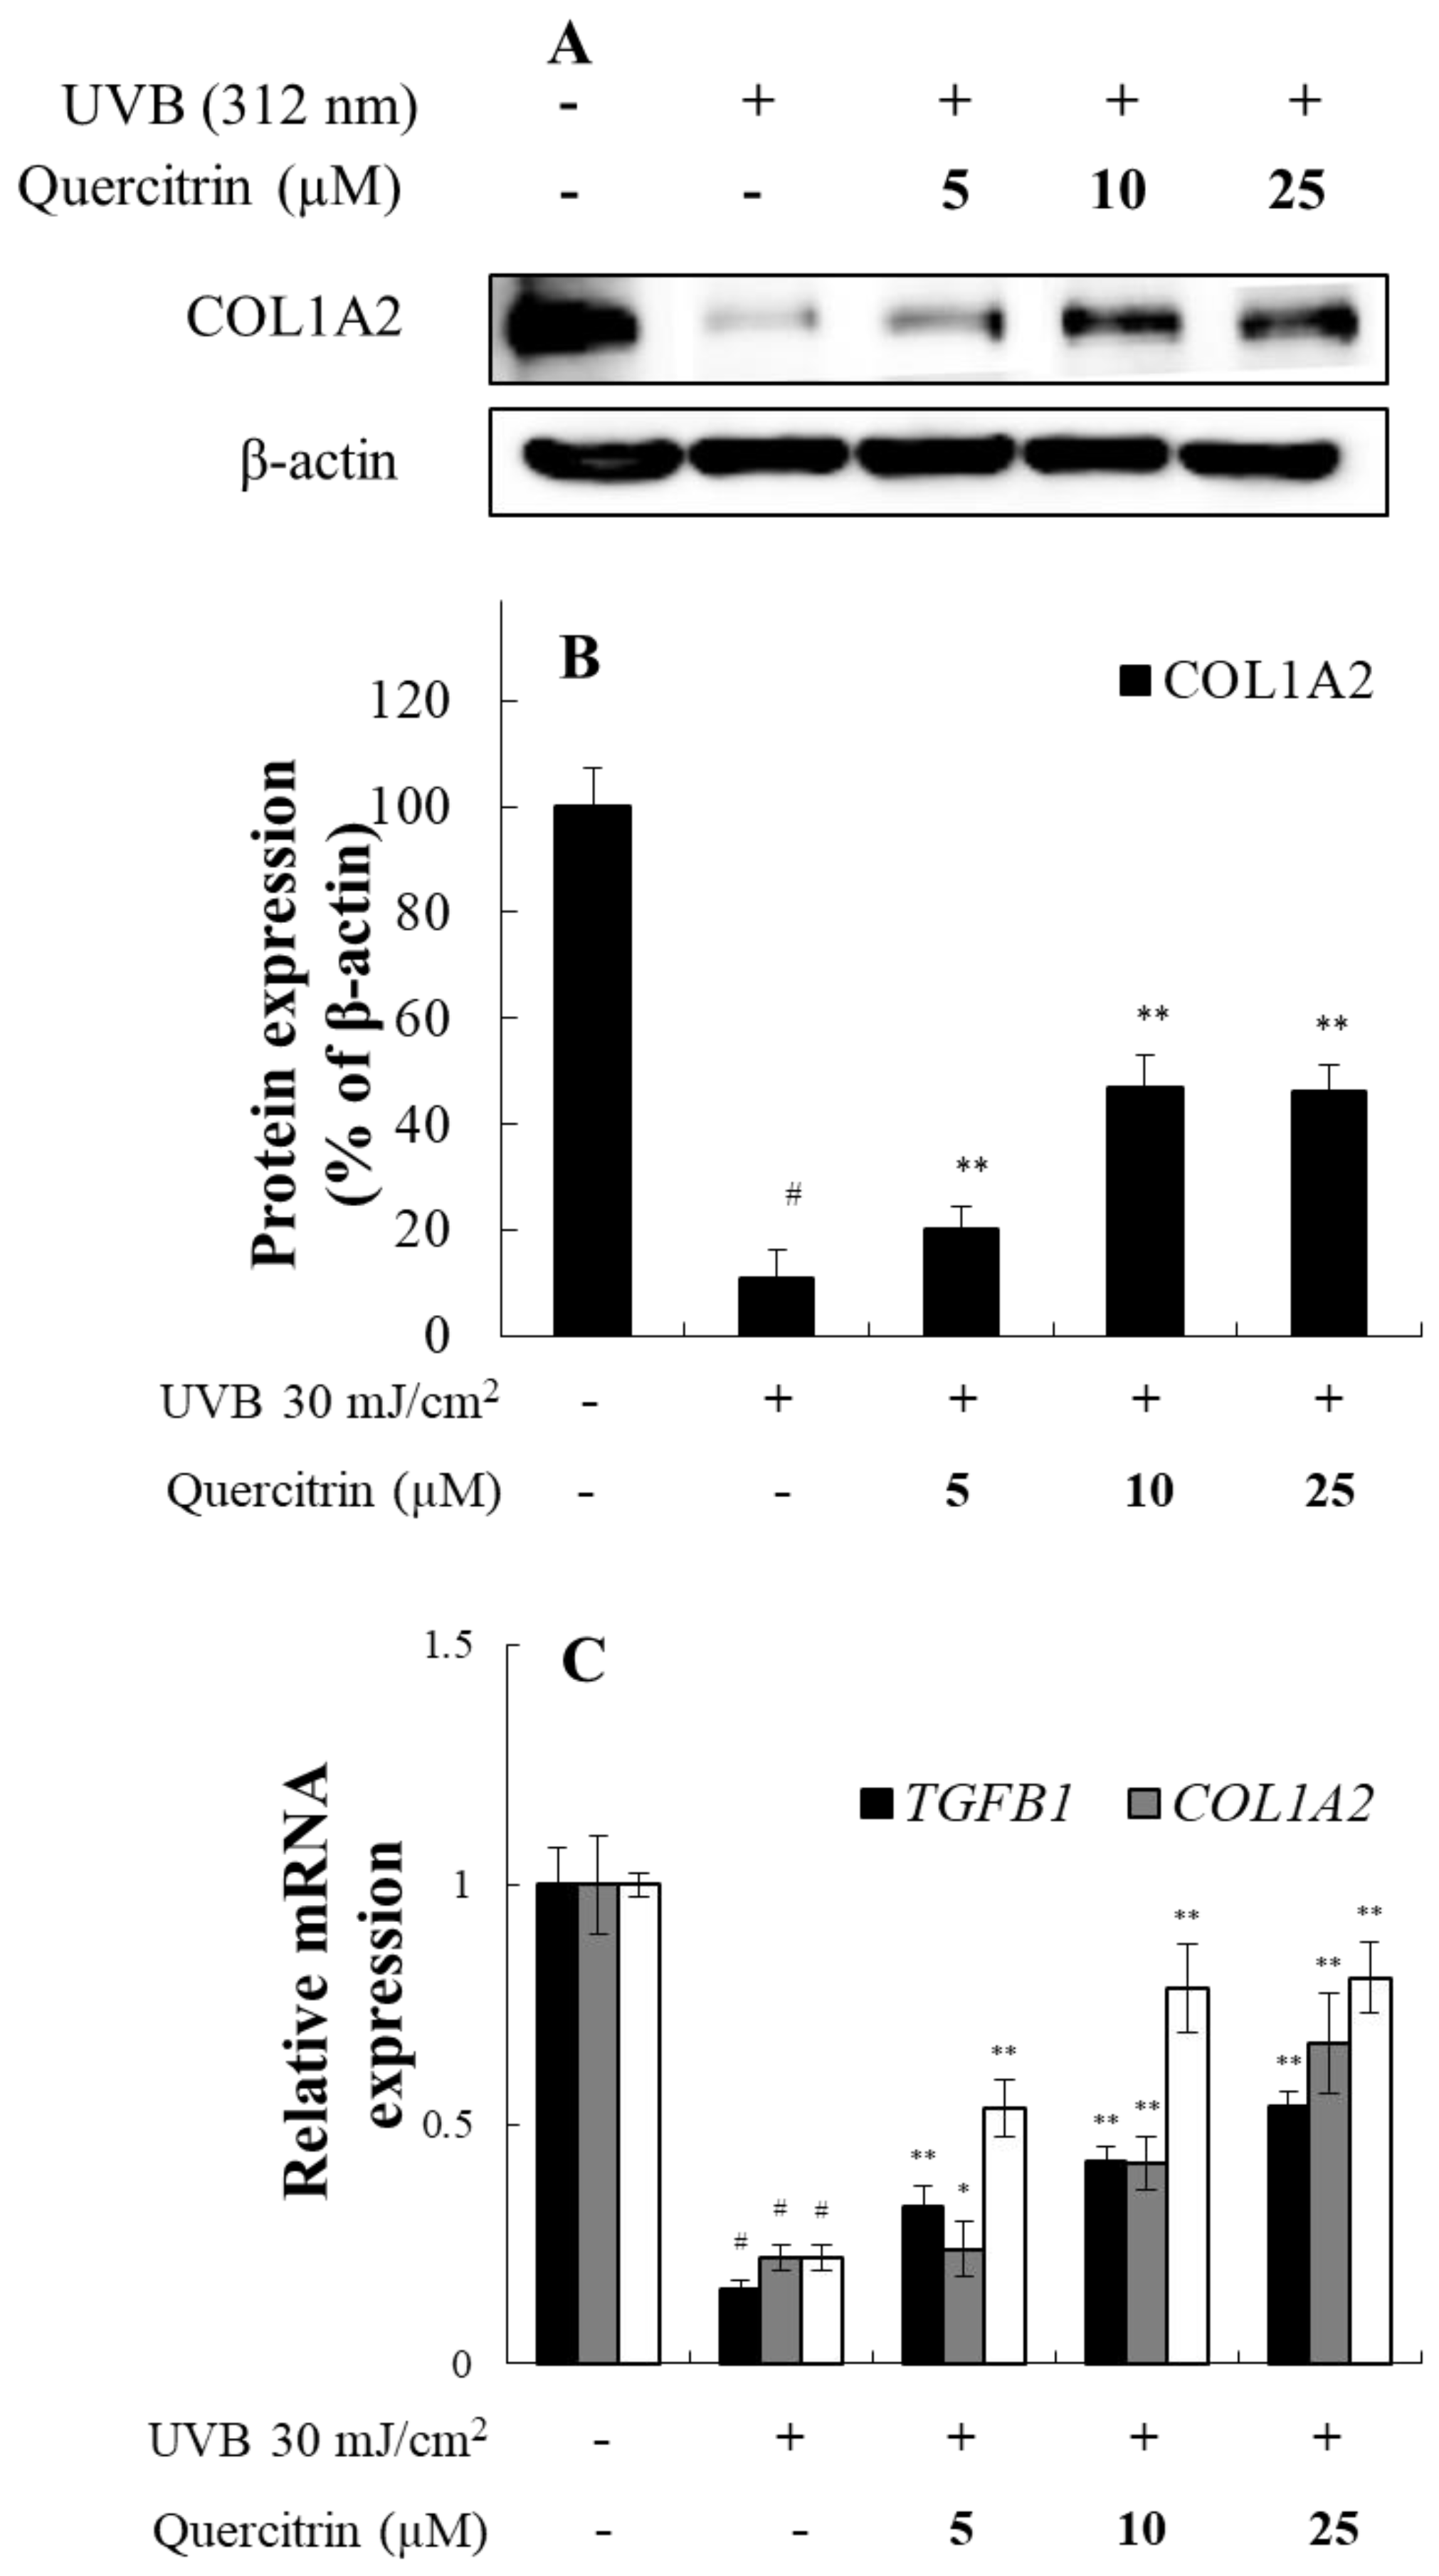
In CCD-986sk cell, UVB-irradiation significantly reduced the expression of both gene and protein of COLIA2, HAS2, and TGFB1 (Figure 4). However, when quercitrin was treated, UVB-irradiated cells showed higher COLIA2 protein expression (Figure 4B) and gene expression of COLIA2, HAS2, and TGFB1 mRNA suggesting a recovery from UVB damage (Figure 4C). Also, expression levels of both protein and gene increased depending on concentration, which suggest that there is a dose response. In particular, TGFB1 is crucial for collagen synthesis and tissue repair. Thus, our result suggests that quercitrin can ameliorate UVB-irradiation damage in the skin by reinforcing the skin matrix with collagen and hyaluronic acid by modulating TGFB1 expression.

3.4. Effects of Quercitrin on NF-κB Signaling Pathway in LPS-Stimulated Raw Cells

NF-κB is translocated from the cytoplasm to the nucleus in Raw cell when it is stimulated with LPS, which leads to inflammatory activity. Activation of COX-2 and iNOS is known to increase the production of PTGES2 and nitrite expression. Our results showed that, quercitrin reduced the production of NF-κB p65 subunit p-p65, COX-2, and iNOS when cells were stimulated with LPS (Figure 5A,B). Furthermore, quercitrin reduced the expression of both PTGES2 mRNA and nitrite expression (Figure 5C,D). These results suggest that quercitrin inhibited NF-κB activity, which reduced the production of COX-2 and iNOS. Furthermore, reduced COX-2 and iNOS decreased ptges2 and nitrite levels.

3.5. Effects of Quercitrin on Cytokines and Chemokine Expression in LPS-Stimulated Raw Cells

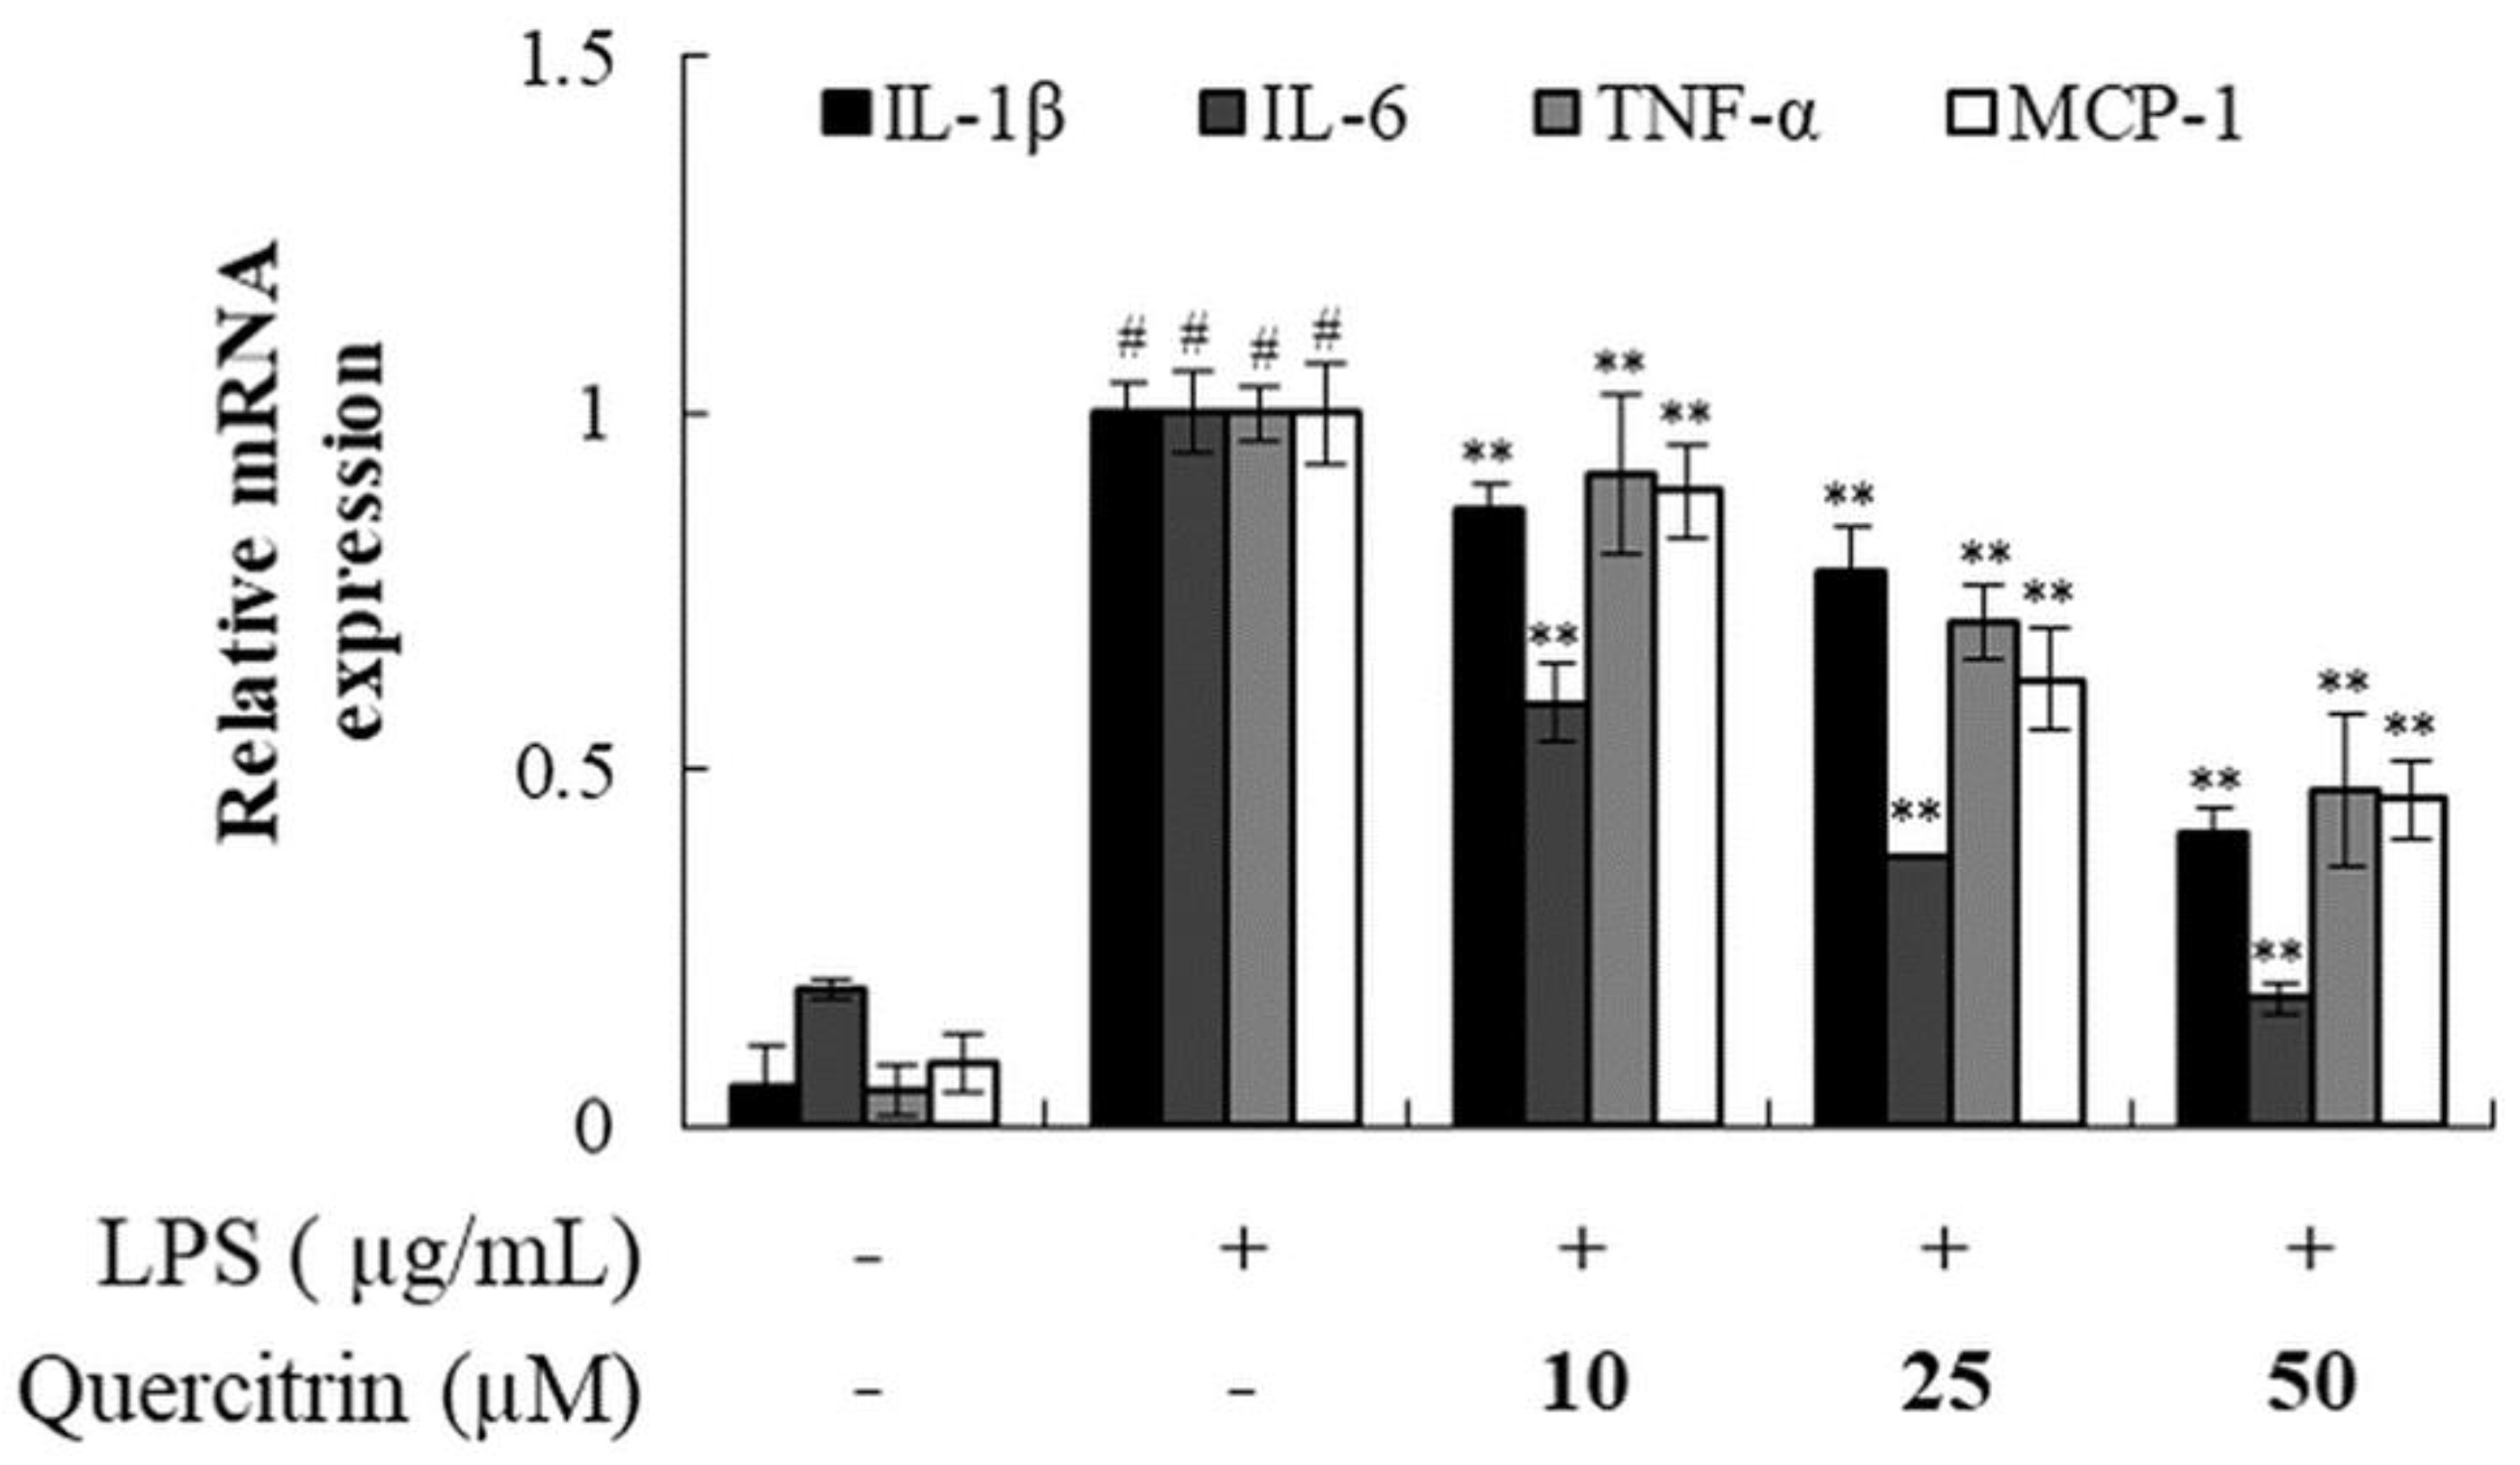
Relative gene expression of IL1β, IL6, TNF, and MCP1 mRNA were increased when Raw cells were stimulated with LPS. When cells were treated with quercitrin, relative expression of these genes were reduced (Figure 6). This suggests that quercitrin can reduce the expression of cytokines and chemokine that are involved in inflammatory activity. Thus, quercitrin has shown similar effect on both fibroblast cells and macrophages suggesting its ability to ameliorate and potentially recover damage that has been caused by external stimulant.

4. Discussions

UVB irradiation can cause various detrimental effects that includes aging, inflammation, skin damage, fibrosis, and necrosis by generating free radicals within the body [5]. Previous studies have reported that crude drugs containing various flavonoids and phenolic acids have shown prevention effect on photoaging and improve skin health [11,19,23]. In addition, compounds derived from natural sources has been known to have various health benefits including skin health and protective effect from UVB [10]. Thus, we have selected an apple flavonoid quercitrin in this study.
Chronic exposure to UVB is known to cause damage to the skin structure by breaking down the collagen matrix, resulting in skin thinning, loss of elasticity, and the formation of wrinkles. Furthermore, UVB irradiation regulates TGF-β1 signals and inhibits collagen biosynthesis, which causes skin aging or damage the skin. Our current study has shown that quercitrin was able to ameliorate the damage caused by UVB irradiation by reducing the activity of MMPs, which are enzymes that degrade collagen and associated extracellular matrix components, by inhibiting collagen degradation. MMPs not only break down collagen, but they also activate inflammatory pathways that contributes on tissue damage and inflammatory responses observed in UVB-induced skin aging [3,21]. In addition, TIMPs are responsible for preventing collagen degradation by binding to the N- and C-terminal domains of MMPs, which leads to inhibiting their activity [26]. Our findings suggest that quercitrin’s ability to inhibit MMPs while modulating TIMPs may play a crucial role in protecting the skin from collagen degradation and suppressing inflammation that can offer protection effect against UVB-induced skin damage. Furthermore, quercitrin treatment led to increased expression of TGFB1. As the TGF-β signaling pathway is well-known for its critical role in procollagen type 1 biosynthesis, the upregulation of TGF-β expression can stimulate collagen production and enhance the repair processes when the skin is damaged by UVB [20]. Our result corresponds with previous studies on TGF-β in skin repair and regeneration, which suggest that quercitrin not only prevents degradation but also promote tissue repair. In addition to collagen, hyaluronic acid is a key material of the extracellular matrix at skin, which is essential for maintaining hydration, structure, and overall skin integrity. UVB irradiation has been shown to reduce the activity of HAS2, the enzyme responsible for HA synthesis, leading to reduced HA levels and subsequent loss of skin moisture and elasticity. Our results showed that quercitrin treatment significantly increased HAS2 expression, which suggests hyaluronic acid level recovery and improve skin hydration after UVB exposure.
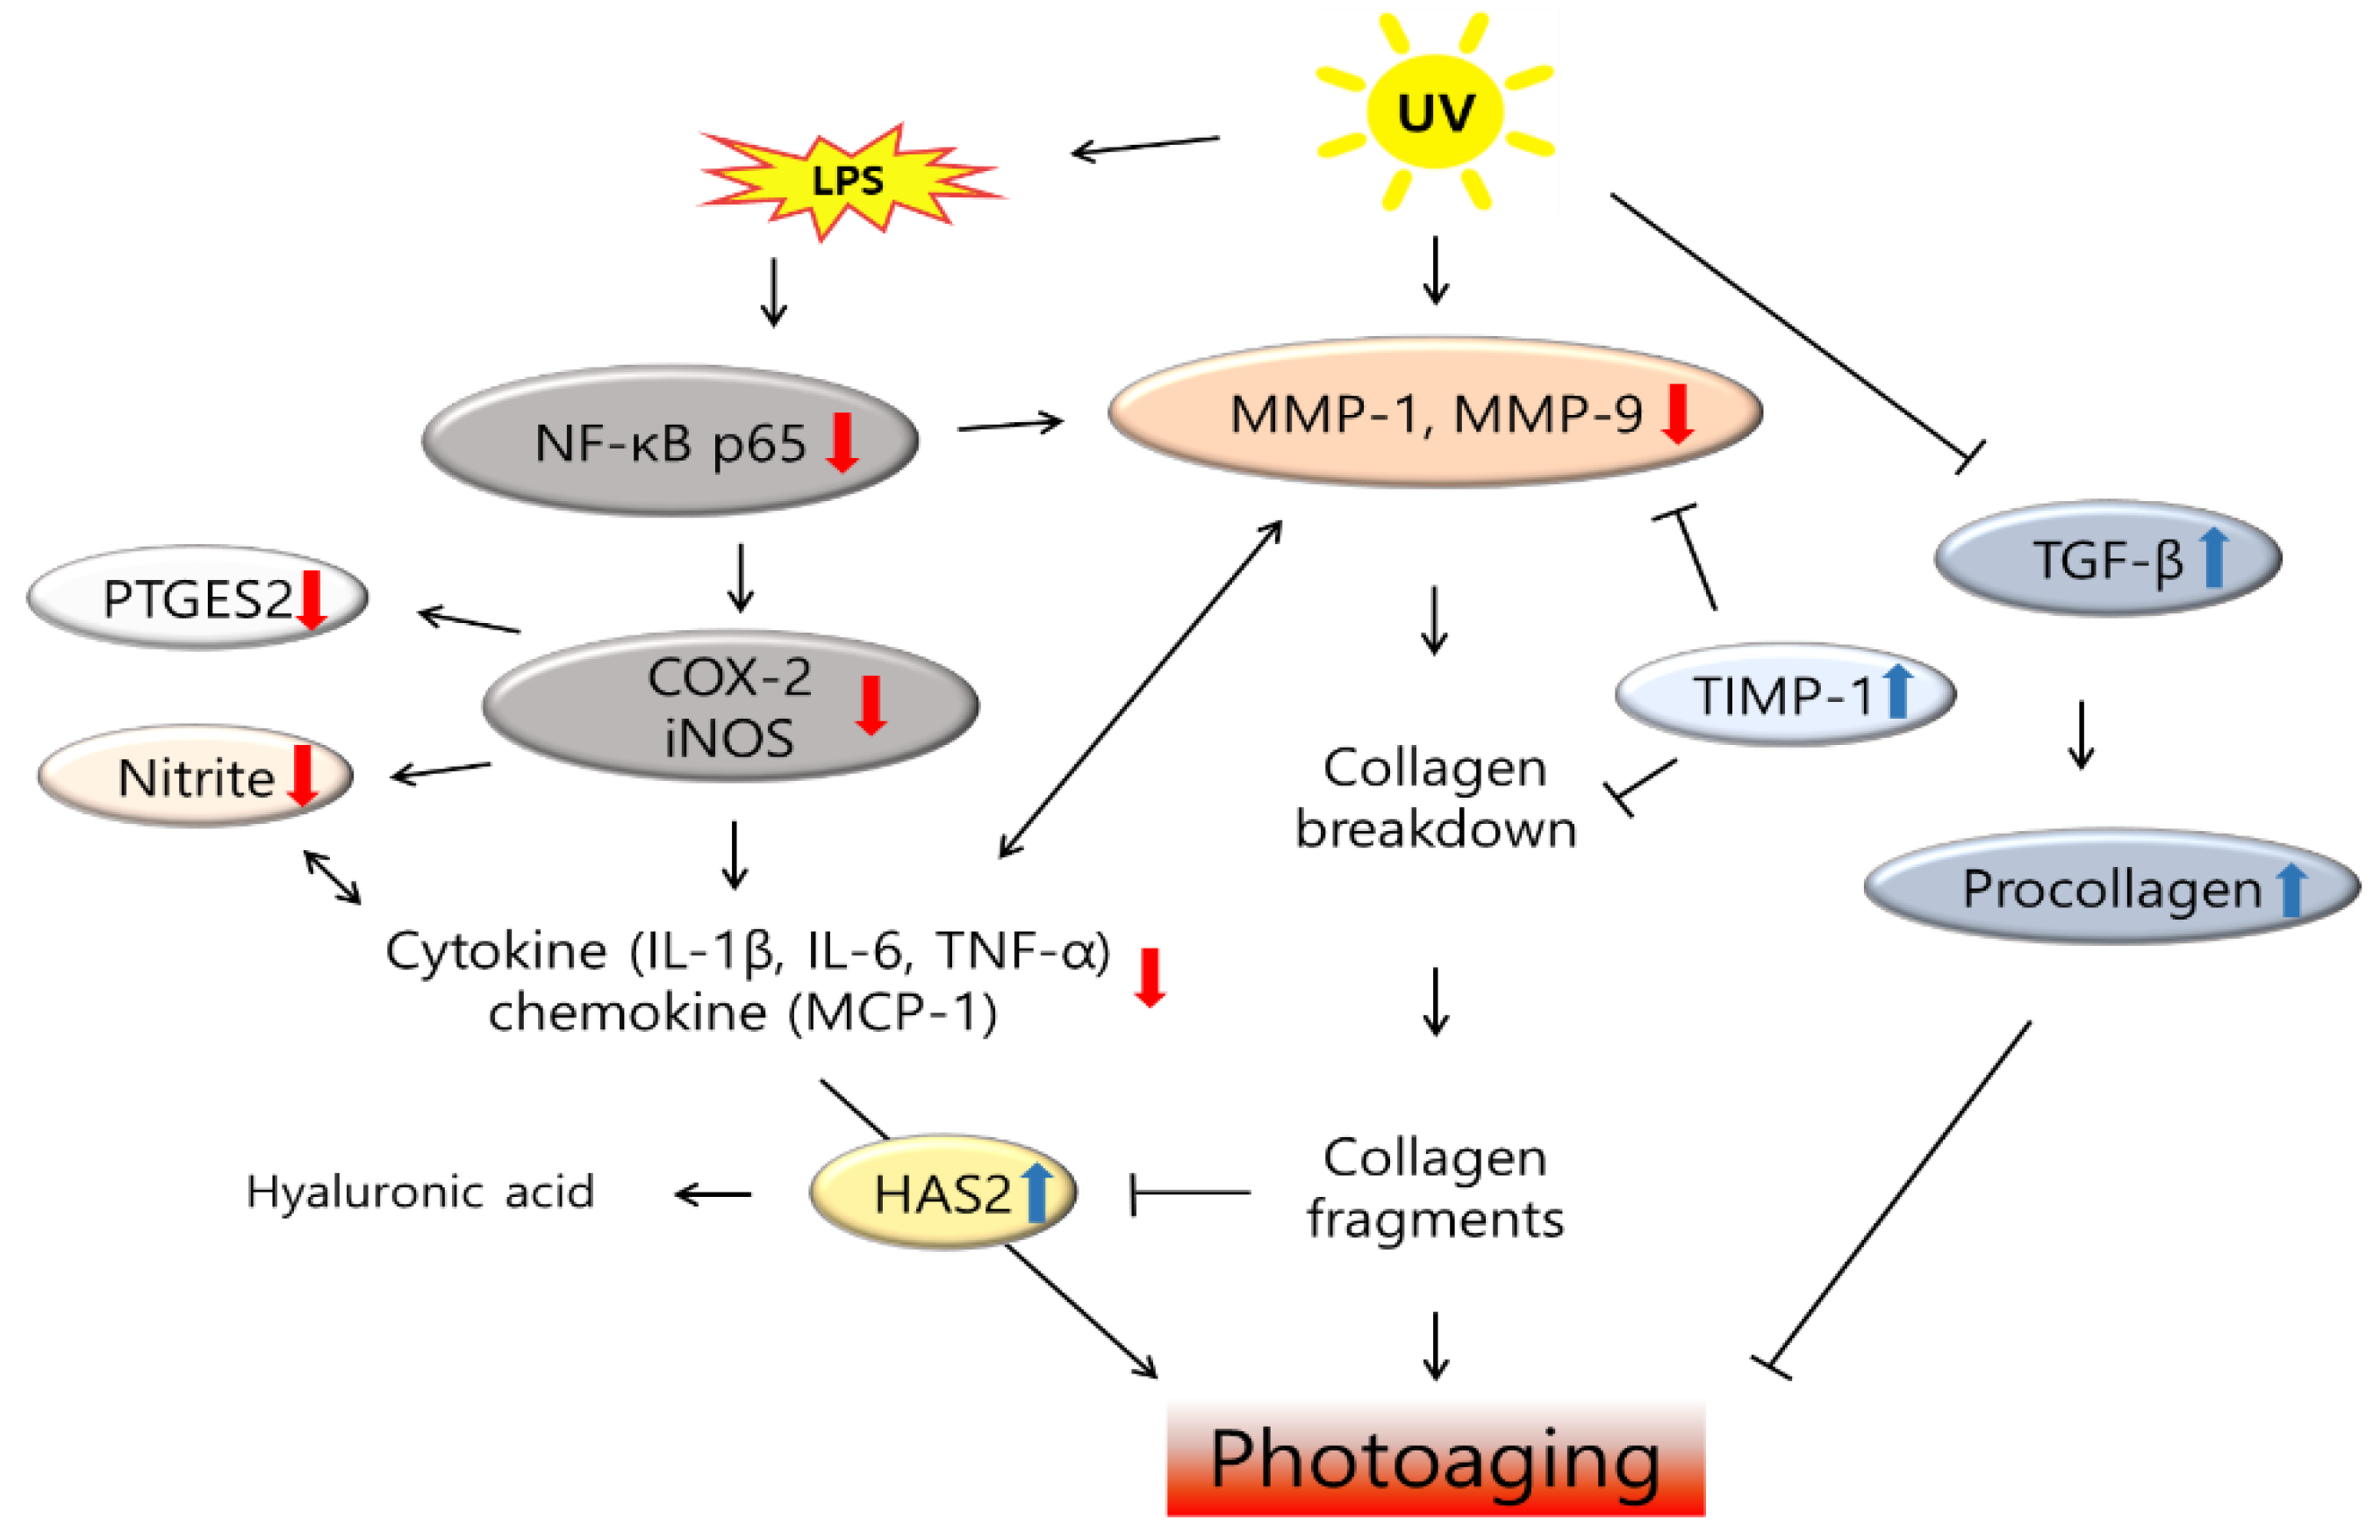
Many types of immune cells including macrophages, exists within skin tissue. Homeostasis of the skin tissue is maintained by the interactions between macrophages and fibroblast cells. Thus, it is crucial to maintain the activity levels of the immune associated cells and fibroblast cells. NF-kB is activated by external stimulants that includes UVB or LPS, which can lead to inflammation in skin or potentially severe damage. In this study, quercitrin has shown anti-inflammatory effect by reducing the production of inflammatory markers of IL-1β, IL-6, TNF-α, and MCP-1. Our results showed that quercitrin has both prevention effect on skin damage and anti-inflammation effect which indicates that it can be used to maintain the homeostasis of skin tissue (Figure 7).

5. Conclusions

In conclusion, our study showed that quercitrin from Green Ball apple significantly reduce the markers of skin damage by UVB-irradiation and inflammatory activity markers.
The production of MMP-1, MMP-9, and TIMP-1 proteins along with TGFB1, COL1A2, and HAS2 gene expression in CCD-986sk cells were regulated. Furthermore, quercitrin reduced the expression levels of of NF-κB p-65, iNOS, and COX-2 in Raw cells and showed anti-inflammatory effect. Therefore, our findings suggest a high potential of quercitrin for the usage on various health beneficial products including cosmetics.

Supplementary Materials

The following supporting information can be downloaded at the website of this paper posted on Preprints.org. Table S 1.

Author Contributions

Performed experiments, analysed data, E.H.L., designed experiments, analysed data and wrote the paper, J.H.C.; designed experiments and wrote the paper, I.K.K.; All authors read and approved the final manuscript.

Funding

This Research was supported by Kyungpook National University Research Fund, 2023.

Institutional Review Board Statement

Not applicable.

Informed Consent Statement

Not applicable.

Data Availability Statement

All the data used in this study are included in this article.

Conflicts of Interest

The authors declare no conflict of interest.

References

  1. Aguirre, L.; Portillo, M.P.; Hijona, E.; Bujanda, L. Effects of resveratrol and other polyphenols in hepatic steatosis. World J. Gastroenterol. 2014, 20, 7366–7380. [Google Scholar] [CrossRef] [PubMed]
  2. Andoh, T.; Nagasawa, T.; Satoh, M.; Kuraishi, Y. Substance P induction of itch associated response mediated by cutaneous NK1 tachykinin receptors in mice. J. Pharmacol. Exp. Ther. 1998, 286, 1140–1145. [Google Scholar] [PubMed]
  3. Bosch, R.; Philips, N.; Suarez-Perez, J.A.; Juarranz, A.; Devmurari, A.; Chalensouk-Khaosaat, J.; Gonzalez, S. Mechanisms of photoaging and cutaneous photocarcinogenesis, and photoprotective strategies with phytochemicals. Antioxidants 2015, 4, 248–268. [Google Scholar] [CrossRef]
  4. Carmichael, J.; DeGraff, W.G.; Gazdar, A.F.; Minna, J.D.; Mitchell, J.B. Evaluation of a tetrazolium-based semiautomated colorimetric assay: assessment of chemosensitivity testing. Cancer Res. 1987, 47, 936–942. [Google Scholar]
  5. D’Orazio, J.; Jarrett, S.; Amaro-Ortiz, A.; Scott, T. UV radiation and the skin. Int. J. Mol. Sci. 2013, 14, 12222–12248. [Google Scholar] [CrossRef] [PubMed]
  6. Fisher, G.J.; Kang, S.; Varani, J.; Bata-Csorgo, Z.; Wan, Y.; Datta, S.; Voorhees, J.J. Mechanisms of photoaging and chronological skin aging. Arch. Dermatol. 2002, 138, 1462–1470. [Google Scholar] [CrossRef]
  7. Forslind, B. A domain mosaic model of the skin barrier. Acta Derm. Venereol. 1994, 74, 1–6. [Google Scholar] [CrossRef]
  8. Hosoi, J.; Abe, E.; Suda, T.; Kuroki, T. Regulation of melanin synthesis of B16 mouse melanoma cell by 1a,25-dihydroxyvitamin D3 and retinoic acid. Cancer Res. 1985, 45, 1474–1478. [Google Scholar]
  9. Ikoma, A.; Steinhoff, M.; Stander, S.; Yosipovitch, G.; Schmelz, M. The neurobiology of itch. Nat. Rev. Neurosci. 2006, 7, 535–547. [Google Scholar] [CrossRef]
  10. Kageyama, H.; Waditee-Sirisattha, R. Antioxidative, anti-inflammatory, and anti-aging properties of mycosporine-like amino acids: Molecular and Cellular Mechanisms in the Protection of Skin-aging. Mar. Drugs. 2019, 17, 222. [Google Scholar] [CrossRef]
  11. Kim, J.; Kim, M.B.; Yun, J.G.; Hwang, J.K. Protective effects of standardized Siegesbeckia glabrescens extract and its active compound kirenol against UVB-induced photoaging through inhibition of MAPK/NF-κB pathways. J. Microbiol. Biotechnol. 2017, 27, 242–250. [Google Scholar] [CrossRef] [PubMed]
  12. Kim, J.H.; Kim, Y.M.; Ahn, K.M. Effect of the indoor environment on atopic dermatitis in children. Allergy Asthma Respir. Dis. 2020, 8, 175–183. [Google Scholar] [CrossRef]
  13. Kris-Etherton, P.M.; Hecker, K.D.; Bonanome, A.; Coval, S.M.; Binkoski, A.E.; Hilpert, K.F.; Griel, A.E.; Etherton, T.D. Bioactive compounds in foods: their role in the prevention of cardiovascular disease and cancer. Am. J. Med. 2002, 113, 71–88. [Google Scholar] [CrossRef] [PubMed]
  14. Lee, E.H.; Cho, E.B.; Kim, B.O.; Jung, H.Y.; Lee, S.Y.; Yoo, J.G.; Kang, I.K.; Cho, Y.J. Functional properties of newly-bred ‘Summer King’ apples. Hortic. Sci. Technol. 2020, 38, 405–417. [Google Scholar] [CrossRef]
  15. Lee, E.H.; Cho, J.H.; Kim, D.H.; Hong, S.H.; Kim, N.H.; Park, M.J.; Hong, E.J.; Cho, Y.J. Anti-inflammatory activity of manassantin A from ultra-fine ground Saururus chinensis in lipopolysaccharide-stimulated RAW 264.7 cells. Appl. Biol. Chem. 2017, 60, 63–71. [Google Scholar] [CrossRef]
  16. Lee, J.C.; Lee, E.; Oh, H.; Yoon, H.S.; Ha, T.K.; Hong, E.H.; Lee, Y.C. Effects of Fructus foeniculi extract on recovering liver function. Kor. J. Herbol. 2007, 22, 213–218. [Google Scholar] [CrossRef]
  17. Lee, Y.R.; Noh, E.M.; Han, J.H.; Kim, J.M.; Hwang, J.K.; Hwang, B.M.; Chung, E.Y.; Kim, B.S.; Lee, S.H.; Lee, S.J. Brazilin inhibits UVB-induced MMP-1/3 expressions and secretions by suppressing the NF-κB pathway in human dermal fibroblasts. Eur. J. Pharmacol. 2012, 674, 80–86. [Google Scholar] [CrossRef]
  18. Murakami, A.; Ashida, H.; Terao, J. Multitargeted cancer prevention by quercetin. Cancer Lett. 2008, 269, 315–325. [Google Scholar] [CrossRef]
  19. Puglia, C.; Offerta, A.; Saija, A.; Trombetta, D.; Venera, C. Protective effect of red orange extract supplementation against UV-induced skin damages: Photoaging and solar lentigines. J. Cosmet. Dermatol. 2014, 13, 151–157. [Google Scholar] [CrossRef]
  20. Quan, T.; Shao, Y.; He, T.; Voorhees, J.J.; Fisher, G.J. Reduced expression of connective tissue growth factor (CTGF/CCN2) mediates collagen loss in chronologically aged human skin. J. Investig. Dermatol. 2010, 130, 415–424. [Google Scholar] [CrossRef]
  21. Rittie, L.; Fisher, G.J. UV-light-induced signal cascades and skin aging. Ageing Res. Rev. 2002, 1, 705–720. [Google Scholar] [CrossRef] [PubMed]
  22. Saito, Y.; Shiga, A.; Yoshida, Y.; Furuhashi, T.; Fugita, Y.; Niki, E. Effects of novel gaseous antioxidative system containing a rosemary extract on the oxidation induced by nitrogen dioxide and ultraviolet radiation. Biosci. Biotechnol. Biochem. 2004, 68, 781–786. [Google Scholar] [CrossRef] [PubMed]
  23. Schuch, A.P.; Moreno, N.C.; Schuch, N.J.; Menck, C.F.; Garcia, C.C. Sunlight damage to cellular DNA: Focus on oxidatively generated lesions. Free Radic. Biol. Med. 2017, 107, 110–124. [Google Scholar] [CrossRef] [PubMed]
  24. Sun, A.Y.; Simonyi, A.; Sun, G.Y. The “French Paradox” and beyond: neuroprotective effects of polyphenols. Free Radic. Biol. Med. 2002, 32, 314–318. [Google Scholar] [CrossRef] [PubMed]
  25. Tsareva, S.A.; Moriggl, R.; Corvinus, F.M.; Wiederanders, B.; Schutz, A.; Kovacic, B.; Friedrich, K. Signal transducer and activator of transcription 3 activation promotes invasive growth of colon carcinomas through matrix metalloproteinase induction. Neoplasia 2007, 9, 279–291. [Google Scholar] [CrossRef]
  26. Willenbrock, F.; Murphy, G. Structure-function relationships in the tissue inhibitors of metalloproteinases. Am. J. Respir. Crit. Care Med. 1994, 150, S165–S170. [Google Scholar] [CrossRef]
  27. Yun, H.J.; Lim, S.Y.; Hur, J.M.; Jeong, J.W.; Yang, S.H.; Kim, D.H. Changes of functional compounds in, and texture characteristics of, apples, during post-irradiation storage at different temperatures. Korean J. Food Preserv. 2007, 14, 239–246. [Google Scholar]
  28. Zhu, J.X.; Wang, Y.; Kong, L.D.; Yang, C.; Zhang, X. Effects of Biota orientalis extract and its flavonoid constitutions, quercetin and rutin on serum uric acid levels on oxonate-induced mice and xanthine dehydrogenase and xanthine oxidase activities in mouse liver. J. Ethnopharmacol. 2004, 93, 133–140. [Google Scholar] [CrossRef]
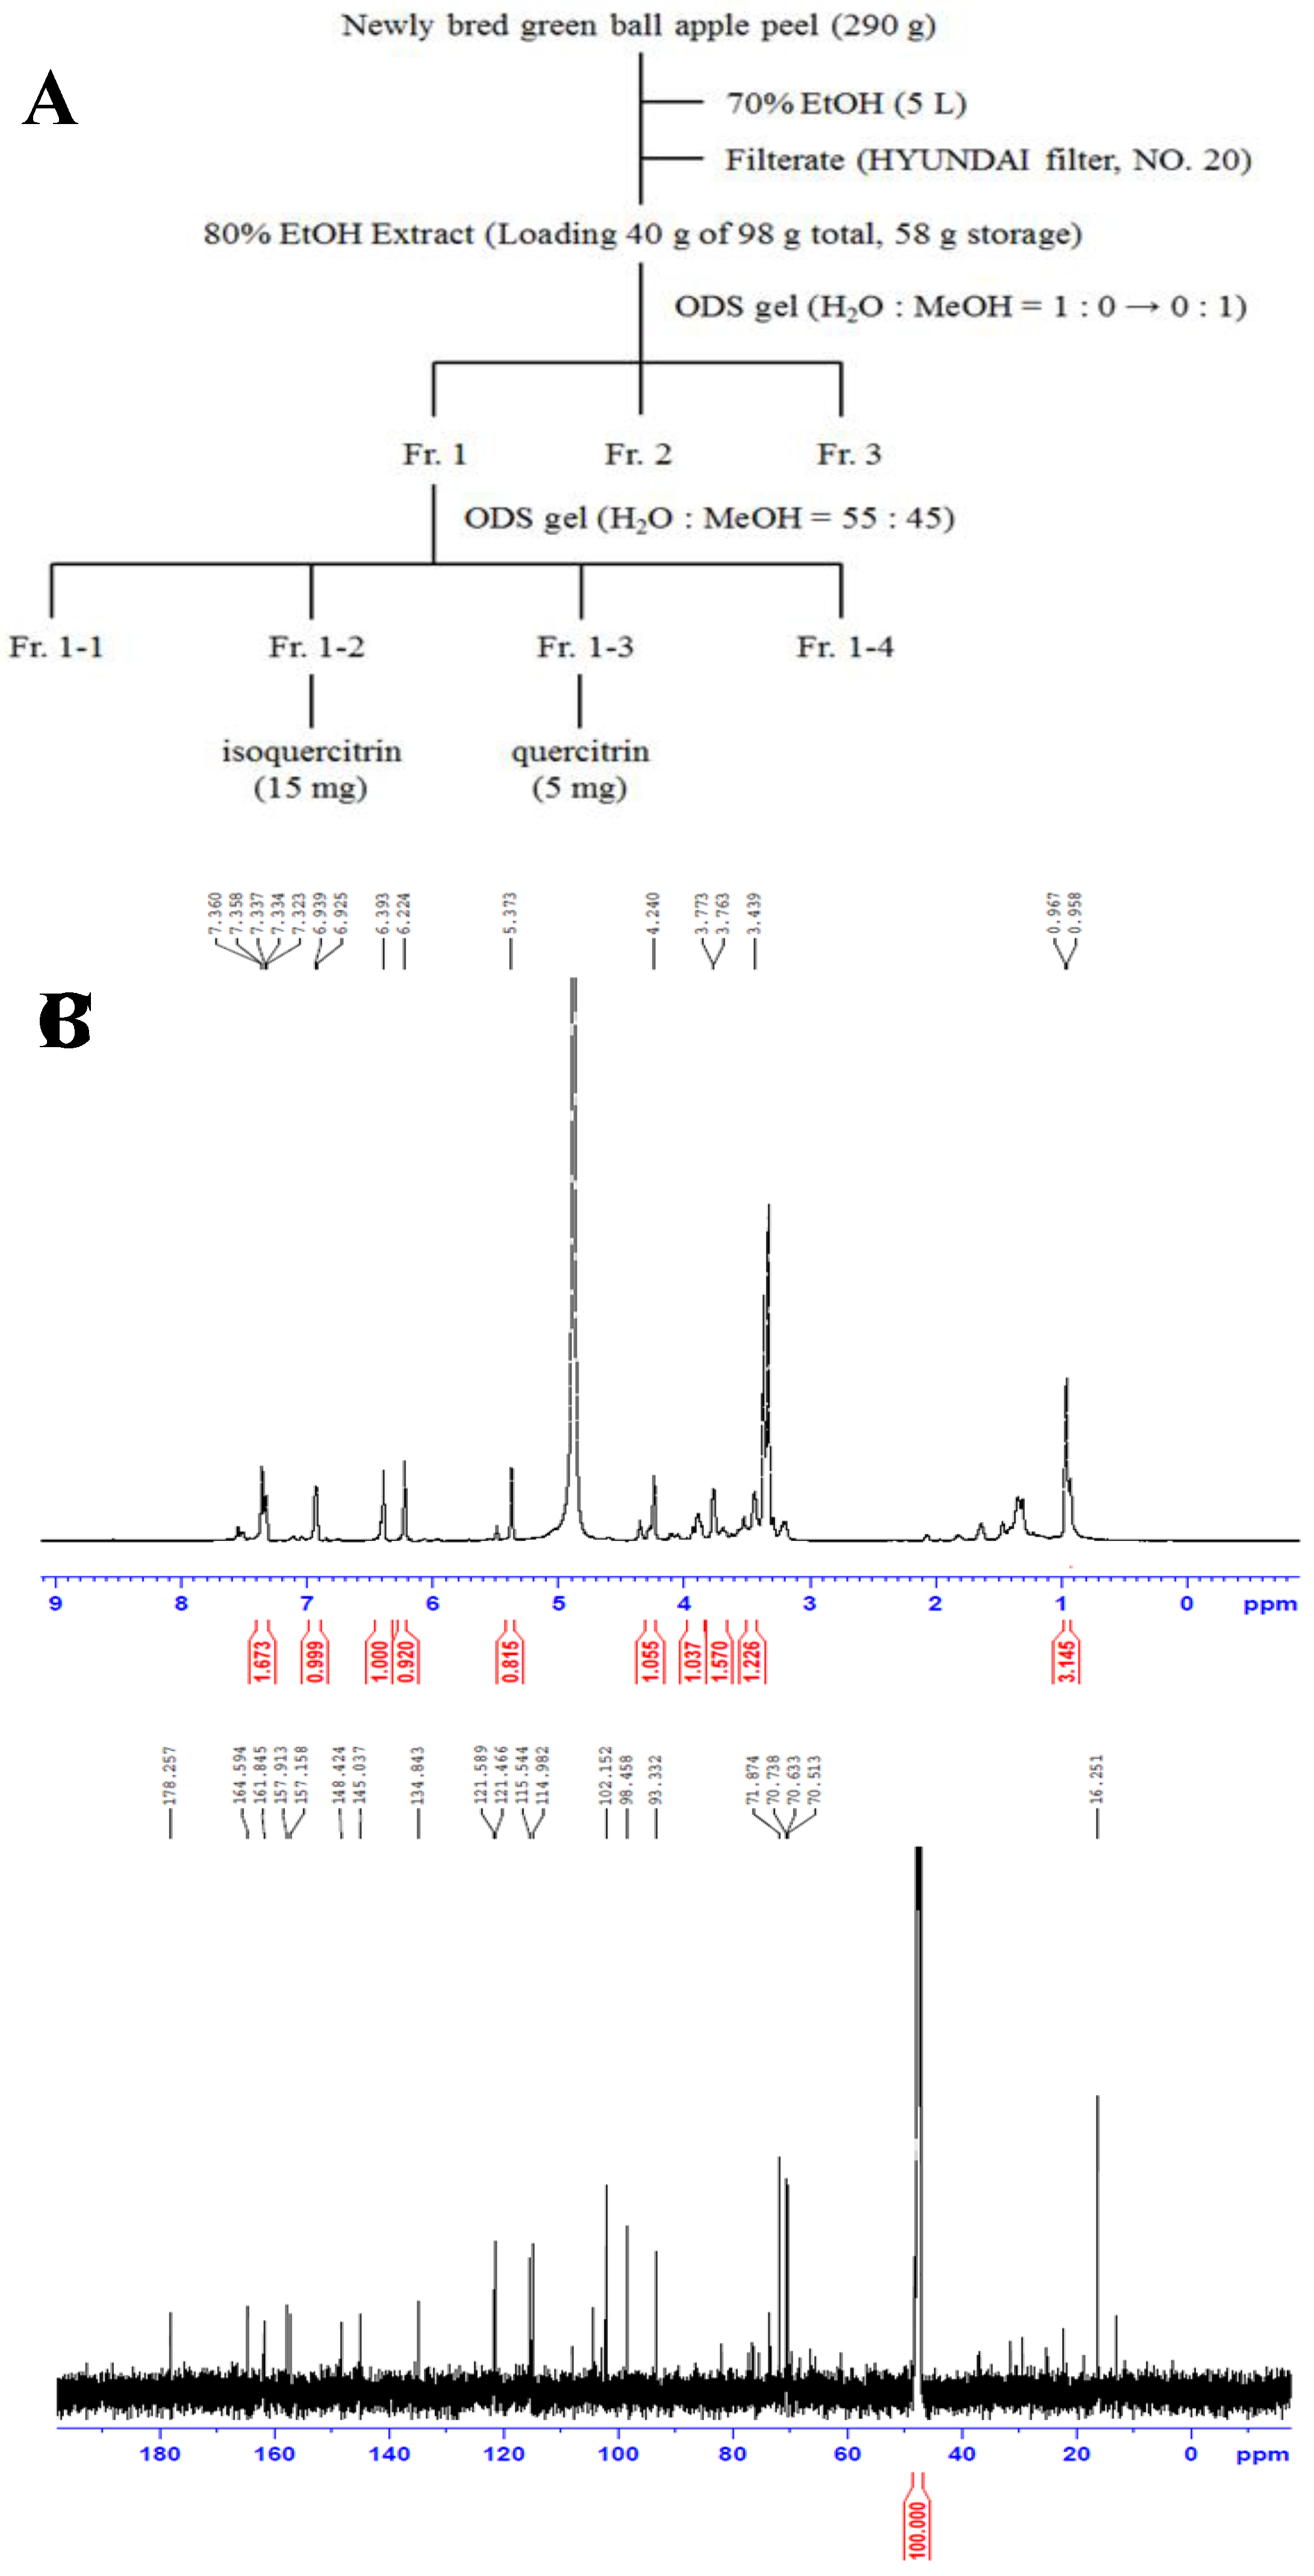
Figure 1. Flow chart of separation and purification of quercitrin isolated from ‘Green Ball’ apples peel (A), 1H-NMR spectrum (600 MHz) and chemical structure of quercitrin (B), 13C-NMR spectrum (150 MHz) of quercitrin (C).
Preprints 121944 g001
Figure 2. The cell cytotoxicity (A), cell numbers (B, C) of quercitrin (5-100 μM) in CCD-986sk cells and Raw 264.7 cells. (A) The cell cytotoxicity was assessed using an MTT reduction assay and the results are expressed as the percentage of surviving cells compared with that in the negative control group (no addition of quercitrin). (B, C) Cell numbers were counted in the cell culture plates after incubation with quercitrin for 0, 12, and 24 h or 0, 24, and 48 h. Normal groups were obtained in the absence of sample. Data represent means ± SD of three independent experiments (n=3). The values are mean ± SD of three independent experiments. #P<0.05 compared with the negative control group, **P<0.01 compared with the negative control group.
Preprints 121944 g002
Figure 3. Effect of quercitrin on MMP-1, MMP-9, and TIMP-1 protein expression (A), protein expression rate (B), MMP-1, MMP-9, and TIMP-1 mRNA expression (C) in CCD-986sk cells with UVB-irradiated. CCD-986sk cells were treated with UVB (30 mJ/cm2) and, various concentrations of quercitrin (5, 10, and 25 μM), were added and the cells were further incubated for 48 h. Normal groups were obtained in the absence of UVB. Negative control group treated only UVB. The values are mean ± SD of three independent experiments. #P<0.05 compared with the negative control group, **P<0.01 compared with the positive control group.
Preprints 121944 g003
Figure 4. Effect of quercitrin on COL1A2 protein expression (A), protein expression rate (B), TGFB1, COL1A2, and HAS2 mRNA expression (C) in CCD-986sk cells with UVB-irradiated. CCD-986sk cells were treated with UVB (30 mJ/cm2) and, various concentrations of quercitrin (5, 10, and 25 μM), were added and the cells were further incubated for 48 h. Normal groups were obtained in the absence of UVB. Negative control group treated only UVB. The values are mean ± SD of three independent experiments. #P<0.05 compared with the negative control group, **P<0.01 compared with the positive control group.
Preprints 121944 g004
Figure 5. Effect of quercitrin on p-p65, iNOS, and COX-2 protein expression (A), protein expression rate (B), PTGES2 mRNA expression (C), and nitrite production (D) in Raw 264.7 cells with LPS-induced. Raw 264.7 cells were treated with LPS (1 µg/mL) and, various concentrations of quercitrin (5, 10, 25, and 50 μM), were added and the cells were further incubated for 24 h. Normal groups were obtained in the absence of LPS. Negative control group treated only LPS. The values are mean ± SD of three independent experiments. #P<0.05 compared with the negative control group, **P<0.01 compared with the positive control group.
Preprints 121944 g005
Figure 6. Effect of quercitrin on IL-1β, IL-6, TNF-α, and MCP-1 mRNA expression in Raw 264.7 cells with LPS-induced. Raw 264.7 cells were treated with LPS (1 µg/mL) and, various concentrations of quercitrin (10, 25, and 50 μM), were added and the cells were further incubated for 24 h. Normal groups were obtained in the absence of LPS. Negative control group treated only LPS. The values are mean ± SD of three independent experiments. #P<0.05 compared with the negative control group, **P<0.01 compared with the positive control group.
Preprints 121944 g006
Figure 7. Summary of the activity of quercitrin on photoaging.
Preprints 121944 g007
Disclaimer/Publisher’s Note: The statements, opinions and data contained in all publications are solely those of the individual author(s) and contributor(s) and not of MDPI and/or the editor(s). MDPI and/or the editor(s) disclaim responsibility for any injury to people or property resulting from any ideas, methods, instructions or products referred to in the content.
Copyright: This open access article is published under a Creative Commons CC BY 4.0 license, which permit the free download, distribution, and reuse, provided that the author and preprint are cited in any reuse.
Alerts
Prerpints.org logo

Preprints.org is a free preprint server supported by MDPI in Basel, Switzerland.

Subscribe

© 2025 MDPI (Basel, Switzerland) unless otherwise stated