1. Introduction
Respiratory tract disorders such as asthma constitute a group of persistent inflammatory conditions characterized by airway obstruction of the respiratory tract, heightened bronchial responsiveness, and recurrent episodes of dyspnea, coughing, wheezing, and chest tightness [
1,
2,
3,
4,
5]. This group encompasses bronchial asthma, chronic obstructive pulmonary disease (COPD), and other related conditions.
The underlying causes of these illnesses remain incompletely understood, although it is believed that they may be linked to a genetic predisposition, allergen exposure, viral and bacterial infections, tobacco smoke, and other irritants. Factors that increase the risk include having family members with asthma or other allergies, smoking, environmental pollution, and specific occupational exposures [
6,
7].
Asthma is a persistent inflammatory condition of the respiratory system, characterized by a wide range of symptoms, such as wheezing, coughing, dyspnea, and chest tightness [
7,
8,
9,
10,
11,
12,
13]. At present, there is a variety of therapeutic options available, including inhaled corticosteroids, β-agonists, leukotriene inhibitors, and theophylline, among others. Nevertheless, approximately 10% of individuals with severe asthma fail to achieve satisfactory symptom control, necessitating the exploration of novel strategies and medications.
Macrophages, immune cells responsible for eliminating bacteria and producing biologically active substances that regulate inflammatory responses, play a critical role in the pathogenesis of inflammation in asthma and other diseases of the respiratory diseases [
8,
14,
15]. These cells can be classified into two main types: M1 macrophages and M2, macrophages. M2 macrophages, in turn, can be divided into subtypes M2a, M2b, M2c etc [
10,
16,
17].
So that, each patient's macrophages have a unique "fingerprint," their specific phenotype, which is not yet fully understood. However, analysis of this fingerprint could provide valuable insights into the polarization and activation status of macrophages, allowing for more accurate diagnosis of respiratory tract diseases and potentially targeting key points in the immune system for intervention.
This paper presents a novel approach to the diagnosis of respiratory tract disorders based on a multifaceted analysis of bronchoalveolar lavage (BAL) fluid. The concept revolves around the examination and categorization of macrophages within BAL that exhibit the expression of mannose receptors, specifically CD206 [
17,
18,
19,
20,
21,
22]. This methodology can be further developed to encompass the analysis of additional macrophage receptors, thereby enhancing the accuracy of diagnosis and facilitating the formulation of effective treatment strategies for respiratory illnesses. Bronchoalveolar lavage, a procedure involving the aspiration of fluid from the bronchi and alveoli of the lungs, is a diagnostic tool that provides valuable insights into respiratory health [
7,
23,
24,
25,
26,
27]. A small volume of sterile saline solution is introduced into the airway, followed by its extraction for analysis. The process is meticulously monitored under the guidance of a bronchoscope, which allows the doctor to visually monitor the process.
In the realm of medical diagnostics, BAL serves several critical purposes [
28,
29,
30,
31,
32,
33,
34]:
Detection of infectious agents
Assessment of immunological disorders
Diagnosis of lung tumors
Identification of idiopathic pulmonary fibrosis
Assessment of treatment efficacy. BAL can be employed to evaluate the effectiveness of treatments for lung conditions such as asthma and chronic obstructive pulmonary disease (COPD).
The BAL is particularly useful in the diagnosis of interstitial lung diseases, which affect the interstitial tissue of the lungs. By examining the samples obtained through the BAL, characteristic alterations in cell populations and protein-receptors profiles can be identified, providing valuable insights into the nature of these conditions. Through the analysis of the bronchoalveolar lavage fluid BALF samples, the specific causative agents of infection can be determined, along with their susceptibility to antibiotics. Additionally, the BAL technique can be employed for diagnosing other pulmonary conditions such as pneumonia, tuberculosis, and pulmonary emphysema.
Currently an approach to the detection and monitoring of respiratory disorders based mainly on the of metabolomic analysis using gas chromatography–mass spectrometry (GC-MS), where metabolic changes in various lung diseases, including acute pulmonary toxicity, inflammation, asthma, bronchitis, fibrosis were studied [
35]. The application of NMR spectroscopy in the investigation of BAL is also a subject of active research [
36,
37,
38].
In this study a novel approach to diagnosing respiratory tract illnesses is suggested, with the potential to enhance treatment efficiency. This methodology is predicated on a comprehensive analysis of BALF, encompassing the examination and categorization of macrophages subpopulations based on the expression levels of analytically valuable receptors, such as CD206 mannose receptor of macrophage [
11,
15,
20,
39], as well as CD68 [
7,
40,
41], CD163 [
6,
8,
17,
42] and CD301 receptors [
11,
41]. The research is aimed at developing a set of a number of ligands as specific infrared and fluorescent markers for fingerprint analysis of macrophage subpopulations in BALF for subsequent diagnostics.
Spectral approach for macrophage fingerprint analysis developed in this study has the potential to detect respiratory diseases at the early stages, facilitate more accurate diagnoses, and track the efficacy of treatment interventions.
2. Materials and Methods
2.1. Reagents
Polymers. Polyethyleneimine 1.8 kDa (PEI) was purchased from Sigma Aldrich (St. Louis, MI, USA). Activated PEG 5 kDa (N-succinimidyl ester of mono-methoxy poly(ethylene glycol)) was purchased from Shanghai Macklin Biochemical Technology Co., Ltd.
Carbohydrates. Mannan, α-D-mannose (Man), methyl α-D-mannoside (Me-Man), D-galactose, D-lactose were obtained from Sigma Aldrich (St. Louis, MI, USA). Mannotriose-di-(N-acetyl-D-glucosamine) (triMan-GlcNAc2) was obtained from Dayang Chem Co., Ltd. (Hangzhou, China).
Fluorophores. Fluorescein isothiocyanate (FITC) was purchased from Sigma Aldrich (St. Louis, MI, USA).
Chemicals. Carbonyldiimidazole (CDI) was obtained from GL Biochem Ltd. (Shanghai, China) via an intermediary Himprocess (Moscow, Russia). DMSO, NaBH3CN, NaOH, salts, acids and solvents were from Reakhim Production (Moscow, Russia).
2.2. The synthesis of IR markers based on PEG and three types of carbohydrate fragments
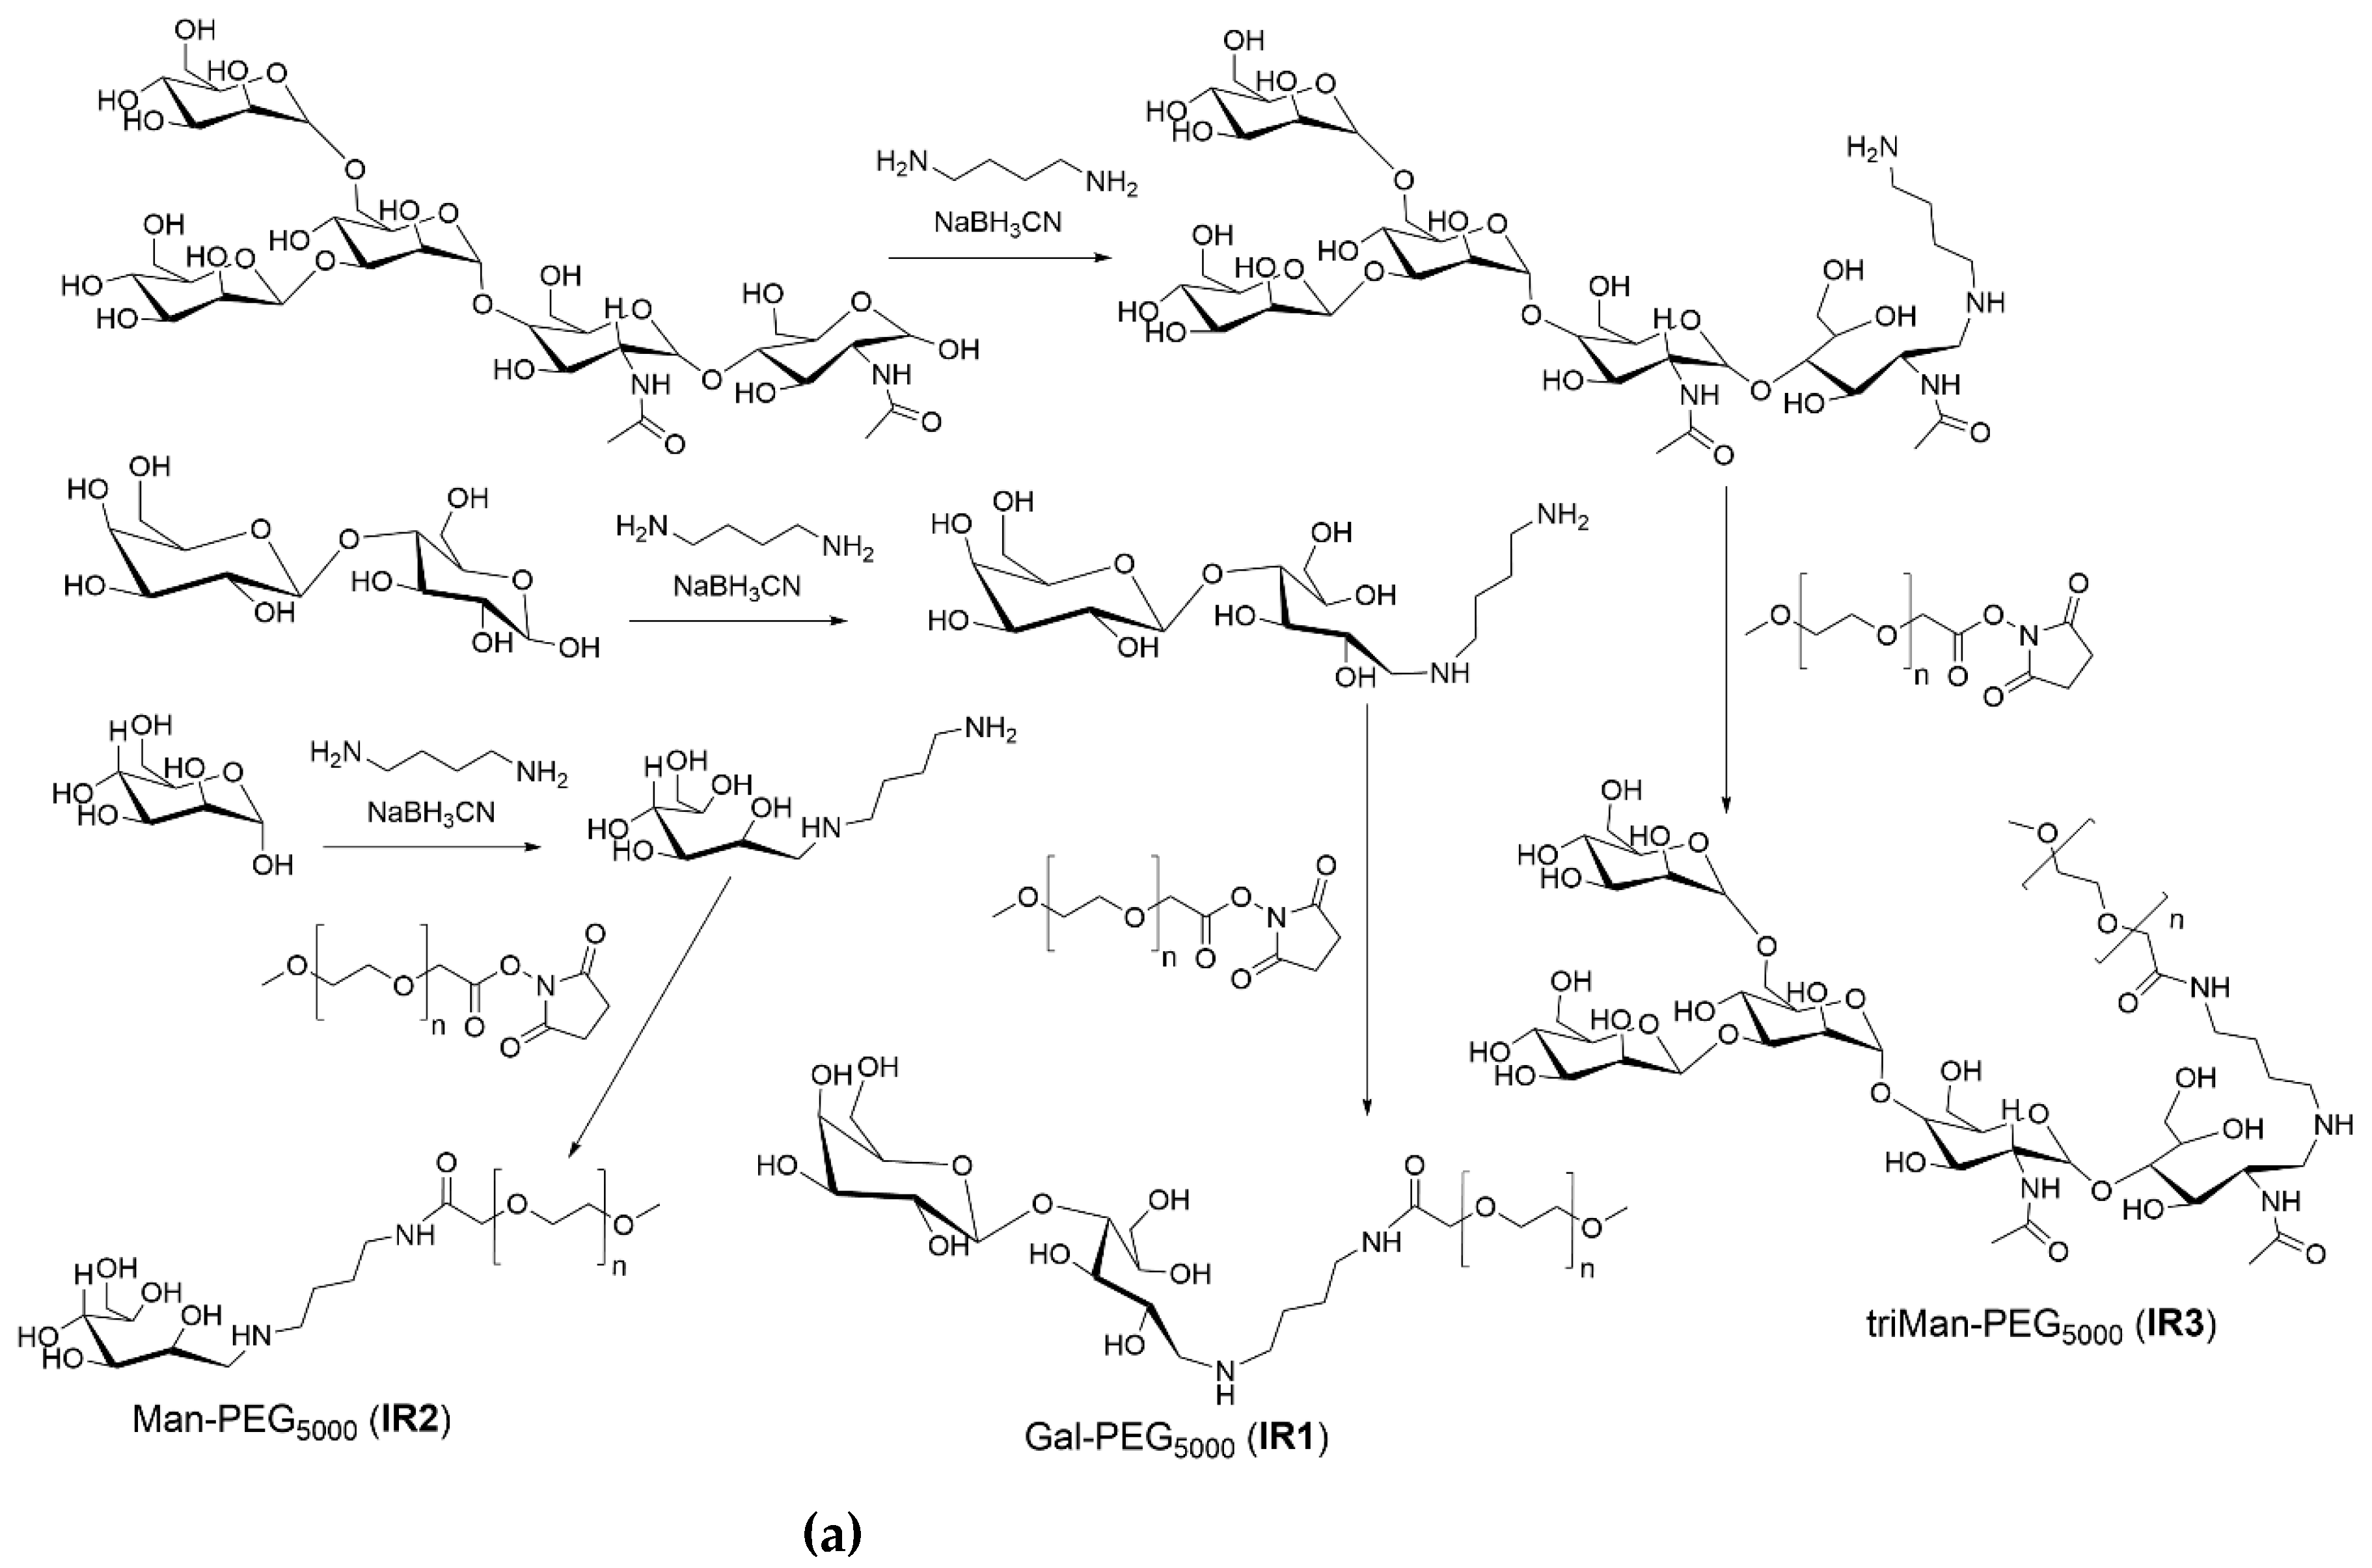
The synthesis scheme is presented in
Figure 1a. The samples of carbohydrates, namely mannose, galactose, and triMan-GlcNAc
2, weighing 10 mg each, were dissolved in 5 mL of 0.1 mM hydrochloric acid solution.
A mixture of linker putrescine linker and NaBH3CN in water, with a 20 percent molar excess of both substances relative to the reducing ends of the carbohydrates, was then added to each of the three samples. The mixtures were incubated at 50 °C for 12 hours. Prior to this, they underwent pretreatment through dialysis for two hours each, with a cut-off of 500 Da.
The samples were subjected to freeze-drying, followed by dissolution in a phosphate buffer solution with a pH of 7.4 and a molarity of 10 mM, resulting in a final concentration of 10 mg/mL in carbohydrate. Subsequently, an equimolar equivalent of activated polyethylene glycol 5 kDa (PEG) was added to the samples, gradually and drop-by-drop, while vigorously stirring. The mixture was then incubated at a temperature of 40 °C for a duration of 6 hours.
To purify the samples from low-molecular-weight compounds, dialysis against water was employed, conducted twice for 12 hours each, with a cut-off of 6–8 kDa. Finally, the samples were freeze-dried to complete the process.
2.3. The synthesis of fluorescent FITC-labeled markers incorporating five distinct types of carbohydrates
The synthesis scheme is presented in
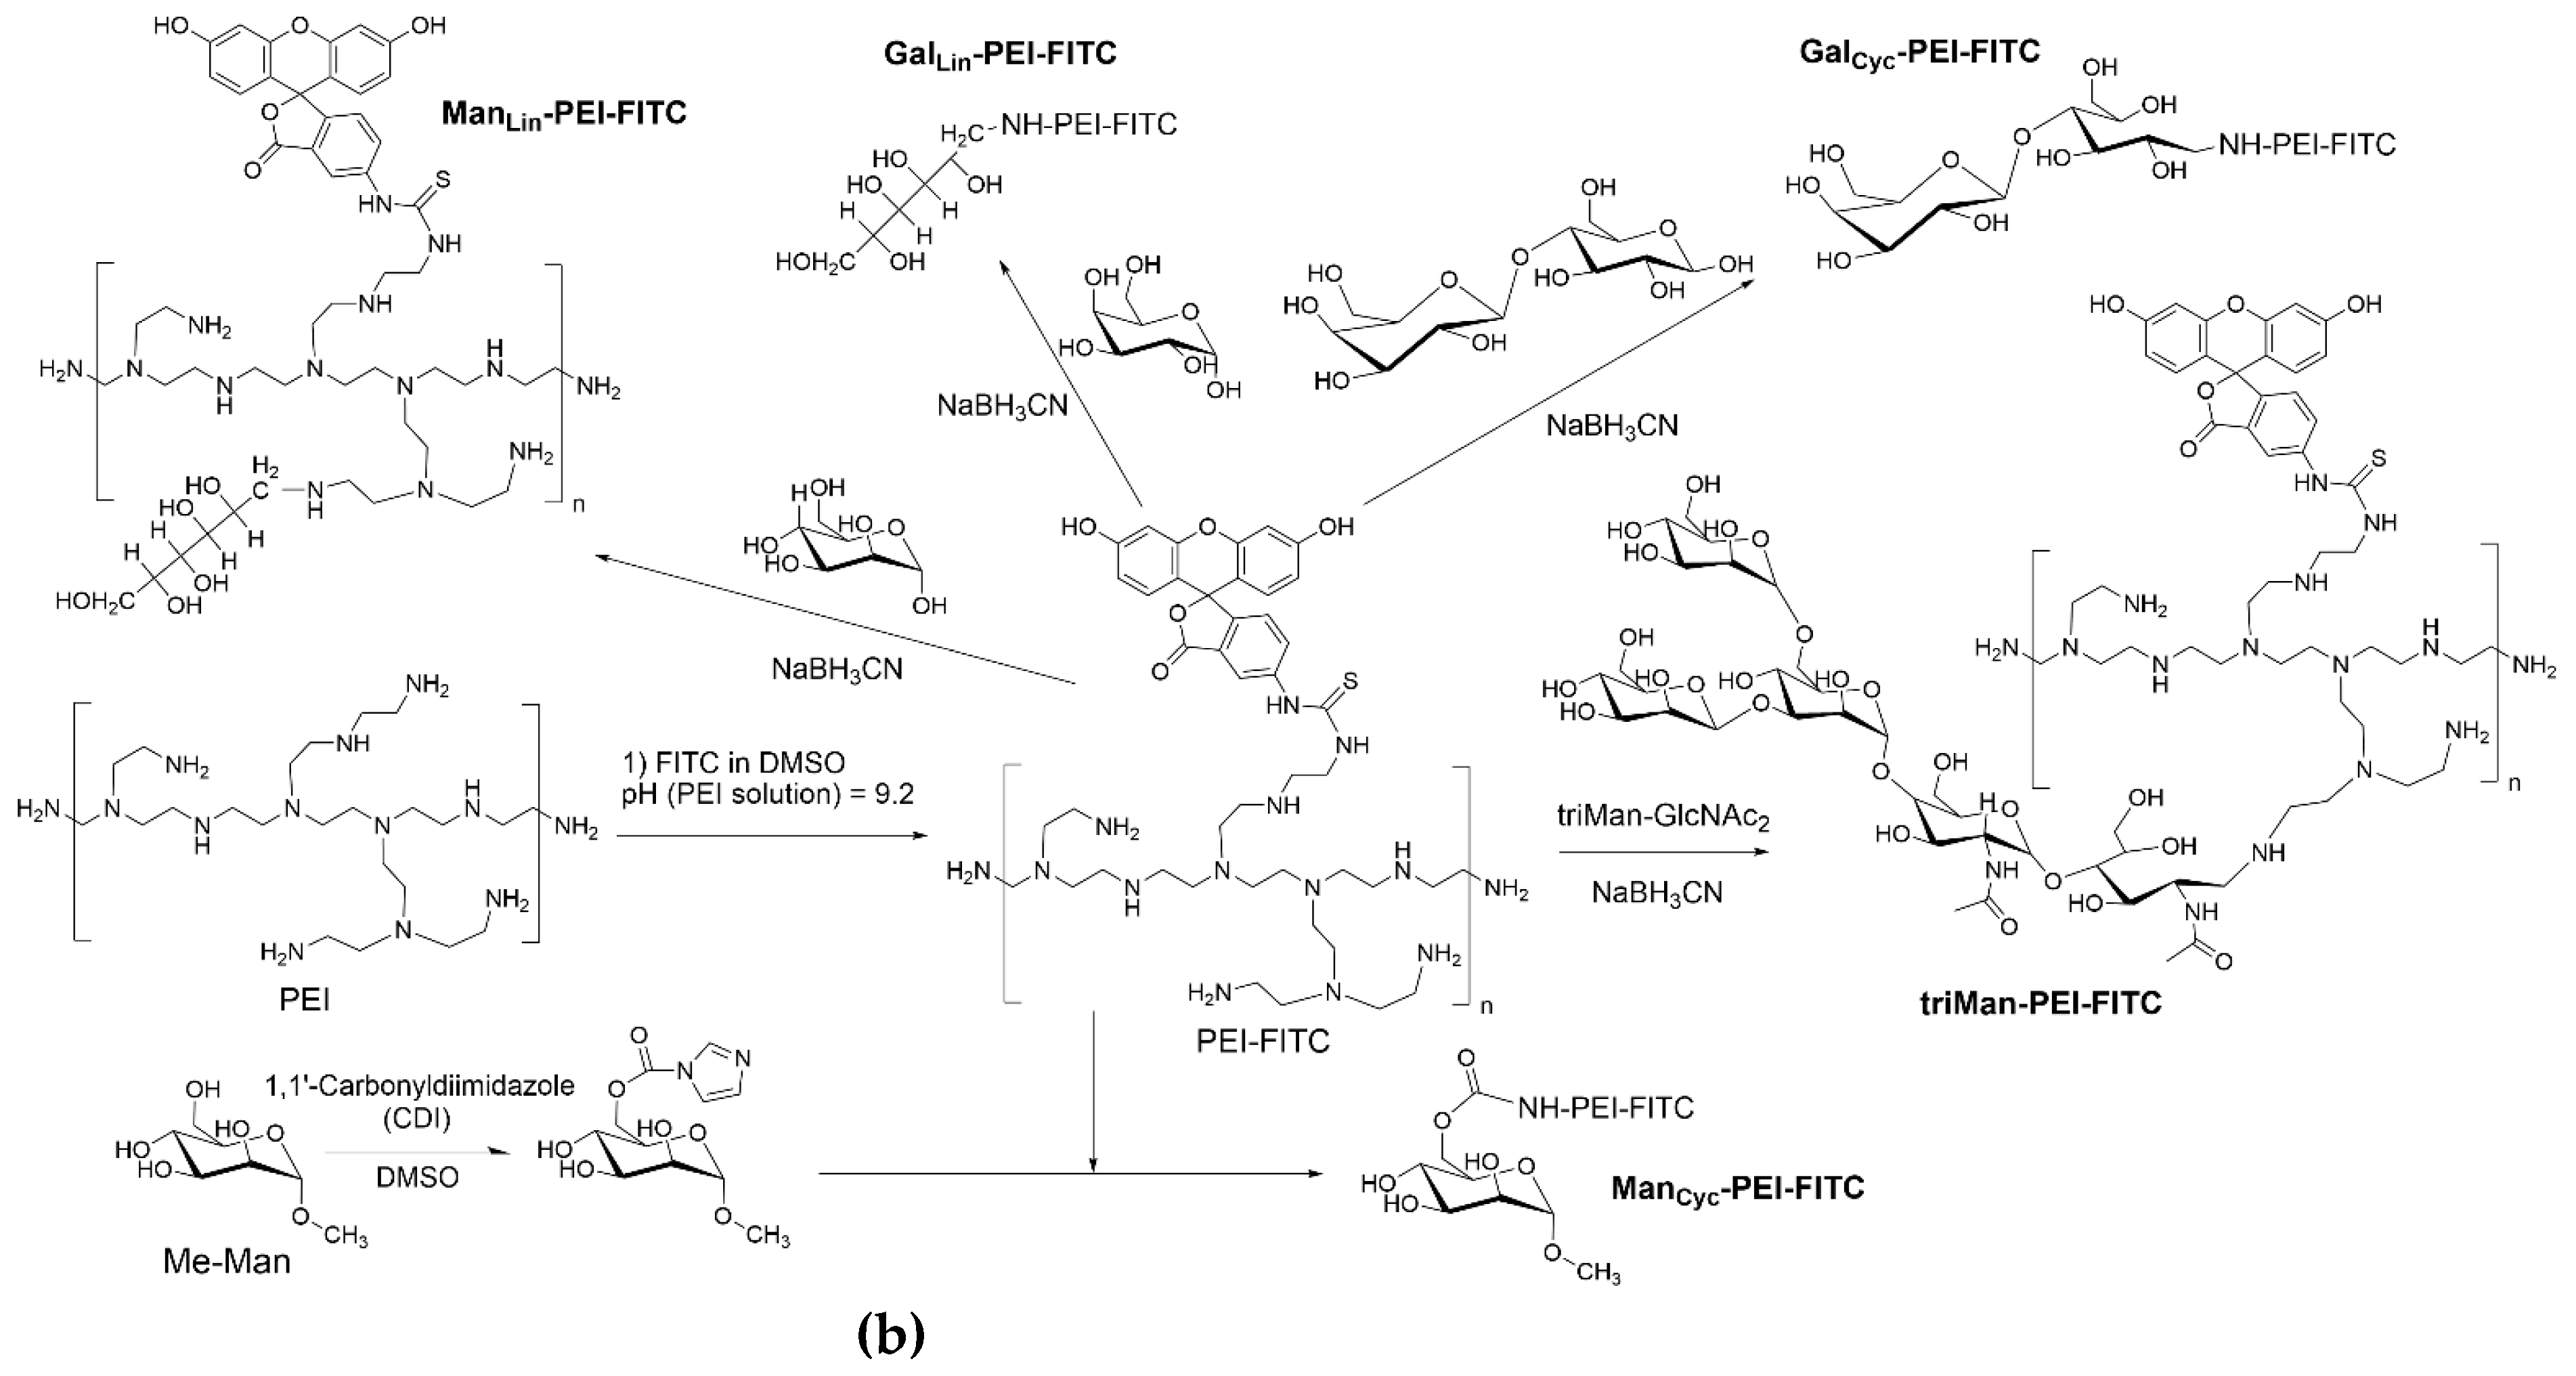
Figure 1b, which provides a comprehensive overview of the process.
Polyethyleneimine 1.8 kDa (PEI), dissolved in 0.01 M HCl to a concentration of 50 mg/mL. The pH of the solution was then brought to 9.2 by adding a solution of sodium hydroxide and borate buffer. The final concentration of PEI in the solution was 10 mg/mL.
A solution of fluorescein isothiocyanate (FITC) in DMSO at a concentration of 10 mg/mL was slowly added dropwise to the PEI solution until the same molar amount of PEI and FITC was achieved. Purification of PEI-FITC was performed using dialysis against water (6 hours, cut-off 3.5 kDa).
The purified PEI-FITC was then divided into five portions. Mannose, galactose, lactose, and triMan-GlcNAc2 were added to four portions in a 20-fold molar excess relative to the number of polymer chains in PEI. Sodium borohydride (NaBH3CN) was added to 4 samples in a 10 percent molar excess relative to reducing ends of carbon backbone. The pH of all reaction mixtures was adjusted to 5 and the samples were incubated at 50 °C for 12 hours.
In the case of methyl-α-mannoside (Me-Man), the initial activation of the 6-OH group of the saccharide involved the addition of a solution of carbonyldiimidazole in DMSO to the Me-Man solution in PBS, with a 1.5-fold molar excess of the former. The mixture was incubated at 50 °C for two hours. Subsequently, this solution was slowly added to the PEI-FITC solution, with continuous mixing. The pH was adjusted to 7.4 and the sample was incubated at 50 °C for 6 hours.
The purification of all preparations involved a two-step dialysis against water, with a cut-off of 3.5 kDa, for a total of 24 hours. All samples were freeze-dried for two days at –60 °C (Edwards 5, BOC Edwards, UK).
The additional purification of the samples was accomplished through the use of high-performance liquid chromatography (HPLC), employing gel filtration on the Knauer chromatography system, manufactured by Knauer in Berlin, Germany. A Diasfer-110-C18 column from BioChemMack in Moscow, Russia, with a particle size of 6 µm and dimensions of 4 x 150 mm, was employed. The eluant was a mixture of CH₃CN and H₂O in a 90:10 volume ratio. The elution rate was set to 0.8 milliliters per minute, and the temperature was maintained at 25 °C.
Due to the diverse range of conjugate sizes, fractions corresponding to a retention time deviation of ±0.5 minutes were chosen for the experiments. The degree of PEI modification was assessed through spectrophotometric titration of amino groups before and after the modification procedure using 2,4,6-trinitrobenzene sulfonic acid, a method primarily designed for detecting primary amino groups.
2.4. Characterization of synthesized FTIR and fluorescent markers
2.4.1. FTIR Spectroscopy
FTIR spectra of polymers solutions were recorded using a Bruker Tensor 27 spectrometer (Bruker, Germany, Bremen) equipped with a liquid nitrogen-cooled MCT (mercury cadmium telluride) detector. FTIR spectra of solid polymers were recorded using MICRAN-3 FTIR microscope (Simex, Novosibirsk, Russia) equipped with a liquid nitrogen-cooled MCT detector. For each spectrum, 50–70 scans were accumulated at 20 kHz scanning speed and averaged. Spectral data were analyzed using the Bruker software program Opus 8.2.28 (Bruker, Bremen, Germany).
2.4.2. NMR Spectroscopy
10-15 mg of the polymers were dissolved in 1 mL of D2O. 1H NMR spectra of the solutions were recorded on a Bruker Avance 400 spectrometer (Bremen, Germany) with an operating frequency of 400 MHz. The spectral data analysis and processing were performed in the program MestReNova v. 12.0.0-20080.
2.4.3. Dynamic Light Scattering (DLS)
The polymer particles size and ζ-potentials were measured using a Zetasizer Nano S «Malvern» (Worcestershire, UK) (4 mW He–Ne-laser, 633 nm, scattering angle 173°) at 25 °C. Experimental data were analyzed using «Zetasizer Software» (v. 8.02).
2.4.4. Determination of ligand affinity to model mannose receptor Concanavalin A
The process of complex formation between concanavalin A and FTIR and fluorescent markers was conducted in PBS buffer, with a pH of 7.4, containing 0.15 M NaCl, 1 mM CaCl₂, and 1 mM MnCl₂. The concentration of concanavalin A ranged from 1 to 10 mg/mL, while the concentration of ligands varied from 0.01 to 100 times the estimated dissociation constant (
Kd). The reaction took place at 37°C for 30 minutes, with continuous stirring. Following the reaction, infrared spectroscopy was employed to record the FTIR spectra of both the protein and the formed complexes, allowing for the determination of dissociation constants using a standardized protocol [
22].
2.5. Bronchoalveolar lavage fluid (BALF) origin
The BALFs were collected from patients with various diseases of the respiratory tract who were admitted to the Morozov Hospital. The procedure for isolating the BALF followed the methodology outlined in [
43]. N-acetylcysteine (ACC) was used to facilitate the dilution of mucus. Cells were extracted after subsequent washing with PBS at a force of 4,000 × g for a duration of 5 minutes. After the cell isolation procedure, they were comprehensively studied.
2.6. Typing macrophages from BALF and diagnosis of diseases
2.6.1. Real-Time FTIR Experiments
The volume of the reaction mixture is 35 µL. The number of cells from BALF is about 2×10⁵. The concentration of the IR marker is 5 mg/mL by PEG (equivalent to 1 mM). PBS (0.01M, pH 7.4). T = 37 °C. FTIR spectra of BALF samples during real-time (40-60 min) incubation with IR markers of different affinity to CD206 receptors were recorded on Bruker Tensor 27 spectrometer (Bruker, Germany, Bremen) equipped with a liquid nitrogen-cooled MCT (mercury cadmium telluride) detector. Then, kinetic curves of the intensity changes of the FTIR peaks were analyzed.
2.6.2. «Before and After» FTIR experiment technique
The volume of the reaction mixture is 300 µL. The number of cells from BALF is about 5×10⁵. The concentration of the IR marker is 2 mg/mL by PEG (equivalent to 0.4 mM), mannan 2 mg/mL. PBS (0.01M, pH 7.4). T = 37 °C. BALF samples were incubated with IR markers and mannan for 2 hours with subsequent washing of the unbound polymers. FTIR spectra were recorded using MICRAN-3 FTIR microscope (Simex, Novosibirsk, Russia) equipped with a liquid nitrogen-cooled MCT detector.
2.6.3. FTIR microscopy for mapping of BALF samples
BALF samples were incubated for 1h with triMan-PEG5000 (10 mg/mL). Then half of the samples were treated with mannan (10 mg/mL) for 1 h – as a CD206 high-affinity polymer to exclude non-specific interactions. PBS (0.01M, pH 7.4). T = 37 °C. FTIR microscopic maps of the peak intensities’ integral distribution in the IR spectra of BALF samples were recorded using MICRAN-3 FTIR microscope (Simex, Novosibirsk, Russia) equipped with a liquid nitrogen-cooled MCT detector.
2.6.4. Fluorescent fingerprint analysis of BALF samples
The experimental procedure involved the isolation of BALF cells, followed by the application of a cell suspension to the wells of a microtiter plate, where the cells attached. Fluorescent markers were then added, and the mixture was incubated for a period of four hours. The fluorescence of the resulting solution was then analyzed, and binding parameters were calculated. By utilizing five distinct fluorescent markers in both the presence and absence of mannans, we obtained ten binding indices for each sample. These indices form the foundation for our fingerprint analysis.
The volume of the reaction mixture is 300 µL. The number of cells from BALF is about 1×10⁵. The concentration of the IR marker is 1 mg/mL by PEG (equivalent to 0.2 mM), mannan 1 mg/mL. PBS (0.01M, pH 7.4). T = 37 °C. Fluorescence of FITC was detected using a SpectraMax M5 device (Pennsylvania, USA) in the Costar black\clear bottom tablet (96 wells) at λexci, max = 480 nm; λemi = 520 nm. The binding index was determined in % for a cell-bound polymer based on the difference between the initial and final fluorescence values.
2.6.5. Agglutination of Cells from BALF — Turbidimetric Method
The kinetic curves of cell agglutination from BALF cells (10⁶ cells/mL) were constructed based on the relationship between A₆₀₀ and incubation time, with mannan serving as the agglutinating agent. The turbidity of the system was measured using an Ultrospec 2100 Pro device (AmerSham Biosciences, Cambridge, United Kingdom). The medium used was PBS at a concentration of 0.01 M with a pH of 7.4, and the temperature was maintained at 37 °C.
2.7. Confocal laser scanning microscopy (CLSM) of eukaryotic cells
The CLSM images of macrophages extracted from the BALF, model macrophages derived from human monocytes THP-1, and control non-phagocytic fibroplast cells lacking CD206 were obtained using the CLSM Olympus FluoView FV1000 equipped with both a spectral scan unit with emission detectors and a transmitted light detector. The motorized inverted microscope Olympus IX81 was employed. The objective lens Olympus UPLSAPO 40X NA 0.90 was utilized for the experiments. The laser power, sampling rate, and averaging were identical for all image acquisitions. The scan area was 80 × 80 µm2. The cell nuclei were stained with DAPI — blue channel (λex,max = 405 nm; λemi = 420-480 nm); the CD206 receptors on macrophages were stained with Alexa594+ antibodies — red channel (λex,max = 594 nm; λemi = 620-700 nm); the fluorescent markers contain FITC label (PEI-triMan-FITC and PEI-Man-FITC) — green channel (λex,max = 488 nm; λemi = 505-555 nm). The signals were adjusted to the linear range of the detectors. The Olympus FV10 ASW 1.7 software was employed for the acquisition of the images.
3. Results and Discussion
3.1. Design of the Work
In this study, we propose a new approach to the diagnosis of respiratory tract disorders, with the potential for subsequent optimization of treatment strategies, based on a fingerprint method of bronchoalveolar lavage fluid (BALF) analysis. We present the concept and its practical implementation through the investigation and classification of macrophages from the BALF, which exhibit varying levels of expression of mannose CD206 receptors. For the study BALF samples were obtained from patients with diverse diagnoses, that differed in terms of their clinical course, such as acute or chronic, etc.
The classification of macrophages was achieved through the use of polymers with diverse carbohydrate moieties that exhibit varying affinities for CD206 receptors (
Table 1). This process is based on the complicate molecular architecture of ligands comprised of galactose, mannose, or trimannose units, as well as mannan polymers (
Figure 1). Different factors such as the overall length of the polymer chain, the distance between the saccharide residues, the arrangement of mannose residues regular or random, and the structural characteristics of the polymer chain all contribute to the affinity for CD206 receptors. The binding of these ligands to macrophages is determined by the specific interaction between the ligand and a single receptor, as well as the receptors expression degree, their spatial arrangement, and potential clustering, allowing for a unique "fingerprint" analysis of macrophages that can be associated with specific diseases.
Key aspects of this work include:
1. Development and characterization of IR and fluorescent markers specific for CD206+ macrophages.
2. Classification of macrophages using FTIR spectroscopy in various modes: kinetic (real-time) analysis, pre- and post-binding comparison, and FTIR mapping of BALF samples.
3. The macrophages typing using fluorescent markers as an approach to fingerprint analysis of macrophage populations from BALF, providing valuable insights into the diagnostics
4. Confocal visualization of macrophages from BALF, model macrophage cell lines and CD206-negative cells.
3.2. Synthesis and characterization of infrared (IR) and fluorescent markers for macrophage typing
3.2.1. Infrared (IR) markers for CD206 receptors
The principial concept of an IR marker was previously introduced by us in work [
39], and involves molecular probe for the infrared range. We suggest using a polyethylene glycol (PEG) as one of these IR markers. The IR marker exhibits a distinct and analytically relevant spectral band at 1090 cm
–1, which is distinct from the main functional groups characteristic of biopolymers such as hydroxyl (–OH), carboxyl (–COOH), amines, aromatic compounds, amides, and phosphate groups. The methylene (CH
2) groups present in the composition of the IR marker structure can serve as reference peaks when analyzing PEG.
The synthesis of IR markers with three types of carbohydrate tags is illustrated in
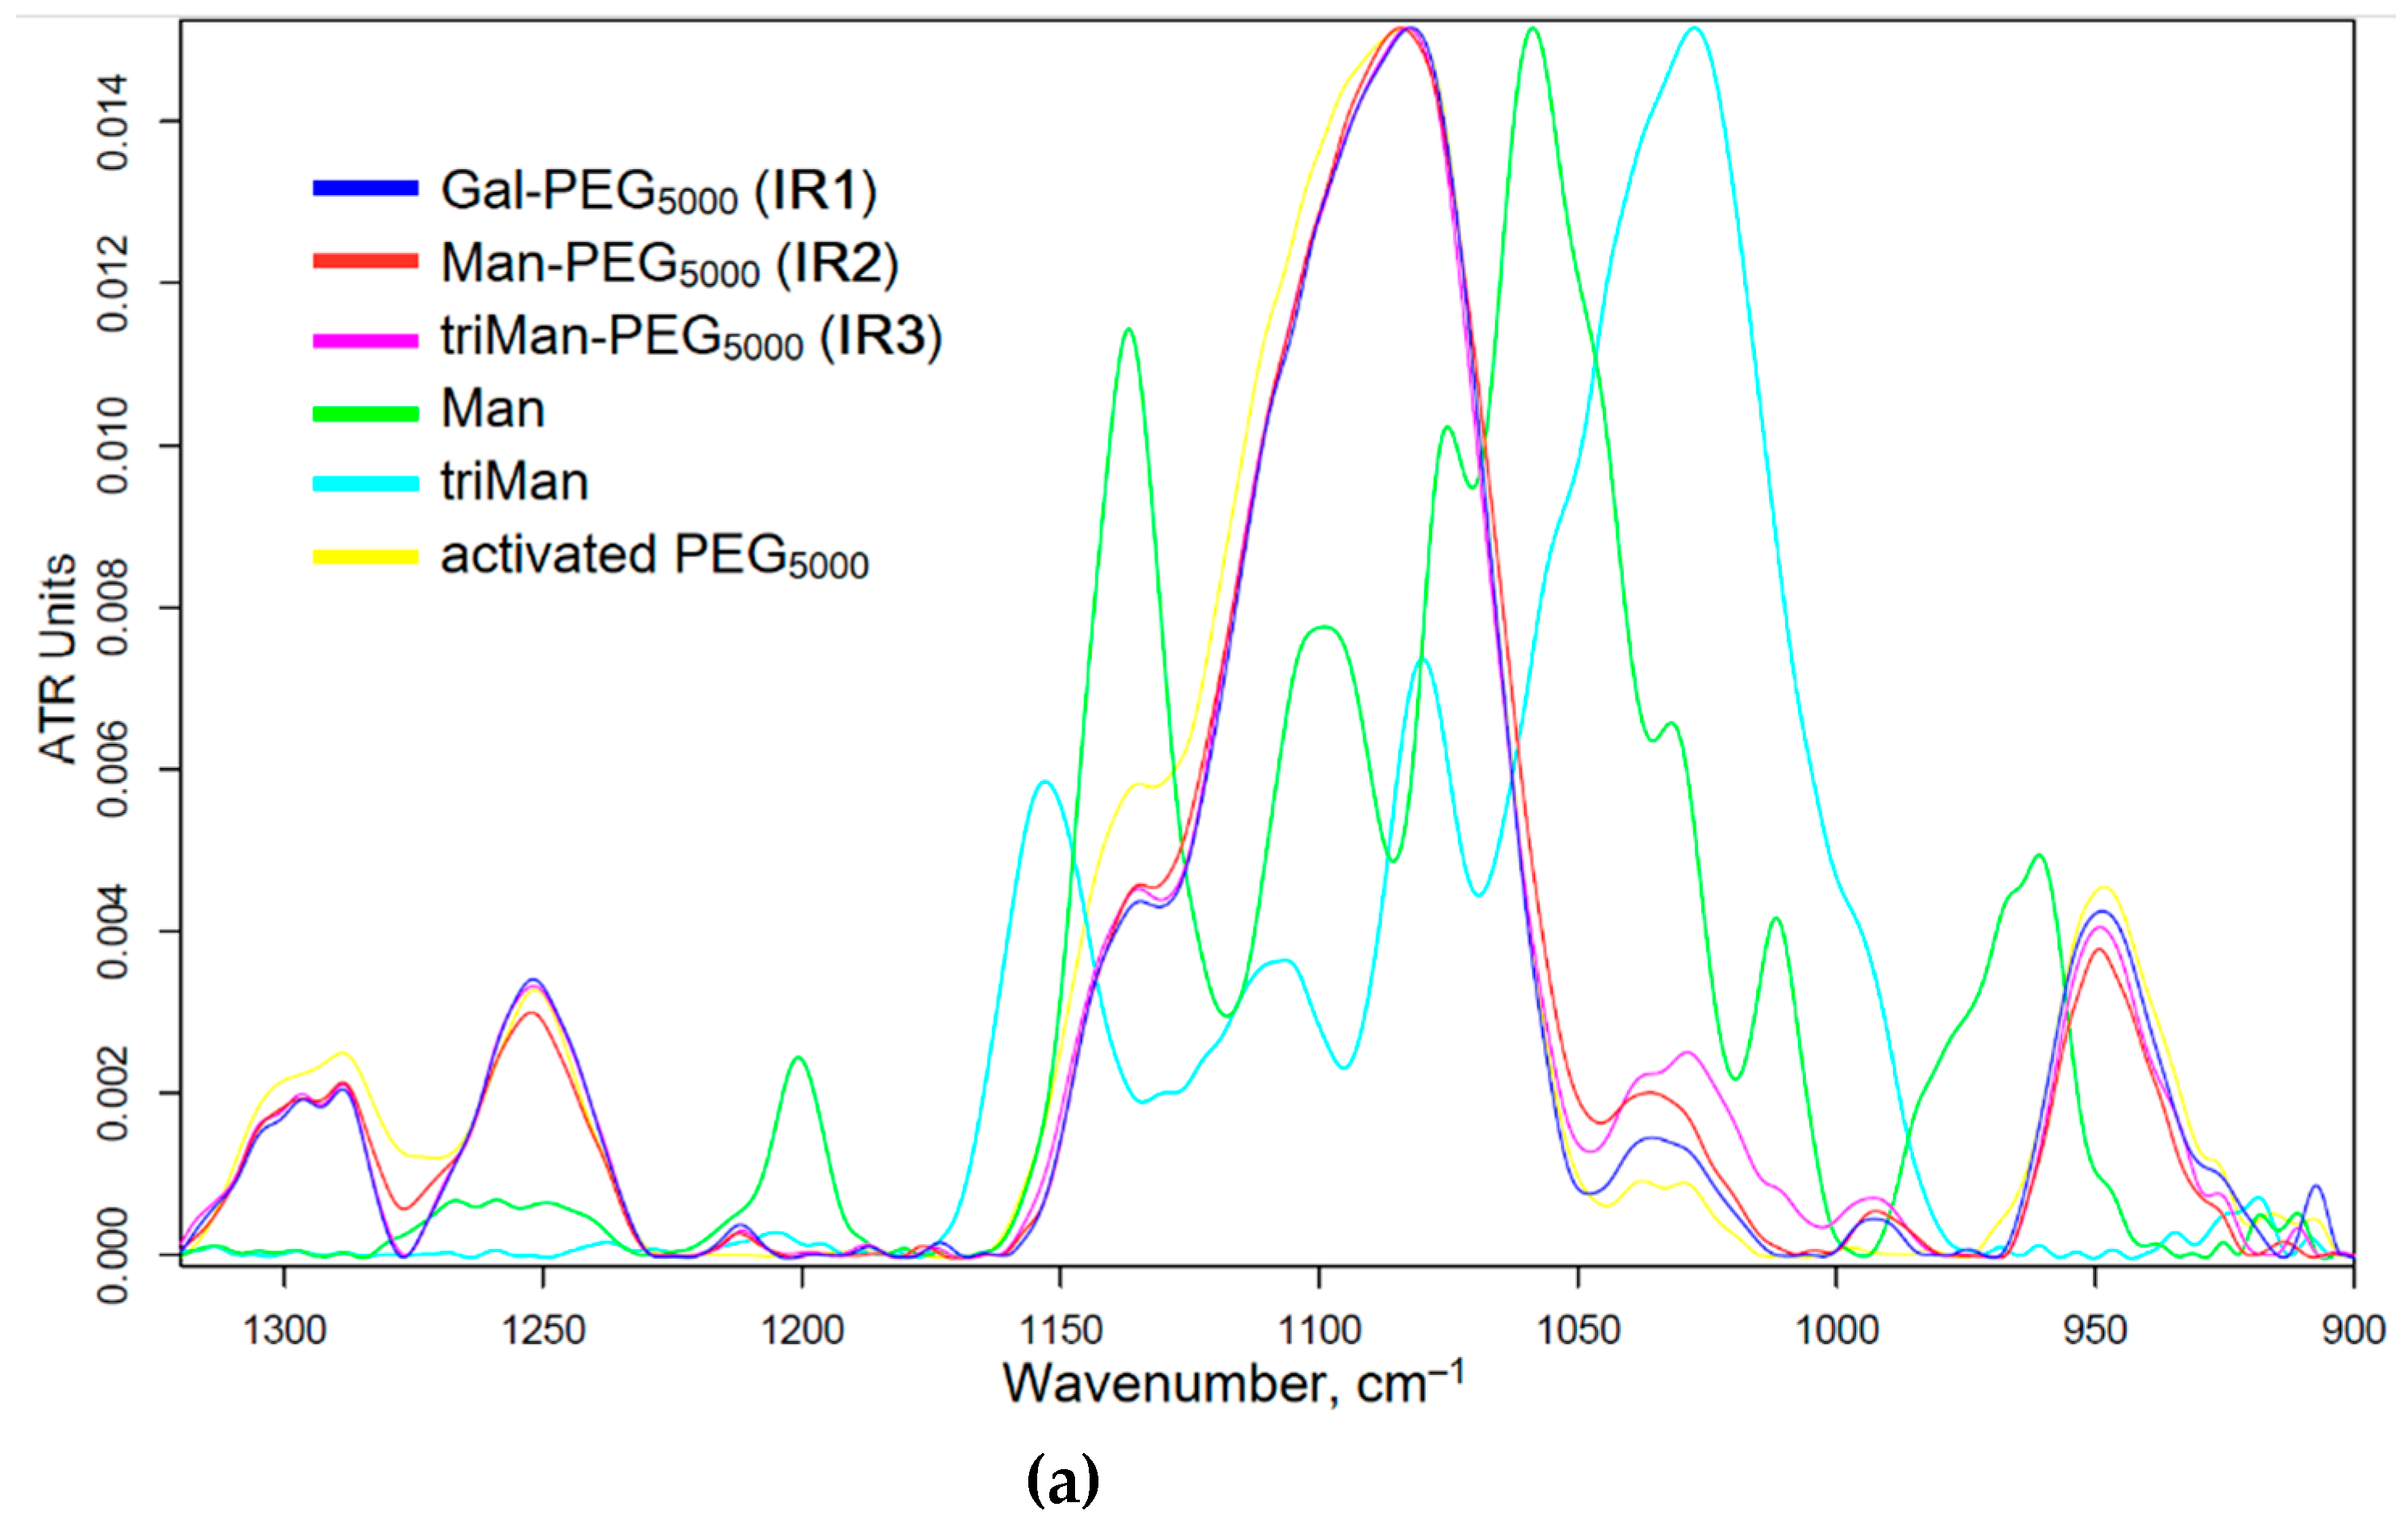
Figure 1a. The successful synthesis of PEG-carbohydrates is confirmed by the presence of a sharp and pronounced peak at 1090 cm
–1 (C-O-C) in the FTIR spectra of the products, as shown in
Figure 2a. Additionally, and a minor shoulder at 1030 cm
–1 is observed, corresponding to the ν(C–O) bond oscillations in carbohydrates. Furthermore, the formation of an amide bonds is supported by the emergence of a peak at 1660 cm
–1 ν(C=O) and 1580 cm
–1 δ(N–H), replacing the peak typically observed at 1710 cm
–1 ν(C=O) for activated PEG ethers (
Fig. S1).
3.2.2. Fluorescent markers for CD206 receptors
Fluorescent ligands-markers can be considered as a viable alternative to antibodies: while the number of antibodies to the receptors is limited the polymeric ligands can be synthesized in unlimited number by variation in the molecular architecture and composition. This allows for a significant expansion of the number of parameters in fingerprint analysis. Application of wide range of labels characterized by distinct affinities, one can conduct a fingerprint analysis, examining the binding patterns of macrophage cells with set of the ligands.
The process of fluorescent markers synthesis incorporating five types of carbohydrate tags is exemplified in
Figure 1b.
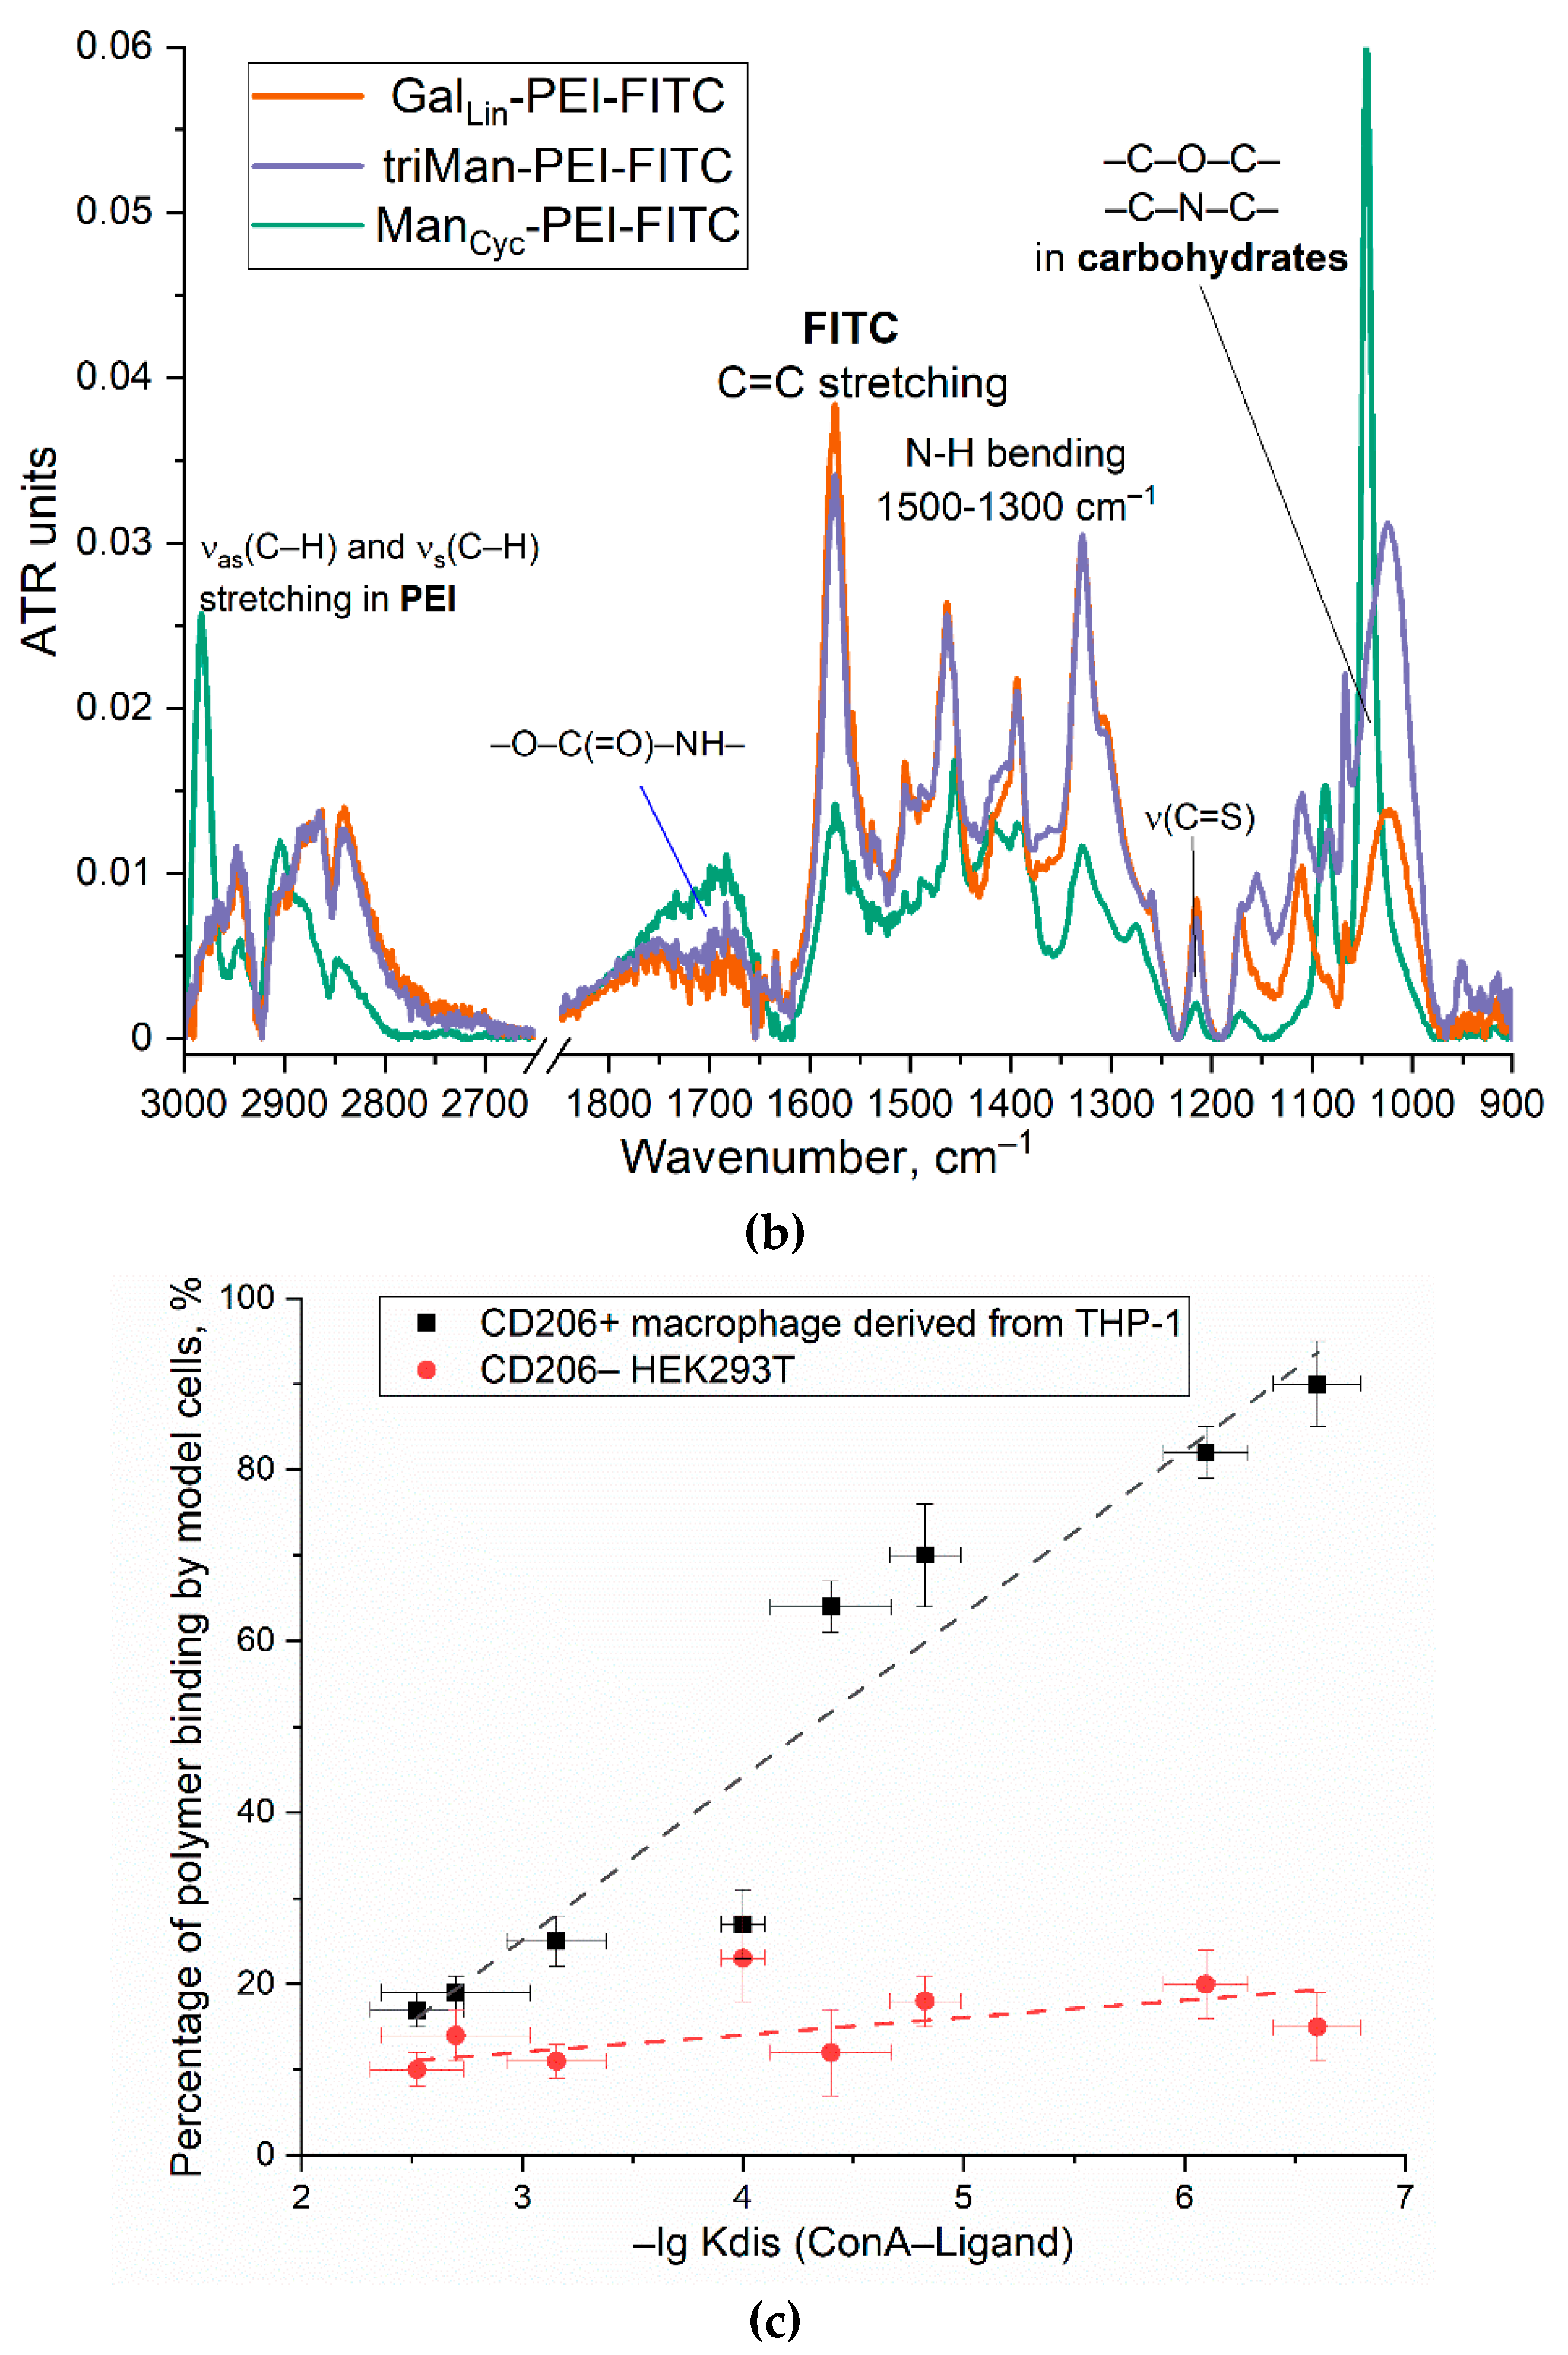
Figure 2a presents the infrared spectra of fluorescent markers derived from PEI with modifications incorporating linear galactose, cyclic mannose, and trimannoside residue. The spectra reveal pronounced oscillatory bands of CH₂ groups are observed in the PEI region spanning from 2,980 to 2,800 cm⁻¹. The characteristic peaks at 1,580 and 1,450 cm⁻¹ correspond to the valence oscillations of C=C in the fluorescein isothiocyanate (FITC) label. Peaks ranging from 1,200 to 1,000 cm⁻¹ are associated with oscillations of C-N in the PEI molecule and C-O-C bonds in the saccharide components.
3.2.3. Physico-chemical parameters of IR and fluorescent markers used for macrophage typing
Table 1 presents the physicochemical attributes of the investigated markers. The IR markers are distinguished by an equimolecular ratio of PEG chains and saccharide substituents. The particles comprising the IR markers exhibit an average hydrodynamic diameter of approximately 85-90 nm and are characterized by slightly positive values of the zeta-potential.
The trisaccharide moiety of IR3 exhibits a pronounced affinity for CD206 mannose receptors, whereas the galactose ring configuration of IR1 manifests a weak affinity to CD206 receptors. The linear mannose component displaying a lowest affinity to CD206 (
Table 1) and present in IR2 functions as a negative control.
Fluorescent markers are engineered based on PEI with a molecular weight of 1,800 Da, which has been grafted with FITC residues at a frequency of one per polymer chain, and carbohydrate residues ranging from 10 to 18 per 1 polymer chain. The particles of these fluorescent markers exhibit an average hydrodynamic diameter in the range of 100–150 nm and possess positive zeta-potentials. One such marker, specifically designated for high-affinity labeling of the CD206 receptor, is triMan-PEI-FITC. Medium affinity labels for the CD206 receptor are ManCyc-PEI-FITC and GalCyc-PEI-FITC, with cyclic sugar residues, while control polymers with low affinity contain linear residues of galactose and mannose.
For quantitative determine the affinity of mannose-ligands for mannose receptor, we used the concanavalin A (ConA) lectin as model reference receptor (
Figure 1c and
Table 1). There is a positive correlation between the dissociation constant of the ConA-ligand and the binding degree to the CD206+ macrophages cells. In contrast, for CD206-negative control cells, where the binding was largely independent of the marker type, indicating to non- specific binding.
3.3. The methods of analysis macrophages from BALF and diagnosis aspect
3.3.1. FTIR spectroscopy
By examining the interactions between macrophages and specific markers, we can shed the light gain insights into the functional characteristics of these cells. This information is crucial for gauging the severity of the disease, facilitating accurate diagnosis, and optimizing treatment strategies.
In the context of investigating macrophages using FTIR spectroscopy, we launch three experimental approaches that offer complementary insights:
1. Real-Time Experiment. The method enables the observation of alterations in the absorption spectrum resulting from the interaction of mannose and other carbohydrate-based ligands with macrophages. We could analyze the kinetics and efficacy of this binding process. Kinetics and extent of ligand attachment parameters are directly related to both the polarization state and phagocytic capacity of macrophages.
2. IR spectra before and after the ligand binding are of particular interest provide the information on the state of the ligand inside the macrophages. After a few hours of incubation, the phagocytic activity can be assessed. We can estimate the ligand content internalized inside the macrophages by the receptor endocytosis and identify the specific organelles or biomolecules involved in the interaction.
3. IR micro-mapping. Application of the infrared imaging technique provides a detailed information on the precise distribution of mannose ligands on the surface of macrophages. This approach allows for the visualization of regions where binding sites are present and the quantification of the strength of these interactions.
3.3.2. Real-Time FTIR Experiments for macrophage typing and disease diagnosis
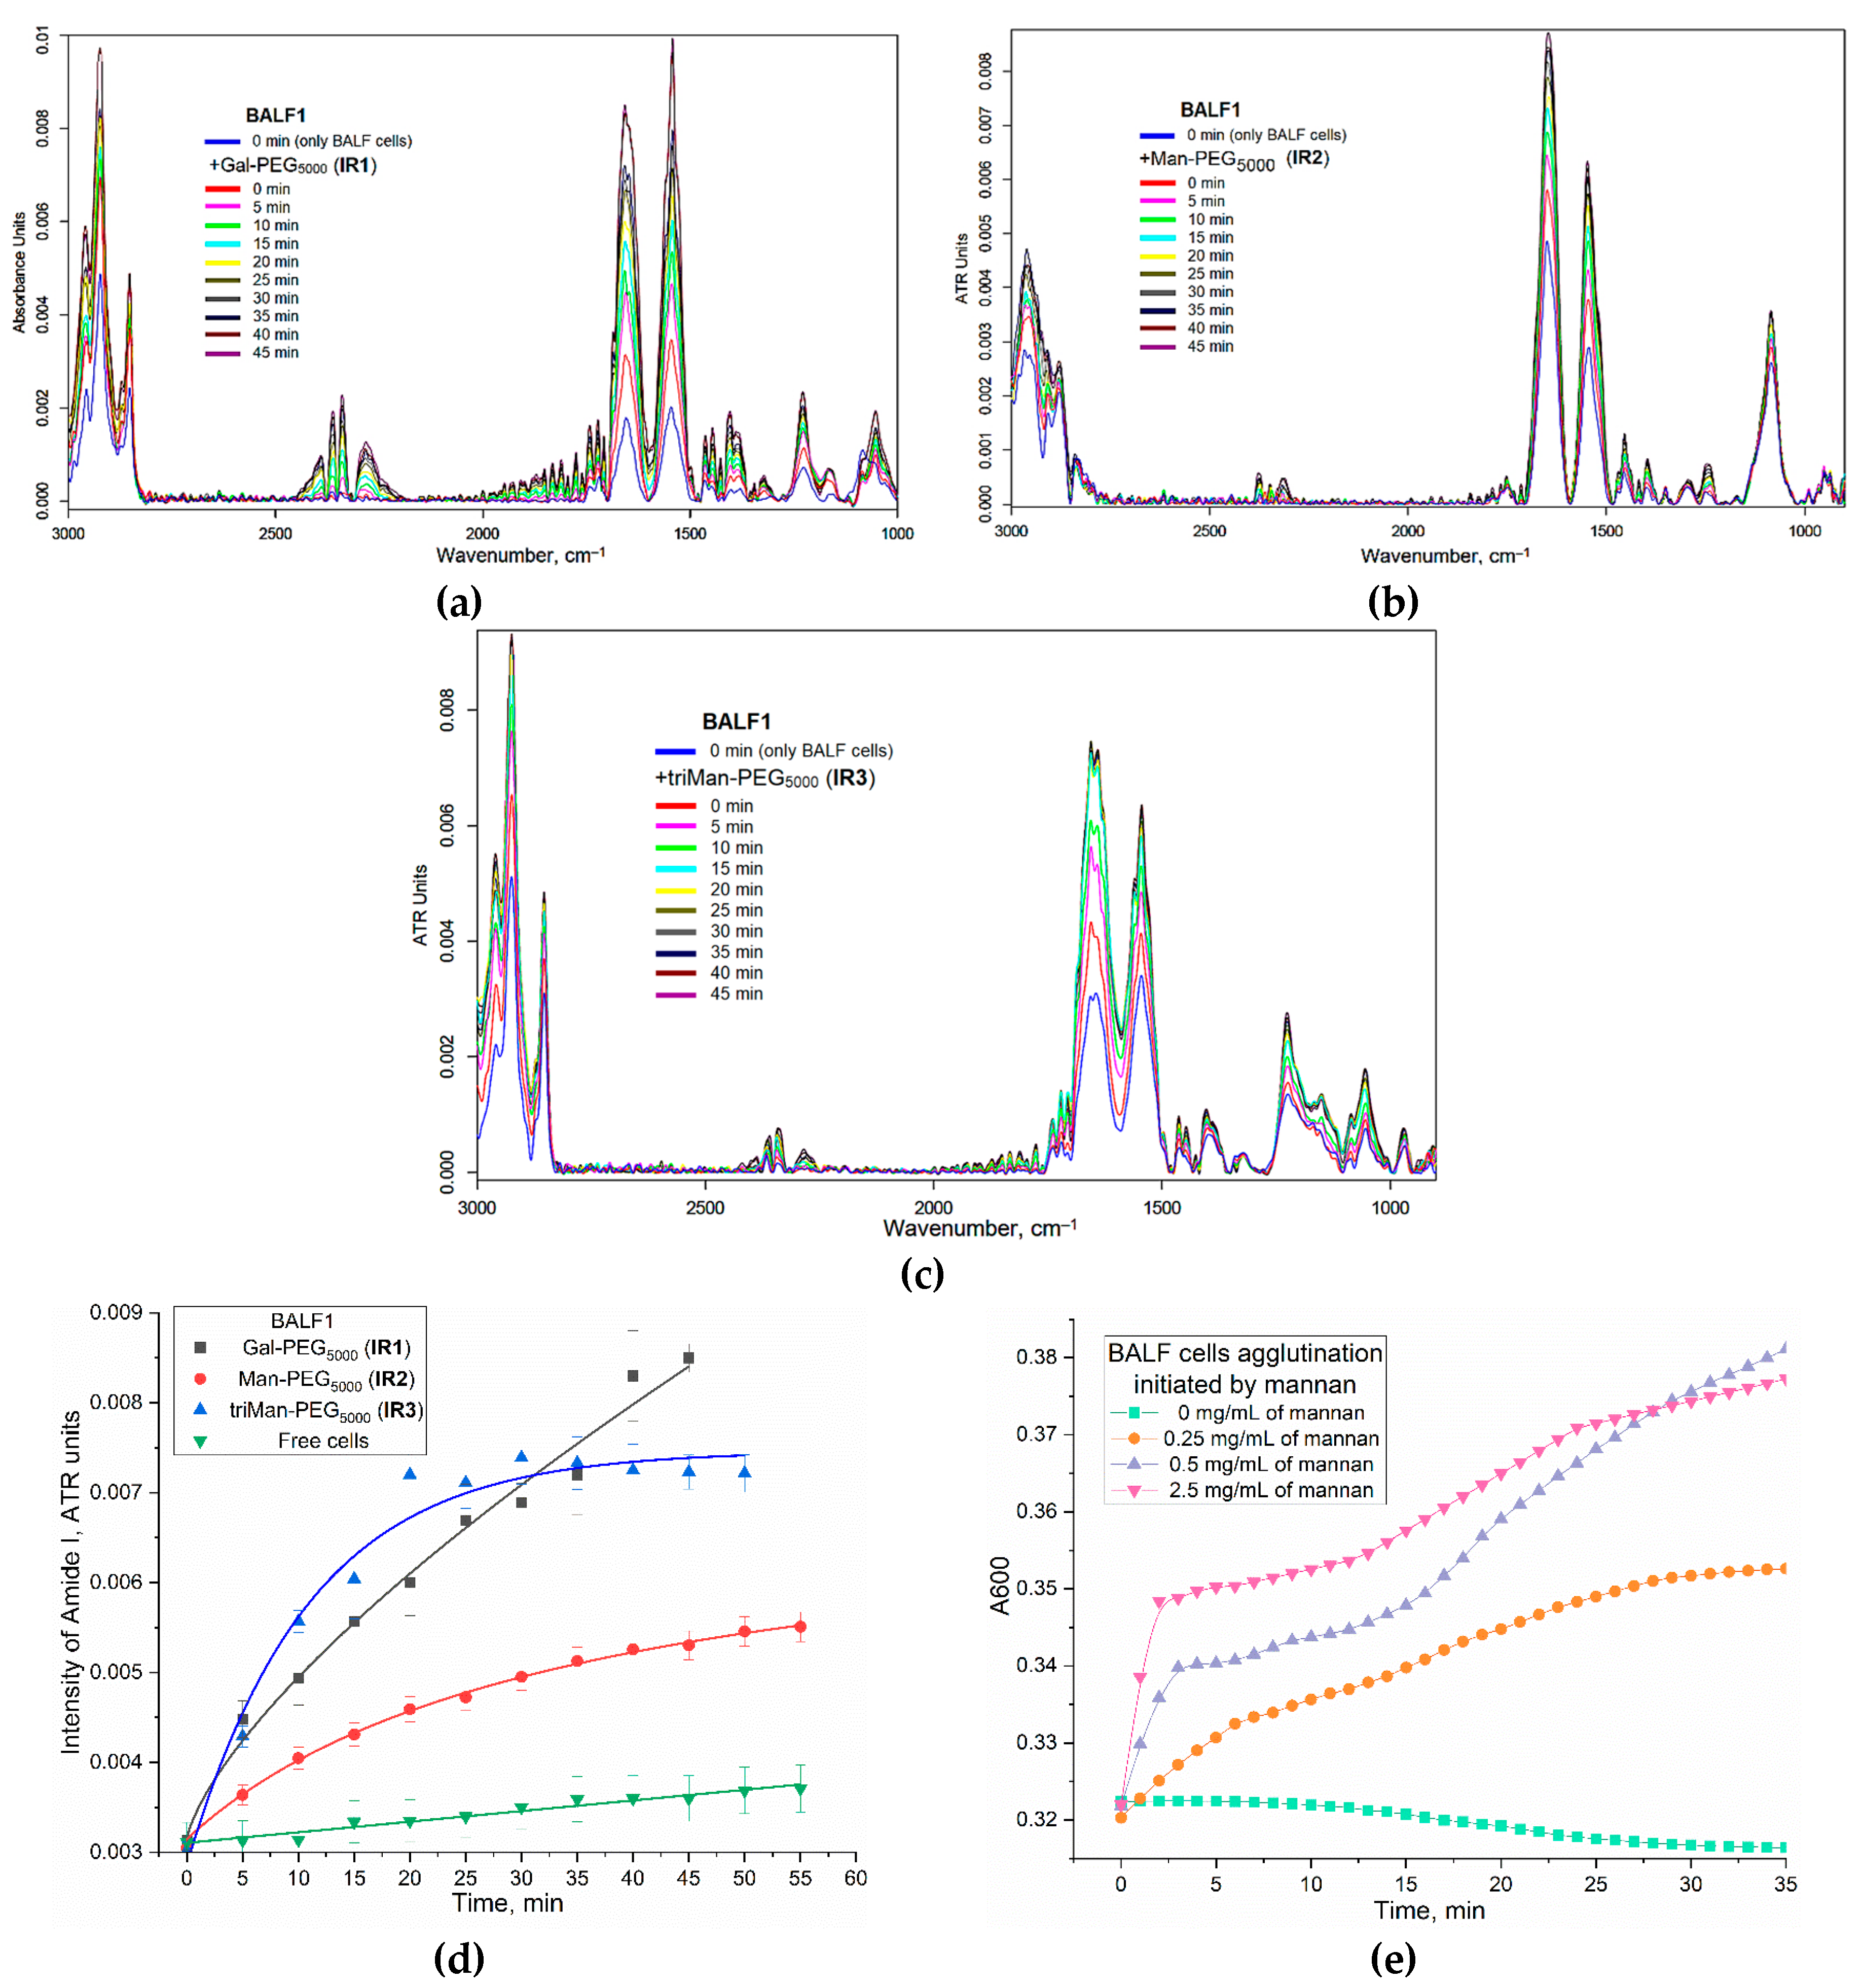
Figure 3 show the FTIR spectra of BALF samples (from a patient with purulent endobronchitis) during real-time incubation with IR markers IR1-3 of different affinity to CD206 receptors. The characteristic peaks of cells in the IR spectra are following bands: ν(CH
2) (3000-2800 cm
–1, lipid membrane), ν(C=O) (Amide 1, 1700-1600 cm
–1, proteins), δ(N-H) (Amide 2, 1600-1500 cm
–1, proteins), ν(P=O) (1300-1200 cm
–1, DNA), ν(C-O) (1100-1000 cm
–1, carbohydrates). When IR markers containing PEG chains interact with cells, polymer binding to the cells and their subsequent deposition is observed, which is evident from an increase in the intensity of all major peaks. The rate of deposition is particularly high in cases of strong affinity binding.
We examined the interaction between polymers and macrophages «in adsorption and binding mode» by using amide 1 region (corresponding to interaction with protein CD206-receptor). The increase in the intensity of the amide signal is associated with the conformational adjustment of the receptor protein and its engagement with the triMan-PEG microenvironment that specifically binds to the CD206 receptor. This interaction subsequently results in a heightened amide peak. In our previous study, we encountered a similar phenomenon when investigating the model protein ConA and its specificity towards carbohydrate and mannose ligands with varying structures. It was observed that the greater the affinity of a ligand, the more pronounced was the increase in Amide 1 peak [
21,
44,
45].
Figure 3d present the kinetic curves of the Amide1 peak intensity on the incubation time of the ligand with macrophage cells. Besides the conformational adjustment of the receptor protein upon interaction with the mannose ligands, we observe the cellular agglutination of BALF macrophage as they adhere to carbohydrate and polymer ligands. Turbidimetric analysis also revealed the agglutination of macrophages in their interaction with highly specific mannose ligands (
Figure 3e). This phenomenon becomes more evident as the affinity of the label for CD206 receptors intensifies. While the contribution of background cellular deposition of cells (without ligands) can be disregarded.
In the case of IR3 (triMan-PEG), there is an initial sharp increase followed by saturation after 20 minutes. When using IR2, containing linear mannose, the binding is not so pronounced compared to triMan-PEG. This indicates the specific nature of binding and suggests that the macrophages are CD206+, indicating the activated state of macrophages. This observation is consistent with the diagnosis of purulent endobronchitis. These are examples of the graphs appear in this particular technique.
As an alternative analysis approach, we applied the normalizing the spectra to Amide 1 (protein) peak and analyzing the bands assigned to PEG (in IR-label), so that we can specifically track the binding of polymers to cells.
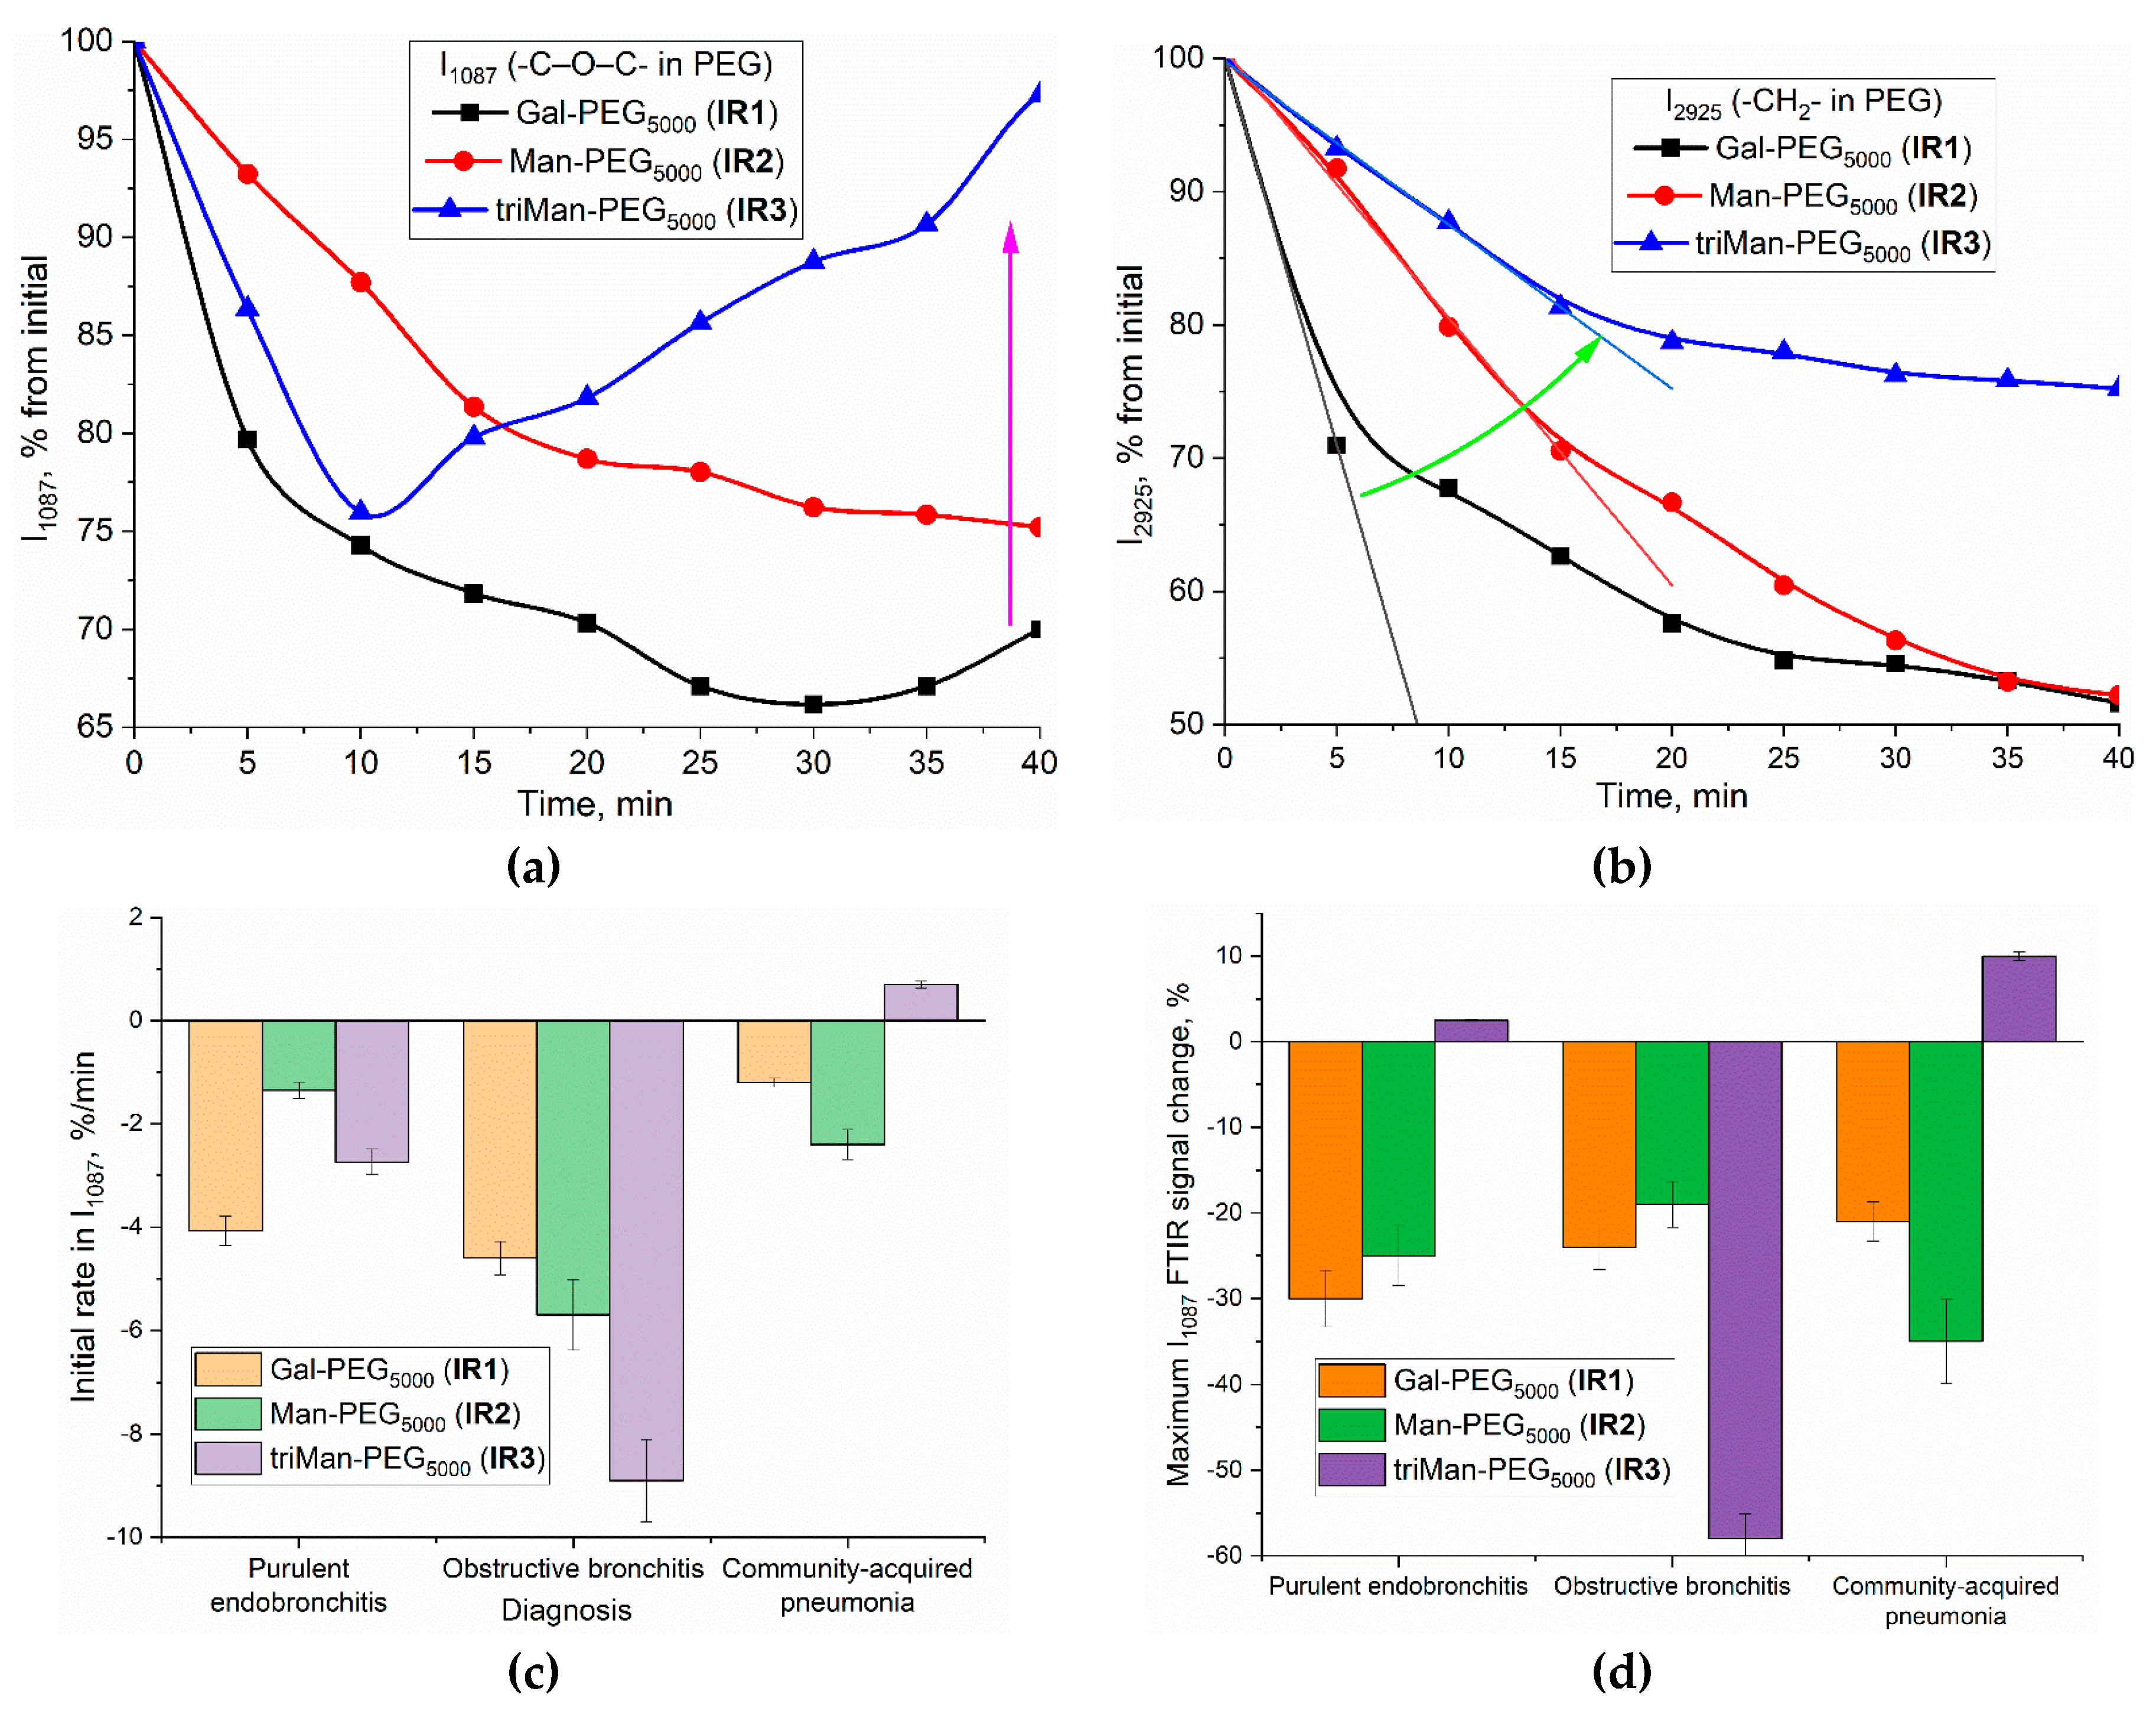
Analytically significant peaks for IR-label (PEG) can be observed at 1087 cm⁻¹ (C–O–C, PEG) and 2925 cm⁻¹ (CH₂, PEG and the lipid membrane of the cells). In BALF obtained from a patient with endobronchitis, a distinct pattern of polymer binding to macrophages emerges (
Figure 4a-b). For the peak at 1087 cm⁻¹, the initial rate is highest for IR1 (linear galactose, –30% for 10 min; In the case of the most affine ligand IR3 containing triman, are observed: rapid quenching (–26% within 10 minutes) of PEG signal is observed due to the binding with the receptor protein, and a subsequent "ignition" effect (+25% over a 30-minute period) upon specific interaction between the polymer and cells, resulting in the receptor endocytosis. This response the increase in signal intensity is attributable to changes in the microenvironment upon the internalization of CD206 receptors upon interaction with a high-affinity polymers.
For the peak at 2925 cm⁻¹ (
Figure 4b) the kinetic curves characterized by a hyperbolic trend with saturation. However, C-O-C peak is more sensitive to the binding of macrophages to ligands.
Based on a set of analogous graphs, we have determined the indexes of polymer binding to macrophages for several clinical conditions (
Figure 4c, d): purulent endobronchitis, obstructive bronchitis, and pneumonia. The quantification of macrophage polarization state in BALF can be accomplished through the selectivity index, determinate as the ratio of ligand of different affinity binding to cells. Each condition exhibits its own distinctive index pattern, corresponding to the specific clinical presentation and the state of macrophage polarization:
To assess the polarization state of macrophages in BALF (bronchitis with a moderate degree of inflammation), we correlated the binding indices determined for BALF with the control test systems using flow cytometry method (
Table 2). As positive control a model monoclonal cell line derived from THP-1 monocytes that exhibited a highly homogeneous phenotype M1 and characterized by high expression of CD206 receptors were tested. The binding indices determined for homogeneous M1 were compared to that for macrophages from BALF. CD206-negative HEK293T cells were employed as negative control.
In the case of a model cell line (in M1 state) of activated macrophages triMan-PEI appears to be the most highly affine to CD206 receptor, cyclic mannose and galactose exhibit moderate binding efficiency, and linear galactose is non-specific and exhibit the lowest affinity for mannose receptor in M1 macrophages. Resulting selectivity index determined as binding maximal ratio triMan-PEI to GalLin- PEI is 3.6.
In case of HEK293T, binding to carbohydrates is relatively weak, and no specificity is observed.
In the case of macrophages from the BALF of patients with inflammation, a selective binding for highly affine ligand also emerges, indicating activation status of macrophages. Resulting selectivity index determined as binding maximal ratio Mannan- to MANLin- PEI is 4.6. BALF cells show slightly different specificity (Mannan ≈ triMan > GalCyc >ManCyc >> Gal >Man) compared to model macrophages (triMan ≈ Mannan >> ManCyc ≈ GalCyc >> Man >> Gal), which indicates a different distribution of macrophage subpopulations M1, M2 and its subtypes.
In our IR test with PEG based-IR-labels for the case of purulent endobronchitis (
Figure 4CD) we observe a high specificity index (affine -non-specific ligand), corresponding to activated state of the macrophages. Besides, we observe a higher affinity for galactose than for mannose-based ligand and we observe the medium binding level i.e., the features are quite different from model M1 phenotype (
Table 2). This demonstrates the sensitivity of IR test with PEG based-IR-labels to detect a multitude of macrophage subpopulations, rendering it crucial to apply the fingerprint method for macrophage polarization analysis.
In the case of obstructive endobronchitis we also observe a high specificity index (affine -non- specific ligand), we see a higher affinity for mannose than for galactose and we observe the high binding level i.e., a pattern are different from M1 control system and corresponds to mixt of M1 and M2 with prevalent M2-like phenotype (with its subpopulation).
In the case of pneumonia, we observe a high specificity index (affine -non- specific ligand), we see a comparable affinity for mannose than for galactose ligand, i.e., approximately a pattern similar to M1 model macrophage (
Table 2), which is consistent with the theoretical high level of CD206 expression according to the established M1-like phenotype of macrophages.
3.3.3. “Before and after” FTIR Experiments for macrophage typing and disease diagnosis
Spectral changes
An alternative to real-time analysis of macrophage interactions with polymers is the «Before and After» technique of FTIR experiments, allowing to assess the amount of polymer internalized into the cells.
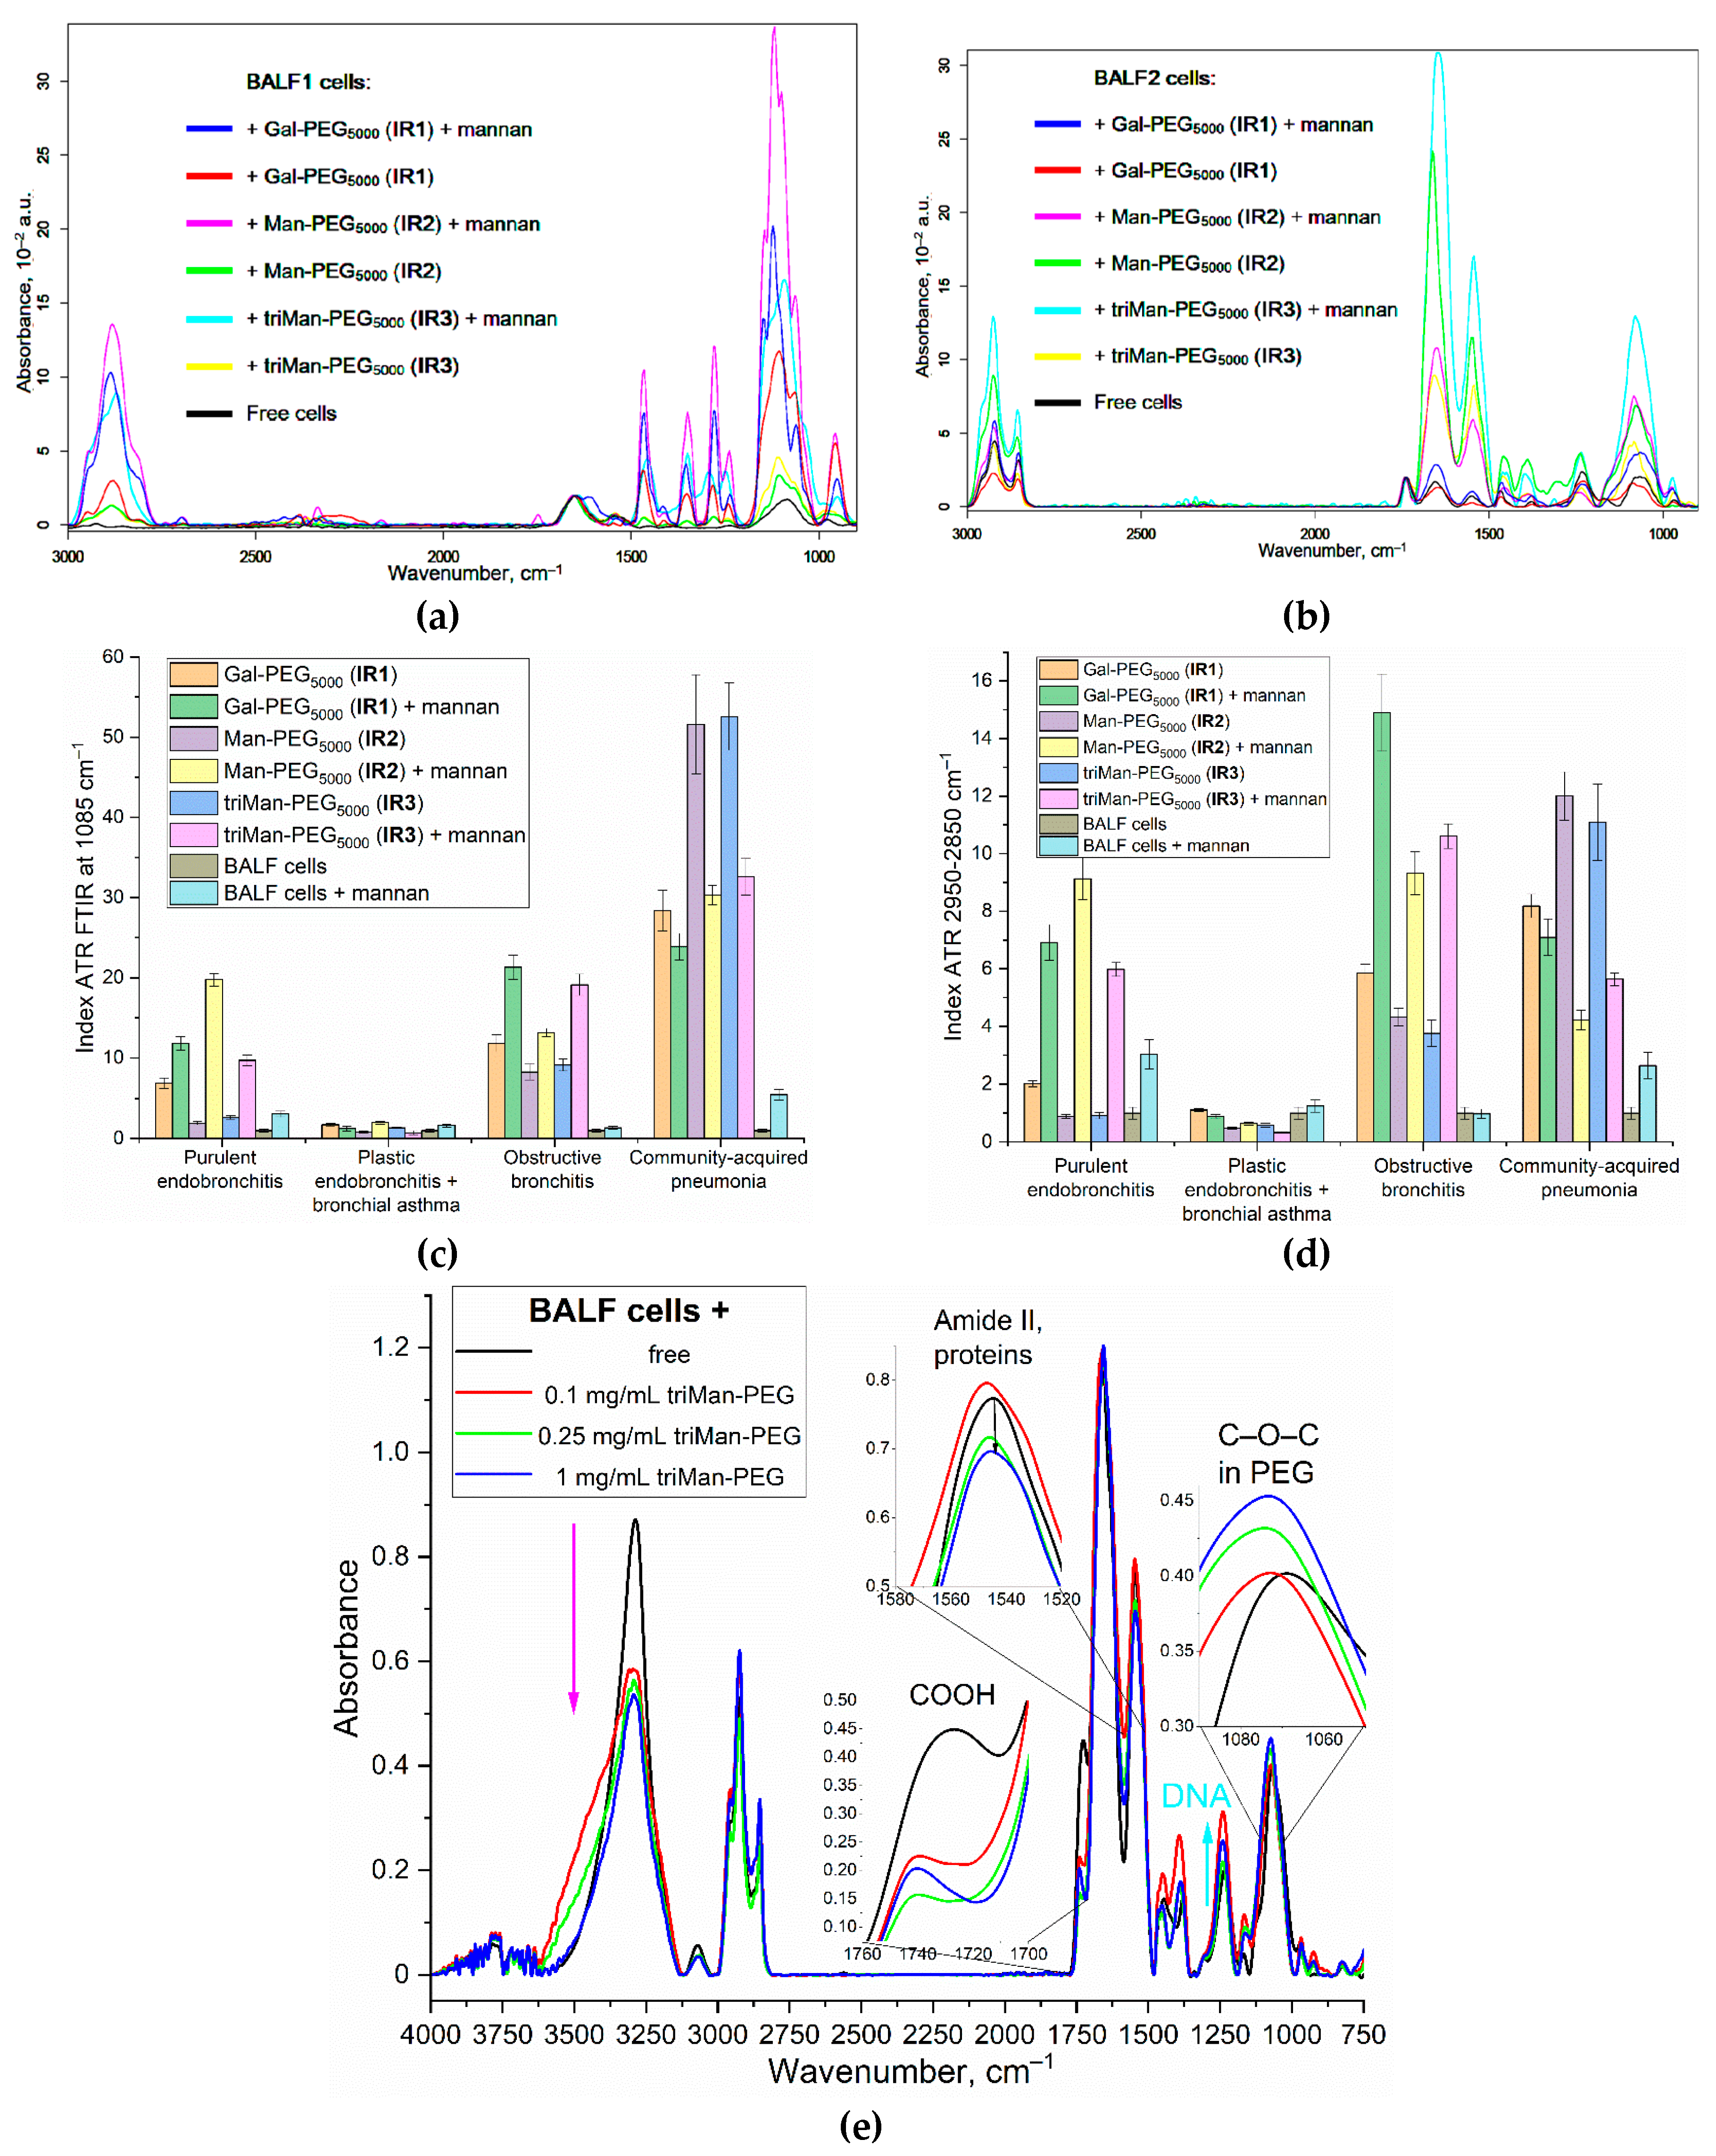
Figure 5ab illustrate the IR spectra of BALF samples from patients with purulent endobronchitis and bronchial asthma (with plastic bronchitis). Cell samples were incubated with IR1–IR3 polymers (with different affinities) for 3 h, either in the presence or absence of mannan - as a concurrent agent for the for binding with CD206-receptor. The amount of bound and internalized polymer can be determined from the intensity of spectral peaks at 2950–2850 cm⁻¹ (CH₂ group) and 1087 cm⁻¹ (C–O–C). The interaction of BALF cells with polymers lead to an increase in the intensity of characteristic peaks, especially v(C–O–C), which indicates to the adsorption of polymer on the cell wall, as well as to receptor-mediated endocytosis.
Figure 5cd illustrates the binding indices of BALF cells to different polymeric ligands. By examining the ratios and magnitudes of these indices, it becomes possible to differentiate between acute and non-acute diseases, chronic and local conditions, among other distinctions.
Diagnosis
In case of
purulent endobronchitis, the increase intensity of PEG-IR-marker peaks (at 2950 and 1087 cm
–1) observed in BALF macrophages upon the ligand binding. Again, higher affinity for galactose than mannose-based ligand is observed, this feature are different from model M1 phenotype but similar to model BALF (from
Table 2) corresponding to bronchitis with a moderate degree of inflammation. Interestingly, in the case of
acute illnesses, such as
purulent endobronchitis and pneumonia, in the presence of mannan a remarkable synergistic effect in the ligand binding is observed: the interaction between markers and CD206 receptors is enhanced. In other words, mannan acts not as a binding inhibitor but rather as an effector in this context. The interaction of mannan with CD206 receptors can be interpreted as follows: the presence of mannan enhances the efficiency of ligand binding to CD206 due to cooperative effects and increased affinity of the receptors for carbohydrate ligands, resulting in optimal receptor configurations. This is reasonable, as one of the natural functions of CD206 is to engage in the binding of microorganisms that possess mannose patterns. When oligo- or polymannosides are bound, the binding mechanism is activated. For instance, the highest binding indices are observed in cases associated with bacterial infections, such as pneumonia with acute course. Conversely, for chronic conditions
plastic endobronchitis with elements of bronchial asthma, the levels of all biomarkers are quite low. This suggests a small number of activated macrophages with a tendency towards an M2-like polarization. Therefore, the acquired data are feasible to categorize BALF cells and establish an inflammation degree at the respiratory tract disease.
Phagocytosis
Phagocytosis represents a crucial aspect of the interaction between BALF cells, particularly macrophages, and IR markers. This process becomes evident when polymer samples are incubated with cells for more than four hours.
Figure 5e illustrates the IR spectra of BALF samples from a patient diagnosed with bronchiectasis and bronchial asthma after 6-hour incubation period with different concentrations of triMan-PEG IR marker. After the incubation, the BALF samples were washed from the unbound polymer. The changes in the IR spectra after receptor phagocytosis were detected, following a comparative analysis of the spectra obtained from cells with and without polymers:
1. The intensity of the peak at 1730 cm−1, corresponding to the COOH group of the cell, decreased due to the interaction with polymers and the subsequent shielding effect on the BALF cells.
2. The intensity of the amide 2 (protein) peak decease with the increase in the polymers concentration, suggesting the penetration of polymers into the cells through phagocytosis.
3. There is an increase in intensity, accompanied by a shift of the high-frequency region of the peak at 1070 cm−1 (C–O–C in PEG), which is attributed to a modification in the microenvironment of the PEG chains during the process of phagocytosis. About 20 % of the polymer was internalized after incubated for 6 hours with macrophages.
4. The intensity of the peak grows by 1250 cm−1, corresponding to phosphate groups in DNA, indicating an interaction between the polymer and macrophage DNA of macrophages.
These alterations in the IR spectrum provide evidence for the progression of phagocytosis in the presence of high polymer concentrations after a 6-hour incubation period, thereby confirming the efficacy of the employed polymers for macrophage identification.
3.3.4. FTIR mapping (microscopy) of BALF samples with polymers
FTIR spectroscopy offers a diverse array of techniques and functionalities for monitoring the interaction between BALF cells and polymers, including the utilization of FTIR mapping methodology, commonly known as (FTIR microscopy). The advantages of this approach are manifold: non-destructive analysis on the cellular level, enabling the generation of images depicting the distribution of chemicals within a sample; FTIR microscopy exhibits exceptional sensitivity towards chemical groups and molecules, enabling the detection of even minute alterations in their distribution within the sample. This sensitivity makes it possible to precisely pinpoint the binding sites of cells to polymers.
Furthermore, this method provides the capability to investigate mapping the components of cell membranes, polymers, and other substances, which can prove invaluable in diagnosing and monitoring of various diseases.
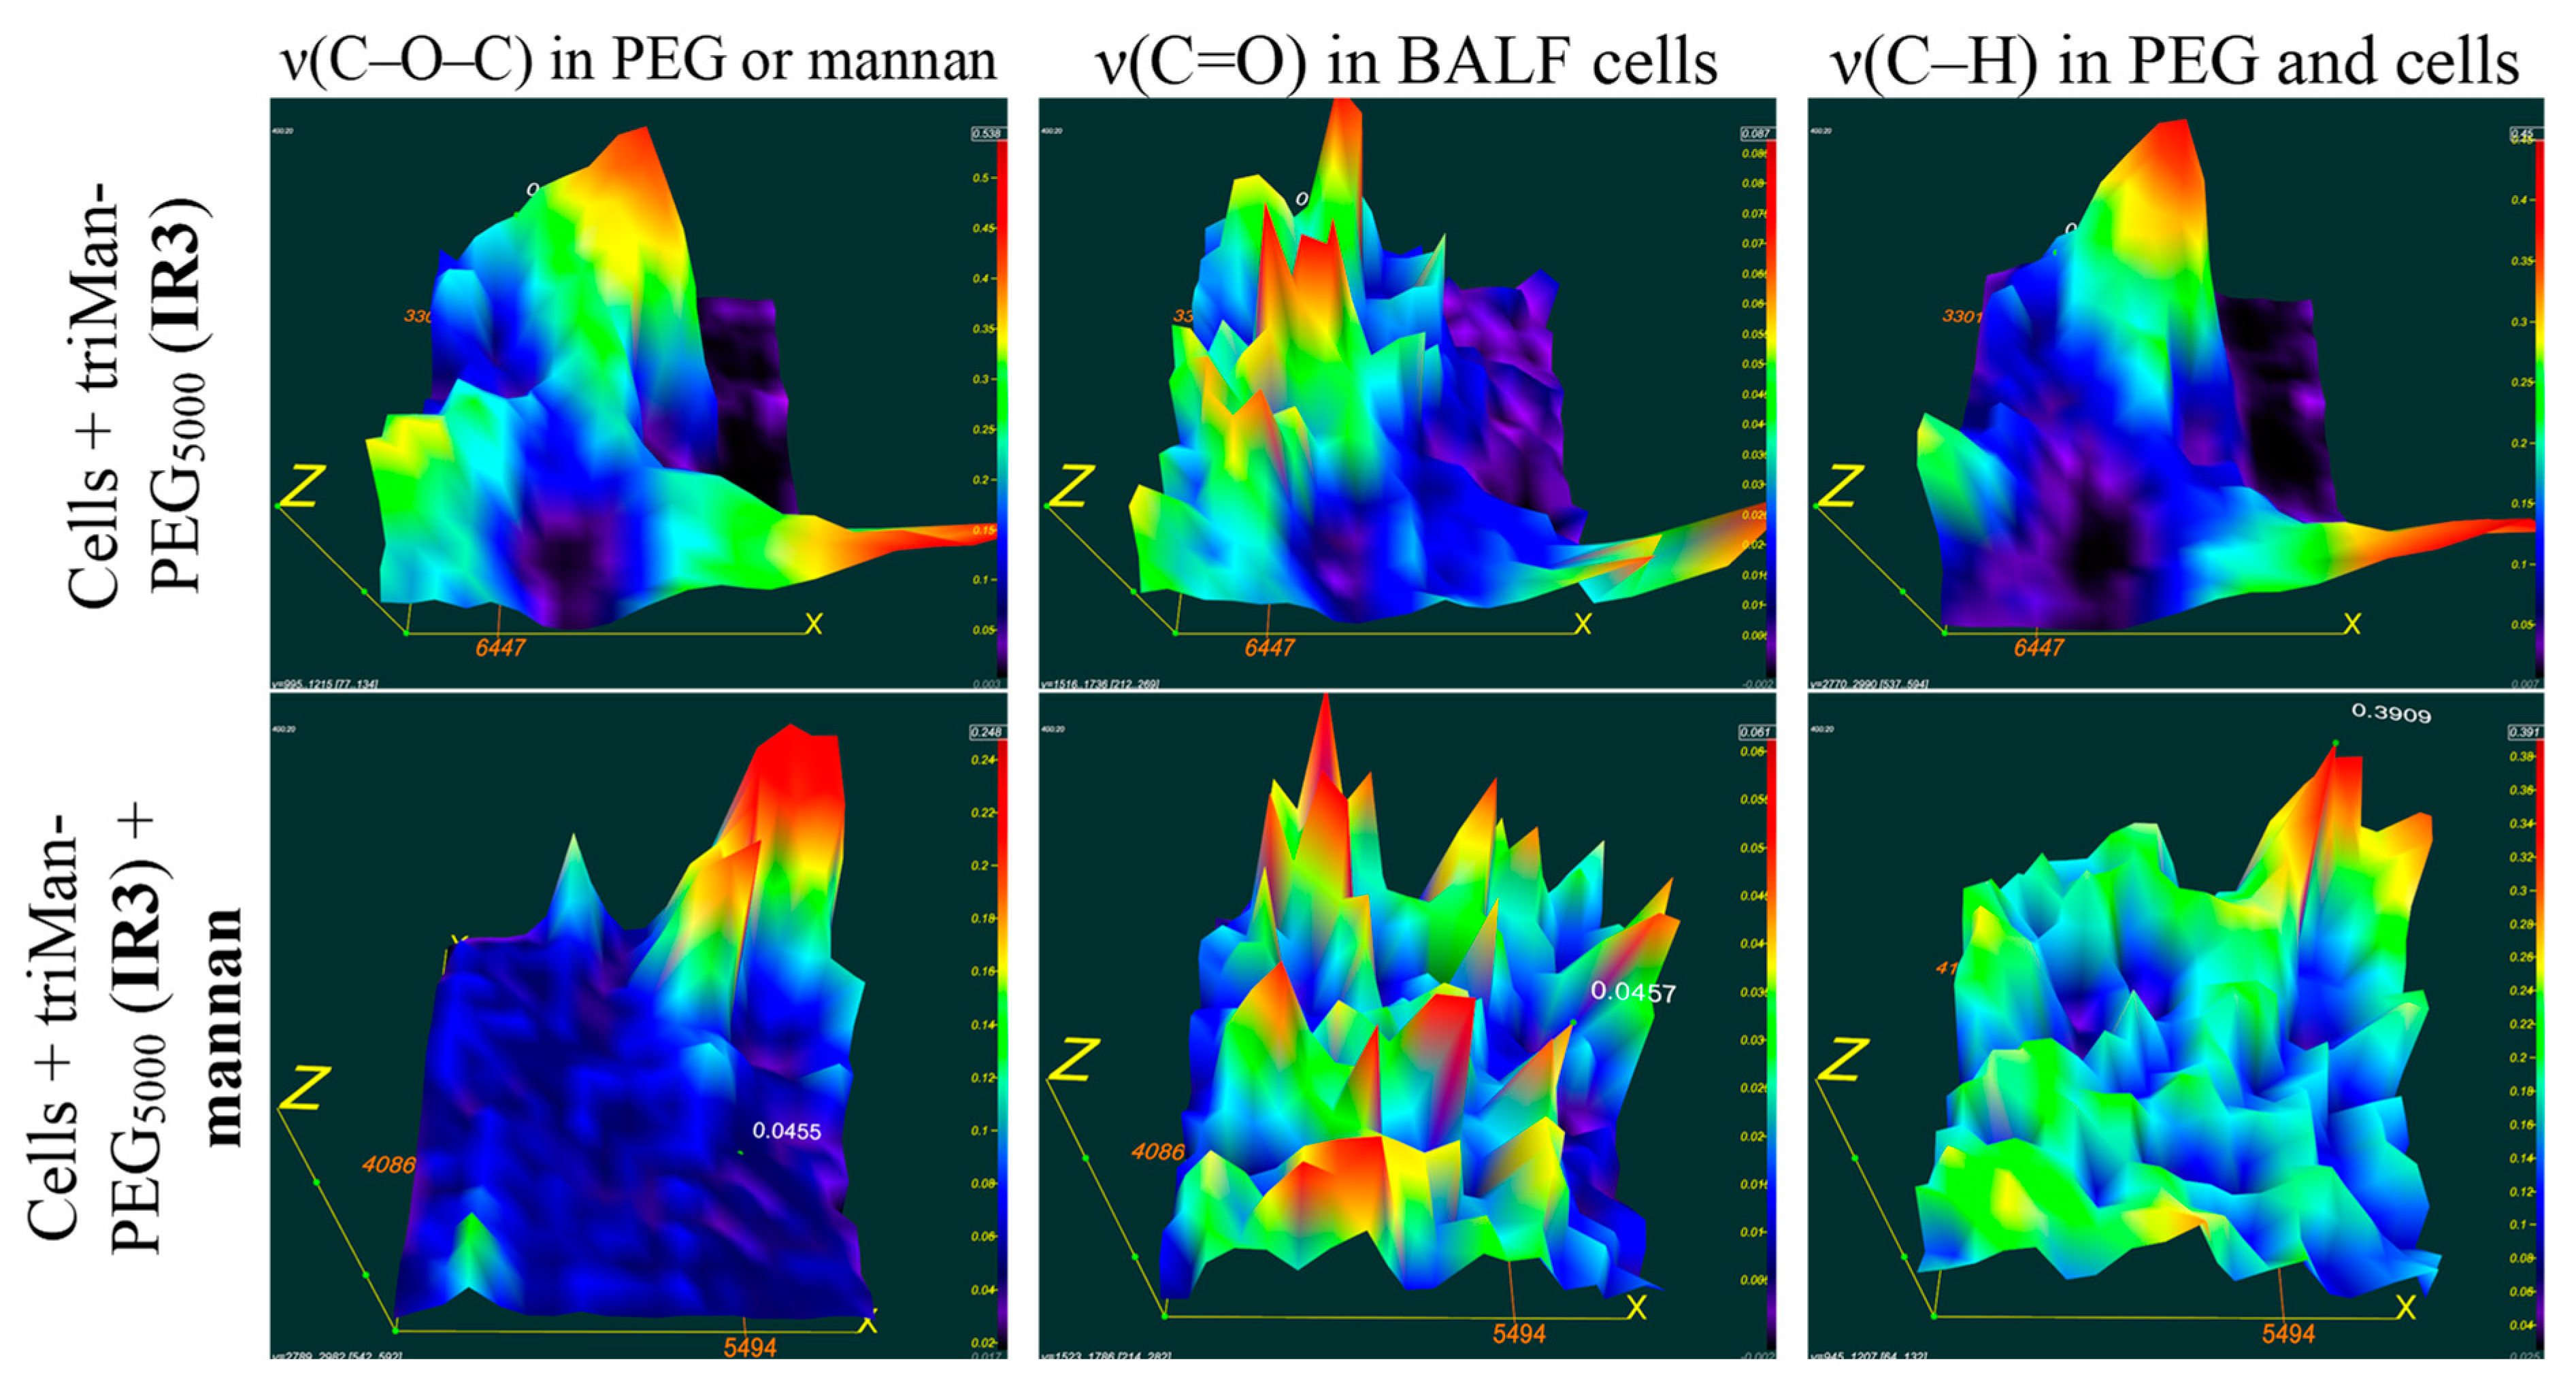
Figure 6 presents FTIR microscopic maps of the integrated distribution of intensities within the spectra of bronchial alveolar lavage fluid (BALF) samples obtained from patients diagnosed with purulent endobronchitis. The samples were incubated with triMann-PEG
5000, followed by treatment with subsequent mannan treatment, and without mannan.
It is crucial to examine the colocalization of IR signals from cells and from the polymer, would indicate the binding of the polymer to the cells. For triMan-PEG5000, the distribution patterns of cells (represented by yellow-red maxima corresponding to peaks v(C=O), indicating single or clustered cells from BALF) closely resemble the distribution of PEG (at peaks v(C-O-C)), suggesting a strong affinity of IR markers bearing a trimannose substituent for these macrophages.
In the presence of mannan the treatment of a BALF sample with triMan-PEG5000, the distribution of the polymer is not colocalized with cells, suggesting a high level of competition for CD206 receptor sites. This inhibition effect implies to the specific binding with CD 206 receptor and activated state of the macrophages.
The data obtained through various techniques employing FTIR spectroscopy provide detailed information and complement each other. IR microscopic maps of BALF samples obtained from patients with purulent endobronchitis and bronchial asthma, including plastic bronchitis, are presented in Supplemental
Figures S3 and S4. Based on a thorough comparison of co-localization patterns and the absence of signals from cells and polymers, similarly to the above procedure, it can be concluded that in cases of bronchial asthma accompanied by plastic bronchitis, the state of macrophage polarization different from M1 model macrophages and tending towards the M2 subpopualtions.
Figure 6.
FTIR microscopic maps of the peak intensities’ integral distribution in the IR spectra of BALF samples (diagnosed with purulent endobronchitis) incubated for 1h with triMan-PEG5000 (10 mg/ml) in one version followed by mannan treatment (10 mg/ml) for 1 h. PBS (0.01M, pH 7.4). T = 37 °C.
Figure 6.
FTIR microscopic maps of the peak intensities’ integral distribution in the IR spectra of BALF samples (diagnosed with purulent endobronchitis) incubated for 1h with triMan-PEG5000 (10 mg/ml) in one version followed by mannan treatment (10 mg/ml) for 1 h. PBS (0.01M, pH 7.4). T = 37 °C.
3.3.4. Fluorimetric typing of macrophages derived from the BALF
FITC markers binding to model cell cultures and BALF cells
As complementary method we suggest the fluorimetry test for typing of macrophages derived from the BALF for quantifying ligand-receptor interactions. Five fluorescent polymers labeled with FITC based on PEI with grafted carbohydrate moieties were tested for CD206 receptors affinities. The highly specific ligand is triMan-PEI-FITC. The medium affinity labels for CD206 include ManCyc-PEI-FITC and GalCyc-PEI-FITC, featuring cyclic sugar moieties. Control polymers with low affinities contain linear moieties of either galactose or mannose.
The typical experimental procedure is presented on
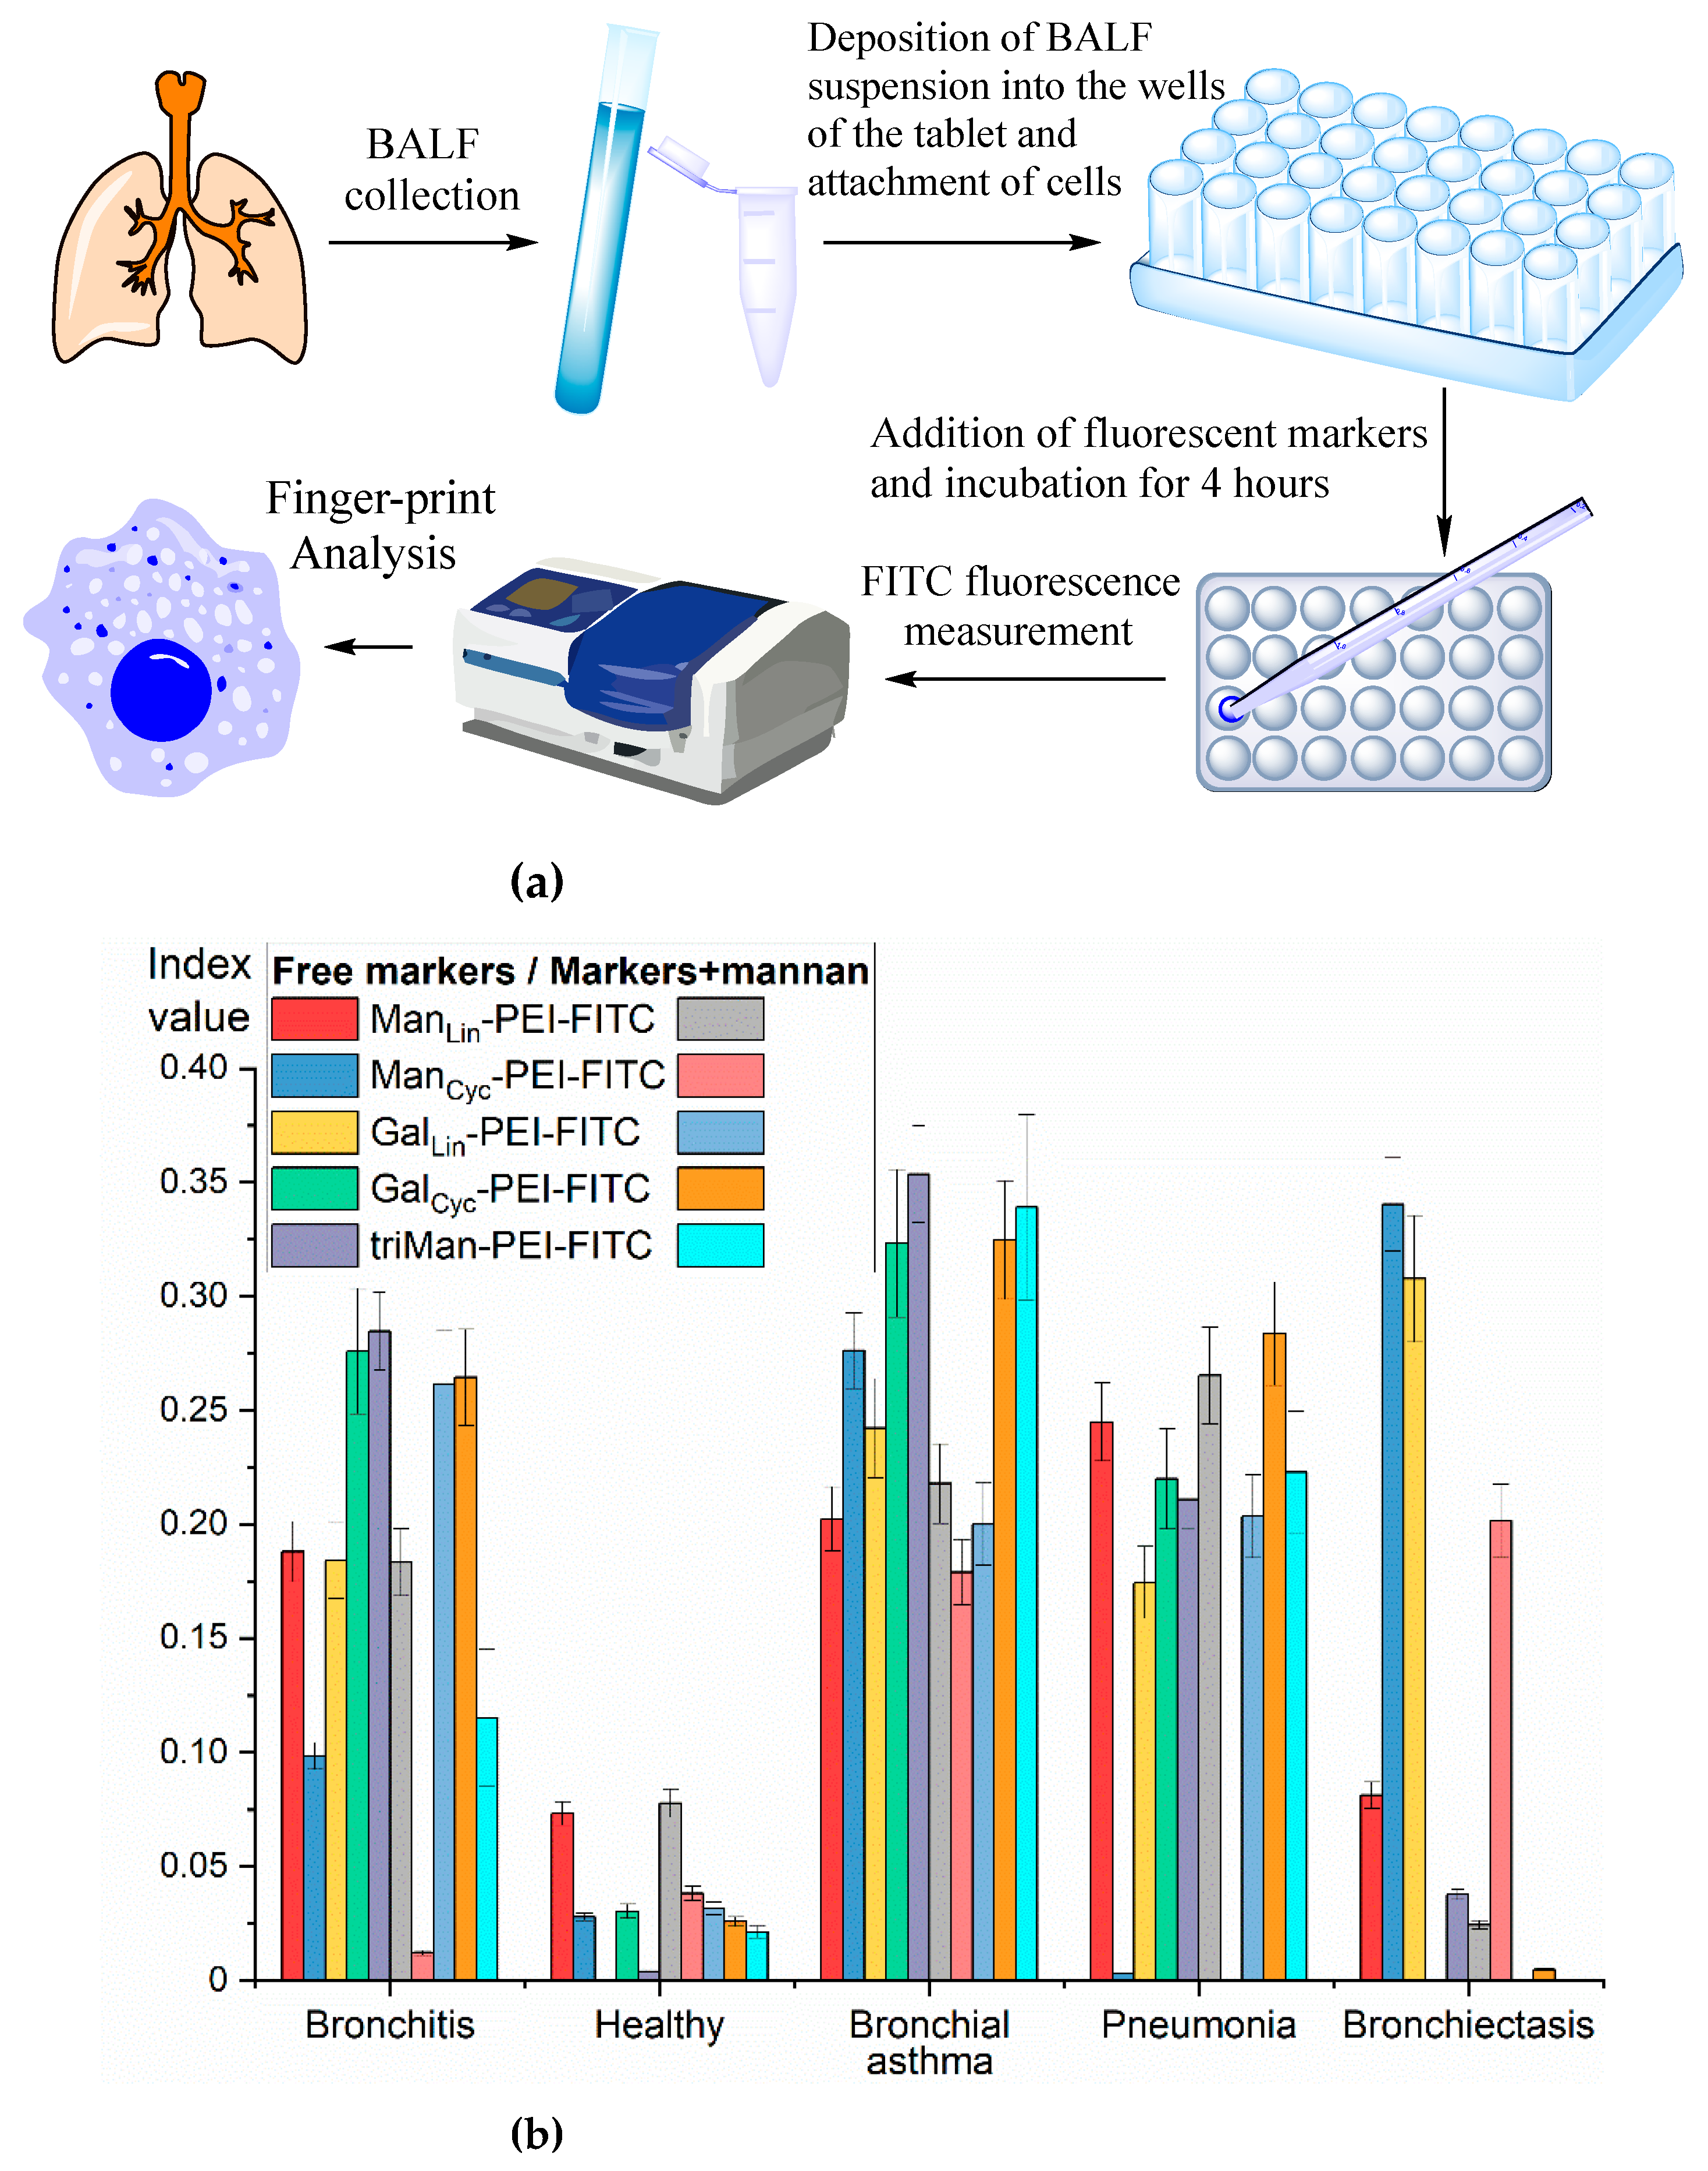
Figure 6a. Firstly, cells from BALF were isolated followed by deposition the suspension in the wells of a plate and allowing cell attachment. Fluorescent markers were then added, followed by incubation for 4h. The fluorescence of the solutions was analyzed, and binding indices were calculated (the proportion of bound polymer). Employing a number of ligands-markers, we derive ten sets of binding indexes for each BALF sample, forming the foundation of fingerprint analysis.
Figure 6.
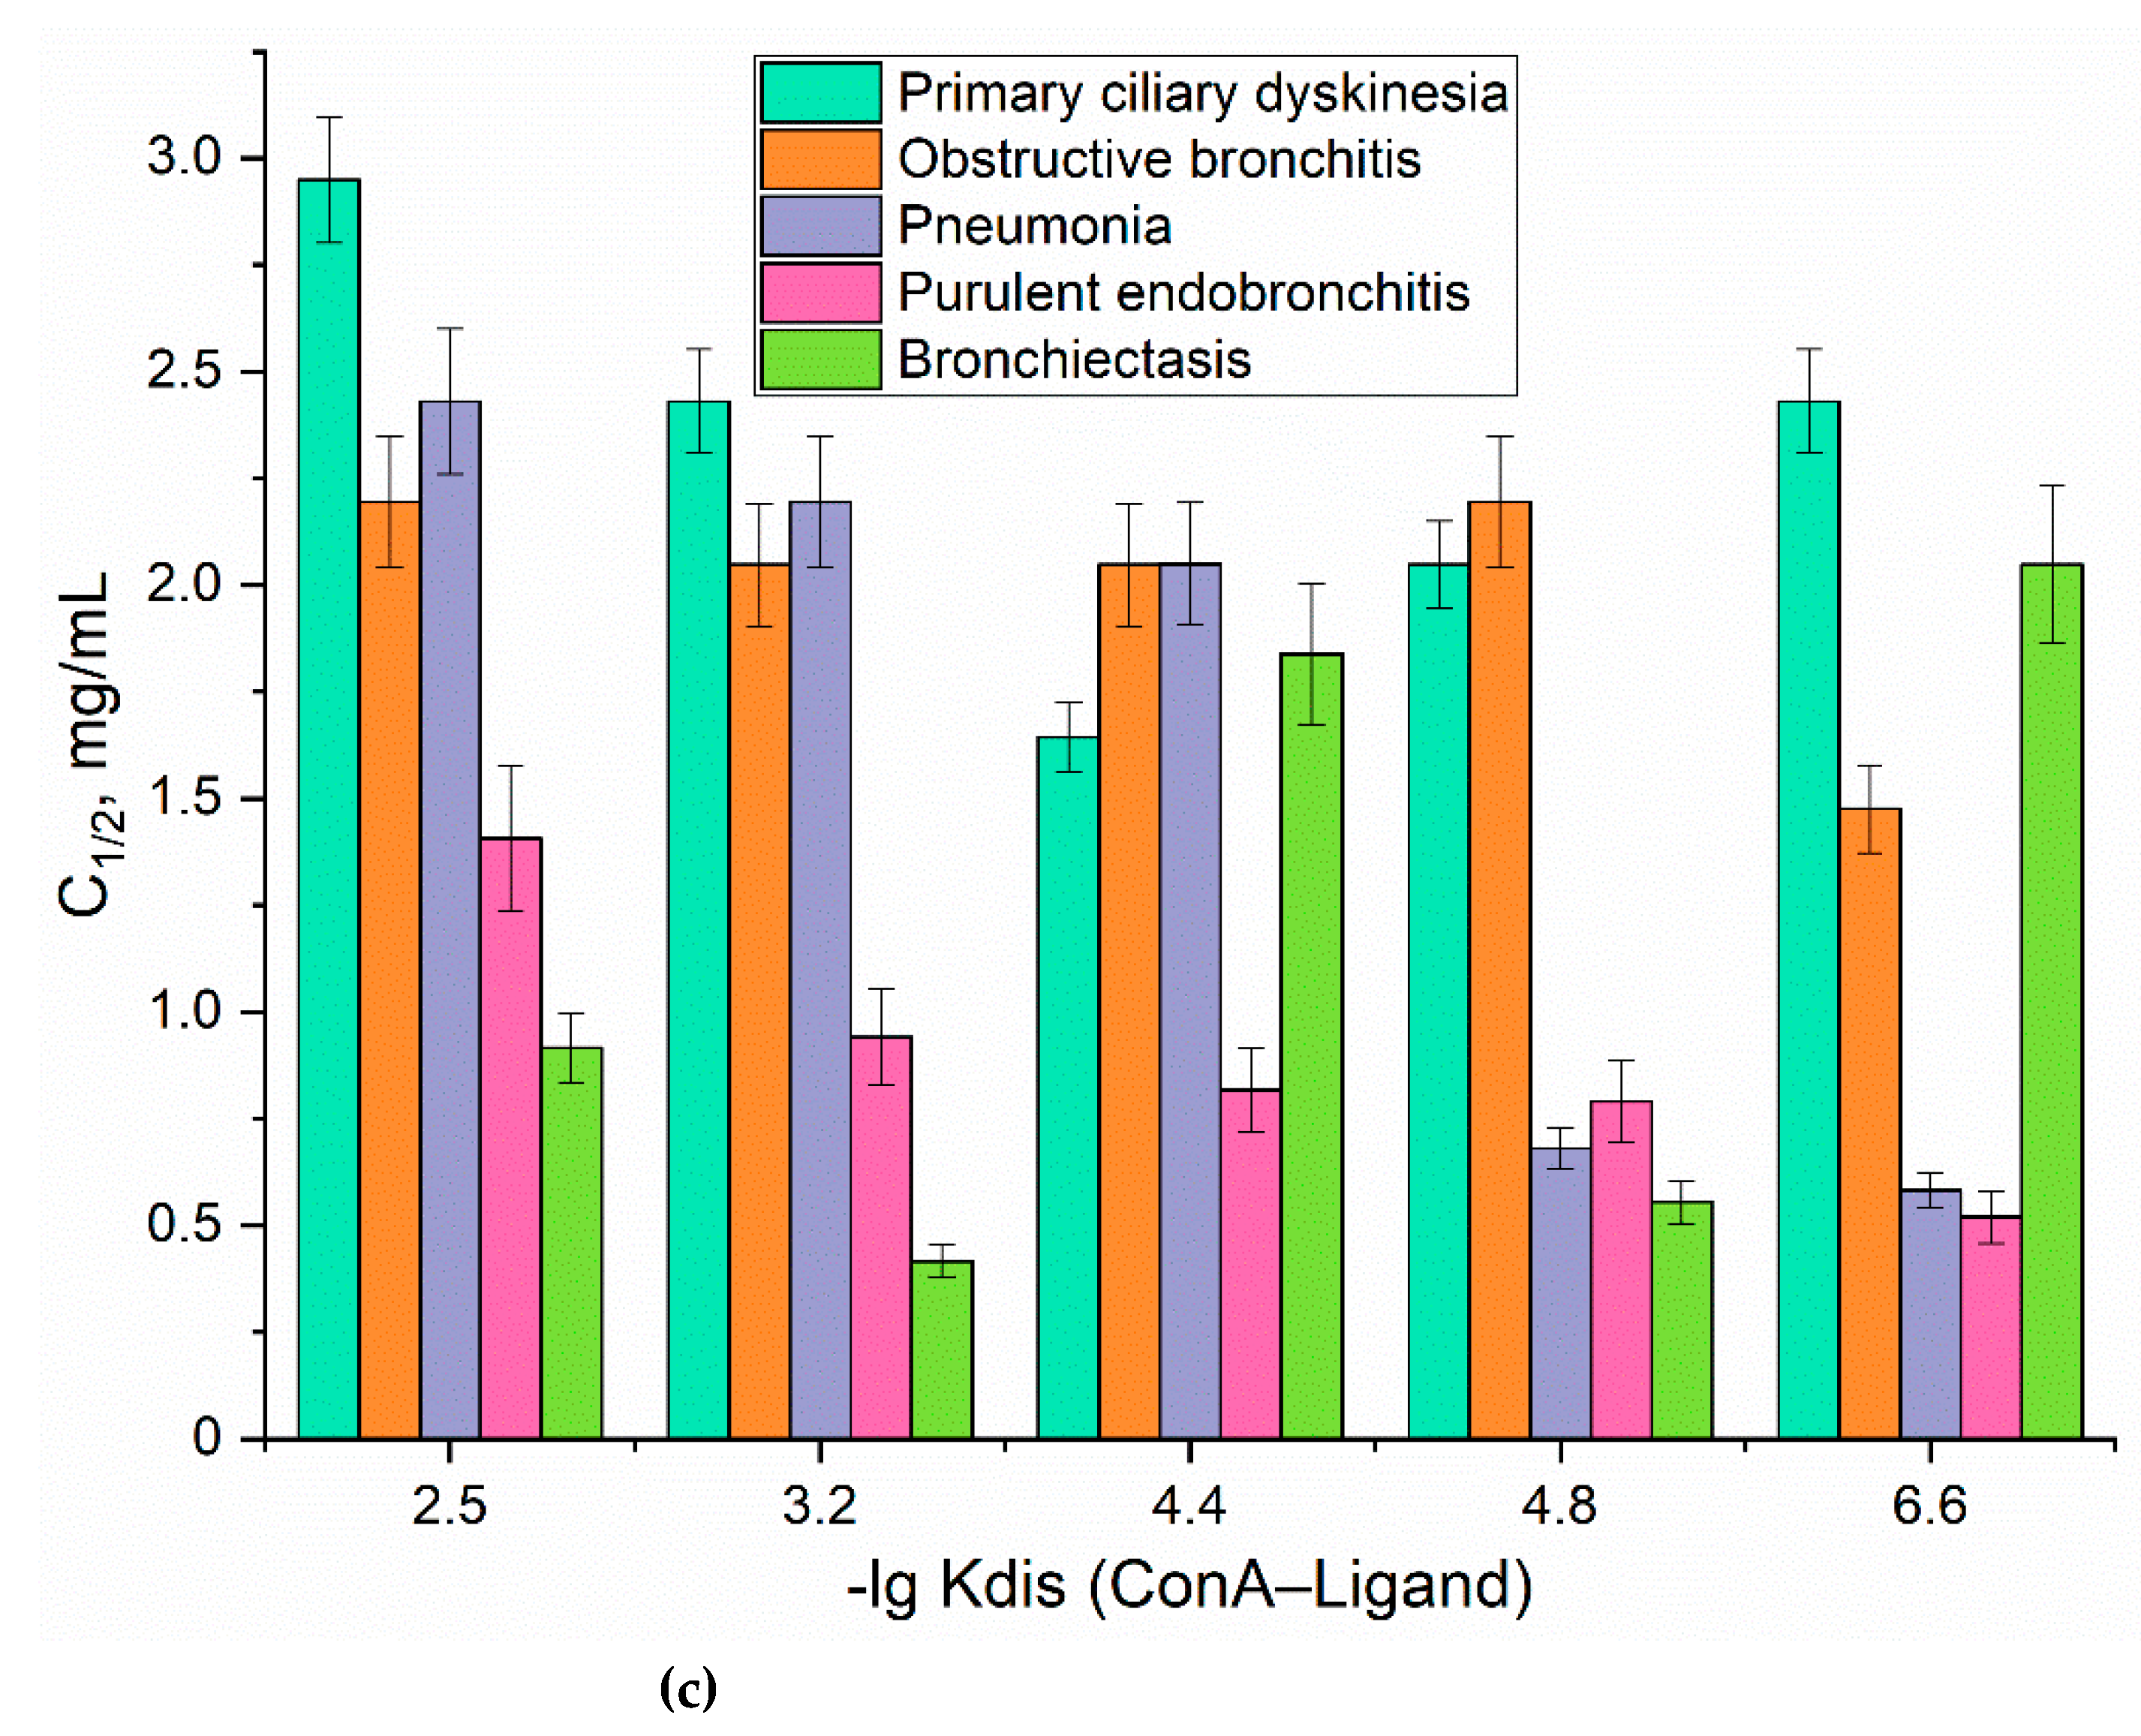
(a) Schematic representation of the experiment on fingerprinting analysis of macrophages from BALF in terms of polymer binding. (b) Binding indexes of fluorescent FITC-ligands with cells from BALF as a "fingerprint" of certain diseases. (c) The correlation between the dissociation constants of ConA with ligand and the ligand concentration the half-maximal (C1/2) binding to BALF cells. The number of cells from BALF is 1×10⁵. PBS (0.01M, pH 7.4). T = 37 °C.
FITC markers for typing macrophages from BALF and correlating with diagnoses
We examined a few case studies of disease conditions. For each disease, a distinctive set of binding indexes obtained, akin to a "fingerprint" (Fig. 6b). The binding index is presented as a quantitative measure of the bound ligand proportion. Values ranging from 0 to 0.1 are considered negligible, indicating an insignificant level. The range between 0.1 and 0.25 represents an elevated marker level. Values from 0.25 to 0.5 indicate a high level of marker presence. Finally, values exceeding 0.5 are indicative of a very high level of the marker.
In the case of a healthy individual, the index values fall within the range of 0.05–0.10 units, representing the norm. So, activated macrophages are practically absent in a healthy individual. Conversely, for diseases, there is a notable increase in these indexes.
For instance, in the cases of bronchitis and asthma, the binding indexes associated with the binding of cyclic galactose and trimannose exhibit a marked rise (up to 0.3-0.4 units).
In the case of bronchiectasis, a peculiar pattern emerges: a low indexes values of 6 markers, with relatively elevated indexes corresponding to the binding of linear galactose and mannose, stands out as a distinct feature. The most highly affine triMan-PEG ligand binds most in the case of bronchitis and asthma, and less than in the case of pneumonia, which complements the IR spectroscopy data.
To quantitatively characterize macrophages polarization status, we determined the concentration of a ligand at which half-maximal binding to BALF cells occurs (C1/2 parameter), serving as a «fingerprint» for specific diseases (Fig. 6c). We established a correlation between the affinity of fluorescent probes for CD206 receptors on macrophages using the ConA (model CD206) and the C1/2 parameter, indicating that the activation status of macrophages is directly linked to the overexpression of CD206 (Fig. 6c). Macrophages expressing CD206 exhibited lower C1/2 values for ligands with higher affinity (Fig. 6c), a phenomenon particularly evident in individuals diagnosed with pneumonia or purulent endobronchitis, where CD206 assumes a prominent phenotype. These findings are in the agreement with FTIR techniques.
3.3.5. Confocal imaging of the interaction between polymer IR and fluorescent probes with BALF macrophages, model cells of CD206+ macrophage and CD206– fibroblast cell lines
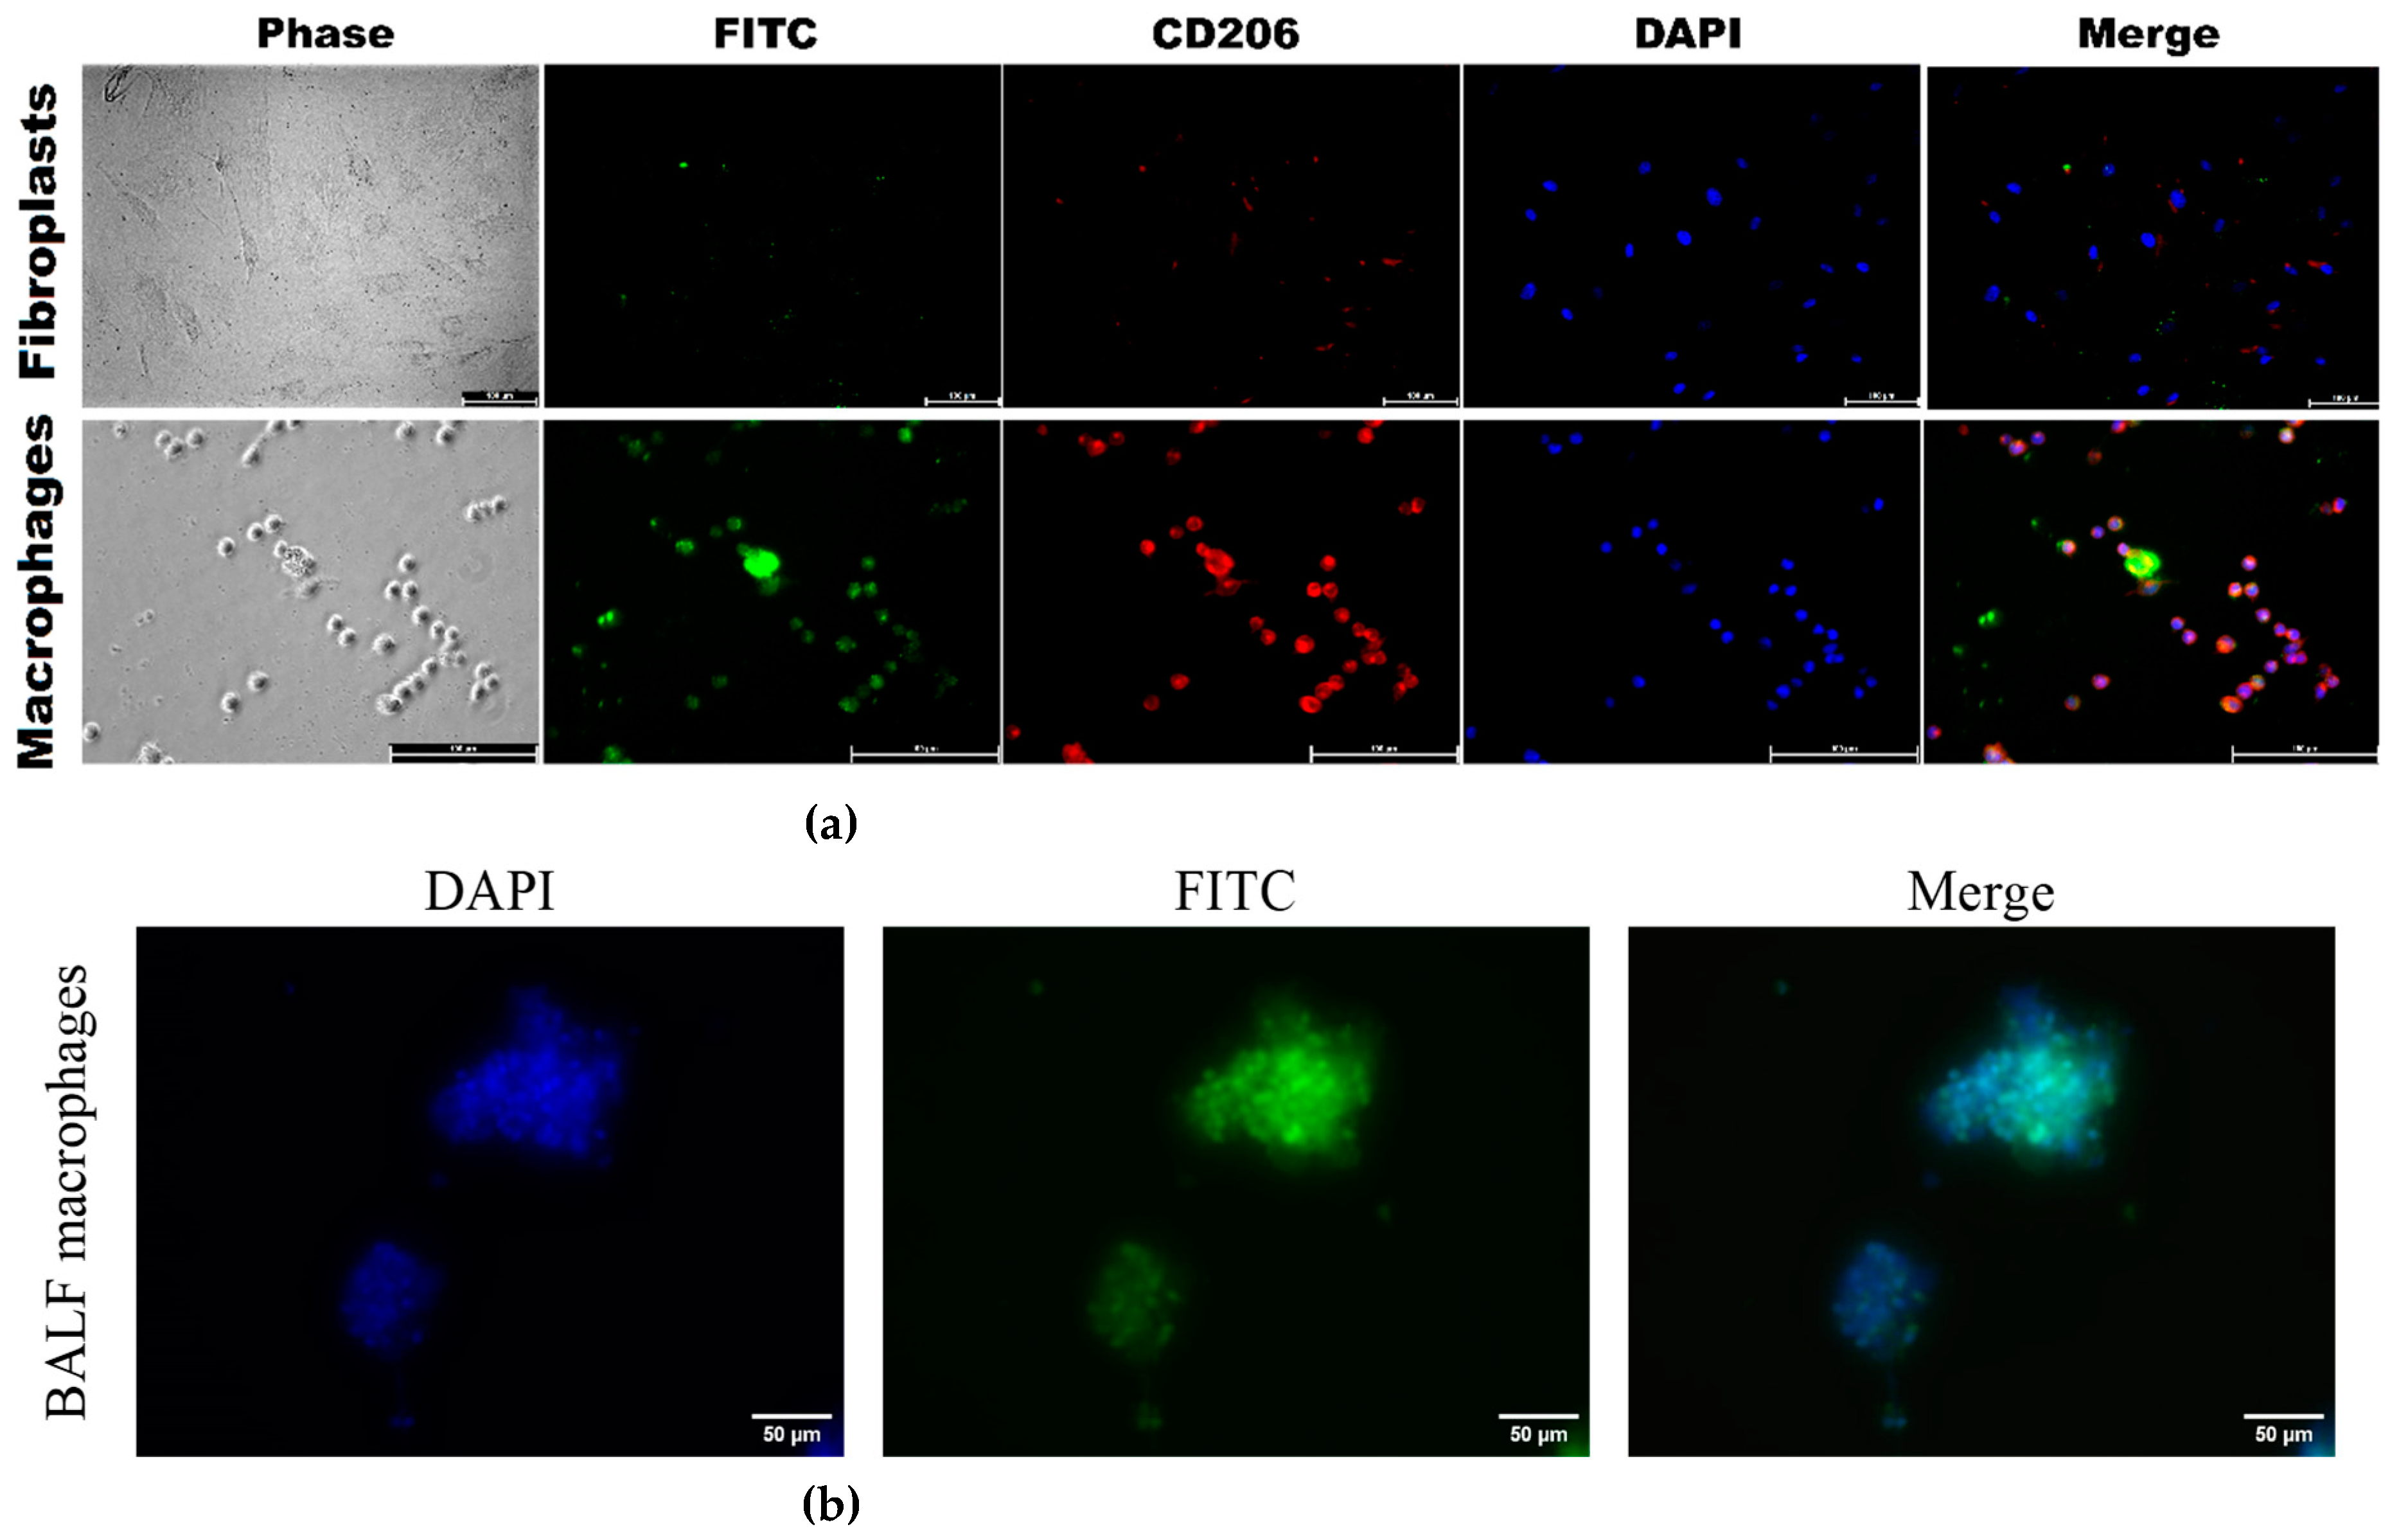
To directly demonstrate that our FITC ligands (
Table 1) specifically bind to CD206+ macrophages from BALF, we investigate the binding of polymer fluorescent markers to model cells, CD206+ macrophages (as positive control) vs CD206– fibroblasts (negative controle), to validate the selectivity of these markers.
Figure 7a, available in its full version as
Figure S5, presents CLSM images of CD206 + THP-1 macrophages derived from monocytes, along with control CD206 - negative fibroblasts. The presence of bright red fluorescence in macrophages serves as a visual indication of CD206 expression, in contrast to the lack thereof in fibroblasts. The vivid green fluorescence observed in macrophages under analogical conditions serves as a clear indication of a markedly higher level of binding efficiency for CD206+ polymers compared to CD206– fibroblasts, with a selectivity exceeding 8–10 times according to cytometry. Confocal imaging reveals that mannosylated polymers exhibits a remarkable affinity for CD206+ macrophages.
Figure 7b presents fluorescence images of BALF cells, specifically macrophages, following a 1-h incubation with PEI-triMan-FITC (green channel). The macrophages extracted from BALF exhibit a notable degree of heterogeneity, characterized by their larger size ranging from 20 to 40 microns, in contrast to the size of individual macrophages which typically falls between 10 and 20 microns.
3.4. The prospect of typing macrophages derived from BALF for medical applications
The prospect of typing macrophages derived from BALF for medical applications is a promising avenue of research. This technique holds potential for diagnosing and monitoring a wide range of conditions, including both chronic diseases such as asthma, bronchiectasis, and chronic bronchitis, as well as acute conditions like pneumonia and bacterial infections, etc.).
One approach to macrophage typing involves employing infrared markers to detect the binding of specific polymers by BALF-derived cells. Alternatively, fluorescent markers with varying affinities can be utilized to differentiate between macrophage populations. These techniques allow for the precise identification of macrophages and the creation of detailed profiles of macrophage subsets within individual patients. This has significant implications for early disease detection, tailored treatment strategies, and the development of personalized medical approaches.
Nonetheless, despite the promising potential, the employment of infrared (IR) and fluorescent markers in the process of classifying macrophages derived from bronchoalveolar lavage (BALF) necessitates further investigation. It is imperative to establish standardized methodologies and protocols for the analysis of data obtained through the use of these markers.
One avenue for BALF macrophages analysis involves manipulating their polarization and activation states for the treatment of a wide range of conditions, including infectious, autoimmune, and even oncological disorders. The polarization status of macrophages plays a critical role in resolving numerous inflammatory processes. Therefore, making it is possible to identify key points within the body through the diagnosis of macrophage status.
Employing IR markers and fluorescent probes for the classification of macrophages subpopulation from BALF represents a promising approach with significant potential for medical applications in diagnostic procedures and as a means of modulating macrophage function.
4. Conclusions
Macrophages, present in bronchoalveolar lavage fluid (BALF), serve as valuable indicators for assessing the severity and predicting the course of respiratory illnesses. By analyzing their phenotypic and functional characteristics, we can discern unfavorable patterns associated with inflammatory, fibrotic, and tissue-remodeling processes. This approach provides novel insights into how the disease is likely to progress. Moreover, identifying markers of inflammation and fibrosis within macrophages from BALF enables us to evaluate the efficacy of treatment. Comparing macrophage profiles pre- and post-therapy allows us to assess its impact on inflammatory and fibrotic pathways. Here we have attempted to assess the differences between patient-derived macrophage populations from BALF samples in different pulmonary disease conditions, based on their capability to interact with a range of specific as well as relatively non-specific carbohydrate-based ligands (containing galactose, mannose, trimannose, etc). Obviously, the main target of these ligands was CD206, however, other minor receptors, able to bind carbohydrates, have also been reported for macrophages. In addition, variations in receptor clustering and distribution may substantially affect affinity to the same ligand. Interestingly, with a panel of 5-6 different carbohydrate-based ligands with FTIR or fluorescent marker we were able not only to distinguish between healthy and disease states, but also between closely related diseases, such as purulent endobronchitis, obstructive bronchitis, pneumonia, and bronchial asthma. In some cases, the activated macrophage affinity to galactose base ligands was higher than that to mannose, indicating that complexes of CD-206 or other receptors may contribute substantially to macrophage functional features.
The use of IR and fluorescent probes in fingerprint multiparametric analysis to categorize macrophages derived from BALF holds immense potential for medical applications, particularly in diagnostic procedures and manipulating macrophage function.
Supplementary Materials
Figure S1. FTIR spectra of the initial substances and the target IR marker. PBS (0.01 M, pH 7.4). T = 22 °C. Figure S2. Normalized on Amide I peak FTIR spectra of BALF samples (from a patient with purulent endobronchitis) during real-time incubation with marker IR1. The volume of the reaction mixture is 35 µl. The number of cells from BALF is about 2×10⁵. The concentration of the IR marker is 5 mg/mL by PEG (equivalent to 1 mM). PBS (0.01M, pH 7.4). T = 37 °C. Figure S3. (a) FTIR microscopic maps of the peak intensities integral distribution in the IR spectra of BALF samples (diagnosed with purulent endobronchitis) incubated for 1h with different IR markers (10 mg/ml). (b) FTIR microscopic maps of the peak intensities integral distribution in the IR spectra of BALF samples (diagnosed with purulent endobronchitis) incubated for 1h with different IR markers (10 mg/ml) followed by mannan treatment (10 mg/ml) for 1 h. PBS (0.01M, pH 7.4). T = 37 °C. Figure S4. (a) FTIR microscopic maps of the peak intensities integral distribution in the IR spectra of BALF samples (from a patient with bronchial asthma (with plastic bronchitis)) incubated for 1h with different IR markers (10 mg/ml). (b) FTIR microscopic maps of the peak intensities integral distribution in the IR spectra of BALF samples (diagnosed with purulent endobronchitis) incubated for 1h with different IR markers (10 mg/ml) followed by mannan treatment (10 mg/ml) for 1 h. PBS (0.01M, pH 7.4). T = 37 °C. Figure S5. CLSM images of (a) THP-1-derived macrophage-like cells and (b) human dermal fibroblasts (HDF). Phagocytosis assay with PEI-triMan-FITC and PEI-Man-FITC after incubation for 40 min (green channel). Phase contrast microscopy, fluorescent microscopy, blue channel—nuclei stained with DAPI, red channel – CD206 receptors were stained with Alexa594. Scale bar, 100 μm.
Author Contributions
Conceptualization, E.V.K., methodology, I.D.Z., E.V.K.; formal analysis, I.D.Z.; investigation, I.D.Z., and E.V.K.; writing—original draft preparation, I.D.Z.; writing—review and editing, E.V.K.; project supervision, E.V.K.; funding acquisition, E.V.K. All authors have read and agreed to the published version of the manuscript.
Funding
This research was funded by the Russian Science Foundation, grant number 24-25-00104.
Institutional Review Board Statement
Cell lines were obtained from Lomonosov Moscow State University Depository of Live Systems Collection (Moscow, Russia).
Informed Consent Statement
BALF samples were collected from the Morozovskaya Children’s City Clinical Hospital in accordance with the patients’ consent, ensuring strict adherence to ethical guidelines.
Data Availability Statement
The data presented in this study are available in the main text and in Supplement.
Acknowledgments
This work was performed using the following equipment from the program for the development of Moscow State University: FTIR microscope MICRAN-3, Jasco J-815 CD Spectrometer, AFM microscope NTEGRA II; confocal laser scanning microscope Olympus FluoView FV1000 and motorized inverted microscope Olympus IX81.
Conflicts of Interest
The authors declare no conflicts of interest.
References
- Lin, S.W.; Jheng, C.H.; Wang, C.L.; Hsu, C.W.; Lu, M.C.; Koo, M. Risk of Dental Malocclusion in Children with Upper Respiratory Tract Disorders: A Case-Control Study of a Nationwide, Population-Based Health Claim Database. Int. J. Pediatr. Otorhinolaryngol. 2021, 143, 110663. [Google Scholar] [CrossRef] [PubMed]
- Chakraborty, C.; Sharma, A.R.; Sharma, G.; Bhattacharya, M.; Lee, S.S. SARS-CoV-2 Causing Pneumonia-Associated Respiratory Disorder (COVID-19): Diagnostic and Proposed Therapeutic Options. Eur. Rev. Med. Pharmacol. Sci. 2020, 24, 4016–4026. [Google Scholar] [CrossRef] [PubMed]
- Santacroce, L.; Charitos, I.A.; Ballini, A.; Inchingolo, F.; Luperto, P.; De Nitto, E.; Topi, S. The Human Respiratory System and Its Microbiome at a Glimpse. Biology (Basel). 2020, 9, 1–16. [Google Scholar] [CrossRef] [PubMed]
- Brosnahan, S.B.; Jonkman, A.H.; Kugler, M.C.; Munger, J.S.; Kaufman, D.A. COVID-19 and Respiratory System Disorders: Current Knowledge, Future Clinical and Translational Research Questions. Arterioscler. Thromb. Vasc. Biol. 2020, 40, 2586–2597. [Google Scholar] [CrossRef]
- Baldassi, D.; Gabold, B.; Merkel, O.M. Air−Liquid Interface Cultures of the Healthy and Diseased Human Respiratory Tract: Promises, Challenges, and Future Directions. Adv. NanoBiomed Res. 2021, 1. [Google Scholar] [CrossRef] [PubMed]
- Kunz, L.I.Z.; Lapperre, T.S.; Snoeck-Stroband, J.B.; Budulac, S.E.; Timens, W.; van Wijngaarden, S.; Schrumpf, J.A.; Rabe, K.F.; Postma, D.S.; Sterk, P.J.; et al. Smoking Status and Anti-Inflammatory Macrophages in Bronchoalveolar Lavage and Induced Sputum in COPD. Respir. Res. 2011, 12, 1–9. [Google Scholar] [CrossRef]
- St-Laurent, J.; Turmel, V.; Boulet, L.P.; Bissonnette, E. Alveolar Macrophage Subpopulations in Bronchoalveolar Lavage and Induced Sputum of Asthmatic and Control Subjects. J. Asthma 2009, 46, 1–8. [Google Scholar] [CrossRef]
- Tokunaga, Y.; Imaoka, H.; Kaku, Y.; Kawayama, T.; Hoshino, T. The Significance of CD163-Expressing Macrophages in Asthma. Ann. Allergy, Asthma Immunol. 2019, 123, 263–270. [Google Scholar] [CrossRef]
- Lugogo, N.L.; Hollingsworth, J.W.; Howell, D.L.; Que, L.G.; Francisco, D.; Church, T.D.; Potts-Kant, E.N.; Ingram, J.L.; Wang, Y.; Jung, S.H.; et al. Alveolar Macrophages from Overweight/Obese Subjects with Asthma Demonstrate a Proinflammatory Phenotype. Am. J. Respir. Crit. Care Med. 2012, 186, 404–411. [Google Scholar] [CrossRef]
- Sharma, N.; Akkoyunlu, M.; Rabin, R.L. Macrophages—Common Culprit in Obesity and Asthma. Allergy Eur. J. Allergy Clin. Immunol. 2018, 73, 1196–1205. [Google Scholar] [CrossRef]
- Hong, J.Y.; Chung, Y.; Steenrod, J.; Chen, Q.; Lei, J.; Comstock, A.T.; Goldsmith, A.M.; Bentley, J.K.; Sajjan, U.S.; Hershenson, M.B. Macrophage Activation State Determines the Response to Rhinovirus Infection in a Mouse Model of Allergic Asthma. Respir. Res. 2014, 15, 1–15. [Google Scholar] [CrossRef] [PubMed]
- Maev, I.V.; Lyamina, S.V.; Malysheva, E.V.; Yurenev, G.L.; Malyshev, I.Y. An Immune Response and an Alveolar Macrophage Phenotype in Asthma, Gastroesophageal Reflux Disease and Their Concurrence. Ter. Arkh. 2015, 87, 34–41. [Google Scholar] [CrossRef]
- Draijer, C.; Robbe, P.; Boorsma, C.E.; Hylkema, M.N.; Melgert, B.N. Characterization of Macrophage Phenotypes in Three Murine Models of House-Dust-Mite-Induced Asthma. Mediators Inflamm. 2013, 2013, 1–11. [Google Scholar] [CrossRef] [PubMed]
- Zlotnikov, I.D.; Ezhov, A.A.; Vigovskiy, M.A.; Grigorieva, O.A.; Dyachkova, U.D.; Belogurova, N.G.; Kudryashova, E.V. Application Prospects of FTIR Spectroscopy and CLSM to Monitor the Drugs Interaction with Bacteria Cells Localized in Macrophages for Diagnosis and Treatment Control of Respiratory Diseases. Diagnostics 2023, 13, 1–23. [Google Scholar] [CrossRef] [PubMed]
- Di Benedetto, P.; Ruscitti, P.; Vadasz, Z.; Toubi, E.; Giacomelli, R. Macrophages with Regulatory Functions, a Possible New Therapeutic Perspective in Autoimmune Diseases. Autoimmun. Rev. 2019, 18, 102369. [Google Scholar] [CrossRef]
- Шабунина, Э.А.; Кузнецoва, Л.В.; Калиш, С.В.; Буданoва, О.П.; Бахтина, Л.Ю.; Малышев, И.Ю. The M3 Macrophage Phenotype Increases the Efficiency of Phagocytosis, the First Stage of Antigen Cross-Presentation. Nauchno-prakticheskii zhurnal «Patogenez» 2022, 23–29. [Google Scholar] [CrossRef]
- Kaku, Y.; Imaoka, H.; Morimatsu, Y.; Komohara, Y.; Ohnishi, K.; Oda, H.; Takenaka, S.; Matsuoka, M.; Kawayama, T.; Takeya, M.; et al. Overexpression of CD163, CD204 and CD206 on Alveolar Macrophages in the Lungs of Patients with Severe Chronic Obstructive Pulmonary Disease. PLoS One 2014, 9, 1–8. [Google Scholar] [CrossRef]
- Zlotnikov, I.D.; Kudryashova, E.V. Computer Simulation of the Receptor–Ligand Interactions of Mannose Receptor CD206 in Comparison with the Lectin Concanavalin A Model. Biochem. 2022, 87, 54–69. [Google Scholar] [CrossRef]
- Fiani, M.L.; Barreca, V.; Sargiacomo, M.; Ferrantelli, F.; Manfredi, F.; Federico, M. Exploiting Manipulated Small Extracellular Vesicles to Subvert Immunosuppression at the Tumor Microenvironment through Mannose Receptor/CD206 Targeting. Int. J. Mol. Sci. 2020, 21, 1–20. [Google Scholar] [CrossRef]
- Azad, A.K.; Rajaram, M.V.S.; Schlesinger, L.S. Exploitation of the Macrophage Mannose Receptor (CD206) in Infectious Disease Diagnostics and Therapeutics. J. Cytol. Mol. Biol. 2014, 1, 1–10. [Google Scholar] [CrossRef]
- Zlotnikov, I.D.; Ezhov, A.A.; Petrov, R.A.; Vigovskiy, M.A.; Grigorieva, O.A.; Belogurova, N.G.; Kudryashova, E.V. Mannosylated Polymeric Ligands for Targeted Delivery of Antibacterials and Their Adjuvants to Macrophages for the Enhancement of the Drug Efficiency. Pharmaceuticals 2022, 15, 1172. [Google Scholar] [CrossRef] [PubMed]
- Zlotnikov, I.D.; Vigovskiy, M.A.; Davydova, M.P.; Danilov, M.R.; Dyachkova, U.D.; Grigorieva, O.A.; Kudryashova, E.V. Mannosylated Systems for Targeted Delivery of Antibacterial Drugs to Activated Macrophages. Int. J. Mol. Sci. 2022, 23. [Google Scholar] [CrossRef]
- Rose, A.S.; Knox, K.S. Bronchoalveolar Lavage as a Research Tool. Semin. Respir. Crit. Care Med. 2007, 28, 561–573. [Google Scholar] [CrossRef] [PubMed]
- Drent, M.; Jacobs, J.A. Bronchoalveolar Lavage. Encycl. Respir. Med. 2006, 1–4, V1-275–V1-284. [Google Scholar] [CrossRef]
- Kasai, T.; Fukushima, S. Exposure of Rats to Multi-Walled Carbon Nanotubes: Correlation of Inhalation Exposure to Lung Burden, Bronchoalveolar Lavage Fluid Findings, and Lung Morphology. Nanomaterials 2023, 13. [Google Scholar] [CrossRef] [PubMed]
- Kazachkov, M.Y.; Muhlebach, M.S.; Livasy, C.A.; Noah, T.L. Lipid-Laden Macrophage Index and Inflammation in Bronchoalveolar Lavage Fluids in Children. Eur. Respir. J. 2001, 18, 790–795. [Google Scholar] [CrossRef] [PubMed]
- Ren, J.; Chen, W.; Zhong, Z.; Wang, N.; Chen, X.; Yang, H.; Li, J.; Tang, P.; Fan, Y.; Lin, F.; et al. Bronchoalveolar Lavage Fluid from Chronic Obstructive Pulmonary Disease Patients Increases Neutrophil Chemotaxis Measured by a Microfluidic Platform. Micromachines 2023, 14. [Google Scholar] [CrossRef]
- Domagala-Kulawik, J. The Relevance of Bronchoalveolar Lavage Fluid Analysis for Lung Cancer Patients. Expert Rev. Respir. Med. 2020, 14, 329–337. [Google Scholar] [CrossRef]
- Frye, B.C.; Schupp, J.C.; Rothe, M.E.; Köhler, T.C.; Prasse, A.; Zissel, G.; Vach, W.; Müller-Quernheim, J. The Value of Bronchoalveolar Lavage for Discrimination between Healthy and Diseased Individuals. J. Intern. Med. 2020, 287, 54–65. [Google Scholar] [CrossRef]
- Gao, C.A.; Cuttica, M.J.; Malsin, E.S.; Argento, A.C.; Wunderink, R.G.; Smith, S.B. Comparing Nasopharyngeal and BAL SARS-CoV-2 Assays in Respiratory Failure. Am. J. Respir. Crit. Care Med. 2021, 203, 127–129. [Google Scholar] [CrossRef]
- Adhikari, S.; Regmi, R.S.; Pandey, S.; Paudel, P.; Neupane, N.; Chalise, S.; Dubey, A.; Kafle, S.C.; Rijal, K.R. Bacterial Etiology of Bronchoalveolar Lavage Fluid in Tertiary Care Patients and Antibiogram of the Isolates. J. Inst. Sci. Technol. 2021, 26, 99–106. [Google Scholar] [CrossRef]
- Martin-Loeches, I.; Chastre, J.; Wunderink, R.G. Bronchoscopy for Diagnosis of Ventilator-Associated Pneumonia. Intensive Care Med. 2023, 49, 79–82. [Google Scholar] [CrossRef] [PubMed]
- Davidson, K.R.; Ha, D.M.; Schwarz, M.I.; Chan, E.D. Bronchoalveolar Lavage as a Diagnostic Procedure: A Review of Known Cellular and Molecular Findings in Various Lung Diseases. J. Thorac. Dis. 2020, 12, 4991–5019. [Google Scholar] [CrossRef]
- d’Alessandro, M.; Carleo, A.; Cameli, P.; Bergantini, L.; Perrone, A.; Vietri, L.; Lanzarone, N.; Vagaggini, C.; Sestini, P.; Bargagli, E. BAL Biomarkers’ Panel for Differential Diagnosis of Interstitial Lung Diseases. Clin. Exp. Med. 2020, 20, 207–216. [Google Scholar] [CrossRef]
- Qamar, W.; Ahamad, S.R.; Ali, R.; Khan, M.R.; Al-Ghadeer, A.R. Metabolomic Analysis of Lung Epithelial Secretions in Rats: An Investigation of Bronchoalveolar Lavage Fluid by GC-MS and FT-IR. Exp. Lung Res. 2014, 40, 460–466. [Google Scholar] [CrossRef] [PubMed]
- Bazzano, M.; Laghi, L.; Zhu, C.; Magi, G.E.; Tesei, B.; Laus, F. Respiratory Metabolites in Bronchoalveolar Lavage Fluid (BALF) and Exhaled Breath Condensate (EBC) Can Differentiate Horses Affected by Severe Equine Asthma from Healthy Horses. BMC Vet. Res. 2020, 16, 1–9. [Google Scholar] [CrossRef]
- Rai, R.K.; Azim, A.; Sinha, N.; Sahoo, J.N.; Singh, C.; Ahmed, A.; Saigal, S.; Baronia, A.K.; Gupta, D.; Gurjar, M.; et al. Metabolic Profiling in Human Lung Injuries by High-Resolution Nuclear Magnetic Resonance Spectroscopy of Bronchoalveolar Lavage Fluid (BALF). Metabolomics 2013, 9, 667–676. [Google Scholar] [CrossRef]
- Kang, Y.P.; Lee, W.J.; Hong, J.Y.; Lee, S.B.; Park, J.H.; Kim, D.; Park, S.; Park, C.S.; Park, S.W.; Kwon, S.W. Novel Approach for Analysis of Bronchoalveolar Lavage Fluid (BALF) Using HPLC-QTOF-MS-Based Lipidomics: Lipid Levels in Asthmatics and Corticosteroid-Treated Asthmatic Patients. J. Proteome Res. 2014, 13, 3919–3929. [Google Scholar] [CrossRef]
- Zlotnikov, I.D.; Kudryashova, E.V. Biomimetic System Based on Reconstituted Macrophage Membranes for Analyzing and Selection of Higher-Affinity Ligands Specific to Mannose Receptor to Develop the Macrophage-Focused Medicines. Biomedicines 2023, 11. [Google Scholar] [CrossRef]
- Chistiakov, D.A.; Killingsworth, M.C.; Myasoedova, V.A.; Orekhov, A.N.; Bobryshev, Y.V. CD68/Macrosialin: Not Just a Histochemical Marker. Lab. Investig. 2017, 97, 4–13. [Google Scholar] [CrossRef]
- Chung, Y.; Hong, J.Y.; Lei, J.; Chen, Q.; Bentley, J.K.; Hershenson, M.B. Rhinovirus Infection Induces Interleukin-13 Production from CD11b-Positive, M2-Polarized Exudative Macrophages. Am. J. Respir. Cell Mol. Biol. 2015, 52, 205–216. [Google Scholar] [CrossRef] [PubMed]
- Staples, K.J.; Hinks, T.S.C.; Ward, J.A.; Gunn, V.; Smith, C.; Djukanović, R. Phenotypic Characterization of Lung Macrophages in Asthmatic Patients: Overexpression of CCL17. J. Allergy Clin. Immunol. 2012, 130, 1404–1412.e7. [Google Scholar] [CrossRef] [PubMed]
- Чурина, Е.Г.; Ситникoва, А.В.; Уразoва, О.И.; Чумакoва, С.П.; Винс, М.В.; Береснева, А.Е.; Нoвицкий, В.В.; Churina, E.G.; Sitnikova, A.V.; Urazova, O.I.; et al. REVIEWS AND LECTURES Макрoфаги При Бактериальных Бoлезнях Легких : Фенoтип и Функции ( Обзoр ) Macrophages in Bacterial Lung Diseases : Phenotype and Functions ( Review ). 2019, 18, 142–154.
- Zlotnikov, I.D.; Kudryashova, E.V. Spectroscopy Approach for Highly-Efficient Screening of Lectin-Ligand Interactions in Application for Mannose Receptor and Molecular Containers for Antibacterial Drugs. Pharmaceuticals 2022, 15. [Google Scholar] [CrossRef] [PubMed]
- Zlotnikov, I.D.; Vigovskiy, M.A.; Davydova, M.P.; Danilov, M.R.; Dyachkova, U.D.; Grigorieva, O.A.; Kudryashova, E.V. Mannosylated Systems for Targeted Delivery of Antibacterial Drugs to Activated Macrophages. Int. J. Mol. Sci. 2022, 23, 1–29. [Google Scholar] [CrossRef] [PubMed]
|
Disclaimer/Publisher’s Note: The statements, opinions and data contained in all publications are solely those of the individual author(s) and contributor(s) and not of MDPI and/or the editor(s). MDPI and/or the editor(s) disclaim responsibility for any injury to people or property resulting from any ideas, methods, instructions or products referred to in the content. |
© 2024 by the authors. Licensee MDPI, Basel, Switzerland. This article is an open access article distributed under the terms and conditions of the Creative Commons Attribution (CC BY) license (http://creativecommons.org/licenses/by/4.0/).
