1. Introduction
In the era of big data, the fields of genomics and medical research are experiencing a transformative shift thanks to the advent of machine learning techniques. Among the most critical applications of these techniques is the analysis of gene expression data for cancer research. Gene expression data, which captures the activity levels of thousands of genes across various conditions or tissues, holds the key to understanding the complex biological mechanisms underlying cancer development and progression. This understanding is essential not only for diagnosing and predicting the onset of cancer but also for identifying potential therapeutic targets.
One of the significant challenges in utilizing gene expression data effectively is its high dimensionality, which can obscure meaningful biological insights when not handled correctly. Techniques such as Principal Component Analysis (PCA) and t-distributed Stochastic Neighbor Embedding (t-SNE) have been pivotal in reducing this complexity by transforming the high-dimensional data into lower-dimensional spaces that are more interpretable while preserving critical information. These dimensionality reduction techniques not only facilitate a clearer visualization of the data but also enhance the performance of predictive models by eliminating irrelevant features.
Cancer research is complicated by disease heterogeneity, with subtypes and stages differing significantly in genetic expression. Advanced machine learning models like XGBoost excel in multi-class classification, leveraging gene expression data to distinguish cancer types and stages, driving precision medicine. The GSE45827 dataset from CuMiDa, featuring 151 samples across six classes and 54,676 genes, exemplifies this potential.
This thesis analyzes the GSE45827 dataset using PCA and t-SNE for preprocessing and XGBoost for classification. It aims to predict disease risk and identify key biomarkers essential for breast cancer diagnosis and treatment. By integrating dimensionality reduction with advanced machine learning, the study contributes to enhancing the accuracy and efficacy of cancer diagnosis and advancing medical research.
2. Literature Review
Recent studies highlight the effectiveness of XGBoost in cancer classification and gene expression analysis. Zelli et al [
1]. demonstrated its superiority in distinguishing tumor types through genomic variance, while Hoque et al [2[. reported strong precision and recall in breast cancer classification. These findings emphasize XGBoost’s robustness and accuracy in handling high-dimensional genomic data, making it a preferred tool for cancer diagnosis.
Dimensionality reduction techniques like PCA are crucial for genomic datasets. Song et al [
3]. highlighted PCA’s ability to reduce dimensionality while preserving key data, and Laghmati et al [
4]. demonstrated its role in enhancing breast cancer prediction models. PCA simplifies complex data, benefiting models like XGBoost.
Feature selection further improves classification performance. Sharma and Mishra emphasized its impact on diagnostic accuracy, while Nguyen et al. showed combining feature selection with ensemble methods enhances stability and accuracy [
5]. Nguyen et al. explored ensemble voting and feature selection techniques in breast cancer prediction, revealing that a combination of methods can lead to more accurate and stable predictions [
6].
Additionally, XGBoost's application is not limited to cancer. Song et al. utilized XGBoost in mining diagnostic markers for COVID-19, demonstrating its versatility in healthcare [
7]. This further reinforces its potential in identifying critical biomarkers in diverse diseases, including cancer. Meanwhile, Liew et al. focused specifically on XGBoost-based algorithms for breast cancer, corroborating its effectiveness in classification tasks with complex, high-dimensional data [
8].
Other researchers have explored multi-omics data integration. Meng et al. examined dimension reduction techniques for multi-omics data, stressing the importance of PCA and other methods for extracting meaningful insights from large datasets [
9]. Zhang et al. discussed the discovery of multi-dimensional modules through integrative analysis of cancer genomic data, further highlighting the potential of combining PCA with machine learning to uncover new patterns in cancer research [
10].
Chiu et al [
11]. highlighted XGBoost’s effectiveness in prostate cancer diagnosis, suggesting its applicability across cancer types. Combined with dimensionality reduction (PCA) and multi-omics approaches, XGBoost consistently improves cancer classification accuracy. These findings support further exploration of XGBoost in breast cancer gene expression analysis and multi-class, multi-omics data integration.
3. Data and Methods
3.1. Data Introduction
The GSE45827 dataset from CuMiDa focuses on breast cancer gene expression, featuring 151 samples across six classes and 54,676 genes. CuMiDa provides uniformly preprocessed, standardized datasets drawn from GEO, ensuring reliability for machine learning applications. Its quality control measures, including sample assessment, probe removal, and normalization, make it a robust resource for cancer research.
The GSE45827 dataset is a valuable resource for breast cancer research, offering homogeneously preprocessed data suitable for machine learning applications. It supports model fine-tuning and exploratory analysis with tools like PCA and t-SNE, aiding interpretation. Its comprehensive gene coverage and rigorous preprocessing from CuMiDa provide a strong foundation for developing predictive models and identifying key biomarkers.
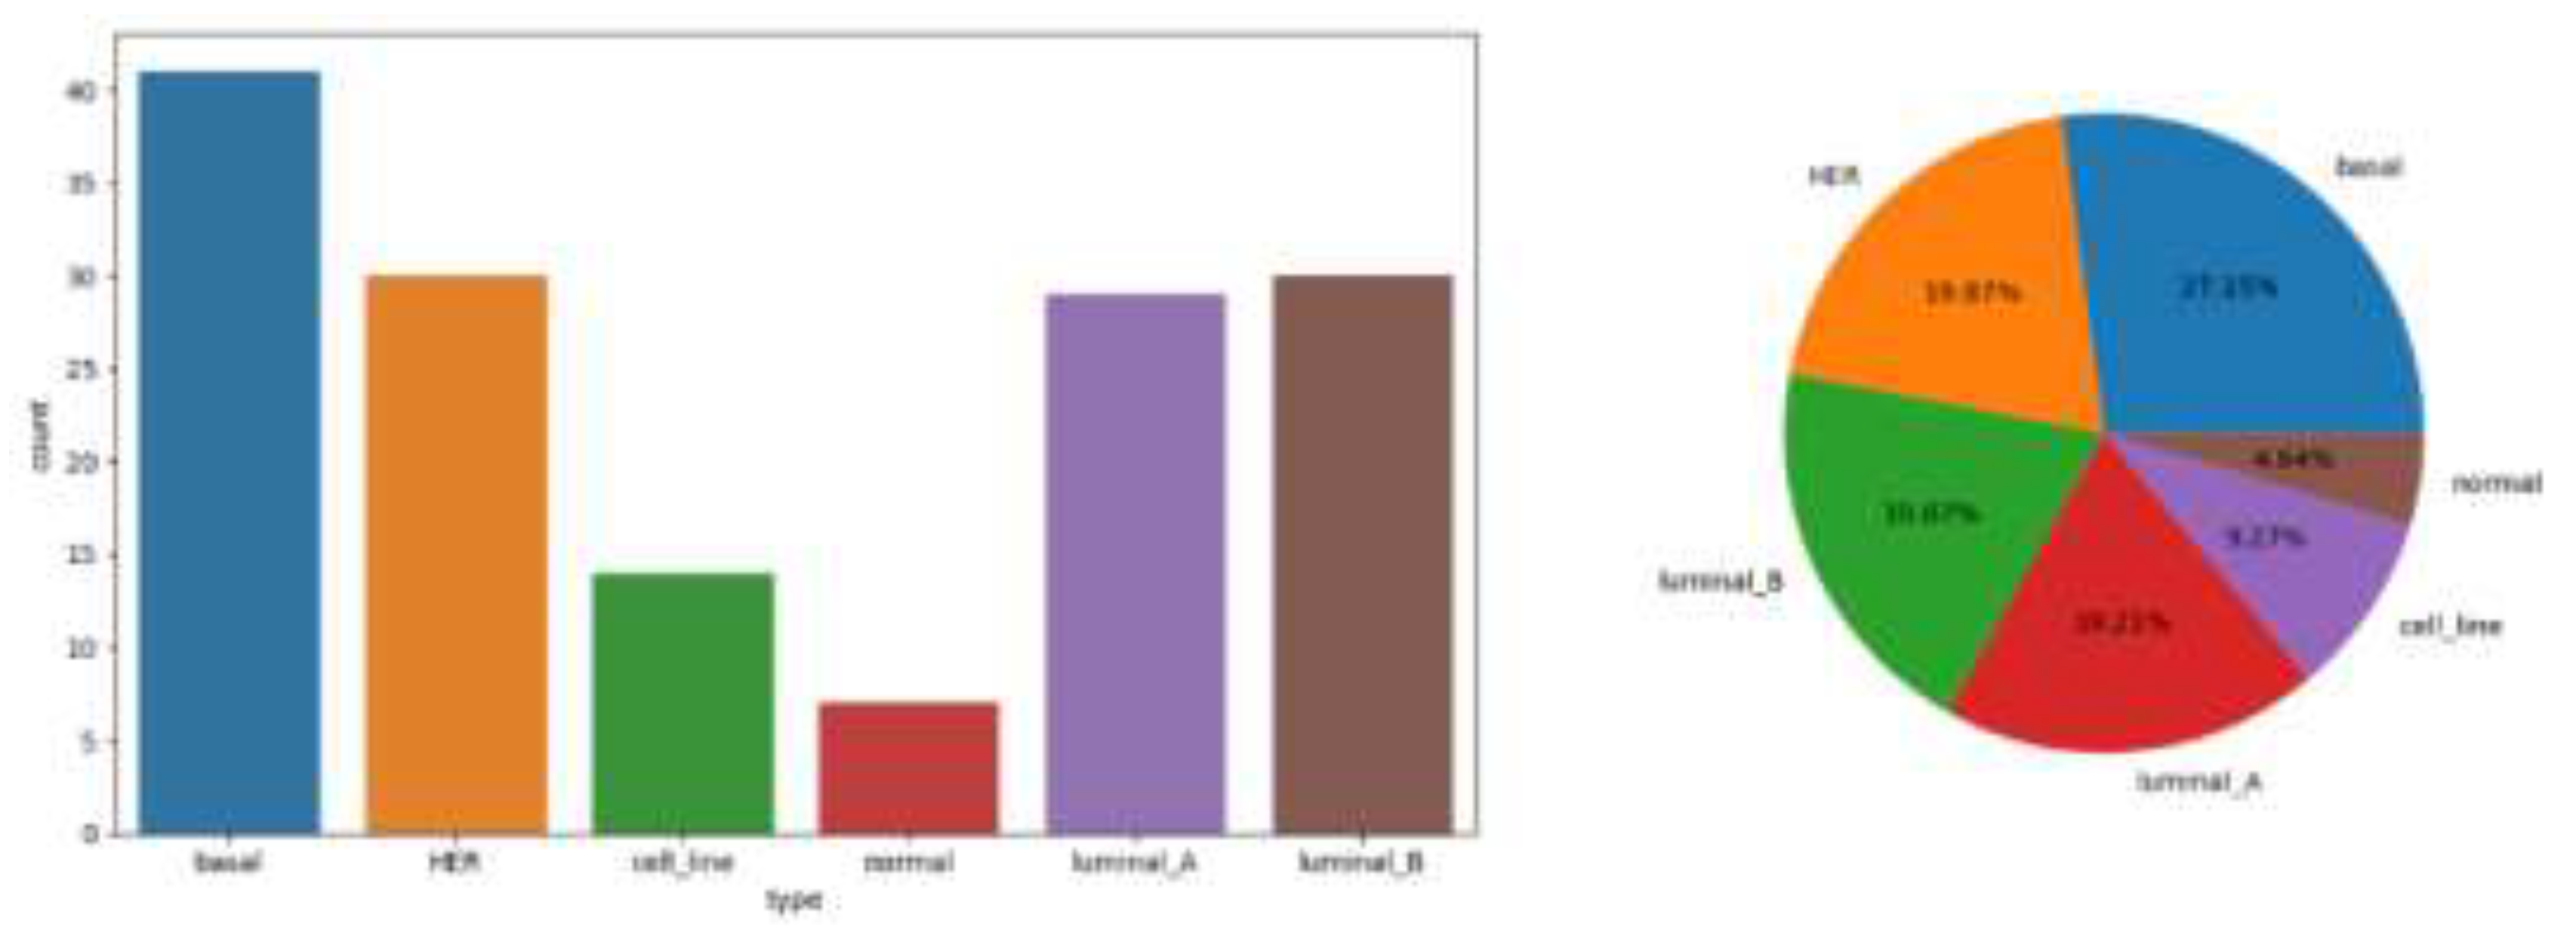
Figure 1.
Statistical chart of explained variable distribution.
Figure 1.
Statistical chart of explained variable distribution.
3.2. T-Distributed Stochastic Neighbor Embedding
T-SNE is a powerful tool for visualizing high-dimensional data by clustering similar points and separating dissimilar ones. It calculates similarity using Gaussian joint probability in high-dimensional space and reconstructs it in low-dimensional space using a T distribution. Ideal for exploratory analysis, T-SNE reveals data structures and relationships, making it effective for complex multi-class datasets.
The goal of t-SNE is to minimize Kullback-Leibler (KL) divergence:
3.3. Principal Component Analysis
Principal component analysis (PCA) is a statistical technique, which is used to transform data from possibly highly correlated variables into a set of variables with fewer values through linear transformation. These variables are called principal components. The principle of PCA is to find the direction with the largest variance in data, and then use it as first principal component. Next, the direction orthogonal to first principal component (i.e. uncorrelated) with the largest variance is found as the second principal component, and so on. As a new axis, these principal components can simplify the data structure with the least loss of information, and are often used for data compression and preprocessing.
3.4. Extreme Gradient Boosting
XGBoost is an optimized distributed gradient lifting library, which is designed to realize machine learning algorithm efficiently, flexibly and portable. Although it was originally designed for binary classification problems, XGBoost can also be used for multi-classification problems. In the setting of multi-classification, XGBoost uses the softmax function to extend the output to multiple categories and predict the categories. It uses the gradient lifting framework and adds a new weak prediction model (such as decision tree) in each step to try to correct the prediction error of the previous step. In this way, XGBoost gradually improves the accuracy of its prediction. The advantages of XGBoost include processing various types of data, automatically processing missing values, supporting regularization to prevent over-fitting, and high customization performance and optimization ability.
The objective function of XGBoost includes loss function and regularization term:
The objective function of XGBoost includes loss function and regularization term:
4. Model Analysis
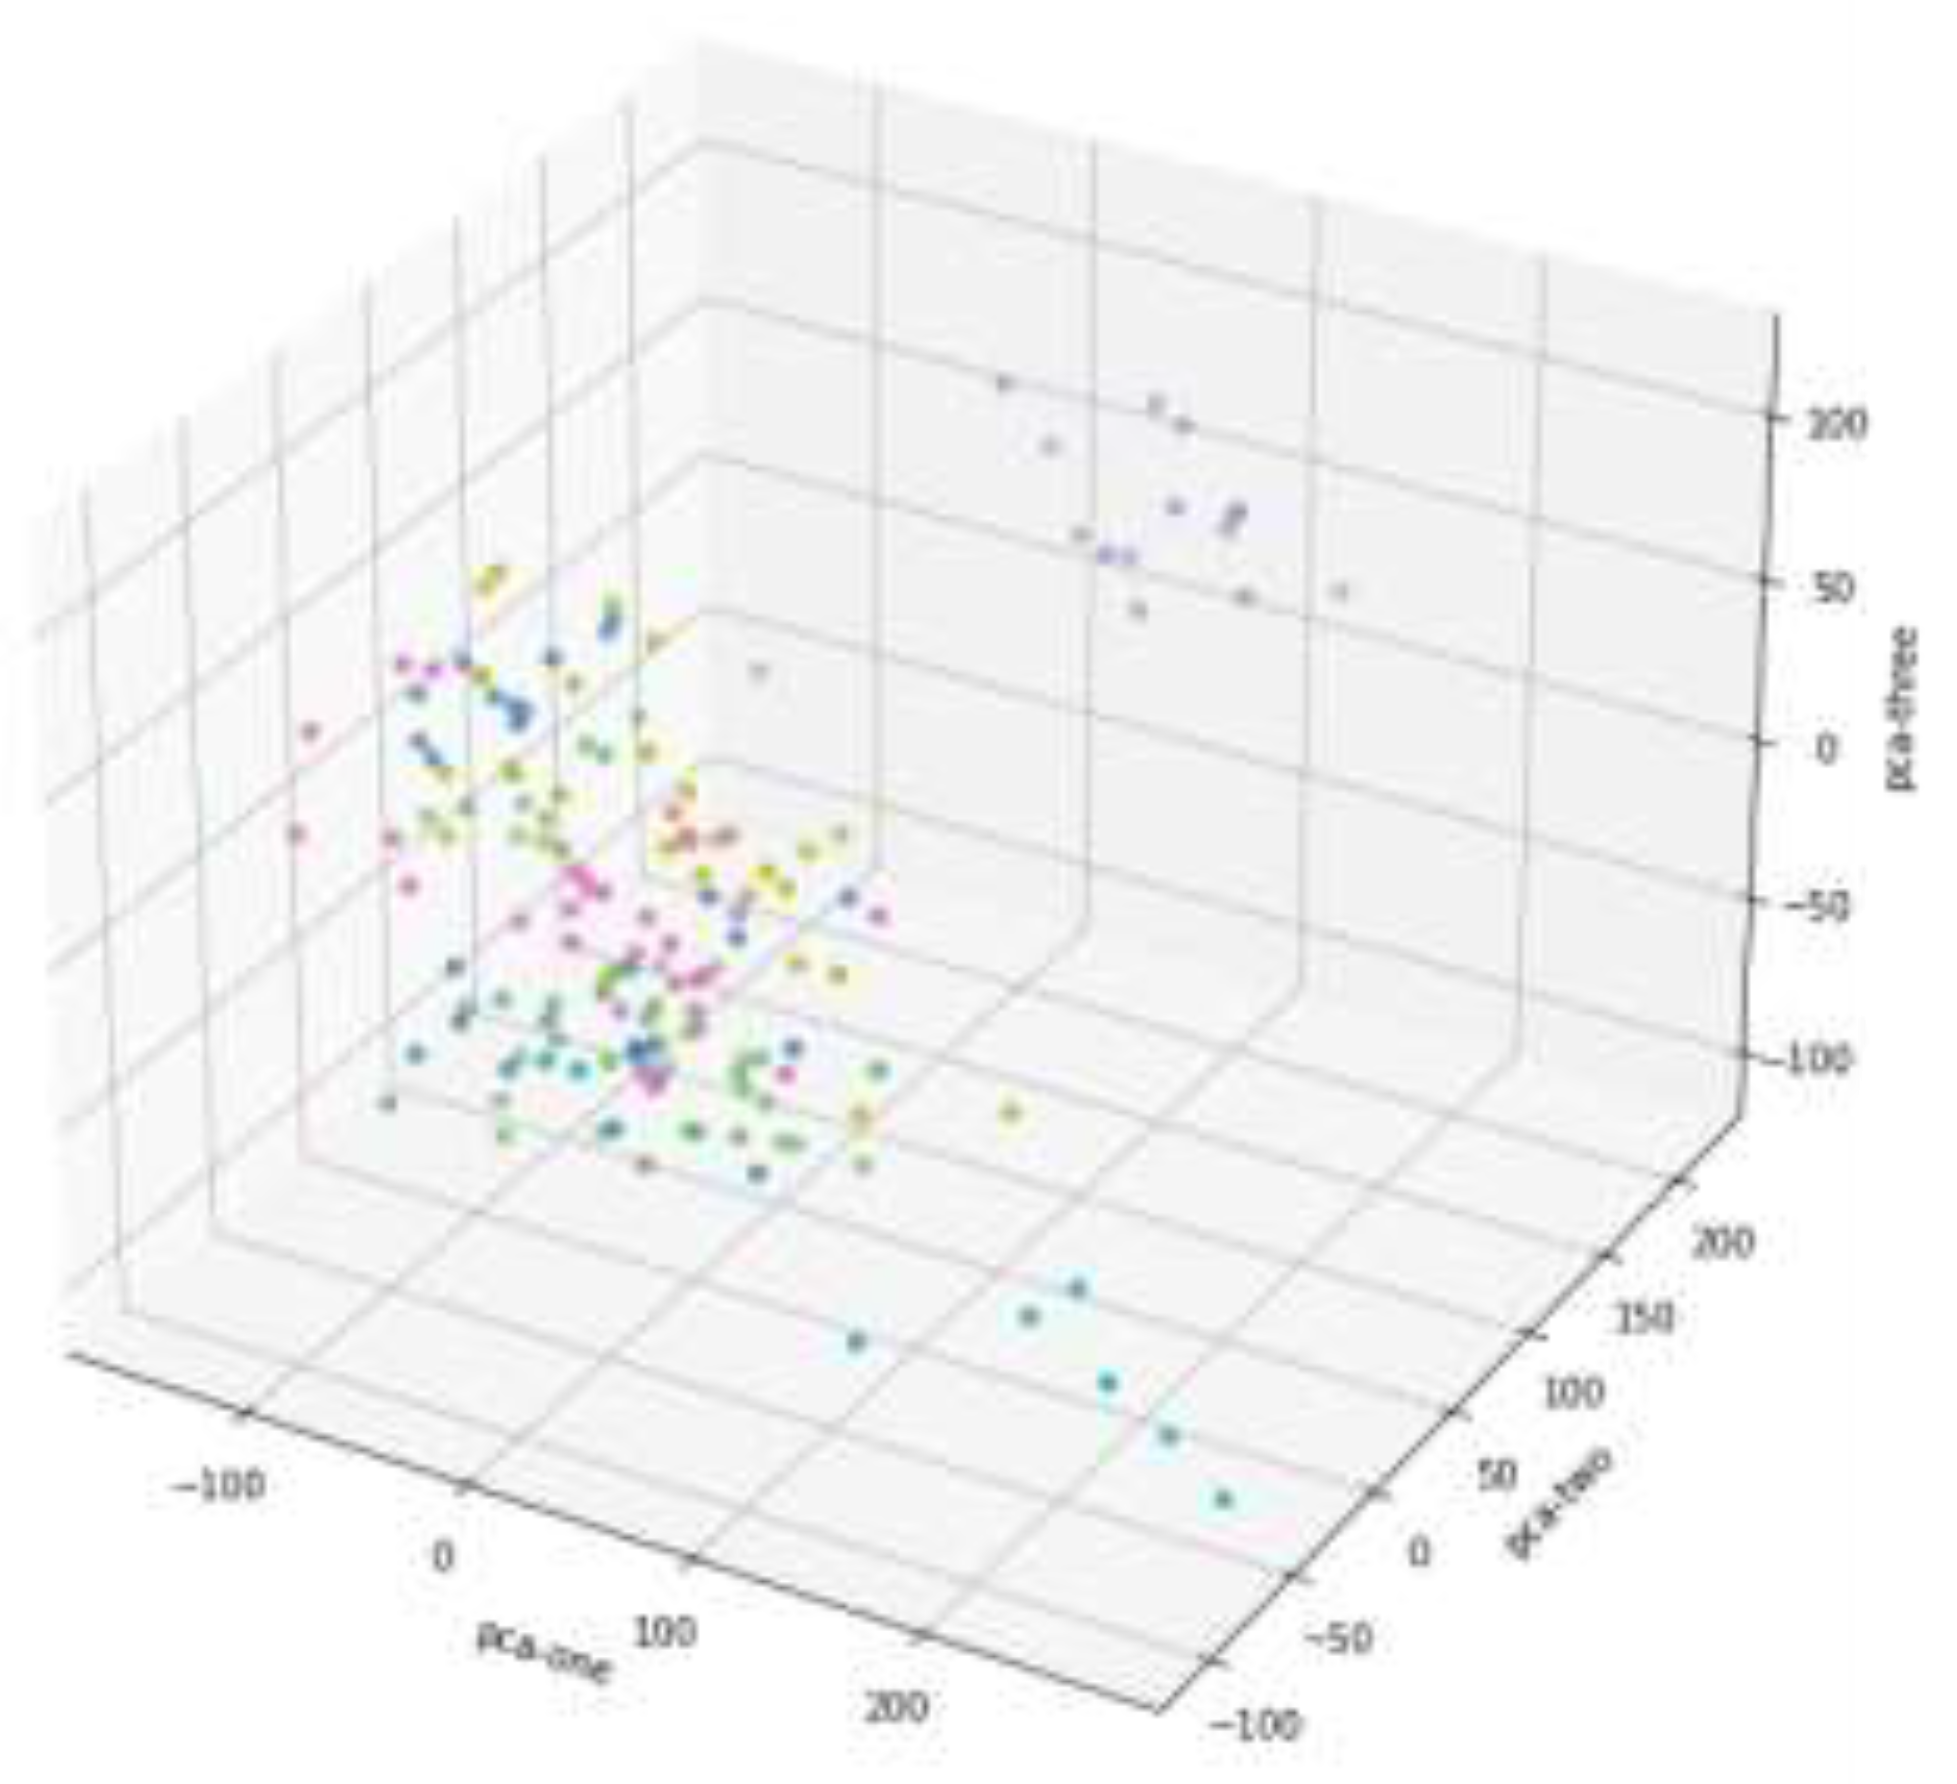
Figure 2 represents high-dimensional data projected onto three principal components in 3D space, condensing information while retaining key features. The colored dots indicate classified or grouped data, with closely clustered points suggesting similar categories and scattered points showing diversity. Points near the origin highlight strong similarity, while outliers are evident in isolated positions. Among the components, PCA-one and PCA-three exhibit larger variation, suggesting they retain more significant information compared to PCA-two. This 3D scatter plot visualizes the data structure post-PCA, aiding in identifying clusters and outliers.
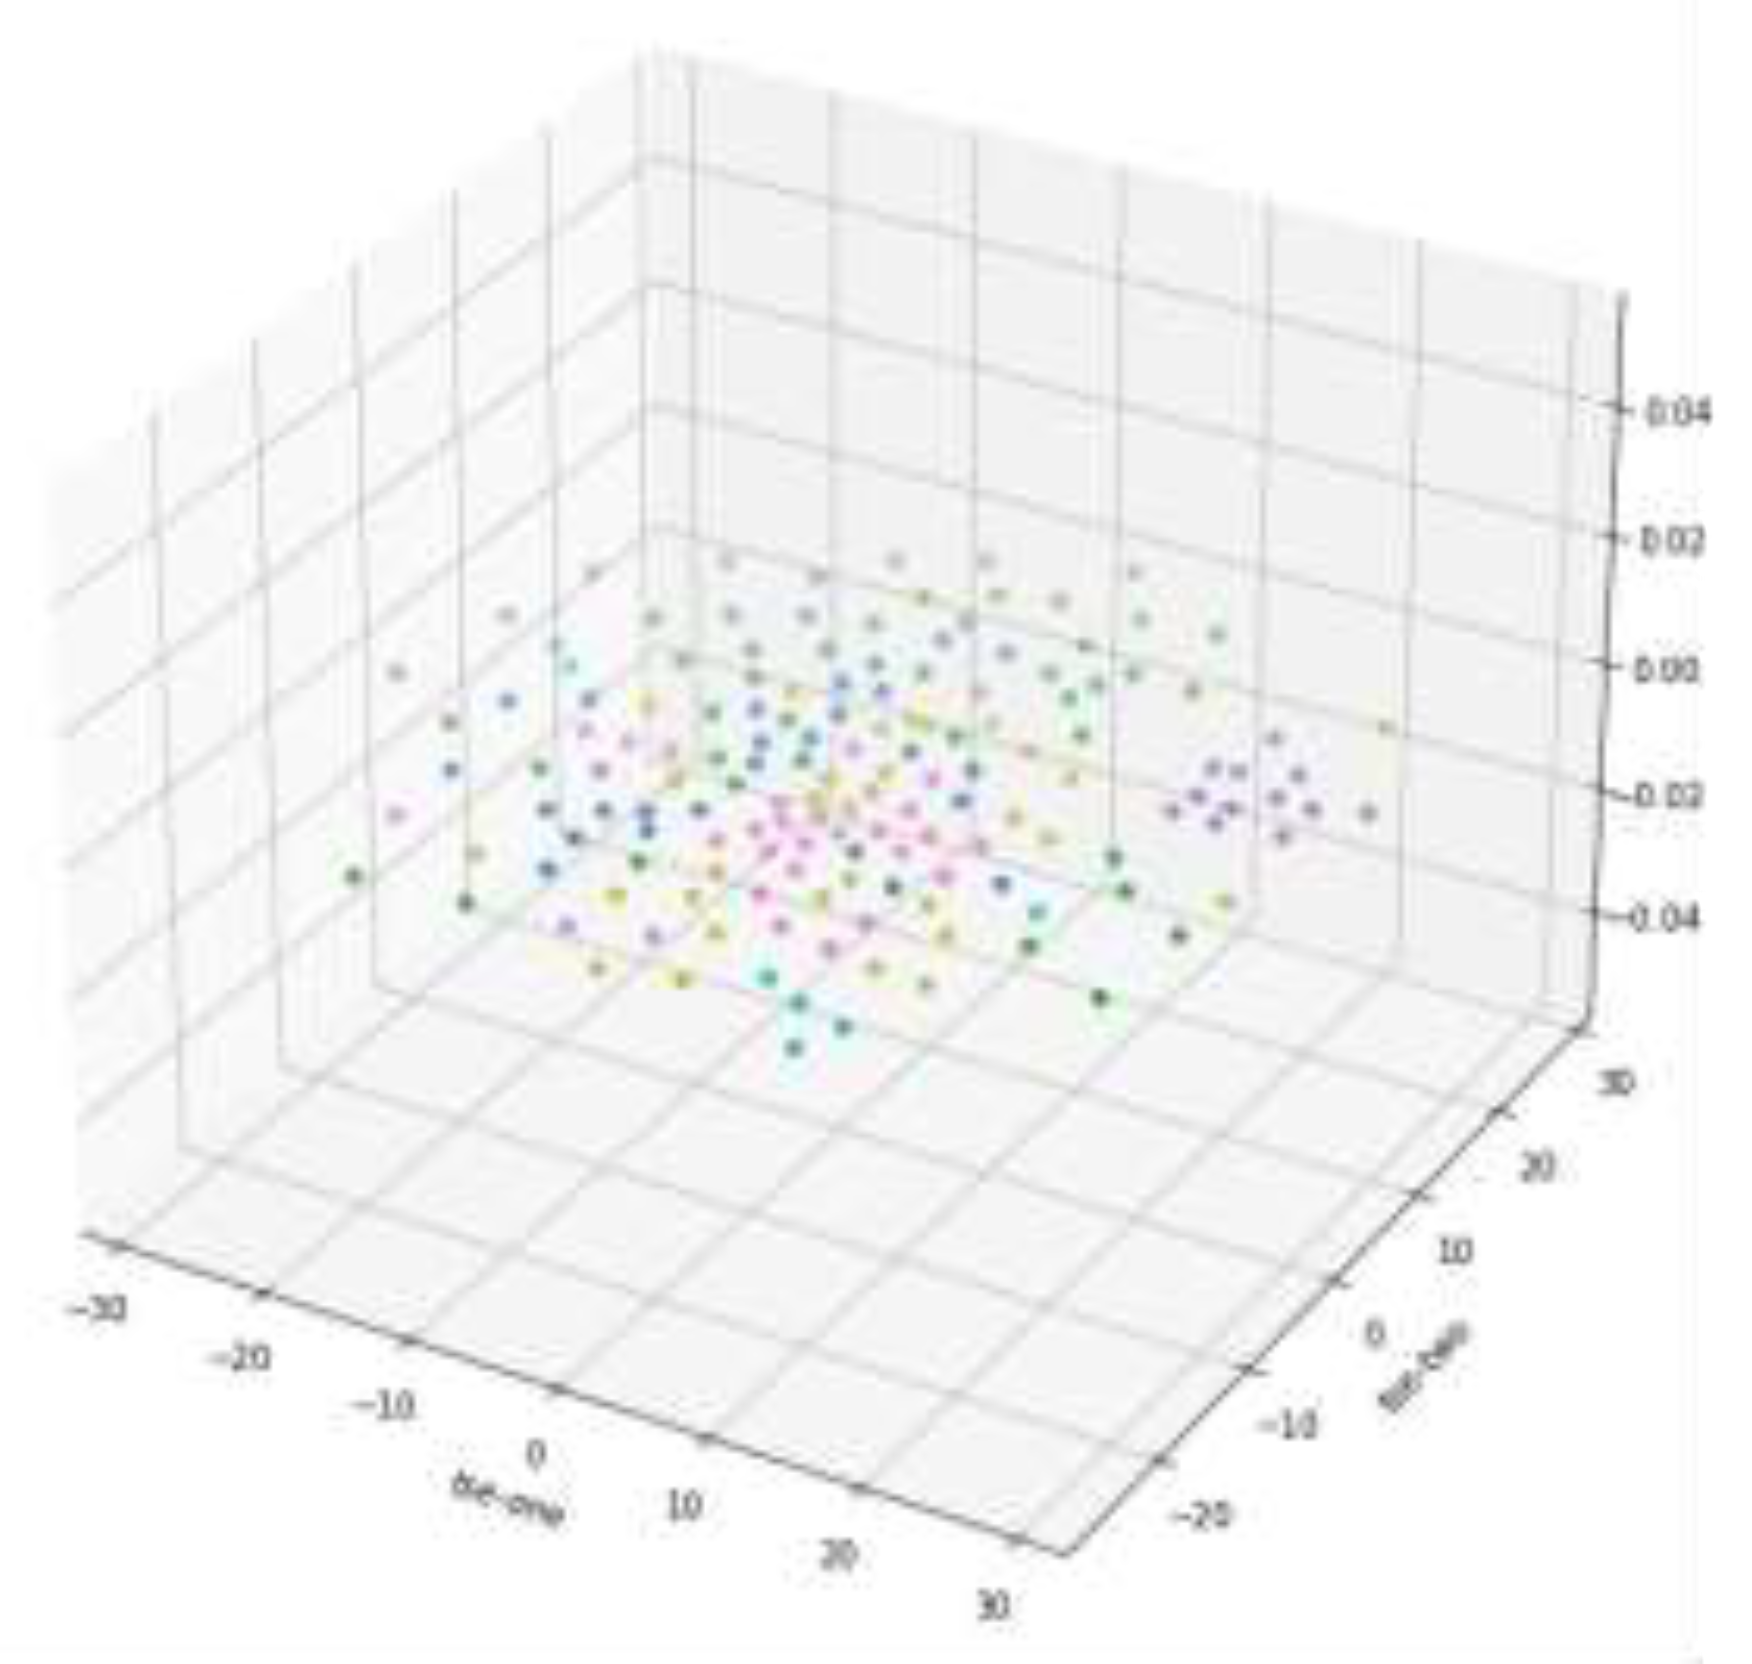
Figure 3 shows the 3D scatter plot of T-SNE dimension reduction, but from the data distribution results in the graph, it is not as good as PCA dimension reduction results, so the subsequent analysis is based on PCA dimension reduction results.
The XGBoost model’s multi-classification results on breast cancer gene expression data provide valuable insights. The micro average reflects an overall precision of 85%, recall of 72%, and F1-score of 78%, accounting for total true positives, false negatives, and false positives. The macro average shows precision of 88%, recall of 79%, and F1-score of 81%, offering unweighted performance across all classes. The weighted average, addressing class imbalance, achieves precision of 89%, recall of 72%, and F1-score of 78%. Lastly, the samples average records 69% precision, 72% recall, and 70% F1-score, calculated per sample.
Class 0 shows moderate precision (50%) and higher recall (67%), with an F1-score of 57%, highlighting room for improvement. Class 1 achieves strong precision (93%) and recall (78%), resulting in an F1-score of 85%, indicating robust performance. Class 2 excels with precision (83%) and perfect recall (100%), yielding an F1-score of 91%. Class 3 boasts perfect precision (100%) but lower recall (77%), leading to an F1-score of 87%. Class 4 has perfect precision (100%) but low recall (50%), with an F1-score of 67%. Class 5 demonstrates flawless precision, recall, and F1-score (100%), reflecting excellent performance.
5. Conclusions
The application of XGBoost in multi-class classification of breast cancer gene expression data has demonstrated strong potential. The model effectively identifies genetic patterns across six subtypes, excelling in Class 1, Class 2, and Class 5 with high precision and recall. However, lower recall in Class 0 and Class 4 highlights the need for further optimization to avoid missing critical cases, essential for clinical applications.
Dimensionality reduction using Principal Component Analysis (PCA) was crucial for preprocessing the high-dimensional dataset of over 54,000 genes. PCA transformed the data into a lower-dimensional space, preserving key variance while reducing noise and computational complexity. This step enhanced data interpretability and improved model performance by eliminating redundant features and collinearity, allowing XGBoost to focus on significant patterns. As a result, PCA contributed to the model's stability and generalization across subtypes.
The combination of PCA and XGBoost presents a powerful approach to handling complex gene expression data, but further refinements are needed. Future research could explore advanced dimensionality reduction techniques, optimize the number of principal components, or employ hyperparameter tuning and ensemble methods. Addressing recall issues in certain classes by adjusting class weights could improve the model's reliability. These enhancements would strengthen the predictive model’s role in precision medicine, aiding early detection and targeted treatment of breast cancer based on genetic profiles.
References
- Zelli V, Manno A, Compagnoni C, et al. Classification of tumor types using XGBoost machine learning model: a vector space transformation of genomic alterations[J]. Journal of Translational Medicine 2023, 21, 836. [Google Scholar] [CrossRef] [PubMed]
- Hoque R, Das S, Hoque M, et al. Breast Cancer Classification using XGBoost[J]. World Journal of Advanced Research and Reviews 2024, 21, 1985–1994. [Google Scholar] [CrossRef]
- Song Y, Westerhuis J A, Aben N, et al. Principal component analysis of binary genomics data[J]. Briefings in bioinformatics 2019, 20, 317–329. [Google Scholar] [CrossRef] [PubMed]
- Laghmati S, Hamida S, Hicham K, et al. An improved breast cancer disease prediction system using ML and PCA[J]. Multimedia Tools and Applications 2024, 83, 33785–33821. [Google Scholar]
- Sharma A, Mishra P K. Performance analysis of machine learning based optimized feature selection approaches for breast cancer diagnosis[J]. International Journal of Information Technology 2022, 14, 1949–1960. [Google Scholar] [CrossRef]
- Nguyen Q H, Do T T T, Wang Y, et al. Breast cancer prediction using feature selection and ensemble voting[C]//2019 International Conference on System Science and Engineering (ICSSE). IEEE, 2019: 250-254.
- Song X, Zhu J, Tan X, et al. XGBoost-based feature learning method for mining COVID-19 novel diagnostic markers[J]. Frontiers in Public Health 2022, 10, 926069. [Google Scholar] [CrossRef] [PubMed]
- Liew X Y, Hameed N, Clos J. An investigation of XGBoost-based algorithm for breast cancer classification[J]. Machine Learning with Applications 2021, 6, 100154. [Google Scholar] [CrossRef]
- Meng C, Zeleznik O A, Thallinger G G, et al. Dimension reduction techniques for the integrative analysis of multi-omics data[J]. Briefings in bioinformatics, 2016, 17(4): 628-641.
- Zhang S, Liu C C, Li W, et al. Discovery of multi-dimensional modules by integrative analysis of cancer genomic data[J]. Nucleic acids research, 2012, 40(19): 9379-9391.
- Chiu P K F, Shen X, Wang G, et al. Enhancement of prostate cancer diagnosis by machine learning techniques: an algorithm development and validation study[J]. Prostate cancer and prostatic diseases, 2022, 25(4): 672-676.
|
Disclaimer/Publisher’s Note: The statements, opinions and data contained in all publications are solely those of the individual author(s) and contributor(s) and not of MDPI and/or the editor(s). MDPI and/or the editor(s) disclaim responsibility for any injury to people or property resulting from any ideas, methods, instructions or products referred to in the content. |
© 2024 by the authors. Licensee MDPI, Basel, Switzerland. This article is an open access article distributed under the terms and conditions of the Creative Commons Attribution (CC BY) license (http://creativecommons.org/licenses/by/4.0/).


