
Submitted:
20 October 2024
Posted:
24 October 2024
You are already at the latest version
Abstract
Summary Introduction: The psoas muscle index (PMI) and the skeletal mass index (SMI), as determined by computed tomography (CT), are the reference methods for assessing muscle mass. An alternative method is to measure the area of the rectus femoris muscle using ultrasonography (US).Objective : The objective of this study is twofold: firstly, to assess whether ultrasound imaging of the rectus femoris has an adequate correlation with psoas muscle index (PMI) and skeletal mass index (SMI) measurements obtained from computed tomography (CT) scans of oncosurgical patients at the L3 level; and secondly, to establish a cut-off point for diagnosing low muscle mass using this ultrasound technique. Material and methods: A retrospective cross-sectional observational study was carried out on oncosurgical patients referred to the nutrition consultation of the General University Hospital of Castellón over a four-year period. Malnutrition was diagnosed according to the GLIM criteria, muscle mass was assessed by ultrasound using a Mindray device, and skeletal muscle index (SMI) and appendicular skeletal muscle mass (PMI) were measured by computed tomography at the third lumbar vertebra (L3). Patients lacking a CT scan or with a CT scan performed more than one month after the ultrasound examination were excluded. Results: The study cohort comprised 43 patients (31 males), with a mean age of 64.7 ± 6.72 years, a mean BMI of 23.7 ± 4.31 kg/m², and a mortality rate of 25.6%. Most of the evaluations were conducted post-surgically (65.1%), with a notable prevalence of radical cystectomy and hepatic surgery. A total of 53 ultrasound evaluations were conducted, with an average area of 2.96 cm² [2.47-4.2] and adipose tissue of 0.55 cm [0.1-0.99] *. Additionally, computed tomography (CT) scans were performed to assess skeletal muscle mass (SMM) using the SMI/height method, yielding an average area of 38.4 cm² [31.6- 54.7)The median values for the variables were as follows: 272 [207-390] HU,PMI area of 4.31 m² [3.71-5.94] * and 86 [69-103] * HU density in PMI. All data were expressed as median and interquartile range. The Pearson correlation coefficients between US and SMI/height, SMI/height and PMI/height, and US and PMI/height were 0.70, 0.750, and 0.548, respectively. All these coefficients were statistically significant (p < 0.001). Following the established criteria for low muscle mass for SMI (1) and PMI (2), a ROC curve analysis was conducted on US, with a cutoff point for low muscle mass of 3.6 cm² , AUC 0.770 with 70% and specificity 100%.Respect PMI , the cut-off was 3.29 cm 2 and the area under the curve was 0.609, with a sensitivity of 42.55% and a specificity of 100%. Conclusions: The results of this study indicate that there is a significant correlation between SMI, PMI, and the area in cm² measured by US in the rectus femoris according to the protocol of García-Almeida et al. (3). The positive correlation between ultrasound and computed tomography (CT) imaging in our sample, which yielded comparable results to those reported by (4), suggests that ultrasonography may serve as a viable alternative to CT for the detection of low muscle mass. This study is the first to establish a cutoff point for ultrasonography in comparison to SMI and PMI. Further studies are required, utilising a semi-automatic method to circumvent measurement bias and encompassing a larger patient cohort, in order to detect cutoff points pre- and post-surgery for cystectomy and hepatic surgery, as well as cutoff points by sex.
Keywords:
Muscle ultrasound
; body composition
; CT imaging
; GLIM criteria
Introduction
Malnutrition is a prevalent issue across all levels of healthcare, from primary care to specialised care and geriatric care settings. It primarily affects the elderly. In developed countries, malnutrition has been identified as a significant issue in hospitals since the mid-20th century, yet a comprehensive solution has yet to be established. The condition itself serves to exacerbate malnutrition, thereby creating a vicious cycle that can ultimately result in death.
The initial definition of malnutrition was defined based on weight loss, low body mass index (BMI), and serum albumin levels (5). However, in 2012, ASPEN (6) published new diagnostic criteria for adult malnutrition, which were primarily focused on identifying patients at nutritional risk and included clinical and body composition data.
In 2015, ESPEN (7) established that for individuals identified as being at risk of malnutrition through screening, the diagnosis of malnutrition should be based on a low BMI (<18.5 kg/m2), or a combination of unintentional weight loss and a low BMI for age or a low fat-free mass index (FFMI) using sex-specific cut-offs.
In 2019, the GLIM criteria (8) were published and have remained current, with updates in 2022 (9, 10).
There is an increasing focus on muscle mass in the assessment of malnutrition, given that BMI is less responsive to early changes and does not provide information about the nature of the body compartments.
A variety of techniques are available for the measurement of muscle mass. Dual-energy X-ray absorptiometry (DEXA), computed tomography (CT), and magnetic resonance imaging (MRI) are regarded as the gold standard (8). In CT scans, muscle mass is typically measured at the level of the third lumbar vertebra. According to Walowski et al (11), the skeletal mass index (SMI) is a superior indicator of total muscle mass compared to the psoas muscle index (PMI).
These methods have inherent limitations, as they are either employed in research contexts or utilize opportunistic CT scans conducted on surgical or oncological patients for other purposes. In recent years, in addition to bioelectrical impedance analysis (10), ultrasonography of the rectus femoris muscle in the middle to distal third of the femur has gained increasing importance for the assessment of muscle mass (3). This is due to the fact that it is a non-radiating, rapid method with a suitable learning curve that can be performed at the bedside.
In this context, the objective of our study is to assess the correlation between the rectus femoris cross-sectional area (RFSA) as measured by US and SMI, as well as PMI measured by opportunistic CT at the level of the third lumbar vertebra in a sample of oncosurgical patients followed up in the nutrition clinic.
Material and Methods
Study Design and Population
This is a retrospective cross-sectional observational study of the records of oncological surgical patients referred to the specialized nutrition clinic from October 2020 to June 2024 at Castellón University Hospital.
The study included patients aged 18 or over who had undergone oncological surgery and had undergone both ultrasound and CT scans. Patients were excluded if there was a time interval of more than one month between the ultrasound and CT scans. Over the course of the study period, 68 oncological patients underwent 108 morpho-functional evaluations.
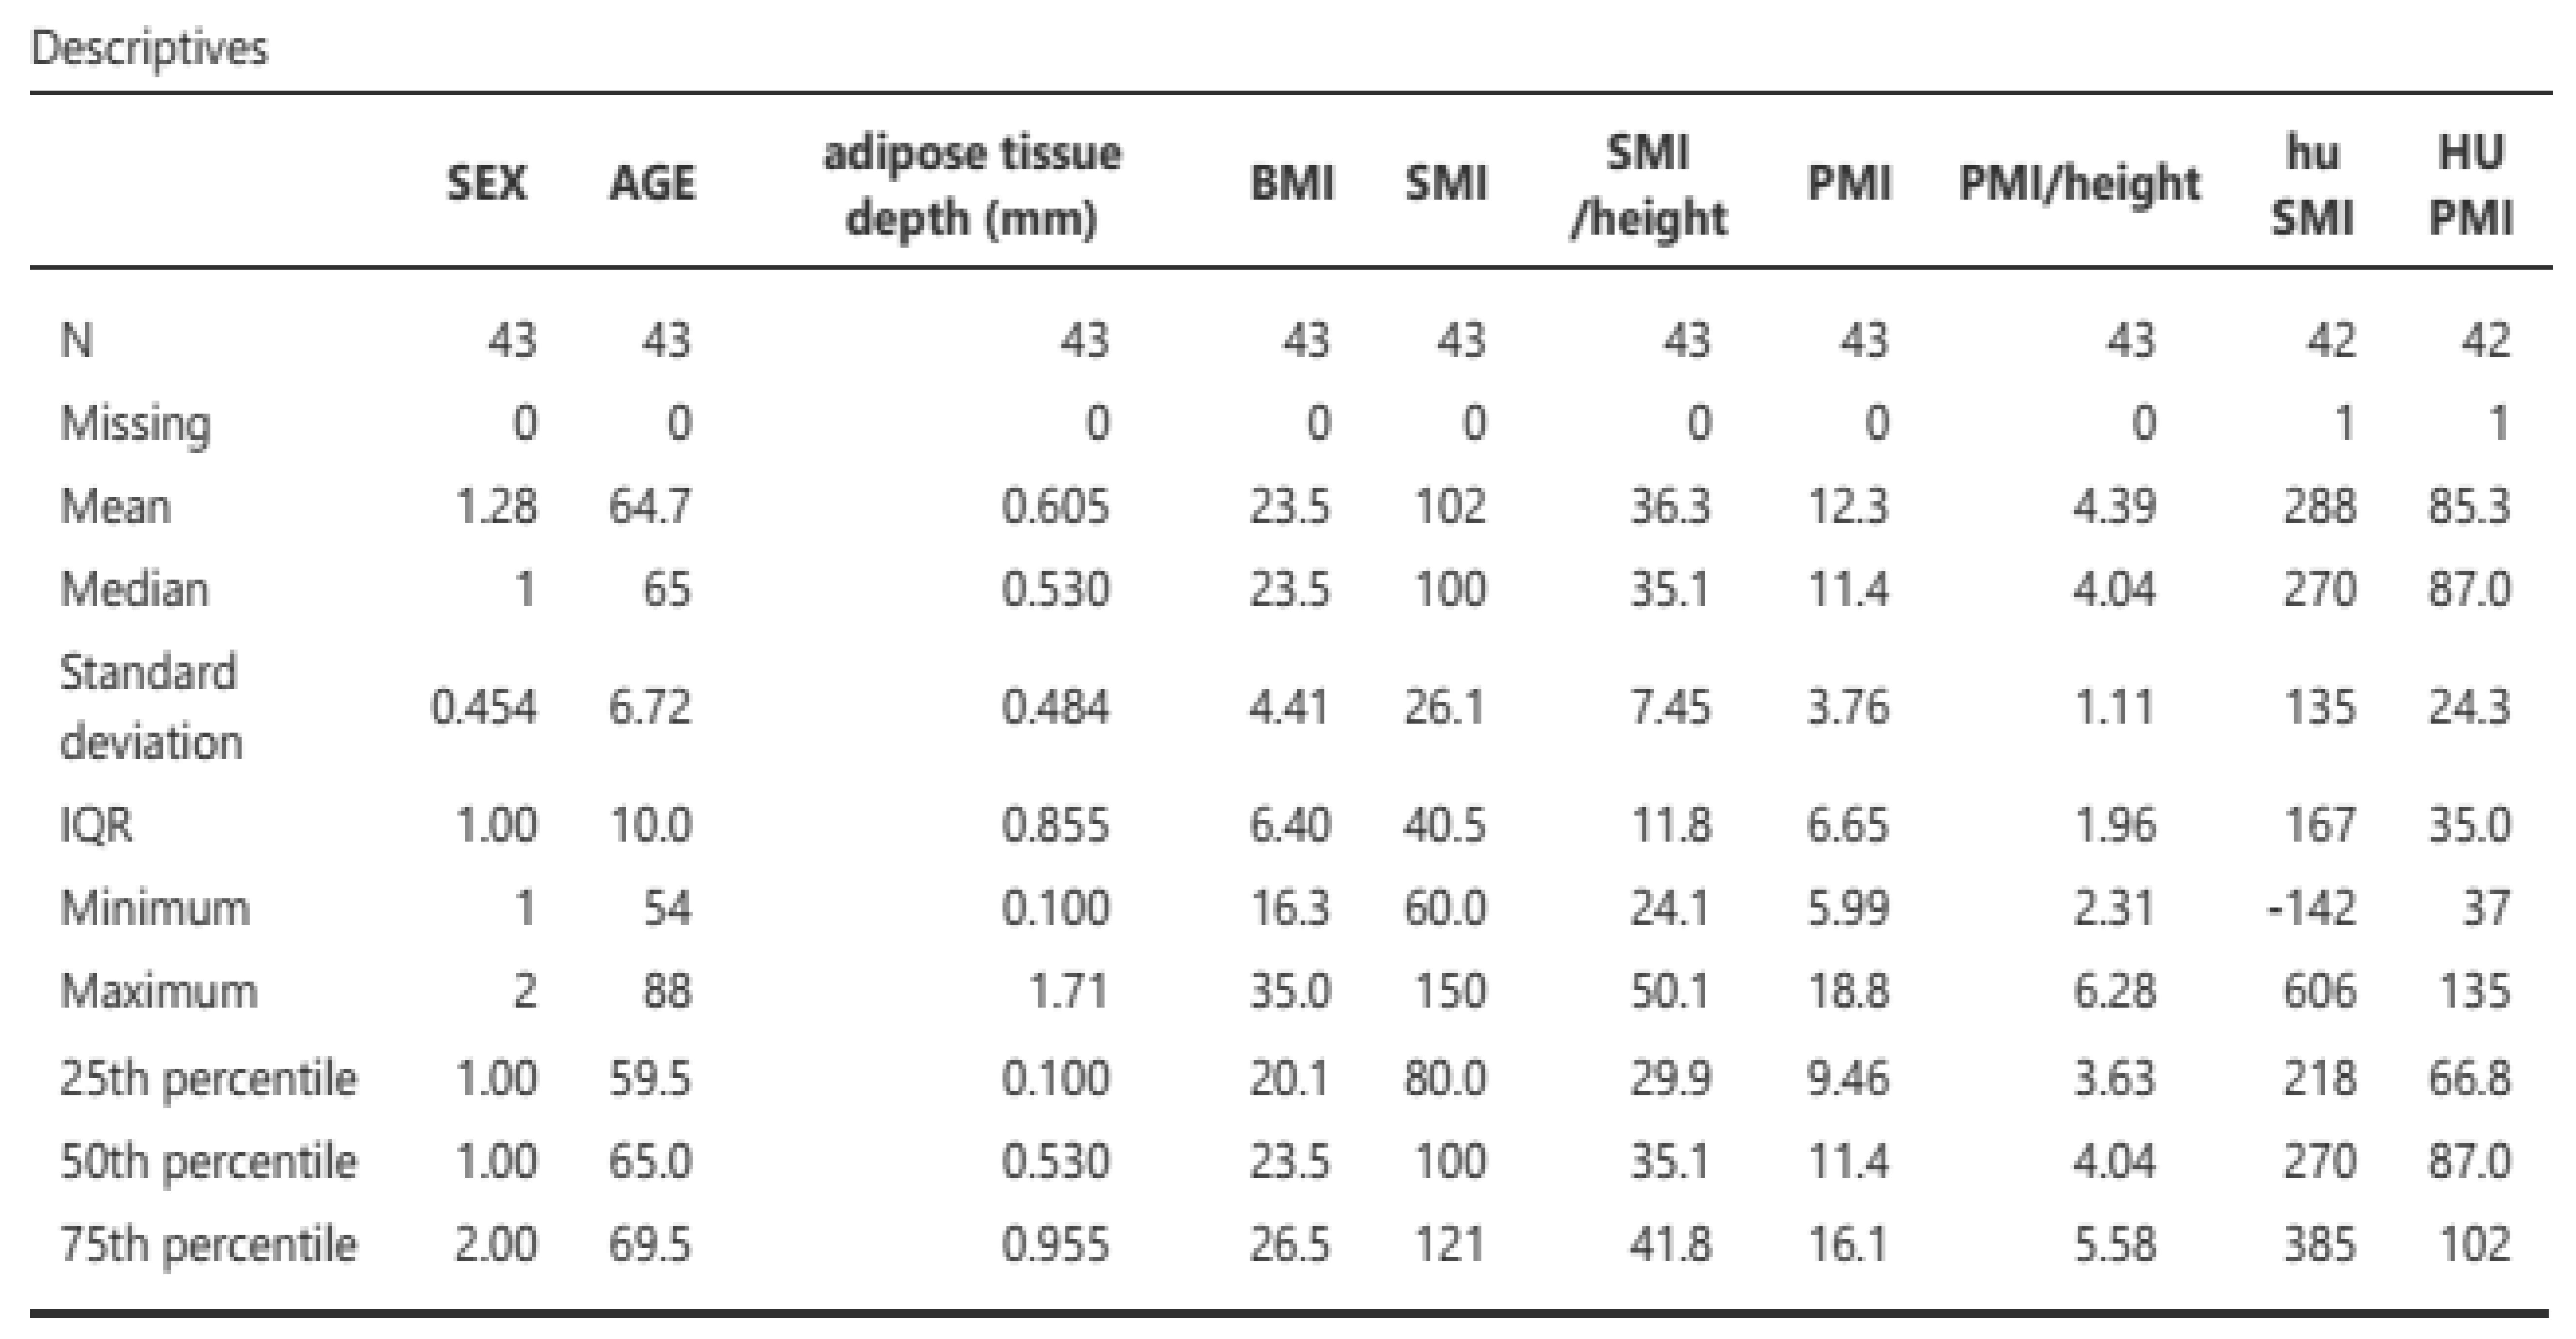
A total of 43 patients were included in the study (Figure 1), comprising 31 males and 12 females, with a mean age of 64.7 ± 6.72 years, a mean BMI 23.7 ± 4.31 kg/m2, and a mortality rate of 25.6%. The majority of evaluations were conducted postoperatively (65.1%), with radical cystectomies and liver surgery being the most prevalent (Table 1 and Table 2).
Study Variables The following variables were subjected to assessment
- Malnutrition: The assessment was conducted following the GLIM criteria (8), which entail the application of both phenotypic criteria (weight loss) and etiological criteria. The resulting classification was as follows: normonutrition, moderate malnutrition, and severe malnutrition.
- Muscle mass and quality: Ultrasonography was employed to assess the area in cm2, adipose tissue depth in the rectus femoris ultrasound, and echogenicity using a Mindray ultrasound, following the methodology outlined by García-Almeida et al. (3).
- Muscle mass at the L3 level: The psoas index and skeletal mass index were employed to ascertain the aforementioned measurements, while myosteatosis was evaluated utilising Centricity Universal Viewer v7.0 SP1 0.3 (a radiology image management system at Castellón General Hospital). The system is manual, with measurements taken manually. All CT scans were performed with contrast.
- Dynapenia: Assessed using a JAMAR dynamometer, with dynapenia defined as a value below the 10th percentile based on Pizarra's cut-off points (12).
Objectives:
-
Primary:
- ○
- To compare the results of rectus femoris ultrasound in oncosurgical patients with skeletal mass index measured at L3 on CT, assessing the correlation between area in cm2 and SMI.
- ○
- To compare the results of rectus femoris ultrasound in oncosurgical patients with PMI measured at L3 on CT, assessing the correlation between area in cm2 and PMI.
- ○
- To analyse the most suitable cut-off, point for detecting low muscle mass using US, based on SMI cut-off points (1) (<43 cm2 in males with BMI < 25, <53 cm2 if BMI > 25, and <41 cm2 in females regardless of BMI) and PMI cut-off points (2) (<6.36 cm2 for males and 3.92 cm2 for females). The cut-off points proposed by Lisa Martin (13) were employed instead of those put forth by Carla Prado (1) due to the fact that the mean BMI of our sample was 23.7 ± 4.31 kg/m2, and Prado et al.'s study was conducted in patients with BMI > 30 kg/m2. In regard to PMI, the cut-off points proposed by Hamaguchi et al. (2) were employed in lieu of those put forth by Ufuk et al. (15), given that the findings documented in the latter article are not consistent with those delineated in the attached table.
- Secondary:
The objective is to assess the myosteatosis of PMI and SMI, as measured in Hounsfield units on contrast-enhanced CT using Centricity Universal Viewer v7.0 SP1 0.3, and to compare it with adipose tissue depth, as measured by rectus femoris muscle ultrasonography and rectus femoris muscle echogenicity.
Furthermore, the aim is to analyse the most suitable cut-off point for detecting sarcopenia using ultrasound and hand grip strength, in comparison to SMI and PMI.
Statistical Analysis:
The statistical analysis was conducted using the JAMOVI program (version 2.3.28). The regression analysis (correlation matrix) was employed with a positive hypothesis if the result was > 0.5 and the result was considered statistically significant if p < 0.005. To identify the optimal cut-off, point that exhibited the highest sensitivity and specificity, binomial logistic regression prediction was utilized to construct ROC curves and AUC.
Results
Primary objectives: A total of 43 patients were included in the analysis, comprising 31 males (12 females) with a mean age of 64.7 ± 6.72 years and a mean BMI of 23.7 ± 4.31 kg/m2, with a mortality rate of 25.6%. Of the 43 patients, 53 assessments were conducted, comprising 31 post-surgical assessments (21 pre-surgical) with a preponderance of radical cystectomies (34.6%) and hepatic surgeries (51.9%). Malnutrition was classified in accordance with the GLIM criteria (8) (measured based on a phenotypic criterion (weight loss) and an etiological criterion. The resulting classifications were norm nutrition, moderate malnutrition, and severe malnutrition. The results are presented in Figure 2.
Ultrasound measurements
- Area: 2.96 cm2 [2.47-4.2] *
- Adipose tissue depth: 0.55 cm [0.1-0.99] *
CT measurements
- SMI/height: 38.4 cm2 [31.6-45.7], HU density: 272 [207-390]
- PMI/height: 4.31 m2 [3.71-5.94], HU density in PMI: 86 [69-103]
median-interquartile range

Table 3.
Morpho-functional characteristics of the 53 assessments.
 |
| Note: The CT measurement method was manual, and all CT scans were performed with contrast. |
Pearson's correlation coefficients were 0.700, 0.702, and 0.504 for US vs. SMI/height, SMI/height vs. PMI/height, and US vs. PMI (calculated by height), respectively. All correlations were statistically significant (see Table 4)
To ascertain the optimal cut-off points for low muscle mass, ROC curve analysis was conducted on US data, based on the established low muscle mass thresholds for SMI (1) and PMI (2). Cut-off points for low muscle mass were determined as 3.6 cm2 for SMI/height (AUC 0.770, sensitivity 70%, specificity 100%) and 3.29 cm2 for PMI/height (AUC 0.609, sensitivity 42.55%, specificity 100%) (see Figure 3 and Figure 4 for ROC curves and Table 5 and Table 6 for AUC values)
Secondary Objectives:
DYNAMOMETRY
With regard to dynamometry, only 32 out of 53 assessments were performed. The mean grip strength was 26.4 kg (19.7-36.3 *), with 43.8% of the sample showing dynapenia (< p10) based on Pizarra's reference values (12). Meanwhile, the frequency of sarcopenia (14 out of 53 assessments: 26.7% of the sample) was 45.5% and 42.4%, respectively, according to the low muscle mass cut-offs for PMI and SMI.
A ROC curve analysis was performed on US, with a cut-off point for sarcopenia based on SMI of 3.23 cm2, AUC 0.637, sensitivity 63.17%, and specificity 78.57% (Figure 5 and Table 7) and 3.12 cm2 for PMI, AUC 0.543, sensitivity 55.56%, and specificity 66.67% (Figure 6 and Table 8)
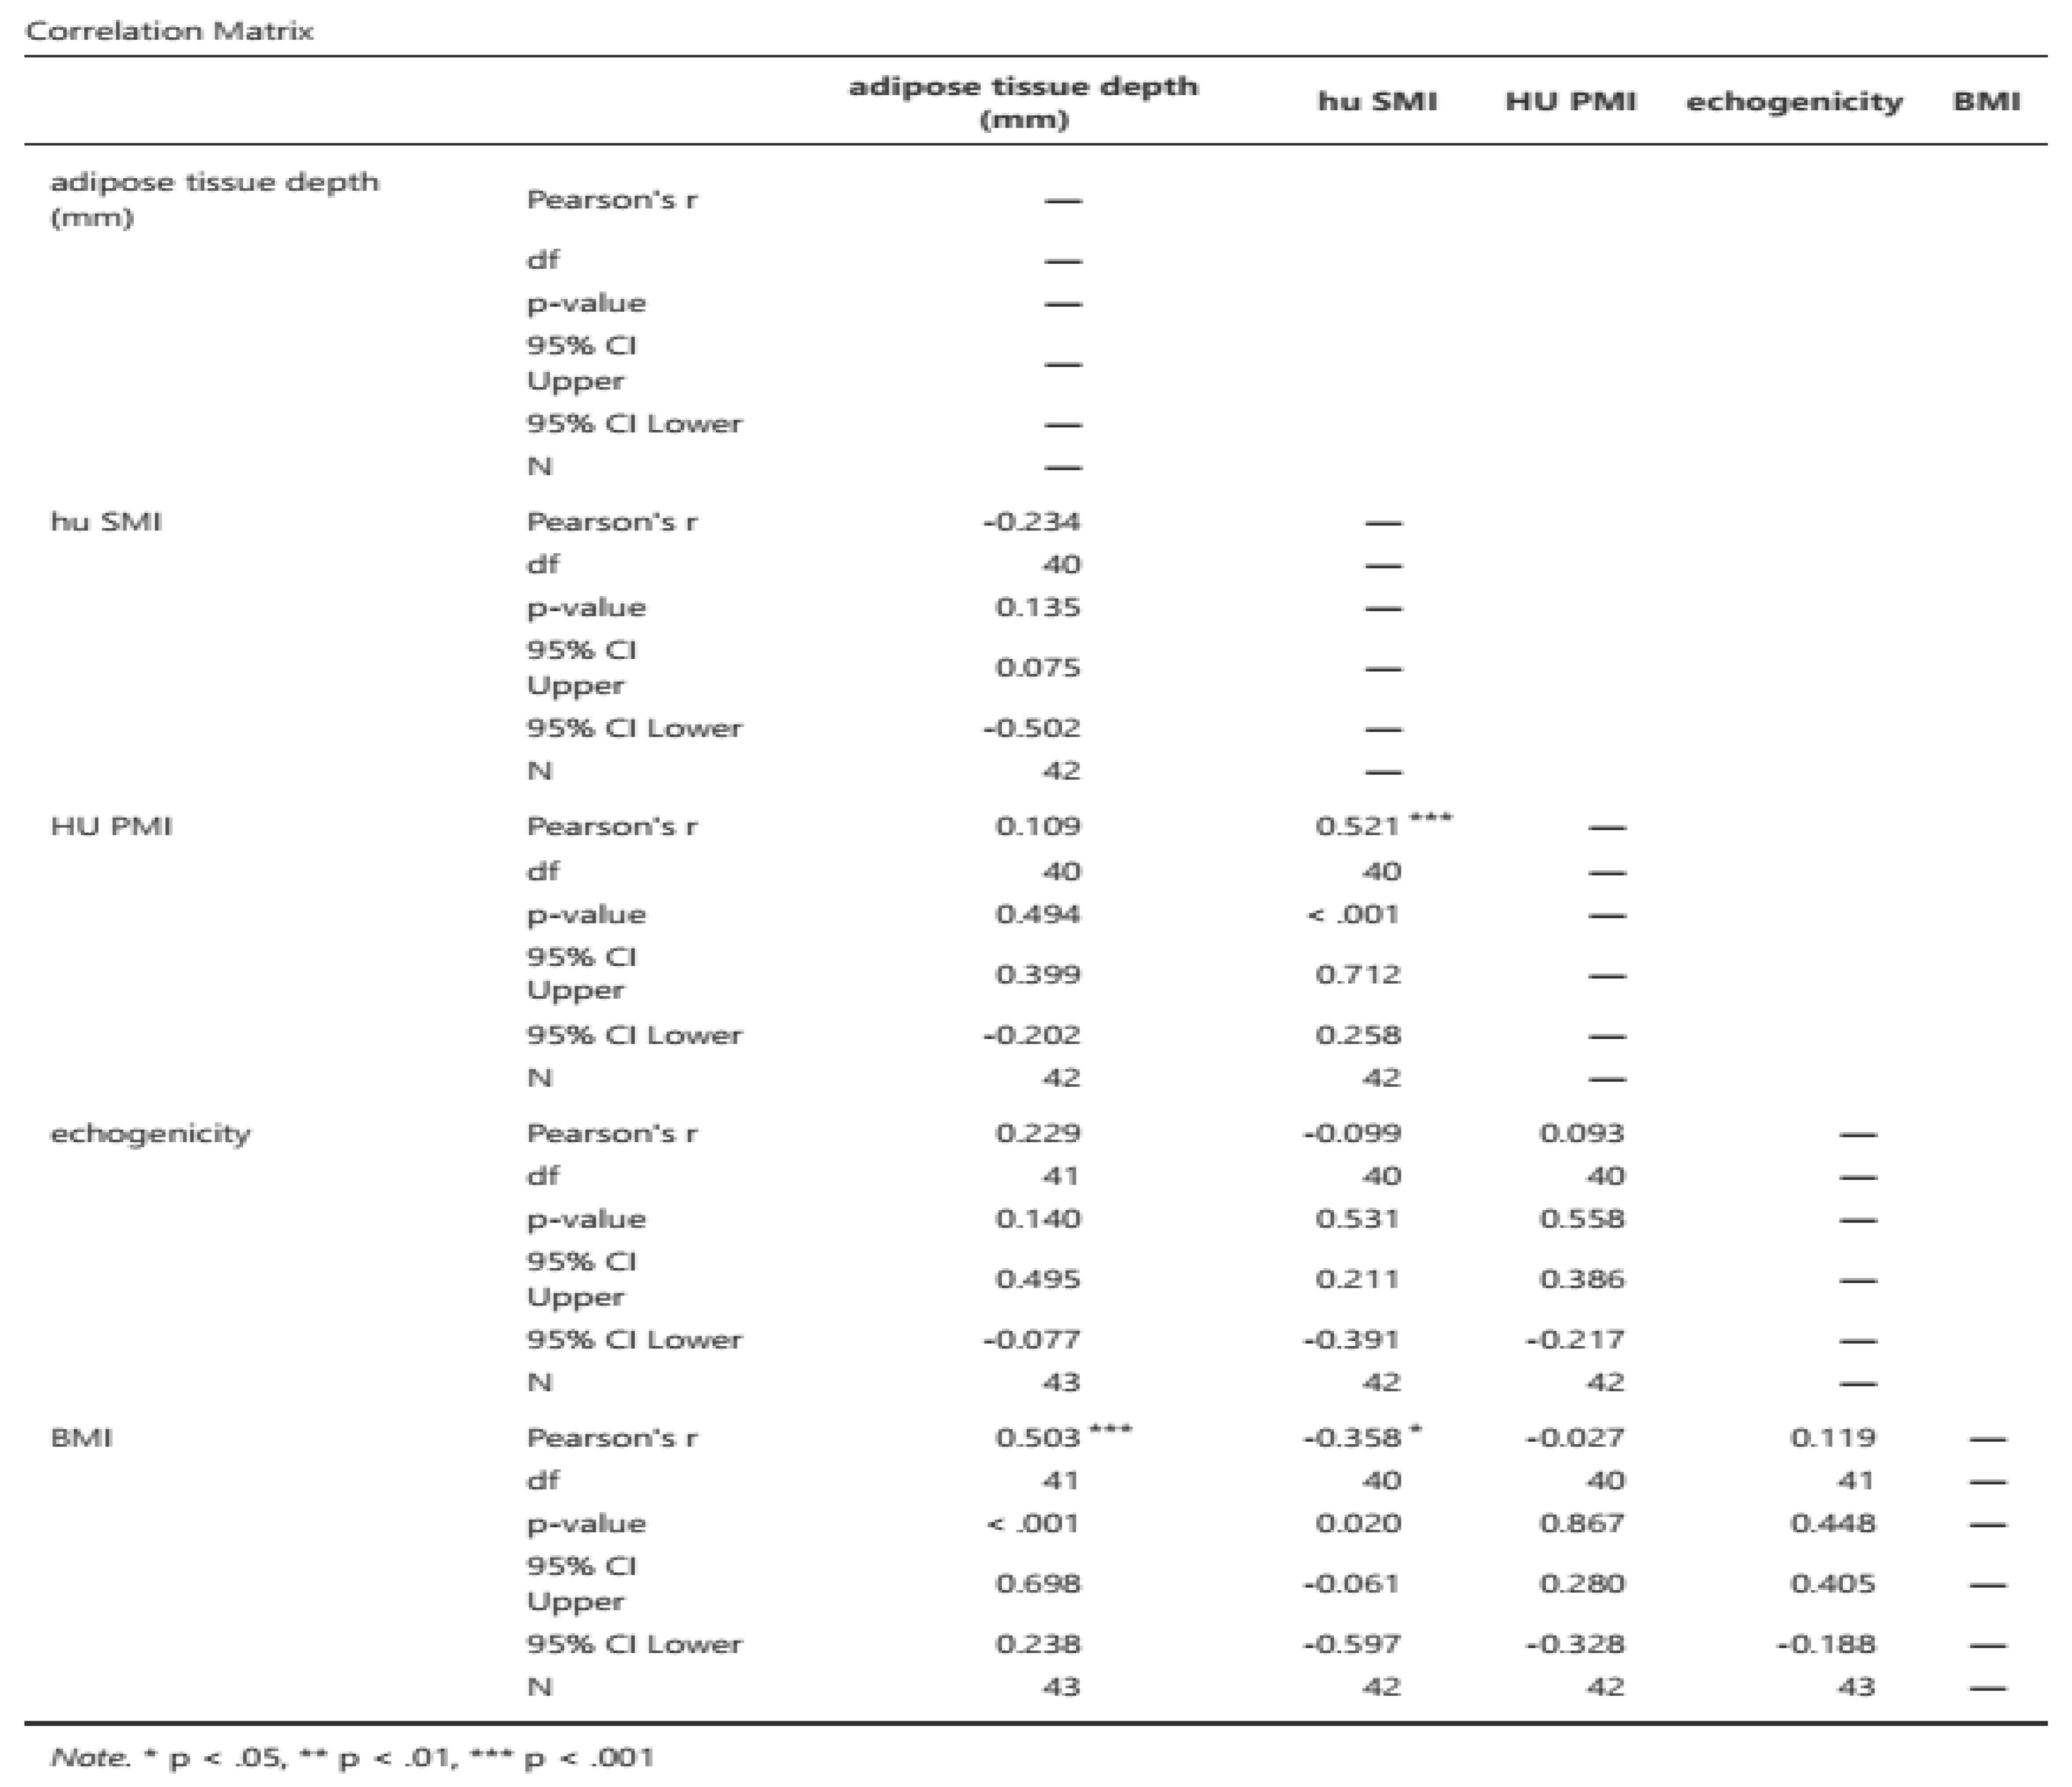
MYOSTEATOSIS
Finally, the Pearson correlation between ultrasound-measured muscle adipose tissue (mioesteatosis) and the HU density of PMI and SMI was -0.133 (p 0.351) and -0.358 (p 0.020), respectively, and did not change after adjustment for BMI or height. The Pearson correlation between BMI and the depth of adipose tissue measured by ultrasound in the rectus femoris was 0.503 (p < 0.001) (Table 9).
Discussion
There is an increasing emphasis on the use of morpho-functional assessment to provide a comprehensive nutritional assessment. This global assessment is essential to complete the overall diagnosis of a patient and to enable personalised therapy. Traditionally, DEXA (especially in research), CT, and MRI have been considered the gold standards for assessing muscle mass; however, (16) these techniques have drawbacks such as difficulty in follow-up and patient exposure to radiation.
In recent years, strong correlations have been described between phase angle and bioelectrical impedance analysis (BIA)-derived body cell mass (BCM) and the rectus femoris cross-sectional area (RFCSA) (17, 18, 19). However, few studies have investigated the correlation between SMI measured at the third lumbar vertebra and RFCSA.
Paris et al. (20) compared SMI at L3 in 149 ICU patients and found a correlation of 0.45 (p < 0.001). Unlike our study, they used a semi-automated CT method (SliceOmatic 4.3 image analysis software) and measured rectus femoris thickness instead of RFCSA. Lambell et al. (21) included 50 ICU patients and, similar to Paris et al., compared SMI at L3 with muscle thickness, and found a correlation of 0.75 (p < 0.001). They also measured the sum of muscle thickness in the upper middle part of the arm and bilateral thighs. Finally, Fiorella Palmas et al. (22) included 147 patients with colorectal cancer and found a correlation of 0.67 (p < 0.005) between rectus femoris area and SMI measured using a semi-automated method, also using a semi-automated method for the interpretation of ultrasound images.
These results are consistent with those presented in this study, as the Pearson correlation was 0.70 between US and SMI/height, 0.750 between SMI/height and PMI/height, and 0.548 between US and PMI (calculated by height), all of which were statistically significant (p < 0.001).
According to the established values for low muscle mass for SMI (1) and PMI (2), a ROC curve analysis was performed on US, with a cut-off point for low muscle mass of 3.6 cm2, AUC 0.770, sensitivity 70%, and specificity 100%, and 3.29 cm2, AUC 0.609, sensitivity 42.55%, and specificity 100%, respectively. However, unlike the study by Palmas et al. (4), our study is the first to establish a cut-off point for ultrasonography compared to SMI and PMI based on ROC curves with a good AUC.
Regarding sarcopenia, the main results indicate that the ROC curve of the "dichotomous SMI for sarcopenia" showed a high specificity value of 100% with a cut-off point of 3.23, highlighting its ability to correctly identify patients without sarcopenia; while the "Psoas index for sarcopenia" showed moderate sensitivity and specificity values with a cut-off point of 3.12, reflecting a lower diagnostic capacity compared to other indices for sarcopenia.
Regarding intramuscular fat mass, in the present study there is a lack of correlation between myosteatosis measured in HU density on CT compared to adipose tissue depth measured by rectus femoris ultrasonography (PMI r -0.040 and SMI r -0.133) and rectus femoris muscle echogenicity (r -0.075 and r 0.118 for SMI and PMI, respectively). This may be due to the method used (with Centricity Universal Viewer v7.0 SP1 0.3), which is a manual method and therefore the HU density varies depending on the amount of contrast used, as can be seen in the two figures (Figure 7. HU density PMI 70 / Figure 8. HU density -52).
This is in contrast to semi-automated methods (4) where the use or non-use of contrast does not affect the results.
The weaknesses of this study are important, as the use of a manual freehand method can lead to significant intra-observer measurement bias. In addition, the sample size is too small to assess differences between pre-surgical and post-surgical patients, by sex, and by pathology. For the assessment of myosteatosis, a semi-automated or automated method is needed where the measurement of myosteatosis is not affected by contrast.
Conclusion
Conclusions: There is a strong correlation between SMI, PMI, and the cross-sectional area in cm2 measured by US in the rectus femoris according to the protocol of García-Almeida et al. (3). The good correlation between US and CT in our sample, with results similar to those published by Soria-Utrilla V et al. (4), suggests that ultrasonography may be a good alternative to CT for detecting low muscle mass. Our study is the first to establish a cut-off point for ultrasonography in comparison with SMI and PMI.
Further studies are needed with a semi-automated method are needed to avoid measurement bias and with a larger number of patients to establish pre-sergical and post-surgical cut-off points for cystectomy and hepatic surgery, as well as cut-off points by sex.
These new data would improve the prehabilitation of oncosurgical patients (hepatic surgery and radical cystectomy) with low muscle mass and dynapenia, as both US and dynamometry can be performed at the bedside on the same day. The pre-surgical cut-off point in patients undergoing radical cystectomy would also allow for a comparison of the number of complications according to the Dindo-Clavien classification in prehabilitated sarcopenic patients with retrospective series in which prehabilitation was performed (23, 24, 25).
Informed Consent Statement
Informed consent was obtained from all subjects involved in the study.
Acknowledgments
AI would like to express my sincere gratitude to the Spanish Society of Enteral and Parenteral Nutrition (SENPE) for awarding me the grant that enabled me to pursue a master’s degree in Morpho-functional Assessment at the University of Málaga. The training received during this period has been fundamental to the completion of this work and has significantly enriched my knowledge in the field of clinical nutrition.
Conflicts of Interest
There is no conflict of interest to declare. The study was conducted in accordance with the Declaration of Helsinki.
References
- Martin, L.; Birdsell, L.; MacDonald, N.; Reiman, T.; Clandinin, M.T.; McCargar, L.J.; et al. Cancer cachexia in the age of obesity: Skeletal muscle depletion is a powerful prognostic factor, independent of body mass index. J Clin Oncol 2013, 31(12), 1539–1547. [Google Scholar] [CrossRef] [PubMed]
- Hamaguchi, Y.; Kaido, T.; Okumura, S.; Kobayashi, A.; Hammad, A.; Tamai, Y.; Inagaki, N.; Uemoto, S. Proposal for new diagnostic criteria for low skeletal muscle mass based on computed tomography imaging in Asian adults. Nutrition 2016, 32(11–12), 1200–1205. [Google Scholar] [CrossRef] [PubMed]
- García-Almeida, J.M.; García-García, C.; Vegas-Aguilar, I.M.; Ballesteros Pomar, M.D.; Cornejo-Pareja, I.M.; Fernández Medina, B.; et al. Nutritional ultrasound®: Conceptualisation, technical considerations and standardisation. Endocrinol Diabetes y Nutr 2023, 70, 74–84. [Google Scholar] [CrossRef]
- Soria-Utrilla, V.; Sánchez-Torralvo, F.J.; Palmas-Candia, F.X.; Fernández-Jiménez, R.; Mucarzel-Suarez-Arana, F.; Guirado-Peláez, P.; et al. AI-Assisted Body Composition Assessment Using CT Imaging in Colorectal Cancer Patients: Predictive Capacity for Sarcopenia and Malnutrition Diagnosis. Nutrients 2024, 16(12), 1869. [Google Scholar] [CrossRef]
- Lochs, H.; Allison, S.P.; Meier, R.; Pirlich, M.; Kondrup, J.; Schneider, S.; et al. Introductory to the ESPEN Guidelines on Enteral Nutrition: Terminology, Definitions and General Topics. Clin Nutr 2006, 25(2), 180–186. [Google Scholar] [CrossRef]
- White, J.V.; Guenter, P.; Jensen, G.; Malone, A.; Schofield, M. Consensus statement: Academy of nutrition and dietetics and American society for parenteral and enteral nutrition: Characteristics recommended for the identification and documentation of adult malnutrition (undernutrition). J Parenter Enter Nutr 2012, 36(3), 275–283. [Google Scholar] [CrossRef]
- Cederholm, T.; Bosaeus, I.; Barazzoni, R.; Bauer, J.; Van Gossum, A.; Klek, S.; et al. Diagnostic criteria for malnutrition - An ESPEN Consensus Statement. Clin Nutr 2015, 34(3), 335–340. [Google Scholar] [CrossRef]
- Cederholm, T.; Jensen, G.L.; Correia, M.I.T.D.; Gonzalez, M.C.; Fukushima, R.; Higashiguchi, T.; et al. GLIM criteria for the diagnosis of malnutrition – A consensus report from the global clinical nutrition community. Clin Nutr 2019, 38(1), 1–9. [Google Scholar] [CrossRef]
- Barazzoni, R.; Jensen, G.L.; Correia, M.I.T.D.; Gonzalez, M.C.; Higashiguchi, T.; Shi, H.P.; et al. Guidance for assessment of the muscle mass phenotypic criterion for the Global Leadership Initiative on Malnutrition (GLIM) diagnosis of malnutrition. Clin Nutr 2022, 41(6), 1425–1433. [Google Scholar] [CrossRef]
- Prado, C.M.; Landi, F.; Chew, S.T.H.; Atherton, P.J.; Molinger, J.; Ruck, T.; et al. Advances in muscle health and nutrition: A toolkit for healthcare professionals. Clin Nutr 2022, 41(10), 2244–2263. [Google Scholar] [CrossRef]
- Walowski, C.O.; Braun, W.; Maisch, M.J.; Jensen, B.; Peine, S.; Norman, K.; et al. Reference values for skeletal muscle mass – current concepts and methodological considerations. Nutrients 2020, 12(3), 755. [Google Scholar] [CrossRef] [PubMed]
- Sánchez Torralvo, F.J.; Porras, N.; Abuín Fernández, J.; García Torres, F.; Tapia, M.J.; Lima, F.; et al. Valores de normalidad de dinamometría de mano en España. Relación con la masa magra. Nutr Hosp 2018, 35(1), 98–103. [Google Scholar] [CrossRef] [PubMed]
- Prado, C.M.; Lieffers, J.R.; McCargar, L.J.; Reiman, T.; Sawyer, M.B.; Martin, L.; et al. Prevalence and clinical implications of sarcopenic obesity in patients with solid tumours of the respiratory and gastrointestinal tracts: a population-based study. Lancet Oncol 2008, 9(7), 629–635. [Google Scholar] [CrossRef] [PubMed]
- Hamaguchi, Y.; Kaido, T.; Okumura, S.; Kobayashi, A.; Hammad, A.; Tamai, Y.; et al. Proposal for new diagnostic criteria for low skeletal muscle mass based on computed tomography imaging in Asian adults. Nutrition 2016, 32(11–12), 1200–1205. [Google Scholar] [CrossRef] [PubMed]
- Ufuk, F.; Herek, D. Reference skeletal muscle mass values at L3 vertebrae level based on computed tomography in healthy Turkish adults. Int J Gerontol 2019, 13(3), 221–225. [Google Scholar] [CrossRef]
- Prado, C.M.; Ford, K.L.; Gonzalez, M.C.; Murnane, L.C.; Gillis, C.; Wischmeyer, P.E.; et al. Nascent to novel methods to evaluate malnutrition and frailty in the surgical patient. J Parenter Enter Nutr 2023, 47(S1), S54–S68. [Google Scholar] [CrossRef]
- García-García, C.; Vegas-Aguilar, I.M.; Rioja-Vázquez, R.; Cornejo-Pareja, I.; Tinahones, F.J.; García-Almeida, J.M. Rectus Femoris Muscle and Phase Angle as Prognostic Factor for 12-Month Mortality in a Longitudinal Cohort of Patients with Cancer (AnyVida Trial). Nutrients 2023, 15(3), 522. [Google Scholar] [CrossRef]
- de Luis Roman, D.; García Almeida, J.M.; Bellido Guerrero, D.; Guzmán Rolo, G.; Martín, A.; Primo Martín, D.; et al. Ultrasound Cut-Off Values for Rectus Femoris for Detecting Sarcopenia in Patients with Nutritional Risk. Nutrients 2024, 16(11), 1552. [Google Scholar] [CrossRef]
- Fernández-Jiménez, R.; García-Rey, S.; Roque-Cuéllar, M.C.; Fernández-Soto, M.L.; García-Olivares, M.; Novo-Rodríguez, M.; et al. Ultrasound Muscle Evaluation for Predicting the Prognosis of Patients with Head and Neck Cancer: A Large-Scale and Multicenter Prospective Study. Nutrients 2024, 16(3), 387. [Google Scholar] [CrossRef]
- Paris, M.T.; Mourtzakis, M.; Day, A.; Leung, R.; Watharkar, S.; Kozar, R.; et al. Validation of Bedside Ultrasound of Muscle Layer Thickness of the Quadriceps in the Critically Ill Patient (VALIDUM Study). J Parenter Enter Nutr 2017, 41(2), 171–180. [Google Scholar] [CrossRef]
- Lambell, K.J.; Tierney, A.C.; Wang, J.C.; Nanjayya, V.; Forsyth, A.; Goh, G.S.; et al. Comparison of Ultrasound-Derived Muscle Thickness with Computed Tomography Muscle Cross-Sectional Area on Admission to the Intensive Care Unit: A Pilot Cross-Sectional Study. J Parenter Enter Nutr 2021, 45(1), 136–145. [Google Scholar] [CrossRef] [PubMed]
- Palmas, F.; Mucarzel, F.; Ricart, M.; Lluch, A.; Zabalegui, A.; Melian, J.; et al. Body composition assessment with ultrasound muscle measurement: optimization through the use of semi-automated tools in colorectal cancer. Front Nutr 2024, 11(April). [Google Scholar] [CrossRef] [PubMed]
- Mayr, R.; Fritsche, H.M.; Zeman, F.; Reiffen, M.; Siebertz, L.; Niessen, C.; et al. Sarcopenia predicts 90-day mortality and postoperative complications after radical cystectomy for bladder cancer. World J Urol 2018, 36(8), 1201–1207. [Google Scholar] [CrossRef] [PubMed]
- Saitoh-Maeda, Y.; Kawahara, T.; Miyoshi, Y.; Tsutsumi, S.; Takamoto, D.; Shimokihara, K.; et al. Sarcopenia in patients with bladder cancer undergoing radical cystectomy: Impact on cancer-specific and all-cause mortality. J Urol 2018, 19(1), 2910–2918. [Google Scholar] [CrossRef]
- Mayr, R.; Gierth, M.; Zeman, F.; Reiffen, M.; Seeger, P.; Wezel, F.; et al. Sarcopenia as a comorbidity-independent predictor of survival following radical cystectomy for bladder cancer. J Cachexia Sarcopenia Muscle 2018, 9(3), 505–513. [Google Scholar] [CrossRef]
Figure 1.
Included patients in the study.
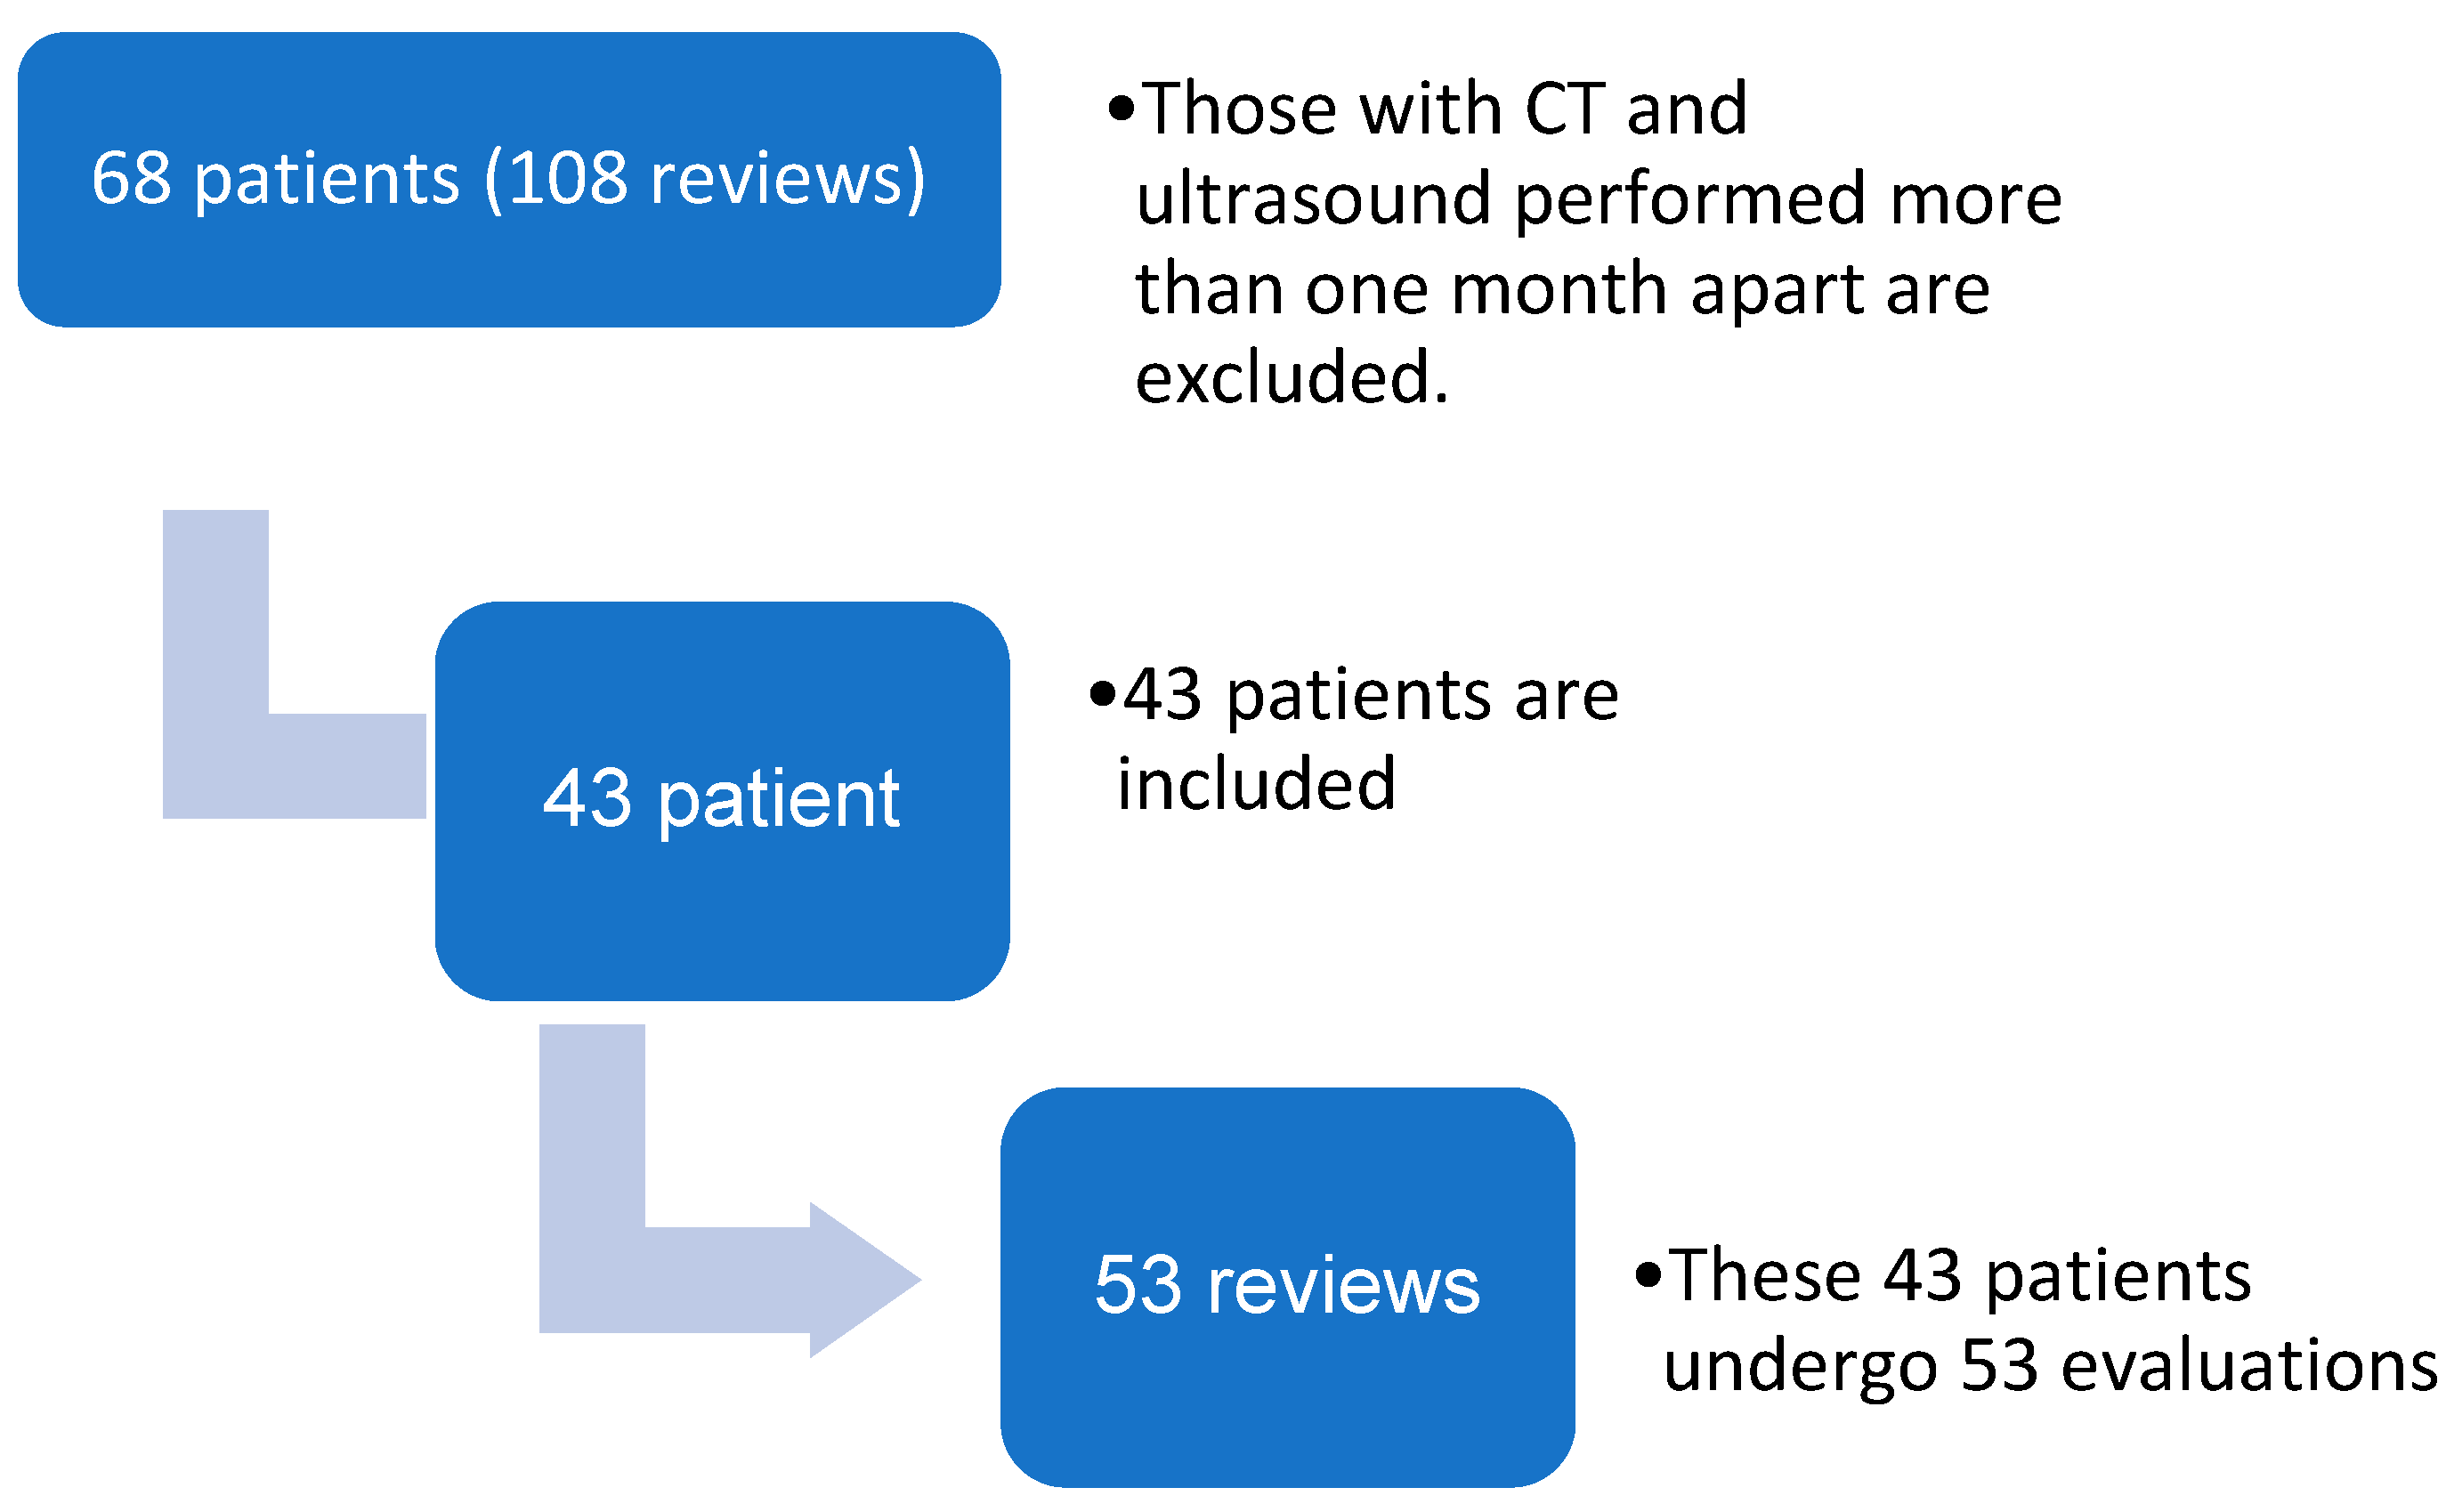
Figure 2.
According to GLIM criteria in 53 assessments.
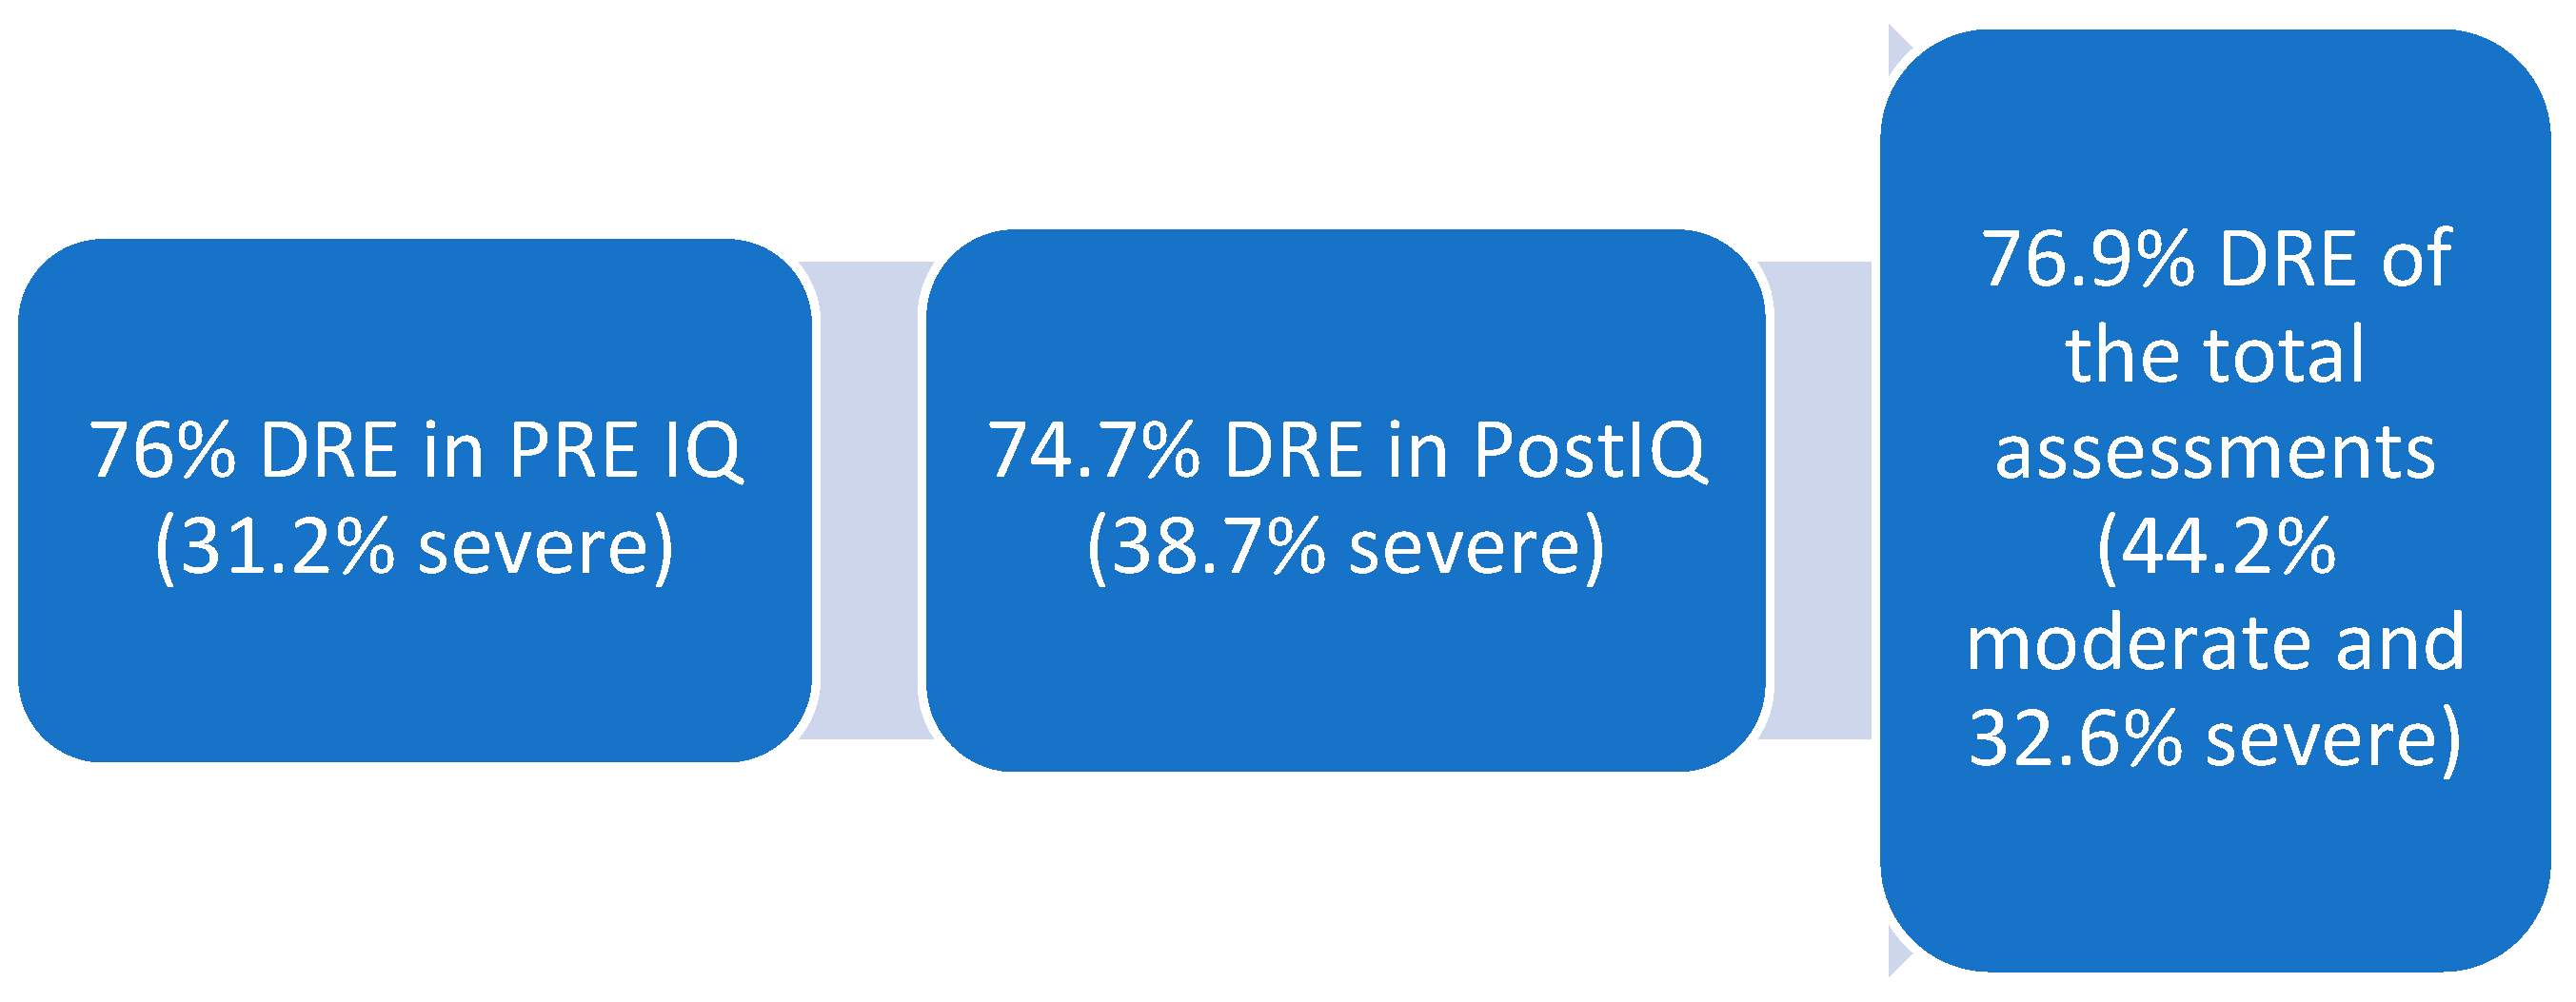
Figure 3.
ROC curves for SMI.
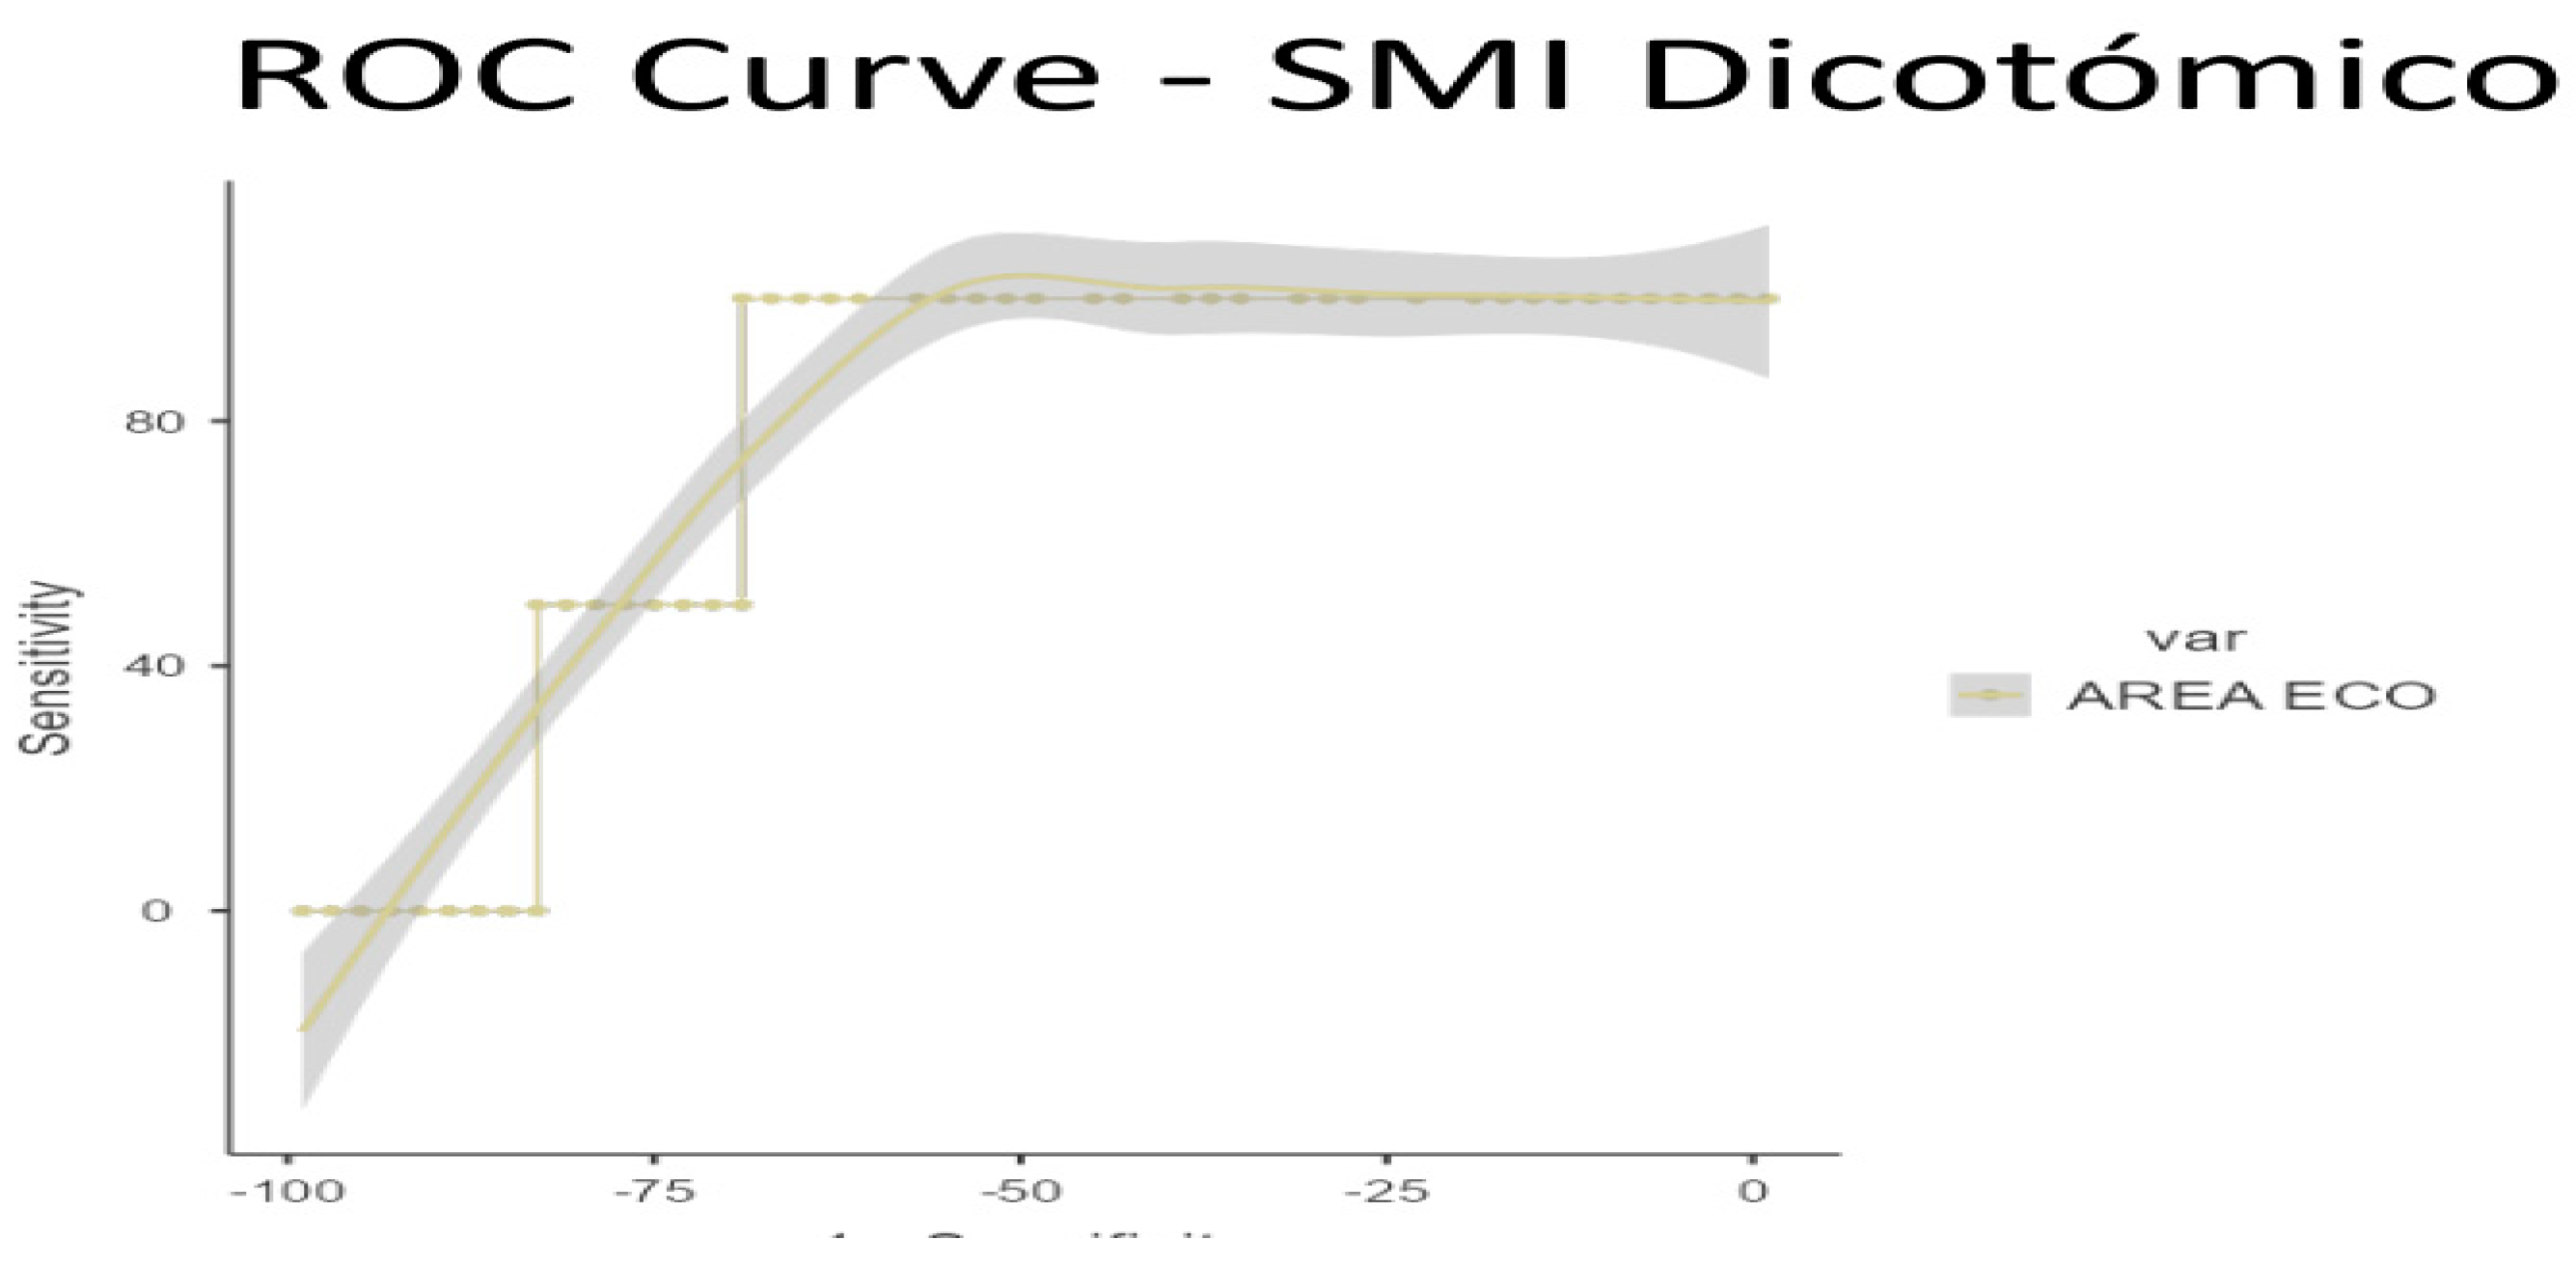
Figure 4.
ROC curves for PMI.
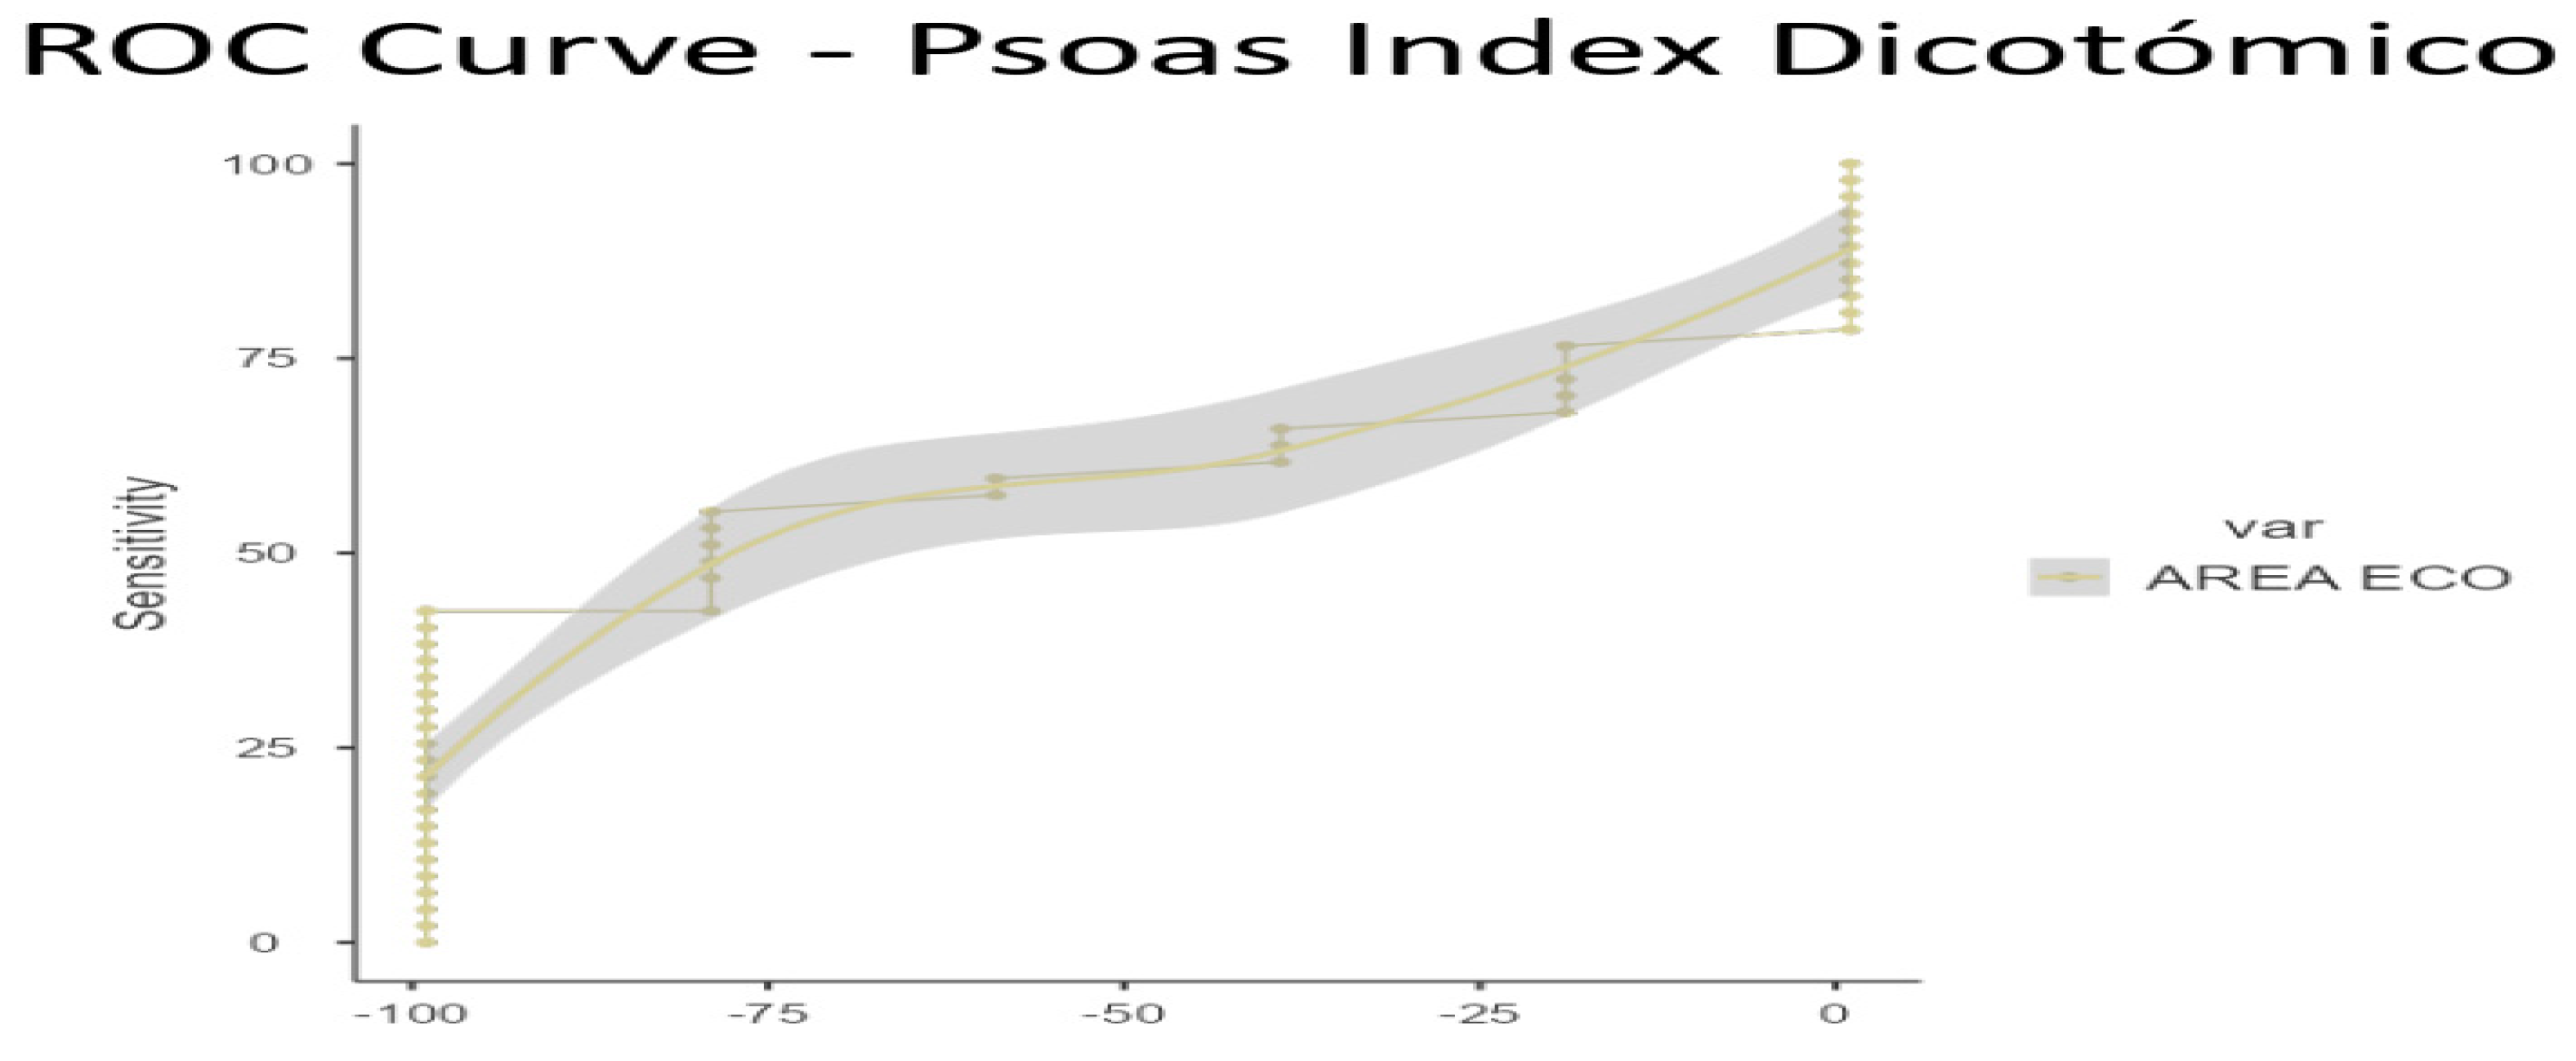
Figure 5.
ROC curves for SMI and sarcopenia.
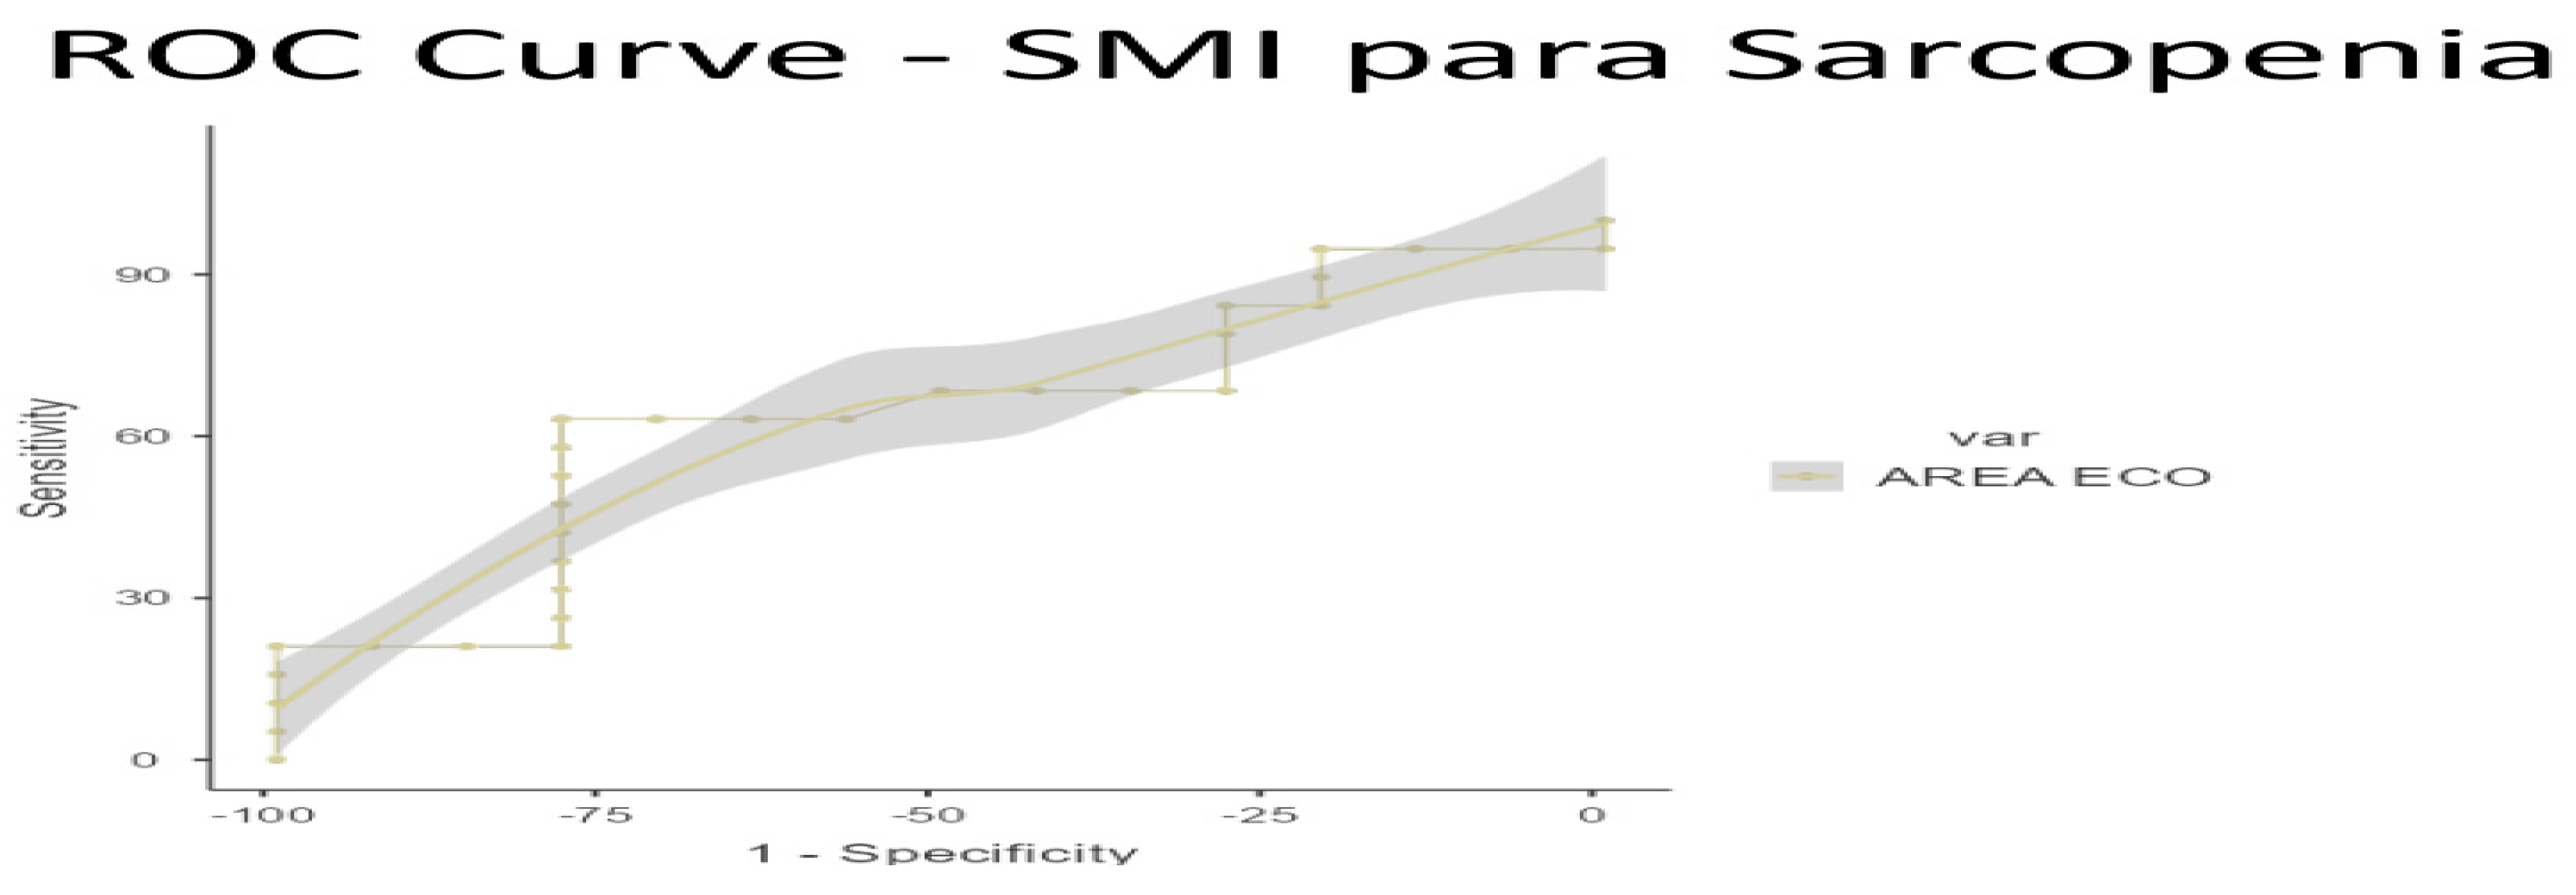
Figure 6.
ROC curves for SMI and sarcopenia.
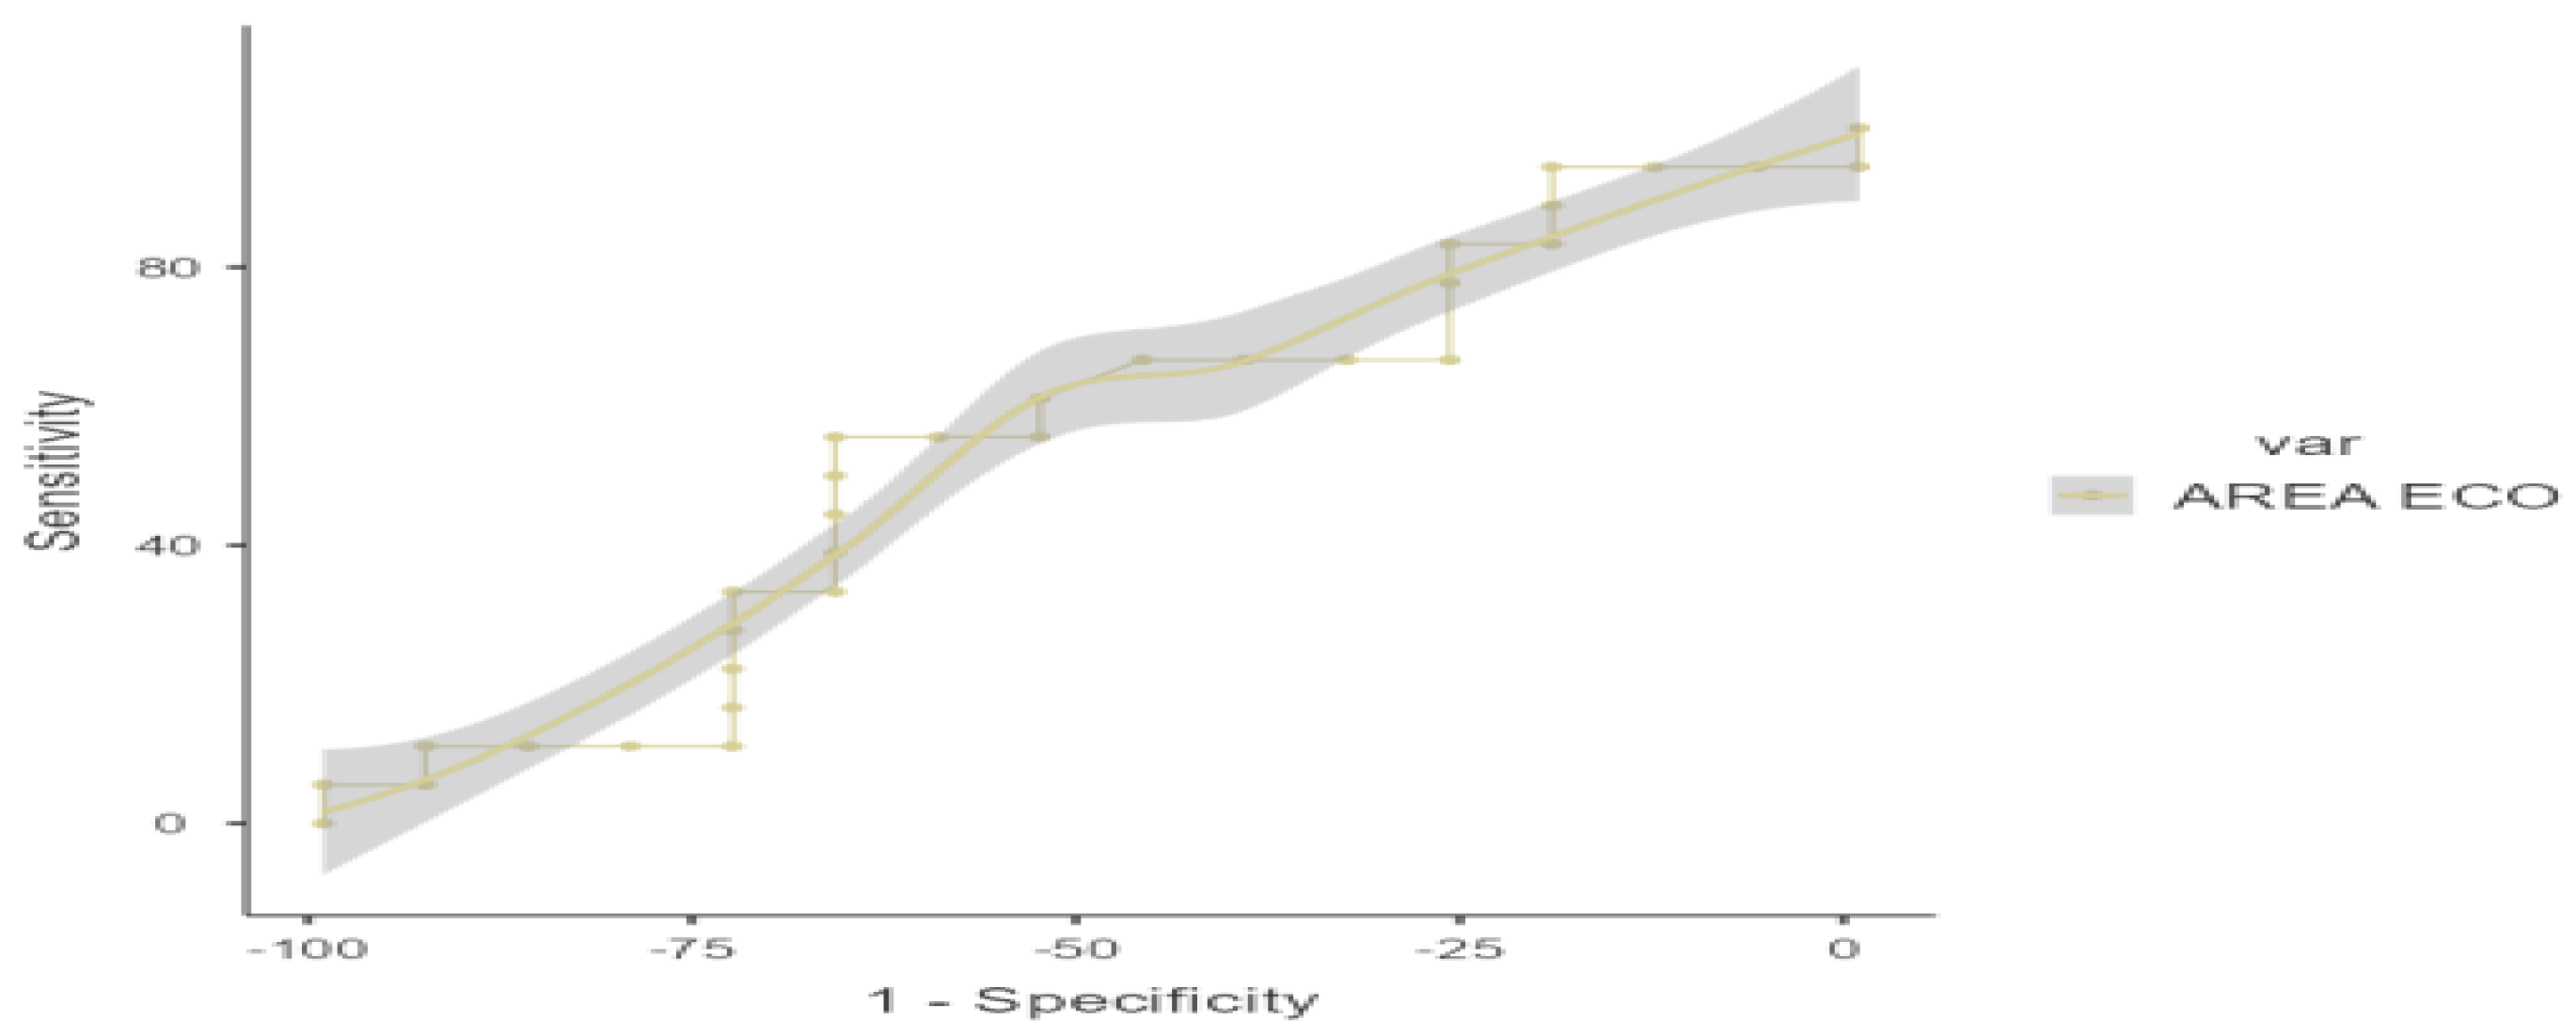
Figure 7.
CT cross section at L3. HU density PMI 70.
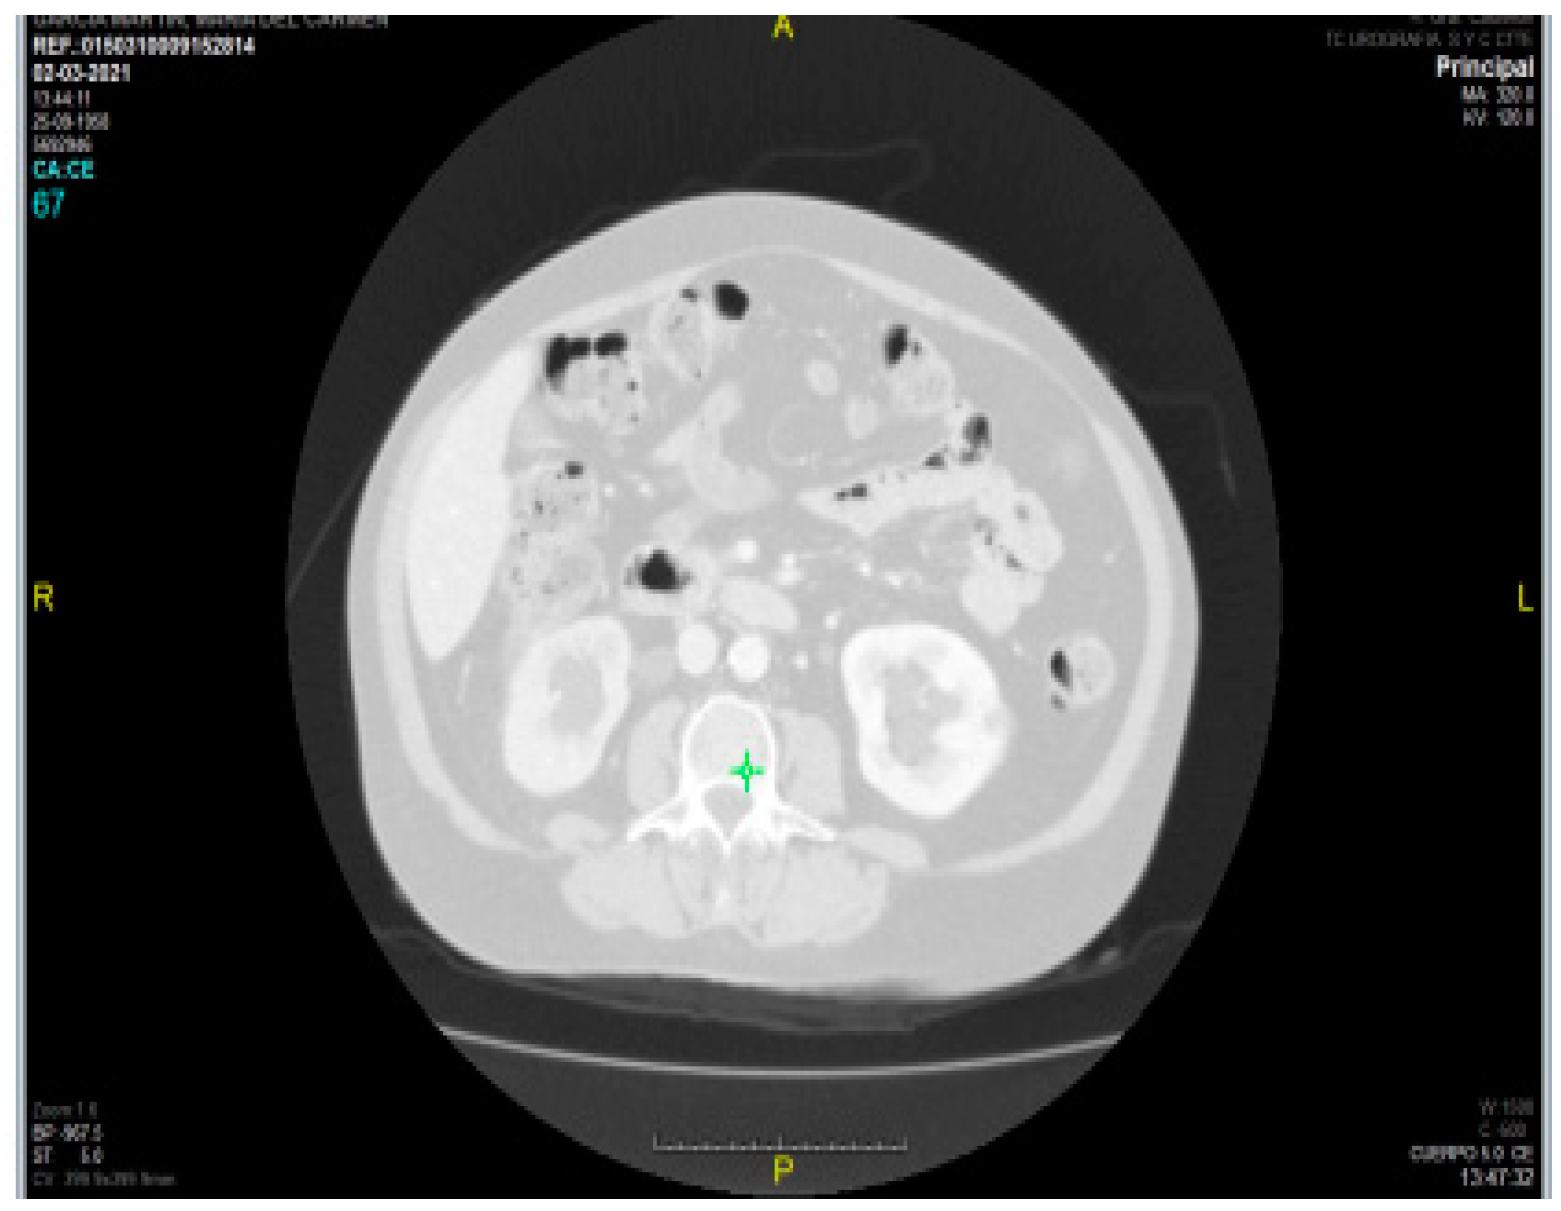
Figure 8.
Cross section in L3 Density HU PMI -52.
Table 1.
valuation type.
 |
Table 2.
type of pathology.
 |
Table 4.
Pearson correlation of ultrasound with SMI and PMI/height.
 |
Table 5.
AUC for RCFSA compared to SMI.
 |
Table 6.
AUC for RCFSA compared to PMI.
 |
Table 7.
AUC for sarcopenia according to SMI.
 |
Table 8.
AUC for sarcopenia according to PMI.
 |
 |
Disclaimer/Publisher’s Note: The statements, opinions and data contained in all publications are solely those of the individual author(s) and contributor(s) and not of MDPI and/or the editor(s). MDPI and/or the editor(s) disclaim responsibility for any injury to people or property resulting from any ideas, methods, instructions or products referred to in the content. |
© 2024 by the authors. Licensee MDPI, Basel, Switzerland. This article is an open access article distributed under the terms and conditions of the Creative Commons Attribution (CC BY) license (http://creativecommons.org/licenses/by/4.0/).
Copyright: This open access article is published under a Creative Commons CC BY 4.0 license, which permit the free download, distribution, and reuse, provided that the author and preprint are cited in any reuse.


