1. Introduction
Predicting the effect of temperature variations on the mechanical properties of steel under the operating conditions of mechanical elements and structural members is critical to diverse industrial applications. The characterization of the mechanical properties of the materials utilized in the industry under different temperature conditions has recently been reported in the literature [
1,
2,
3,
4].
The influence of temperature on the rate of deformation and distribution of force in the coated steels used in the automotive industry was reported at ranges between 500 °C and 850 °C [
1,
2]. Kim et al. [
3] reported on the mechanical properties of non-ferromagnetic alloys of titanium in high-temperature conditions of up to 500 °C, for applications in the aerospace industry. In addition, Shimamoto et al. [
4] developed and validated an experimental biaxial tension testing station capable of performing both dynamic and static tests at controlled temperatures different than room temperature conditions on cruciform aluminum specimens.
The methodology for the characterization of materials at constant temperatures above room temperature conditions requires keeping the temperature constant throughout the test. Therefore, multiple heating processes have been used to characterize materials under high-temperature conditions. Due to its ease of implementation, heating via electrical resistance, along with heating by electromagnetic induction, are two of the most commonly used processes for heating materials undergoing mechanical characterizing tests.
In general, the electrical resistance heating process consists in placing the specimen between two electrodes and heating it via the Joule effect [
5,
6]. However, this type of heating can cause temperature variations at various points in the specimen, resulting in non-uniform mechanical properties in the material [
7,
8]. Also, heating by induction is a heating process that can be both fast and uniform and is normally used for casting and heating materials [
9,
10,
11]. The energy efficiency of induction heating is, up to now, greater than that of other processes for heating ferromagnetic materials [
12,
13]. Due to its high-efficiency characteristics, speed, and uniform heating properties, this paper presents a study of a variety of parameters of the induction heating process on standard steel specimens for tensile tests.
Commonly, the diverse studies carried out for the characterization of the mechanical properties of different materials are performed at high temperatures – in the 500 °C to 900 °C range. Nevertheless, the influence of temperature on the mechanical properties of materials in the 100 °C to 500 °C range is not easily found in the literature. Thus, this paper proposes the analysis of the parameters of the induction heating process in the material within a low-temperature range (between 50 °C and 200 °C).
This research proposes a multi-objective optimization of the experimental process of induction heating in order to enable the maximization of temperature with a minimum current in the heating circuit. One of the most utilized strategies for determining the influence of factors that intervene in an experimental development is the Design of Experiments (DOE) [
14,
15,
16]. The results obtained through DOE have been utilized to generate response surfaces in a variety of experiments reported in the literature. In [
17], a numeric-experimental study was carried out to determine the behavior of dry sliding wear in aluminum-based hybrid metal matrix composites. In this study, various techniques were employed, such as DOE, ANOVA, and Response Surface, for the optimization of the wear resistance of the materials proposed. Additionally, [
18] involved the optimization of mechanical properties such as ultimate tensile strength, elastic limit, and elongation percentage in diverse materials under different temperature conditions (at ranges of 750 °C to 900 °C), using ANOVA and Response Surface Methodology. Lastly, with the response surface obtained based on the DOE results, a methodology can be implemented to determine the optimal points on said surface. Wang, et al. [
19] analyzed the principal factors affecting the non-uniform distribution of temperature in an induction heating system for pipe coatings using a Plackett-Burman design and the Response Surface method. For this analysis, they considered ten factors: current density; frequency; pipeline velocity; the thickness of dust accumulation on the pipeline; pipe diameter; pipe wall thickness; air space; coil length; coil thickness; and layer thickness. Despite the large number of factors considered in [
19], the surface response method implemented enabled them to optimize the significant factors in the process.
This work describes a DOE that considered both the building parameters of the inductor, such as its geometry and the separation from the material and the variation in power supply and the time that the circuit is active as design factors, in such a way that it is possible to control the heating temperature as an output variable for the experiments. Once developed, the DOE makes it possible to obtain different design points with which to construct a response surface. Then, optimization was carried out to maximize the temperature reached in the proposed induction heating process. Following the optimization process, standard tension ASTM A8 flat specimens were used to carry out the experiment. The results obtained from the analysis here described will determine the feasibility of implementing an optimal experimental system for future characterization of the mechanical properties of materials at the attained temperatures.
2. Theoretical Basis
The phenomenon of heating by induction can be described by the Maxwell equations related to electromagnetism. In an experimental context, if the experiment employs an electromotive force (EMF) capable of maintaining a difference in potential between two points on a device built from a conductive material, it is possible to achieve an electrical current capable of generating a magnetic field B. Thus, the magnetic field created can be intensified by conditioning the conductor in the form of a coil with multiple electrically isolated turns [
20]. All electromagnetic phenomena can be related using the Maxwell equations, shown below.
Equation (1) is Gauss’ law for electricity, which relates electrical charge q and electrical field E, which passes over surface S, where is the electrical permittivity in vacuum conditions. Equation (2) is Gauss’ law for magnetism, which partially describes the behavior of magnetic field B moving over surface S. Equation (3) is Faraday’s law of induction, which relates the electrical effect of the flow of magnetic field with the electric field moving along a given length l of the medium. Lastly, equation (4) is Ampere’s law, which describes the magnetic effect of electric fields or variable currents on the medium, where is the magnetic permeability of the vacuum and is the flow of the electric field.
Thus, if a coil-type conductor is made to circulate an electric current, it generates a magnetic field whose amplitude and distribution may also be expressed by Ampere’s law [
17].
where N is the number of turns in the coil, I is the current circulating through the coil, and
H is the magnetic field. In the case of an alternating current acting on the coil, the Faraday-Maxwell equation can be used, which tells us that a variable magnetic field is induced in time, which as a consequence also generates an
EMF (
) on the conductor exposed to said field. The value
can be determined with the following relation:
In addition, in the interior of the piece to be heated through electromagnetic induction, an induced current is generated, also known as Foucault current, represented as
, which is responsible for creating the Joule effect and can be expressed as:
where P is the amount of heat expressed in joules (J) and
is the electrical resistance of the conductor. Thus, the generation of heat and the depth
to which the piece is to be heated can be controlled, and it is estimated with:
where
is the electrical resistivity of the material, f is the frequency of the alternating current in the coil,
is the vacuum magnetic permeability, and
is the relative magnetic permeability of the material. Using the equations described, it is possible to model mathematically the induction heating process in a ferromagnetic material. The procedure followed for the development of the Design of Experiments implemented in this work is described in the following section.
3. Materials and Methods
This work was based on a 2
K factor design of experiments involving five design factors.
Table 1 shows the factors and levels implemented in the study. The number of factors and levels proposed demanded an initial set of 32 experimental sets. In order to achieve statistical significance, each set considered three replicas using a completely randomized design, resulting in a set of 96 experiments in total.
Table 2 gives an example of the randomized order used for the experiments for one of the replicas using Yates’ notation.
In order to carry out the experiments, eight different coils were constructed using the varying geometrical construction parameters at the levels shown in
Table 1. The coils consisted of spirals of between 5 and 10 turns. Thus, for this study oval coils were manufactured, with values at the large axle (LA) and small axle (
sa) of 69.85 mm and 27.94 mm, respectively, for the “High (+)” level coil size, while the “Low (-)” level coil size had measurements of LA 58.42 mm and
sa 17.018 mm. The coils were made using 12-gauge copper wire, while a consistent value was maintained for the separation of turns parameter using ABS spacers to keep both 3mm and 6mm distances.
The characterization of the coils proposed was done by applying a voltage supply, to the induction heating device, of 5 and 10 volts while measuring the power consumed by the circuit in vacuum and under charging conditions. The induction heating circuit is a mini ZVS plate with a range of 5 to 12 V and with maximum current consumption of 6 A. The supply to the heating circuit was provided via a BK Precision® power supply with operating ranges of 0-32 V and 0-6 A. To generate the charge to the circuit, a carbon steel specimen of standard dimensions for the tension test in accordance with ASTM E8 standards was introduced.
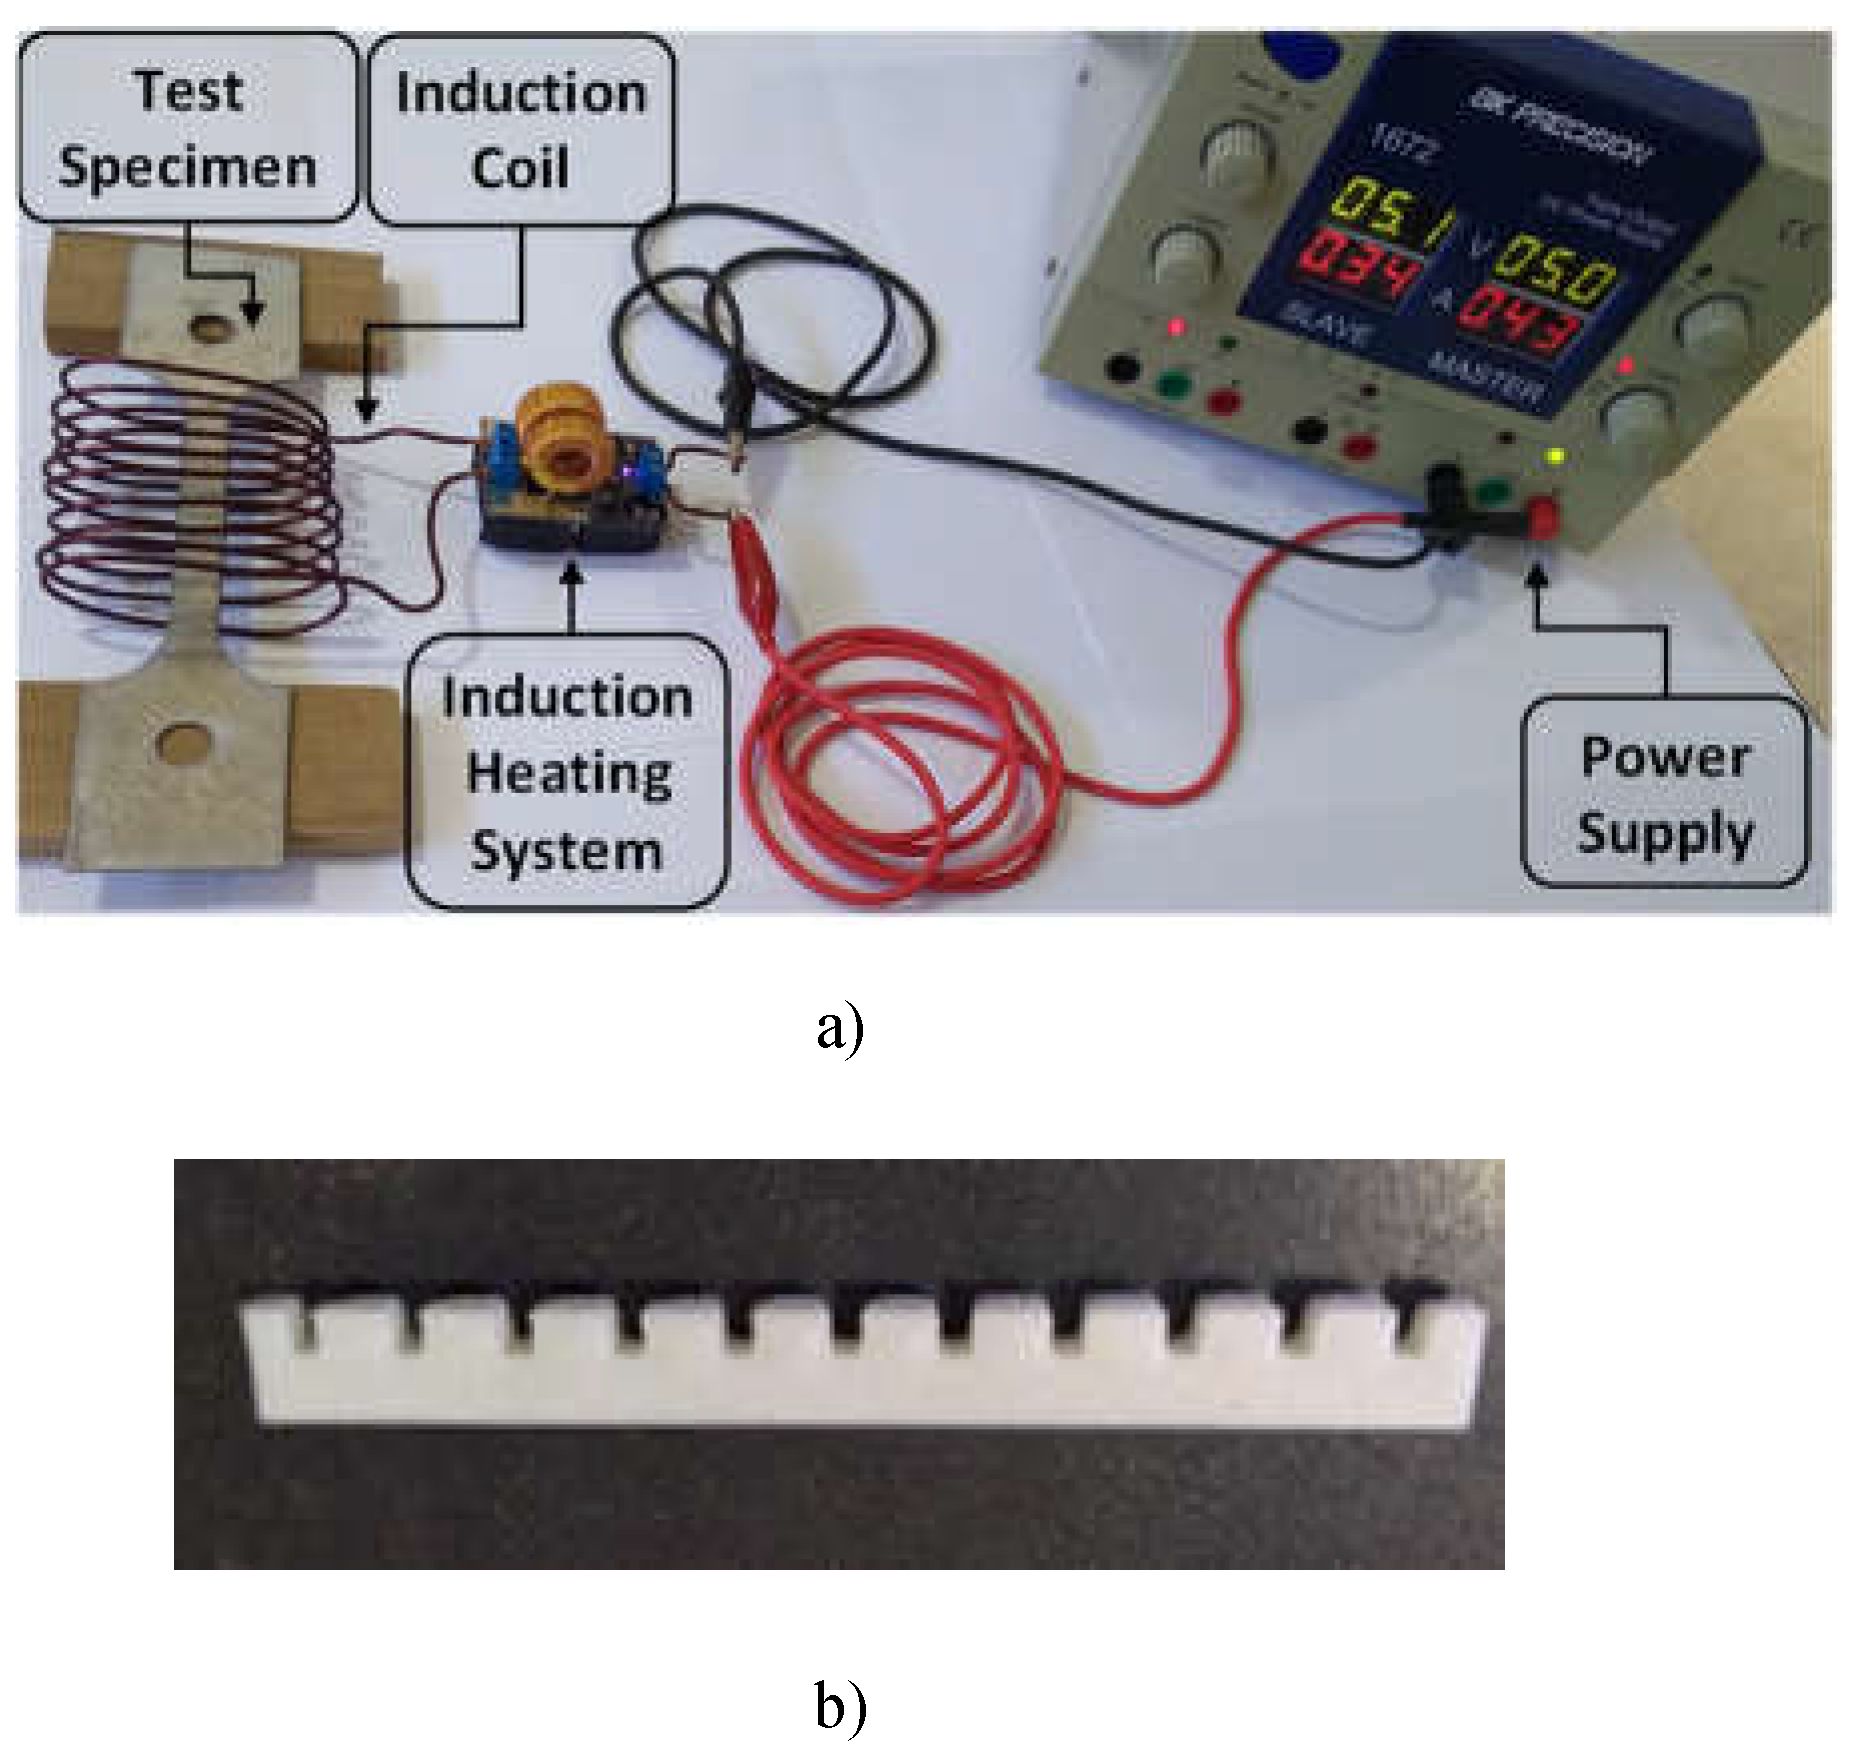
Figure 1a) shows the experimental system, including one of the coils built for the proposed study, while
Figure 1b) illustrates one of the spacers used for the construction of the coils.
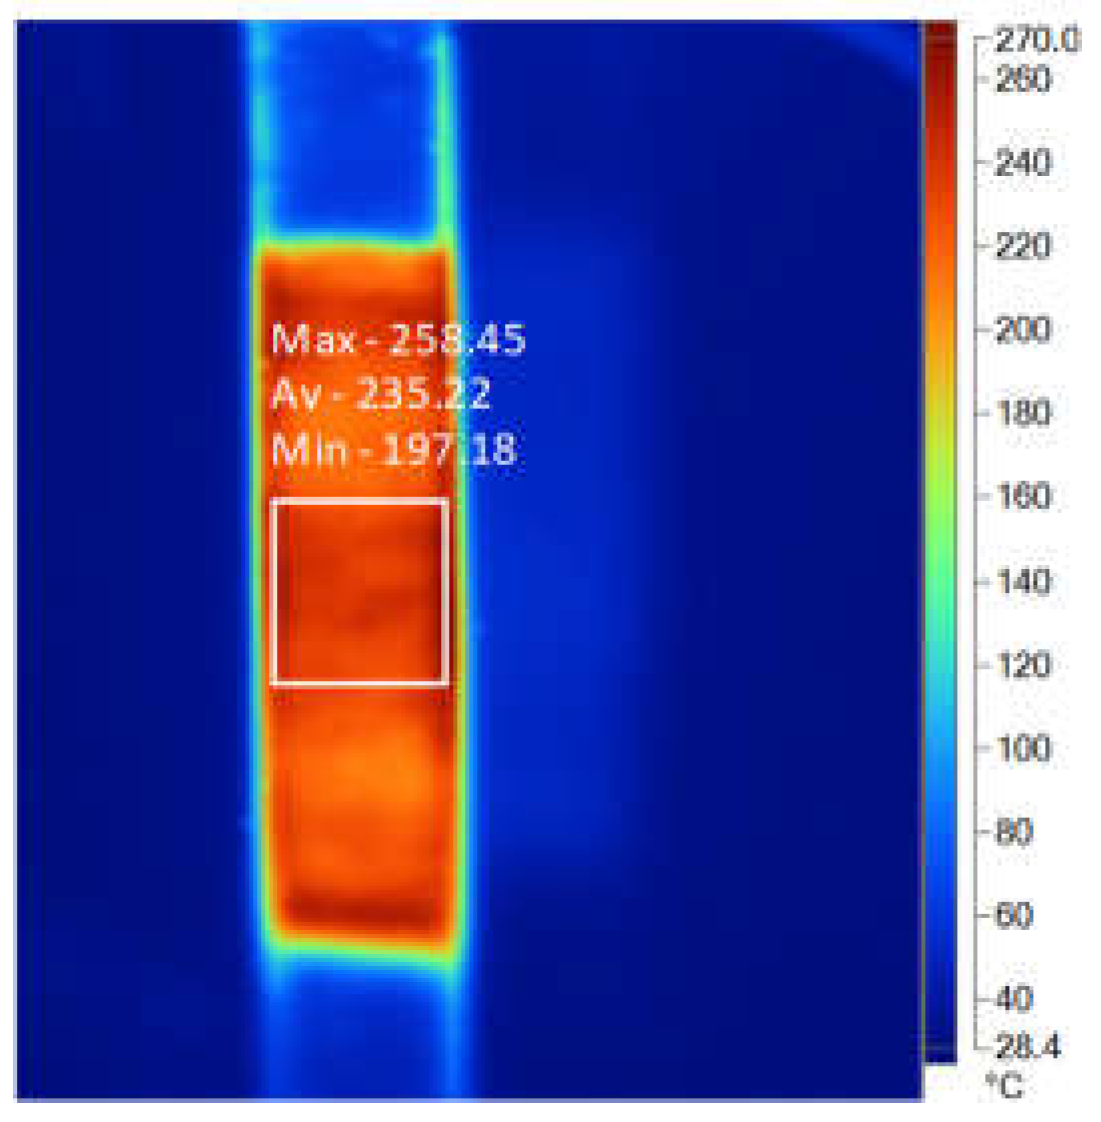
The specimen temperature was monitored on two moments while testing: at 30 seconds from the start of the test and then after 60 seconds of heating. In order to determine the temperature reached in the test sample, thermographic images were taken using a Fluke TI10 camera, which shows the distribution of temperature along the calibrated surface of the specimen (see
Figure 2). In each of the thermographic images obtained, the minimum and maximum temperatures of the specimen were determined. In addition, an estimation, of the average temperatures, was made using the software of the thermographic camera (see
Figure 2). The temperatures obtained with the initial values of each proposed factor will be used to perform an optimization process in which the optimal candidates will be obtained, to generate the required temperatures in the samples. This optimization process is described in the following section.
Optimization Process of the Induction Heating System Parameter
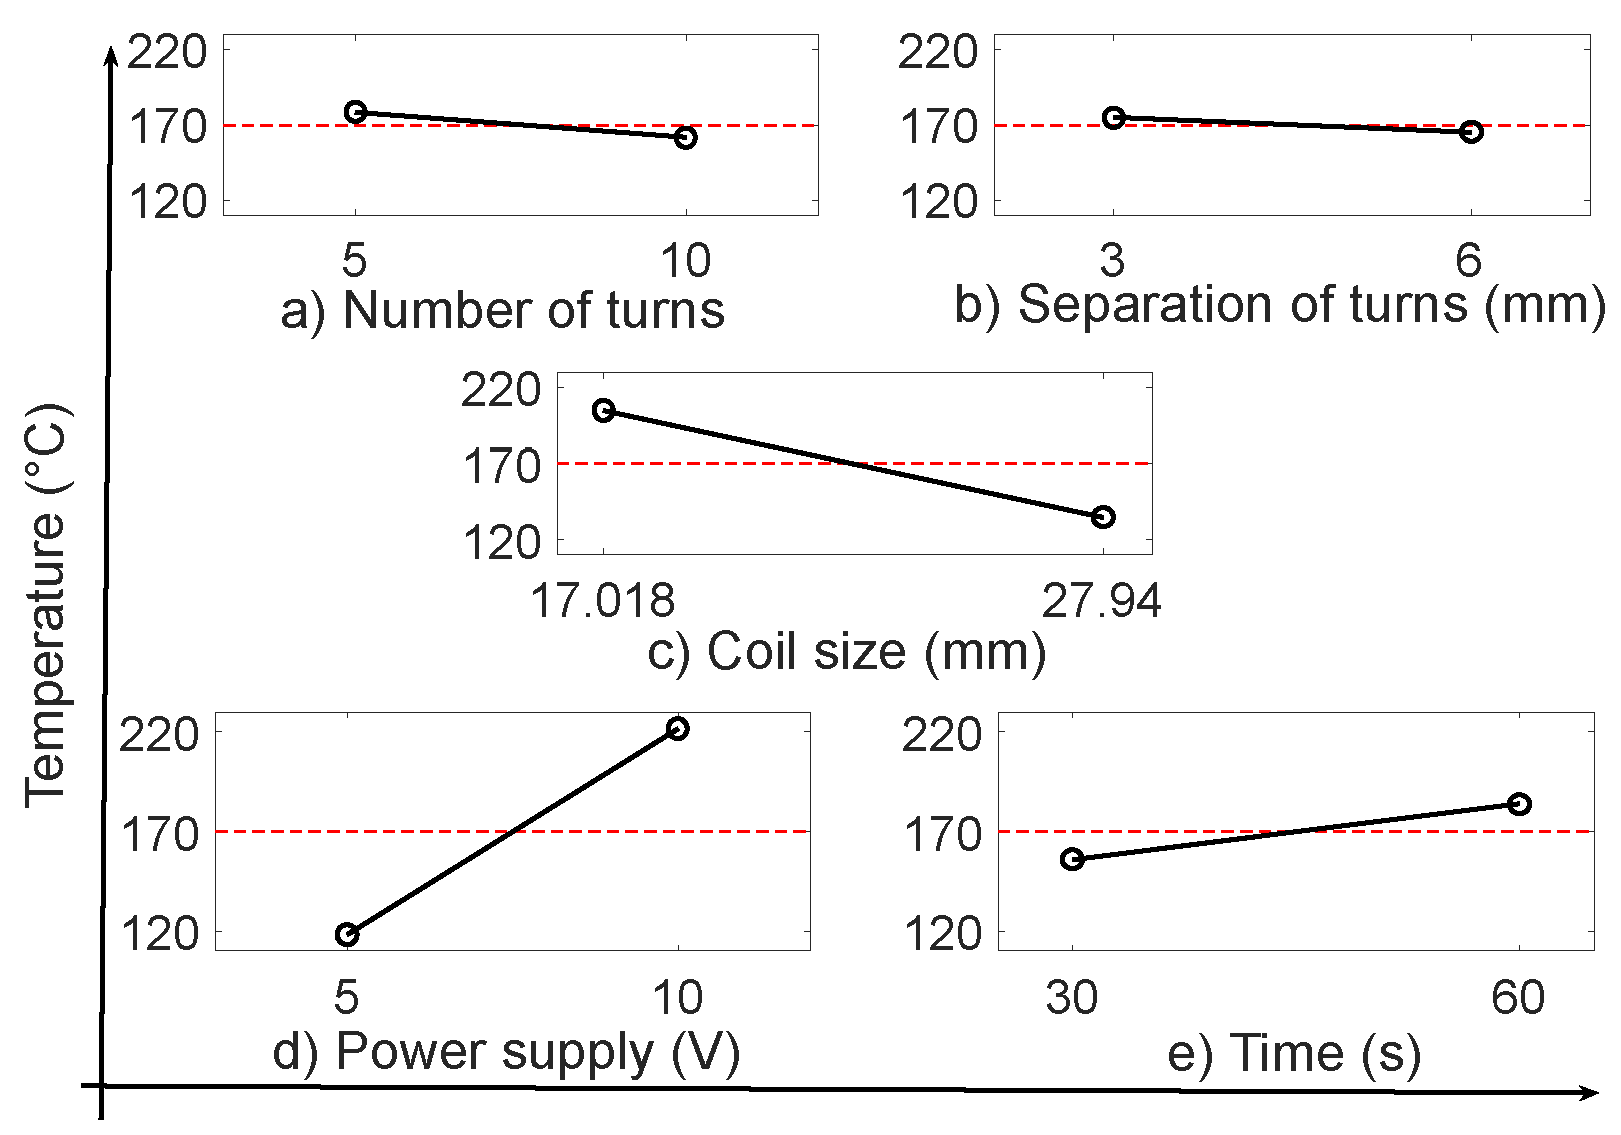
Based on the results obtained from the initial set of proposed experiments, an analysis was performed of the principal effects in order to determine the effect each factor had on the desired outcome. Based on this analysis, it was determined that the variables that increase positively the output temperature are supply and time, while the variables that cause a decrease in temperature relate to the number of turns, the separation of these, and the size of the coil (see
Figure 3).
In
Figure 3, the dotted horizontal line indicates where the points should be located if the effects of the factors considered were null. As can be seen, none of the factors considered has a null effect, meaning that it is necessary to analyze which of them are significant for the outcome of the experiments.
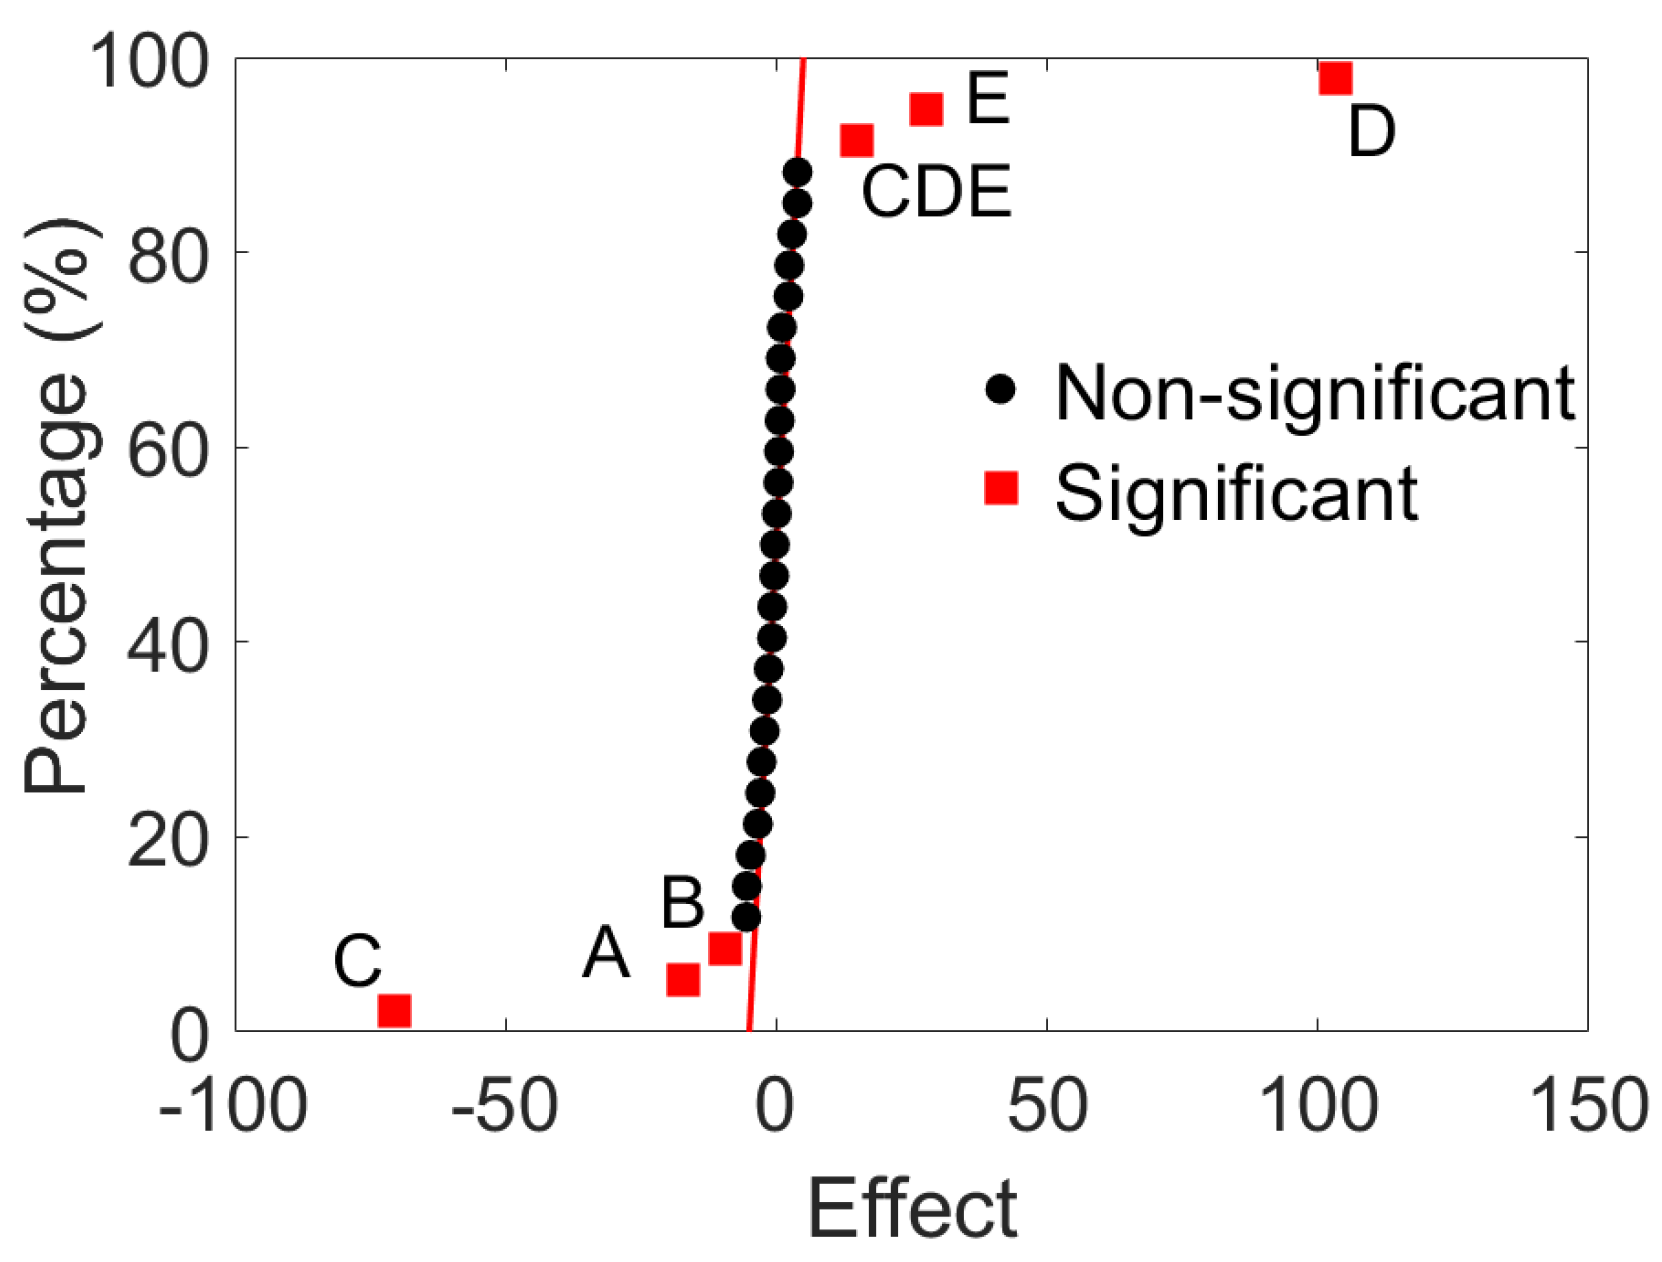
Figure 4 shows a normal effects chart, used to determine which effects and interactions are statistically significant to 95% of output. On the same graph, the further from the dotted line the effects are, the more significant they will be. In addition, the factors with values below zero have a negative effect on the temperature output, while those greater than zero have a positive effect. Lastly, the dotted line represents the position at which the points ought to be located if the effects of the factors and the interactions considered were null.
Figure 4 also marks the statistically significant factors, together with the interactions between the variables with a value
p under 0.05. The significant factors, ordered from greater to lesser, are power supply, coil size, time, number of turns, and separation of turns.
Additionally, the double interactions of the factors implemented in the experiment are significant too. However, there are non-significant interactions between the variables number of turns-separation of turns, number of turns-coil size, separation of turns-coil size, and number of turns-power supply. Neither do the remaining combinations of two, three, four, and five variables demonstrate significant interactions. This holds for all with the exception of the triple interaction between coil size, power supply, and exposure time, which does have a significant impact on output.
Taking into account the fact that, individually, each of the factors at the levels proposed turned out to be significant in terms of output in the experiments, the experimental results obtained previously were used to generate response surfaces for the proposed outputs. These response surfaces were generated using the Kriging interpolation method that is integrated into the Ansys Finite Element software. This method was developed around 1950 by Danie Krige as a technique to optimize mineral extraction and is considered as a statistical type technique applied for spatial interpolation whose objective is to estimate unknown values at specific locations based on known values of surrounding points. The Kriging interpolation method assumes that the underlying data can be modeled as a Gaussian process, characterized by a mean function and a covariance function. The covariance function, often referred to as a variogram, quantifies the degree of spatial dependence between data points. The major advantage of the Kriging technique over many classical statistical procedures is that Kriging incorporates the spatial correlation of the data, while the other classical statistical procedures do not. Another major advantage of Kriging over other techniques is its ability to quantify the variance of the estimate, which will allow defining the precision of the resulting estimates [
21]. This method is usually applied in environmental sciences, geology and even finance, however, its use has been generalized to other engineering fields such as studying the reliability of the wire bonding structure of the power electronic module [
22]. In this study, the Finite Element Method was applied to the analysis of electrothermal structural fatigue damage in the debonding failure of the cable joint of a power electronics module. The Kriging interpolation method and the Finite Element Method were also applied in dental implant problems involving the prediction of micromotions [
23].
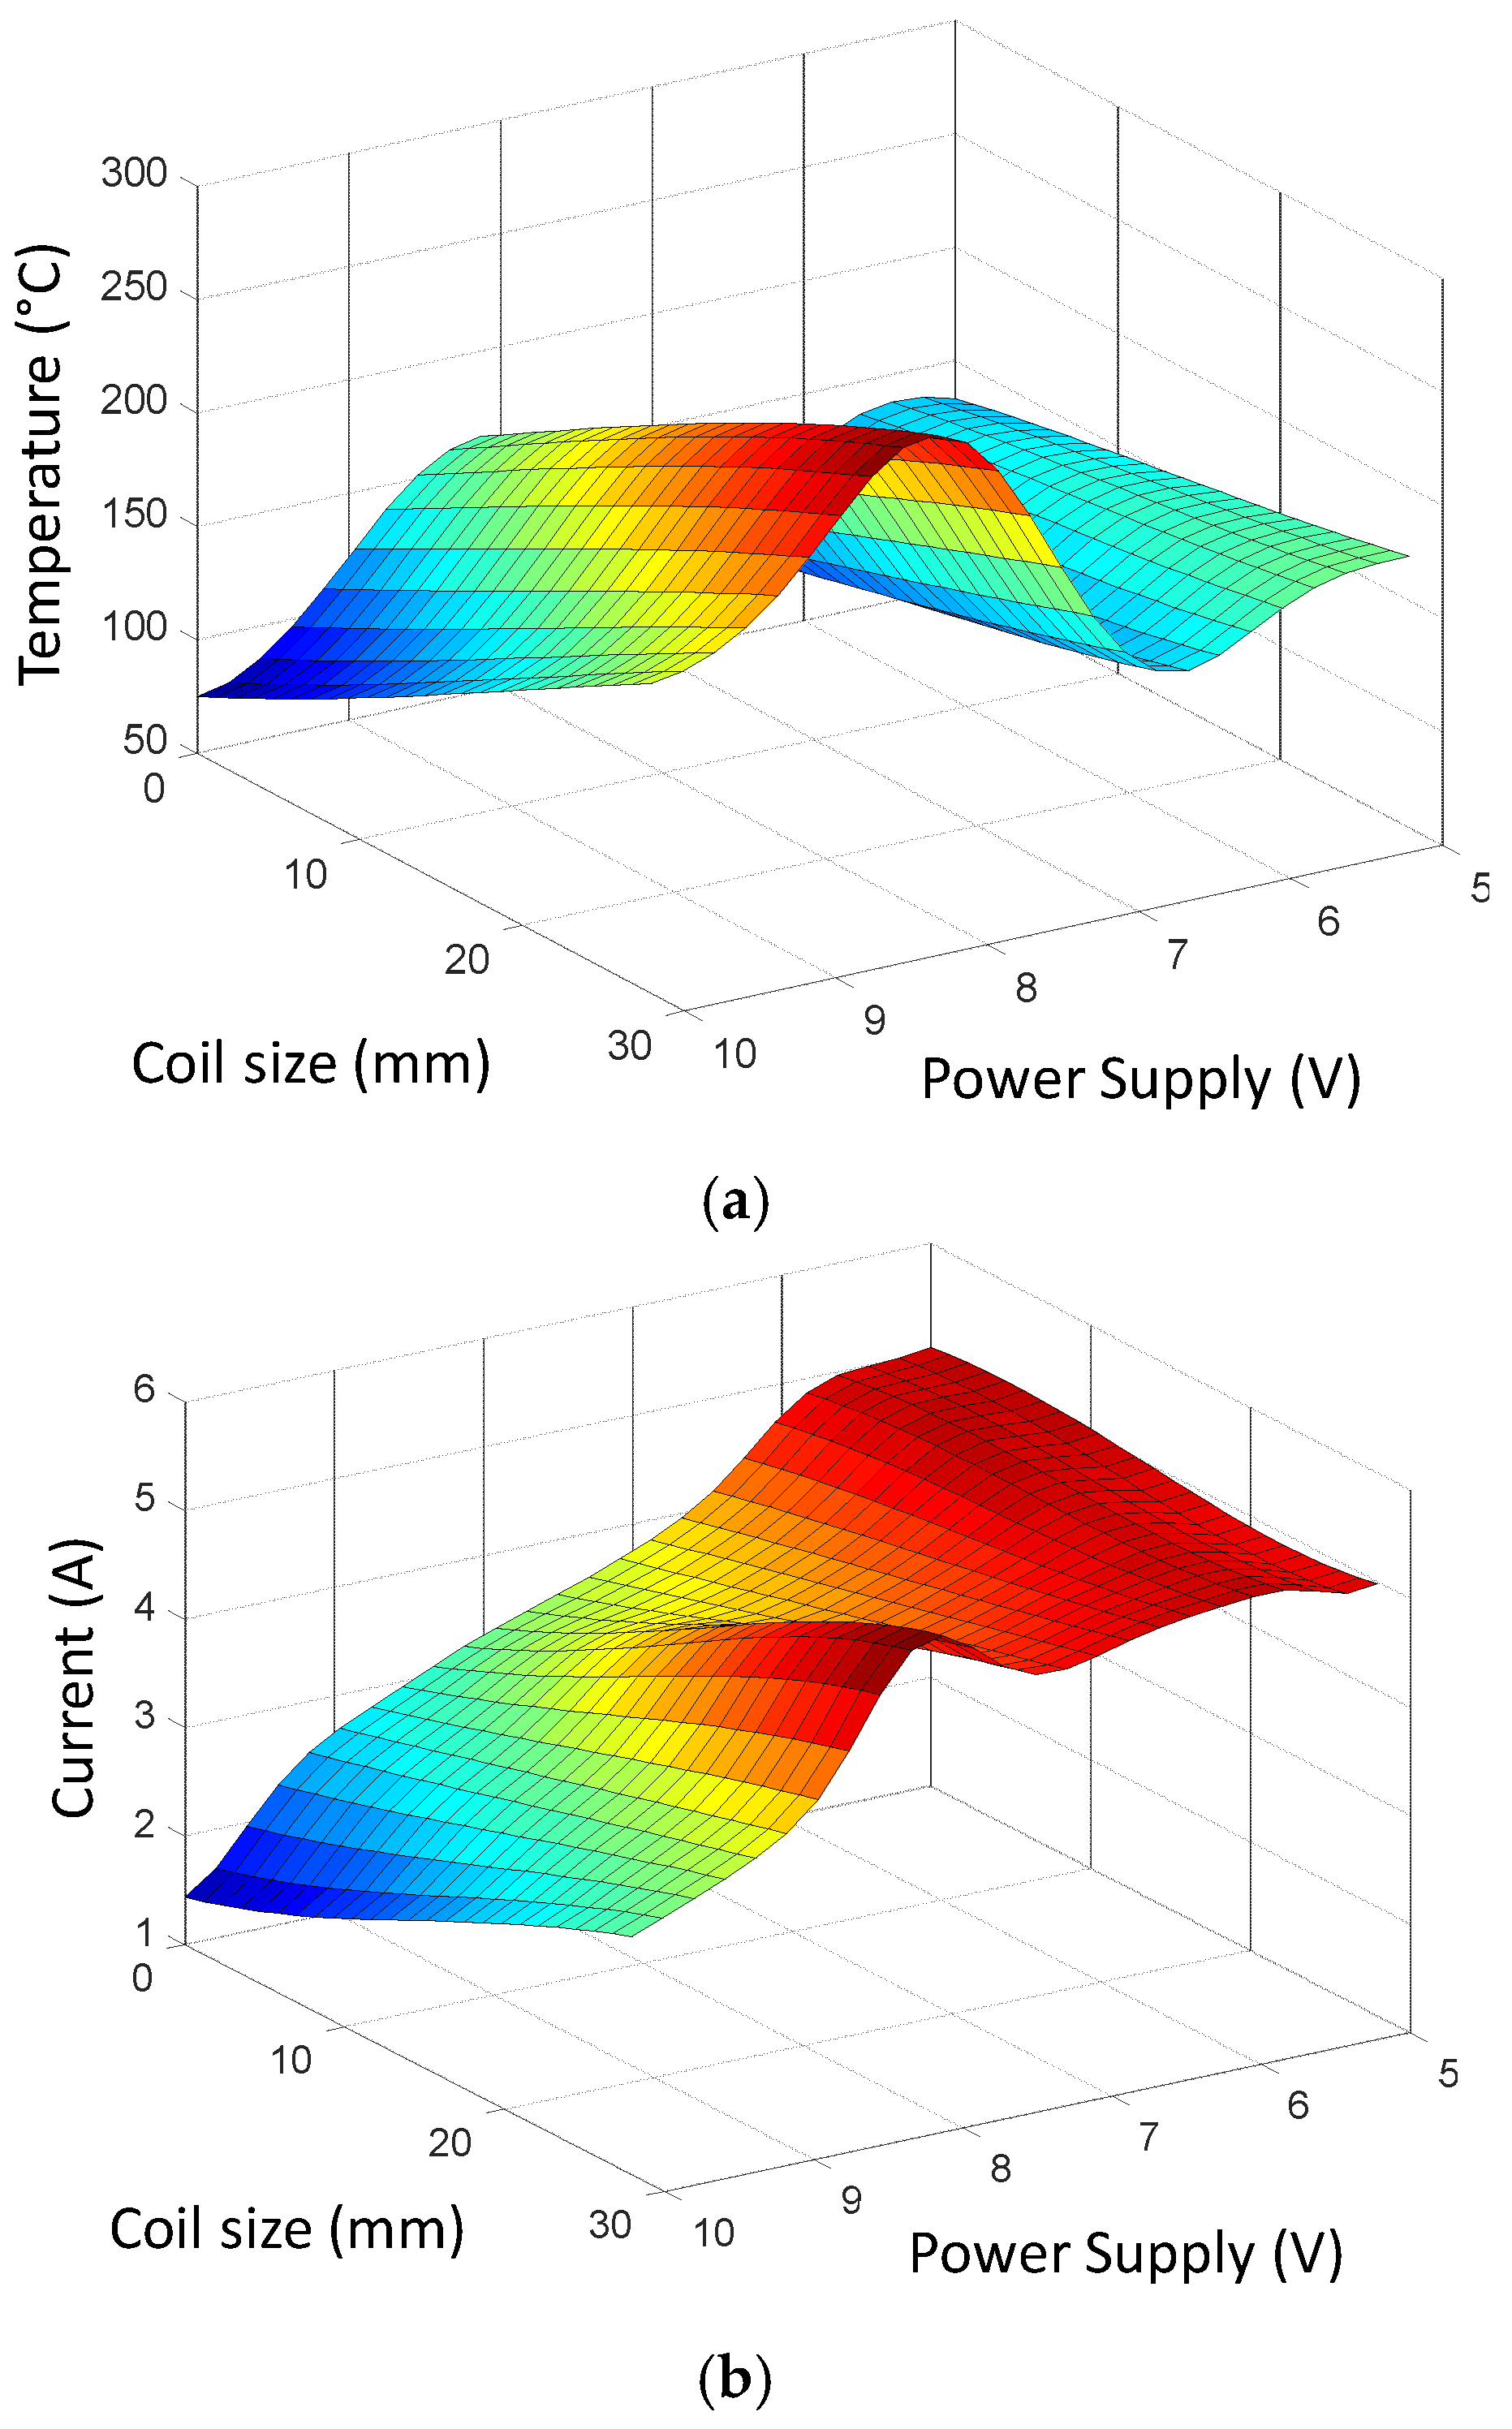
Figure 5 shows examples of response surfaces, based on factors proposed for Coil Size and Circuit Supply, for both the output of the temperature achieved (
Figure 5a) as well as for the consumption of current by the circuit (
Figure 5b).
Based on the response surfaces generated, three optimal candidates for the heating process were identified and are listed in
Table 3. The multi-objective optimization was achieved by means of the goal-directed optimization method.
To develop the experimental tests with optimal parameters, it was decided to build and test only Candidate 1. The selection criterion for the optimal candidate was based on the highest temperature achieved, as the current consumption of all three candidates was within the functioning range of the heating circuit. The results obtained with the coil constructed according to the optimal parameters are described in the next section.
4. Results and Discussion
The results of the experimental tests with the optimum settings were obtained considering the parameters for Candidate 1 shown in
Table 3. The coil size was 21.4 mm, with 5.37 turns separated by approximately 3.96 mm. In addition, the circuit supply was 9.88 volts, with a heating time of 49 seconds.
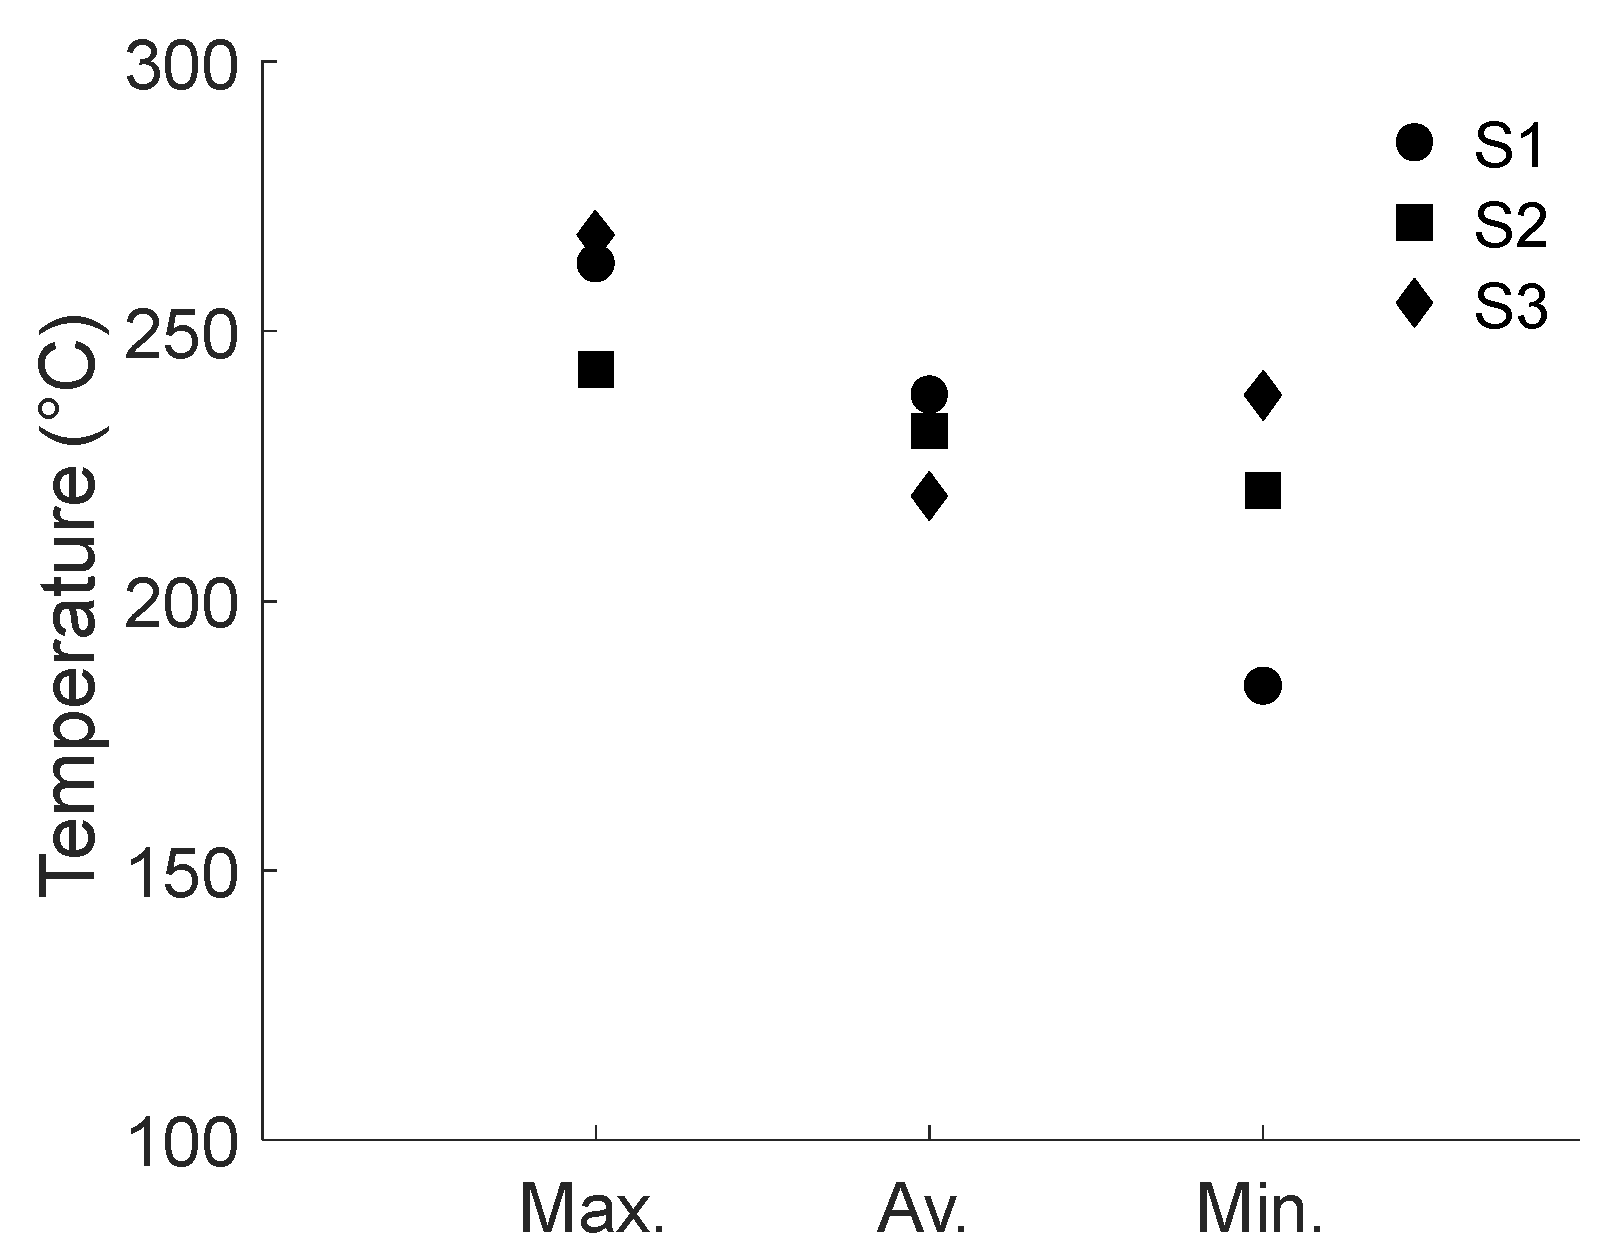
Table 4 shows the maximum, minimum, and average temperatures achieved through heating the 3 different test samples using the parameters from Candidate 1.
The data shown in
Table 4 was used to create
Figure 6, which shows the maximum, minimum, and average variations in the heating of the three test samples using the optimal parameters generated. As can be seen, at least for two of the specimens, the values for maximum, minimum, and average temperatures are similar. In addition, the maximum difference between the temperatures measured is given by the minimum estimated temperatures, and it is about 37 °C. It is worth noting that the variations obtained for the temperature values could be due to the fact that the values shown in
Table 4 depend, as shown in
Figure 2, on the temperature area selected on the thermographic image.
Based on the results shown in
Figure 6, it was determined that the average value of the estimated temperatures can be used to make a comparison with the value obtained via the optimization process.
Table 3 shows that the selected optimal candidate (Candidate 1) had an estimated temperature of 245.28 °C, while the average of the temperatures experimentally measured, with the same parameters as Candidate 1, was 235.94 °C. These results produce an error of 4% between the estimated temperature for the optimal candidate in the optimization process and the average temperature of the values measured in the experiments with three different test samples, with consumption of current within the working range of the circuit. This demonstrates that the experimental application of the optimal parameters obtained from the analysis of the generated response surfaces agrees tightly with the output estimation of the optimization process. The conclusions from this study are presented below.
5. Conclusions
This research work involved the analysis of the induction heating process in carbon steel specimens. The purpose of this analysis was to determine the geometric design parameters of heating coils and the appropriate power supply values that would enable the optimization of the said heating process.
In order to carry out this work, the proposal was made for a DOE with initial (non-optimal) construction factors for various heating coils, varying the determined geometric parameters, as well as the power supply to the heating circuit and the amount of time that the tests samples were exposed to the induction heating process. Following this, with the results initially produced, various statistical analyses were performed in order to determine the principal factors and the significant effects and interactions of the selected factors that would affect output parameters. The values obtained from the first set of experiments enabled the generation of different response surfaces that were implemented for the purpose of carrying out a multi-objective optimization process. Based on this process, an estimation was made of the parameters of three optimal candidates, one of which was chosen by giving priority to the candidate that reached a higher temperature within the range of the current consumption of the heating circuit. With the parameters of the candidate selected, a new experimental coil was constructed, and this was used to carry out various heating tests, taking into account the supply values and exposure times for the selected candidate. Lastly, the experimental results obtained with the optimal parameter set produced a variation of 4% with respect to the values derived from the optimization process.
Based on these results, it is possible to determine the optimal design for the coil to be used, along with the supply parameters for the heating circuit and the exposure time needed for the specimens to reach a maximum temperature with a current consumption within the functional range of the circuit implemented. The results of the analysis carried out in this research project provide the groundwork for future work into the characterization of the mechanical properties of ferrous materials under conditions of different constant temperature values that differ from room temperature.
Author Contributions
Conceptualization and writing, Pablo Alberto Limón.; Analysis and writing, Antonio de Jesús Balvantín.; State of the art, Armando Ambrosio López; Proofreading and editing, Rafael Alfonso Figueroa.; Research, Pablo Alberto Limón; Supervision, Antonio de Jesús Balvantín and Eusebio Jiménez.; Analysis and editing, Eusebio Jiménez and Pablo Alberto Limón. All authors have read and agreed to the published version of the manuscript.
Funding
This research received no external funding.
Acknowledgments
The authors of this paper are grateful for the support provided by the Instituto Tecnológico de Sonora, Universidad de Guanajuato and Universidad Tecnológica del sur de Sonora, for the realization of this research.
References
- Fan, D. W.; Kim, H. S.; Birosca, S.; De Cooman, B. C. Critical review of hot stamping technology for automotive steels. Proc. from the Materials Science & Technology Conference MS&T 2007, Sept.16-20, Detroit, Michigan. 2007, pp.1-18.
- Taylor, T. A.; Clough, A. Critical review of automotive hot-stamped sheet steel from an industrial perspective. J. Mater. Sci. Technol., 2018, 34(7): 809-861. [CrossRef]
- Kim, J.; Kim, K. H.; Kwon, D. Evaluation of high-temperature tensile properties of Ti-6Al-4V using instrumented indentation testing. Met. Mater. Int., 2016, 22(2): 209-215. [CrossRef]
- Shimamoto, A.; Shimomura, T.; Nam, J. H. (2003). The development of a servo dynamic biaxial loading device. Key Eng. Mater., 2003, 243: 99-104. [CrossRef]
- Mori, K., Maki, S., & Tanaka, Y. Warm and hot stamping of ultra high tensile strength steel sheets using resistance heating. CIRP annals, 2005, 54(1): 209-212. [CrossRef]
- Sun, Y.; Wang, K.; Politis, D. J.; Chen, G.; Wang, L. An experimental investigation on the ductility and post-form strength of a martensitic steel in a novel warm stamping process, J. Mater. Process. Technol., 2020, 275, 116387. [CrossRef]
- Kolleck, R.; Veit, R.; Hofmann, H.; Lenze, F. J. Alternative heating concepts for hot sheet metal forming. In 1st Unternational Cinference on Hot Metal Forming of High-Performance Steel. Kassel, Germany, 2008, pp. 239-246.
- Behrens, B. A.; Hübner, S.; Demir, M. Conductive heating system for hot sheet metal forming. In Proceedings of 1st International Conference on Hot Sheet Metal Forming of High-Performance Steel. Kassel, Germany, October 22-24, 2008, pp. 63-68.
- Merklein, M.; Wieland, M.; Lechner, M.; Bruschi, S.; Ghiotti, A. Hot stamping of boron steel sheets with tailored properties: a review. J. Mater. Process. Technol., 2016, 228: 11-24. [CrossRef]
- Francesco, G.; Giuseppina, A.; Luigino, F. Incremental forming with local induction heating on materials with magnetic and non-magnetic properties. Procedia Eng., 2017, 183: 143-148. [CrossRef]
- Kim, D. K.; Woo, Y. Y.; Park, K. S.; Sim, W. J.; Moon, Y. H. Advanced induction heating system for hot stamping. Int. J. Adv. Manuf. Tech., 2018, 99(1): 583-593. [CrossRef]
- Nishibata, T.; Kojima, N. Effect of quenching rate on hardness and microstructure of hot-stamped steel. J. Alloys Compd., 2013, 577: S549-S554. [CrossRef]
- Bok, H. H.; Choi, J.; Barlat, F.; Suh, D. W.; Lee, M. G. Thermo-mechanical-metallurgical modeling for hot-press forming in consideration of the prior austenite deformation effect. Int. J. Plast., 2014, 58, 154-183. [CrossRef]
- Lee, R. Statistical design of experiments for screening and optimization. Chemie Ingenieur Technik, 2019, 91(3): 191-200. [CrossRef]
- Durakovic, B. Design of experiments application, concepts, examples: State of the art. Period. Eng. Nat. Sci., 2017, 5(3): 421-439. [CrossRef]
- Weissman, S. A.; Anderson, N. G. Design of experiments (DoE) and process optimization. A review of recent publications. Org. Process Res. Dev., 2015, 19(11): 1605-1633. [CrossRef]
- Aabid, A.; Murtuza, M. A.; Khan, S. A.; Baig, M. Optimization of dry sliding wear behavior of aluminium-based hybrid MMC’s using experimental and DOE methods. J. Mater. Res. Technol., 2022,16: 743-763. [CrossRef]
- Haq, A. U.; Kavit, A. K.; Rao, T.; Buddi, T.; Baloji, D.; Satyanarayana, K.; Singh, S. K. Evaluation and optimization of material properties of ASS 316L at elevated temperatures using response surface methodology. Materials Today: Proceedings, 2019, 18: 4589-4597. [CrossRef]
- Wang, Y.; Hu, X.; Jiang, M.; Wang, J.; Wei, M.; Zhang, L. Temperature field characterization and optimization of temperature field distribution in pipe lining process based on electromagnetic induction heating system. Case Stud. Therm. Eng., 2021, 28: 101609. [CrossRef]
- Resnick, R.; Halliday, D.; Krane, K. Physics, Vol. 1. 4 th edition. Wiley. 1992.
- Largueche, F. Z. B. Estimating soil contamination with Kriging interpolation method. Am. J. Appl. Sci., 2006, 3(6): 1894-1898. [CrossRef]
- Rajaguru, P.; Lu, H.; Bailey, C. Application of Kriging and radial basis function in power electronic module wire bond structure reliability under various amplitude loading. Int. J. Fatigue, 2012, 45: 61-70. [CrossRef]
- Cheng, Y. C.; Lin, D. H.; Jiang, C. P. Micromotion Improvement and Applications for Abutment-Implant System by Uniform Design and Kriging Interpolation. Int. j. biosci. biochem. bioinforma., 2016, 6(2), 41. [CrossRef]
|
Disclaimer/Publisher’s Note: The statements, opinions and data contained in all publications are solely those of the individual author(s) and contributor(s) and not of MDPI and/or the editor(s). MDPI and/or the editor(s) disclaim responsibility for any injury to people or property resulting from any ideas, methods, instructions or products referred to in the content. |
© 2024 by the authors. Licensee MDPI, Basel, Switzerland. This article is an open access article distributed under the terms and conditions of the Creative Commons Attribution (CC BY) license (http://creativecommons.org/licenses/by/4.0/).
