Submitted:
23 October 2024
Posted:
23 October 2024
You are already at the latest version
Abstract
Keywords:
1. Introduction
2. Materials and Methods
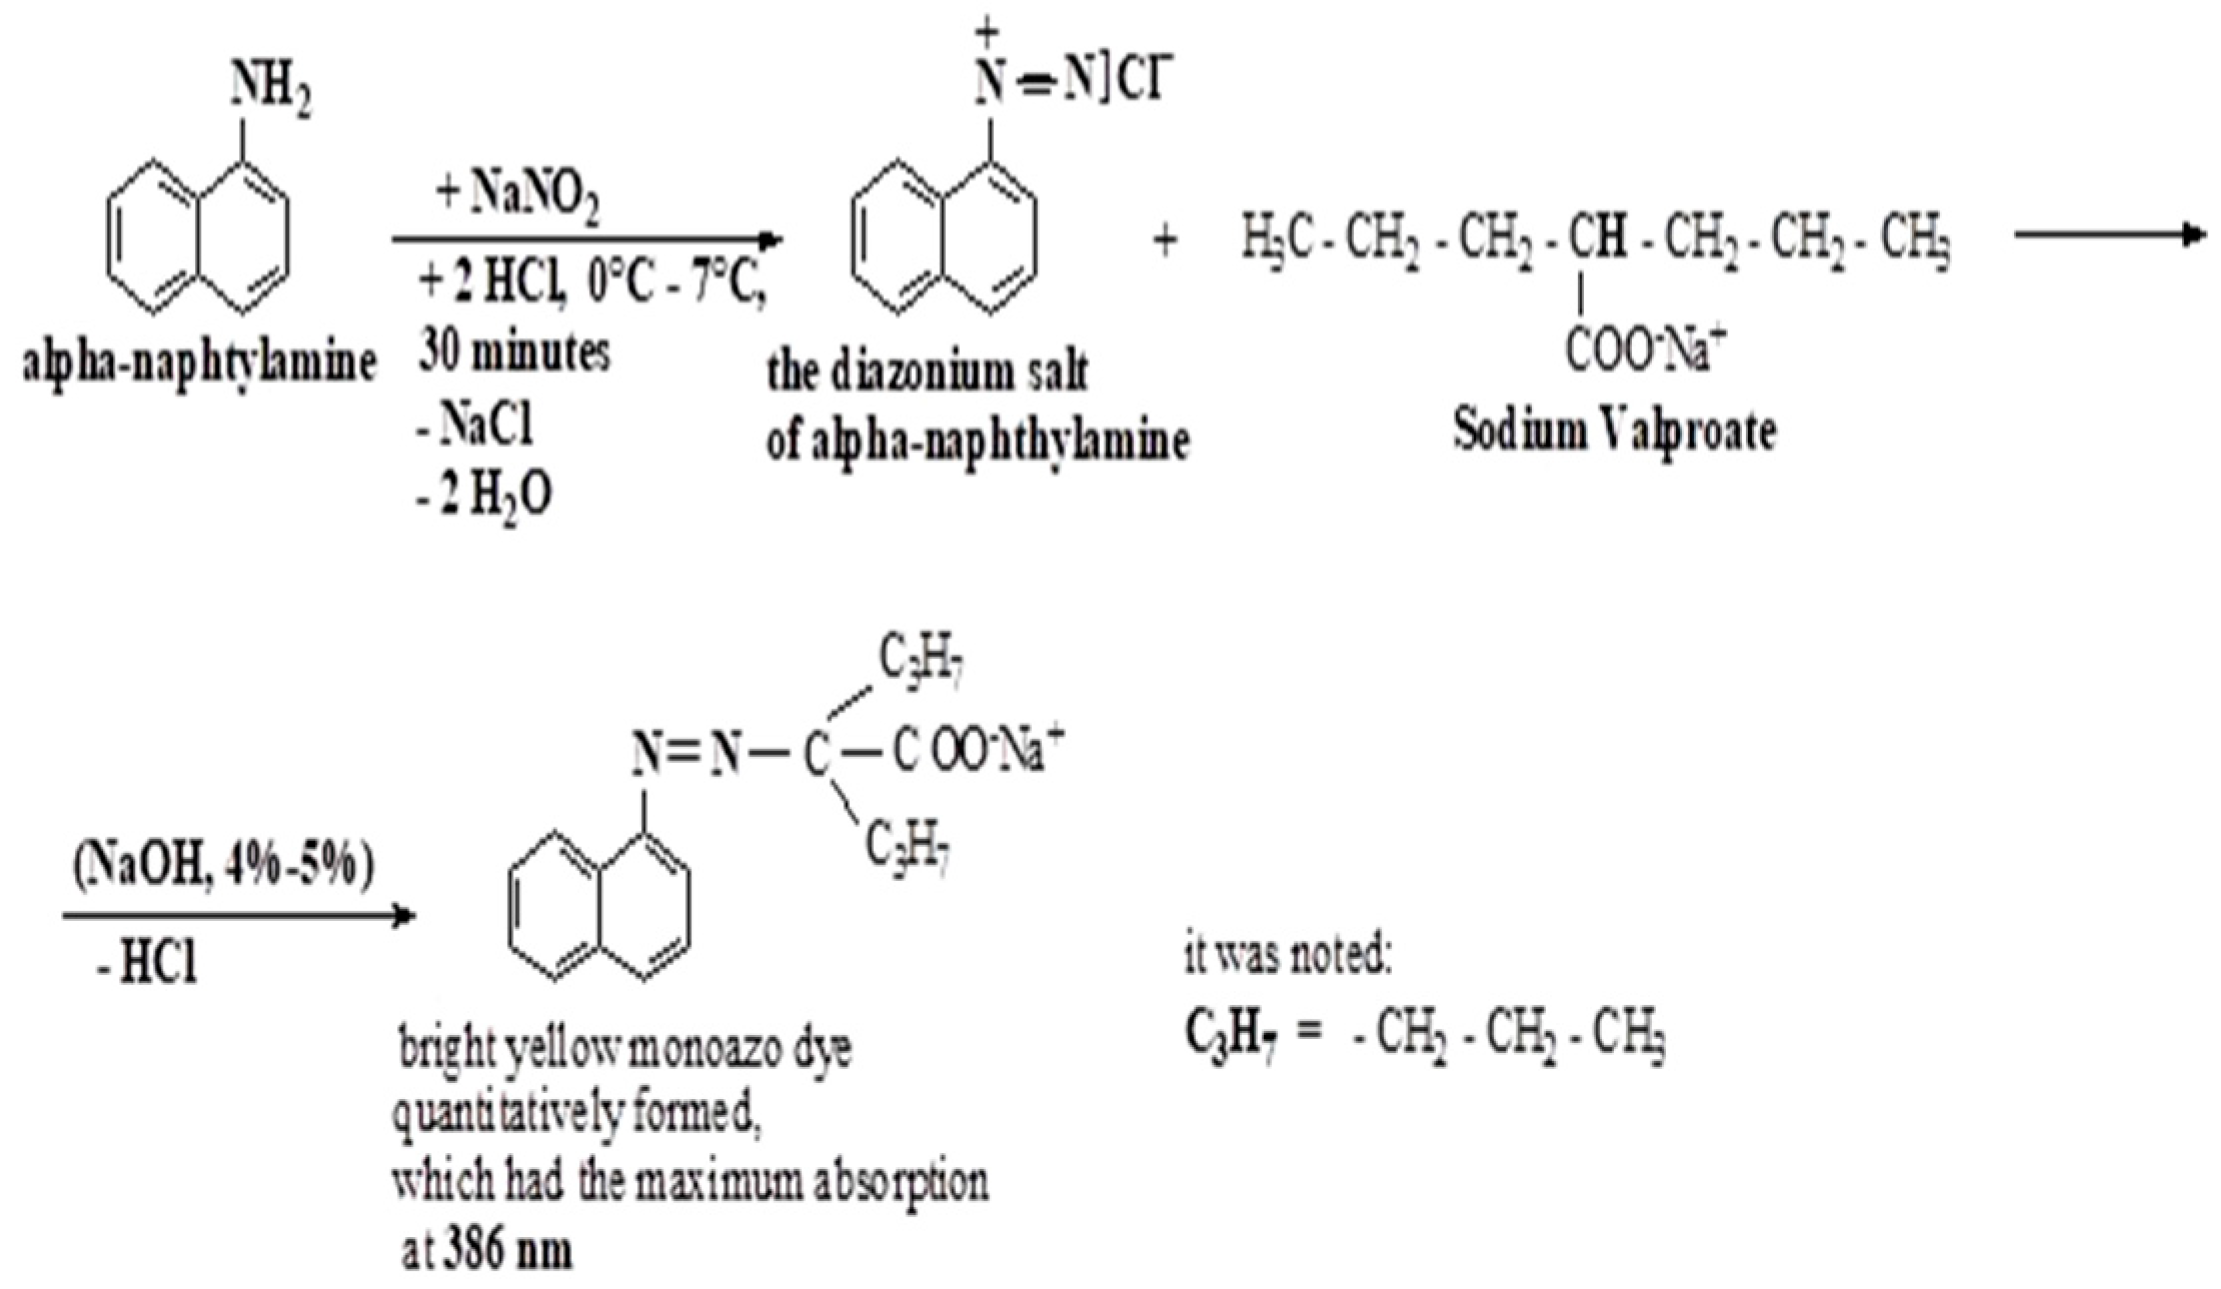
2.1. Description of the Method Basic Principle and Chemical Reactions Pathway
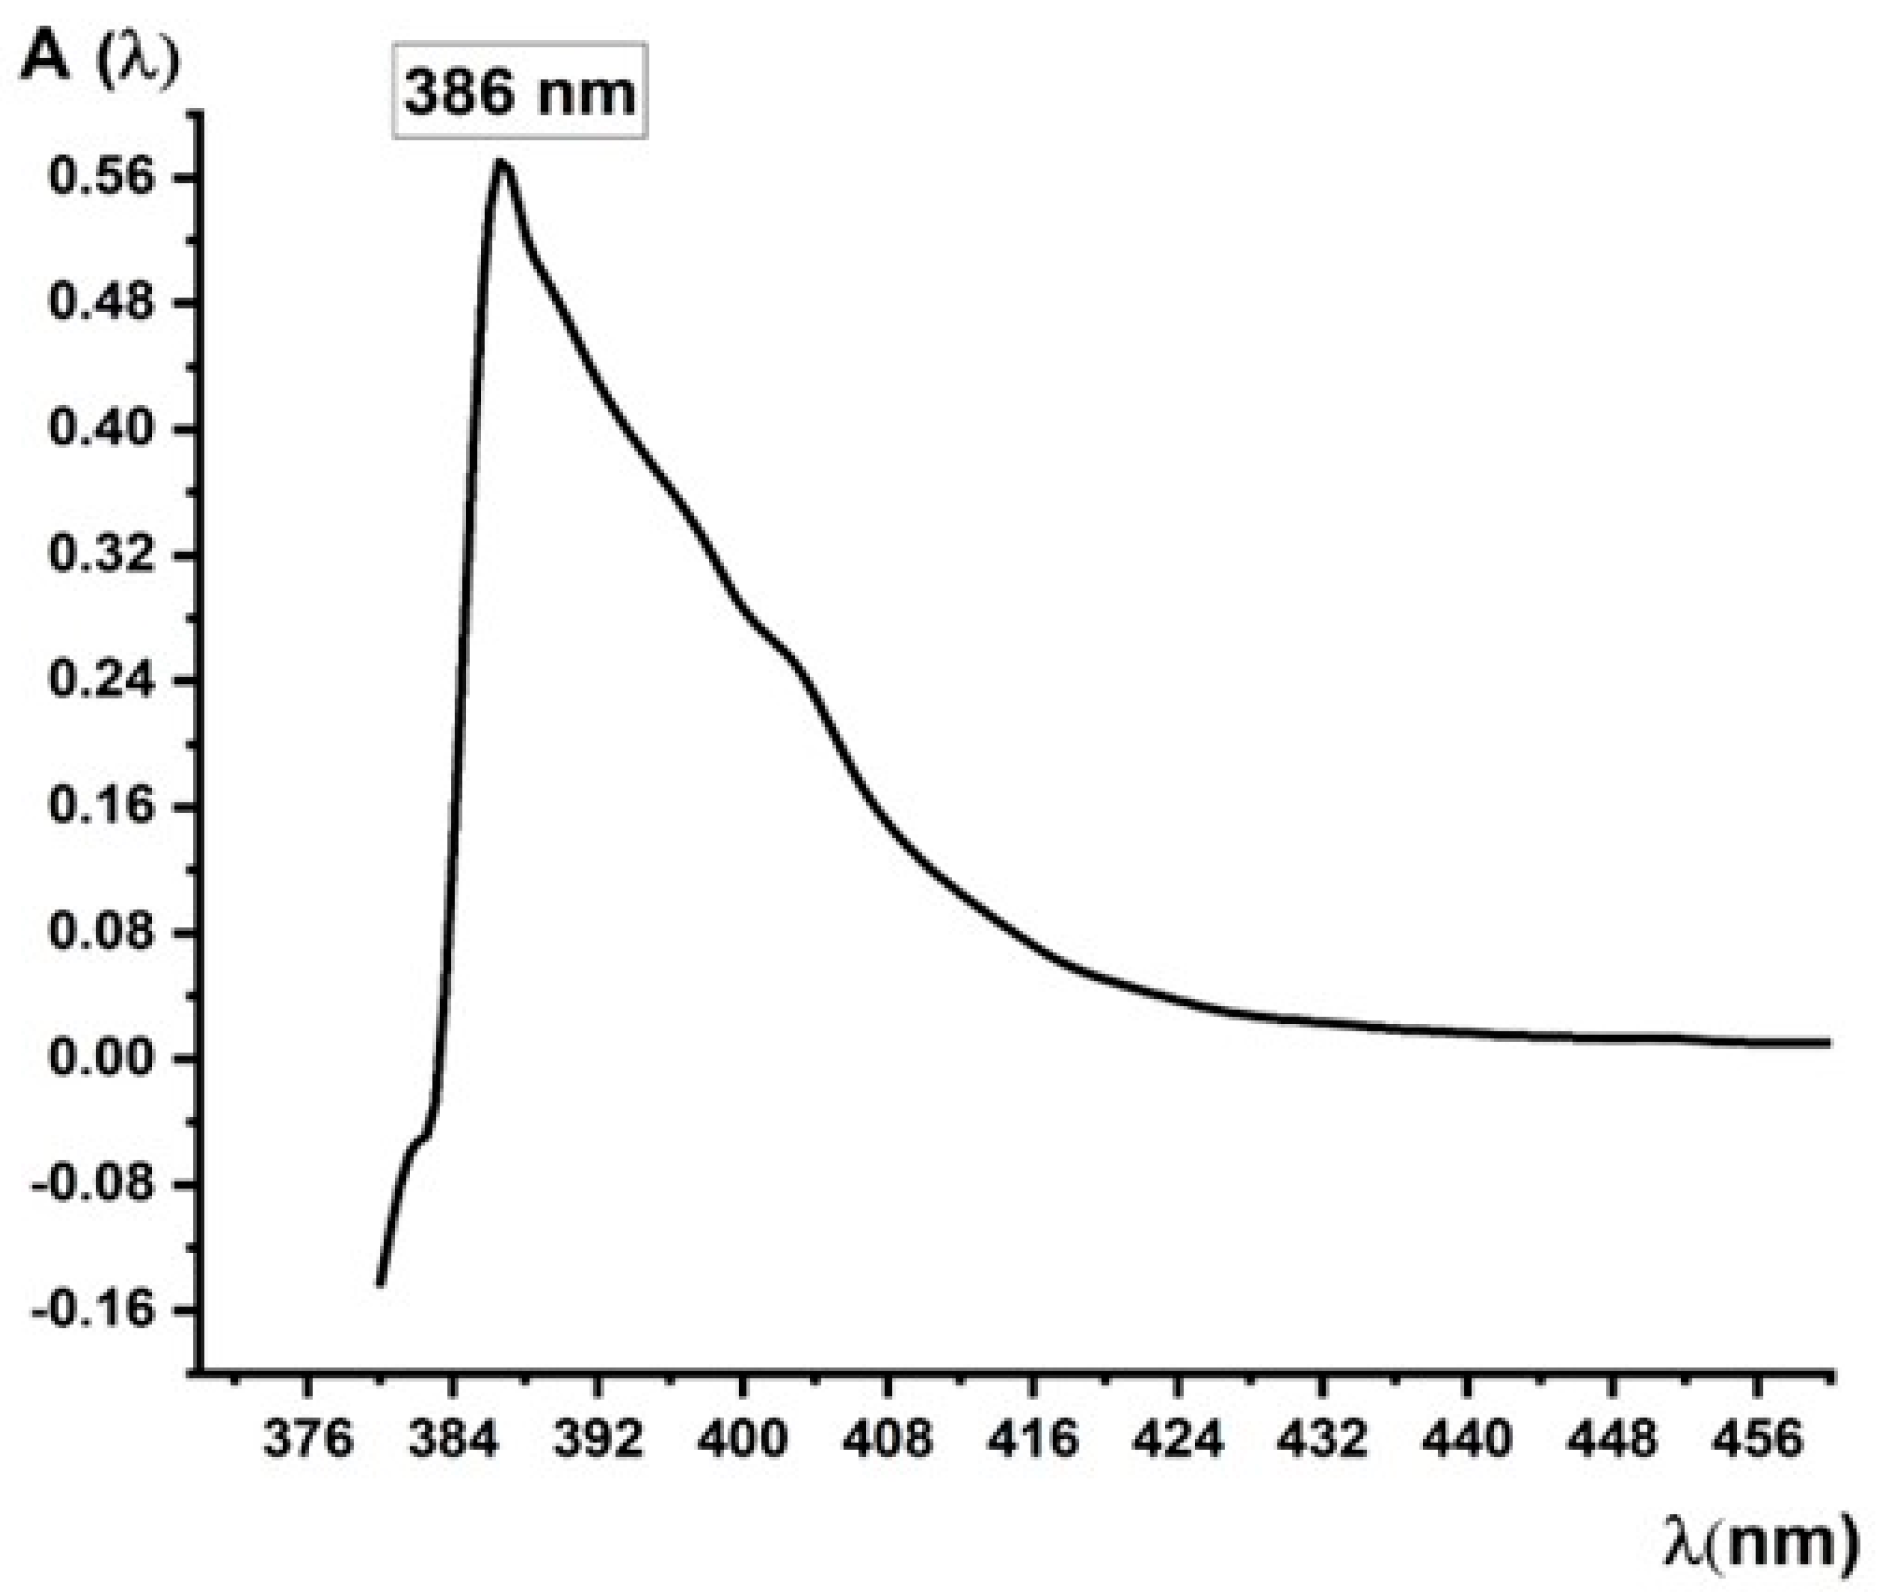
2.2. Visible (VIS) Spectrum Design of Sodium Valproate by Proposed Method. Calculation Procedure of Specific Absorbance (a) and Molar Absorptivity Coefficient. (ε).
2.2.1. Preparation of a Sodium Valproate Pure Initial Stock Solution 0.5 g % (5000 µg/mL) from Standard Sodium Valproate Crystalline Solid Powder Provided by Merck®
2.2.3. Visible Spectrum Design Using Sodium Valproate Standard Solution 1.44 µg/mL Prepared from Working Solution 0.05 g % (500 µg/mL).
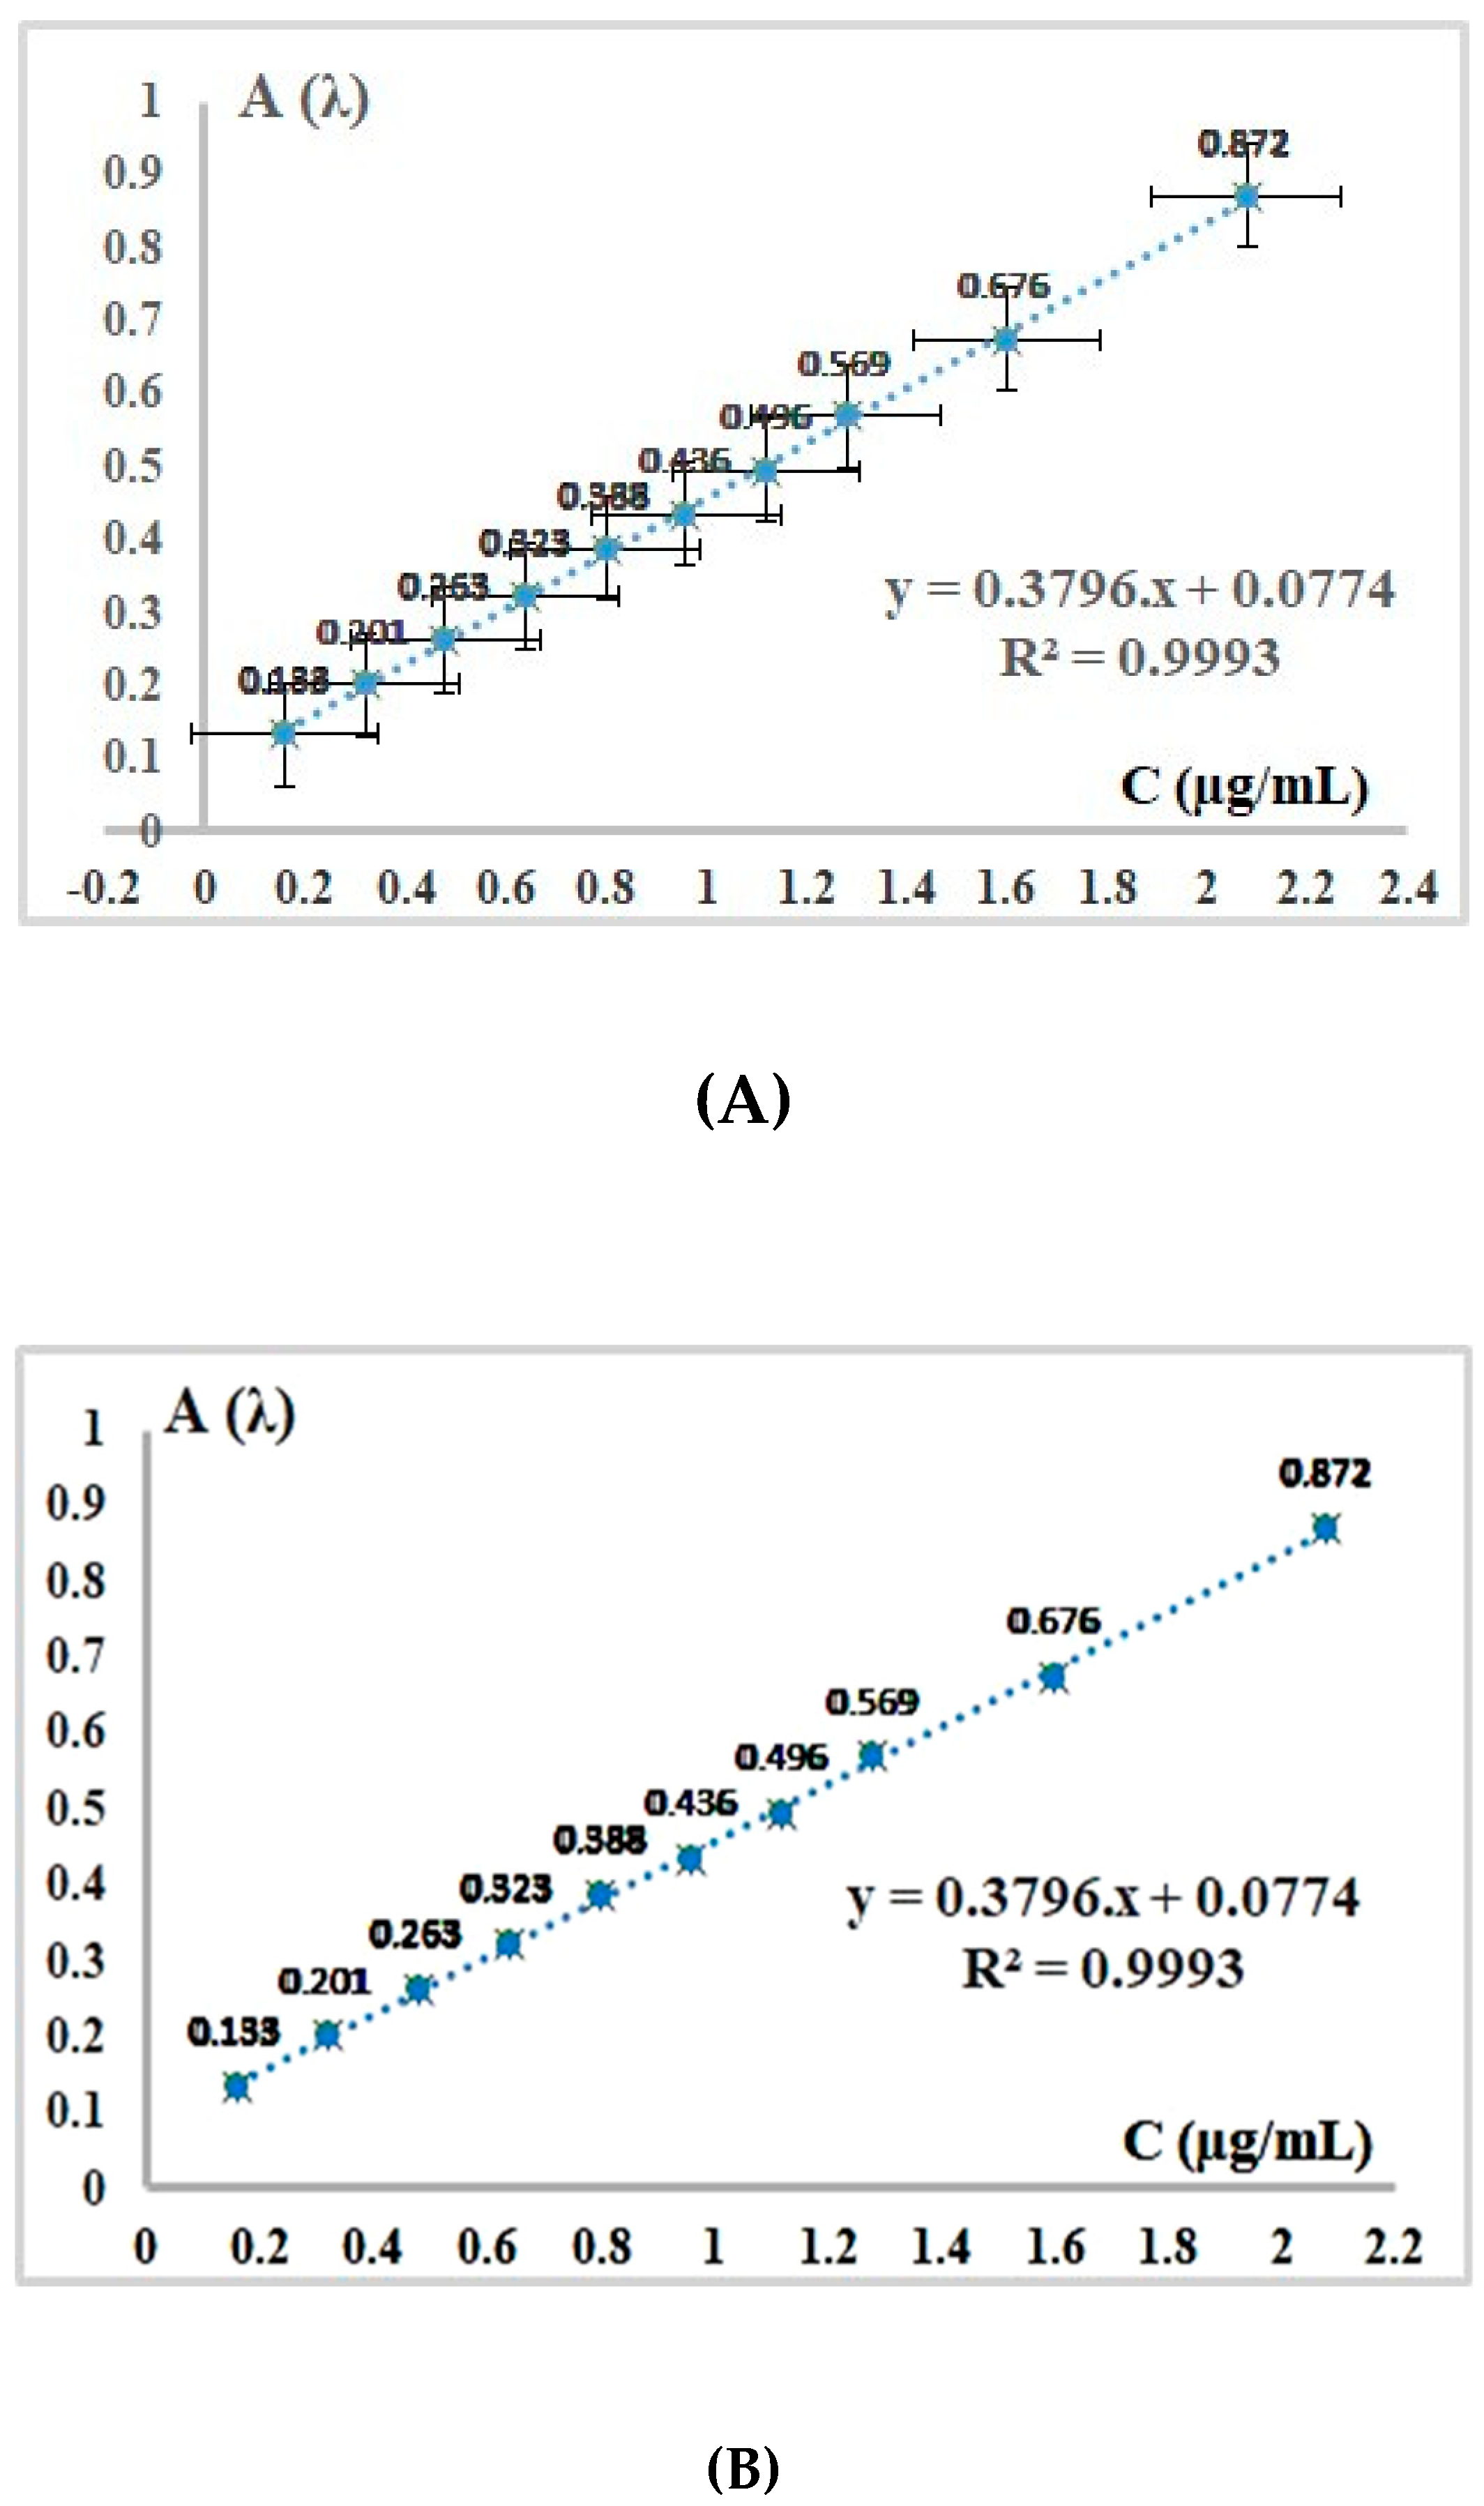
2.3. Plotting the Calibration Line on the Chosen Concentration Range 0.16 µg/mL – 2.08 µg/mL of Sodium Valproate Standard Solutions from Second Set, after the Second Consecutive Dilution (Final Set II)

| Solutions. | Preparation of two standard solution of sodium valproate used to design the Visible absorption spectrum | ||||
| mL NaNO2 4%-5% | mL HCl 10 %-15% | mL alpha-naphtylamine 0.1 % |
mL working solution 500 µg/mL |
CS μg/mL |
|
| Solution I | 0.9 | 0.9 | 0.9 | 0.9 | 18.00 |
| Solution II | 2 mL Solution I → to V2 = 25 mL with absolute ethyl alcohol | 1.44 | |||
| Preparation of sodium valproate standard solutions used for spectrophotometer calibration – first dilution → Set I of standard solutions | ||||
|---|---|---|---|---|
| mL NaNO2 4%-5% | mL HCl 10 %-15% | mL alpha-naphtylamine 0.1 % | mL working solution 500 µg/mL |
CS (μg/mL) |
| 0.1 | 0.1 | 0.1 | 0.1 | 2,0 |
| 0.2 | 0.2 | 0.2 | 0.2 | 4,0 |
| 0.3 | 0.3 | 0.3 | 0.3 | 6,0 |
| 0.4 | 0.4 | 0.4 | 0.4 | 8,0 |
| 0.5 | 0.5 | 0.5 | 0.5 | 10,0 |
| 0.6 | 0.6 | 0.6 | 0.6 | 12,0 |
| 0.7 | 0.7 | 0.7 | 0.7 | 14,0 |
| 0.8 | 0.8 | 0.8 | 0.8 | 16,0 |
| 1.0 | 1.0 | 1.0 | 1.0 | 20,0 |
| 1.3 | 1.3 | 1.3 | 1.3 | 26,0 |
| Measured absorbance values (Af) at λ = 386 nm of the second final set of Sodium Valproate standard solutions obtained from the first initial set after second consecutive dilution. | ||||
| Nr det. | mL added from initial Set I | mL ethyl alcohol add up to VE = 25 mL | Cf(μg/mL) | Af (λ = 386 nm) |
| 1 | 2.0 | 23.0 | 0.16 | 0.133 |
| 2 | 2.0 | 23.0 | 0.32 | 0.201 |
| 3 | 2.0 | 23.0 | 0.48 | 0.263 |
| 4 | 2.0 | 23.0 | 0.64 | 0.323 |
| 5 | 2.0 | 23.0 | 0.80 | 0.388 |
| 6 | 2.0 | 23.0 | 0.96 | 0.436 |
| 7 | 2.0 | 23.0 | 1.12 | 0.496 |
| 8 | 2.0 | 23.0 | 1.28 | 0.569 |
| 9 | 2.0 | 23.0 | 1.60 | 0.676 |
| 10 | 2.0 | 23.0 | 2.08 | 0.872 |
2.4. Preparation and Analysis of the Sample Solution of Sodium Valproate
2.5. Calculations of the Dosing Method .
2.6. Study of the Method Linearity. Calculation of Dectection Limit (LOD) and Quantitation Limit (LOQ)
3. Results and Discussions
3.1. Absorption Spectrum Analysis . Specific Absorbance and Molar Extinction Coefficient (ε) or Molar Absorptivity Calculations
3.1.1. Quantitative Analysis of Sodium Valproate in Tablets of a Pharmaceutical Product: Calculation of Pure Amount Expressed in Milligrammes (mg) of Sodium Valproate Relative to Solid Extended-Release Tablet of Pharmaceutical
- Calculation of pure sodium valproate concentration Cp (µg/mL) present in sample solution, from equation of the regression line (Figure 3):
- Evaluation of quantity X expressed in µg of pure Sodium Valproate from V’ = 25 mL final sample solution named P2
- Determination of the quantity X1 expressed in µg of pure Sodium Valproate from VP = 25 mL initial prepared sample solution P1:
- Calculation of the amount Y expressed in µg of pure Sodium Valproate from VX = 50 mL total sample solution initially prepared in the volumetric flask
- Determination and analysis of the quantities Y’ and Y1 expressed in μg and mg respectively, of pure sodium valproate from a = 0.02 g sample analyzed powder, related to the average mass of a phramaceutical tablet mc = 500 mg = 0.5 g.
- Calculation of the percentage content Z (%) of pure Sodium Valproate on solid film-coated tablet of pharmaceutical product:
3.1.2. Method Linearity Analysis. Calculation of Dectection Limit (LOD) and Quantitation Limit (LOQ)
4. Conclusions
References
- R.S. Fisher , C. Acevedo, A. Arzimanoglou, A. Bogacz , J.H. Cross, C. E. Elger, J. Engel Jr., L. Forsgren, J.A. French, M. Glynn, D.C. Hesdorffer, B.I. Lee, G.W. Mathern, S.L. Moshé, E. Perucca, I.E. Scheffer, T. Tomson, M. Watanabe and S. Wiebe.,”ILAE official report: a practical clinical definition of epilepsy”. Epilepsia, 2014, 55 (4): 475–482.
- ***”Epilepsy Fact sheet”. WHO. February 2016. Archived from the original on 11 March 2016. Retrieved 4 March 2016.
- R.S. Fisher , W. van Emde Boas, W. Blume, C. Elger, P. Genton, P. Lee, and J. Engel Jr., ”Epileptic seizures and epilepsy: definitions proposed by the International League Against Epilepsy (ILAE) and the International Bureau for Epilepsy (IBE)”. Epilepsia, 2005, 46 (4): 470–472. [CrossRef]
- K.J. Martin-McGill, R. Bresnahan, R.G. Levy, P.N. Cooper, “Ketogenic diets for drug-resistant epilepsy”, The Cochrane Database of Systematic Reviews, 2020, 6 (6): 1-55.
- ***”Valproic Acid”. The American Society of Health-System Pharmacists. 24 November 2020. Archived from the original on 31 July 2017.
- M.J. Owens, C.B. Nemeroff, “Pharmacology of valproate”, . Psychopharmacology Bulletin, 2003, 37 (Suppl. 2): 17–24.
- Y. Ghodke-Puranik, C.F. Thorn, J.K. Lamba, J.S. Leeder, W. Song, A.K. Birnbaum, R.B. Altman and T.E. Klein, ”Valproic acid pathway: pharmacokinetics and pharmacodynamics”, Pharmacogenetics and Genomics, 2003, 23 (4): 236–241.
- R.M.Pinder, R.N. Brogden, T. M.. Speight, G. S. Avery, “Sodium valproate: a review of its pharmacological properties and therapeutic efficacy in epilepsy”, Drugs, 1977 ;13 (2): :81-123.
- W. Löscher, “Basic pharmacology of valproate: a review after 35 years of clinical use for the treatment of epilepsy”. CNS Drugs,. 2002, 16 (10): 669–694.
- M. Romoli, P.Mazzocchetti, R.D’Alonzo, S.Siliquini, V.E. Rinaldi, A. Verrotti, P. Calabresi and C. Costa, “Valproic Acid and Epilepsy: From Molecular Mechanisms to Clinical Evidences”, Current Neuropharmacology.2019, 17 (10): 926–946. [CrossRef]
- S.Y. Kwan, ”The role of intravenous valproate in convulsive status epilepticus in the future” ,. Acta Neurologica Taiwanica, 2010, 19 (2): 78–81.
- K. B. Olsen , E. Taubøll, L. Gjerstad, “Valproate is an effective, well-tolerated drug for treatment of status epilepticus/serial attacks in adults,. Acta Neurologica Scandinavica, 2007, 187: 51-54. [CrossRef]
- M. A. Uberall , R. Trollmann, U. Wunsiedler, D. Wenzel, “Intravenous valproate in pediatric epilepsy patients with refractory status epilepticus”, Neurology, 2000, 54 (11): 2188-9. [CrossRef]
- H. J. Kupferberg, “Sodium valproate”, Advanced Neurology, 1980, 27: 643-54.
- G. Tunnicliff, “Actions of sodium valproate on the central nervous system”, Journal of Physiology and Pharmacology, 1999, 50 (3): 347-65.
- J.X . Li , Q. Zhang, J.H. Liang, “Valproate prevents the induction, but not the expression of morphine sensitization in mice”, Behavioral Brain Research, 2004, 152 (2): 251-7.
- J. Chukwu, N. Delanty, D. Webb, G.L. Cavalleri, “Weight change, genetics and antiepileptic drugs”. Expert Review of Clinical Pharmacology, 2014, 7 (1): 43–51.
- P. Chang , M. C. Walker , R. S. B. Williams , “Seizure-induced reduction in PIP3 levels contributes to seizure-activity and is rescued by valproic acid”, Neurobiology of Disease, 2014, 62: 296-306. [CrossRef]
- A.K. Death, K.C. McGrath, D.J. Handelsman, “Valproate is an anti-androgen and anti-progestin”, Steroids, 70 (14): 946–953. [CrossRef]
- H. Uchida, T. .Maruyama, T. Arase., M. Ono, T. Nagashima, H. Masuda, H. Asada and Y. Yoshimura, “Histone acetylation in reproductive organs: Significance of histone deacetylase inhibitors in gene transcription”, Reproductive Medicine and Biology. 2005, 4 (2): 115–122. [CrossRef]
- J.I.T. Isojärvi, E. Taubøll and A.G. Herzog, “Effect of antiepileptic drugs on reproductive endocrine function in individuals with epilepsy”. CNS Drugs, 2005, 19 (3): 207–223. [CrossRef]
- T. S. Belal , D.S. El-Kafrawy , M. S. Mahrous , M. M. Abdel-Khalek , A. H. Abo-Gharam, “Validated spectrophotometric methods for determination of sodium valproate based on charge transfer complexation reactions”, Spectrochimica Acta A Molecular and Biomolecular Spectroscopy, 2016, 155: 47-53. [CrossRef]
- M. N. Abualhasan, N. W. Odeh, G.N. Younis and O. F. Zeidan, , “Analytical Method Development for Sodium Valproate through Chemical Derivatization”, Hindawi International Journal of Analytical Chemistry, 2020, 5 , 1-7. [CrossRef]
- Z.J. Chen, X.D. Wang, H.S. Wang, S.D. Chen, , L.M. Zhou J.L. Li , W.Y. Shu, J.G. Zhou, Z.Y. Fang , Y. Zhang , M. Huang, “Simultaneous determination of valproic acid and 2-propyl-4-pentenoic acid for the prediction of clinical adverse effects in Chinese patients with epilepsy”, Seizure , 2012, 21, 2, 110-117.
- K. Lipska, A. Gumieniczek , R. Pietra’s and A. .A. Filip, “HPLC-UV and GC-MS Methods for Determination of Chlorambucil and Valproic Acid in Plasma for Further Exploring a New Combined Therapy of Chronic Lymphocytic Leukemia”, MDPI Molecules, 2021, 26, 2903, 1-17. [CrossRef]
- S. Kaewpradit, G. Yusakul , P. Rojsitthisak, C. Jantarat, “A simple and rapid HPLC-UV method for the determination of valproic acid in human plasma using microwave-assisted derivatization with phenylhydrazine hydrochloride”, Heliyon, 2024, 10, e27875, 1-13. [CrossRef]
- W. Czarnecki and B. Haƚczyńska, “Colorimetric Determination of Valproic Acid and Its Salts”, Acta Poloniae Pharmaceutica – Drug Research, 1999, 56, 5, 353-355.
- Ermer J..and McB J. H. Miller , Method Validation in Pharmaceutical Analysis, Wiley – VCH Verlag GmbH & Co. KgaA Edit., Wienheim, 1-151, 2005.
- McB. Miller, J.H. Validation of Pharmacopoeial Methods. In Methods Validation in Pharmaceutical Analysis. A Guide to Best Practice, Ermer, J., Nethercote, P.W., (Eds.); Wiley-VCH Verlag GmbH & Co. KGaA: Weinheim, Germany, 2005; pp. 301–335.
- ***European Pharmacopoeia, 10th ed.; European Directorate for the Quality of Medicine & Healthcare (edQm), Council of Europe: Strasbourg, France, 2019; Volume I, p. 11–56.
- Y. Yorozu, M. Hirano, K. Oka, and Y. Tagawa, “Electron spectroscopy studies on magneto-optical media and plastic substrate interface,” IEEE Transl. J. Magn. Japan, vol. 2, pp. 740-741, August 1987 [Digests 9th Annual Conf. Magnetics Japan, p. 301, 1982. [CrossRef]
- ***Romanian Pharmacopoeia Commission National Medicines Agency. Romanian Pharmacopoeia, 10-th ed.; Medical Publishing House: Bucharest, Romania, 1993; p. 977–1293.


| Solutions | Preparation of the first initial sample solution (P1) of Sodium Valproate from Tablets (first dilution) | ||||
| mL NaNO2 4%-5% | mL HCl 10 %-15% | mL alpha-naphtylamine 0.1 % |
mL sample unknown solution |
Ethyl alcohol as solvent and control |
|
| Initial Sample Solution PI |
0.3 |
0.3 |
0.3 |
0.3 |
→ Vp = 25 mL |
| Solutions | Preparation of the second final sample solution (P2) of Sodium Valproate effectively used for spectrophotometric determination (after the second dilution) | ||||
| mL Initial Sample Solution P1 | Absolute Ethyl alcohol | Ap |
CP (µg/mL) |
mg pure sodium valproate / tablet |
|
| Final Sample Solution P2 |
2.0 |
23 |
0.221 |
0.3783 |
492.578 |
| Statistical parameters of the Linear Regression (Regression Statistics) | ||||
| Correlation coefficient R | Regression coefficient R2 |
Adjusted R Square R2 |
Standard error (SE) |
Detection Limit LOD and Quatitation Limit LOQ |
|
0.999665 |
0.999330 |
0.999246 |
0.00621264 |
LOD = 0.0491 LOQ = 0.1636 |
Disclaimer/Publisher’s Note: The statements, opinions and data contained in all publications are solely those of the individual author(s) and contributor(s) and not of MDPI and/or the editor(s). MDPI and/or the editor(s) disclaim responsibility for any injury to people or property resulting from any ideas, methods, instructions or products referred to in the content. |
© 2024 by the authors. Licensee MDPI, Basel, Switzerland. This article is an open access article distributed under the terms and conditions of the Creative Commons Attribution (CC BY) license (http://creativecommons.org/licenses/by/4.0/).


