Preprint
Article

Role of DHA in a Physicochemical Study of a Model Membrane of Grey Matter

Altmetrics

Downloads

36

Views

36

Comments

0

Submitted:

23 October 2024

Posted:

24 October 2024

You are already at the latest version

Alerts
Abstract
In this study, we present a multicomponent lipid model membrane composed of six lipids, in-cluding cholesterol, which represent the structure of neuronal membranes found in grey matter. To our knowledge, no previous studies have attempted a model like this. We constructed our model membranes using an esterified form of the most abundant polyunsaturated fatty acid found in grey matter: docosahexaenoic acid (DHA). It is the most prevalent fatty acid in the brain and is essential for maintaining cellular structural integrity, acting as a major phospholipid in neural membranes. The aim of this work is to analyse the effects that different proportions of DHA have on the proposed membrane model. For this purpose, transmission electron microscopy, zeta potential, and molecular acoustics were used. The results showed differences that may be attributable to the influence DHA has on the nanodomains of sphingomyelin and cholesterol.
Keywords: 
Subject: Chemistry and Materials Science  -   Nanotechnology

1. Introduction

The brain is composed of a diverse array of lipids, which have attracted significant interest due to their associations with both genetic and common neurodegenerative diseases. In the present study, a multicomponent lipid model membrane, comprising six lipids that represent the structure of neuronal membranes found in grey matter, is presented. To date, no previous models have attempted this. The design is based on research that isolated individual components of grey matter from the human frontal lobe [1,2].
Model membranes are invaluable for studying lipid nanodomains, as direct observation in living cells is currently unfeasible. These simplified systems provide insights into biological membranes and cellular processes, although applying these findings to living cells remains challenging due to the complex and dynamic environment, where membranes interact with diverse biomolecules.
The model membrane was constructed using an esterified form the most abundant polyunsaturated fatty acid (PUFA) found in grey matter: docosahexaenoic acid. DHA is the most prevalent fatty acid in the brain and plays a crucial role in maintaining cellular structural integrity, serving as a major phospholipid in neural membranes. Its levels in tissues and plasma are influenced by dietary intake, and a deficiency of this omega-3 fatty acid has been linked to various issues, including visual impairments and psychological or neurological dysfunctions. It is also known to alleviate symptoms of several chronic inflammatory conditions [3,4,5,6,7,8].
Three distinct membranes were investigated, from the proposed model, each featuring different levels of omega-3 content: 100%, 50%, and 0%, with the 0% model representing a hypothetical scenario of total deficiency.
Long-chain PUFAs are known to mediate inflammation by integrating into plasma membrane phospholipids, which influence the biophysical properties of lipid rafts. However, the exact structural mechanisms underlying this process remain unclear [9]. DHA-rich phospholipids may phase-separate into microdomains—sometimes referred to as putative domains—that may be rich in DHA but low in sphingomyelin (SM) and cholesterol, or vice versa [10]. Investigating these phase separations provides valuable insights into the intricate signalling pathways associated with membrane proteins. DHA has the potential to enhance health by modulating those cell processes influenced by lipid rafts [11].
Despite the well-documented benefits of DHA for brain function, there is limited understanding of how omega-3 fatty acids affect the physicochemical properties of phospholipid membranes, which may account for their therapeutic effects. Additionally, findings from various studies often yield inconsistent results, likely due to differing experimental conditions [12]. In addition to this, there is the added challenge of the small estimated size of rafts in biological membranes (no greater than 50 nm), which makes their direct observation very difficult [13,14].
A clear understanding of how omega-3 PUFAs impact molecular organisation in lipid rafts is still lacking. Some reports suggest that omega-3 PUFAs increase membrane order, while others indicate the opposite, reflecting the complexity of biological membranes and the influence of other fatty acids [15]. Studying lipid bilayers can provide insights into how controlled compositional changes influence cellular behaviour, aiding the interpretation of events in more complex biological systems.
The present study aims to examine how DHA deficiency affects the physicochemical properties of the proposed neuronal model membrane [1,2]. Mechanical and surface charge properties were evaluated using methods not commonly applied for this purpose. Ultrasound velocimetry and densitometry were employed to determine the speed of sound and density within the membrane. This analysis provided insights into compressibility and phase states [16,17]. Complementary zeta potential measurements were taken as a function of temperature, offering data on phase transitions and surface charge within the lipid systems [18]. The zeta potential analysis, combined with other studies, gave information the structural organisation of the lipids in these membranes. These techniques offer unique advantages over other methods, allowing assessments of changes across the entire lipid bilayer. They are highly precise, non-intrusive, and require minimal sample volumes. Given the complexity of these systems, in which no single region represents the whole, a comprehensive assessment of mechanical properties is essential.
Additionally, transmission electron microscopy (TEM) allowed the membrane morphological analysis.
All experiments were conducted under physiological conditions of pH and temperature, facilitating closer extrapolation to biological systems.
Perhaps the reader may perceive a limited corroboration of the results with literature data. The complexity of the model proposed in this work restricts the possibility of comparison. For this same reason, it cannot be definitively stated whether the results align with existing literature.

2. Materials and Methods

2.1. Materials

1-hexadecanoyl-2--(9Z-octadecenoyl)-sn-glycero-3-phosphocholine (POPC), N-octadecanoyl-D-erythro-sphingosylphosphorylcholine (Brain SM), 1-hexadecanoyl-2--(9Z-octadecenoyl)-sn-glycero-3-phospho-L-serine (sodium salt) (POPS), 1-hexadecanoyl-2-(9Z-octadecenoyl)-sn-glycero-3-phosphoethanolamine (POPE),1-hexadecanoyl-2-(4Z,7Z,10Z,13Z,16Z,19Z-docosahexaenoyl)-sn-glycero-3-phosphocholine (PDPC), cholesterol (Chol) were acquired from Avanti Polar Lipids Inc. (Alabaster, AL). Lipid 3D-structures are presented in Figure 1. All lipids were stored at −20°C when not in use. 2-[4-(2-Hydroxyethyl)piperazin-1-yl]ethane-1-sulfonic acid (HEPES) and HEPES Sodium salt was purchased from Sigma-Aldrich. The Chloroform employed was of analytical grade. Finally, the mediums for lipidic dispersions were water (Ultrapure water, Super Q Millipore system, pH=5.5, conductivity 5 mS.m-1) and HEPES Buffer solution (pH=7.45 and conductivity 40 mS.m-1)

2.2. Model Lipid Membrane Preparation

Vesicles of POPC-Chol, POPC-POPE-Chol, POPC-POPE-SM-Chol, and POPC-POPE-SM-POPS-Chol were prepared by weighing appropriate quantities of each one to obtain proportions of interest. vesicles of POPC-POPE-SM-POPS-PDPC-Chol were prepared in the same fashion but PDPC quantities were measured using a Hamilton syringe from a 10mg/mL septum sealed chloroform solution purged with nitrogen. All lipids were used as purchased without further purification.
The molar ratio of lipids for six components vesicles were calculated from literature [1,2] to mimic a 55 years old grey matter composition (ω-3100). For contrast systems were prepared presenting omega deficiency with 50% (ω-350) and 0% (ω-30) of the original PDPC composition. Thus molar fraction composition resulted in: POPC:POPE:SM:POPS:PDPC:Chol of 0.16:0.28:0.060:0.09:0.11:0.30 for ω-3100, POPC:POPE:SM:POPS:PDPC:Chol of 0.22:0.28:0.06:0.09:0.05:0.3 for ω-350 and POPC-POPE-SM-POPS-Chol of 0.27:0.28:0.06:0.09:0.30 for ω-30 .
For vesicles without PDPC compositions were as follows: POPC:Chol 0.7:0.30, POPC:POPE:Chol 0.35:0.35:0.30, POPC:POPE:SM:Chol 0.31:0.32:0.07:0.30, and POPC-POPE-SM-POPS-Chol 0.27:0.28:0.06:0.09:0.3.
Molar fractions of lipids in the vesicles are calculated without considering the solvent.
HEPES buffer solution for liposome hydration was prepared by mixing 0.005 mol of HEPES Sodic salt and 0.005 mol of HEPES free acid in 100mL of water.
To form the vesicular solutions the masses of lipid corresponding to the proportion enunciated above were weighted separately. All lipidic components were introduced in a test tube, then the lipids were dissolved in chloroform and finally the chloroform was removed by evaporation with nitrogen stream to obtain a dry lipid film. Remaining traces of solvent were eliminated by a high vacuum system using a Thermo Scientific Speed Vac SPD11V. The resulting dry lipid films were hydrated with 5 mL of Milli-Q water or 5 mL of HEPES buffer solution as required for the experiment and homogenized with cycles of vigorous vortexing at around 10 °C above the transition temperature of the sample. This heating-vortexing combination yields a polydispersed population of vesicles. Thus samples in water only are expected to be multilamellar vesicle (MLV). Sonication of samples with HEPES was performed in an ultrasonic bath with a power of 70 W and a frequency of 40KHz for 30 minutes to obtain small unilamellar vesicles (SUV). The dispersions acquired a final concentration of 2.0 mg.mL−1 for density and ultrasound velocity measurements and 3.0 mM for ZP experiments. Before conducting the density and ultrasound velocity measurements, the aqueous vesicle suspension was properly degassed by a vacuum system with constant agitation using magnetic stirrer at 440 rpm.
Precautions throughout the manipulation of PDPC- containing solutions were taken to avoid oxidation. These precautions included limiting exposure to light, using a controlled atmosphere bag purged with high purity nitrogen and hermetic sealing the cuvettes during measurements. The degree of lipid oxidation was checked by FT-IR and no oxidation was found. It is remarkable that every sample was prepared at the moment of the measurements to avoid oxidation during storage.

2.3. Methods

2.3.1. Transmission Electron Microscopy (TEM)

To understand the morphology of the vesicles and electron microscopy was used. TEM images were obtained with aJEOL 100 CX II CCDGATANES 1000W Erlangshen microscope and 50,000 magnifications over a carbon-coated copper microscopy grid (400 mesh). Samples were negatively stained with 1% aqueous uranyl acetate for 10 min, washed with water, stained with lead citrate for 3 min, washed with a 0.01 N NaOH solution and placed on a filter paper in a Petri dish to dry. This method has the disadvantage of polluting the sample with undissolved uranyl acetate crystals but these objects are easily distinguishably for their angular crystalline structure and high absorption thus they do not mask the results. Analysis of the images was performed following published protocols [19].

2.3.2. Dynamic Light Scattering (DLS) and Zeta Potential

To study the size of the vesicles and superficial charge, non-invasive techniques were selected. DLS and Zeta potential techniques allow access to vesicle properties without sample disturbance. Sizes, conductivity and Zeta potential of liposomes were determined in Zetasizer Nano ZS90 equipment (Malvern Instruments Ltd., UK). The measurements were performed at progressively decreasing temperatures, enabling the sample to attain thermal equilibrium and recording points every 2°C with a stabilization period of 5 min (at ±0.1 °C constant temperature through the Peltier method). For sizes experiments the hydrodynamic diameter is the result of ten independent measurements. For conductivity and Zeta potential twelve independent measurements were performed. Measurement errors were below 5%.

2.3.3. Measurement of Ultrasound Velocity and Density

Molecular acoustic techniques allow access to solution properties in a non-invasive approach. Commercial density and sound velocity measurement instrument (Anton-Paar DSA 5000 densimeter and sound velocity analyzer) was used to get continuous, simultaneous and automatically, densities (ρ) and sound velocities (u). Measurements were taken at progressively decreasing temperatures because of the. Speed of sound and density values are dependent on solution temperature; thus, this variable was controlled by the Peltier method within the equipment with appreciation of ±0.01°C. Density and sound velocity measurements were highly reproducible (superior to ±3×10⁻⁵ g cm−3 and ±0.03 m s−1, respectively).

2.3.4. Data Analisis

The purpose of ultrasound velocity measurements is the evaluation of elastic properties of the systems at study. For that end the adiabatic compressibility coefficient of solvent (β0) and aqueous solutions and suspensions (βS) was obtained using the following equation.
β s = 1 / u 2 ρ
where u is the sound velocity of the suspension and ρ is the density [20]. Measurements of u and ρ are the only direct ways to evaluate the adiabatic compressibility coefficient of a liquid.
Relative change in a physical characteristic per unit of solute concentration is often more important than the absolute value. With this consideration the relative concentrational increment of sound velocity [u] can be calculated using the following formula:
u = ( u u 0 ) / ( u 0 c )
where c, is the solute concentration (lipid) in mg/mL and u and u0 indicate the sound velocity solution and the solvent (distilled water or HEPES solution) respectively.
Apparent specific partial volumes φv were derived from the density data by:
Φ v = [ 1 ( ρ ρ 0 ) c ] ( 1 ρ 0 ) ,
where ρ is the density of the solution, ρ0, is the density of the solvent and c is the concentration of lipids in mg/mL.
Variation of β0, [u] and φv with temperature can be obtained by measuring changes in sound velocity and density. From a combination of specific volume and sound-velocity concentration increment measurements, the specific adiabatic compressibility, φk0, of the liposomes was estimated:
ϕ k β 0 = 2 u 1 ρ 0 + 2 Φ v ,
The value of φk0 represents changes in the volume compressibility of the vesicles relative to the solvent.

3. Results and discussion

3.1. DLS

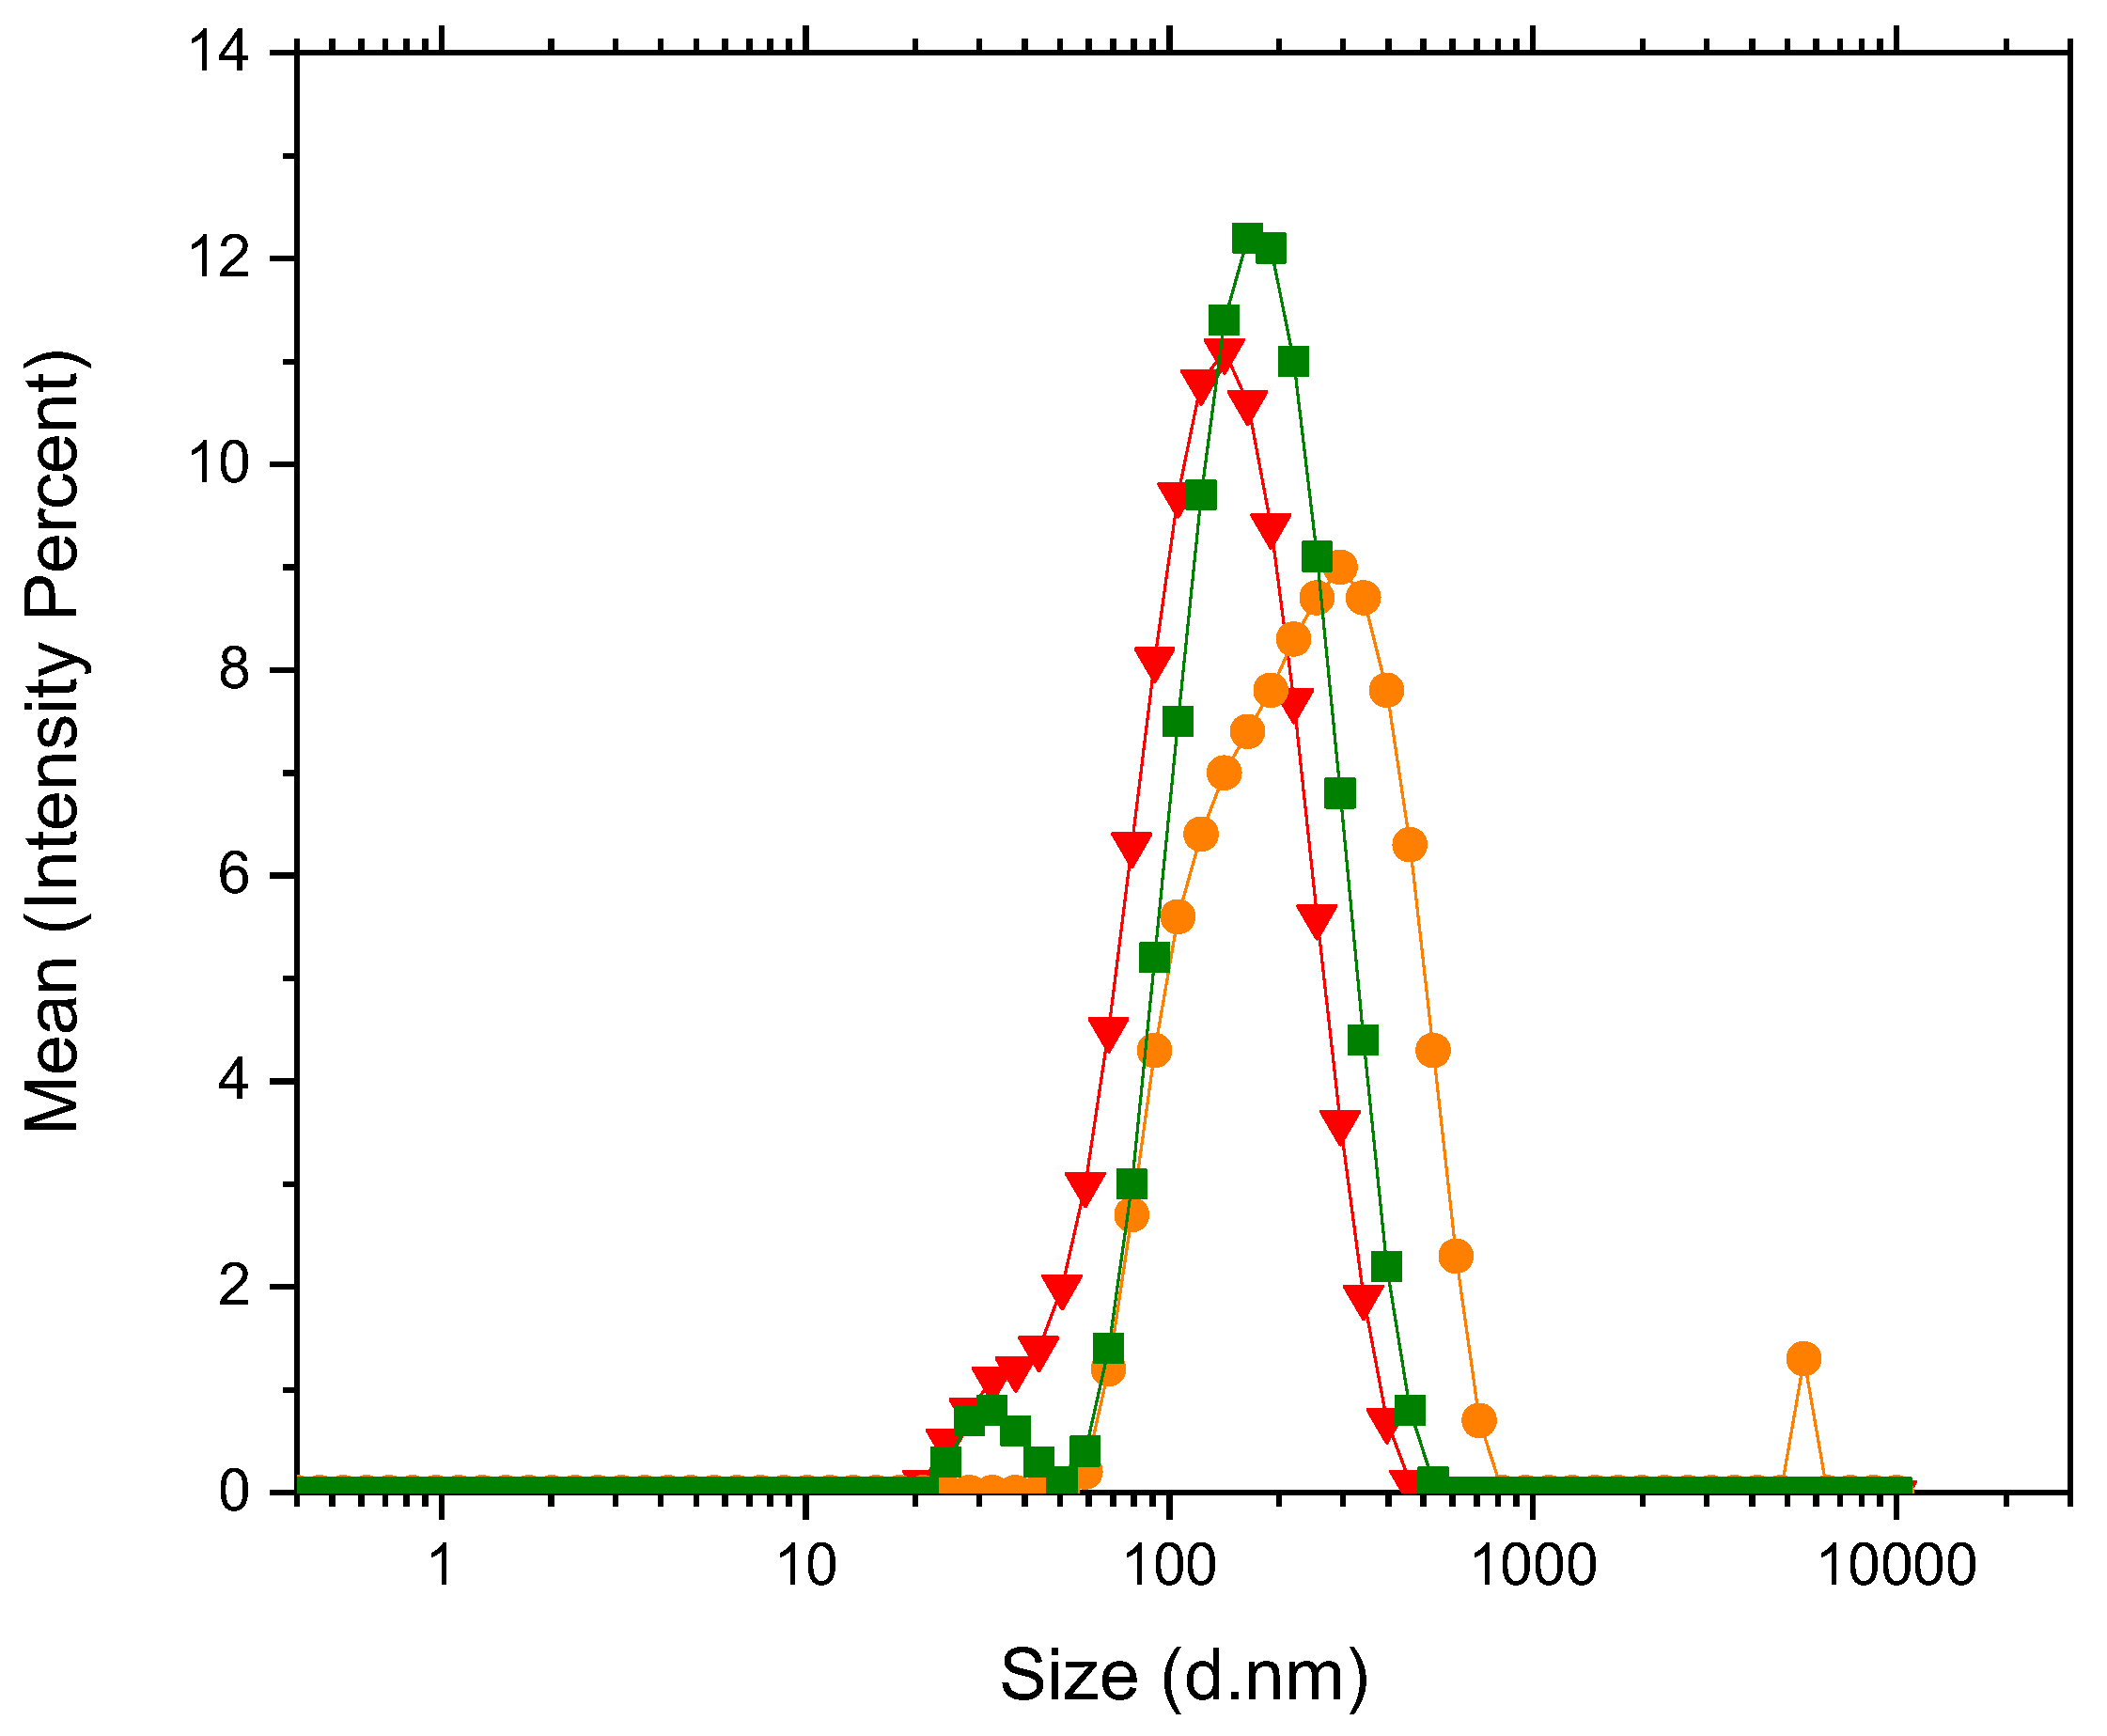
The sizes of the vesicles were studied with DLS. Apparent hydrodynamic diameter for the system POPC-POPE-SM-POPS-Chol in water was found to be 583.6±50.4 nm at a temperature of 42°C and 599.2±59.5 nm at a temperature of 32°C. This indicates that the systems are stable in the temperature range of study and results are highly reproducible. In HEPES buffer solution for the systems containing 0%, 50% and 100% PDPC the apparent hydrodynamic diameters were found to be 145.8±35.9 nm, 259.67±71.2 nm and 187.5±43.7 nm respectively. Size distributions are presented in Figure 2.
Statistical analysis on size distribution using 5% level of significance indicating there is no difference between the samples. This result confirms that vesicles formed in HEPES present similar apparent hydrodynamic diameter. In the other hand vesicles formed in water present a much larger apparent hydrodynamic diameter. This result would indicate that HEPES buffer is allowing the formation of smaller vesicles, most probably because of the compensation of charges at the internal and external surface of the liposomes. DLS technique is sensitive to size distribution as intensity analysis has a bias towards larger particles for intensity of scattering is proportional to diameter to the sixth power. Furthermore, the analysis of the correlation function results in translational diffusion coefficient of the equivalent sphere, not allowing access to vesicular morphology.

3.2. TEM

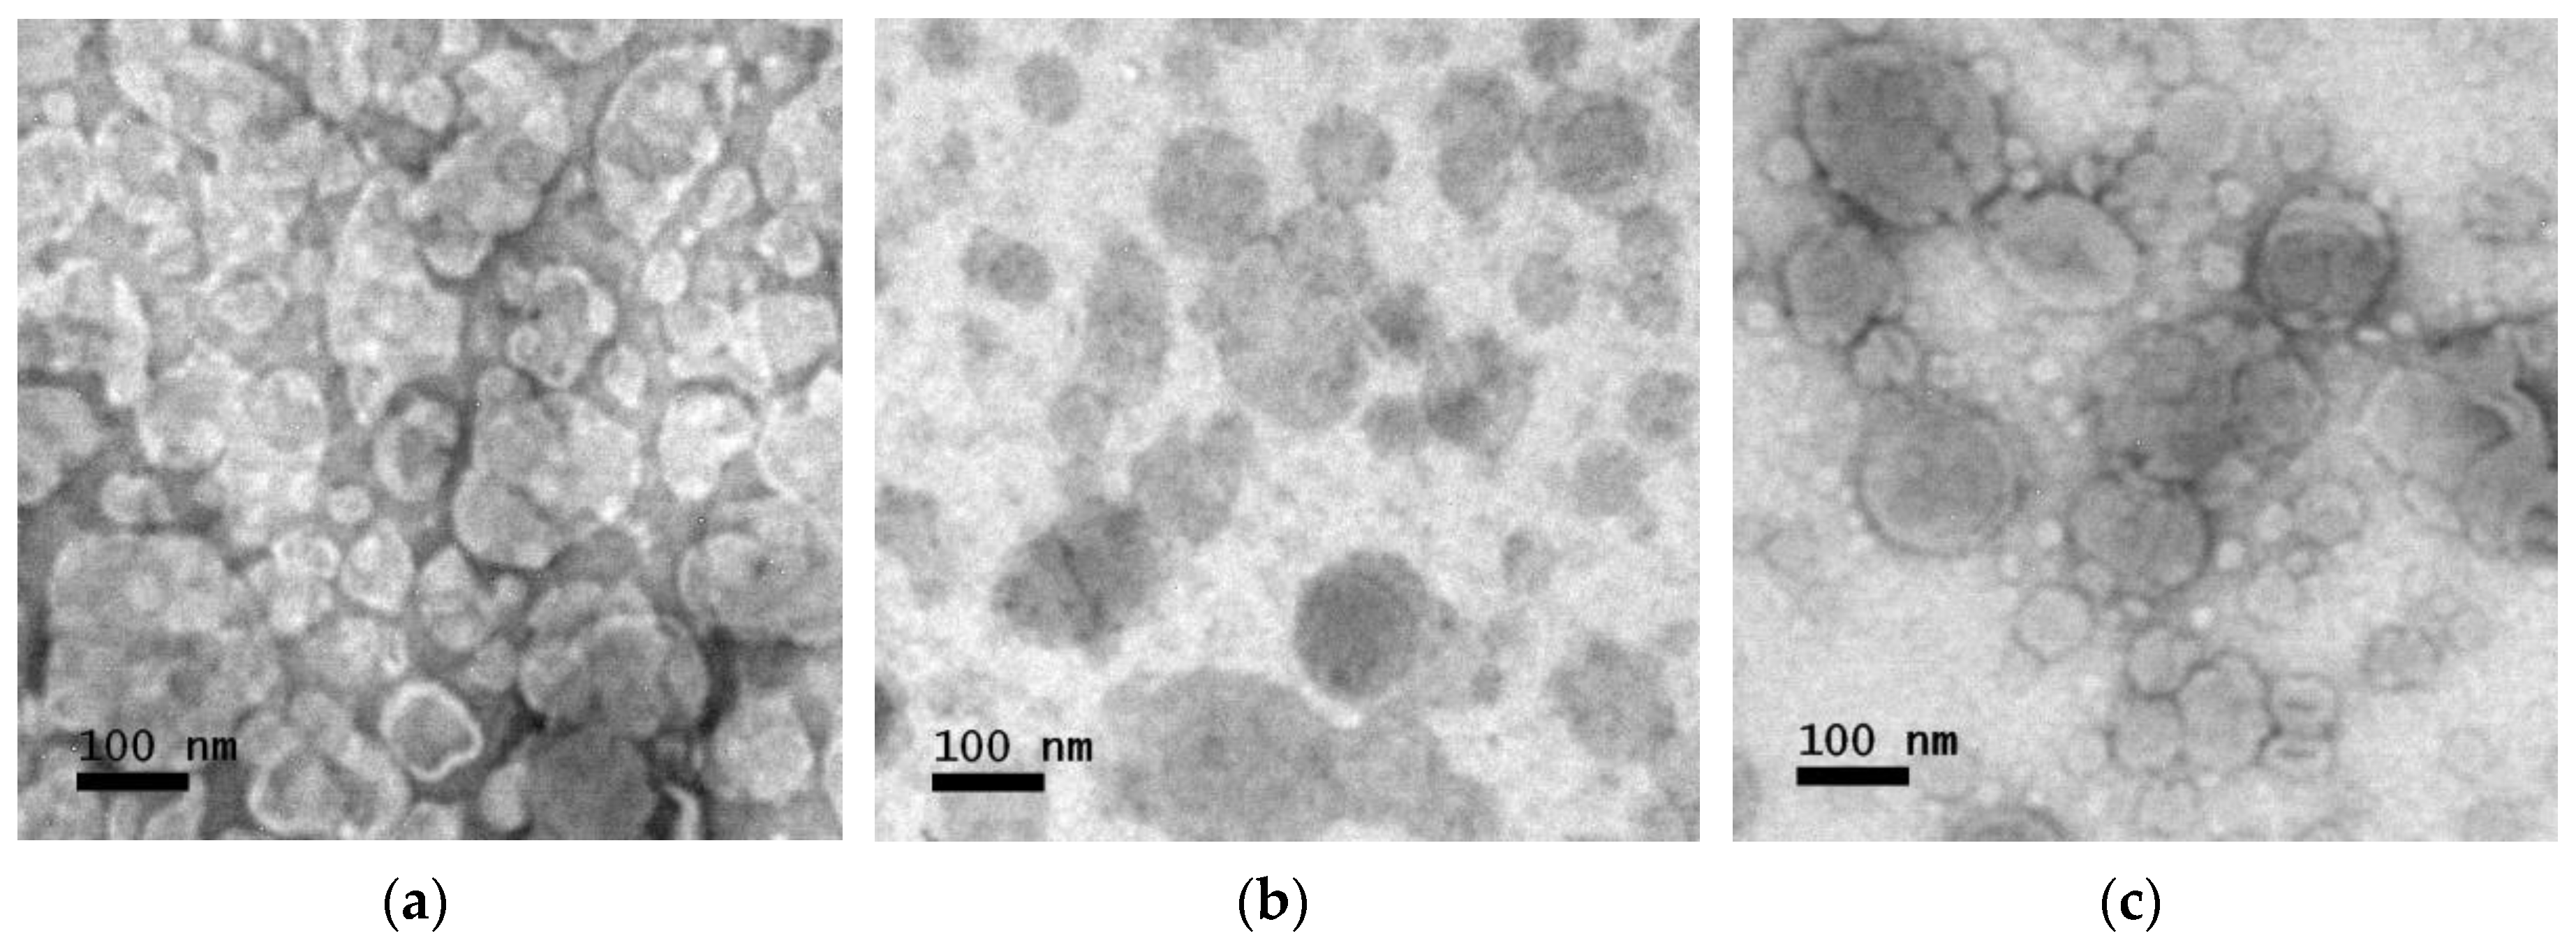
To obtain information about the shape of the vesicles TEM technique was also used to study the system. Images of the vesicles were taken to observe morphology and size distribution of the liposomes (Figure 3). The sizes of the vesicles were found to be 103.8±6.3 nm for the system with 0% PDPC, 103.3±6.1 nm for the system with 50%PDPC and 83.1±6.0 nm for the system with 100%PDPC (Figure 4). The sizes obtained are consistent with DLS measurements considering DLS provides the apparent hydrodynamic diameter of the vesicles and not the actual diameter and contribution in scattering from larger particles shifts the resulting size distribution towards larger diameters.
Vesicles are expected to be spherical in shape with some irregularities due to collapse from contact with the grid and the dehydration from the high vacuum in the microscope chamber however only samples containing PDPC presented this characteristic. To study this change in morphology the roundness of the vesicles in TEM images were analyzed using the roundness formula.
R o u n d n e s s = 4 a r e a π ( m a j o r a x i s ) 2
Roundness was found to be 0.698±0.019, 0.838±0.013 and 0.832±0.012 for the system with 0% PDPC,50%PDPC and 100% PDPC respectively (n>200 for each sample,). T-test statistical analysis was performed between the system containing 0% PDPC and 50% PDPC using 5% level of significance and a degree of freedom of 367, with T-value of 1.966. The computed value was11.63 indicating there is an intrinsic difference. Same analysis was performed samples containing 50% PDPC and 100% PDPC using 5% level of significance and a degree of freedom of 409 with a T-value of 1.966. The computed value was 0.639 indicating that there is no difference between means and systems with PDPC behave similarly in TEM conditions. Literature indicates that polyunsaturated lipids increase membrane fluidity [21] and the difference in the system with 0% PDPC could be explained considering that PDPC increases this parameter. Biological membranes consist of patches of differing composition, called domains. Lipid domains are consequence of preferred affinities between different lipids. Fluidity of the membrane is tied to the presence of omega lipids and might raise differences in liposome morphology in TEM conditions. Membrane fluidity is very important in protein activity of proteins located in the bilayer [22] and PDPC would have an influence increasing domain fluidity.
To interpret the chemical deviations from normal that occur in brain diseases, it is necessary to determine reference values in healthy individuals. After an extensive search on the subject, the most detailed works, not only on the lipid proportion of the normal human brain but also on its fatty acid composition, are those of O'Brien and Sampson. [1,2].. Of the four age groups that present these works, we focus on the adult brain, obtaining the proportion of lipids esterified with DHA. Although there are other polyunsaturated fatty acids present, the aforementioned omega-3 is the most abundant and promotes domains in the presence of cholesterol, as described in the Introduction section.
As a result of our choice, a multicomponent lipid model membrane was obtained that mimics the neuronal membrane of gray matter. Given that its number of components results in a complex membrane, it was decided to conduct a systematic study starting with a bicomponent model membrane and adding one lipid at a time to observe the contributions of each to the membrane’s surface electrical and mechanical properties.

3.3. Consecutive Addition of Lipids

In order to characterize the five-component membrane, prior to the addition of PDPC, systems ranging from two to five components were studied: POPC-Chol; POPC-POPE-Chol; POPC-POPE-SM-Chol; POPC-POPE-SM-POPS-Chol. The respective proportions are described in the experimental section.

3.3.1. Zeta Potential and Conductivity

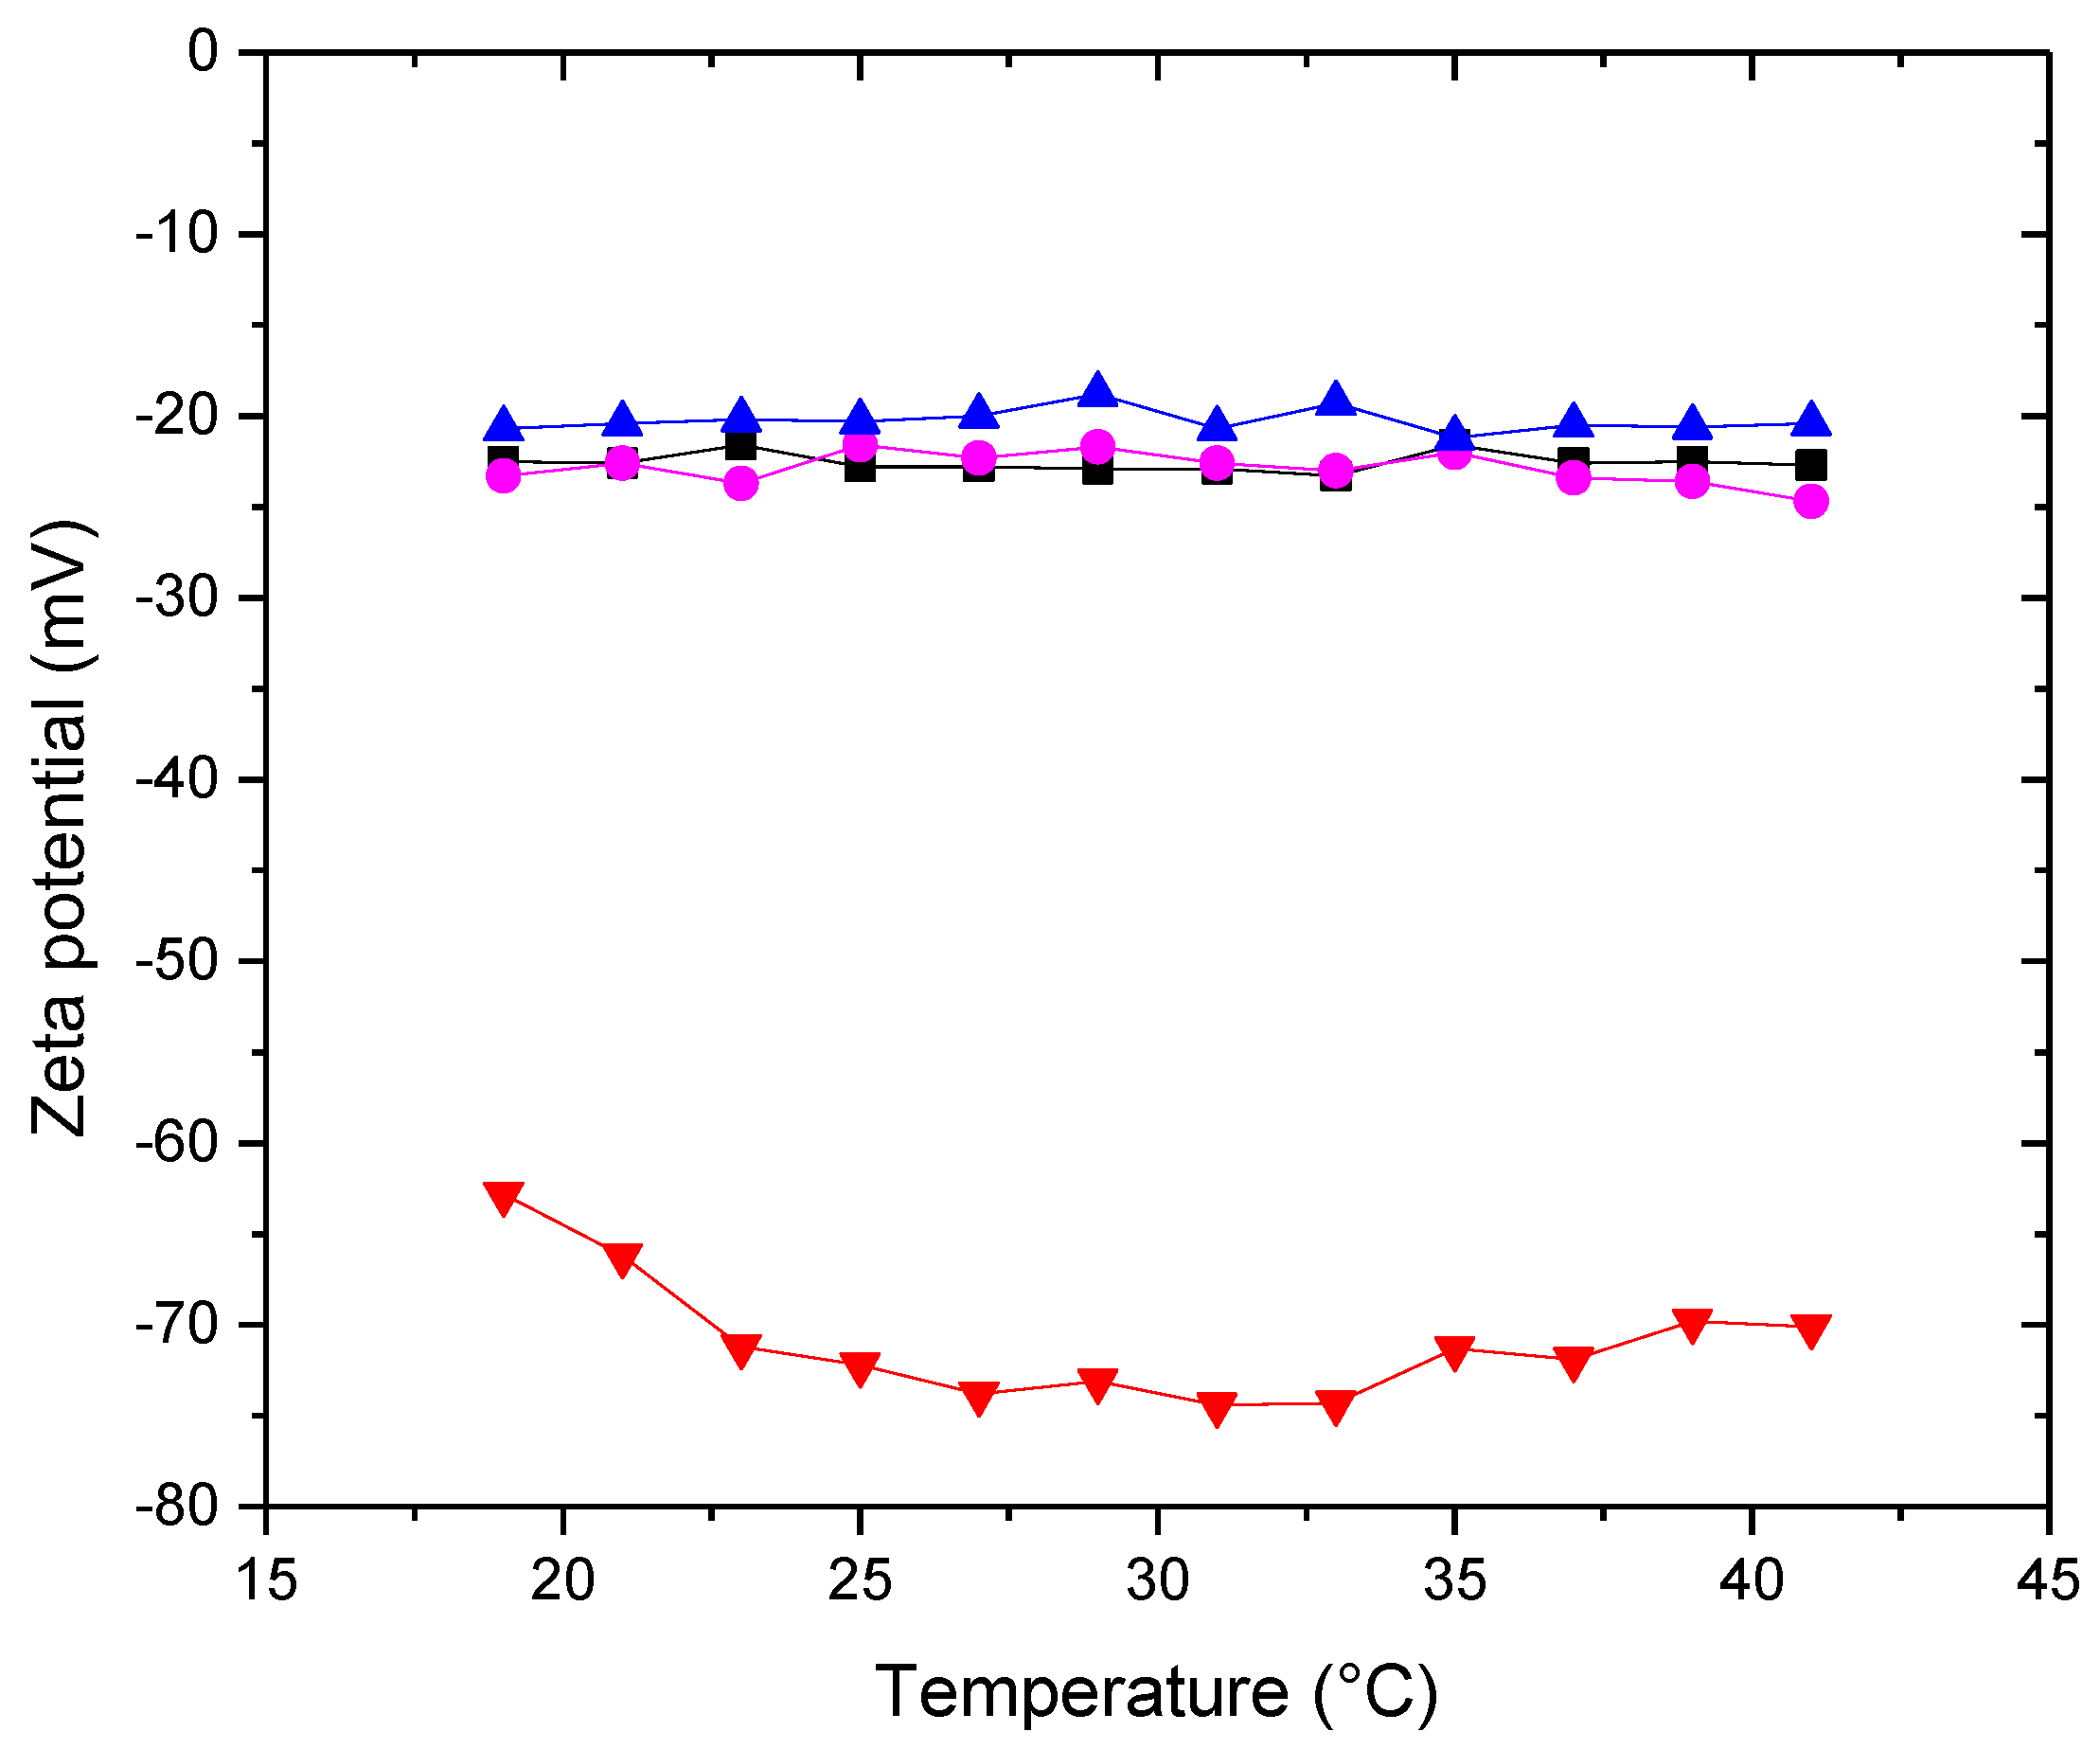
Figure 5 shows the zeta potential as a function of temperature for the different MLV membranes in an aqueous medium.
Zeta potential provides information about the liposomal surface through surface charge. The sign of the zeta potential for a zwitterionic lipid in an aqueous medium, as a consequence of the surface arrangement of head groups (and not due to surface adsorption of ions from the medium), was proposed by our research group [23]. It is considered that the sign of the zeta potential of the different proposed membranes would be a consequence of the various surface rearrangements, including domains, resulting from the different interactions and affinities between the components of the system. Starting with the bicomponent system, POPC-Chol, it shows negative zeta potential values. Based on the planar structure of cholesterol, which allows intercalation in the acyl chain region of phospholipids, Pandit et al. [24] proposed the formation of complexes between DPPC and cholesterol, where not only is the typical OH-O hydrogen bond established (cholesterol is a donor and phospholipid is an acceptor), but also between the methyl hydrogens of the phospholipid's choline group and the oxygen atom of the hydroxyl group of cholesterol (cholesterol as an acceptor and phospholipid as a donor). These interactions would expose the phosphate groups on the surface, resulting in a negative zeta potential for the POPC-Chol system. With the successive addition of other lipids, the result in terms of the sign and magnitude of the zeta potential is similar. It is clearly observed that the addition of POPS drastically makes the membrane potential more negative, as expected for a charged lipid.
This result is relevant because the surface charge of the membrane plays a significant role in many biological processes, such as the interactions of biomembranes with peripheral membrane proteins and liposomes for drug delivery with the immune system [25].
In a previous work, we presented this technique as a non-invasive method from which the transition temperature of lipid systems can be inferred [26] through a change in the slope in the region of this temperature. It is known that the presence of cholesterol in lipid membranes fluidizes the gel phase and rigidifies the liquid crystalline phase, giving rise to a new phase called the liquid-ordered phase (Lo). This effect is reflected in the graphs by the absence of an abrupt jump in the zeta potential in the temperature region close to the main phase transition. Other studies, such as the temperature dependence of fluorescence emission spectroscopy, with similar results, have been reported [27]. The lack of a slope change is predictable due to the disordering effect of sterol in the gel phase, which allows the mobility of molecules in the PC lipid membrane [28,29], while at higher temperatures, sterols produce a more ordered membrane [28]. In general, the hydroxyl groups of sterols restrict the movement of acyl chains and also retain the ammonium group of choline [28]. Another explanation is that sterols may disrupt the interactions between phospholipids, and consequently, the difference in membrane fluidity between the gel and liquid states is less pronounced [30]. The different membranes presented in this section contain 30% cholesterol relative to the lipids present. Only the five-component membrane suggests the occurrence of phase transition, between 22 and 23°C, even in the presence of cholesterol. Perhaps, the proportion of cholesterol is not sufficient, given the various unsaturated lipids that constitute the membrane, to completely modify the phase type. More studies are needed to fully understand this system, given the importance that lipid phase states play in pathological processes of cell membranes.
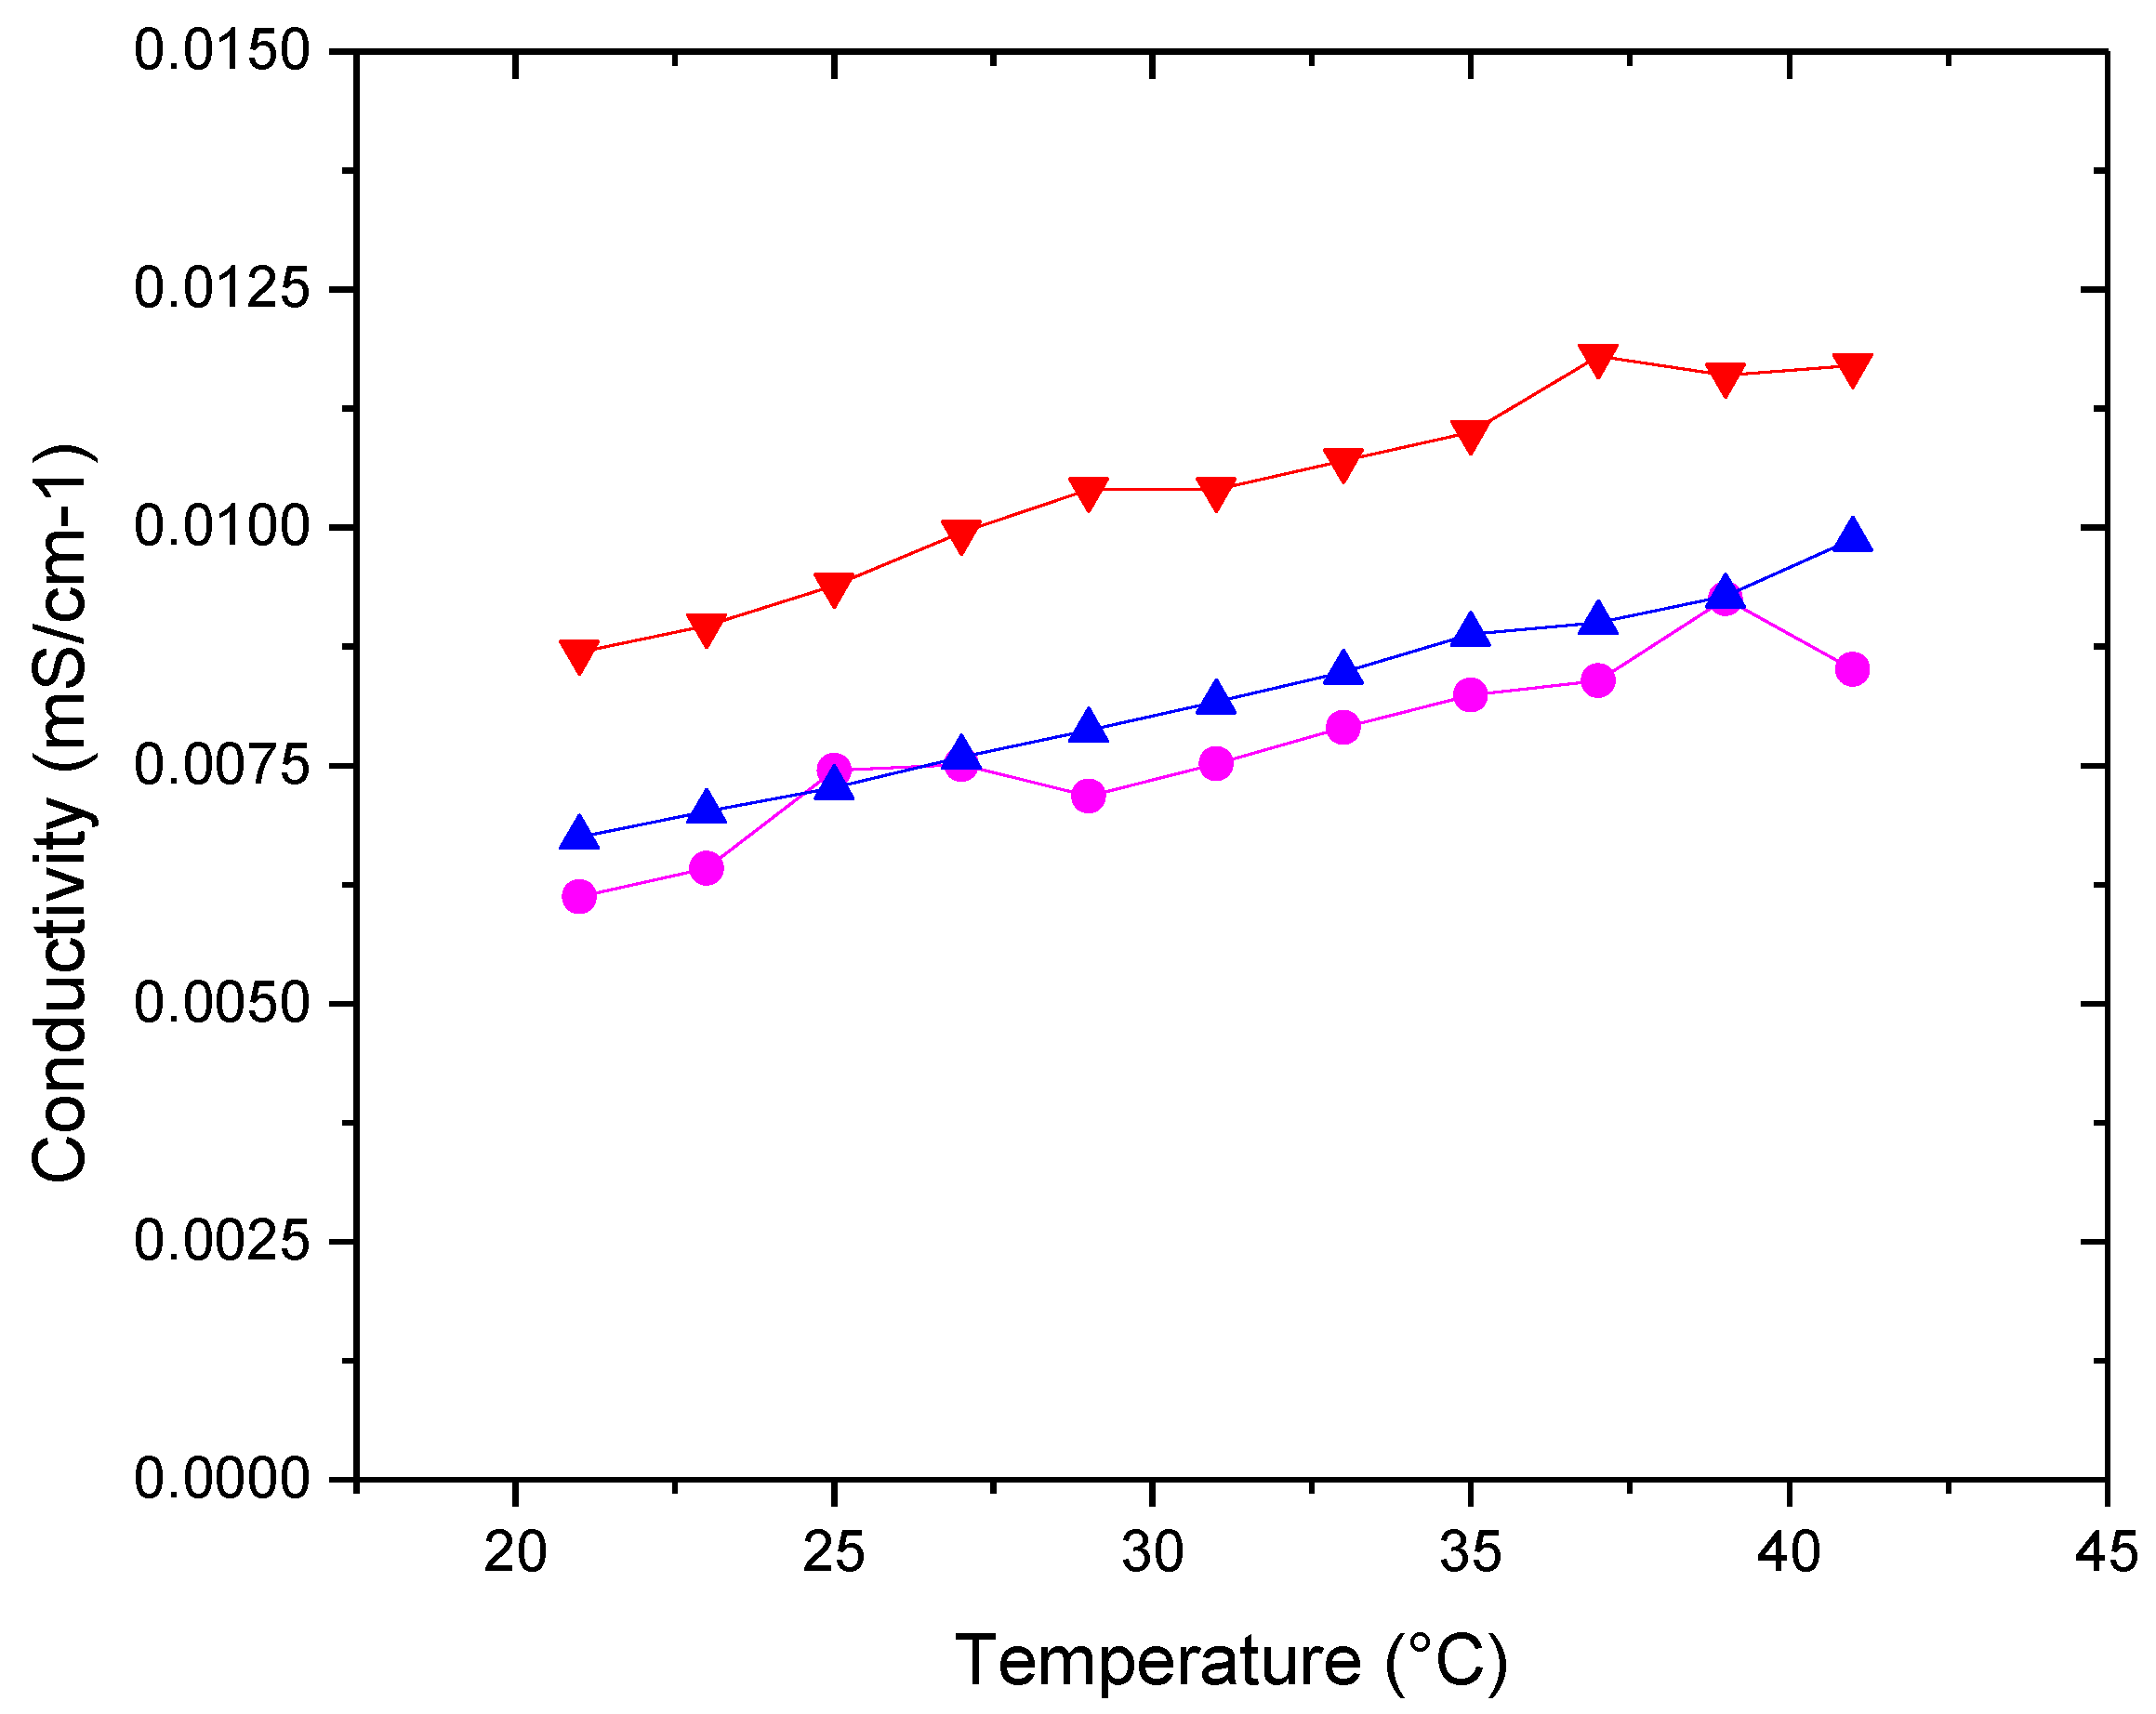
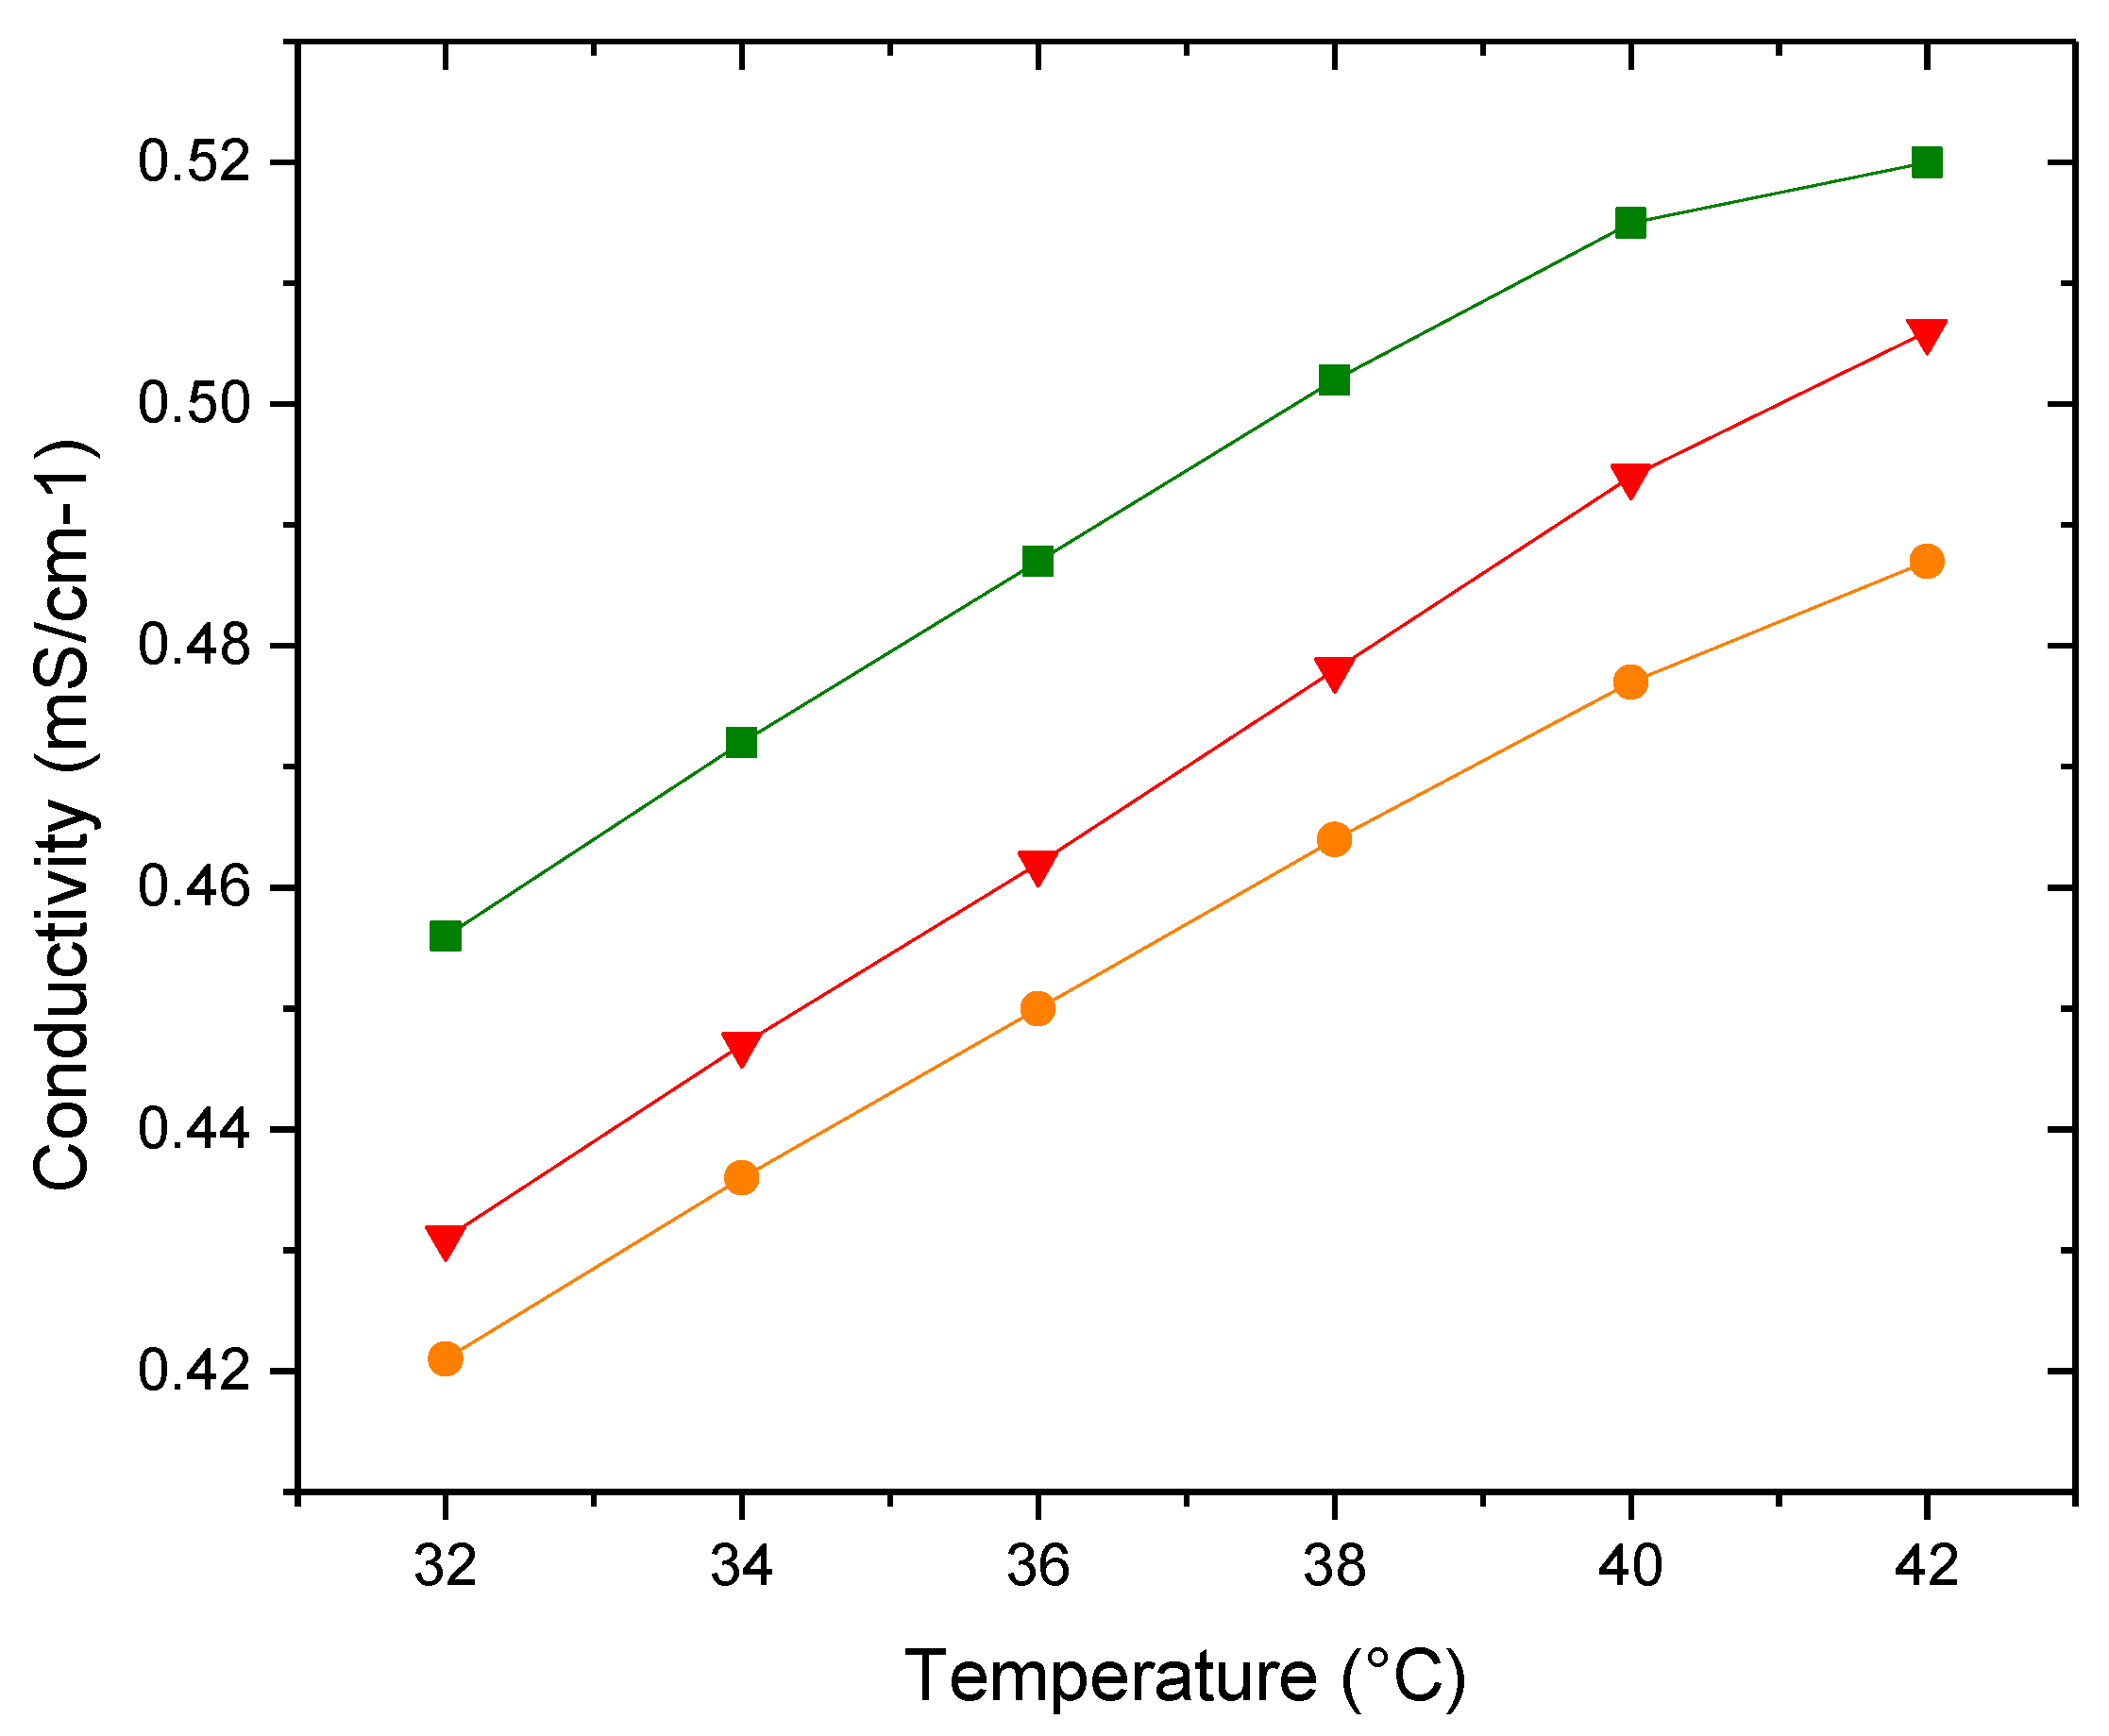
Figure 6 shows the conductivity behavior as a function of temperature for the different membranes. The conductivities of the different systems are of the same order of magnitude in an aqueous medium.

3.3.2. Molecular Acustic

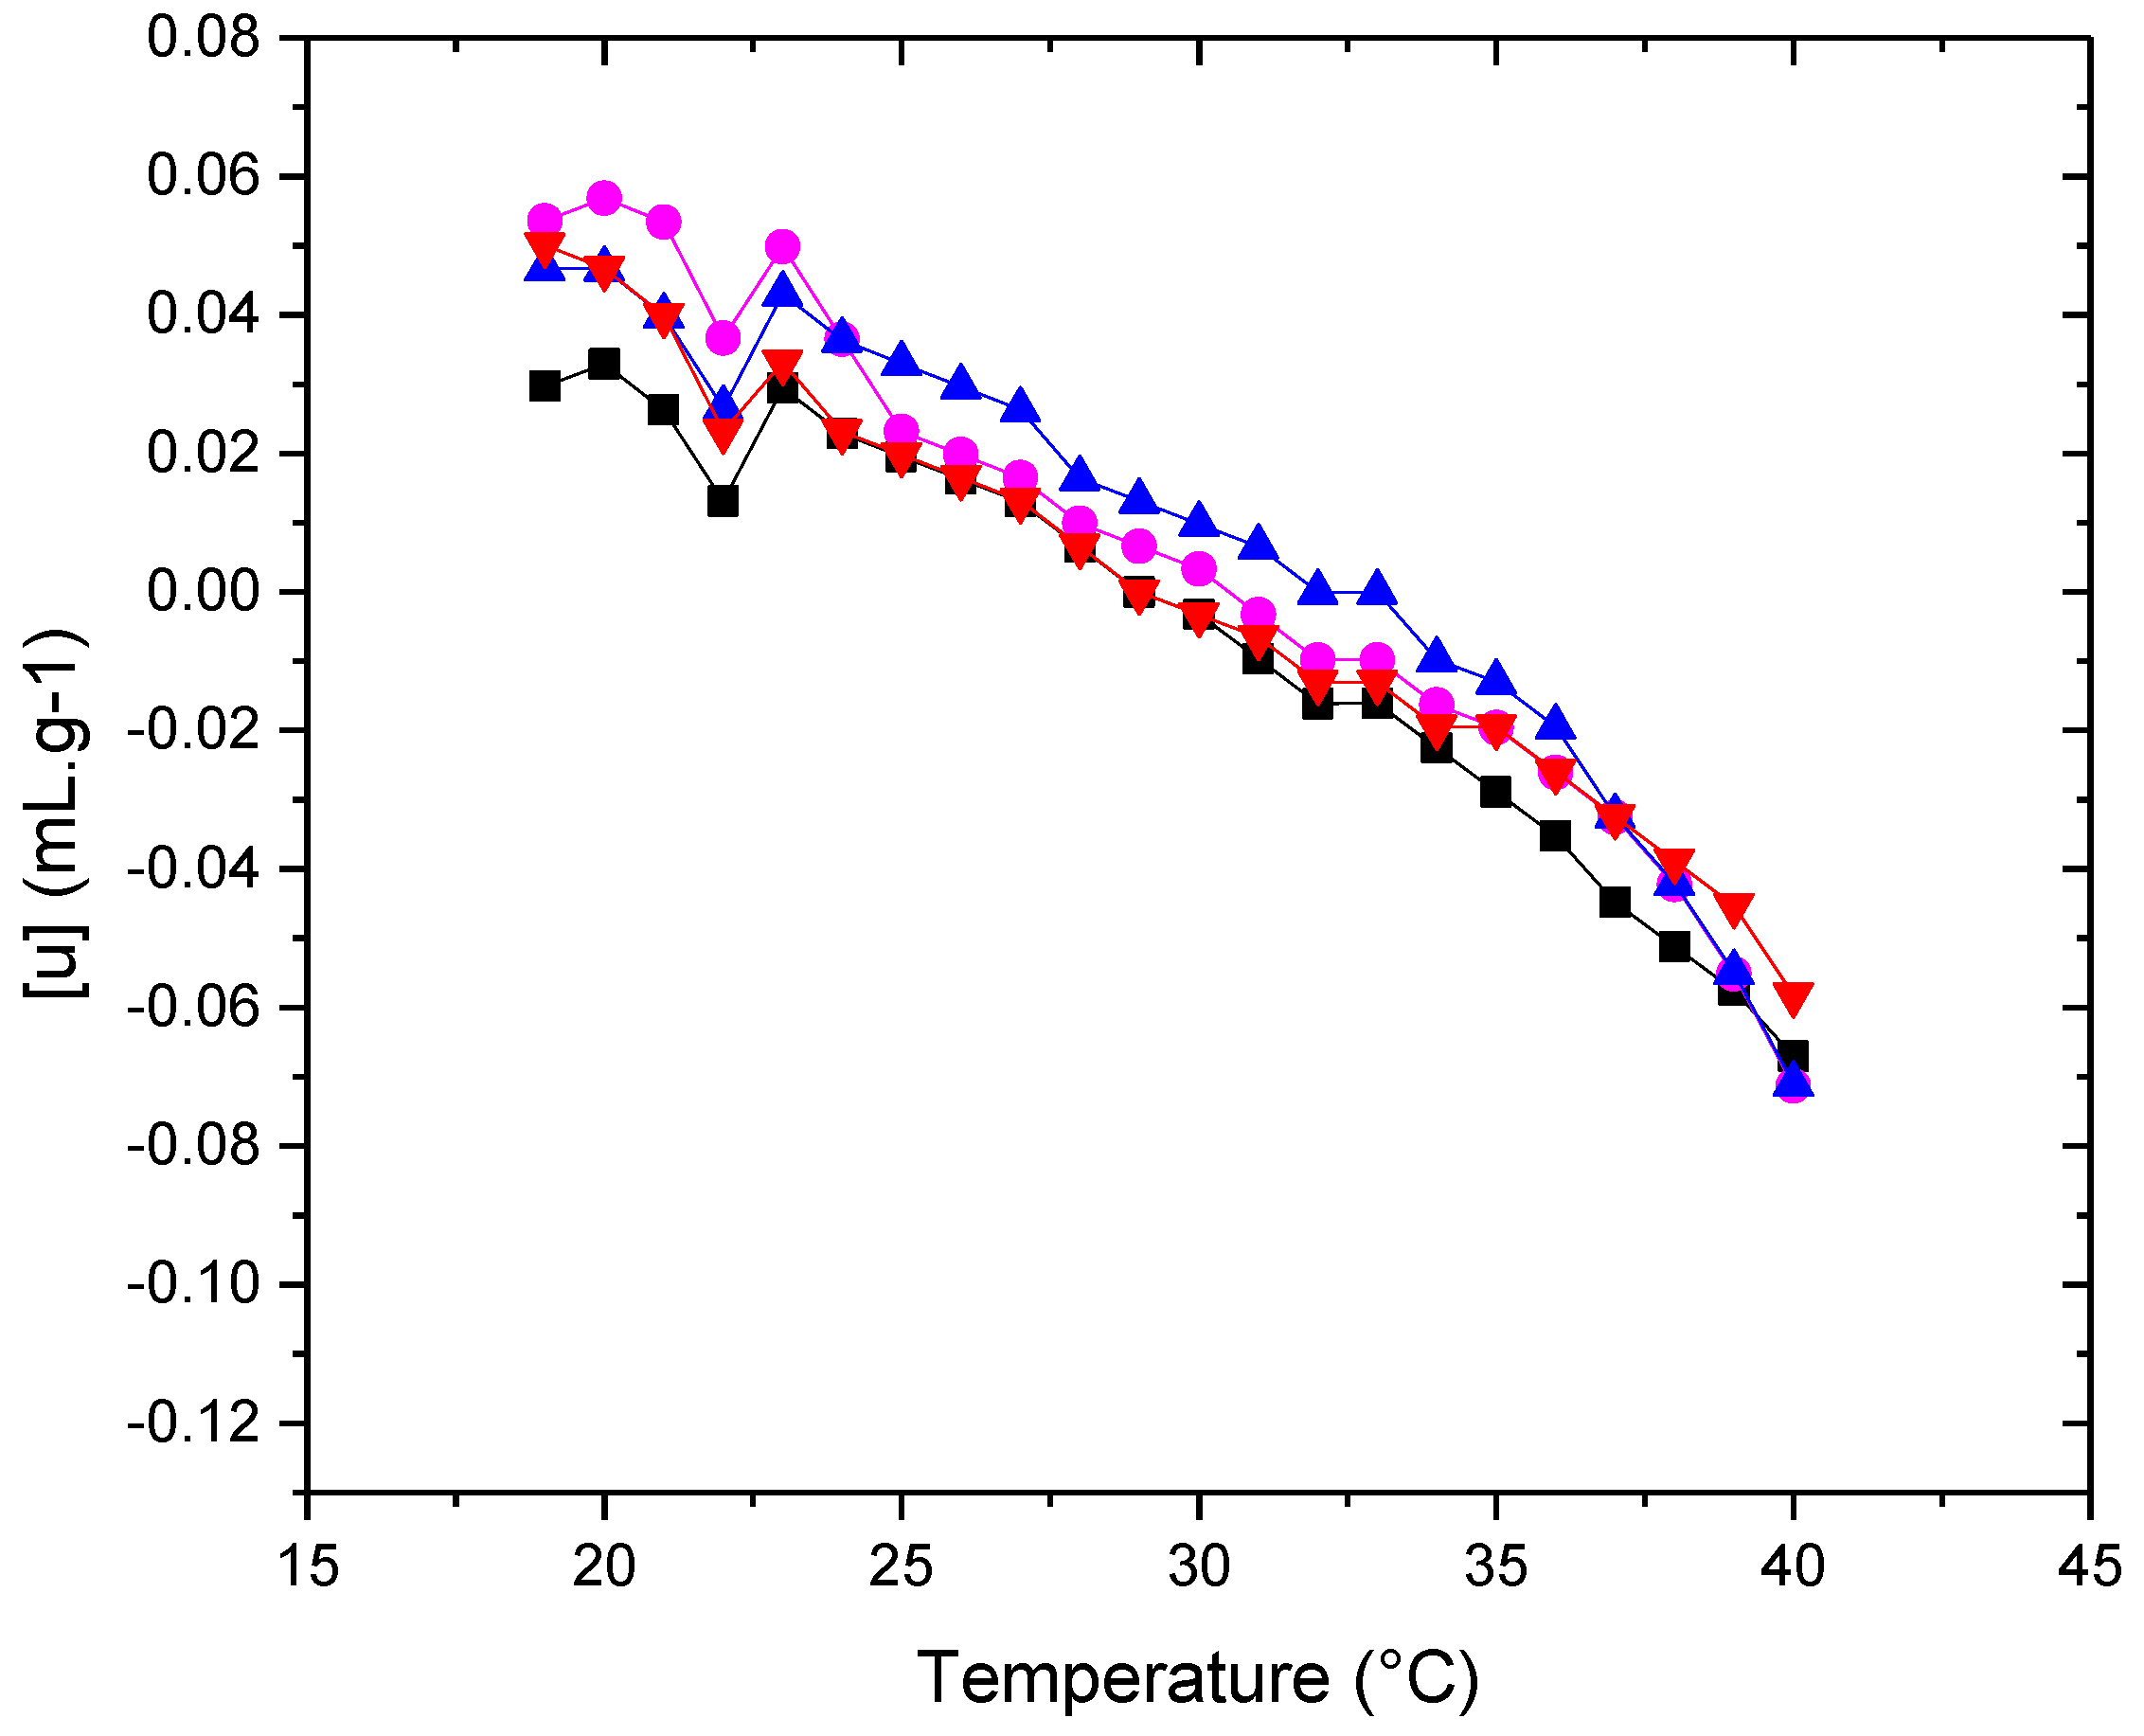
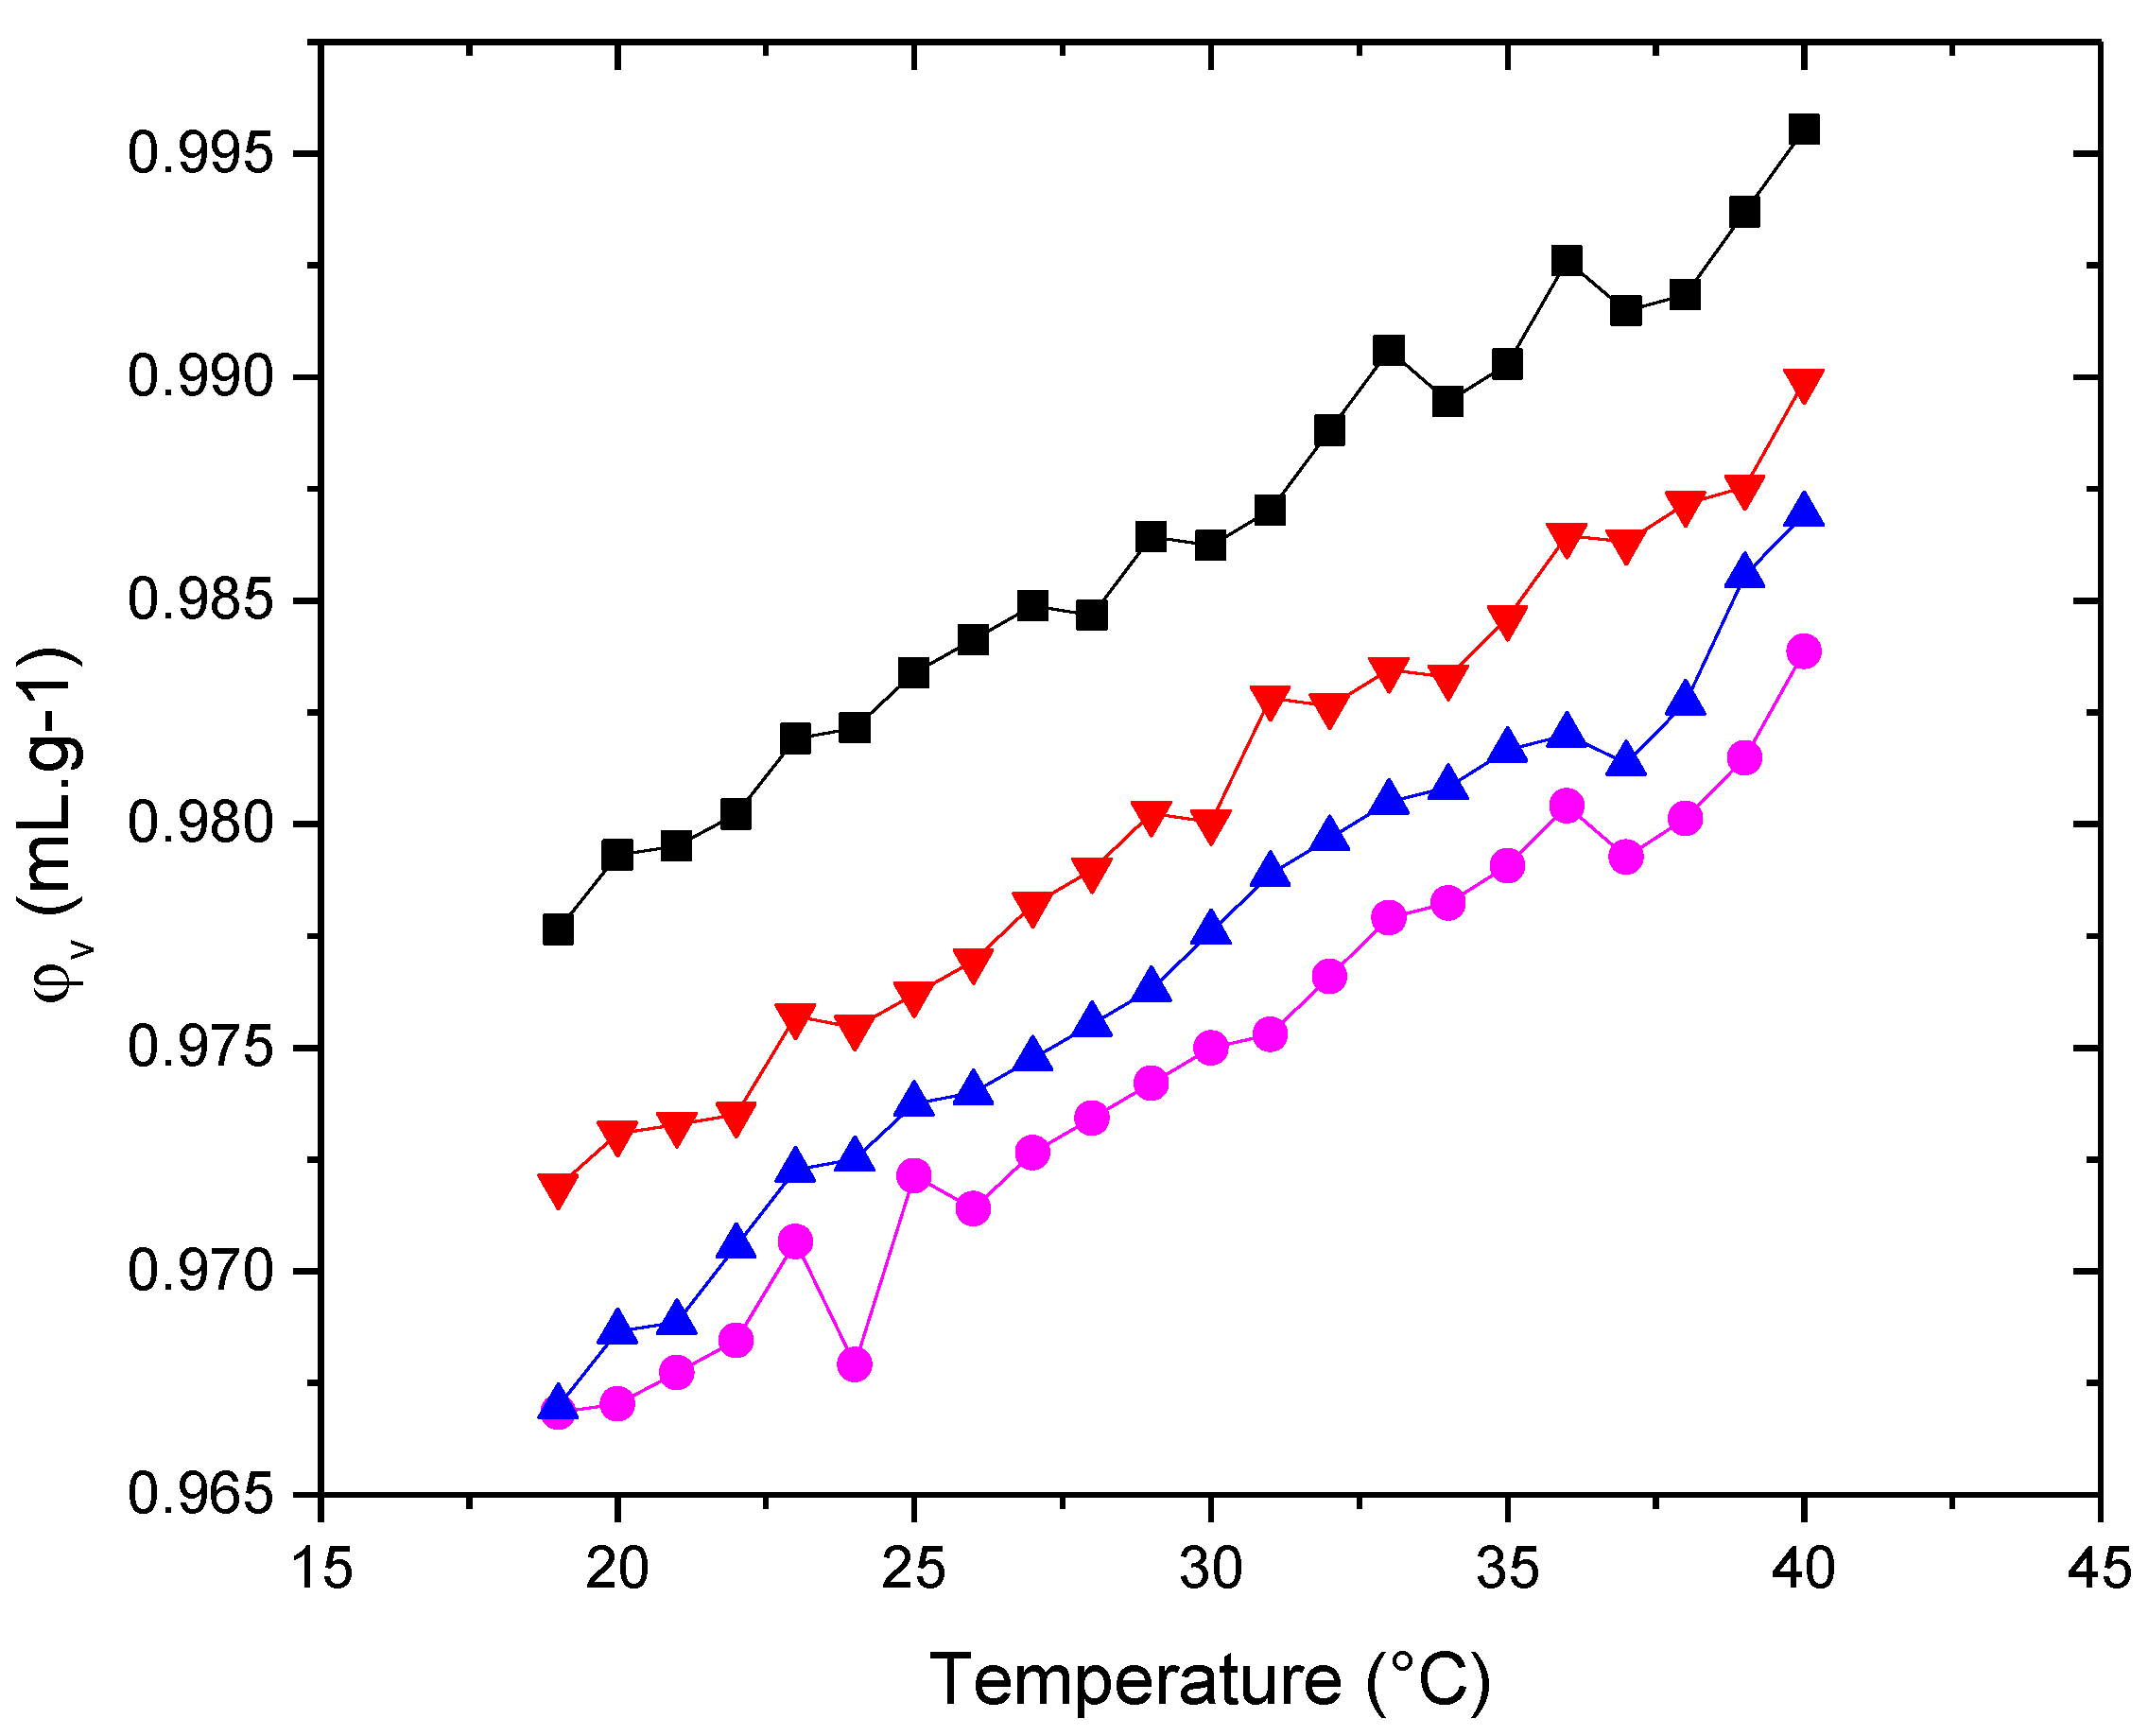
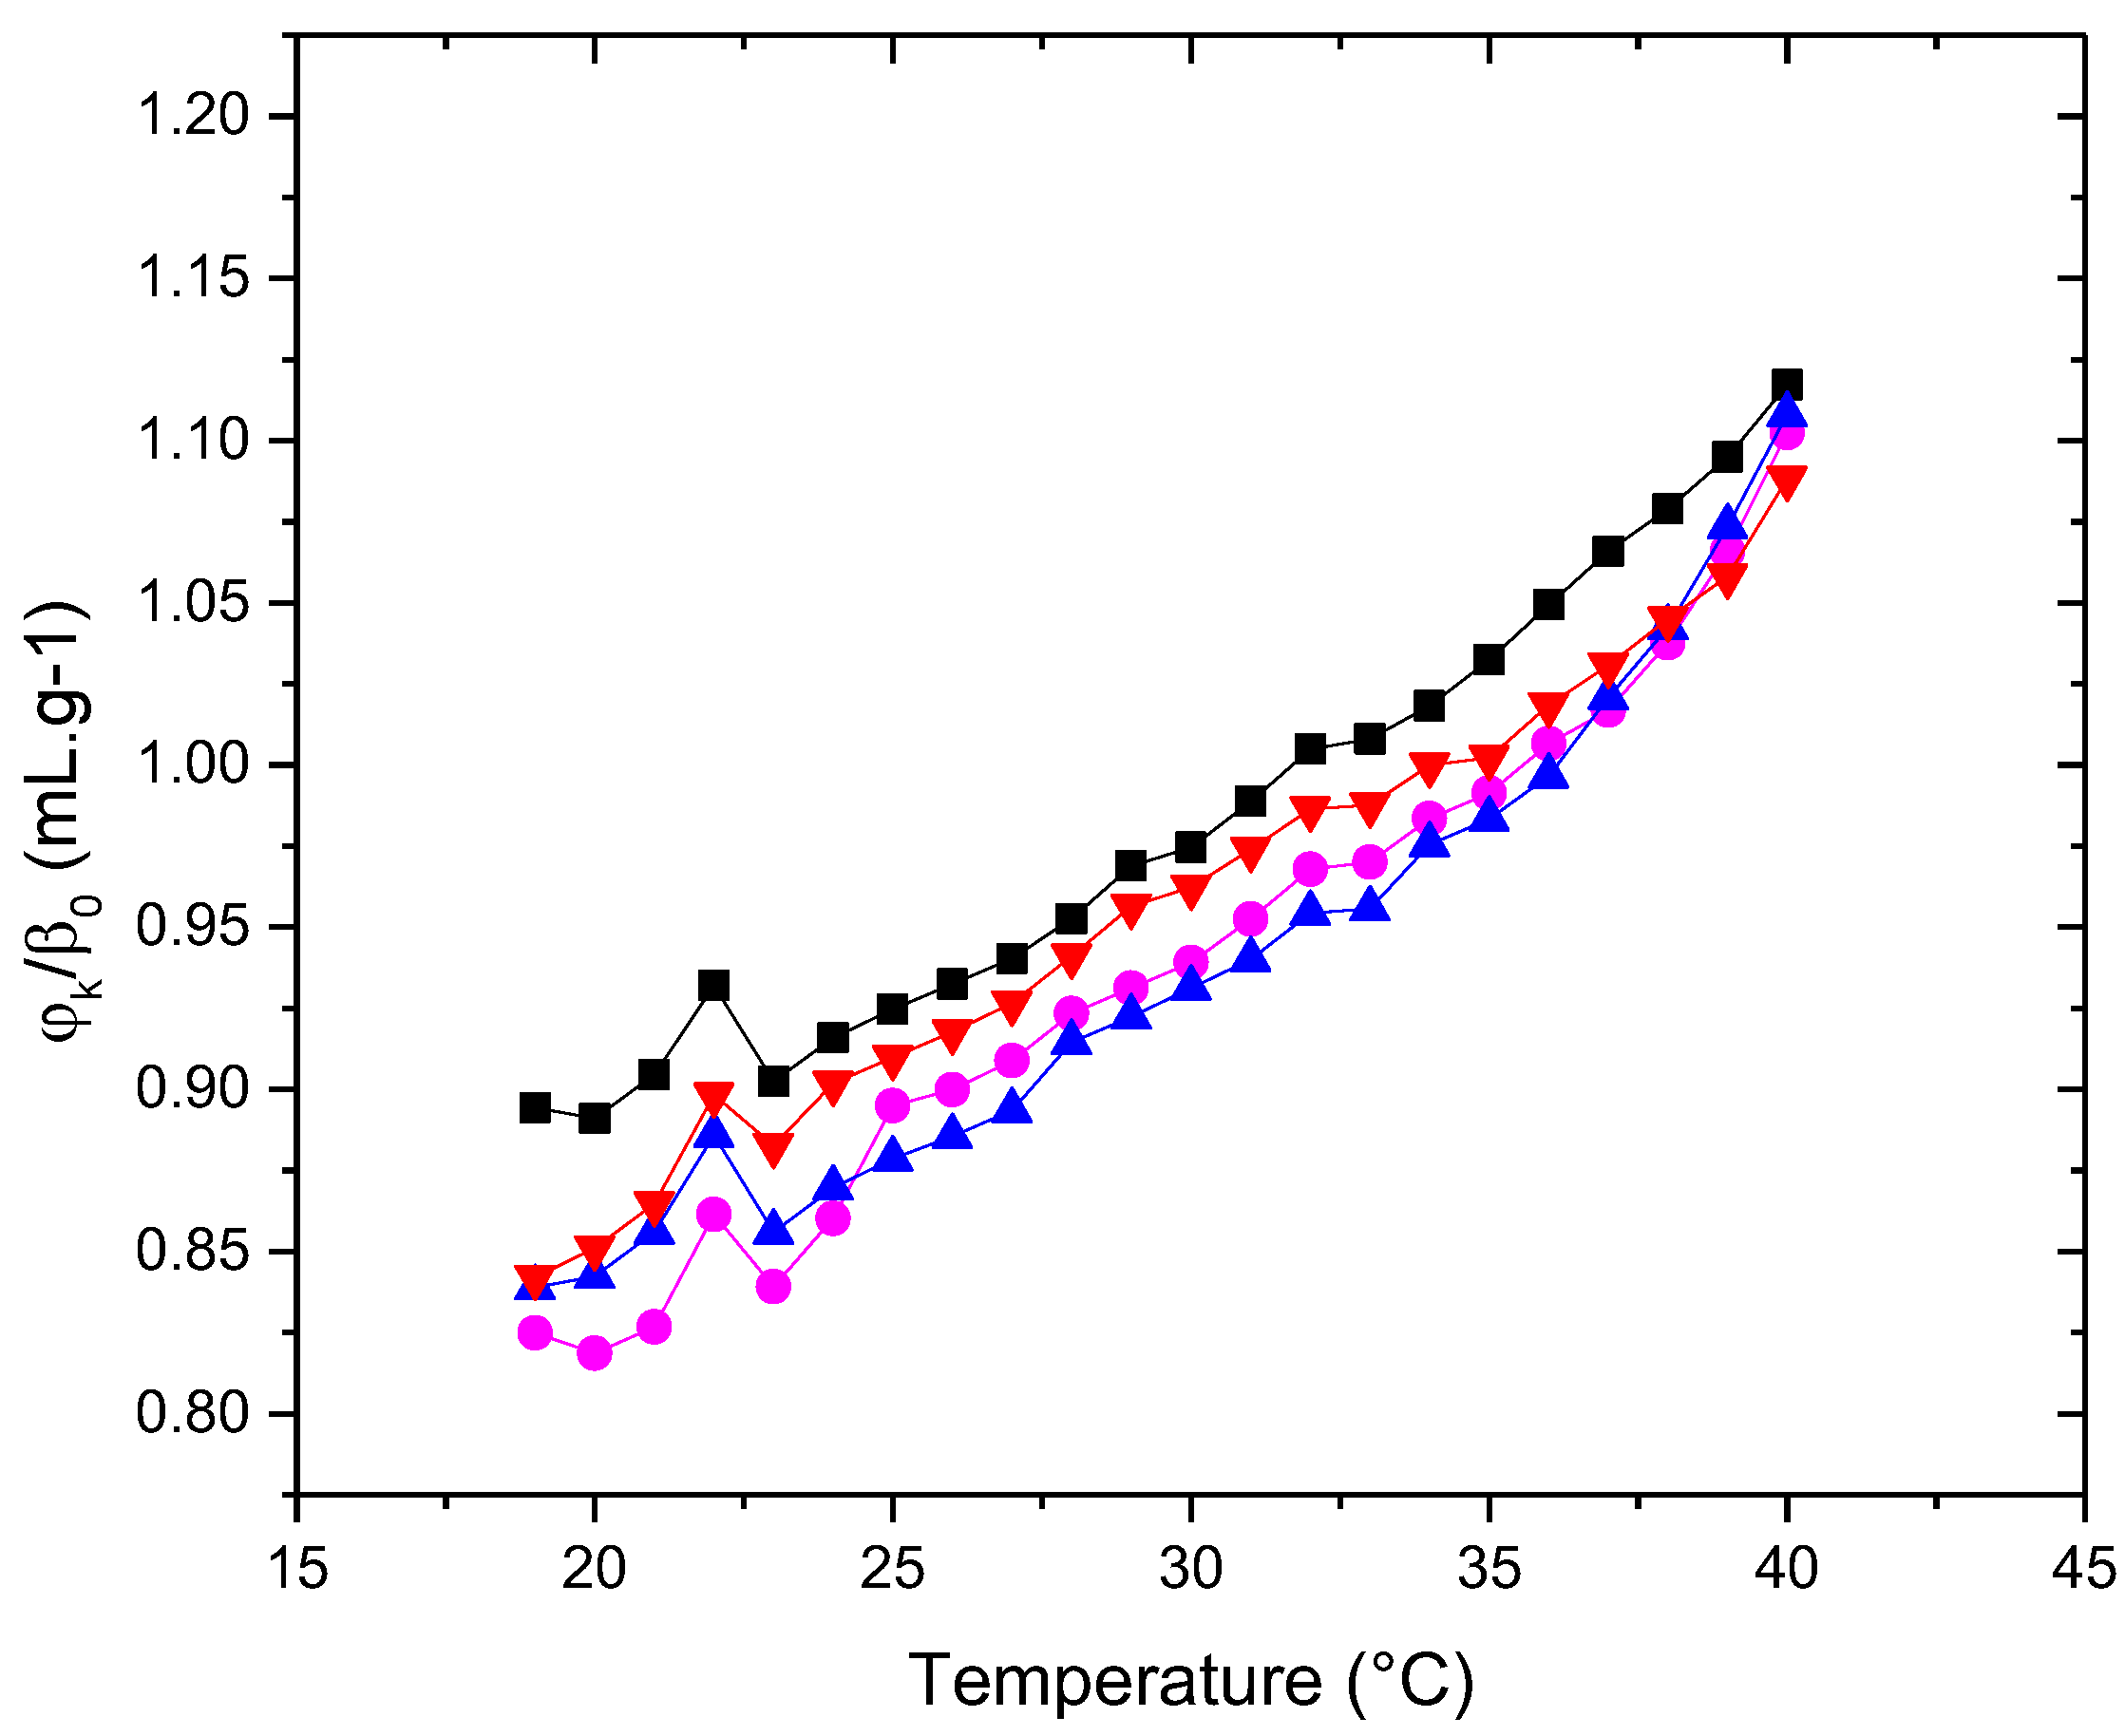
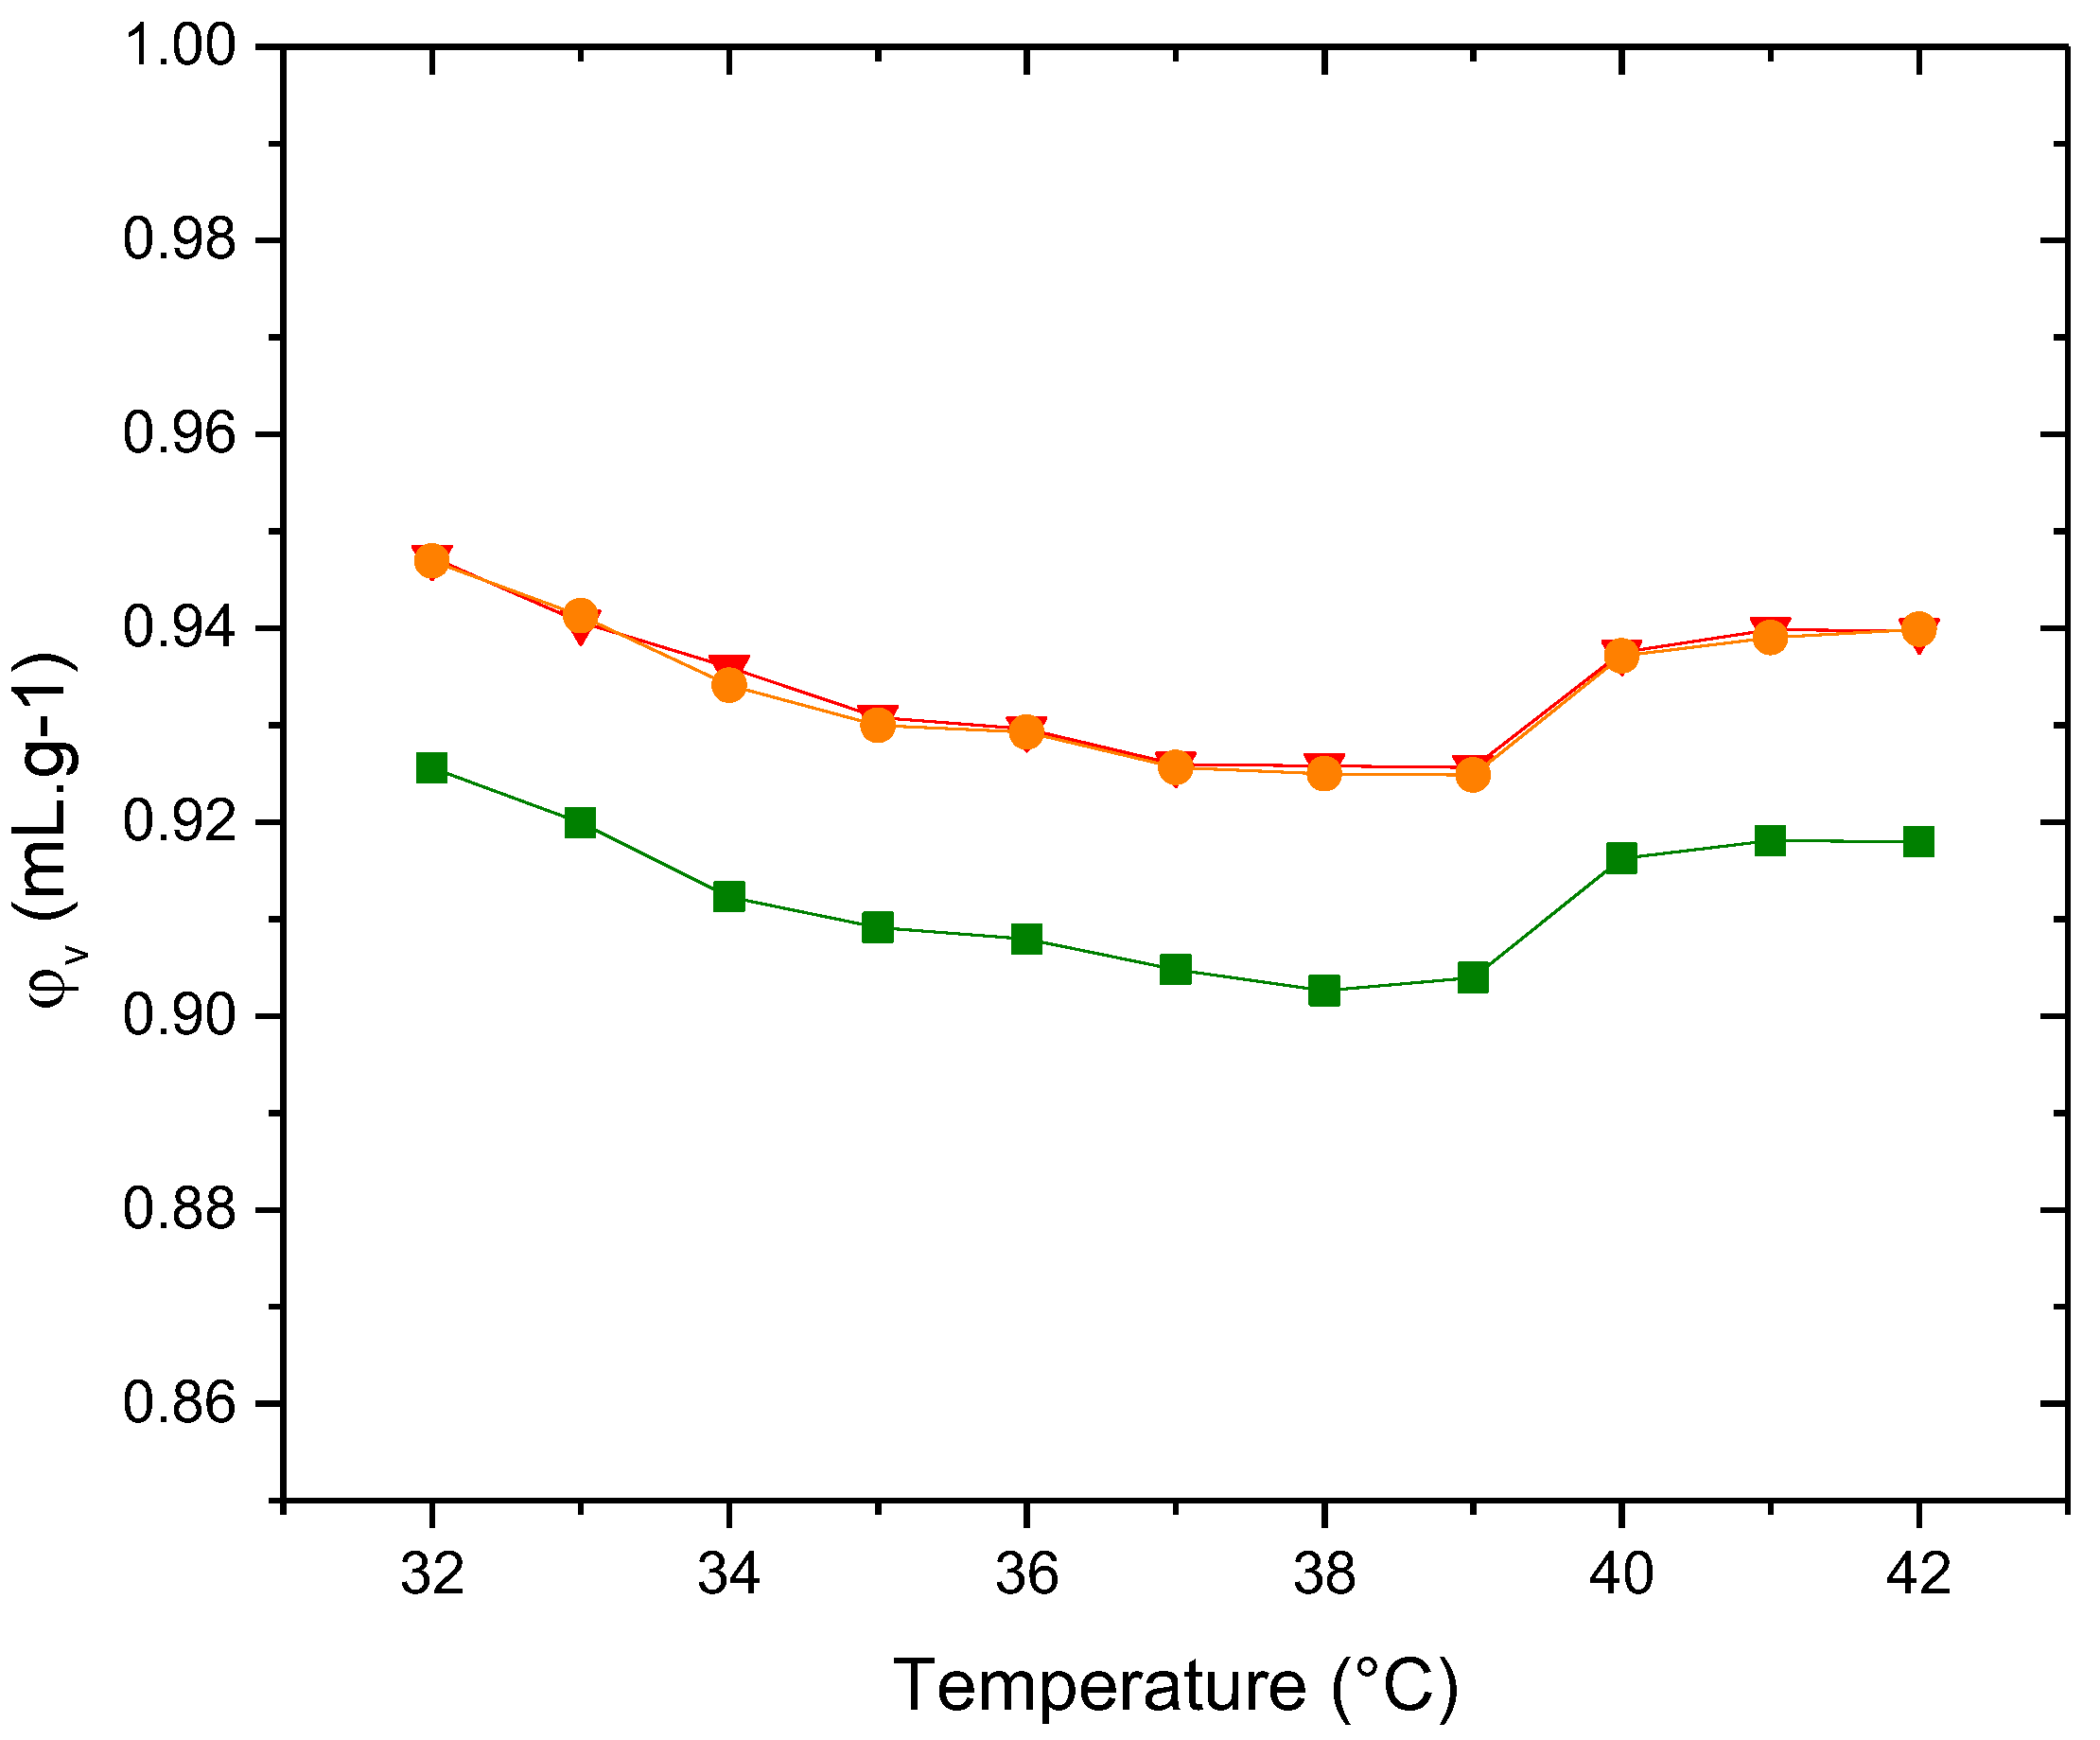
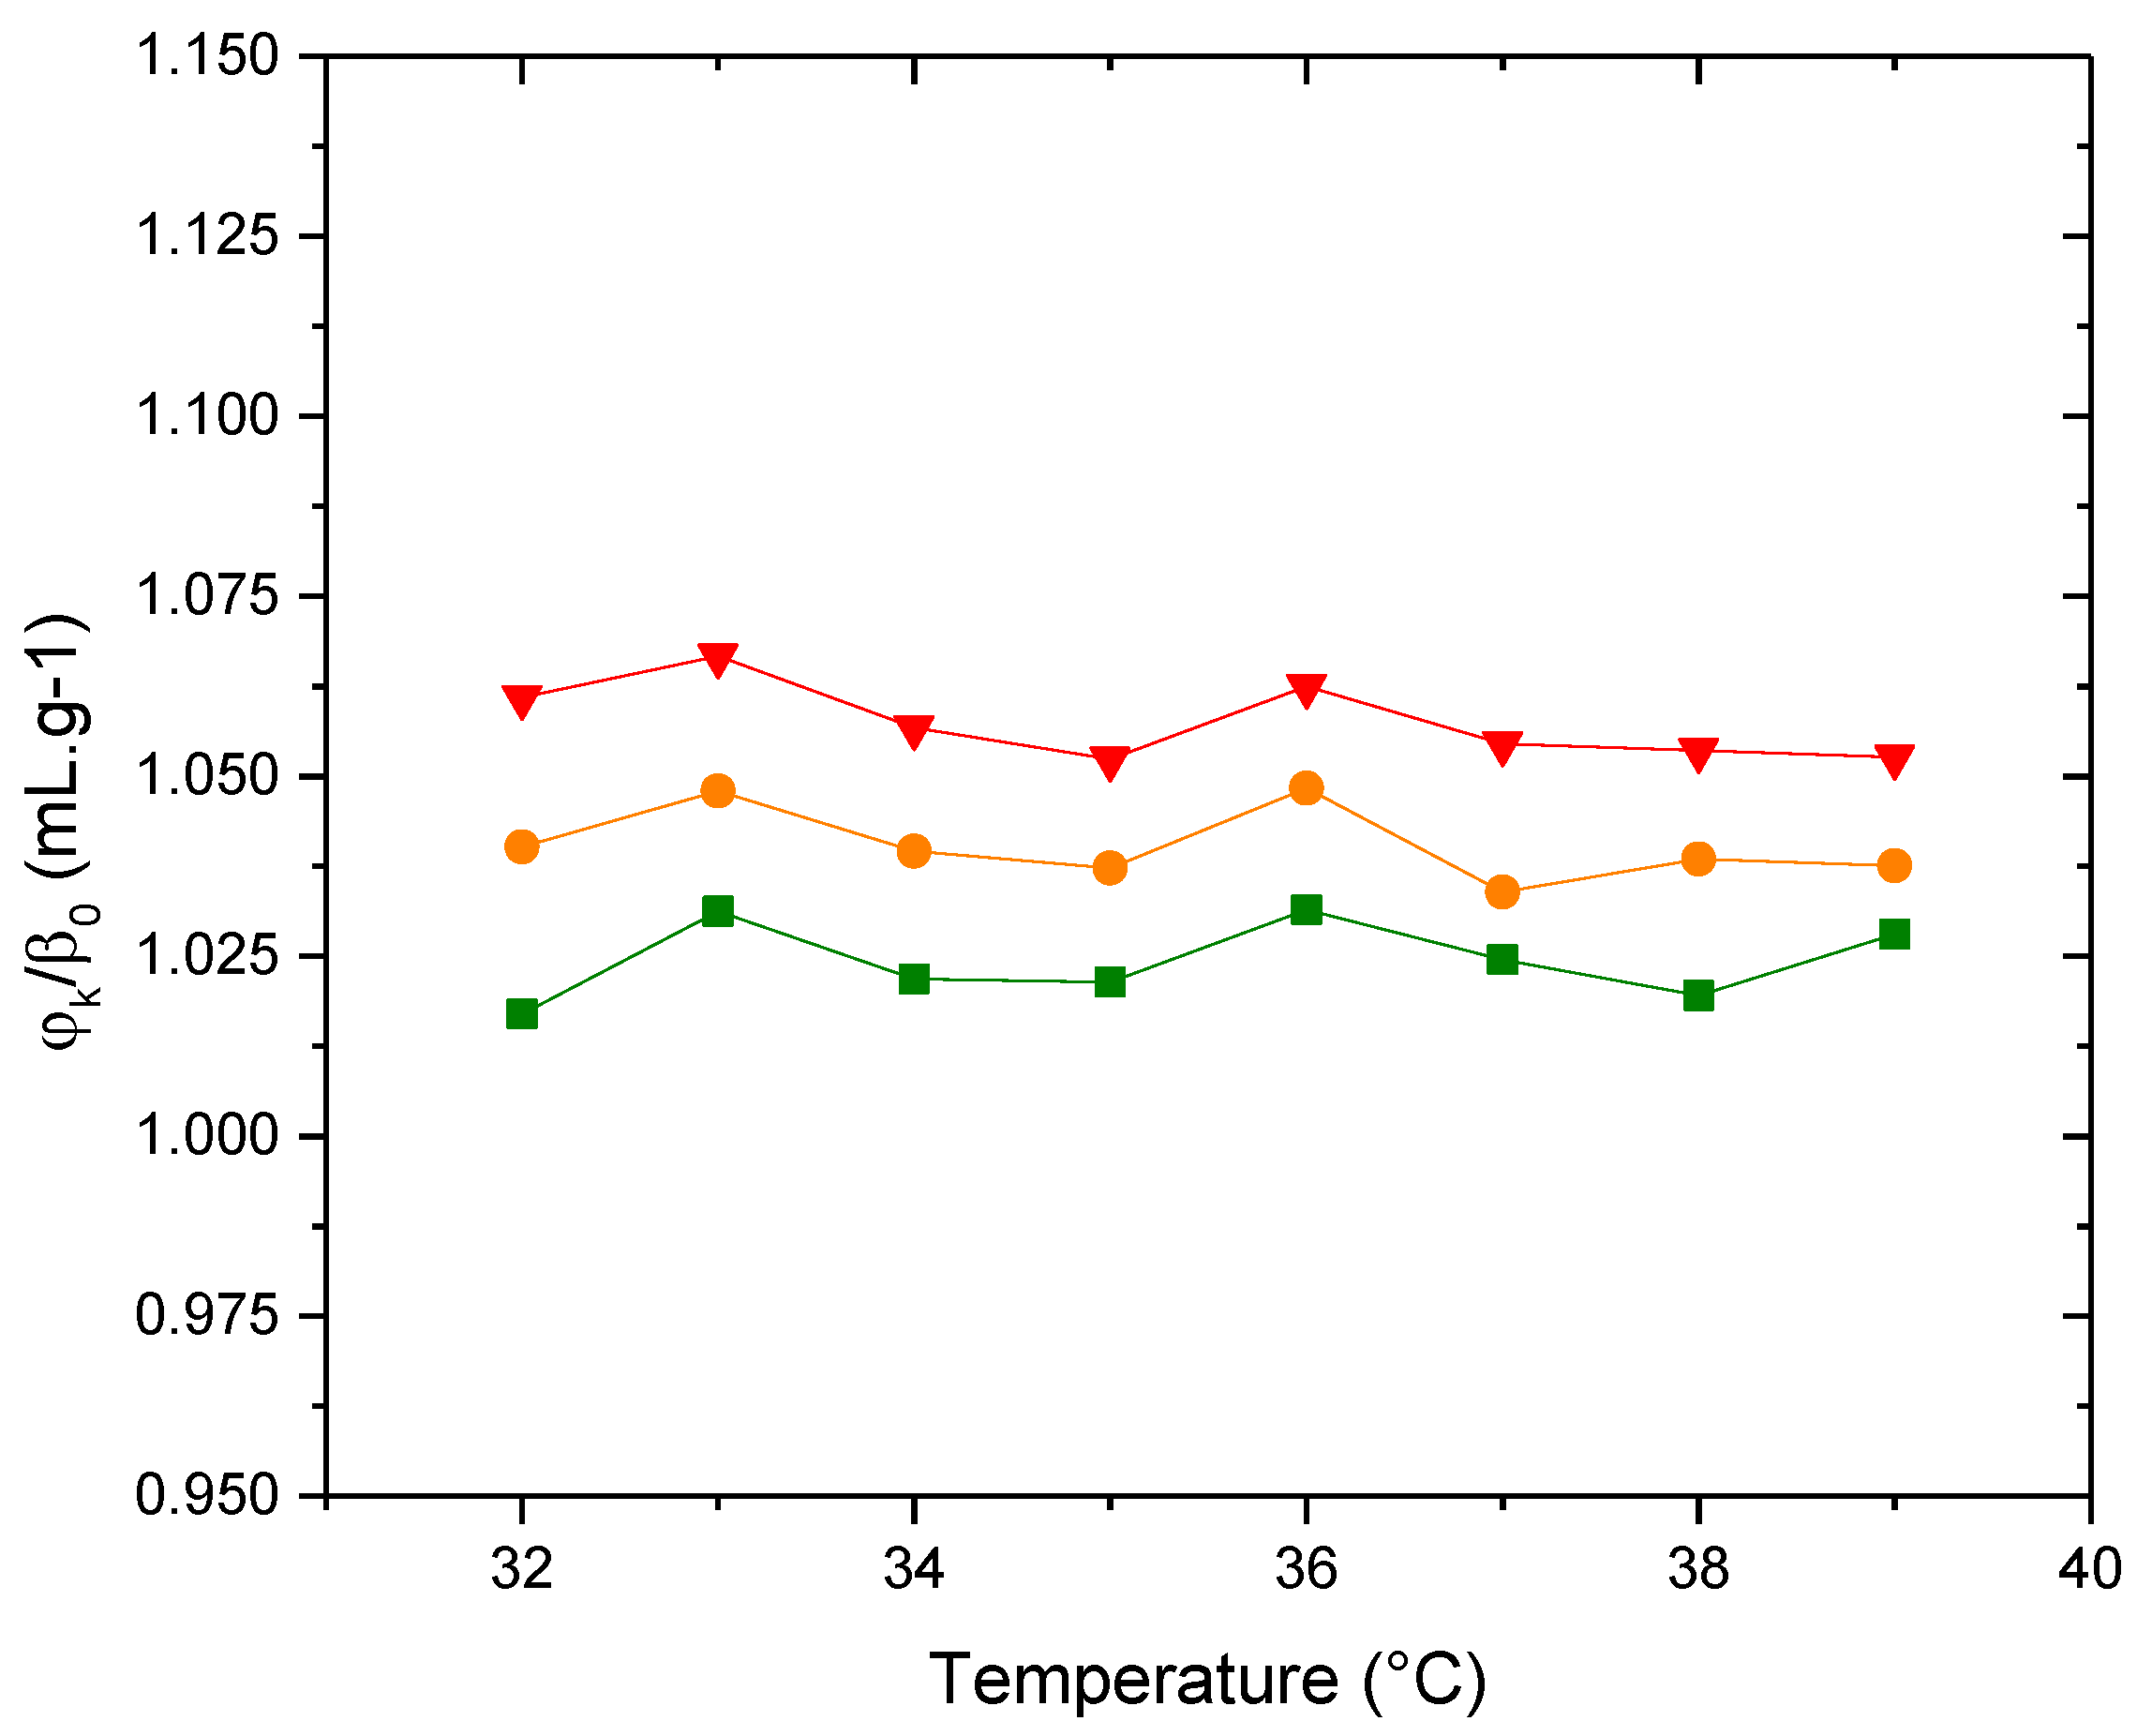
Based on density and sound velocity measurements, the specific volume and specific adiabatic compressibility of the lipid bilayers were calculated. The results for the increment in ultrasound velocity concentration, [u], specific volume, φV, and the specific adiabatic compressibility coefficient, φK0, for the different systems are presented in Figure 7, Figure 8 and Figure 9 as a function of temperature.
A typical feature of the [u] vs. temperature plot is the minimum observed at the main phase transition temperature (Tm) (Figure 7).
The sound velocity value shows a characteristic dip at the transition temperature [31,32,33] An increase in [u] is typical for the temperature region above Tm. This trend might be due to a decrease in lipid bilayer ordering, which could be related to an increase in the conformational freedom of the phospholipid hydrocarbon chains as the temperature rises [34]. This characteristic shape of the [u] vs. T plot, along with the nature of the minimum in the [u] value, has been documented in various works focusing on ultrasound velocimetry studies of temperature-induced phase transitions in vesicle suspensions composed of saturated PCs [16,31,35,36], The presence of cholesterol influences the membrane's [u] value. As shown in Figure 7, the typical dip in the [u] vs. temperature plot is not as pronounced (as observed in pure lipids) due to the presence of cholesterol in all systems, but it can still be clearly observed between 22 and 23°C. This temperature coincides with the transition temperature obtained from the zeta potential study.
Since changes in [u] include changes in the compressibility of both the bilayer and the hydration shell, further analysis of the membrane's mechanical properties requires evaluating changes in the specific volume of the liposomes. This can be done by determining the density of the liposome suspensions [34]. With such density values and employing Equation (3), the specific volume, φV, of the various vesicles was determined and plotted as a function of temperature (Figure 8). From direct inspection of this figure, it can be deduced that the specific volume generally increases with rising temperature. Although the φV vs. temperature plots share a similar overall shape, a decrease in the apparent volumes of the systems is observed as POPE is incorporated, indicating the existence of additional constraints on the volume fluctuations of the phospholipid layer, primarily imposed by cholesterol. The reduction in volume magnitude could be indicative of a more compact lipid bilayer structure. However, when SM is present, the systems slightly increase in volume again. This likely indicates that the association of cholesterol with SM results in a softer membrane.
Based on the [u] and φV values obtained, we calculated the specific adiabatic compressibility, φK0, (Equation (4)) for the various vesicles. These results are shown in Figure 9. An increase in specific compressibility with temperature is evident in all the systems studied. The increase in specific compressibility reflects the enhanced disorder in the liposomes (mainly due to the behavior of the hydrophobic phase of the bilayer) and an increase in the compressibility of the hydration shell as temperature rises [34]. The degree of order reflects the anisotropy in molecular motion.
The curves of φK0 dependence exhibit similar behavior in both shape and magnitude across the membranes. Similarly to the behavior of the volume, in the presence of cholesterol and SM, a slight increase in the system's compressibility is observed, which would indicate that the membrane tends to become softer. These findings highlight that the successive incorporation of lipids modifies the structural state of the lipid bilayers, perhaps reflecting the presence of Chol-SM domains.

3.4. Membranes with PDPC

In this section, the results obtained from zeta potential, molecular acoustics, and TEM analysis of the POPC-PDPC-POPE-SM-POPS-Chol membranes will be discussed. The focus is on observing changes in the vesicular surface, mechanical properties, and vesicle morphology as the proportion of PDPC in the membrane varies. Taking as a reference the composition of omega-3 polyunsaturated fatty acids in a neuronal gray matter membrane, representing a healthy membrane [1,2], membranes were prepared with 100% PDPC, 50% PDPC, and 0% PDPC. These variations were evaluated in a HEPES buffer medium and within a temperature range that includes the physiological temperature of 37°C. Given the analysis conducted in Section 3.3, the experimental data presented below refer to the membrane in a fluid phase.
The ultimate goal is for the results obtained in this work to serve as a bridge between biophysics and cellular biology.

3.4.1. Zeta Potential and Conductivity

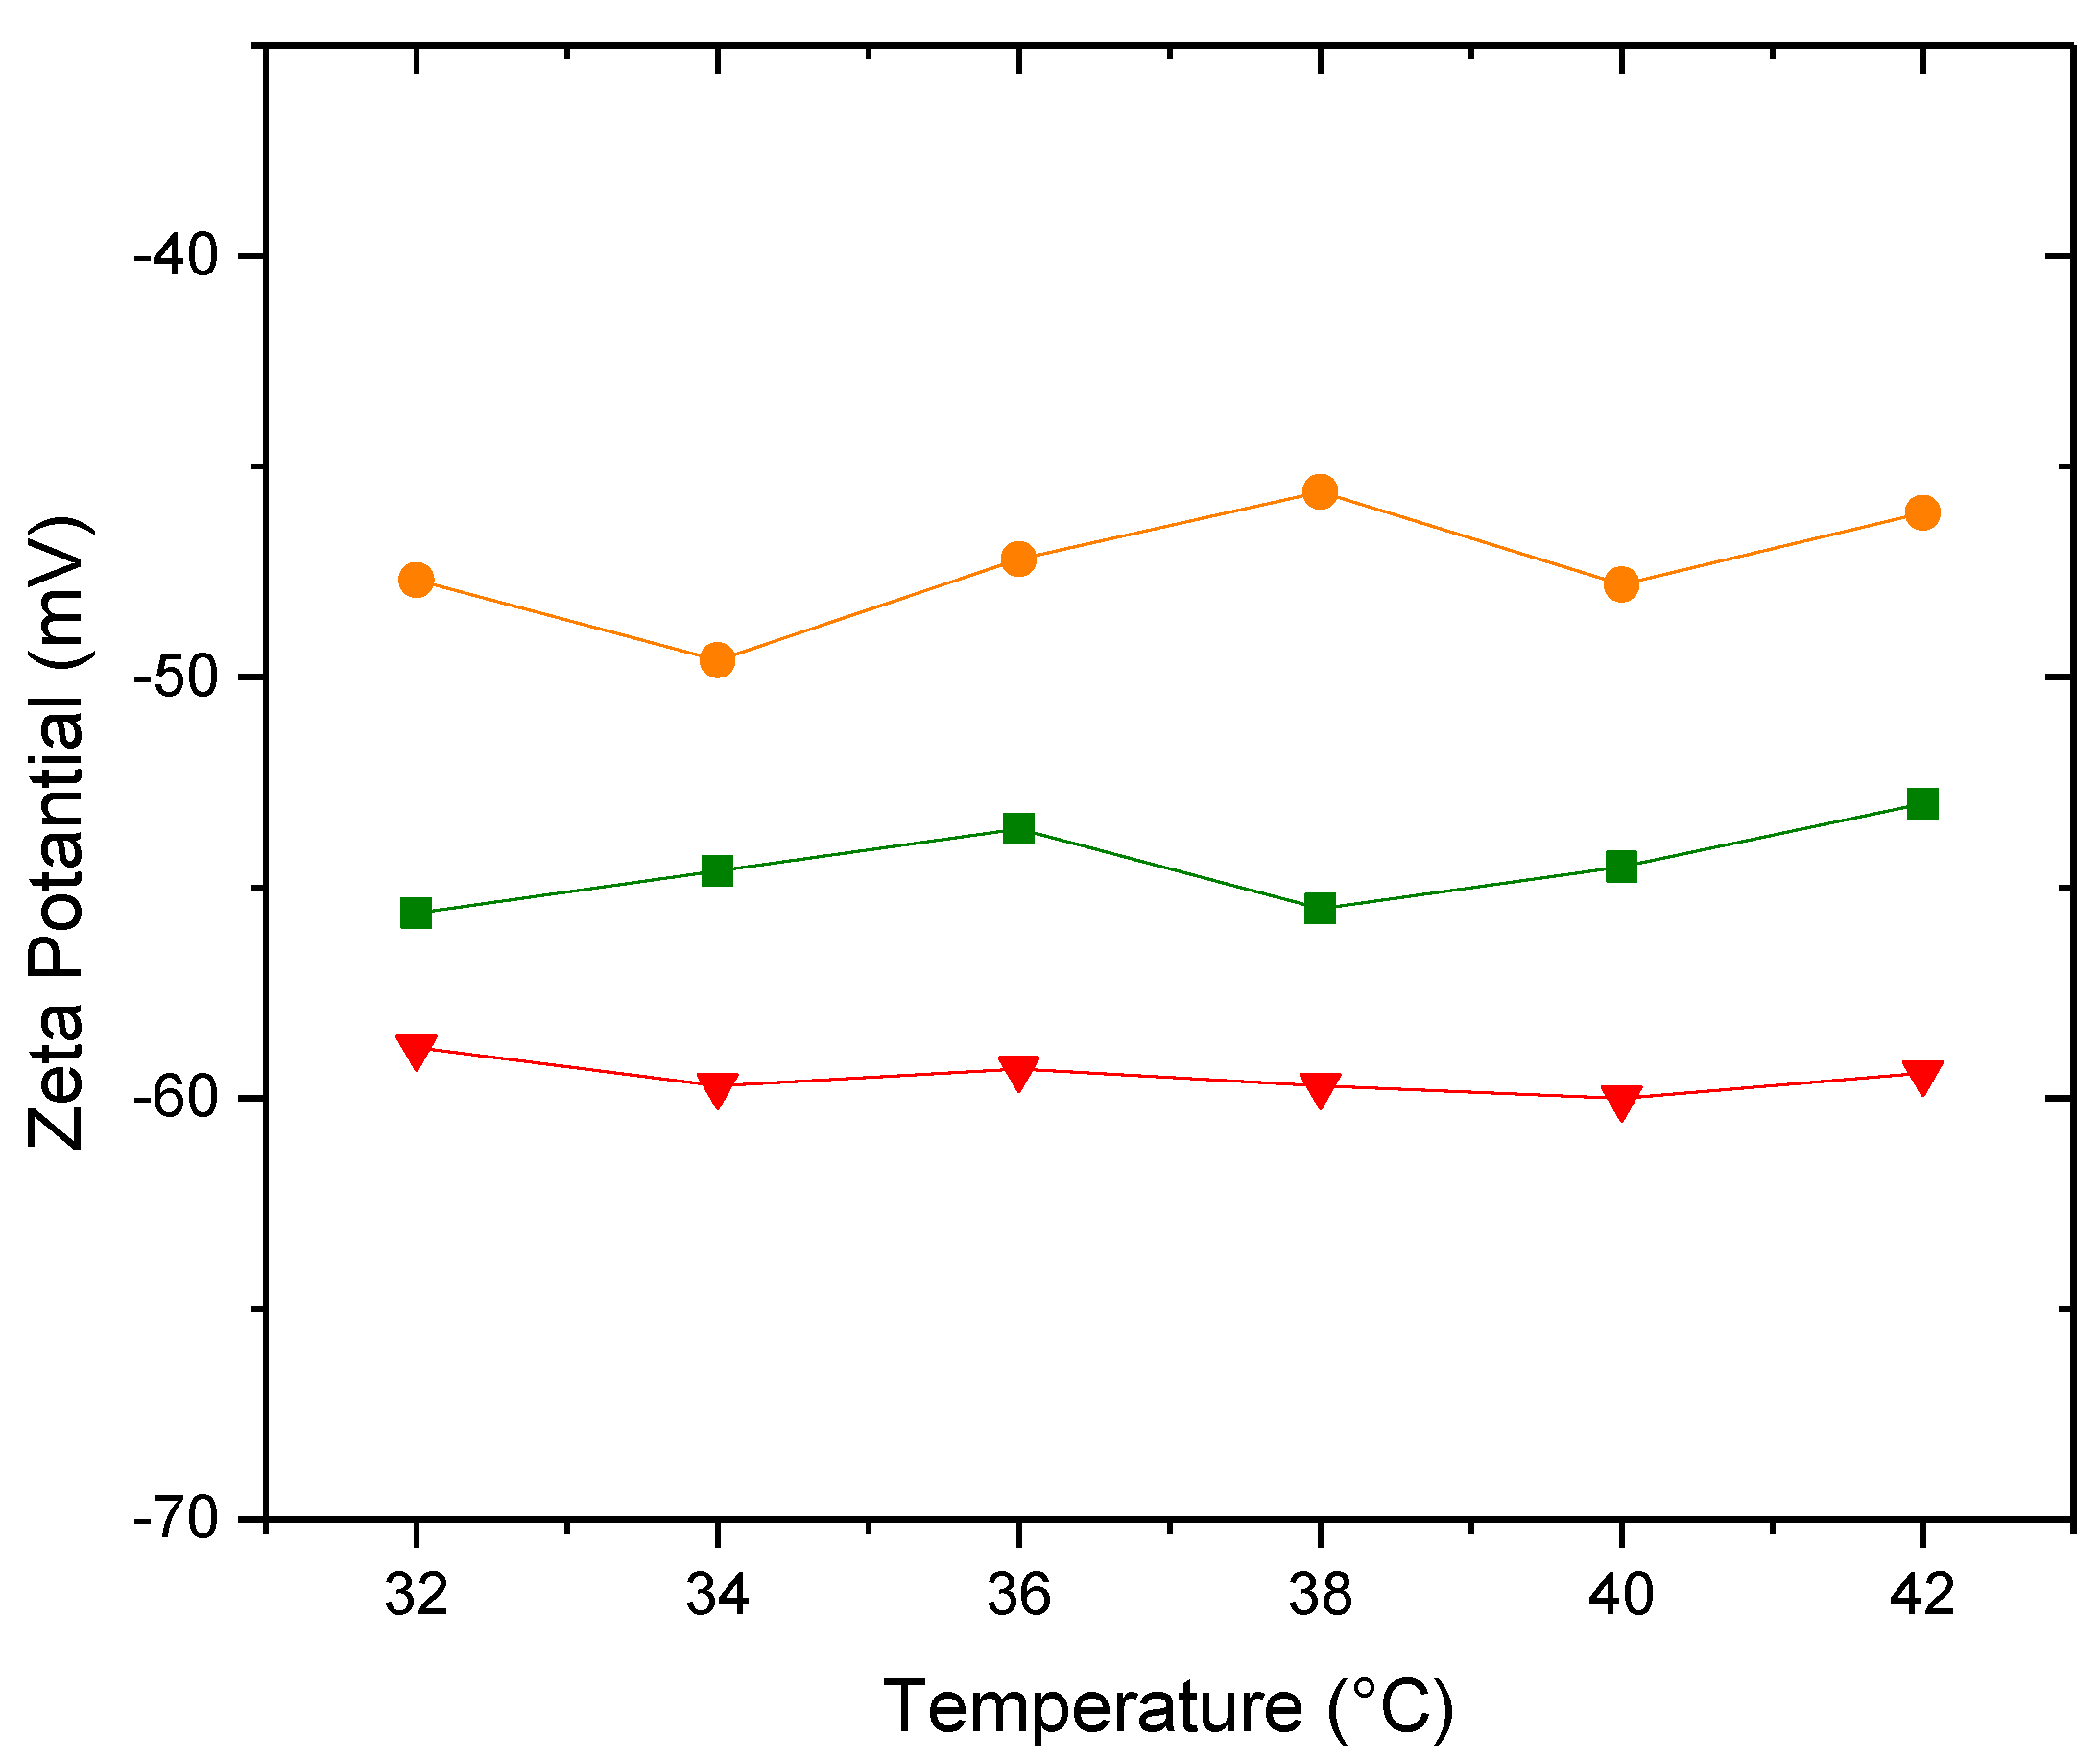
Figure 10 shows the zeta potential as a function of temperature for the different membranes in HEPES buffer.
The magnitudes of the potentials of the systems differ slightly from each other, although the addition of PDPC slightly alters the structuring of the vesicular surface, reaching a potential of approximately -54.5±0.8 mV in the healthy membrane at 37°C. This rearrangement may be a consequence of the effect of polyunsaturated fatty acids in relation to SM-Chol domains. It is worth noting that DHA is esterified, and therefore unable to ionize and contribute charge to the surface. This is important to mention because when DHA is free, its behavior affects the corresponding membrane differently [37]. The PDPC 0% membrane shows a value of -59.5±0.3 mV, clearly less negative than the one in water, which has a value of -71.9±2.5 mV. These changes in magnitude are a consequence of the effect of the ionic medium (HEPES) and not due to a rearrangement in the vesicular structure. All the values obtained related to the zeta potential are relevant from an electrostatic point of view of the vesicle, which, when extrapolated to the cellular level, play a significant role in their functionality.
Figure 11 shows the conductivity of the three proposed membranes as a function of temperature
There are no significant differences in the conductivity values between the different membranes in HEPES, although it is worth noting that they are an order of magnitude higher than the membranes presented in Section 3.3, which were prepared in water. The conductivity values are slightly higher than those for pure water. Since the charge of the vesicle does not contribute to conductivity, we can assert that this change in the order of magnitude is due to the presence of ions in the HEPES buffer medium.

3.4.2. Molecular Acustic

With density values and employing Equation (3), the specific volume, φV, of the three vesicles were determined and plotted as a function of temperature (Figure 12). The reduction in volume magnitude of the healthy membrane in relation to the PDPC 0% and 50% could be indicative of a more compact lipid bilayer structure.
Figure 13 shows curves of φK0 as a function of temperature for the three types of vesicles. Similar to the behavior of the specific volume, the membrane containing the full proportion of PDPC is the least compressible, that is, the most compact.
The results obtained correspond to the behaviour of the proposed grey matter model membrane, that is, with the proportions respected based on the chosen reference. While differences in our results are observed when varying the proportion of DHA, we understand that to draw conclusions relating these changes to the formation and size of nanodomains, it is necessary to employ complementary techniques. We hope that this marks the beginning of a process that can ultimately shed light on the understanding of this topic.

Funding

Financial support from CONICET and UNS is gratefully acknowledged. M.A.M. is a member of the research career of CONICET.

Conflicts of Interest

The authors declare no conflicts of interest.

References

  1. O’Brien, J.S.; Sampson E., L. Lipid composition of the normal human brain: gray matter, white matter, and myelin. J. Lipid Res. 1965, 6, 537–545. [Google Scholar] [CrossRef]
  2. O’Brien, J.S.; Sampson E., L. Fatty acid and fatty aldehyde composition of the major brain lipids in normal human gray matter, white matter, and myelin. J. Lipid Res. 1965, 6, 545–551. [Google Scholar] [CrossRef] [PubMed]
  3. Murata Ooi K-L; Vacy K. ; Boon W. C.. Fatty acids and beyond: Age and Alzheimer’s disease related changes in lipids reveal the neuro-nutraceutical potential of lipids in cognition. Neurochem. Int. 2021, 149, 105143. [CrossRef]
  4. Chu, C.-S.; Hung, C.-F.; Ponnusamy, V.K.; Chen, K.-C.; Chen, N.-C. Higher Serum DHA and Slower Cognitive Decline in Patients with Alzheimer’s Disease: Two-Year Follow-Up. Nutrients 2022, 14, 1159. [Google Scholar] [CrossRef] [PubMed]
  5. Sinclair, A. J.; Wang, Y.; Li, D. What is the evidence for dietary-induced DHA deficiency in human brains? Nutrients 2022, 15, 161. [Google Scholar] [CrossRef]
  6. von Schacky, C. Importance of EPA and DHA blood levels in brain structure and function. Nutrients 2021, 13, 1074. [Google Scholar] [CrossRef]
  7. Kousparou, C.; Fyrilla, M.; Stephanou, A.; Patrikios, I. DHA/EPA (Omega-3) and LA/GLA (Omega-6) as bioactive molecules in neurodegenerative diseases. Int. J. Mol. Sci. 2023, 24, 10717. [Google Scholar] [CrossRef]
  8. Bradbury, J. Docosahexaenoic acid (DHA): an ancient nutrient for the modern human brain. Nutrients 2011, 3, 529–554. [Google Scholar] [CrossRef]
  9. Virk, R.; Cook, K.; Cavazos, A.; Wassall, S. R.; Gowdy, K. M.; Shaikh, S. R. ; How Membrane Phospholipids Containing Long-Chain Polyunsaturated Fatty Acids and Their Oxidation Products Orchestrate Lipid Raft Dynamics to Control Inflammation, J. Nutr., 2024, 154, 2862–2870. [Google Scholar] [CrossRef]
  10. Schachter, I.; Paananen, R. O.; Fábián, B.; Jurkiewicz, P.; Javanainen, M. ; The Two Faces of the Liquid Ordered Phase. J. Phys. Chem. Lett. 2022, 13(5), 1307–1313. [Google Scholar] [CrossRef]
  11. Shaikh, S.R.; Dumaual, A.C.; Castillo, A.; LoCascio, D.; Siddiqui, R.A.; Stillwell, W.; Wassall, S.R. ; Oleic and docosahexaenoic acid differentially phase separate from lipid raft molecules: A comparative NMR, DSC, AFM and detergent extraction study. Biophys. J. 2004, 87, 1752–1766. [Google Scholar] [CrossRef]
  12. Pedroni, V. I.; Sierra, M. B.; Alarcon, L. M.; Verde, A. R.; Appignanesi, G. A.; Morini, M. A. A certain proportion of docosahexaenoic acid tends to revert structural and dynamical effects of cholesterol on lipid membranes. Biochim. Biophys. Acta, Biomembr. 2021, 1863, 183584. [Google Scholar] [CrossRef] [PubMed]
  13. Edidin, M. Shrinknig patches and slippery rafts: scales of domains in the plasma membrane. Trends Cell Biol. 2001, 11, 493–496. [Google Scholar] [CrossRef] [PubMed]
  14. Cebecauer, M.; Amaro, M.; Jurkiewicz, P.; Sarmento, M.J.; Šachl, R.; Cwiklik L., Hof M. Membrane Lipid Nanodomains. Chem. Rev. 2018, 118, 11259–11297. [Google Scholar] [CrossRef] [PubMed]
  15. Kinnun, J. J.; Bittman, R.; Shaikh, S. R.; Wassall, S. R. DHA Modifies the Size and Composition of Raftlike Domains: A Solid-State 2H NMR Study. Biophys. J. 2018, 114, 380–391. [Google Scholar] [CrossRef]
  16. Rybar, P.; Krivanek, R.; Samuely, T.; Lewis, R.N.A.H. , McElhaney, R.N., Study of the interaction of an α-helical transmembrane peptide with phosphatidylcholine bilayer membranes by means of densimetry and ultrasound velocimetry. Biochim. Biophys. Acta, 2007, 1768, 1466–1478. [Google Scholar] [CrossRef] [PubMed]
  17. Hianik, T.; Passechnik, V.I. Bilayer Lipid Membranes: Structure and Mechanical Properties, 1st ed.; Academic Publishers: The Netherlands: Kluwer, 1995. [Google Scholar]
  18. Sierra, M.B.; Pedroni, V.I.; Buffo, F.E.; Disalvo, E.A.; Morini, M.A. The use of zetapotential as a tool to study phase transitions in binary phosphatidylcholines mixtures. Colloids Surf., B 2016, 142, 199–206. [Google Scholar] [CrossRef] [PubMed]
  19. Lam, J.; Katti, P.; Biete, M.; Mungai, M.; AshShareef, S.; Neikirk, K.; Garza Lopez, E.; Vue, Z.; Christensen, T.A.; Beasley, H.K.; et al. A Universal Approach to Analyzing Transmission Electron Microscopy with ImageJ. Cells 2021, 10, 2177–2194. [Google Scholar] [CrossRef]
  20. Sarvazyan, A. P. ; Ultrasonic Velocimetry of Biological Compounds. Annu. Rev. Biophys. Biophys. Chern. 1991, 20, 321–342. [Google Scholar] [CrossRef]
  21. PandeA. H.; Qin S.; Tatulian S.A., Membrane Fluidity Is a Key Modulator of Membrane Binding, Insertion, and Activity of 5-Lipoxygenase. Biophys. J. 2005, 88, 4084–4094. [CrossRef]
  22. Mitchell, D.C.; Straume, M.; Litman, B.J. Role of sn-1-saturated, sn-2-polyunsaturated phospholipids in control of membrane receptor conformational equilibrium: effects of cholesterol and acyl chain unsaturation on the metarhodopsin I / metarhodopsin II equilibrium. Biochemistry 1992, 31, 662–670. [Google Scholar] [CrossRef]
  23. Morini, M.A.; Sierra, M.B.; Pedroni, V.I.; Alarcon, L.M.; Appignanesi, G.A.; . Disalvo, E.A. Influence of temperature, anions and size distribution on the zeta potential of DMPC, DPPC and DMPE lipid vesicles. Colloids Surf., B 2015, 131, 54–58. [Google Scholar] [CrossRef] [PubMed]
  24. Pandit, S.A.; Bostick, D.; Berkowitz, M.L. Complexation of phosphatidylcholine lipids with cholesterol. Biophys. J. 2004, 86, 1345–1356. [Google Scholar] [CrossRef] [PubMed]
  25. Magarkar, A.; Dhawan, V., Kallinteri; Rog., T., Bunker A. Cholesterol level affects surface charge of lipid membranes in saline solution. Sci. Rep. 2014, 4, 05005. [Google Scholar] [CrossRef]
  26. Sierra, M. B.; Pedroni, V. I.; Buffo, F. E.; Disalvo, E. A.; Morini, M. A. The use of zeta potential as a tool to study phase transitions in binary phosphatidylcholines mixtures. Colloids Surf. B. 2016, 142, 199–206. [Google Scholar] [CrossRef]
  27. Jovanovic A., A.; Balanc B., D.; Ota, A.; Grabnar P., A.; Djordjevic V., B.; Savikin K., P.; Bugarski B., M.; Nedovic V., A.; Ulrih N., P. Comparative effects of cholesterol and β-sitosterol on the liposome membrane characteristics. Eur. J. Lipid Sci. Technol. 2018, 120, 1800039. [Google Scholar] [CrossRef]
  28. Silva, C.; Aranda, F.; Ortiz, A.; Martínez, V.; Carvajal, M.; Teruel, J. Molecular aspects of the interaction between plants sterols and DPPC bilayers: an experimental and theoretical approach. J. Colloid Interface Sci. 2011, 358, 192–201. [Google Scholar] [CrossRef] [PubMed]
  29. Perez, H. A.; Disalvo, A.; Frías, M.d.l.A. Effect of cholesterol on the surface polarity and hydration of lipid interphases as measured by Laurdan fluorescence: new insights. Colloids Surf. B 2019, 178, 346–351. [Google Scholar] [CrossRef]
  30. Ricci, M.; Olivia, R.; Del Vecchio, P.; Paolantoni, M.; Moressi, A.; Sassi, P. DMSO-induced perturbation of thermotropic properties of cholesterol-containing DPPC liposomes. Biochim. Biophys. Acta 2016, 1858, 3024–3031. [Google Scholar] [CrossRef]
  31. Kharakoz, D. P.; Colotto, A.; Lohner, K.; Laggner, P. Fluid-gel interphase line tension and density fluctuations in dipalmitoylphosphatidylcholine multilamellar vesicles: an ultrasonic study. J. Phys. Chem. 1993, 1993. 97, 9844–9851. [Google Scholar] [CrossRef]
  32. Heimburg, T. Mechanical aspects of membrane thermodynamics. Estimation of the mechanical properties of lipid membranes close to the chain melting transition from calorimetry. Biochim. Biophys. Acta 1998, 1415, 147–162. [Google Scholar] [CrossRef]
  33. Pabst, G.; Lonez, C.; Vandenbranden, M.; Jestin, J.; Radulescu, A.; Ruysschaert, J. ; Gutberlete,T. Stalk-free membrane fusion of cationic lipids via an interdigitated phase. Soft Matter 2012, 8, 7243–7249. [Google Scholar] [CrossRef]
  34. Hianik, T.; Rybár, P.; Krivánek, R.; Petríková, M.; Roudna, M.; Apell, H. Specific volume and compressibility of bilayer lipid membranes with incorporated Na,K-ATPase. Gen. Physiol. Biophys. 2011, 30, 145–153. [Google Scholar] [CrossRef] [PubMed]
  35. Halstenberg, S.; Heimburg, T.; Hianik, T.; Kaatze, U.; Krivanek, R. Cholesterol-Induced Variations in the Volume and Enthalpy Fluctuations of Lipid Bilayers. Biophys. J. 1998, 75, 264–271. [Google Scholar] [CrossRef] [PubMed]
  36. Mitaku, S.; Ikegami, A.; Sakanishi, A. Ultrasonic studies of lipid bilayer. phase transition in synthetic phosphatidylcholine liposomes. Biophys. Chem. 1978, 8, 295–304. [Google Scholar] [CrossRef]
  37. Verde A., R. , Sierra M. B., Alarcón L. M., Pedroni V. I., Appignanesi, G. A. Morini M.A. Experimental and computational studies of the effects of free DHA on a model phosphatidylcholine membrane. Chem. Phys. Lipids 2018, 217, 12–18. [Google Scholar] [CrossRef] [PubMed]
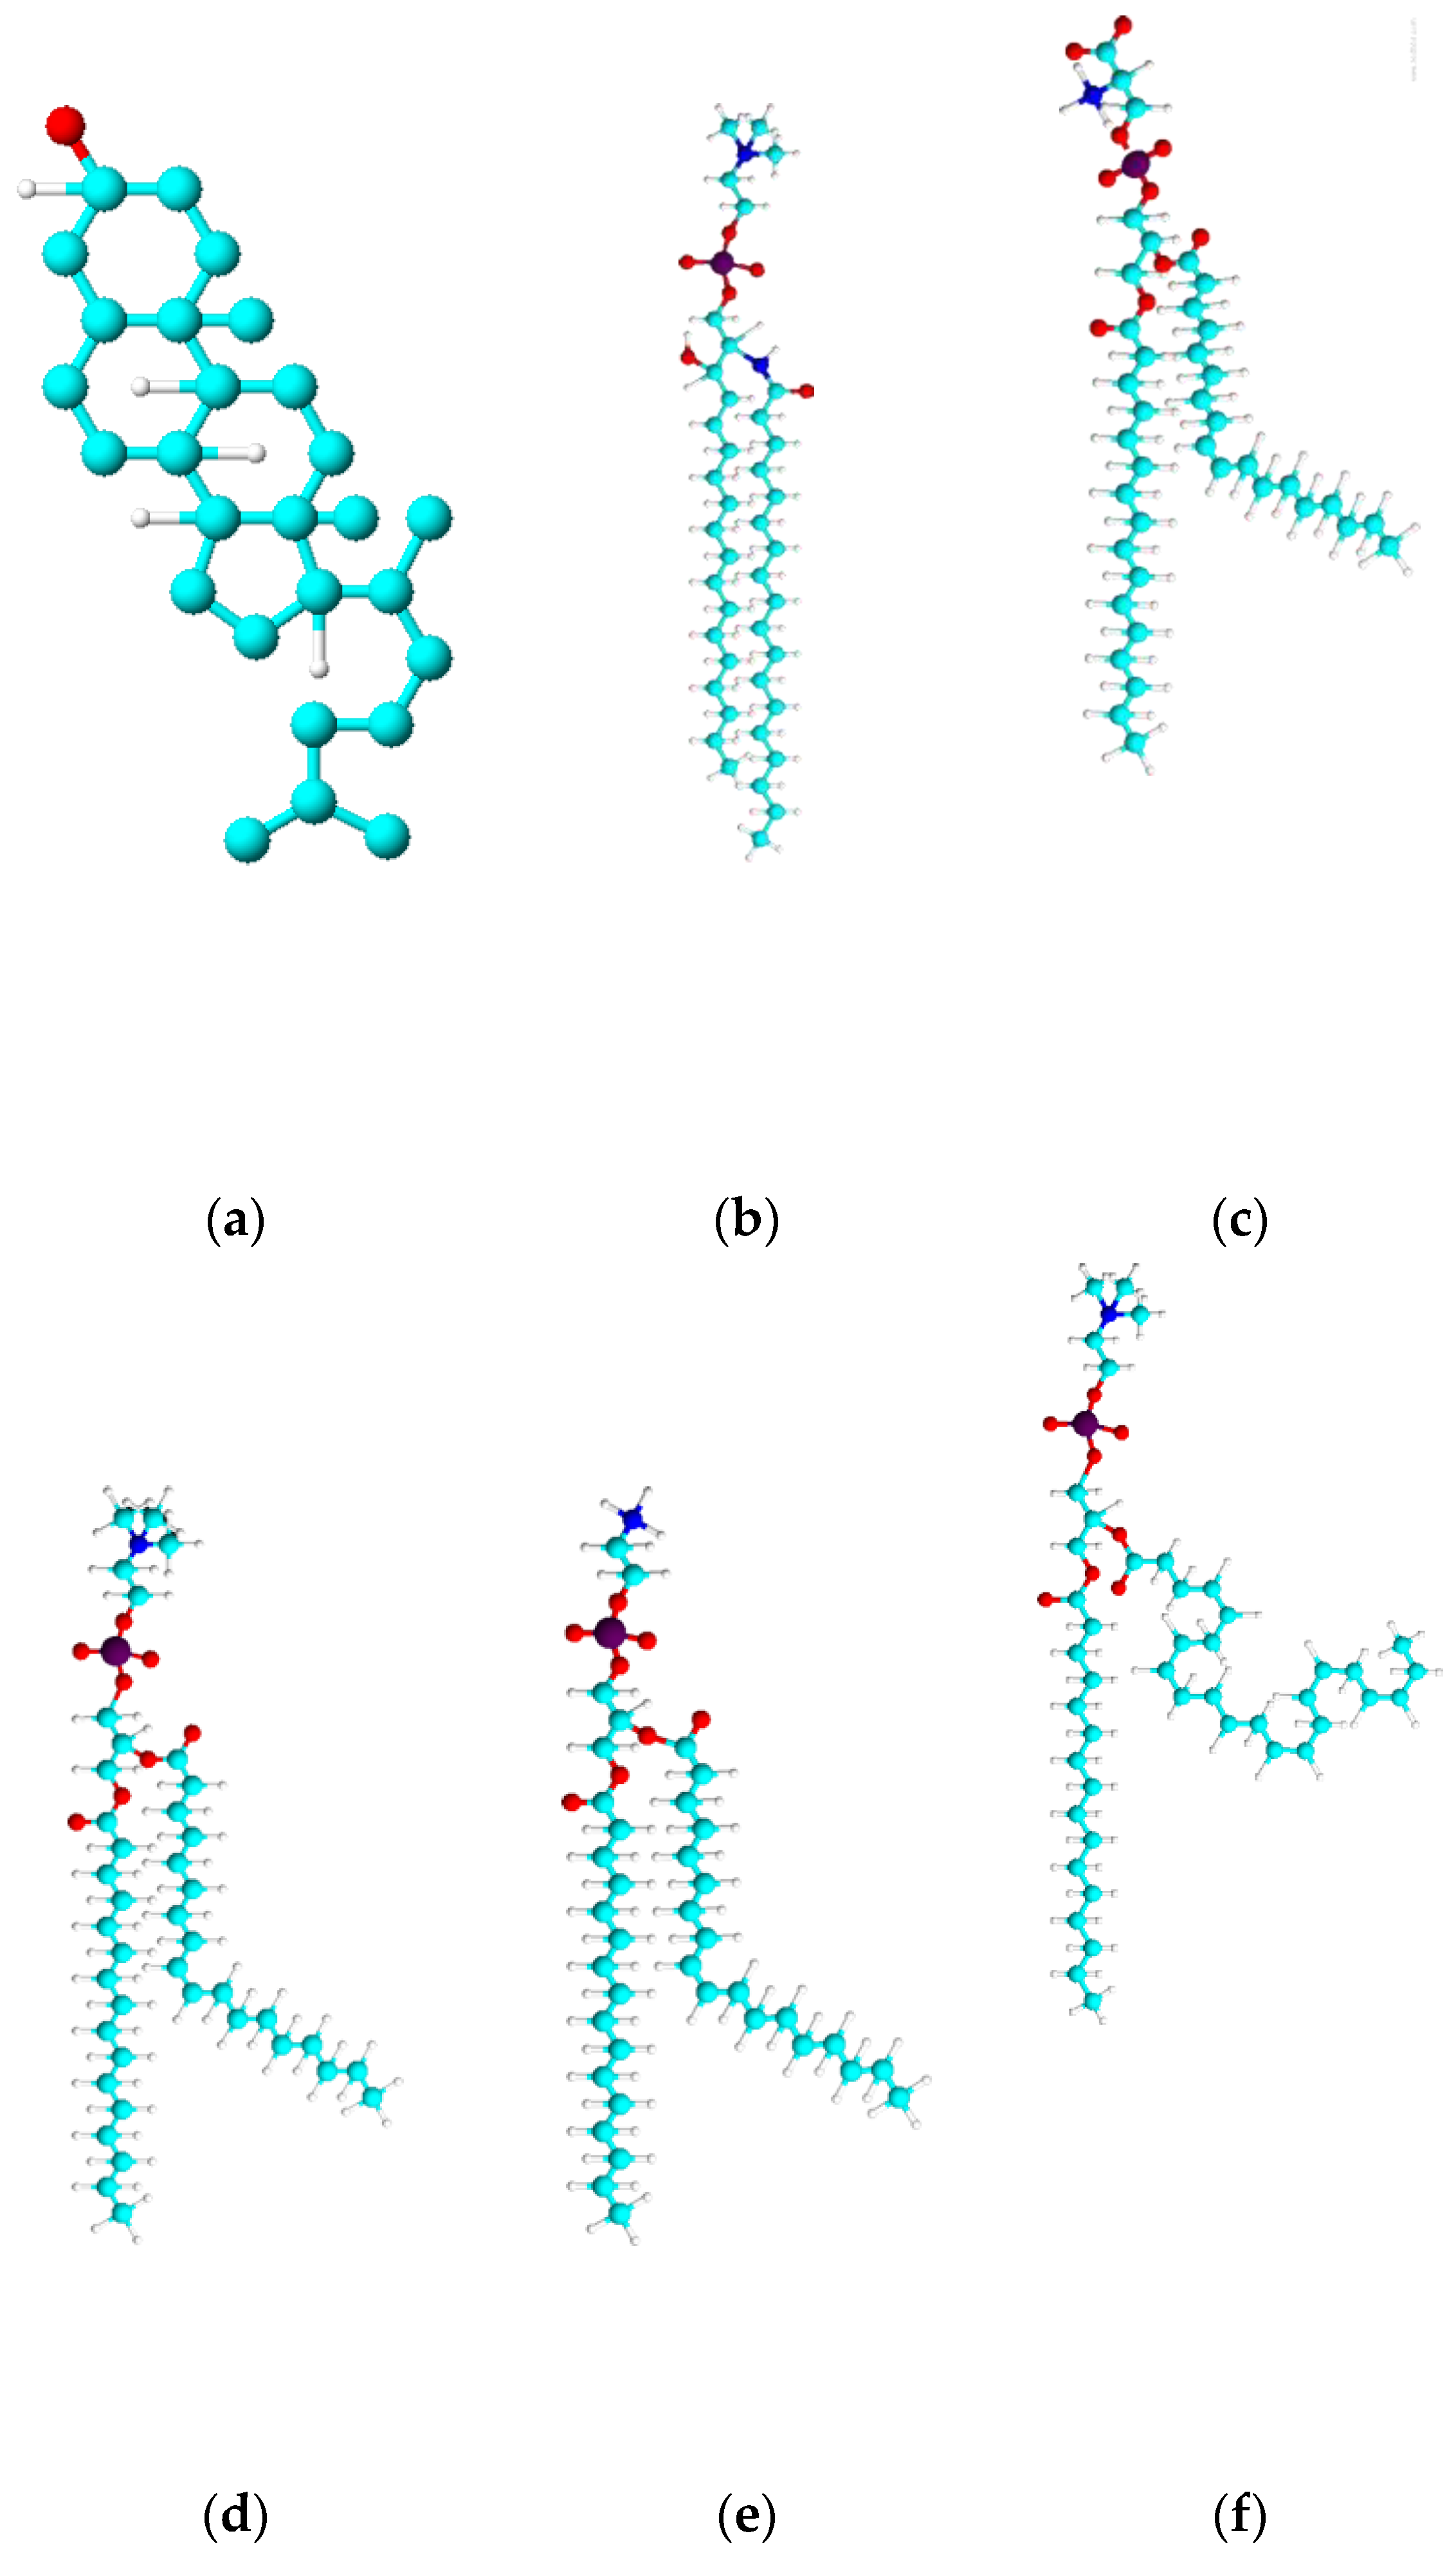
Figure 1. 3D representation of lipid used in this work (a) Chol(b) SM (c) POPS (d)POPC (e) POPE (f) PDPC.
Preprints 122152 g001
Figure 2. Apparent hydrodynamic diameter distribution for () 0% PDPC () 50% PDPC () 100% PDPC.
Preprints 122152 g002
Figure 3. TEM image of vesicles with (a) 0% PDPC (b) 50% PDPC (c) 100% PDPC.
Preprints 122152 g003
Figure 4. Diameter distribution of vesicles with (a) 0% PDPC (b) 50% PDPC (c) 100% PDPC.
Preprints 122152 g004
Figure 5. Zeta Potential of (■) POPC+Chol () POPC+POPE+Chol () POPC+POPE+SM+Chol () POPC+POPE+SM+POPS+Chol in water. Measurement errors below 5%. Error bars not shown to avoid cluttering.
Preprints 122152 g005
Figure 6. Conductivity of (■) POPC+Chol () POPC+POPE+Chol () POPC+POPE+SM+Chol () POPC+POPE+SM+POPS+Chol in water. Measurement errors below 5%. Error bars not shown to avoid cluttering.
Preprints 122152 g006
Figure 7. Relative concentrational increment of sound velocity [u] (■) POPC+Chol () POPC+POPE+Chol () POPC+POPE+SM+Chol ()POPC+POPE+SM+POPS+Chol in water. Measurement errors below 5%. Error bars not shown to avoid cluttering.
Preprints 122152 g007
Figure 8. Apparent specific partial volumes φv (■) POPC+Chol () POPC+POPE+Chol () POPC+POPE+SM+Chol () POPC+POPE+SM+POPS+Chol in water. Measurement errors below 5%. Error bars not shown to avoid cluttering.
Preprints 122152 g008
Figure 9. adiabatic compressibility, φk/β0, of the liposomes (■) POPC+Chol () POPC+POPE+Chol () POPC+POPE+SM+Chol () POPC+POPE+SM+POPS+Chol in water. Measurement errors below 5%. Error bars not shown to avoid cluttering.
Preprints 122152 g009
Figure 10. Zeta potential of ()PDPC 0% ()PDPC 50% ()PDPC 100% in HEPES solution Measurement errors below 5%. Error bars not shown to avoid cluttering
Preprints 122152 g010
Figure 11. Conductivity of ()PDPC 0% ()PDPC 50% ()PDPC 100% in HEPES solution.
Preprints 122152 g011
Figure 12. Apparent specific partial volumes φv () PDPC 0% () PDPC 50% ()PDPC 100% in HEPES solution.
Preprints 122152 g012
Figure 13. Adiabatic compressibility, φk/β0, of the liposomes ()PDPC 0% ()PDPC 50% ()PDPC 100% in HEPES solution.
Preprints 122152 g013
Disclaimer/Publisher’s Note: The statements, opinions and data contained in all publications are solely those of the individual author(s) and contributor(s) and not of MDPI and/or the editor(s). MDPI and/or the editor(s) disclaim responsibility for any injury to people or property resulting from any ideas, methods, instructions or products referred to in the content.
Copyright: This open access article is published under a Creative Commons CC BY 4.0 license, which permit the free download, distribution, and reuse, provided that the author and preprint are cited in any reuse.
Prerpints.org logo

Preprints.org is a free preprint server supported by MDPI in Basel, Switzerland.

Subscribe

© 2024 MDPI (Basel, Switzerland) unless otherwise stated