1. Introduction
In the medical field, blood cell image analysis plays an important role in clinical laboratories. It is also the basis for the diagnosis and monitoring of many diseases [
1]. The type and quantity of blood cells is one of the important bases for doctors to diagnose and treat diseases. In practice, most doctors use manual microscopy and instrument counting, but this method lacks efficiency. The test result is an important basis for diagnosis. The image information could not be obtained by blood cytometer detection. Manual microscopy is time-consuming and labor-intensive and subject to the subjective influence of medical personnel [
2]. The use of computer and digital processing technology to detect and classify blood cells can objectively and accurately analyze microscopic images to reduce the analysis time. Therefore, replacing manual inspection with computer vision technology is an important trend at present.
The detection method based on deep learning has more efficient image feature extraction ability than the traditional machine vision method. Liang [
3] proposed a multi-task learning framework (MTLA) based on convolutional neural networks to solve the problem of image target recognition and location, and the model accuracy reached 81.5%. Byahatti R [
4] proposes the Decoupled Head module design idea and implementation details, Decoupled Head module will feature fusion layer and convolution separation makes the model more flexible, can be in different sizes of character figure on different sizes of target detection and improve the precision of target detection. Mahto [
5] designed Refined YOLOv4 model to improve the anchor frame, post-processing algorithm and attention mechanism to improve the detection accuracy of small targets. Wang Pengfei [
6] added a shallow detection layer based on YOLOv5 and improved the Loss function as Quality Focal Loss to improve the detection ability of dense targets. Chen [
7] introduced the Content-Aware ReAssembly of Features (CARAFE) module to perceive effective features. The Wise—IoU loss function with dynamic focusing mechanism is used to replace the original loss function in YOLOv7 to improve the generalization ability and detection accuracy of the model. Han [
8] improved and designed the STC-YOLOv5 model to solve the difficulties in identifying small wood targets and dense defects. Compared with the original YOLOv5, the accuracy was increased by 3.1%.
Commonly used algorithms generally fall into two categories [
9]. One is single-stage detection algorithm, including SSD [
10], MultiGrasp [
11], YOLO [
12,
13,
14] series algorithms. The other is two-stage detection algorithm, representative of which are R-CNN [
15], SPP-Net [
16] and Faster-RCNN [
17]. However, the above algorithms still have many problems in blood cell detection, such as insufficient ability to extract features of different types of blood cells and low detection accuracy [
18]. YOLO is a typical single-stage object detection algorithm. Its main idea is to use the whole image input model, using CNN directly regression target coordinates and classification probability. The YOLO series has seen the release of YOLOv7[
19], YOLOv8[
20], and YOLOX [
21]. But the YOLOv5 algorithm has a smaller model, less computation and considerable speed. It is especially suitable for real-time target detection. In the case of whether the GPU exists, the cost is higher, especially the PC side of the CPU consumption is less. Compared with YOLOv7 and YOLOv8, YOLOv5 is more suitable for running on mobile devices, and YOLOV5 is more suitable for detecting small objects [
22], which requires less equipment cost. YOLOv5 consists of four main components: input, trunk, neck, and head. It is available in the following architectures: YOLOv5n, YOLOv5s [
23], YOLOv5m, YOLOv5l, and YOLOv5x. These architectures differ in terms of network depth and feature map width. YOLOv5s can be divided into Backbone [
24], Neck and head. Backbone is a backbone network, which is usually used to extract features. The function of Neck is to better integrate the features given by Backbone to enhance the ability of target positioning information. Head uses previously extracted features to make predictions.
The following is an introduction of the work done in this paper. In the
section 2, the improvement principle of the algorithm is summarized.
Section 3 is the experimental results and analysis. This chapter first introduces the process of building blood cell target detection data set. Then four groups of ablation experiments and comparison experiments were carried out, and the experimental process and test results were explained. The classification ability of the improved algorithm is demonstrated through the parameter index of the model, the evaluation index of the test set, the prediction result graph and the performance curve. Finally, a blood cell recognition and counting system based on QT tool is established.
2. Materials and Methods
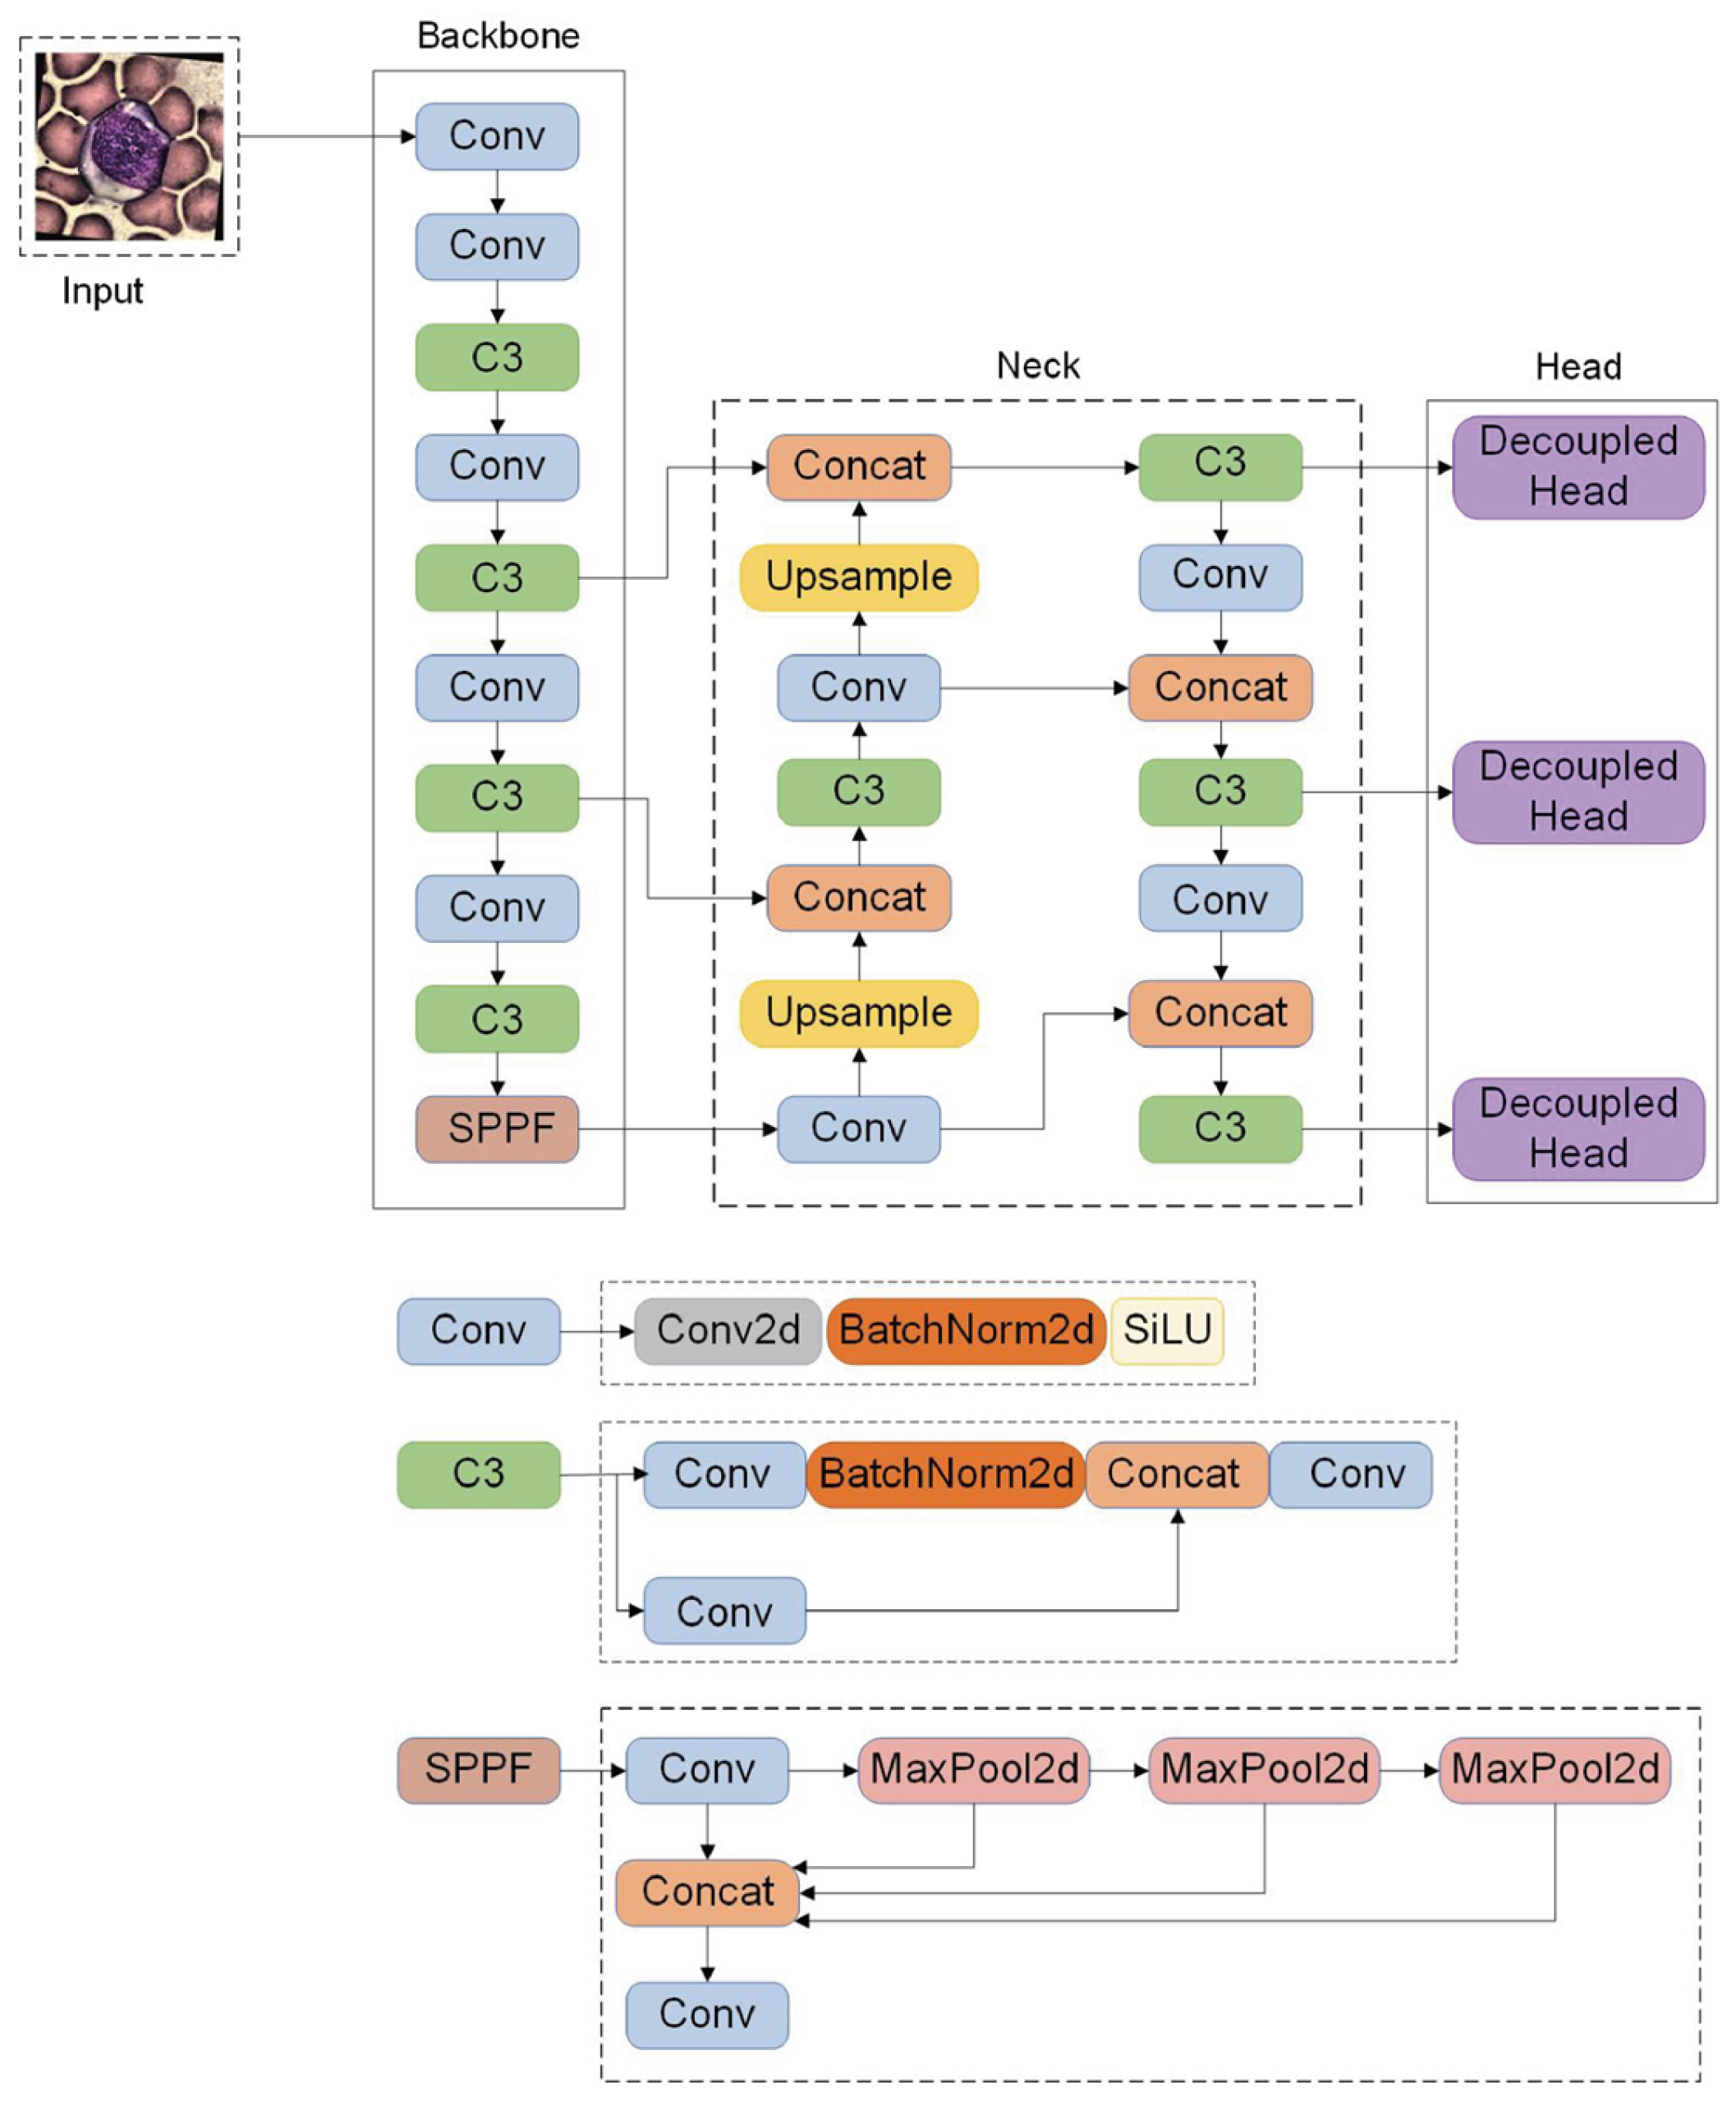
YOLOv5s is the network of YOLOv5 series with the smallest depth and smallest width of feature graph. Its model size is small, which is easy to expand the application later. In order to meet the actual demand for target detection algorithms, real-time detection and simple deployment. In this paper, YOLOv5s network was selected as the baseline network for blood cell recognition. It can provide higher detection accuracy and faster processing speed, and provides a reliable basis for the accuracy of blood cell detection systems. The improved YOLOv5s network structure and some module details are shown in
Figure 1. Improved section to achieve box marking.
2.1. Backbone Network Module
With the deepening of the number of network layers, the extracted feature information may be gradually lost. Therefore, in order to improve the detection performance of network models, multi-scale feature fusion is widely used in target detection networks. Multi-scale feature fusion fuses feature maps from different levels together to improve the performance of target detection algorithms. This method helps to reduce information loss and improve the generalization ability of the algorithm. The algorithm can perform better target detection in many cases. The image of blood cells shows an excessive number of cells and a variety of forms. Complex features cannot be adequately extracted by the original YOLOv5. Therefore, BotNet module [
25] was introduced into YOLOv5 to enhance the feature fusion capability of the network and enable the network to fully extract cell features.
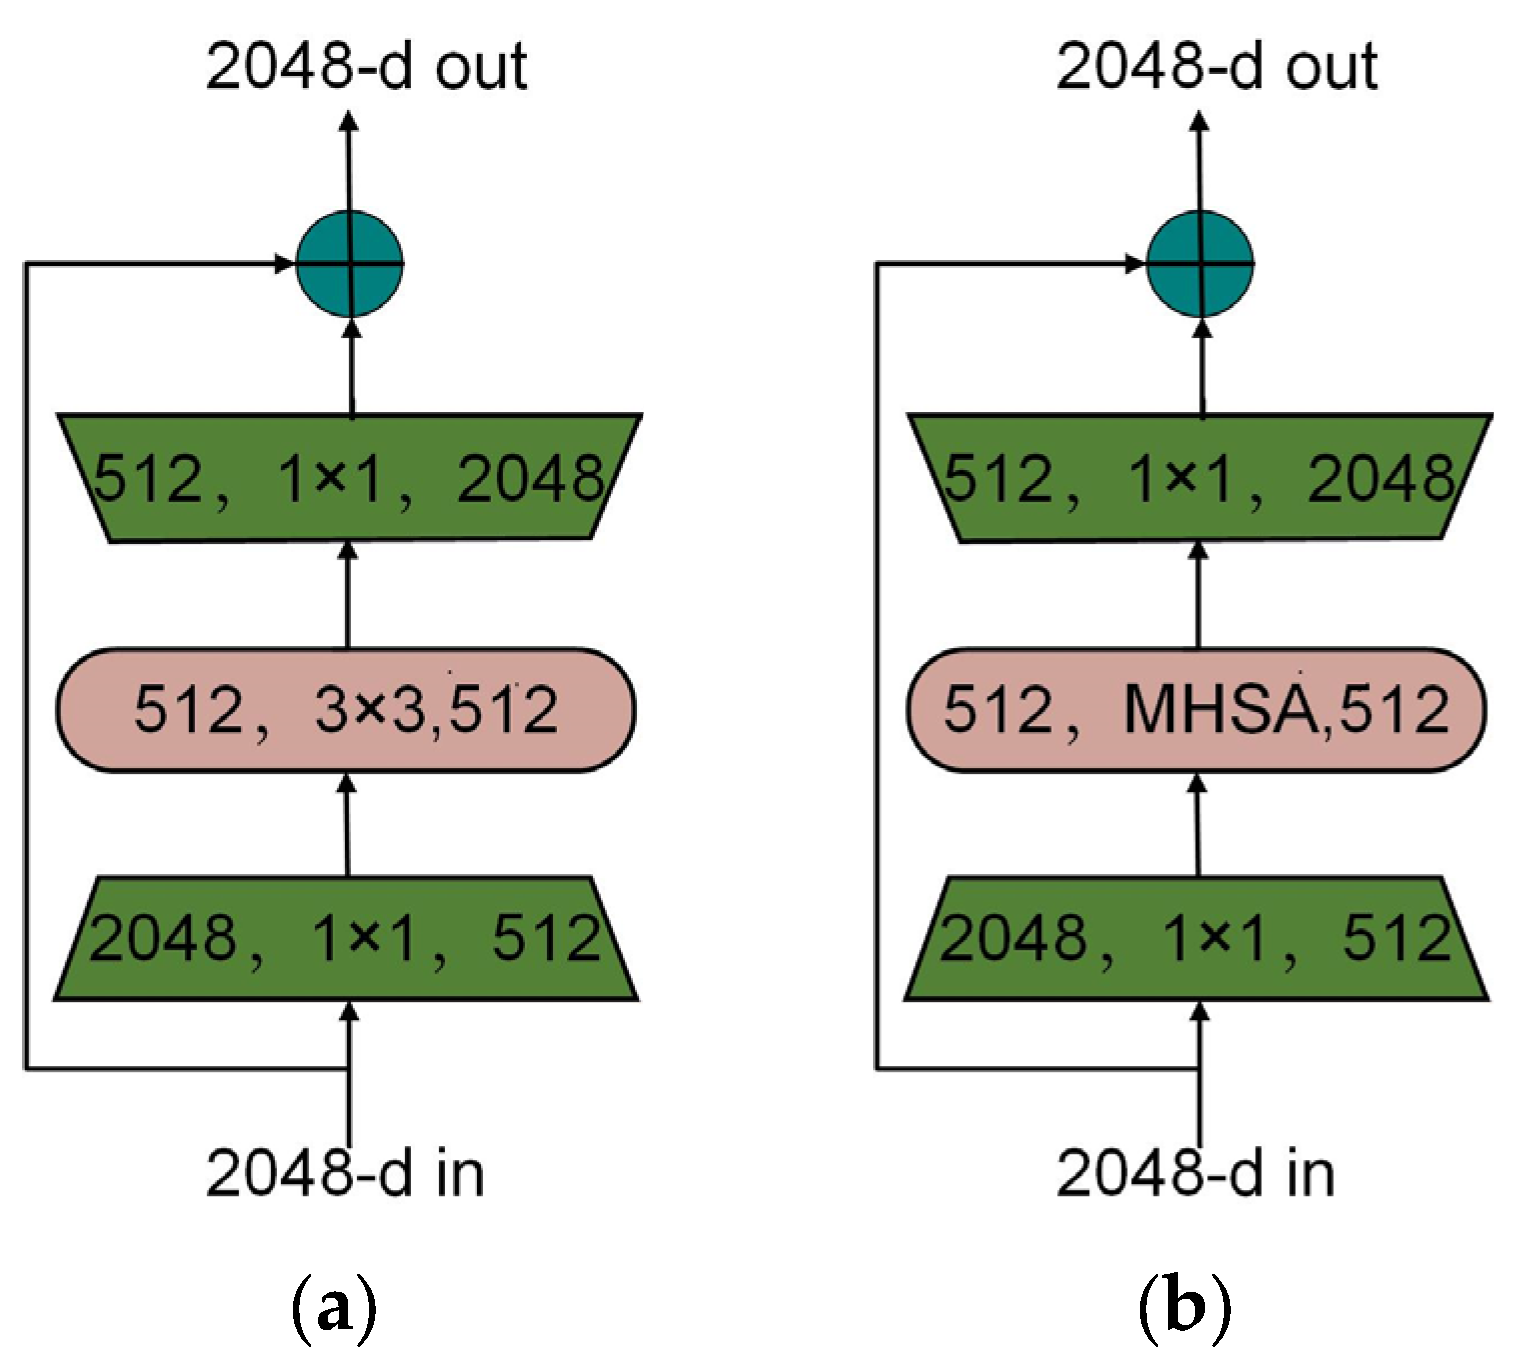
Microsoft Research Asia proposed a BotNet t module based on the original backbone network. BotNet is a convolutional neural network architecture based on Transformer [
26]. BotNet replaces the bottleneck in the fourth block in ResNet with the MHSA (Multi-Head Self-Attention) module to form a new module. This structure can correlate each pixel in the input feature map to extract more refined features. The parameters are also reduced overall, and the delay cost is reduced. The difference between BotNet and ResNet is that the spatial 3×3 convolution is replaced by Multi-Head Self-Attention (MHSA) to improve the detection effect. The structure is shown in
Figure 2.
2.2. Decoupled Head Module
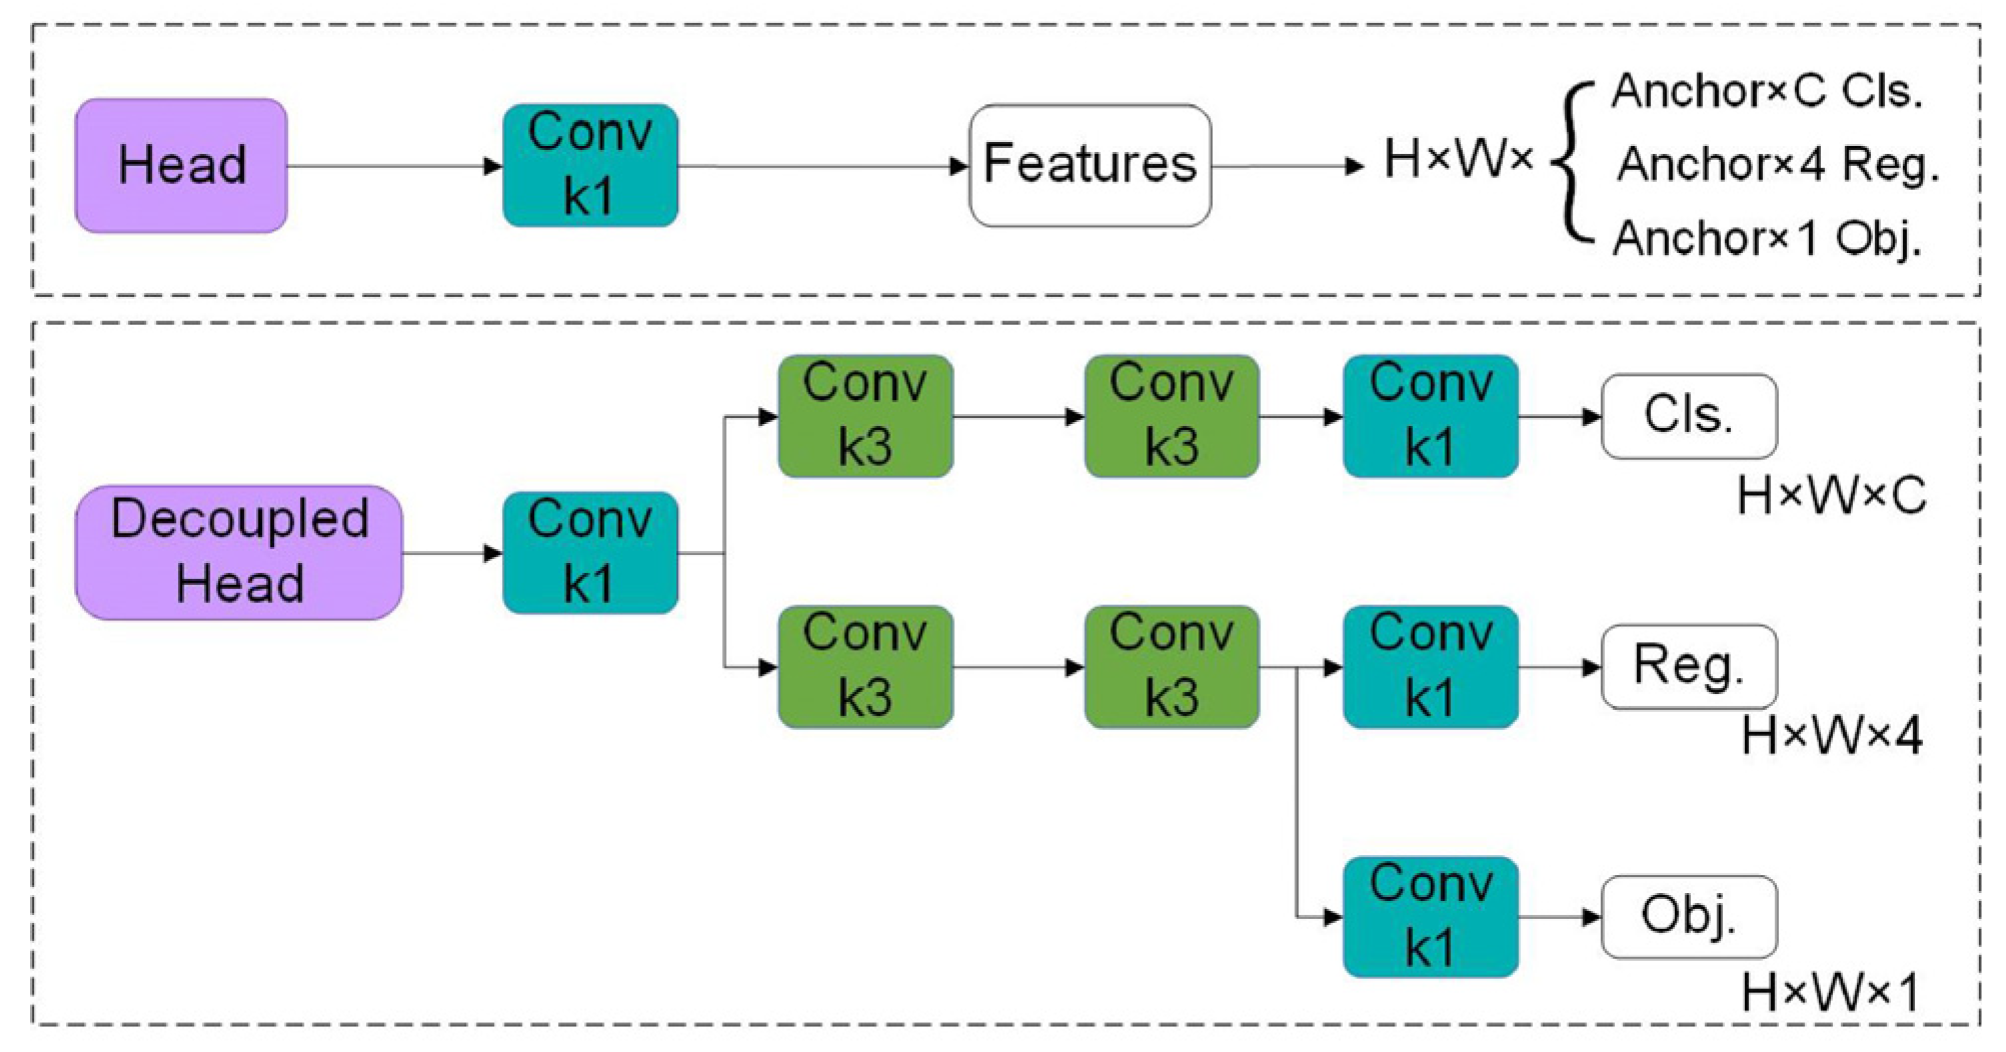
In object detection algorithm, detection problem and classification problem should be independent of each other in ideal state. However, in the yolov5s network, the Head module in the prediction phase couples the detection and classification problems. This method reduces the performance of the algorithm to some extent. In this paper, the Head structure is improved to solve the above problems. In 2020, Byahatti R proposed the design idea and implementation details of Decoupled Head [
27] module. This paper improves the Head structure and introduces Decoupled head. The structure diagram is shown in
Figure 3. This method can detect different kinds of blood cells in different characteristic layers and improve the detection accuracy of the model.
In YOLOv5, the prediction part is called SPP-YOLO [
28] (Spatial Pyramid Pooling YOLO). In SPP-YOLO, the input image is reduced to multiple feature maps of different sizes on which object detection is then performed. But there are problems with this approach. For example, detecting a large-size target on a smaller feature map may result in reduced accuracy, and detecting a small-size target on a larger feature map may result in too low detection accuracy. Decoupled Head will reduce the input image to multiple feature maps of different sizes, and then perform object detection on each of these feature maps. This method can detect large size targets on larger feature maps and small size targets on smaller feature maps. At the same time, the above problems are avoided. The advantage of Decoupled Head is that it can adjust the balance between accuracy and efficiency by adjusting the size of each feature map. For example, larger feature maps can be used to improve accuracy and smaller feature maps can be used to improve efficiency. Overall, Decoupled Head can improve the accuracy and efficiency of YOLOv5 by using multiple feature maps of different sizes.
2.3. SIoU_LOSS
In order to speed up network convergence, improve detection accuracy and reduce false detection in blood cell detection. The updated loss function SIoU (Soft Intersection Over Union) [
29] is used in YOLOv5 instead of the standard CIoU (Complete Intersection Over Union) [
30]. The only dimensions that CIoU can consider are the overlap area of the real and predicted frames, the centroid distance and the aspect ratio. There are four common types of crossover loss functions, namely IoU(Intersection Over Union), GIoU(Generalized Intersection Over Union), DIoU(Distance Intersection Over Union) and CIoU. IoU is one of the most commonly used position loss functions. A larger IoU means that the more the two bounding boxes overlap, the less loss there will be. However, when the intersection between the predicted box and the real box is zero, the convergence speed may be slow. DIoU is another improved version of the position loss function. It evaluates the overlap of two bounding boxes by calculating their center point distance. However, the aspect ratio of prediction box regression is not added, resulting in the convergence speed is still not fast enough. We chose SIoU because it can better reflect changes in width, height, and confidence level for more accurate target framing.
Gevorgyan proposed the SIoU function. This function adds the vector Angle between the prediction box and the real box when defining the loss indicator. SIoU takes into account the vector Angle between the predicted box and the real box and uses the position information to redefine the loss item. The probability of free transformation of the prediction frame is reduced, and the detection frame is guided to approach the target frame in a more reasonable way to improve the regression accuracy. SIoU is an area-based loss function whose value is not affected by boundary box changes and only depends on the area of the target box. It makes the training process more stable. The SIoU loss function does not involve complex distance measurement and division operations, so the calculation is simpler. At the same time, by considering the matching direction, the prediction frame can be quickly moved to the nearest axis, which improves the training speed. SIoU consists of 4 parts: Angle loss, distance loss, shape loss and IoU loss. The total loss function is expressed as equation (1):
where,
Lcls is Focal loss;
Wbox and
Wcls are prediction box and classification loss weights respectively.
SIoU Loss adds a weight factor to the class information. Using the SIoU loss function, the model tends to preferentially adjust the position of the bounding box during training. Align it with the nearest axis, and then adjust it further on the corresponding axis. In short, the addition of Angle penalty costs effectively reduces the total freedom. It is helpful to improve the stability and speed of training and reduce the errors generated in the training process, so as to improve the final target detection model.
2.4. Model Evaluation Index
In object detection research, commonly used evaluation indexes include Precision, Recall, Average Precision (AP) and Mean Average Precision (mAP).
The accuracy rate is the precision rate. It refers to the proportion of the actual number of positive samples in all samples tested as positive. The calculation formula is shown in equation (2).
Where P represents the accuracy rate,
TP represents the number of positive samples predicted as a positive class, and
FP represents the number of negative samples predicted as a positive class.
Recall rate, that is, recall rate. It refers to the proportion of the number of positive samples that are detected as positive classes in the actual total positive samples. The calculation formula is shown in equation (3).
Where R represents the recall rate and
FN represents the number of positive samples predicted as a negative class.
The curve formed by the accuracy rate and recall rate of a certain class of variables is called the P-R curve. In a P-R curve, the area enclosed by the horizontal axis, the vertical axis, and the P-R curve is the average accuracy of the class. The calculation formula is shown in Equation (4):
where P(R) represents the P-R curve.
Multi-class average accuracy is the mean of the average accuracy of all classes. It is one of the most important evaluation indexes in the target detection algorithm and can be used to express the detection accuracy of the target detection model. The calculation formula of mAP is shown in Equation (5):
where N is the number of target categories.
3. Results
3.1. Experimental Process and Environment Configuration
In order to further verify the practical effect of blood cell recognition and counting system based on QT interface. A series of experiments are carried out in this paper. Through the data import module, blood cell image data from different sources are loaded into the system. This data includes still images, video files, and images captured by live cameras. The system loads different types of data flexibly according to the user’s choice, and displays the corresponding detection results in the image display module. In the image display module, users can easily browse and observe the blood cell test results through the label control.
Platelet, RBC, WBC, and sickle cell are accurately labeled as rectangular boxes in the image. The ability of the algorithm to recognize different kinds of cells is demonstrated. First, data enhancement and cell labeling of the data set should be performed. The blood cell model was then trained. In order to optimize the training effect of the model in this paper, 70% of the blood cell data set was used as the training set, 20% as the test set, and 10% as the verification set during the experiment. The picture size of the training and verification process is 640×640, the number of training rounds is 150, the batch_size is 16, and the initial learning rate is 0.001. In the test process, the image size is 640×640, the batch_size is 32, the confidence threshold is 0.001, the IOU threshold is 0.6, and the maximum number of objects detected by a single image is 300.
The training platform is Windows10, and the configuration is as follows: Intel(R) Core(TM) i9-12900K processor, NVIDIA RTX A2000 stand-alone graphics card, deep learning framework for Pytorch1.11, Python 3.8, CUDA 11.2.
3.2. Experimental Data
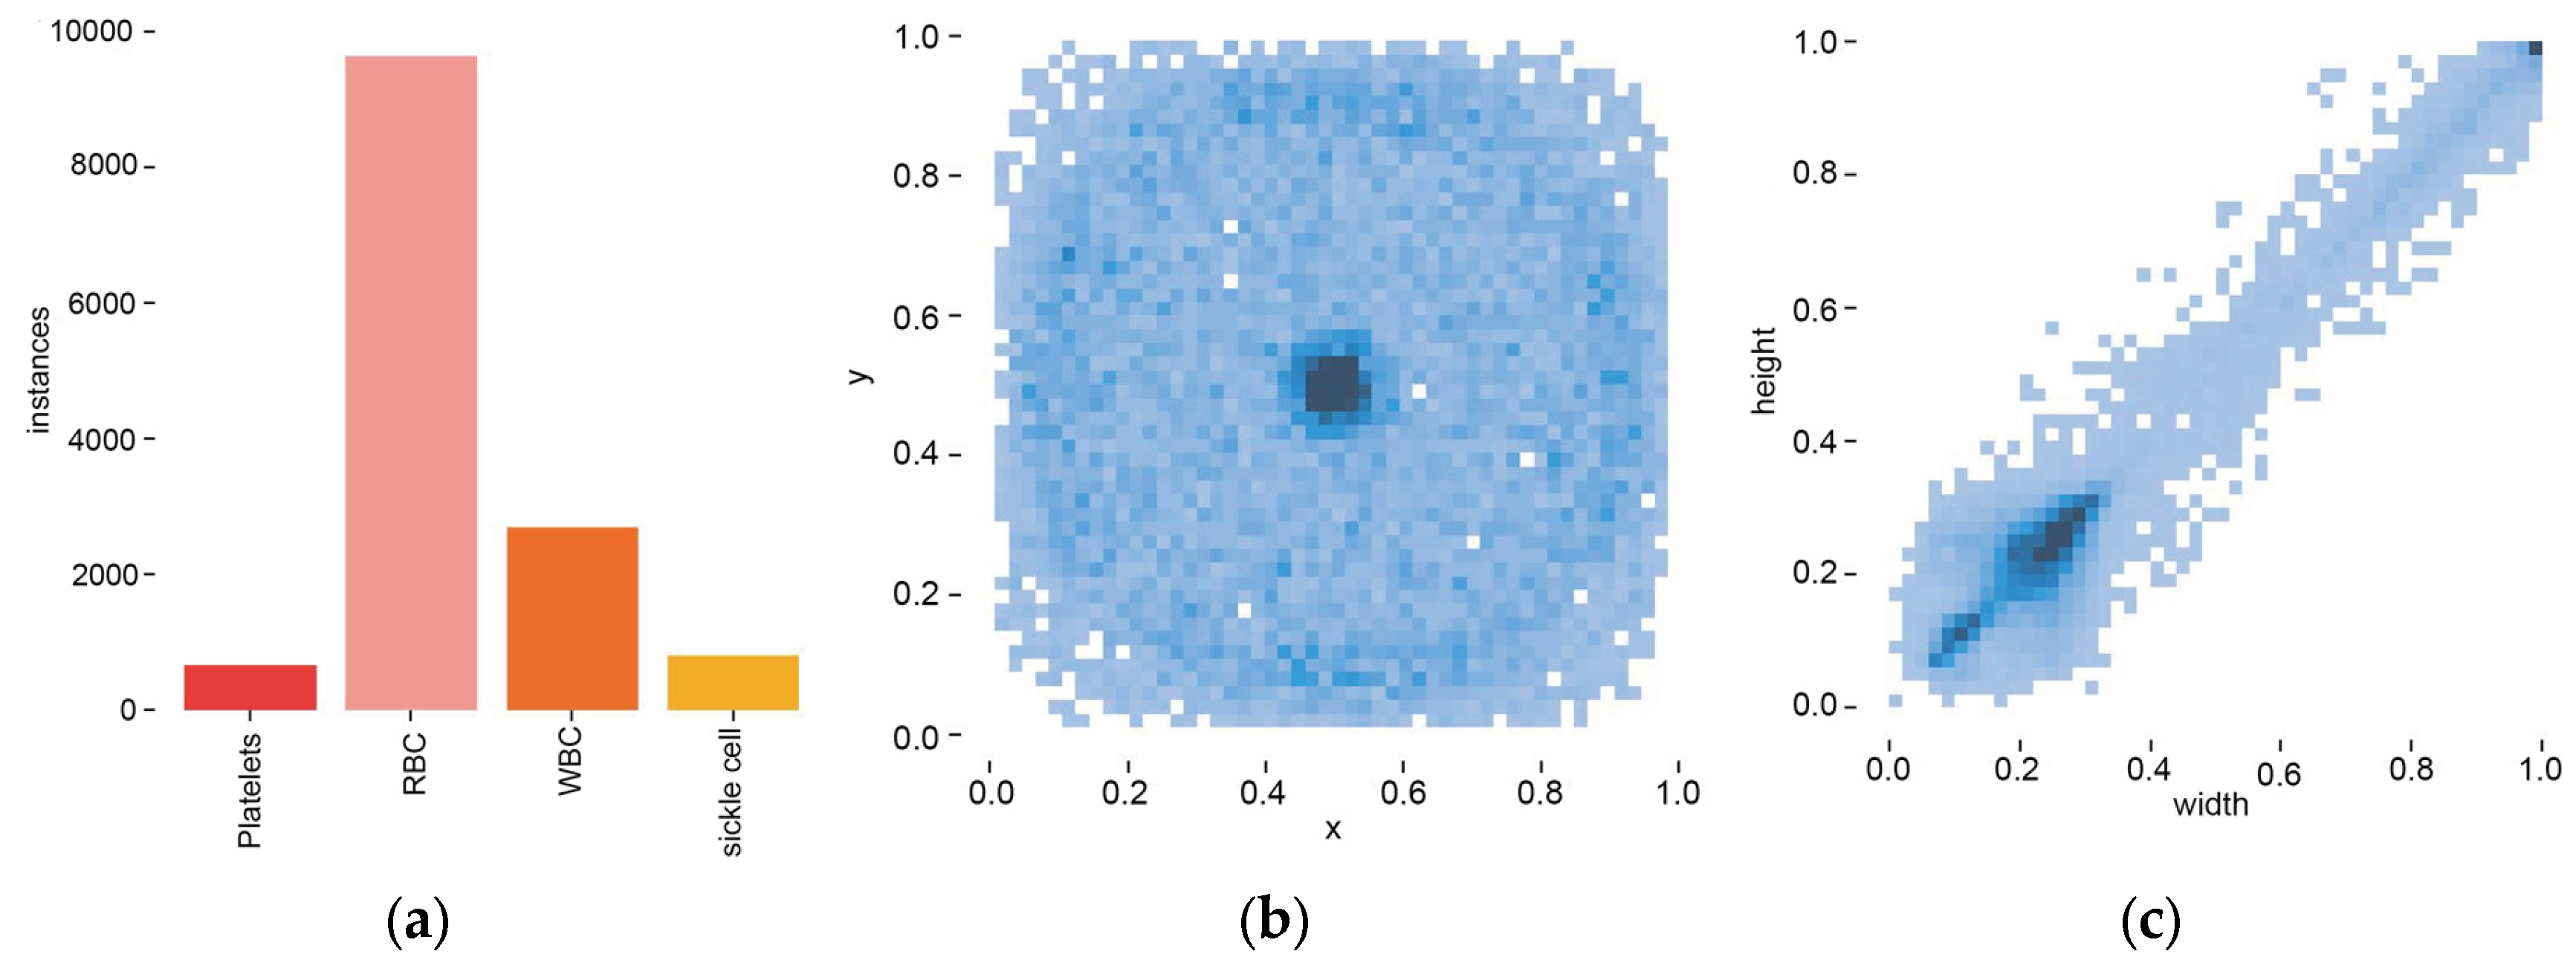
Open blood cell datasets were used in the experiment, and four common cells, including Platelets, RBC, WBC and sickle cell, were selected for dataset construction. The data set contained more red blood cells and fewer white blood cells, platelets and sickle cells, consistent with the number of cells in a normal human environment.
In this paper, visual annotation tool Labelme was used to annotate the data set. The label is the type and location of the cell. Among them, the location is marked by a rectangular box. The requirement for the rectangular box is to be able to completely surround the cell and avoid the rectangular box being too large. The labeling of species requires that the category label match the actual cell category to avoid labeling errors. The training data set obtained after accurate annotation of the original data set is shown in
Figure 4.
After the labeling is completed, the quantity of each cell category label and its position distribution on the image are shown in
Figure 5. Each blood cell category is widely distributed throughout the image. This uniformity provides the algorithm with a rich and comprehensive learning sample, enhancing the algorithm’s understanding of blood cell characteristics in different locations and scenarios. Rigorous data cleaning and validation ensures data quality, providing a reliable basis for training blood cell recognition models. At the same time, the robustness of the algorithm is improved, so that it can better adapt to the blood cell recognition task in the real scene.
3.3. Ablation Experiment
In order to show the performance of the improved algorithm more intuitively, the ablation experiment was carried out. “√” indicates the addition of this improved method based on the YOLOv5s network model. The experimental results are shown in
Table 1.
The experiment took YOLOv5s as the baseline. The comparison of experimental results between the first group and the second group in
Table 1 shows that mAP increases from 83.2% to 83.3% after the network structure is changed to BotNet. The results show that the YOLOv5 integrated BotNet module can effectively improve the detection accuracy. The results of the second set of experiments compared with the third set of experiments, the increase of Decoupled Head in the network, mAP decreased from 83.3% to 83.2%. The results show that the detection Head in YOLOv5s changes from Decoupled head to Decoupled Head [
13], which reduces the predictive ability and accuracy of model classification and regression. The comparison of the results of the third and fourth sets of experiments shows that the mAP increases from 83.2% to 83.8% by replacing the loss function in the network. The results show that the loss function SIoU in the network improves the detection accuracy of the algorithm. The comparison between the first group and the four groups of experimental results shows that in the YOLOv5s network, mAP is increased by 0.6% after network structure fusion, decoupling head and loss function improvement.
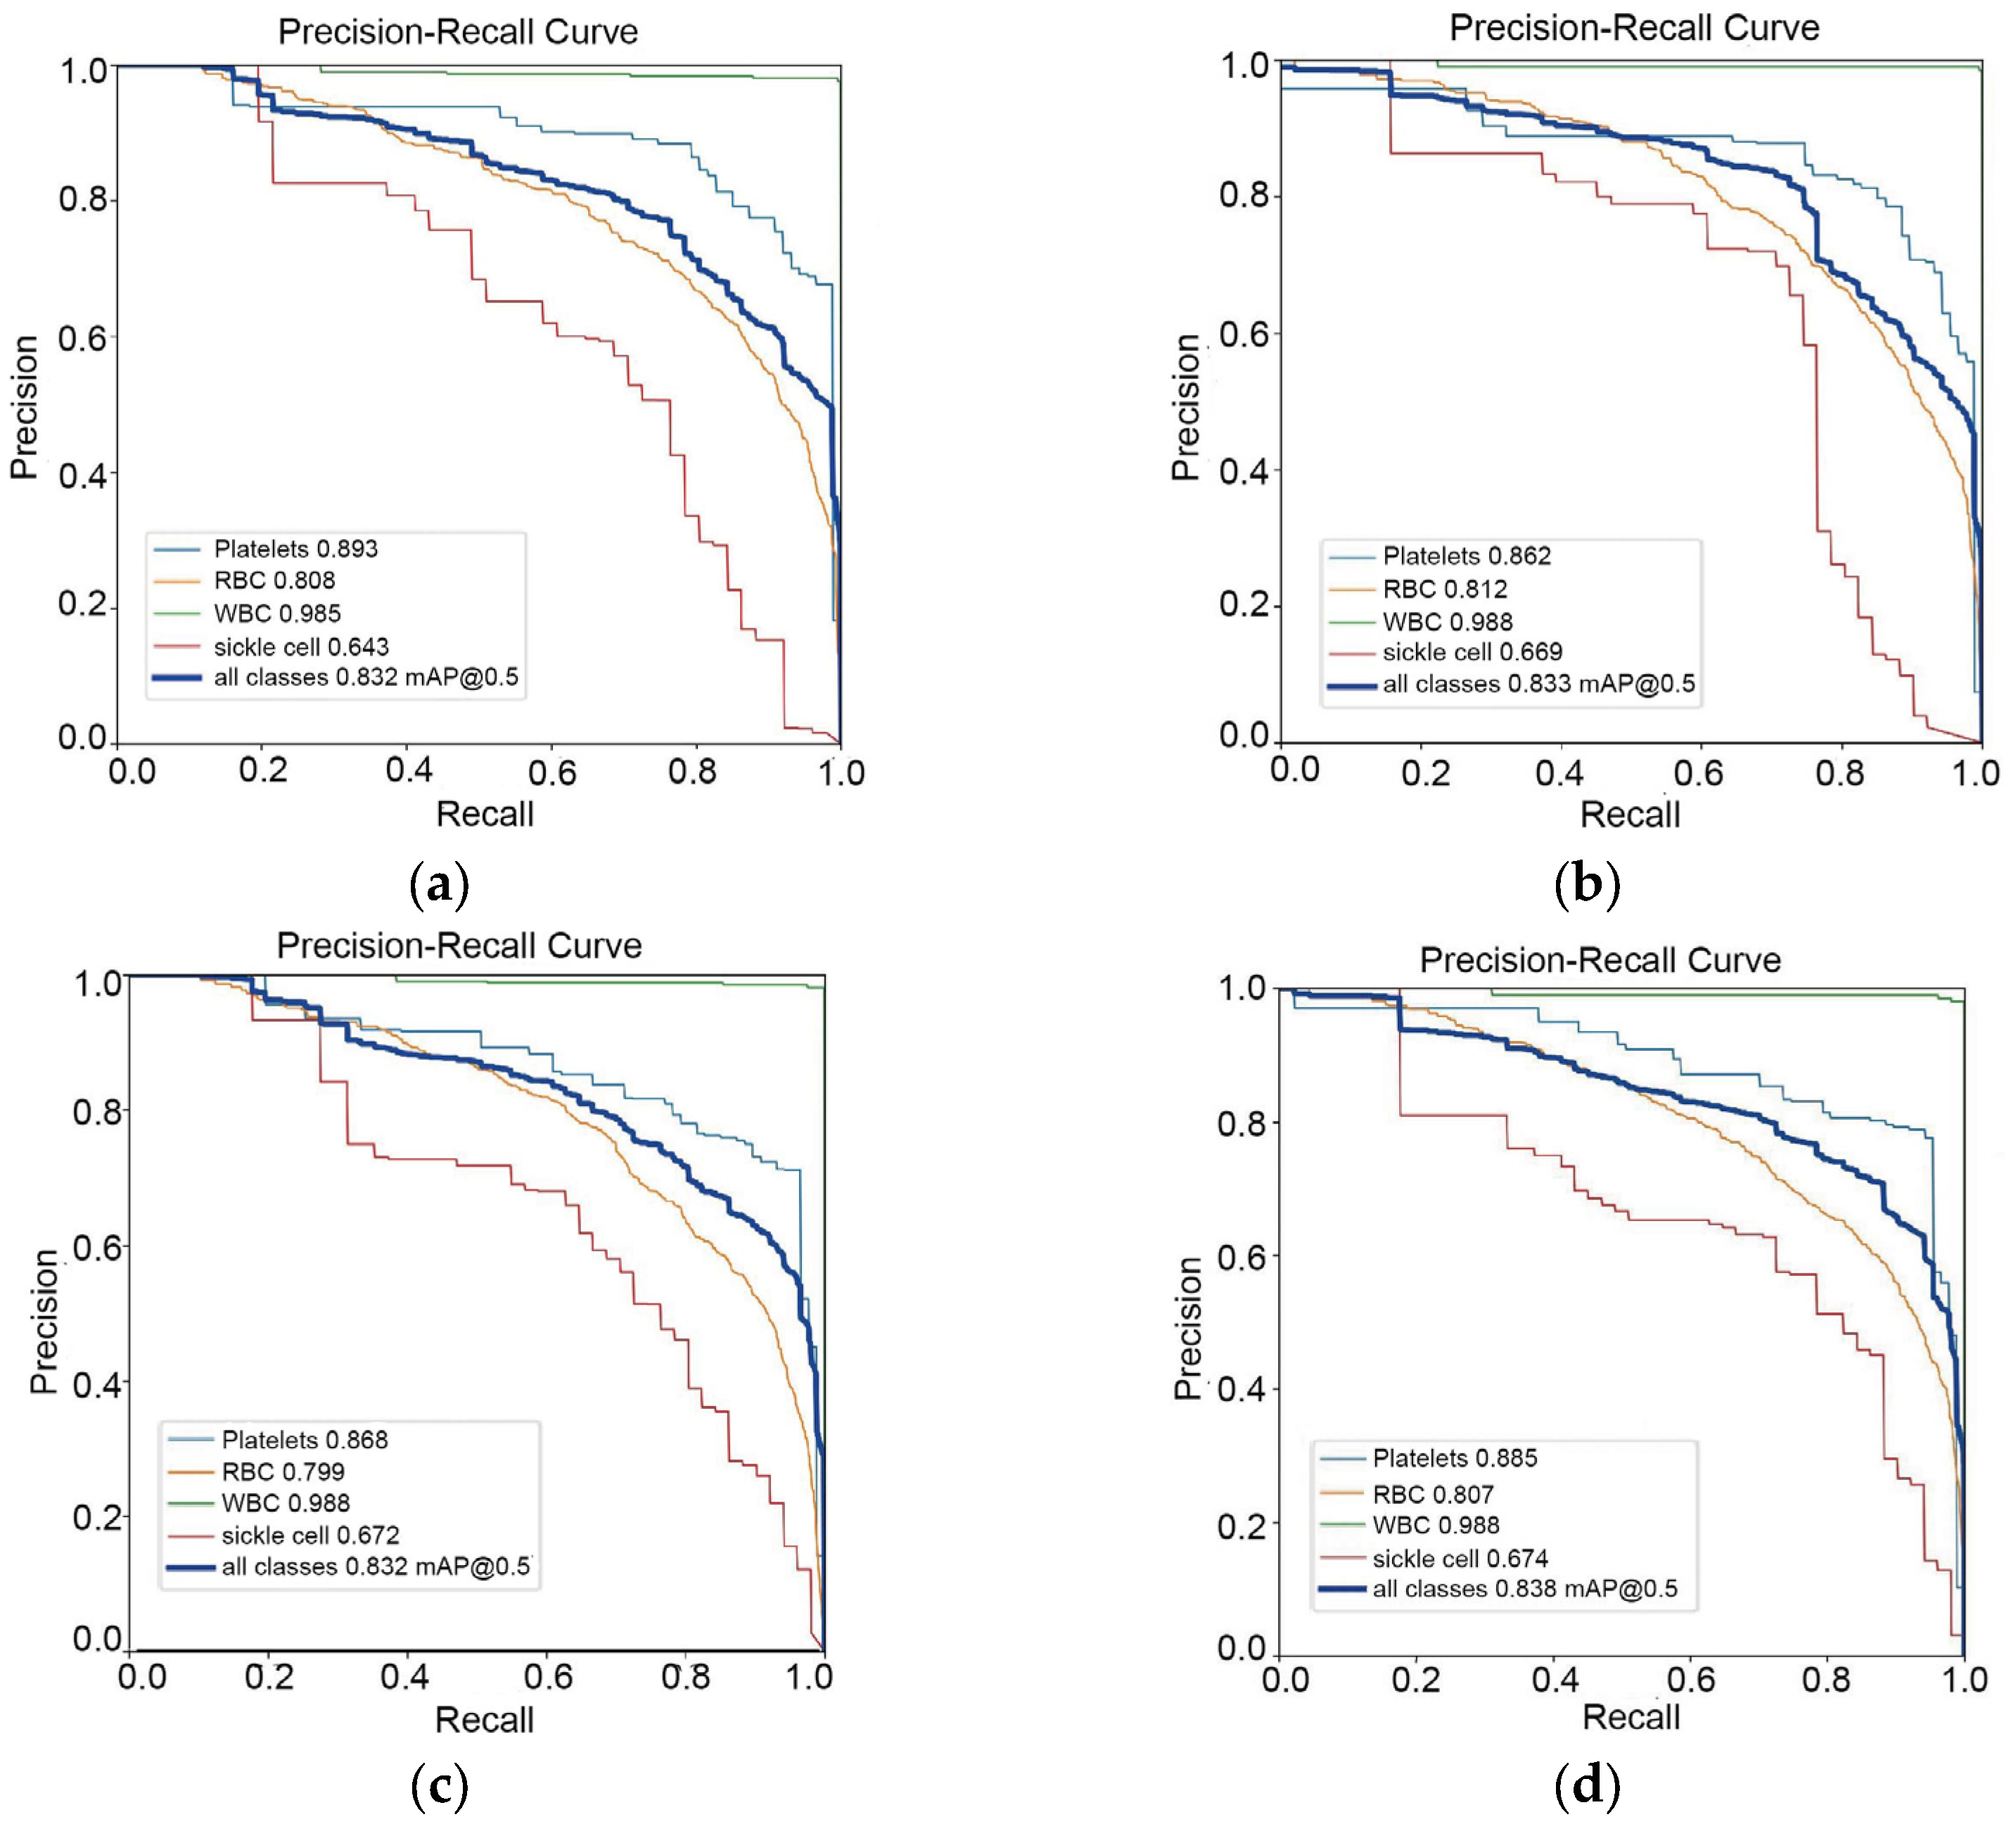
In the PR curve shown in
Figure 6. The shape of PR curve can reflect the performance of classifier. If the accuracy and recall rate of the classifier are high, the PR curve will approach the upper right corner, that is, the larger the area between the curve and the X-axis. This means better performance. The results of the improved algorithm are found to be optimal.
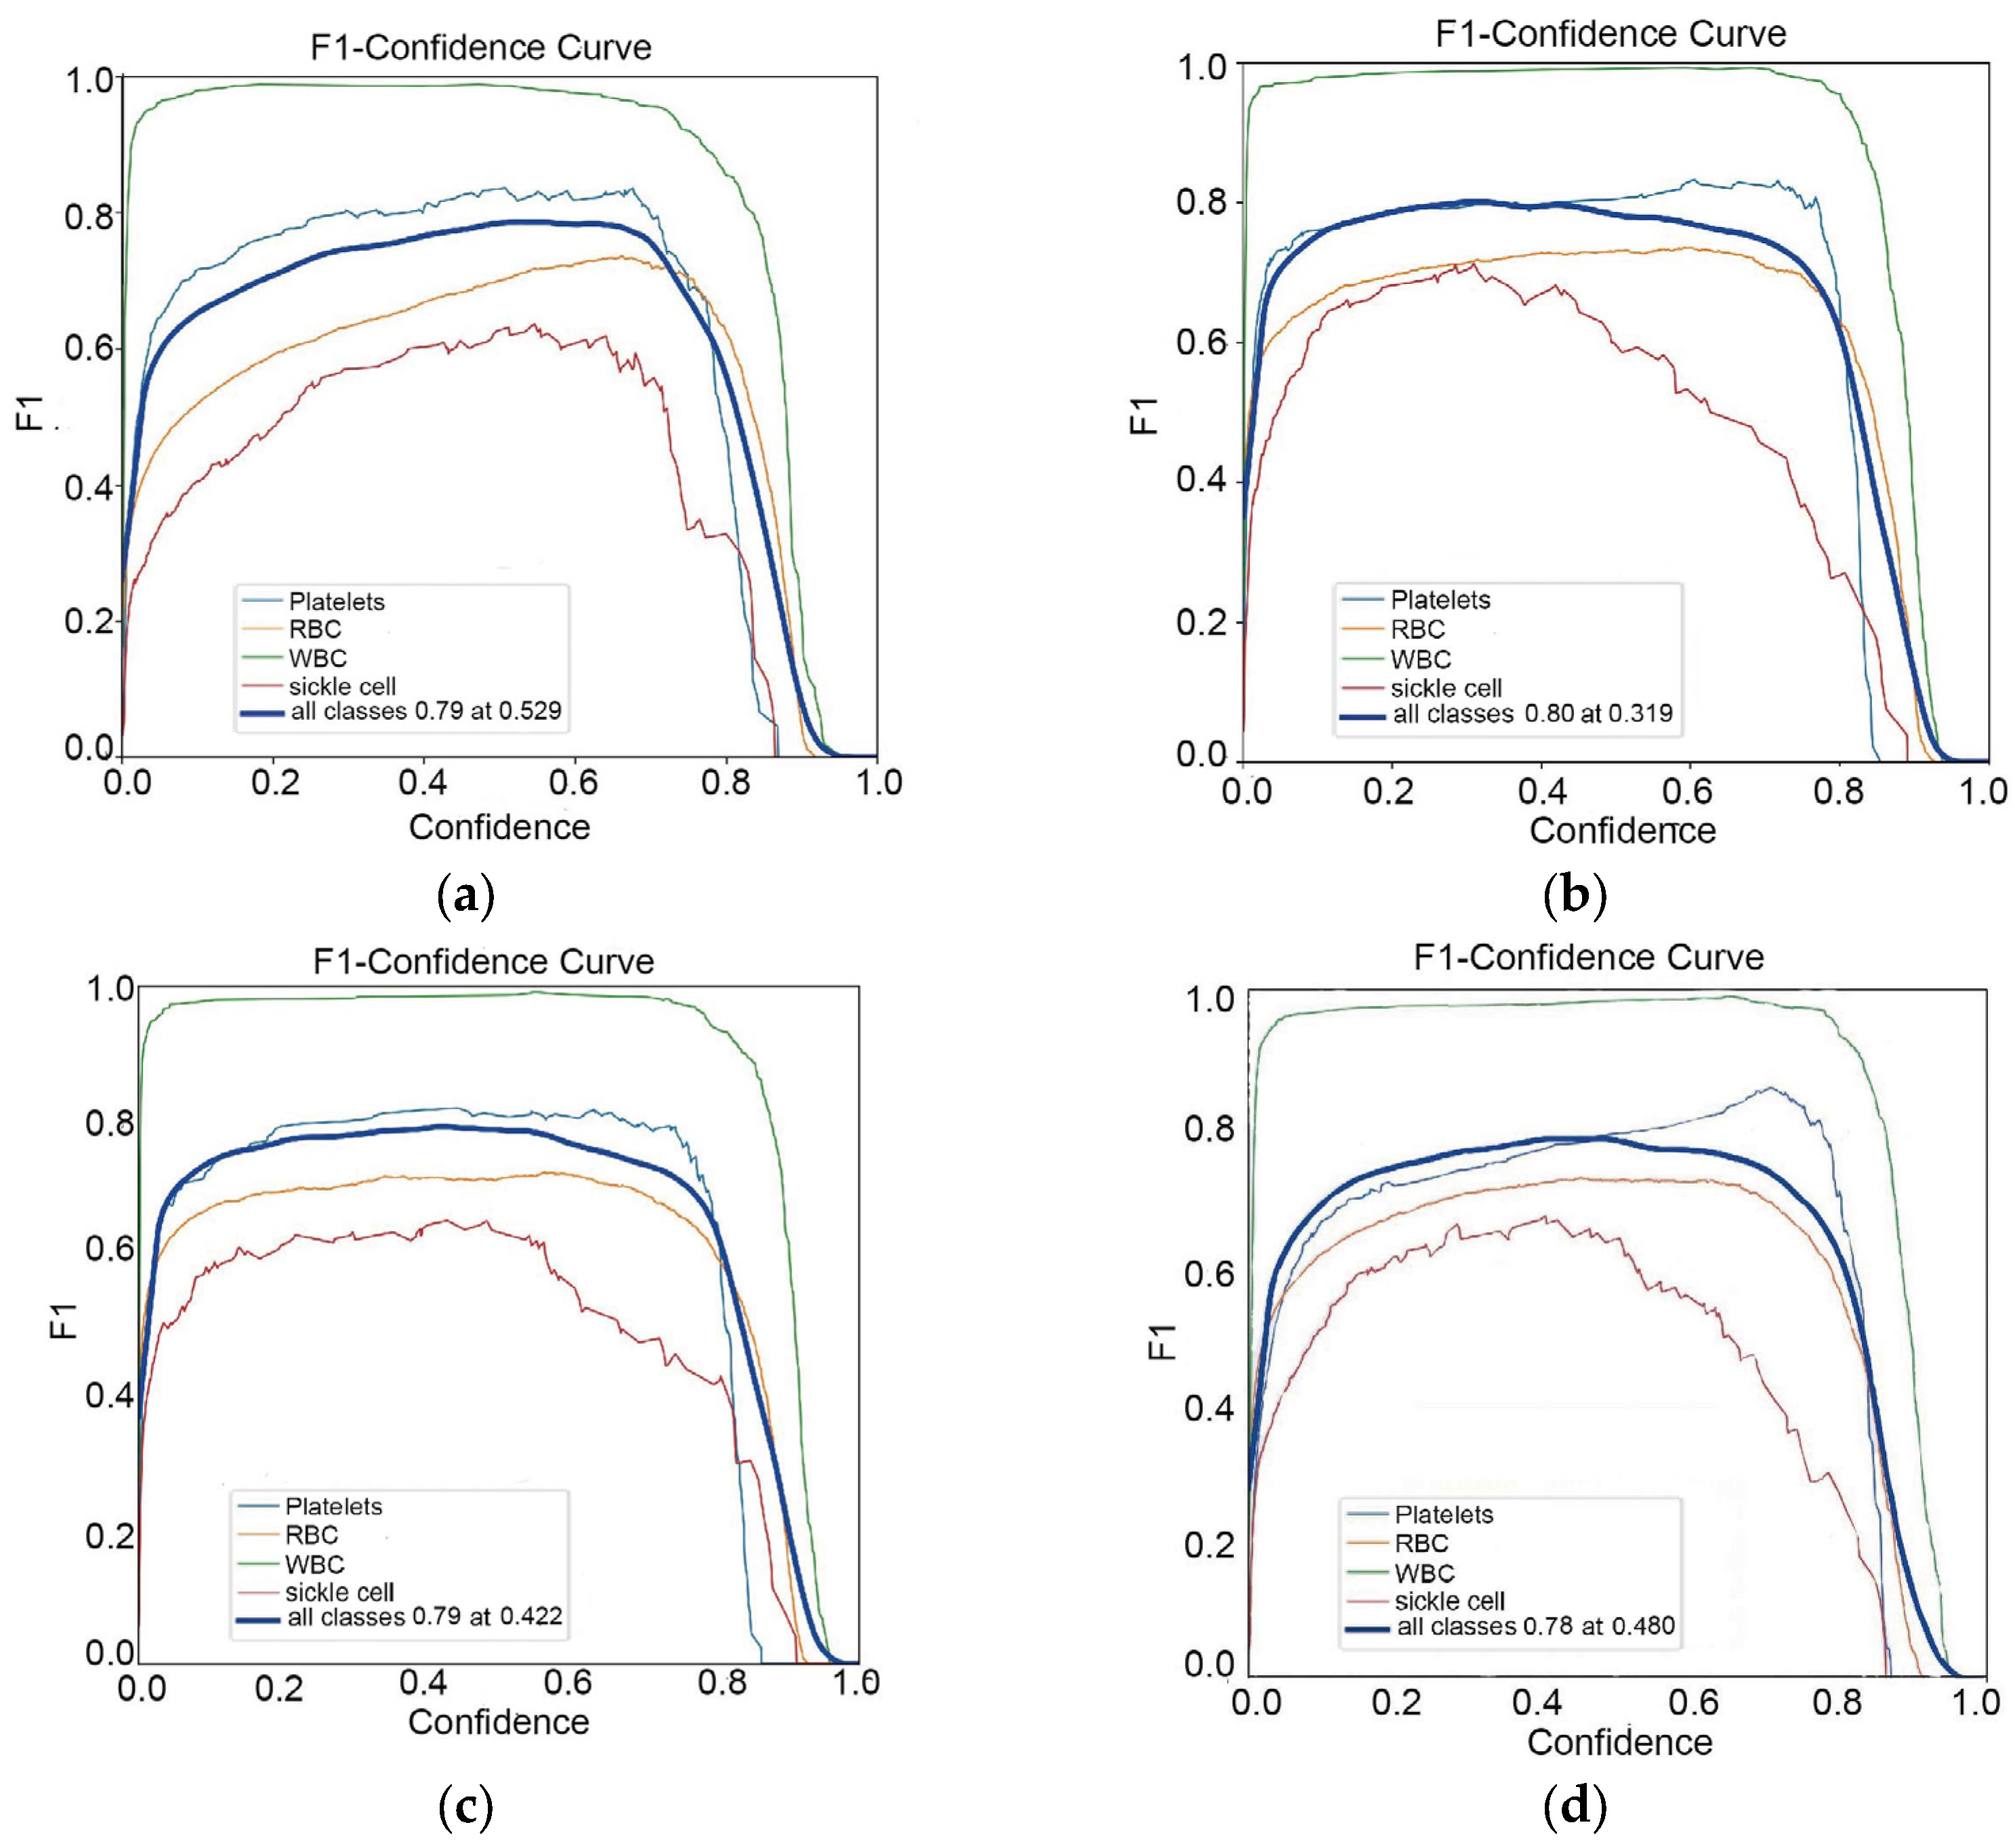
Figure 7 shows the F1 curve. It takes precision and recall into account. The larger the value of F1, the better the model detection performance.
3.4. Contrast Experiment
In order to test the performance of the improved algorithm, comparative experiments are carried out. It was tested with YOLOv8 on the data set, and the specific results are shown in
Table 2.
Table 2 shows the comparison of the results of the two test models. The improved algorithm is optimal in all indexes. YOLOv5-BS has a 3.9% increase in mAP and a 3% increase in recall compared to YOLOv8.
It can be seen from the comparison experiment that the detection effect of the improved algorithm on the data set is better than that of YOLOv8.
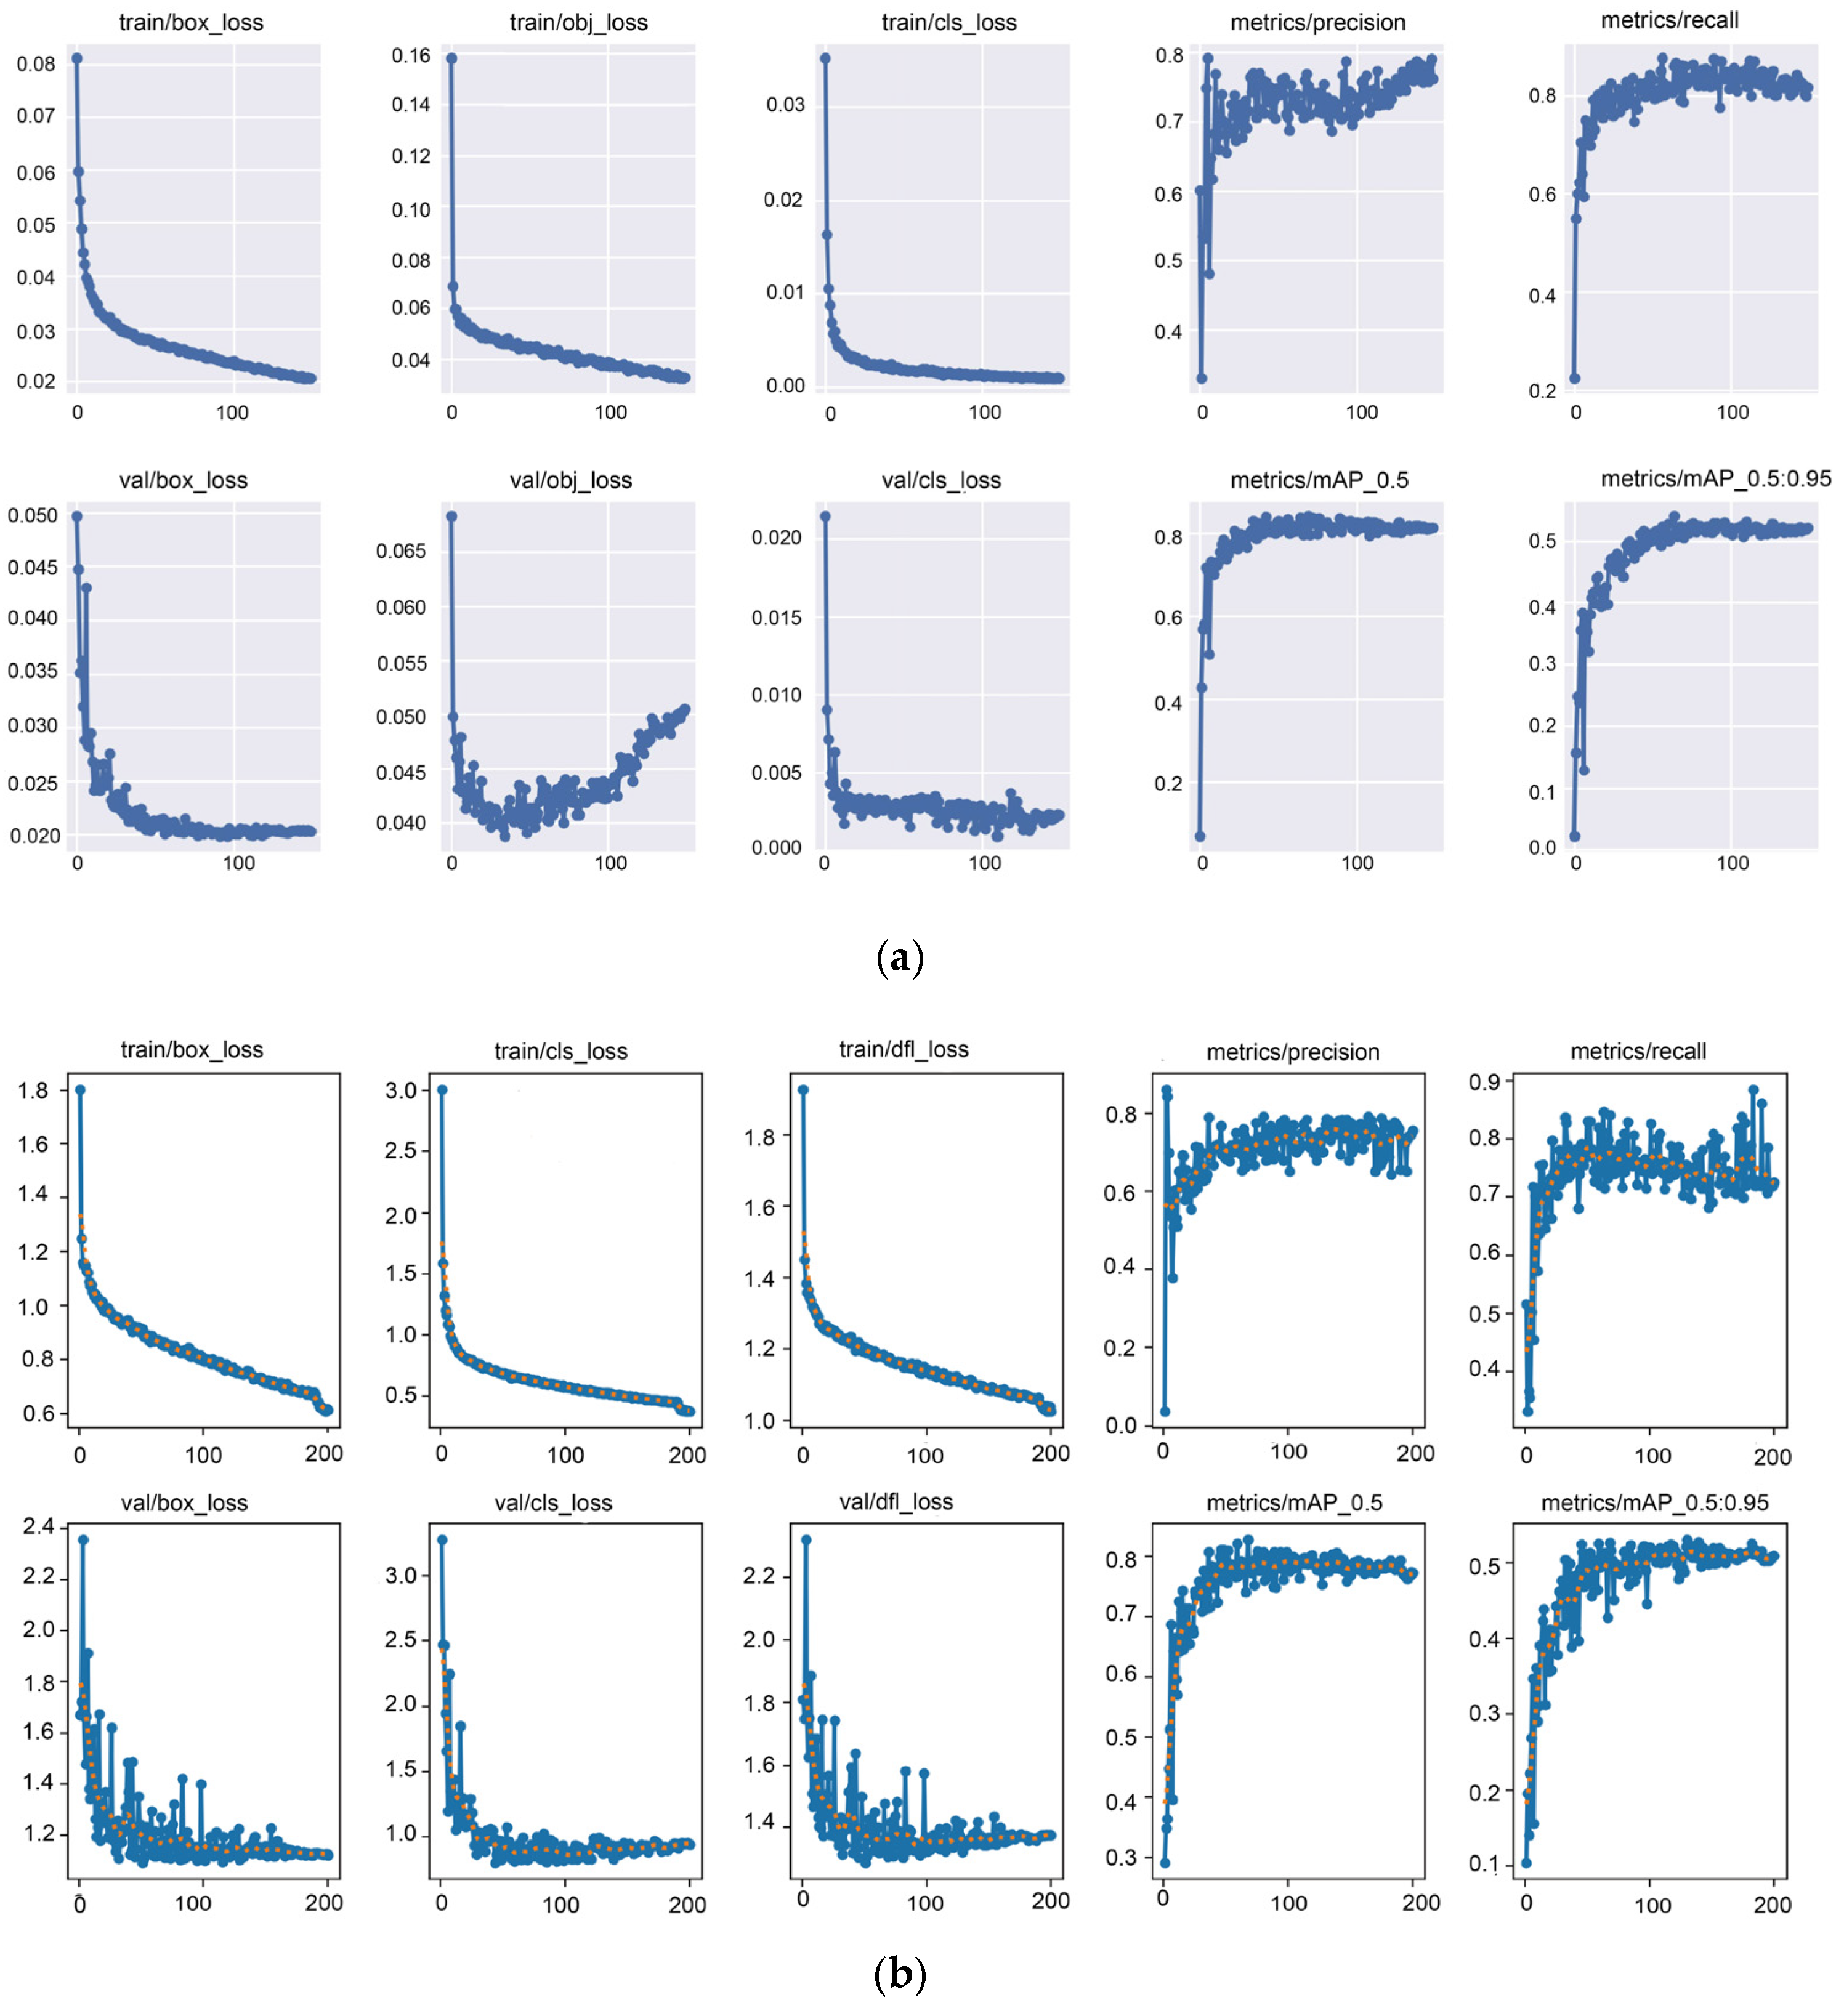
Figure 8 shows the comparison of test results between the improved YOLOv5-BS and the benchmark model YOLOv8s used in the test set. The solid blue line in the figure represents the result, and the yellow dot represents smooth.
The more complex the algorithm is. The better the ability to fit the data set, the better the performance on the data set. However, too much complexity can lead to too long training times, which can degrade performance. In addition, if the data set is too large, the training time will increase, which will reduce the algorithm performance. With the increasing number of training rounds, the curves of positioning loss, classification loss and confidence loss of training and verification continue to decline. At the same time, the accuracy P, the recall R, the average accuracy mAP_0.5 and the average accuracy MAP_0.5 :0.95 all keep increasing. As can be seen from the comparison chart of the results. The improved YOLOv5-BS in this paper is more stable than the YOLOv8s model in the fluctuation of average accuracy and recall rate, and is better than the detection effect of YOLOv8s. It is proved that the improved algorithm has better robustness than YOLOv8s. To sum up, the model YOLOv5-BS in this paper has better detection effect.
3.5. Experimental Effect
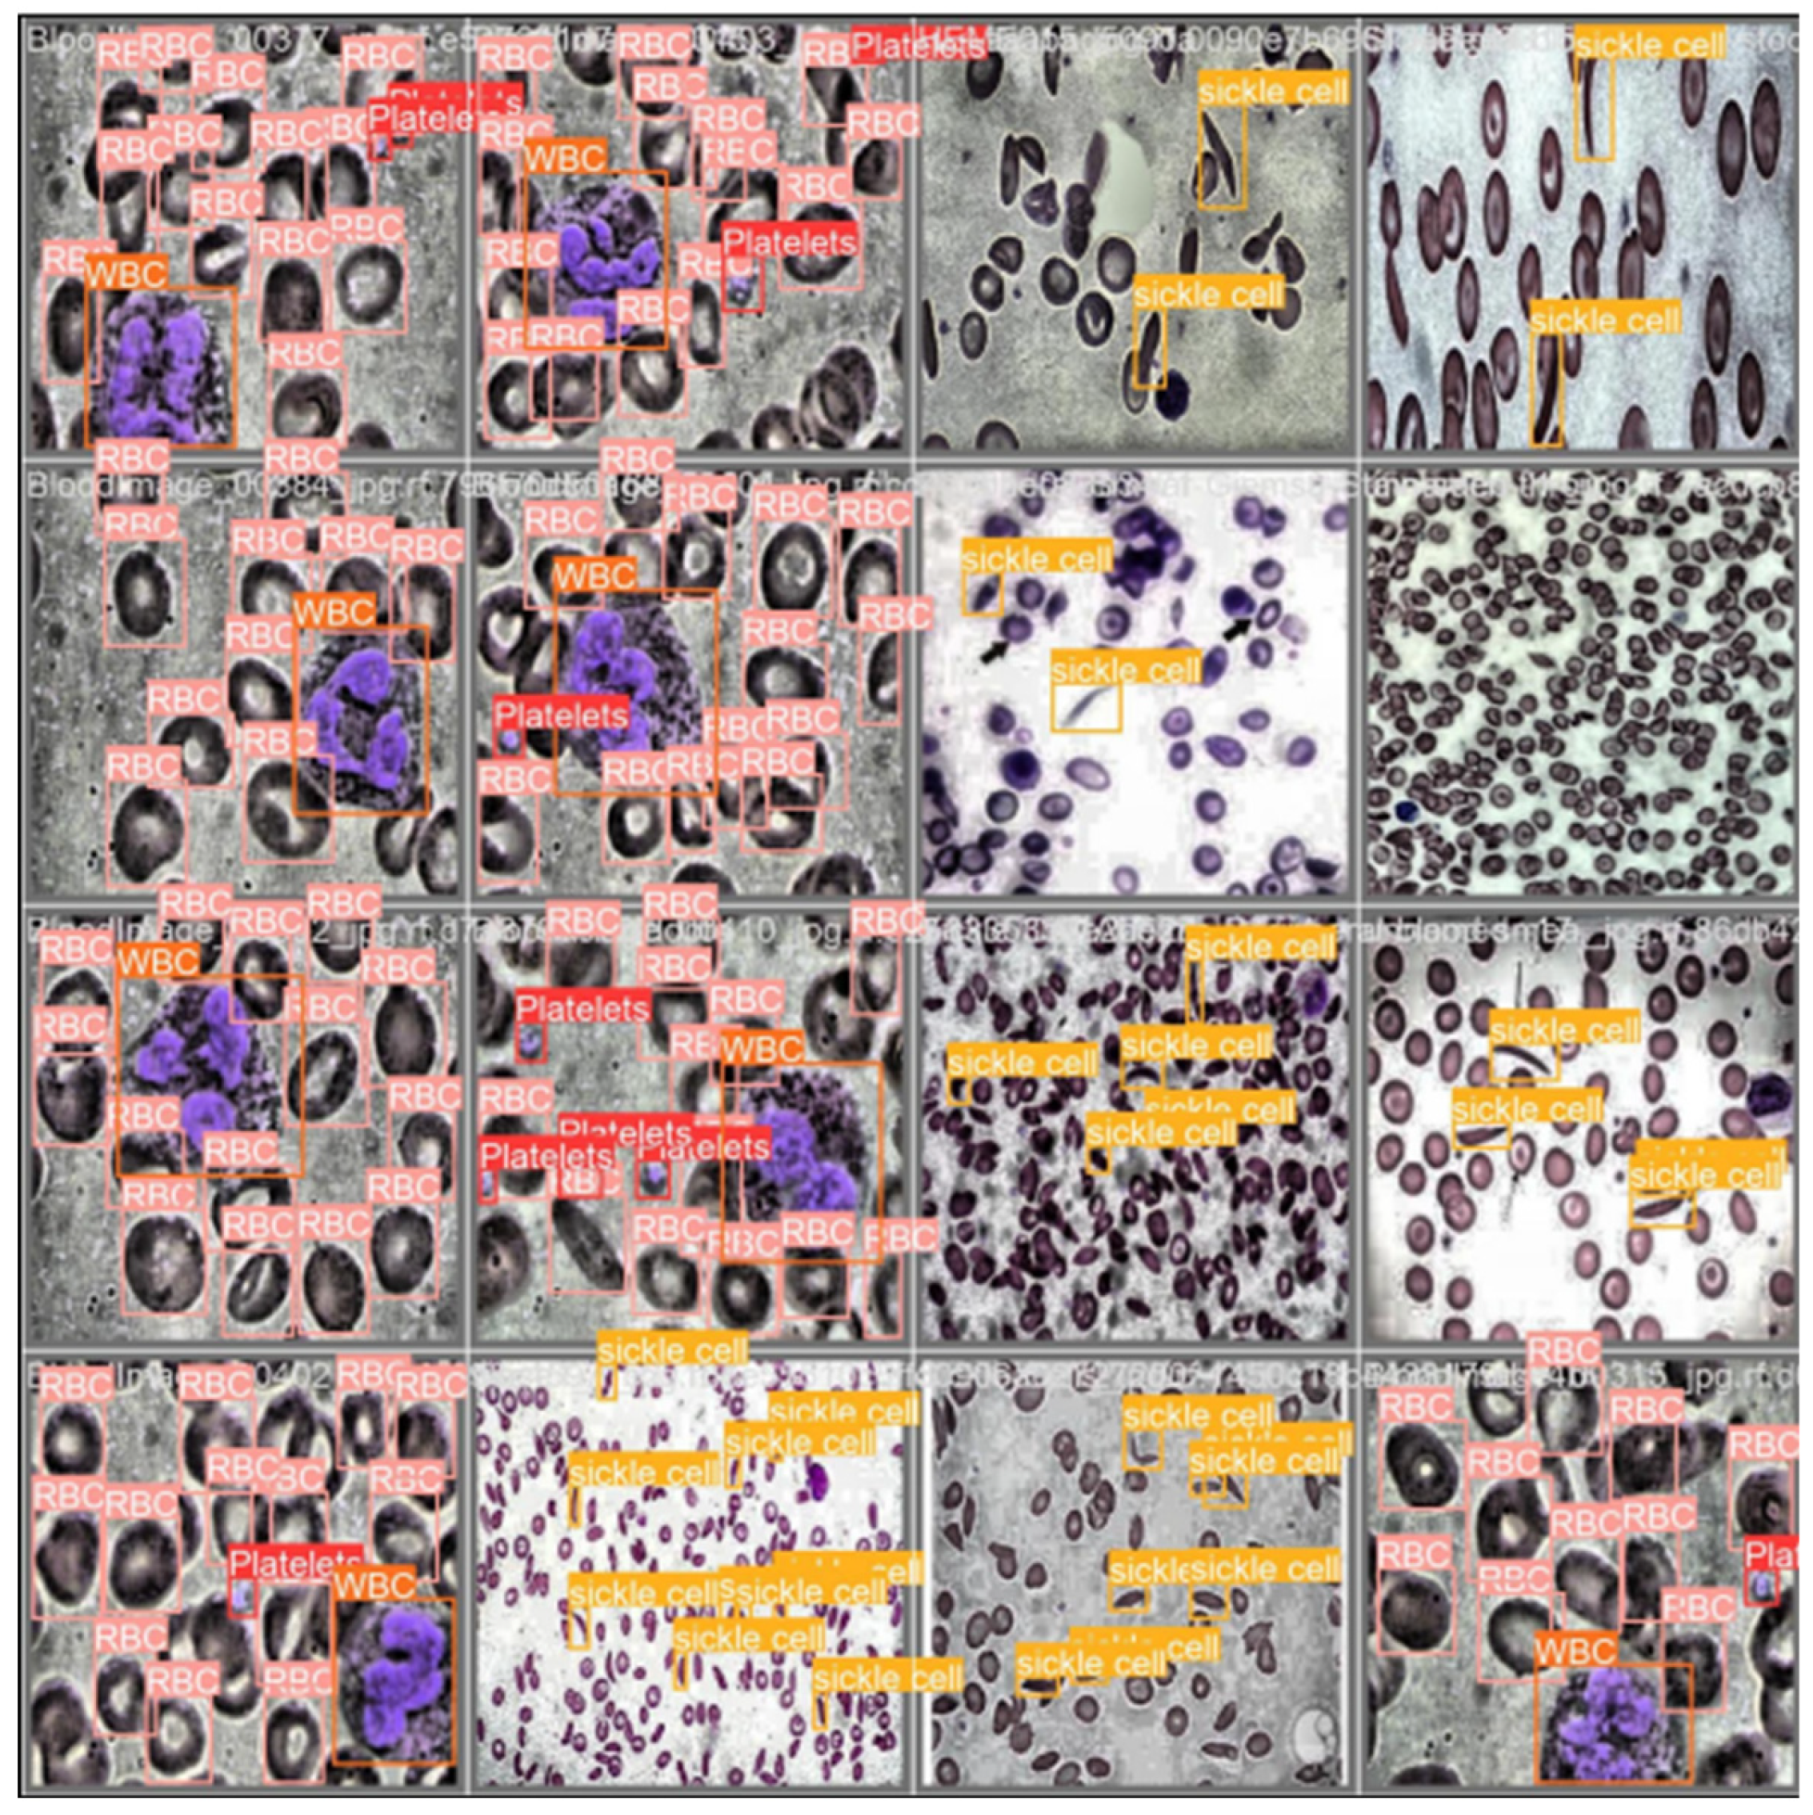
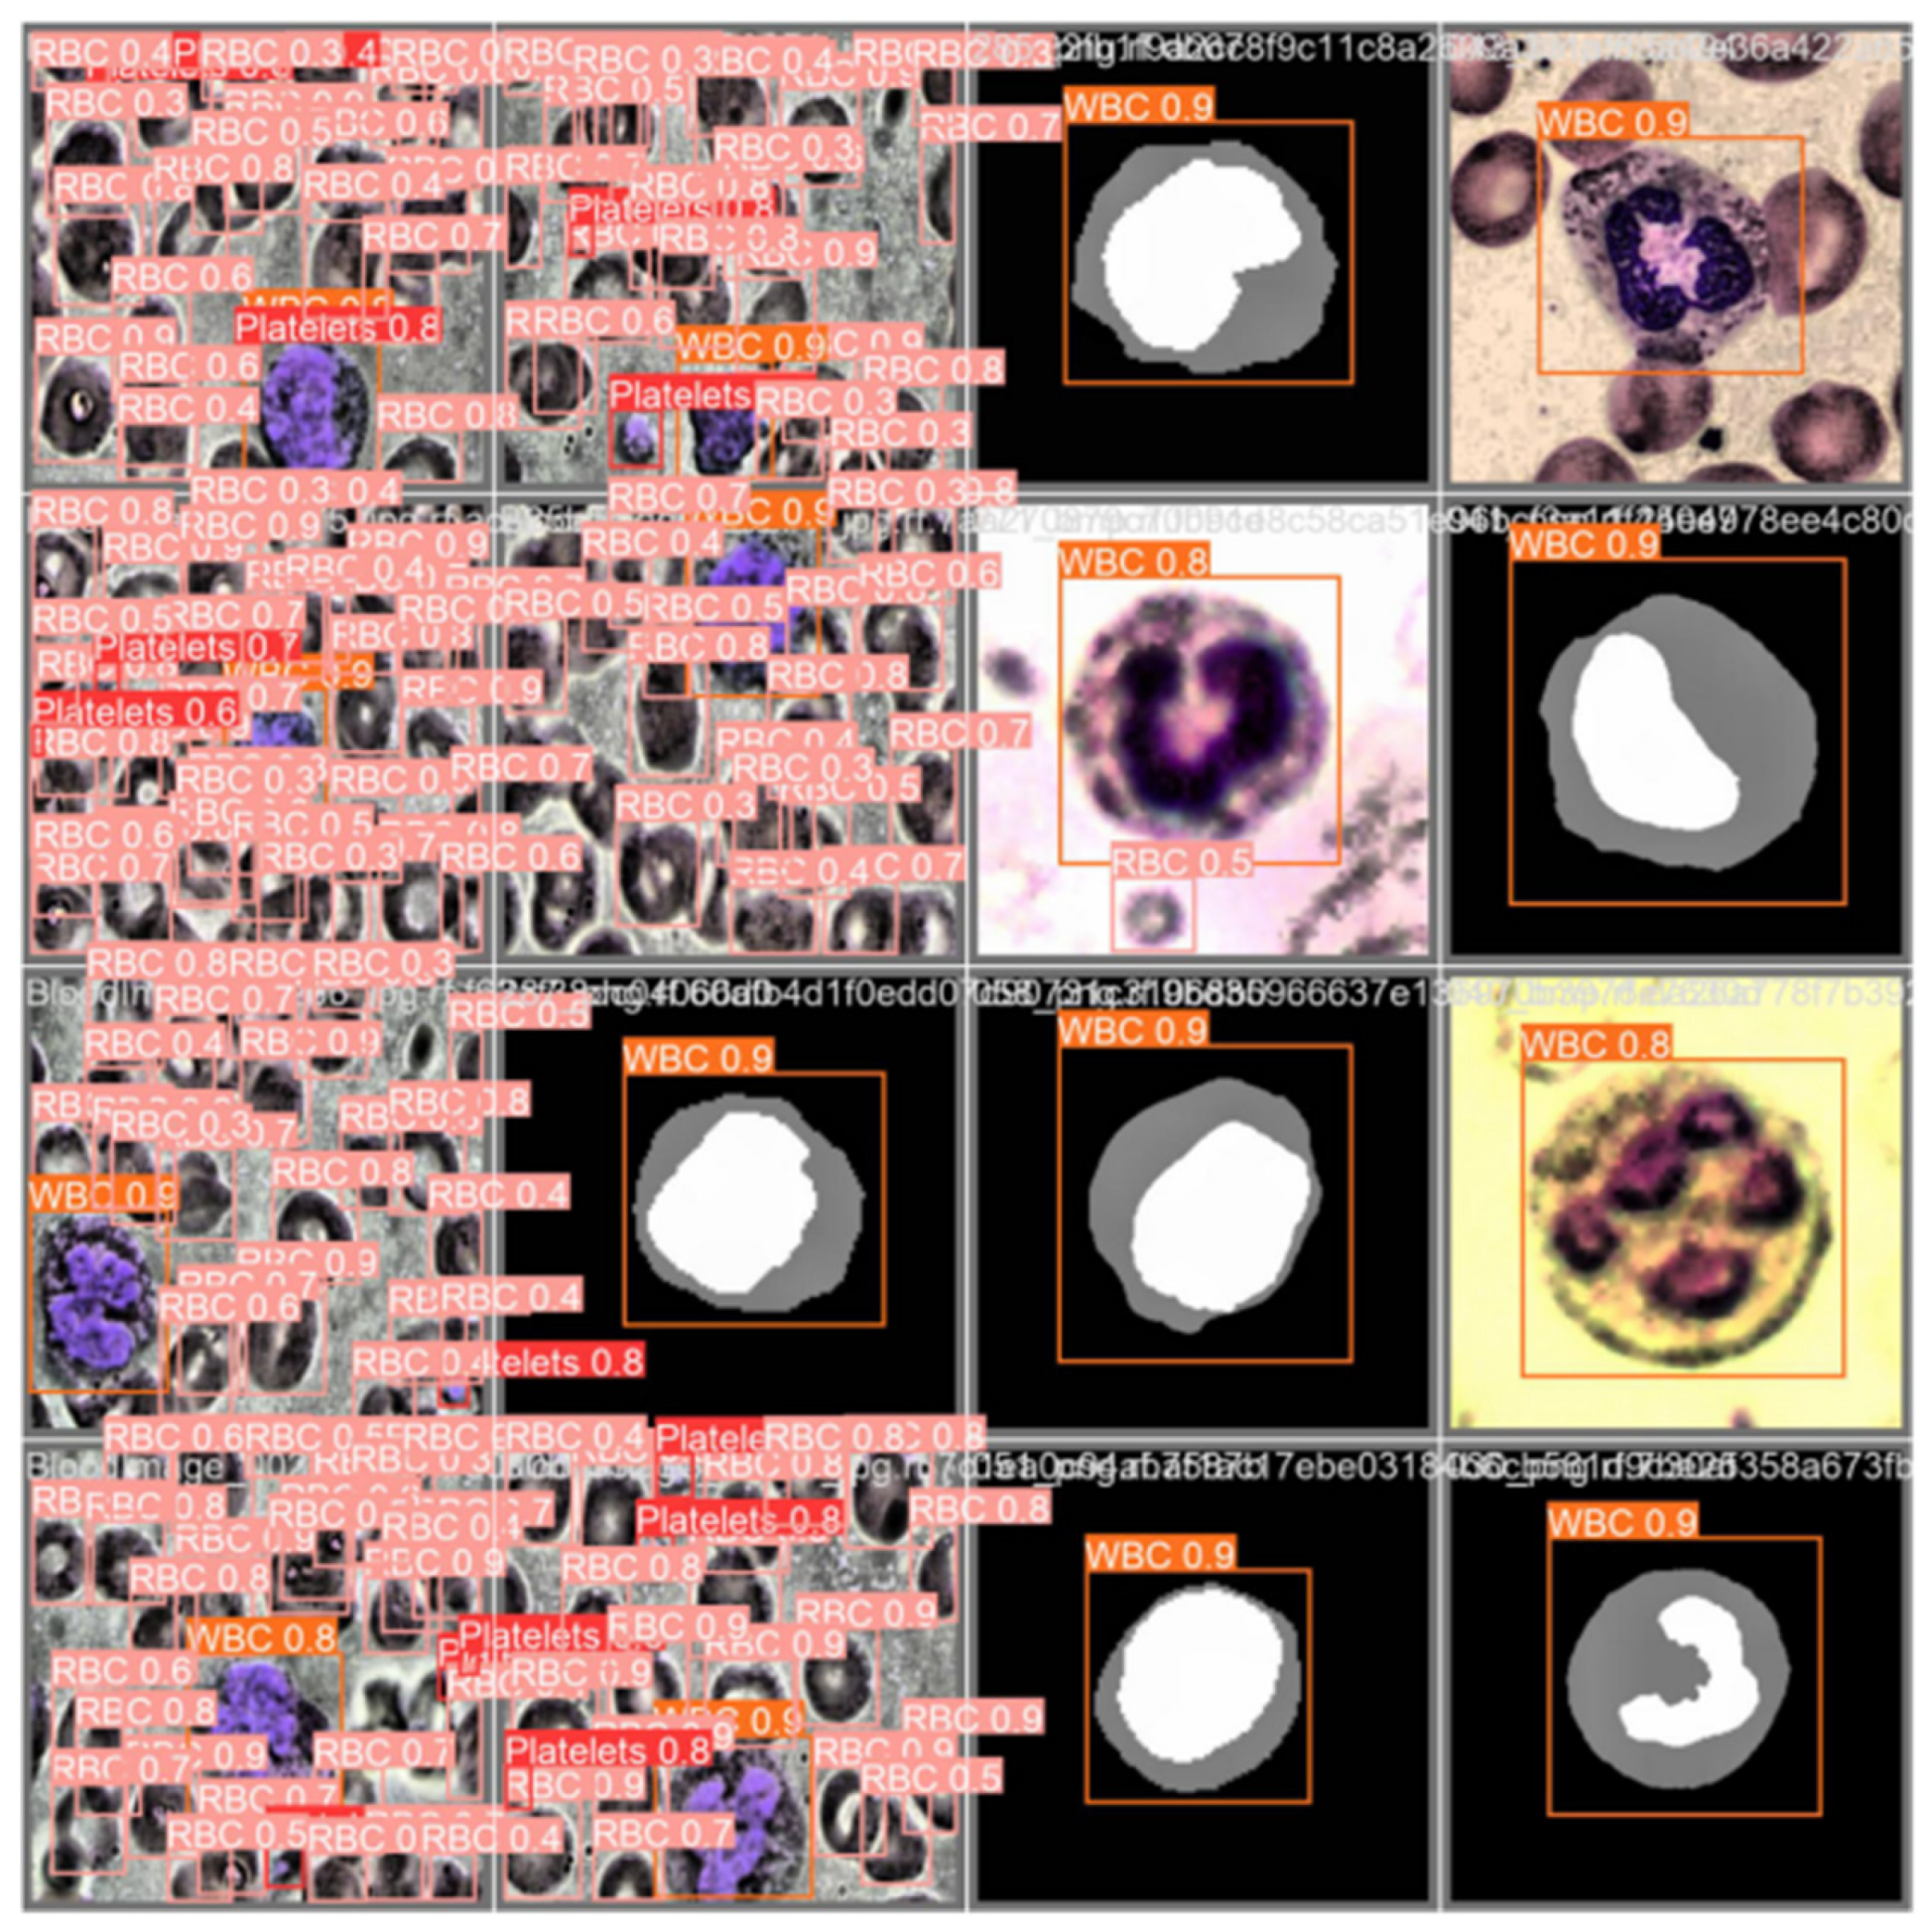
After several optimizations, this paper finally selected the improved YOLOv5-BS as the blood cell detection algorithm. The images in the test data set can be used to check whether the improved algorithm can accurately detect the target object. The prediction effects of the four blood cells are shown in
Figure 9. The results show that the algorithm has high detection accuracy, can accurately identify all kinds of blood cells and show reliable detection ability.
3.6. Experimental Analysis
Figure 6 and
Figure 7 show the index curves of the improved blood cell recognition model in the test set. The accuracy curve clearly shows that the model maintains high accuracy under different thresholds and shows high stability. The recall curve highlights the model’s comprehensive coverage of positive samples and maintains a high level of recall. The PR curve clearly shows the model’s ability to distinguish positive and negative samples while maintaining high accuracy. In addition, the F1 curve achieves the best balance between accuracy rate and recall rate, which further validates the excellent performance of the improved algorithm. These evaluation indexes show the excellent performance of the model. It shows satisfactory accuracy and robustness in the task of blood cell recognition.
The improved algorithm combines BotNet with Decoupled Head structure to enhance the ability of blood cell feature extraction, and the loss function is modified to improve the localization detection accuracy. Experiments show that the improved YOLOv5-BS has good detection performance, and compared with the yolov8 model, it shows good classification ability on the test set. The improved model is highly effective in identifying these blood cell types.
3.7. Visual Window
Users can gain insight into the state and characteristics of cells through the visual window for more detailed analysis. Key data such as detection category, confidence, detection box position and the number of cells of each type are displayed through the label control. Users can get a comprehensive picture of the detection of each type of blood cell. This helps users compare, analyze and make deeper decisions, improving understanding of blood cell test results.
The experimental results show that the Qt-based blood cell recognition and counting system can recognize and count different types of blood cells efficiently. The system demonstrates accurate calibration and counting of Platelets, RBC, WBC, and sickle cells. At the same time, it provides intuitive image display and detailed statistical information. This verifies that the system has high practicability and operability in practical application, and provides a convenient and effective solution for the blood cell detection task.
4. Discussion
In this paper, a new detection algorithm is proposed, which improves the basic yolov5 network. First combine the BotNet network. Then SIoU is added to improve the convergence speed and positioning accuracy of the model. In the end, the YOLOv5 Head architecture SPP-YOLO was replaced by Decoupled Head architecture to improve the accuracy of the model. Through a series of experiments, the improved YOLOv5-BS algorithm shows high recall rate and accuracy in detection. The average accuracy on the test set reached 83.8%, and the recall rate was 99%, which was improved by 3.9% and 3% respectively compared with YOLOv8. The improved algorithm can effectively improve the detection efficiency and accuracy, and has important significance for the application of blood cell detection. It is expected that the blood cell detection system will be applied in the real clinical field, real-time monitoring and assisting doctors to diagnose diseases. This has positive social and medical significance for improving the automation level of medical image analysis and promoting the early diagnosis and treatment of diseases.
Author Contributions
X.S. wrote the original paper and did all the experiments. H.T. reviewed the manuscript and directed revisions. All authors have read and agreed to the published version of the manuscript.
Funding
This research was supported by the Shanghai Action Plan for Scientific and Technological Innovation (23YF1429900).
Data Availability Statement
The original data mentioned in this article is not convenient to make public, and further research can be directed to the corresponding author.
Conflicts of Interest
The authors declare no conflicts of interest.
References
- Deshpande, N. M., Gite, S., & Aluvalu, R. (2021). A review of microscopic analysis of blood cells for disease detection with AI perspective. PeerJ. Computer science, 7, e460. [CrossRef]
- Tiwari, P., Qian, J., Li, Q., Wang, B., Gupta, D., Khanna, A., Rodrigues, J., & Albuquerque, V.H. (2018). Detection of subtype blood cells using deep learning. Cognitive Systems Research, 52, 1036-1044. [CrossRef]
- Liang, S., & Gu, Y. (2021). A deep convolutional neural network to simultaneously localize and recognize waste types in images. Waste management, 126, 247-257 . [CrossRef]
- Viraktamath, D.S., Yavagal, M., & Byahatti, R. (2021). Object Detection and Classification using YOLOv3.
- Mahto, P. , Garg, P. , Seth, P. , & Panda, J. . Refining yolov4 for vehicle detection. Social Science Electronic Publishing.
- Wang, P., Fu, S., & Cao, X.R. (2022). Improved Lightweight Target Detection Algorithm for Complex Roads with YOLOv5. 2022 International Conference on Machine Learning and Intelligent Systems Engineering (MLISE), 275-283.
- Chen, J., Zhu, J., Li, Z., & Yang, X. (2023). YOLOv7-WFD: A Novel Convolutional Neural Network Model for Helmet Detection in High-Risk Workplaces. IEEE Access, 11, 113580-113592. [CrossRef]
- Han, S., Jiang, X., & Wu, Z. (2023). An Improved YOLOv5 Algorithm for Wood Defect Detection Based on Attention. IEEE Access, 11, 71800-71810. [CrossRef]
- Li, L.; Zhang, R.; Xie, T.; He, Y.; Zhou, H.; Zhang, Y. Experimental Design of Steel Surface Defect Detection Based on MSFE-YOLO—An Improved YOLOV5 Algorithm with Multi-Scale Feature Extraction. Electronics 2024, 13, 3783. [CrossRef]
- Liu, W., Anguelov, D., Erhan, D., Szegedy, C., Reed, S.E., Fu, C., & Berg, A.C. (2015). SSD: Single Shot MultiBox Detector. European Conference on Computer Vision.
- Redmon, J., & Angelova, A. (2014). Real-time grasp detection using convolutional neural networks. 2015 IEEE International Conference on Robotics and Automation (ICRA), 1316-1322.
- Redmon, J., & Farhadi, A. (2016). YOLO9000: Better, Faster, Stronger. 2017 IEEE Conference on Computer Vision and Pattern Recognition (CVPR), 6517-6525.
- Redmon, J., & Farhadi, A. (2018). YOLOv3: An Incremental Improvement. ArXiv, abs/1804.02767.
- Jocher, G.R., Stoken, A., Borovec, J., NanoCode, Chaurasia, A., TaoXie, Liu, C., Abhiram, Laughing, tkianai, yxNONG, Hogan, A., lorenzomammana, AlexWang, Hájek, J., Diaconu, L., Marc, Kwon, Y., Oleg, wanghaoyang, Defretin, Y., Lohia, A., ah, M., Milanko, B., Fineran, B., Khromov, D.P., Yiwei, D., Doug, Durgesh, & Ingham, F. (2021). ultralytics/yolov5: v5.0—YOLOv5-P6 1280 models, AWS, Supervise.ly and YouTube integrations.
- Girshick, R.B., Donahue, J., Darrell, T., Malik, J., & Berkeley, U. (2013). Rich feature hierarchies for accurate object detection and semantic segmentation Tech report.
- He, K., Zhang, X., Ren, S., & Sun, J. (2014). Spatial Pyramid Pooling in Deep Convolutional Networks for Visual Recognition. IEEE Transactions on Pattern Analysis and Machine Intelligence, 37, 1904-1916. [CrossRef]
- Ren, S., He, K., Girshick, R.B., & Sun, J. (2015). Faster R-CNN: Towards Real-Time Object Detection with Region Proposal Networks. IEEE Transactions on Pattern Analysis and Machine Intelligence, 39, 1137-1149. [CrossRef]
- Xue, B., Sun, C., Chu, H., Meng, Q., & Jiao, S. (2020). Method of Electronic Component Location, Grasping and Inserting Based on Machine Vision. 2020 International Wireless Communications and Mobile Computing (IWCMC), 1968-1971.
- Wang, C., Bochkovskiy, A., & Liao, H.M. (2022). YOLOv7: Trainable Bag-of-Freebies Sets New State-of-the-Art for Real-Time Object Detectors. 2023 IEEE/CVF Conference on Computer Vision and Pattern Recognition (CVPR), 7464-7475.
- Li, Y.; Wang, Y.; Lu, L.; An, Q. YOD-SLAM: An Indoor Dynamic VSLAM Algorithm Based on the YOLOv8 Model and Depth Information. Electronics 2024, 13, 3633. [CrossRef]
- Ge, Z., Liu, S., Wang, F., Li, Z., & Sun, J. (2021). YOLOX: Exceeding YOLO Series in 2021. ArXiv, abs/2107.08430.
- Redmon, J., Divvala, S.K., Girshick, R.B., & Farhadi, A. (2015). You Only Look Once: Unified, Real-Time Object Detection. 2016 IEEE Conference on Computer Vision and Pattern Recognition (CVPR), 779-788.
- Zhu, X., Lyu, S., Wang, X., & Zhao, Q. (2021). TPH-YOLOv5: Improved YOLOv5 Based on Transformer Prediction Head for Object Detection on Drone-captured Scenarios. 2021 IEEE/CVF International Conference on Computer Vision Workshops (ICCVW), 2778-2788. [CrossRef]
- Wang, C., Liao, H.M., Yeh, I., Wu, Y., Chen, P., & Hsieh, J. (2019). CSPNet: A New Backbone that can Enhance Learning Capability of CNN. 2020 IEEE/CVF Conference on Computer Vision and Pattern Recognition Workshops (CVPRW), 1571-1580.
- Srinivas, A., Lin, T., Parmar, N., Shlens, J., Abbeel, P., & Vaswani, A. (2021). Bottleneck Transformers for Visual Recognition. 2021 IEEE/CVF Conference on Computer Vision and Pattern Recognition (CVPR), 16514-16524.
- Cai, L., Janowicz, K., Mai, G., Yan, B., & Zhu, R. (2020). Traffic transformer: Capturing the continuity and periodicity of time series for traffic forecasting. Transactions in GIS, 24, 736–755. [CrossRef]
- Ge, Z., Liu, S., Wang, F., Li, Z., & Sun, J. (2021). YOLOX: Exceeding YOLO Series in 2021. ArXiv, abs/2107.08430.
- Huang, Z., & Wang, J. (2019). DC-SPP-YOLO: Dense Connection and Spatial Pyramid Pooling Based YOLO for Object Detection. Inf. Sci., 522, 241-258. [CrossRef]
- Zhang, Y., Li, H., Wang, R., Zhang, M., & Hu, X. (2022). Constrained-SIoU: A Metric for Horizontal Candidates in Multi-Oriented Object Detection. IEEE Journal of Selected Topics in Applied Earth Observations and Remote Sensing, 15, 956-967.
- Zheng, Z., Wang, P., Ren, D., Liu, W., Ye, R., Hu, Q., & Zuo, W. (2020). Enhancing Geometric Factors in Model Learning and Inference for Object Detection and Instance Segmentation. IEEE Transactions on Cybernetics, 52, 8574-8586. [CrossRef]
|
Disclaimer/Publisher’s Note: The statements, opinions and data contained in all publications are solely those of the individual author(s) and contributor(s) and not of MDPI and/or the editor(s). MDPI and/or the editor(s) disclaim responsibility for any injury to people or property resulting from any ideas, methods, instructions or products referred to in the content. |
© 2024 by the authors. Licensee MDPI, Basel, Switzerland. This article is an open access article distributed under the terms and conditions of the Creative Commons Attribution (CC BY) license (http://creativecommons.org/licenses/by/4.0/).
