1. Introduction
New Psychoactive Substances (NPS) represent a large class of compounds designed to reproduce the pharmacological effects of classic drugs of abuse, bypassing antidrug laws due to differences in the chemical structures with the already scheduled illicit substances [
1]. In particular, the class of New Synthetic Opioids (NSOs) has gained the attention of scientists and law enforcement in the last decade due to their extreme toxicity and the increasing number of related fatalities. Among those, fentanyl represents the major global threat, causing more than 70,000 yearly overdose deaths in the USA (the so-called “fentanyl epidemics” in North America) [
2]. In response to this health emergency, numerous strategies and political actions were taken to accelerate the risk assessment and the scheduling process for this illicit drug and its analogues. However, the void left by the regulated fentanyl analogues was rapidly filled by the newly emerged NSO sub-class of benzimidazole opioids, also called nitazenes, which emerged on the illicit market in 2019 [
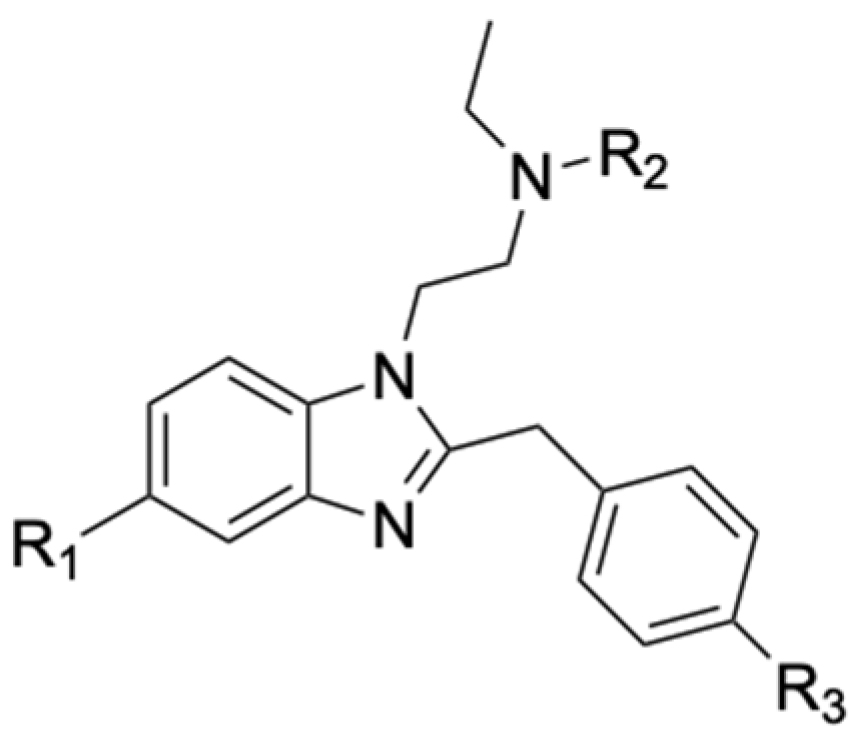
3]. Nitazenes general structure is characterized by a benzimidazole ring with an ethylamine in position 1 and a substituted benzyl group in position 2 of the ring (
Figure 1).
These substances exert their pharmacological activity through the binding with the µ-opioid receptors, producing analgesia, sedation, euphoria, respiratory depression and strong addiction as the main effects. A pharmaceutical company first synthesized Nitazenes to investigate their analgesic effects for medicinal purposes; however, they were never approved due to the narrow therapeutic window, the significant toxic effects and the risk of abuse or addiction [
4]. The first illicitly marketed nitazene was etonitazene, found as brownish powder in late 1960s in Italy [
1]. Lately, isotonitazene was identified in the Belgian illicit market and this led the European Union Drugs Agency (EUDA) to formally declare this compound as the first nitazene in circulation [
3]. The first isotonitazene fatal intoxication was reported in Switzerland in 2019 [
5]. Nowadays, other nitazene analogues are etazene, protonitazene, butonitazene, flunitazene, etonitazepyne and etonitazepipne which were reported in the literature as related to fatal and non-fatal intoxications [
6,
7]. According to the United Nations Office on Drugs and Crime (UNODC), 83 NSOs were reported in 2024, comprising 8 nitazenes [
8].
Nitazenes represent a challenge for analytical toxicologists for several reasons. Due to their extreme potency, low doses are usually consumed, resulting in low concentrations in biological matrices. Consequently, analytical methods should be extremely sensitive, allowing the quantification of concentrations lower than 1 ng/mL. As a new sub-class of NPS, nitazenes pharmacokinetics is poorly investigated, increasing the difficulty of their identification in real intoxication cases due to the lack of knowledge of the most appropriate biomarkers. Finally, little is known about their stability in biological matrices. The degradation assessment represents an important parameter to determine the optimal storage conditions, time between sample collection and analysis, and the best sample to conduct nitazenes identification. Walton et al. investigated the stability of 9 nitazenes at 10 ng/mL in blood samples. A degradation pattern was observed at room temperature after 14 days for isotonitazene, protonitazene, while the same compounds showed no degradation when stored at 4°C [
9]. Conversely, Ververi et al. [
10], observed that room temperature was the best sample storage condition for dried blood spots (DBS). DBS is a micro sampling technique which is raising particular interest since it is less invasive, easy to use, less expensive compared to classic blood sampling, and it requires small blood volumes (10-50 µL) [
11].
An interesting review available on literature examined several analytical techniques used for nitazenes analysis in biological matrices, such as gas chromatography-mass spectrometry (GC-MS), gas chromatography-tandem mass spectrometry (GC-MS/MS), liquid chromatography-mass spectrometry (LC-MS), liquid chromatography-tandem mass spectrometry (LC-MS/MS) and liquid chromatography-high resolution mass spectrometry (LC-HRMS) [
12].
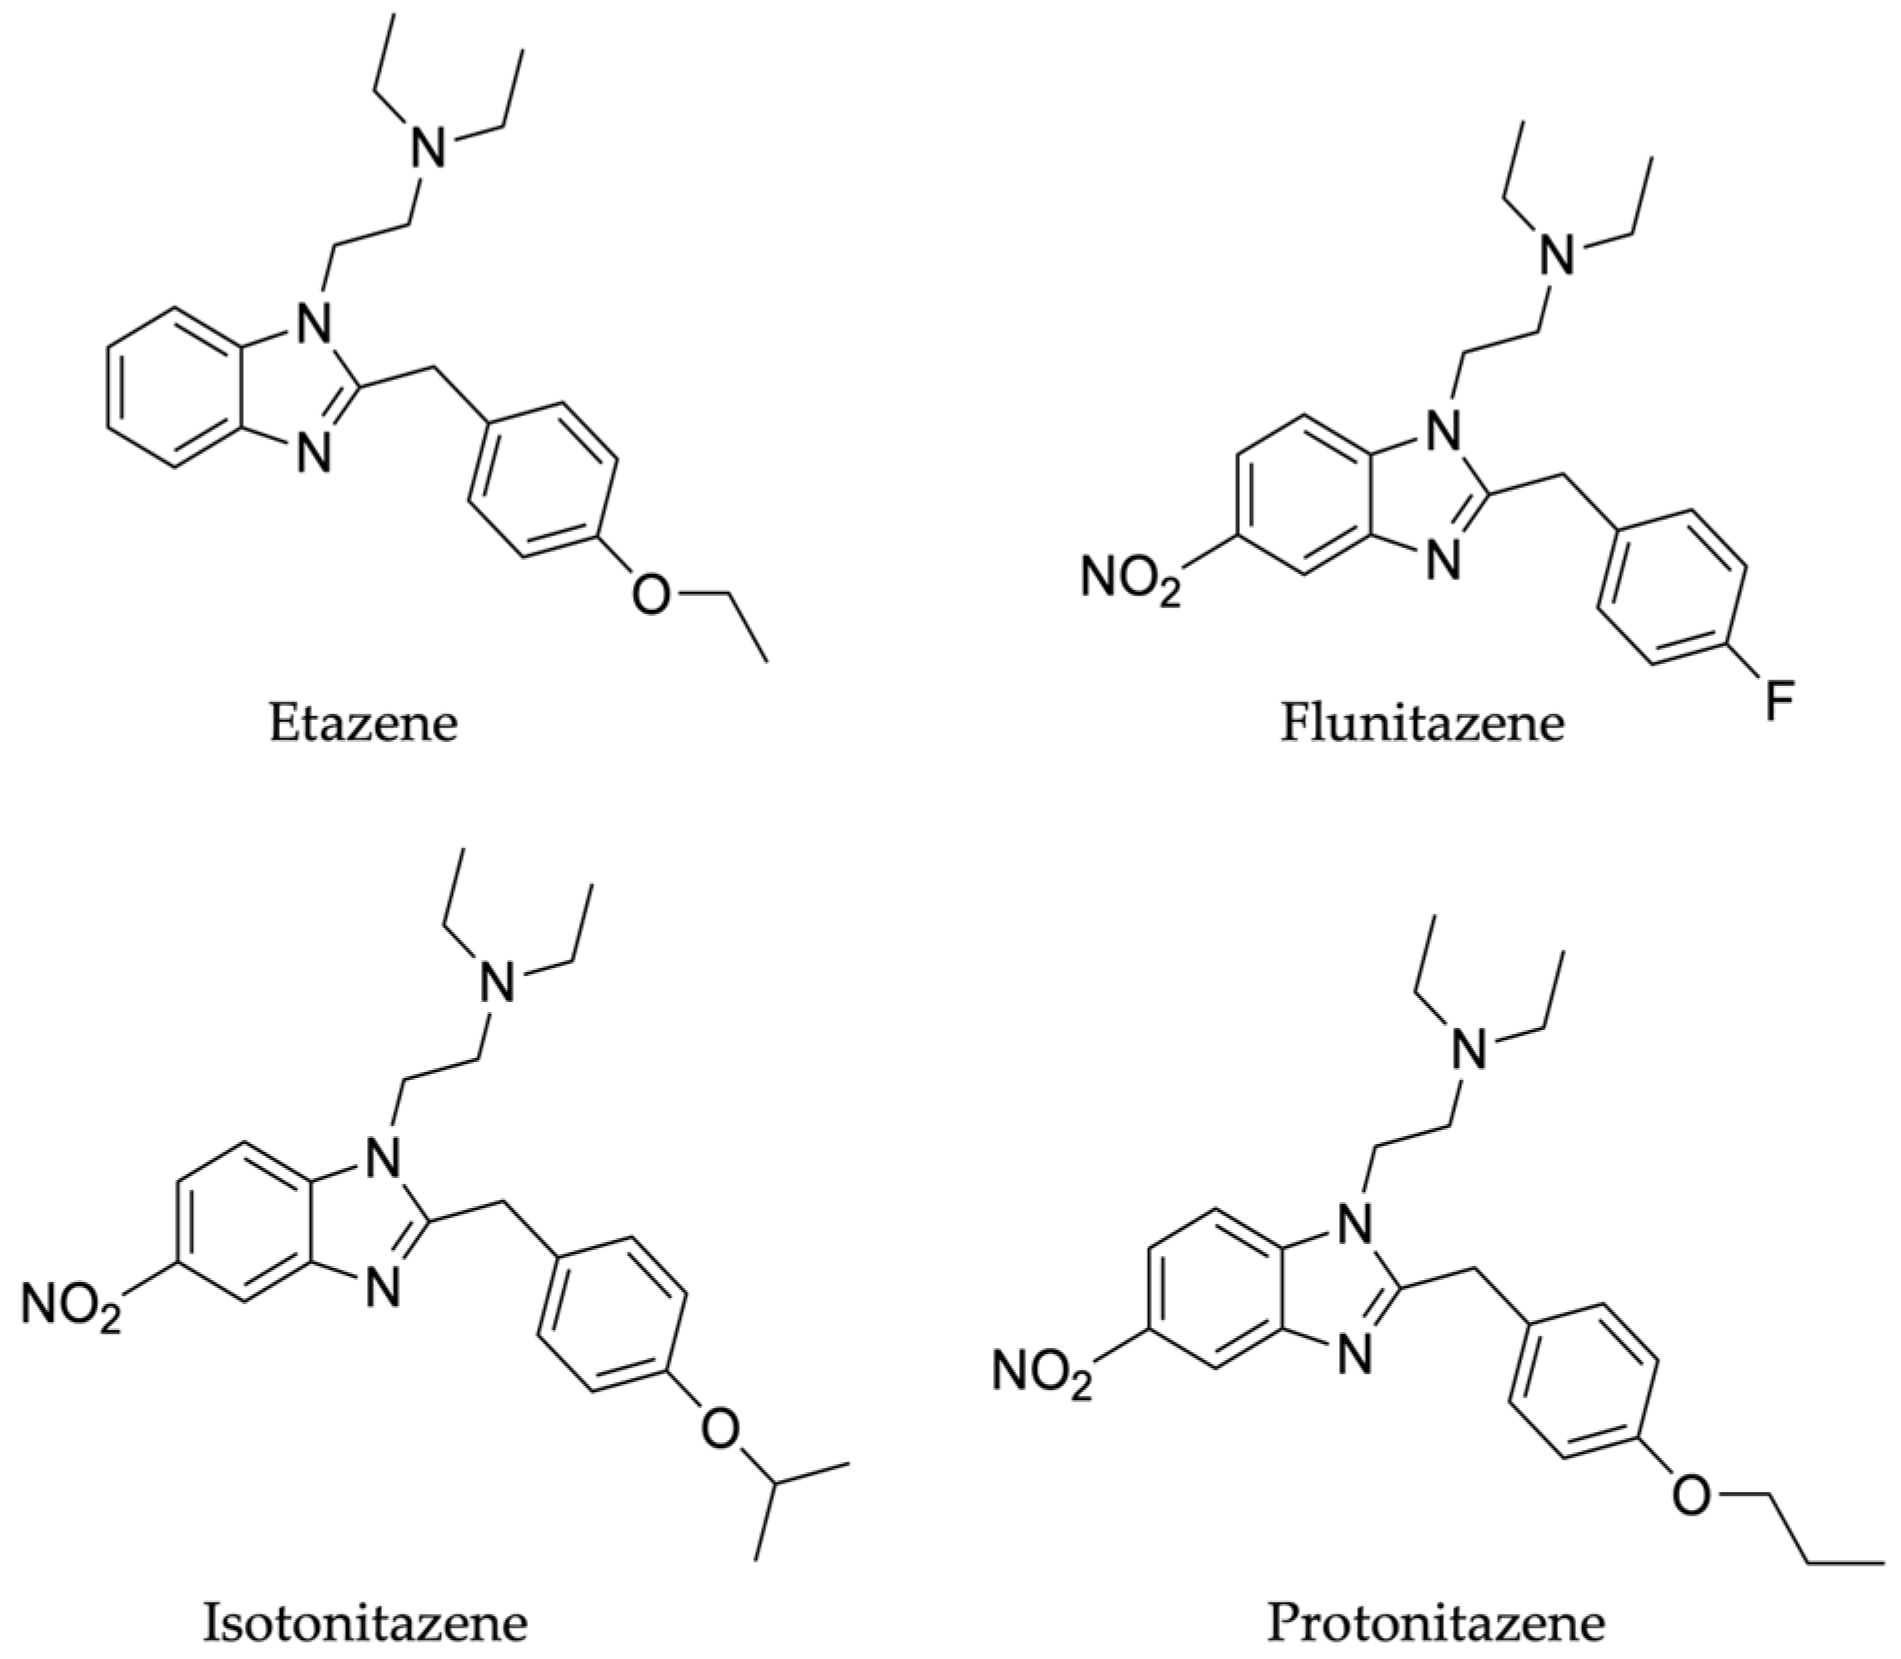
The aims of this study were to develop and validate an analytical method for the quantification of 4 nitazenes (etazene, flunitazene, isotonitazene and protonitazene, (
Figure 2) in DBS and to assess their stability at 4°C and room temperature, over a 30-day period.
2. Results
2.1. Method Optimization and Validation
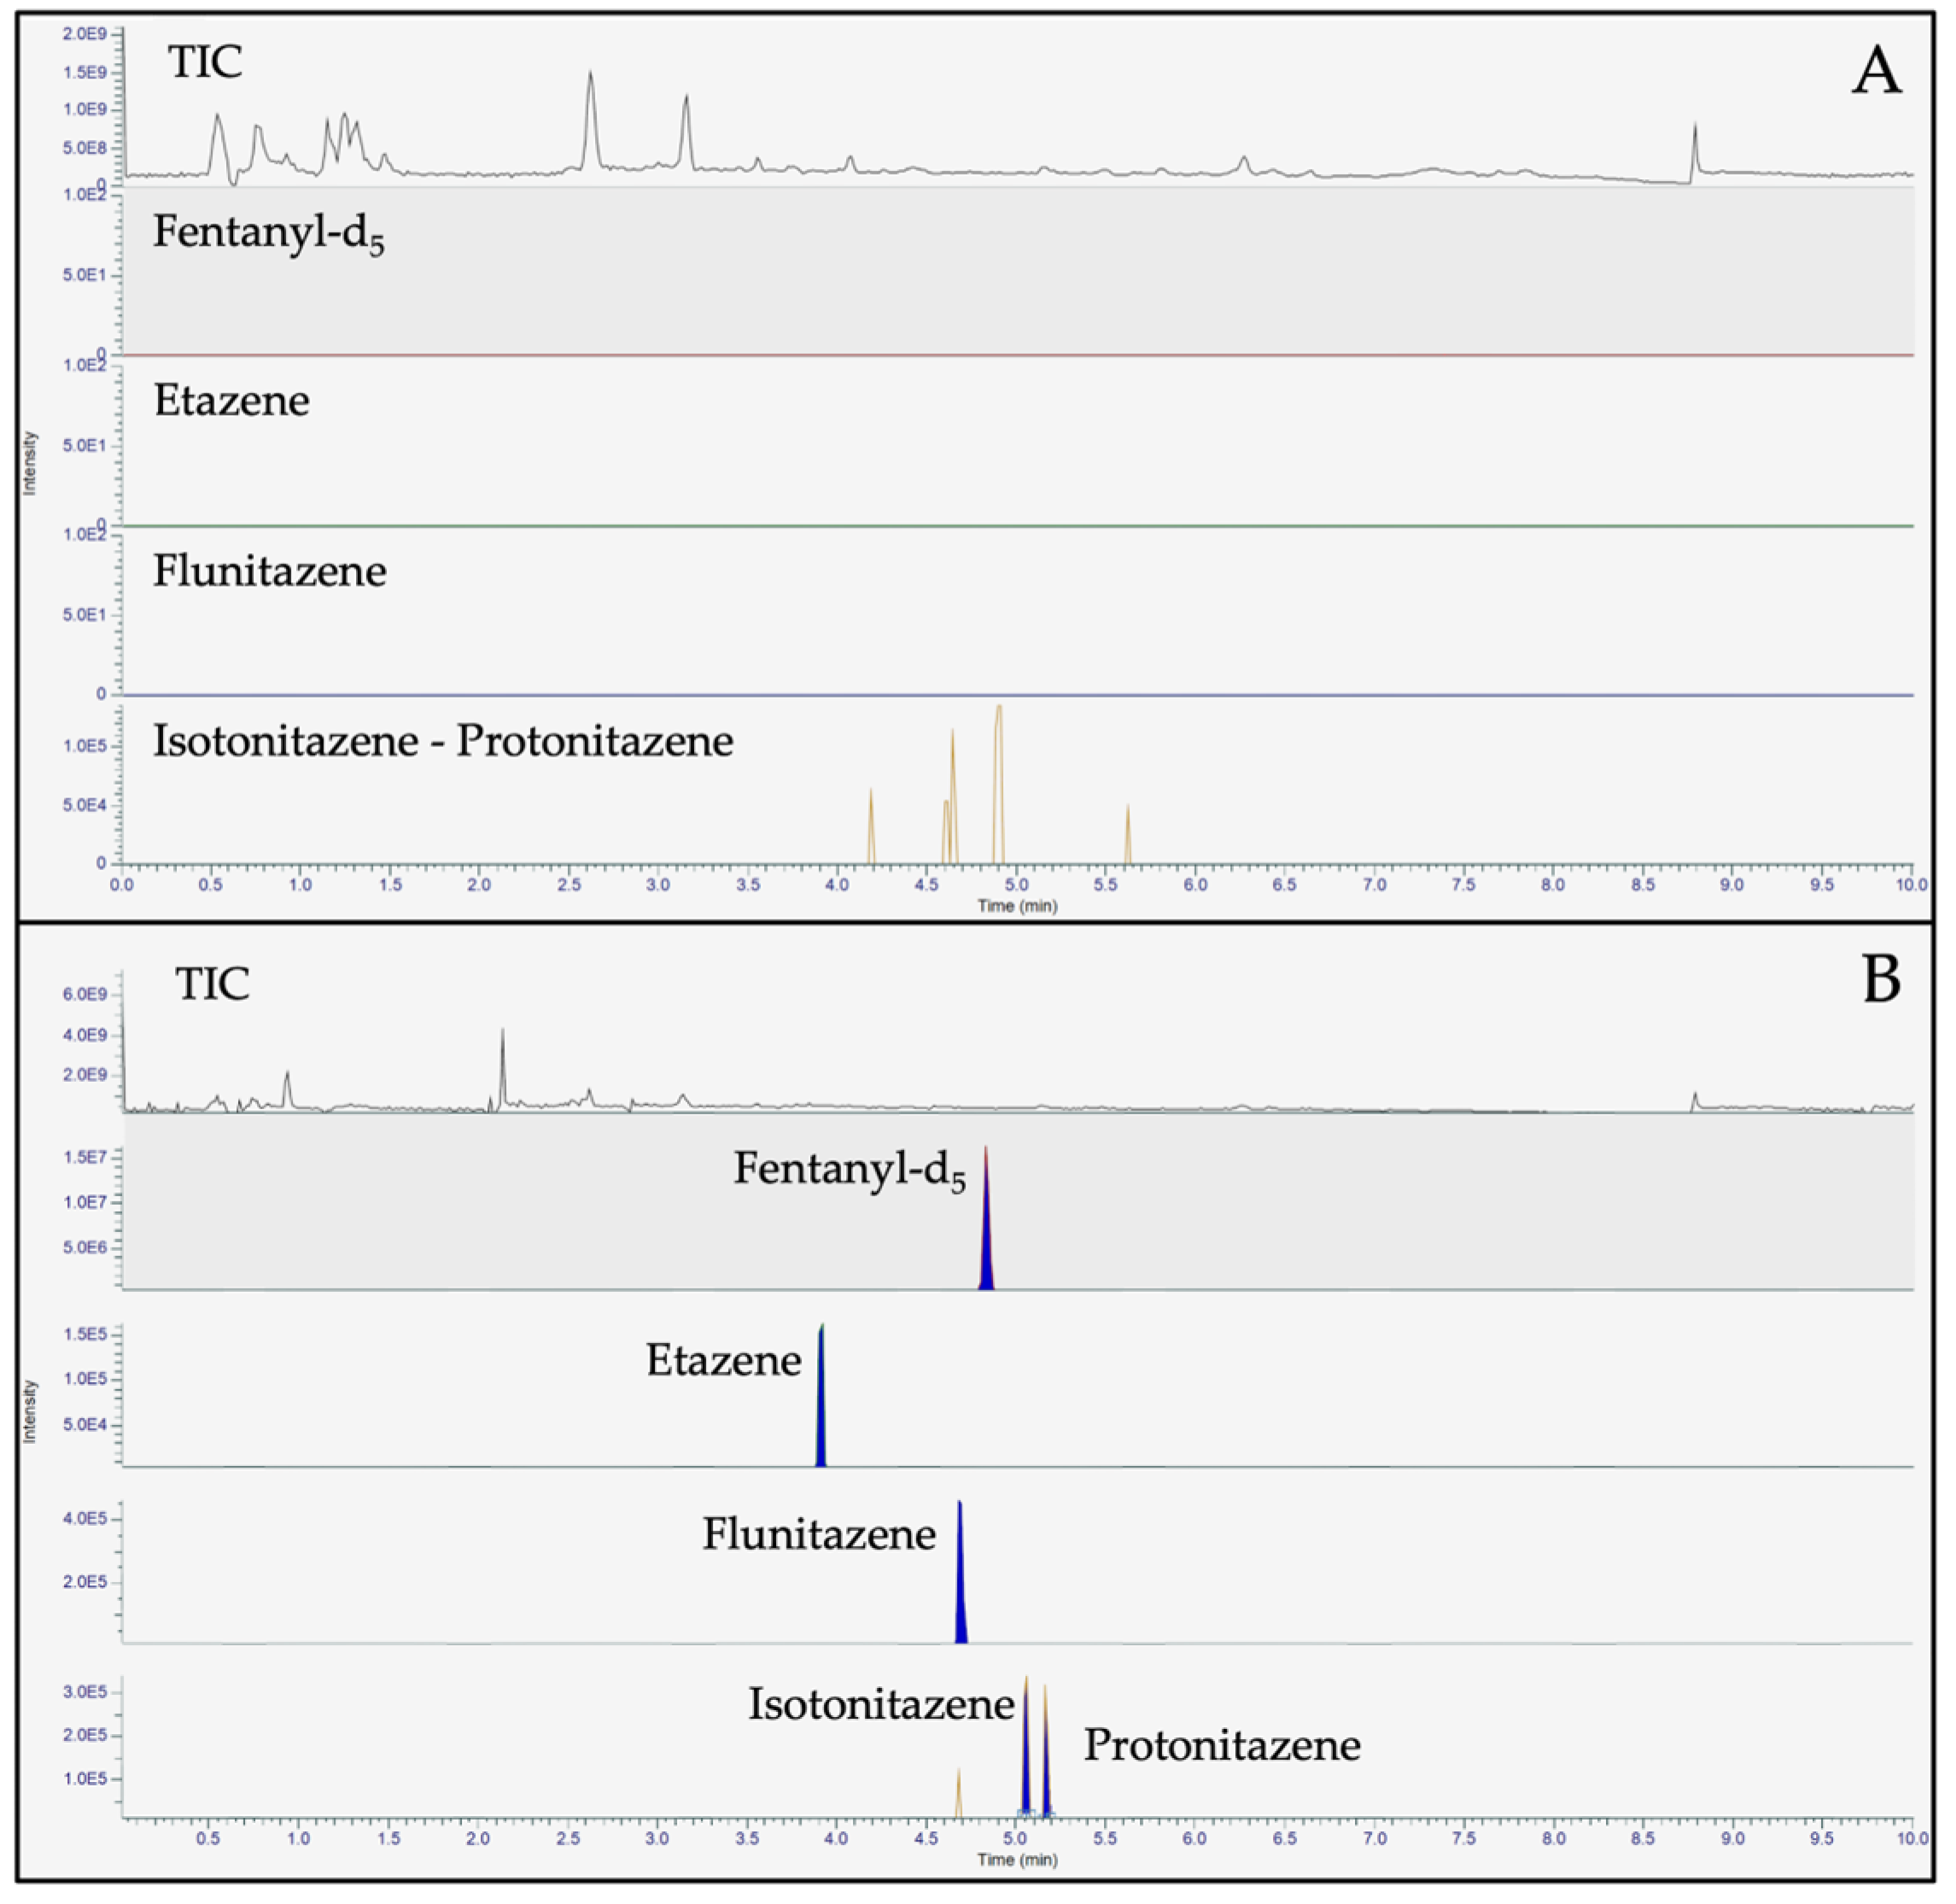
The ultra high-performance liquid chromatography (UHPLC) conditions were optimized by selecting the chromatographic column, testing the mobile phases composition and the elution gradient that enabled baseline separation of the 4 nitazenes under investigation. The Accucore™ Phenyl Hexyl (100 x 2.1 mm, 2.6 µm, ThermoFischer Scientific) and the FORCE Biphenyl columns (50 x 3.0 mm, 3 µm, Restek Corporation) were tested. Although a good baseline separation and peak shape were observed with both columns, the Biphenyl one was chosen based on a short run-time with the satisfying obtained resolution. To this concern, the chromatographic resolution is fundamental to distinguish isotonitazene and protonitazene, which present the same [M+H]
+ exact mass and a similar fragmentation pattern. Then, different mobile phase compositions were investigated during method development. Aqueous 0.1% formic acid (mobile phase A, MPA) and 0.1% formic acid in acetonitrile (mobile phase B, MPB), proved to be the best mobile phases composition for the baseline resolution of isotonitazene and protonitazene. Finally, the elution gradient was optimized to allow the best chromatographic separation and acceptable reproducibility in a short time.
Figure 3 shows representative chromatograms of the 4 nitazenes under investigation.
Mass spectrometric conditions were optimized by direct infusion of working standards of each analyte in the HESI source. Once obtained the exact mass at [M+H]
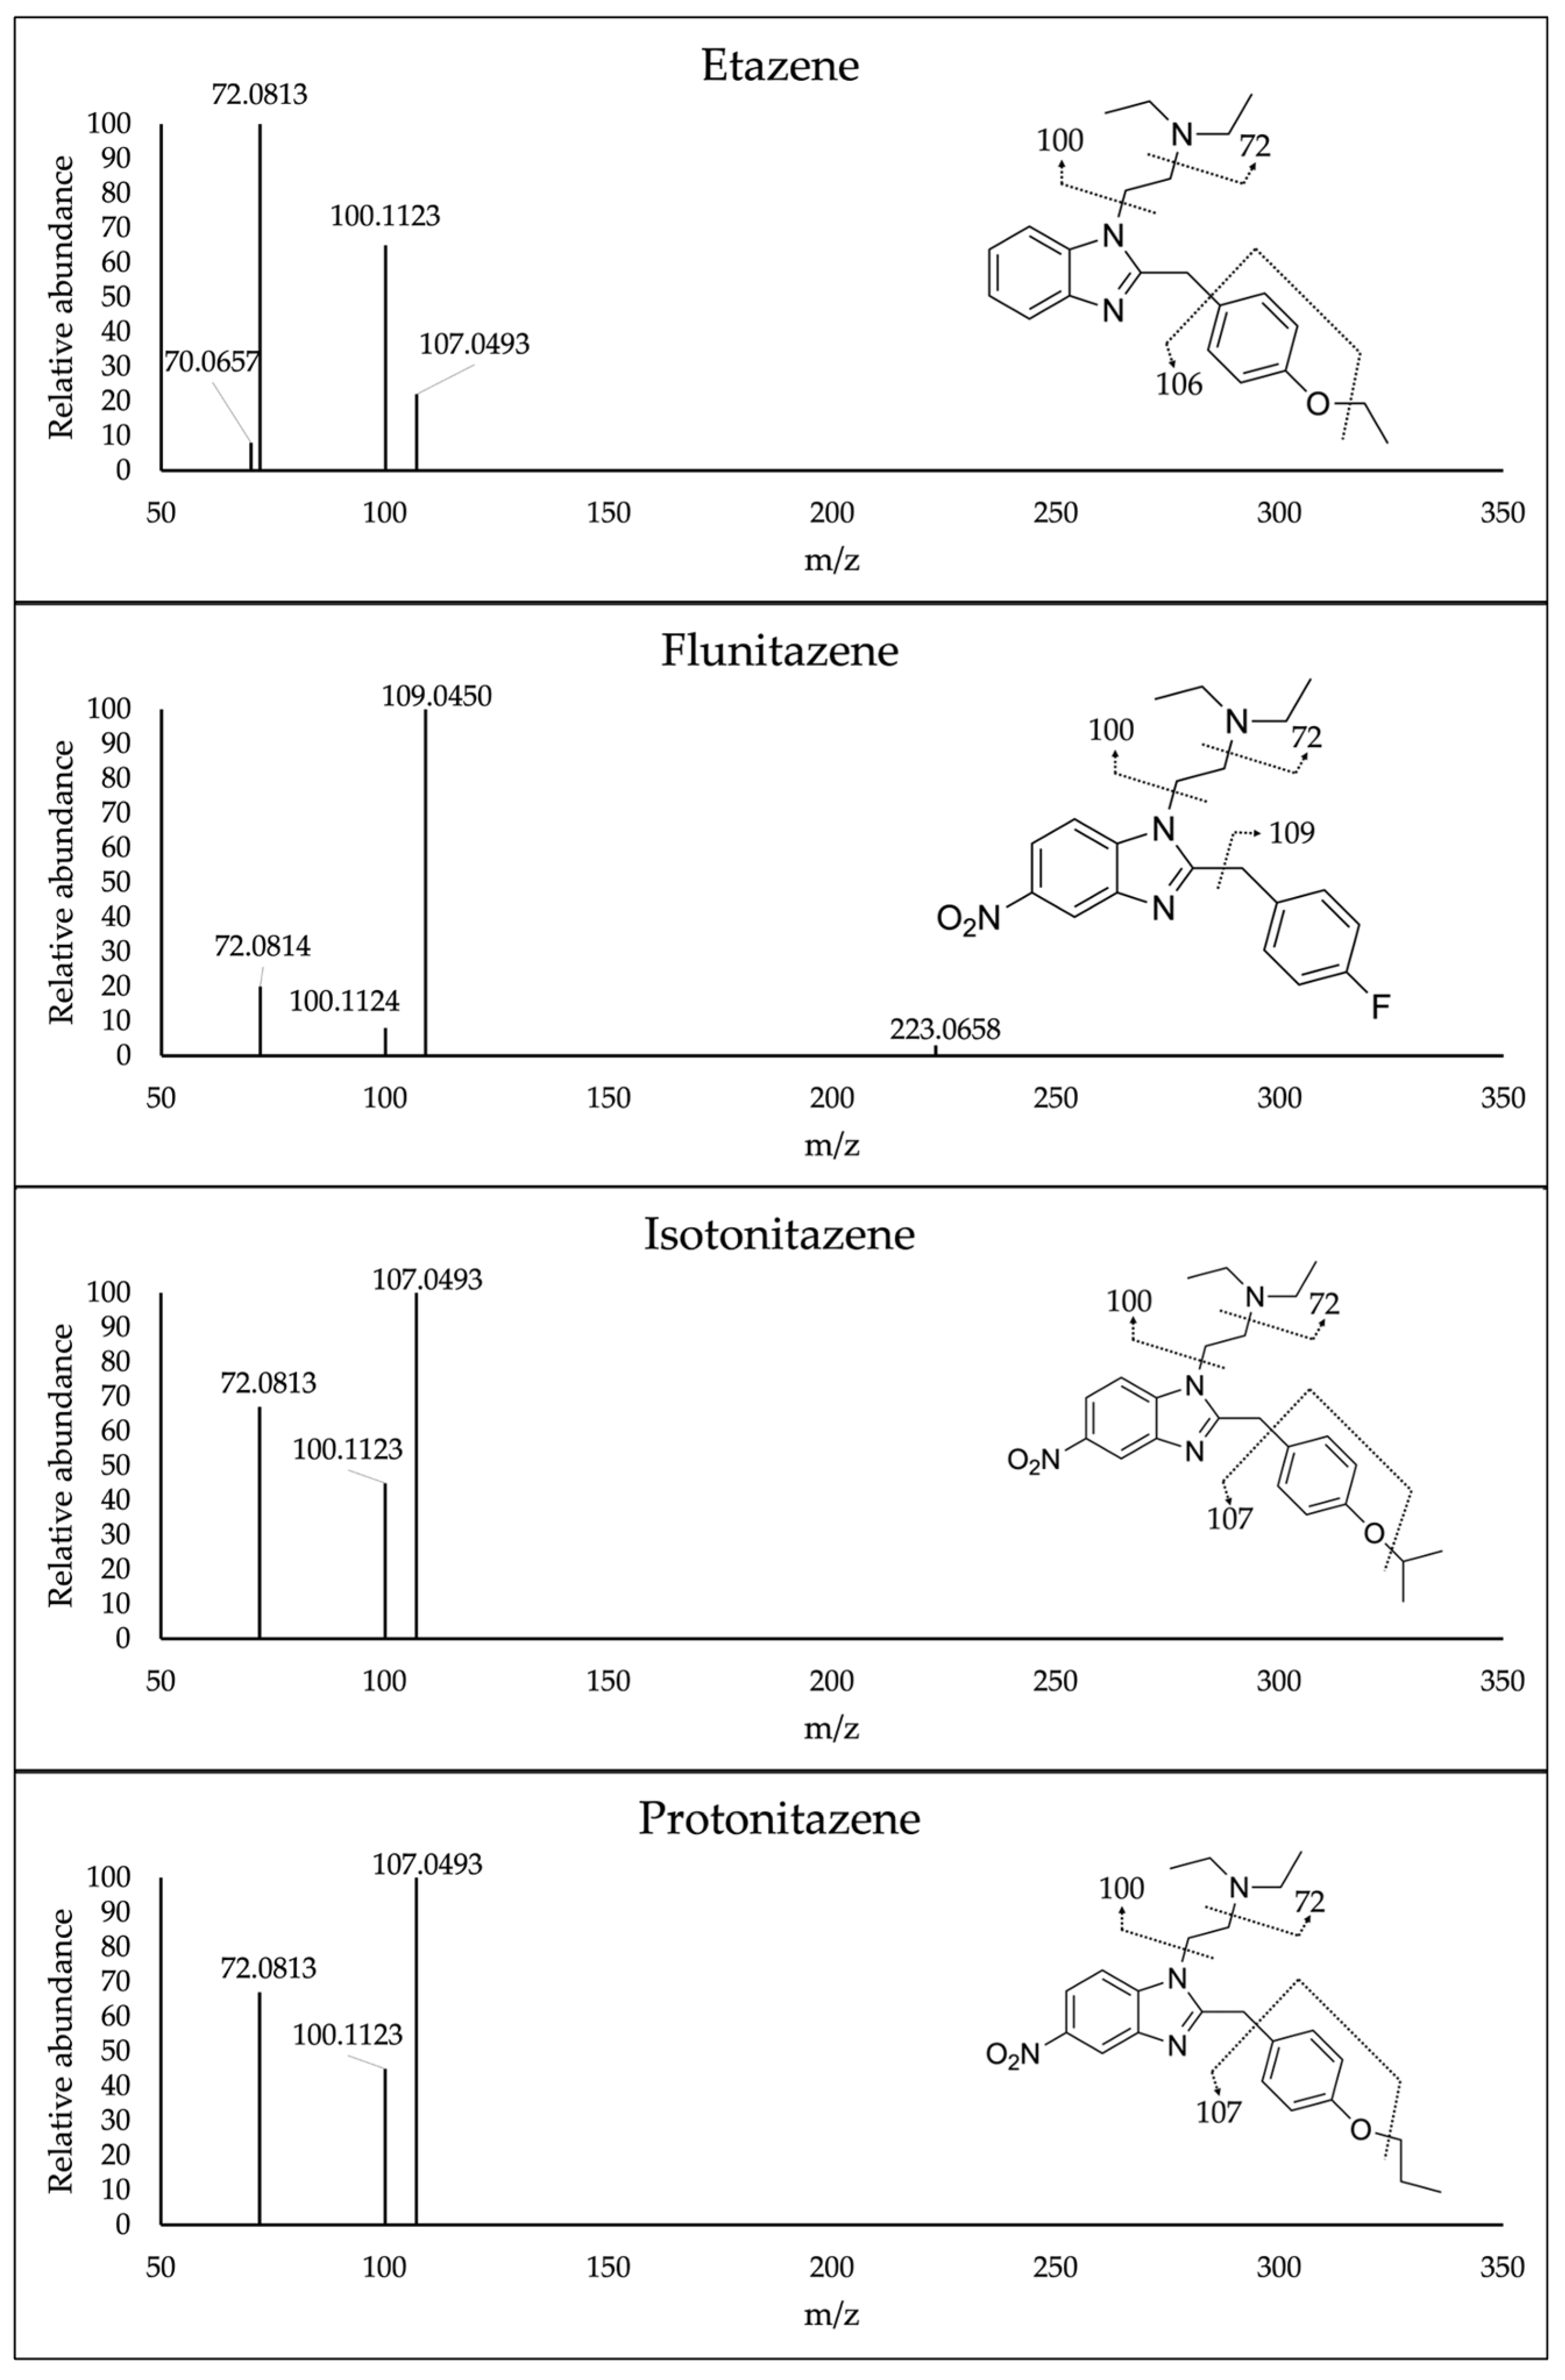
+, increasing collision energies were applied to select the best fragmentation pattern for each compound. The best fragmentation pattern was obtained at 70 NCE for all the compounds. Finally, the HESI source parameters, such as capillary voltage and temperature, were optimized by injecting pure standards mixture in MPA:MPB 80:20 v/v into the chromatographic system to gain the optimal ionization of the analytes and increase the sensitivity of the method. Mass spectra of all analytes under investigation are reported in
Figure 4. Different extraction solvents were investigated for sample preparation, such as acetonitrile, acetonitrile:methanol 1:1 (v/v), isopropanol, chloroform:isopropanol 9:1 (v/v) and methanol; this latter provided the highest recovery percentages.
The newly developed analytical method was validated according to the Organization of Scientific Committee (OSAC) for Forensic Sciences guidelines [
13]. Specifically, the method proved to have a good sensitivity, with a limit of detection (LOD) of 0.25 ng/mL for etazene and flunitazene, whereas 0.5 ng/mL for isotonitazene and protonitazene; limit of quantification (LOQ) was 0.5 ng/mL, for all the analytes. Linearity was assessed in the range 1-20 ng/mL, also confirmed by the Mandel test [
14]; bias and precision were within the acceptable criteria. No carryover or interferences were observed during the validation experiments. Recovery and matrix effect were within the range 84-117% and 80-112%, respectively. All the validation parameters are reported in
Table 1.
2.2. Nitazenes Stability
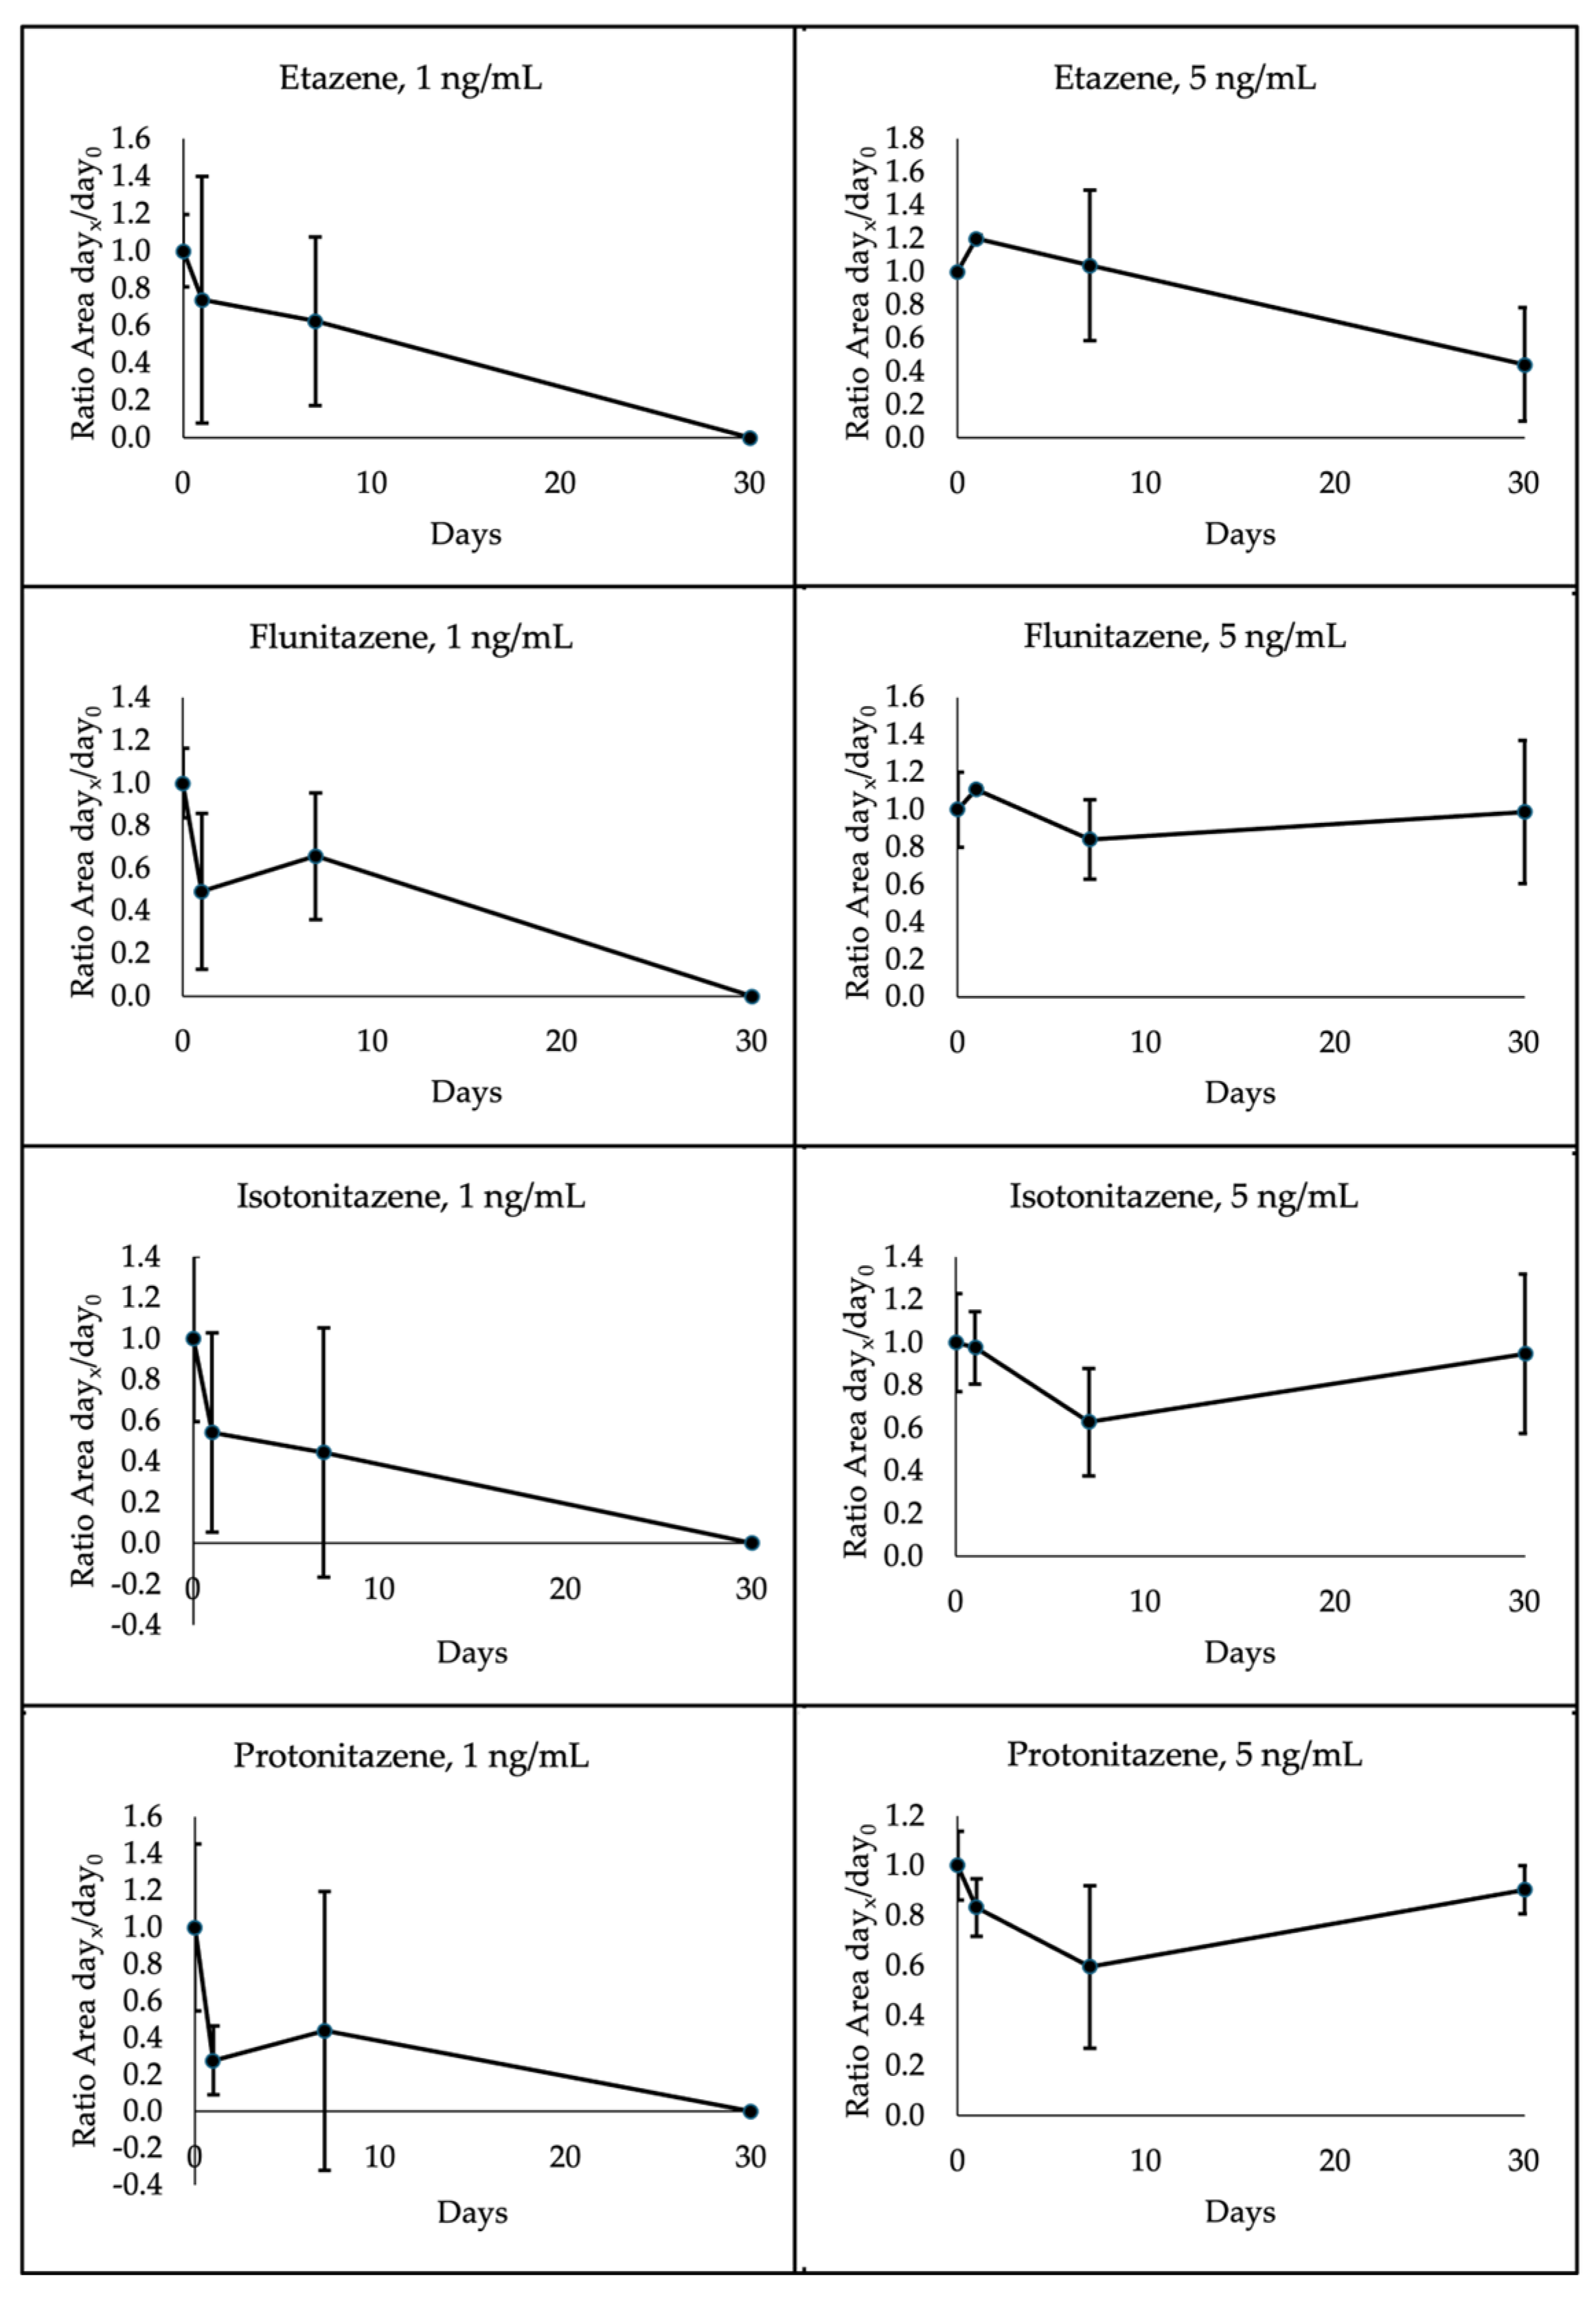
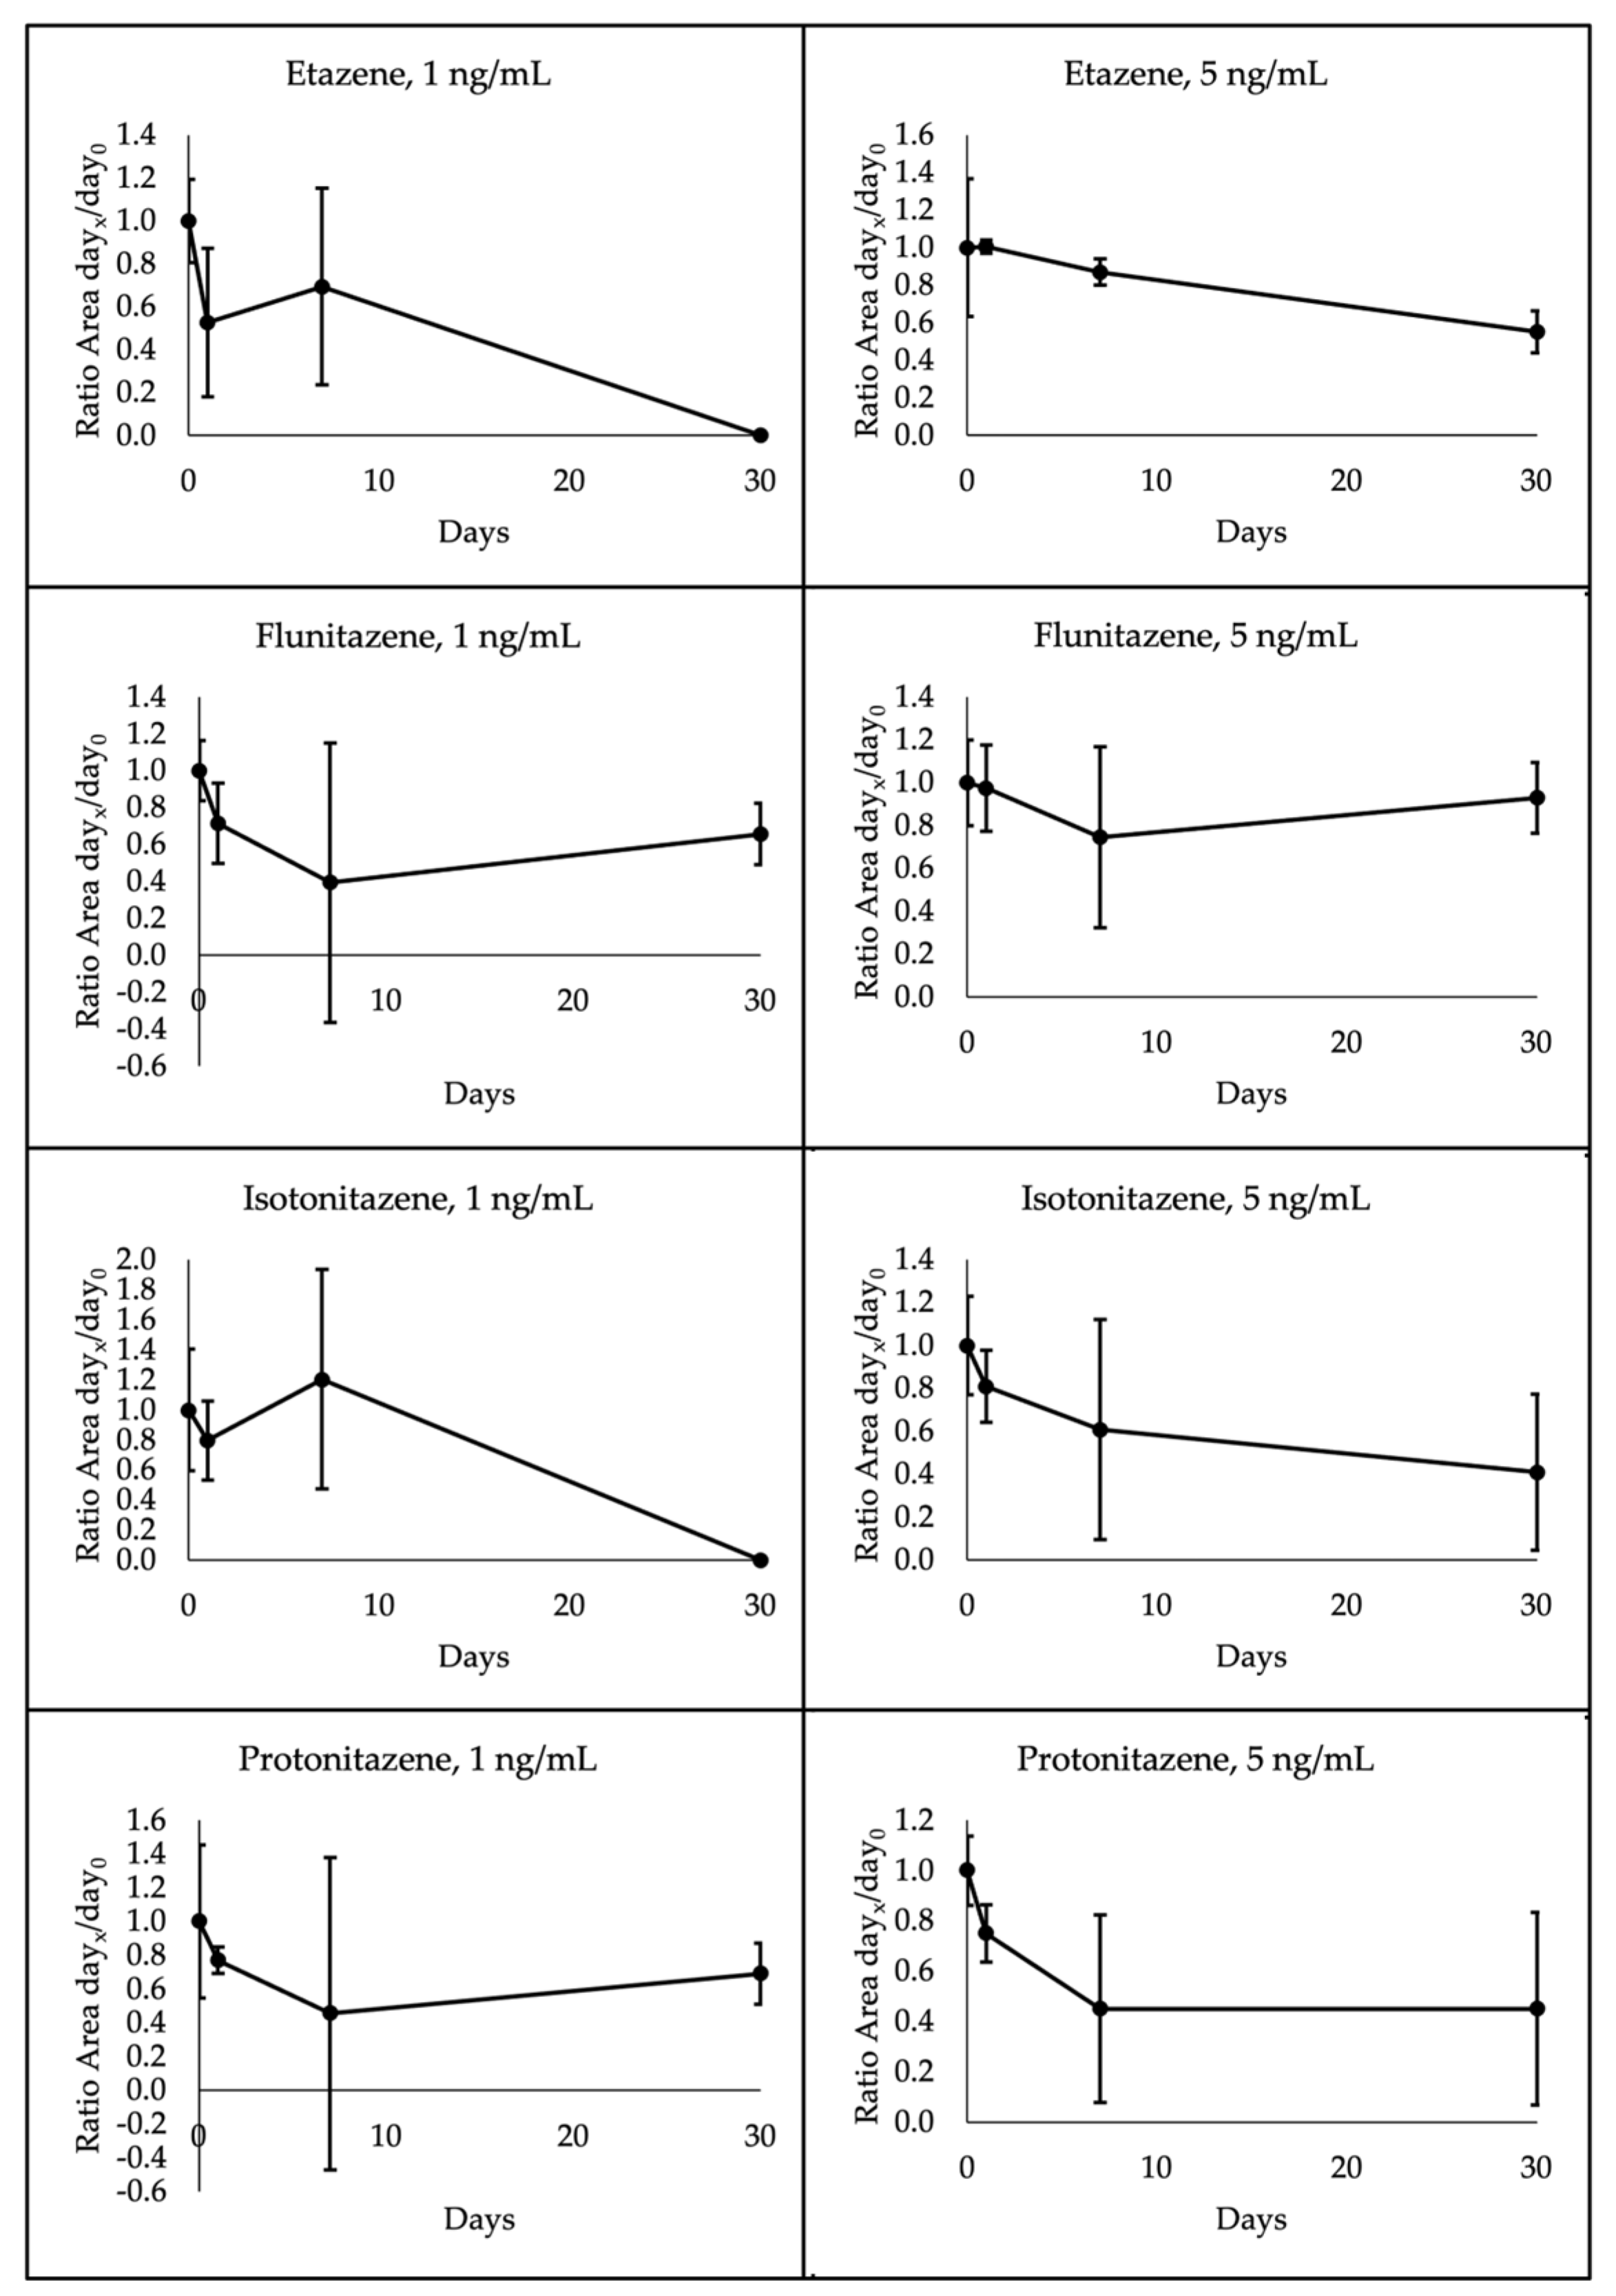
The 4 nitazenes under investigation showed different degradation patterns depending on the temperature storage and concentration. Specifically, all 1 ng/mL analytes were below the LOQ at 30 days when stored at room temperature. Etazene and isotonitazene presented the same degradation pattern also at 4°C, whereas flunitazene and protonitazene proved to be more stable. Indeed, these latter decreased to a mean of 66% and 69% initial concentration, respectively, after 30 days. A different pattern was observed for 5 ng/mL analytes. In this case, etazene, flunitazene, isotonitazene and protonitazene were quantified at a mean of 44%, 99%, 95% and 90% initial concentration, respectively, after 30 days at room temperature; when stored at 4°C, etazene, flunitazene, isotonitazene and protonitazene were assessed at a mean of 55%, 93%, 41% and 45%, respectively. A high variability was observed within each group of samples, as shown in
Figure 5;
Figure 6 through the standard deviation bars.
3. Discussion
The developed and validated analytical method proved to be suitable for the analysis of the 4 nitazenes under investigation. It also allowed the separation of isomers isotonitazene and protonitazene, which only differs for the -isopropyl (isotonitazene) and -propyl (protonitazene) bound to the oxygen in the benzene ring.
In this study, DBS was investigated as a promising micro-sampling technique in pharmacology and toxicology fields due to its numerous advantages; indeed, this micro sampling technique is easy to use, cheap, non-invasive and it requires low volume. Furthermore, DBS sampling does not necessitate special equipment or trained healthcare professionals for sampling, and also allows to collect samples on the roadside, at crime scenes, and workplace drug testing. On the other hand, DBS also presents some disadvantages. Among these, the low collected blood volume requires sensitive analytical methods for the detection of substances. Moreover, the hematocrit effect may affect the spreading of capillary blood in the DBS card [
15]. Sample collection can also be challenging due to the time for drying blood before storage (about 3 hours).
During the method development, particular attention was given to the internal standard (ISTD) incorporation to DBS. Indeed, this step is crucial for compensating any variability during the analytical process and for the quantification of the analytes under investigation. Due to the unavailability of deuterated nitazenes standards, different stable isotope standars were tested to achieve the best validation parameters. In this concern, fentanyl-d
5 was chosen as ISTD due to the similar physicochemical properties with nitazenes and the intermediate retention time between the analytes under investigation.Furthermore, several alternatives are available for the ISTD incorporation to DBS, such as spraying before extraction, or precoating the DBS with ISTD [
16,
17]. However, these techniques are not available in most laboratories and require high costs. For this reason, we decided to add ISTD to the methanolic solution before extraction, as reported in many DBS-based analytical methods [
18,
19].
The proposed investigation represents one of the first studies on nitazenes stability in DBS samples; indeed, few studies are available in the literature. Ververi et al. [
10] investigated the stability of 9 nitazenes in DBS at -20°C, 4°C and room temperature over 28 days. Three concentrations were examined (1, 10 and 50 ng/mL); results showed that room temperature was the best storage condition over 28 days, with the lowest variability. Different concentrations and different time points were studied in the present research, which were chosen considering the high nitazenes pharmacological potency and the low concentrations usually detected in biological samples of consumers [
7]. For this reason, higher concentrations were not evaluated. In this study, results highlighted that 1 ng/mL nitazenes were not detectable after 30 days when stored at room temperature; this suggests performing analyses of DBS samples within 7 days from the samples’ arrival. Differently, an increase in stability was observed depending on the concentration; indeed, 5 ng/mL samples proved to be less unstable even at room temperature. However, considering the unknown content of samples, it is suggested to perform analysis within the first week, if stored at this condition. Etazene and isotonitazene at 1 ng/ml were not detected at day 30 even when stored at 4°C, whereas flunitazene and protonitazene presented a concentration less than half of the initial concentration. As expected, 5 ng/mL showed higher stability; however, analysis should be performed within 1 week from the sample arrival also when stored at refrigerated temperature.
The stability of nitazenes in blood samples was assessed by Walton et al., investigating three storage conditions (-20°C, 4°C and room temperature) at 10 ng/mL. Isotonitazene, protonitazene and flunitazene proved to be stable at 4°C over 60 days, whereas isotonitazene and protonitazene were observed to be unstable at room temperature after the fourteenth days of storage [
9]. This higher stability may be a consequence of several factors. First, we observed that the degradation pattern of nitazenes was affected by the concentration; thus, the higher stability may be a consequence of the higher tested concentrations. Then, Walton et al. performed the study in 500 µL blood samples; besides the differences between blood samples and DBS, the higher volume may contribute to the stability of these analytes.
The obtained results showed a high variability of ratios in the same group of samples. However, this is not due to analytical method imprecision, since the validation process showed that bias and precision met the OSAC guidelines criteria. One of the possible reasons explaining the variability may be the hematocrit; as reported by Deprez et al. [
20], this parameter produced a bias in the results during the development of an analytical method for the determination of 4 immunosuppressant drugs in DBS. Consequently, authors set up a correction factor that allowed to overcome the hematocrit [
20]. However, further studies need to be performed to study the possible factors affecting the variability.
Stability studies play a crucial role in pharmacotoxicological laboratories; indeed, comprehensive knowledge of the degradation pattern of analytes in specific matrices is required for adopting the best practices. Notably, we demonstrated that etazene, flunitazene, isotonitazene and protonitazene were not detectable after 30 days when stored at room temperature; this can help to interpret results in cases involving the analysis of nitazenes in DBS samples and to avoid false-negative results.
4. Materials and Methods
4.1. Chemicals and Reagents
Flunitazene, etazene, protonitazene, isotonitazene and fentanyl-d5 analytical standards were obtained from Cayman Chemicals (Ann Arbour, MI, US). LC-MS grade acetonitrile, methanol, water and analytical grade formic acide were supplied from Carlo Erba (Cornaredo, Italy). QIAGEN QIAcard FTA DMPK DBS cards were purchased from Fisher Scientific (Hampton, NH, USA).
4.2. Calibrators and Quality Control (QC) Samples
Working standard solutions for calibrators containing the nitazenes under investigation at 30, 120, 180, 360 and 600 ng/mL were prepared by appropriate methanolic dilution of stock solution. Similarly, working standards for quality control (QC) samples were prepared at 90, 240 and 480 ng/mL for low-, medium- and high-QC, respectively.
Fentanyl-d5 solution at 180 ng/mL was prepared by appropriate methanolic dilution of stock solutions.
Pooled drug-free human blood was obtained by 7 different volunteers and used for the preparation of calibrators and QC samples. Considering the capacity of DBS cards, 30 µL blank blood was deposited on each DBS and fortified with 1 µL of the corresponding working standard solution to obtain the 5 calibrators (1, 4, 6, 12 and 20 ng/mL).
Low-, medium- and high-QC samples were set at 3, 8 and 16 ng/mL and were prepared by adding 1 µL of the corresponding working standard solution.
4.3. Stability Study Design
Blank, 1 and 5 ng/mL DBS samples were used for the stability study. Specifically, blank samples were prepared by depositing 30 µL drug-free human blood in the DBS card, without the addition of working standards. Then, 1 µL of 30 ng/mL working standard solution was added to blank DBS for the preparation of 1 ng/mL sample; similarly, 1 µL of 150 ng/mL working standard solution was added to blank DBS to obtain the 5 ng/mL sample. Final concentrations were chosen to fit the usual nitazenes concentrations in this matrix.
Analyte stability was assessed at different storage temperatures (4°C and room temperature) over time (1, 7 and 30 days). Short-term stability (1 day at 4°C and room temperature) was determined to simulate different conditions of sample transportation. Medium- and long-term stability were evaluated at 14 and 30 days, respectively, at 4°C and room temperature. DBS prepared in day 0 were used as control samples to normalize the instability.
4.4. Sample Preparation
DBS was cut and transferred to a clean glass tube, before the addition of 500 µL methanol and 2 µL ISTD. Then, sample was sonicated for 30 min and centrifuged (4000 rpm x 5 min). The methanolic solution was collected, transferred to a clean glass tube and allowed to evaporate under gentle nitrogen stream. The dry residue was reconstituted in 30 µL MPA:MPB 80:20 (v/v), vortexed and centrifuged (4000 rpm x 5 min). Finally, the solution was transferred to an autosampler vial, prior to the injection of 10 µL into the LC-HRMS/MS.
4.5. Instrumental Analysis
Instrumental analyses were performed on a DIONEX UltiMate 3000 liquid chromatographer coupled to a Q Exactive Focus quadrupole-Orbitrap high-resolution mass spectrometry equipped with a heated electrospray ionization (HESI) source (Thermo Scientific, Waltham, MA, USA). The chromatographic separation was carried out through a FORCE Biphenyl column (50 x 3.0 mm, 3 µm) by Restek Corporation (Bellefonte, PA, USA). Aqueous 0.1% formic acid and 0.1% formic acid in acetonitrile were MPA and MPB, respectively. The gradient elution was set as follows: 2% MPB was held for 1 min and increased to 20% until 2.5 min; then, MPB reached 95% until 8 min, prior to restore the initial conditions (2% MPB) in 2 min, until the end of the chromatographic run. Total run time was 10 min.
MS source parameters were set as follows: aux gas flow rate at 3, heated at 50°C; capillary temperature, 250°C; spray voltage, 3.50 kV. MS acquisition mode was FullMS/data dependent MS/MS scan (FullMS/ddMS
2). Full scan resolution was 70,000 m/z, scan range was set at 120-1000 m/z, automatic gain control (AGC) target at 1x10
5 and maximum injection time at 50 ms. A direct infusion of each nitazene and fentanyl-d
5 diluted standard was performed to create an inclusion list. Specifically, the protonated adducts [M+H]
+ were m/z 352.2383 for etazene, m/z 371.1877 for flunitazene, m/z 411.2390 for both isotonitazene and protonitazene, and 342.2588 for fentanyl-d
5 (
Table 2). The ddMS
2 acquisition was set with an isolation window of m/z 1.5, 3 microscans and a normalized collision energy (NCE) of 70. Data were processed using Xcalibur™ (Thermo Scientific, Waltham, MA, USA).
4.6. Method Validation
The method linearity, bias, precision, sensitivity, and carryover were assessed following a five-days protocol proposed by the OSAC guidelines [
13]. Furthermore, recovery and matrix effect were evaluated according to the protocol proposed by Matuszewski et al. [
21].
4.6.1. Linearity
Method linearity was evaluated by assessing 5 calibration curves in the range 1-20 ng/mL on 5 different days, performing each analysis in triplicate. Calibrators were required to be quantified within 15% nominal concentration and the correlation coefficient (r
2) was required to be ≥0.99. In addition, Mandel test was performed to check whether the straight-line function could be used for calibration [
14].
4.6.2. Bias
Bias was assessed by fortifying 3 separate blanks at each QC concentration (low-, medium- and high-QC) over 5 different runs. Samples were required not to exceed ± 20% nominal concentration.
4.6.3. Precision
Each QC sample (low-, medium- and high-QC) was analyzed in triplicate over five different runs performed in the same day and in 5 different days. Precision was evaluated in terms of percent coefficient of variation (%CV) and ± 20% was the acceptable criterion.
4.6.4. Sensitivity
LOD was assessed by spiking blank matrix at the LOQ concentration and diluting 5-, 10-, 20-fold. The lowest concentration at which a chromatographic peak eluted within ± 0.1 min of the average calibrator retention time with a signal-to-noise ratio ≥ 3 was defined as LOD.
LOQ was assessed by spiking blank matrix at the lowest non-zero calibrator. Retention time was required to be within ± 0.1 min, and the quantification was required to be ± 20% nominal concentration.
4.6.6. Carryover
Blank samples were analyzed in triplicate after the highest calibrator to evaluate the carryover. Peaks within ± 0.1 min of the average calibrator retention time were evaluated; if no peaks with a signal-to-noise ratio ≥ 3 eluted in this time window, carryover was negligible.
4.6.7. Recovery and Matrix Effect
Blank matrices were spiked at low-, medium- and high-QC concentration. Three different sets of samples were prepared. Specifically, in set A, the ISTD was added before the extraction step; in set B, the ISTD was added after the extraction and before the evaporation; set C consists of neat standards reconstituted in MPA:MPB 80:20. The mean chromatographic peak area of each analyte was used for the following calculations. Recovery was assessed by dividing set B by set A, whereas matrix effect was determined by dividing set B by set C. Both parameters were required to be within ± 30%.
4.7. Statistical Analysis
The Dixon test (p < 0.05) was performed to detect and exclude outliers in the replicates of each group of samples. Stability testing was assessed by performing a one-way analysis of variance (ANOVA) test.
5. Conclusions
The developed and validated analytical method allowed the determination of etazene, flunitazene, isotonitazene and protonitazene in DBS samples. The stability study highlighted the influence of storage temperature, time and concentration on nitazenes degradation pattern. Indeed, 1 ng/mL nitazenes showed a complete degradation after 30 days when stored at room temperature; the same degradation pattern was observed for etazene and isotonitazene at day 30 when stored at 4°C. Differently, an increased stability was generally observed with the highest tested concentration. Further stability studies may be carried out to investigate the investigated parameters for a longer extent to determine the long-term stability at 4°C for 5 ng/mL samples.
Author Contributions
Conceptualization, S.P. and A.D.T.; methodology, A.D.G and N.L.M.; validation, A.V. and A.D.G.; data curation, A.V., A.D.G., A.D.T and N.L.M.; writing—original draft preparation, A.V., A.D.G, V.A, N.L.M; writing—review and editing, all authors; supervision, A.D.T and N.L.M.; funding, S.P. All authors have read and agreed to the published version of the manuscript.
Funding
This research was funded by the Anti-drug Policies Department of the Italian Government Presidency of the Council of Ministers, through the project “HELP SNAP 2”.
Institutional Review Board Statement
Not applicable.
Informed Consent Statement
Not applicable.
Data Availability Statement
We encourage all authors of articles published in MDPI journals to share their research data. In this section, please provide details regarding where data supporting reported results can be found, including links to publicly archived datasets analyzed or generated during the study. Where no new data were created, or where data is unavailable due to privacy or ethical restrictions, a statement is still required. Suggested Data Availability Statements are available in section “MDPI Research Data Policies” at
https://www.mdpi.com/ethics.
Acknowledgments
The authors acknowledge mr Michele Sciotti, ms Simonetta Di Carlo, ms Antonella Bacosi, ms Chiara Fraioli, ms Laura Martucci for the technical and administrative support.
Conflicts of Interest
The authors declare no conflicts of interest. The funders had no role in the design of the study; in the collection, analyses, or interpretation of data; in the writing of the manuscript; or in the decision to publish the results.
References
- Ujváry, I.; Christie, R.; Evans-Brown, M.; Gallegos, A.; Jorge, R.; De Morais, J.; Sedefov, R. DARK Classics in Chemical Neuroscience: Etonitazene and Related Benzimidazoles. ACS Chem. Neurosci. 2021, 12, 1072–1092. [Google Scholar] [CrossRef] [PubMed]
- National Center for Health Statistics U.S. Overdose Deaths Decrease in 2023, First Time Since 2018 Available online: https://www.cdc.gov/nchs/pressroom/nchs_press_releases/2024/20240515.htm.
- Di Trana, A.; Pichini, S.; Pacifici, R.; Giorgetti, R.; Busardò, F.P. Synthetic Benzimidazole Opioids: The Emerging Health Challenge for European Drug Users. Front. Psychiatry 2022, 13, 858234. [Google Scholar] [CrossRef] [PubMed]
- Schüller, M.; Lucic, I.; Øiestad, Å.M.L.; Pedersen-Bjergaard, S.; Øiestad, E.L. High-Throughput Quantification of Emerging “Nitazene” Benzimidazole Opioid Analogs by Microextraction and UHPLC–MS-MS. Journal of Analytical Toxicology 2023, 47, 787–796. [Google Scholar] [CrossRef] [PubMed]
- European Monitoring Centre for Drugs and Drug Addiction Isotonitazene. Report on the Risk Assessment of N,N-Diethyl-2- [[4-(1-Methylethoxy)Phenyl]Methyl]-5-Nitro-1Hbenzimidazole- 1-Ethanamine (Isotonitazene) in Accordance with Article 5c of Regulation (EC) No 1920/2006 (as Amended);
- Schumann, J.L.; Syrjanen, R.; Alford, K.; Mashetty, S.; Castle, J.W.; Rotella, J.; Maplesden, J.; Greene, S.L. Intoxications in an Australian Emergency Department Involving ‘Nitazene’ Benzylbenzimidazole Synthetic Opioids (Etodesnitazene, Butonitazene and Protonitazene). Journal of Analytical Toxicology 2023, 47, e6–e9. [Google Scholar] [CrossRef] [PubMed]
- Di Trana, A.; La Maida, N.; Froldi, R.; Scendoni, R.; Busardò, F.P.; Pichini, S. The New Synthetic Benzimidazole Opioid Etonitazepipne: An Emerging Fatal Harm and a Challenge for Laboratory Medicine. Clinical Chemistry and Laboratory Medicine (CCLM) 2023, 61, e200–e202. [Google Scholar] [CrossRef] [PubMed]
- United Nations Office on Drugs and Crime SPECIAL POINTS OF INTEREST. In The World Drug Report 2024.
- Walton, S.E.; Krotulski, A.J.; Logan, B.K. A Forward-Thinking Approach to Addressing the New Synthetic Opioid 2-Benzylbenzimidazole Nitazene Analogs by Liquid Chromatography–Tandem Quadrupole Mass Spectrometry (LC–QQQ-MS). Journal of Analytical Toxicology 2022, 46, 221–231. [Google Scholar] [CrossRef] [PubMed]
- Ververi, C.; Galletto, M.; Massano, M.; Alladio, E.; Vincenti, M.; Salomone, A. Method Development for the Quantification of Nine Nitazene Analogs and Brorphine in Dried Blood Spots Utilizing Liquid Chromatography – Tandem Mass Spectrometry. Journal of Pharmaceutical and Biomedical Analysis 2024, 241, 115975. [Google Scholar] [CrossRef] [PubMed]
- Andrlova, L.; Kandar, R. The Dried Blood Spot Sampling Method in the Laboratory Medicine. BLL 2019, 120, 223–234. [Google Scholar] [CrossRef] [PubMed]
- Palmquist, K.B.; Truver, M.T.; Shoff, E.N.; Krotulski, A.J.; Swortwood, M.J. Review of Analytical Methods for Screening and Quantification of Fentanyl Analogs and Novel Synthetic Opioids in Biological Specimens. Journal of Forensic Sciences 2023, 68, 1643–1661. [Google Scholar] [CrossRef] [PubMed]
- Academy Standards Board; American Academy of Forensic Sciences Standard Practices for Method Validation in Forensic Toxicology Available online: https://www.aafs.org/academy-standards-board.
- Van Loco, J.; Elskens, M.; Croux, C.; Beernaert, H. Linearity of Calibration Curves: Use and Misuse of the Correlation Coefficient. Accreditation and Quality Assurance 2002, 7, 281–285. [Google Scholar] [CrossRef]
- Müller, I.R.; Linden, G.; Charão, M.F.; Antunes, M.V.; Linden, R. Dried Blood Spot Sampling for Therapeutic Drug Monitoring: Challenges and Opportunities. Expert Review of Clinical Pharmacology 2023, 16, 691–701. [Google Scholar] [CrossRef] [PubMed]
- Abu-Rabie, P.; Denniff, P.; Spooner, N.; Chowdhry, B.Z.; Pullen, F.S. Investigation of Different Approaches to Incorporating Internal Standard in DBS Quantitative Bioanalytical Workflows and Their Effect on Nullifying Hematocrit-Based Assay Bias. Anal. Chem. 2015, 87, 4996–5003. [Google Scholar] [CrossRef] [PubMed]
- Mommers, J.; Mengerink, Y.; Ritzen, E.; Weusten, J.; Van Der Heijden, J.; Van Der Wal, S. Quantitative Analysis of Morphine in Dried Blood Spots by Using Morphine-D3 Pre-Impregnated Dried Blood Spot Cards. Analytica Chimica Acta 2013, 774, 26–32. [Google Scholar] [CrossRef] [PubMed]
- Capiau, S.; Veenhof, H.; Koster, R.A.; Bergqvist, Y.; Boettcher, M.; Halmingh, O.; Keevil, B.G.; Koch, B.C.P.; Linden, R.; Pistos, C.; et al. Official International Association for Therapeutic Drug Monitoring and Clinical Toxicology Guideline: Development and Validation of Dried Blood Spot–Based Methods for Therapeutic Drug Monitoring. Therapeutic Drug Monitoring 2019, 41, 409–430. [Google Scholar] [CrossRef] [PubMed]
- Timmerman, P.; White, S.; Globig, S.; Lüdtke, S.; Brunet, L.; Smeraglia, J. EBF Recommendation on the Validation of Bioanalytical Methods for Dried Blood Spots. Bioanalysis 2011, 3, 1567–1575. [Google Scholar] [CrossRef] [PubMed]
- Deprez, S.; Stove, C. Application of a Fully Automated Dried Blood Spot Method for Therapeutic Drug Monitoring of Immunosuppressants: Another Step Toward Implementation of Dried Blood Spot Analysis. Archives of Pathology & Laboratory Medicine 2023, 147, 786–796. [Google Scholar] [CrossRef]
- Matuszewski, B.K.; Constanzer, M.L.; Chavez-Eng, C.M. Strategies for the Assessment of Matrix Effect in Quantitative Bioanalytical Methods Based on HPLC−MS/MS. Anal. Chem. 2003, 75, 3019–3030. [Google Scholar] [CrossRef] [PubMed]
|
Disclaimer/Publisher’s Note: The statements, opinions and data contained in all publications are solely those of the individual author(s) and contributor(s) and not of MDPI and/or the editor(s). MDPI and/or the editor(s) disclaim responsibility for any injury to people or property resulting from any ideas, methods, instructions or products referred to in the content. |
© 2024 by the authors. Licensee MDPI, Basel, Switzerland. This article is an open access article distributed under the terms and conditions of the Creative Commons Attribution (CC BY) license (http://creativecommons.org/licenses/by/4.0/).
