
Submitted:
23 October 2024
Posted:
24 October 2024
You are already at the latest version
Abstract
This article presents a stochastic model for the effect of interference caused by a sudden increase in the number of users that access a QAM digital cellular communication system. As demonstrated, the rapid increase in the number of users that access the system causes a non-stationary traffic in the network. A stochastic differential approach is used to model the epidemic interference effect.
Keywords:
Wireless communications
; QAM modulation
; stochastic differentiation
; interference analysis
1. Effect of the Sudden Increase in the Interference
It is usual to assume stationarity in the analysis of bit error probability. But, in cellular communication systems the interference depends on the state of the network. In the case of a sudden increase in telephone traffic the usual linear tools, such as stationary stochastic processes, are less useful. Stochastic integration is a new mathematical tool that can be used to attack the problem, because it permits to deal with the non-stationary cases.
A non-stationary digital transmission environment is usually complicated in terms of mathematical modelling, therefore it is usual to assume stationarity in the analysis of symbol or bit error probability. In most cases, the assumption is feasible and reliable, and the model works well in real life.
In cellular communication systems, although, the interference depends on the state of the network. For instance, if the users access the network early morning the traffic is clearly non-stationary, because it is increasing with the number of users that place calls. The interference also increases, as more callers access the telephone system [1].
In the case of a sudden increase in telephone traffic, the usual linear tools, such as basic probabilistic models or stationary stochastic processes, are less useful. But stochastic integration can be used to attack the problem, because it is based on a stochastic differential equation formulation that makes it possible to deal with the non-stationarity of the communications channel.
2. The Instantaneous Power Interference
When dealing with complex problems, such as the effect of interference on a mobile cellular communication system, it is usually necessary to compromise, in terms of mathematical modelling. The main reason is that the model could be difficult to verify in practice, or unfeasible to compute in theory.
The stochastic processes that model the interference in a cellular communications system, when this system enters an epidemic state, that is, when most users decide to place calls at the same time, are not stationary. This means that their statistical averages, or moments, can vary with time.
The traditional correlation analysis is, thus, not adequate to attack that type of problem. In this case, stochastic differentiation is a useful tool to deal with the situation. This makes it possible to obtain a problem formulation, for the modelling of the interference based on a stochastic differential equation.
The stochastic calculus began with the study and modelling of market prices, this is, the fluctuation of the stock value as a function of time. In this case, the investors work based on the variation of the potential gain or loss, , as a proportion of the invested sum .
Therefore, in fact, what matters is the relative price, , of a certain asset, as it reacts to the market fluctuations, this is, it should be proportional to a Wiener process [2],
which is an informal manner to express the corresponding integral equation,
In order to model the epidemic effect on the signal transmission it is important to consider the relative instantaneous power, , of a certain signal, as it reacts to the channel interference fluctuations.
As is usually considered in modeling epidemic spreads, the interference that affects the transmitted signal grows at a rate that is proportional to the number of users [5].
The incremental variation of the interference is also proportional to the differential variation of a stochastic process, , which usually has a Gaussian distribution and represents the variability of the channel.
Observe that it is multiplied by the total power of the active users, , and should be adjusted by the parameter , which remains to be found, based on the channel specifications. For instance, is related to the power exponencial growth.
The stochastic process , by its turn, is the result of an additive combination of all interference factors, , which can be found in the cellular communication system. Therefore, by the Central Limit Theorem, that process has a Gaussian probability distribution.
It is natural to combine both preceding assumptions, which results in the following stochastic differential equation [6]
in which is the drift function, or model trend, and is the dispersion function, volatility, of the stochastic process.
The stochastic differential equation obtained with the interference model, can be solved using the generic formulation for stochastic differential equations, derived by Itô.
An immediate question associated to the equation solution is related to the non-differentiability of a Wiener process , at any point in time. A way to circle the problem has been found, and is known as the theory of stochastic integrals, or the study of stochastic differential equations [3].
3. Solution of the Stochastic Equation
Recall that when formulating a stochastic model to represent the reject variation along with time, it is important to consider that the interference rate is proportional to the existing amount of interference. This can be expressed as [5],
The incremental variation of the interference is proportional to the differential variation of a stochastic process, , which usually has a Gaussian distribution, multiplied by the existing amount of interference, , and adjusted by the parameter , which remains to be found, based on the channel specifications
Combining the previous equations one obtains 2, which is the informal manner to write
in which represents the future value of the process , that is time units in advance.
The solution of the equation follows the procedure established by Itô, which gives
For the proposed stochastic process, one notes that the interference power grows exponentially in time. On the other hand, it is controlled by the parameters and , that remain to be determined, based on system and channel conditions. The random variation on the curve is a result of the stochastic process .
The process , which results from N independent interference factors, caused by the users that access the system, is given by
thus, by the Central Limit Theorem, if N is large has a Gaussian probability distribution, with mean and variance given by
and
If its distribution is Gaussian, it is possible to compute the associated interference distribution, using the transformation of probability density function mathematical operation. For stationary stochastic processes, or for short instants of time, the moments are independent of time, this is
and
Note that the stochastic process, , is non-stationary, because its average value depends on time. Besides, the probability distribution of process , that represents the interference power, is not Gaussian, as is usually assumed in the computation of the error probability, using the theory of stochastic processes.
In order to solve the stochastic differential equation obtained with the reject model, using the generic formulation for stochastic differential equations, one considered that the drift function is proportional to the stochastic process, , that the dispersion function is modelled as , and that one can use the Itô formula for the logarithm function .
Following the procedure established by Itô, for the solution of the equation, one obtains,
Thus,
this is,
Integrating in time, one obtains
taking the logarithm inverse function, results in
in which represents the initial value of the process, that remains to be found, based on the problem constraints.
The expected value of the process, , is given by,
Therefore, according to the obtained mathematical model, the average value of the interfering power grows exponentially, for the specified conditions. The initial mean value of the process, , should be determined from the data obtained from the received signal, as well as the estimate of the parameter, , that controls the curve.
3.1. The Influence of the Combined Interference
As discussed in the previous section, the stochastic process results from the combination of several interferers, , as the users decide to place calls at the same time, or in the same time interval.
Equation 6 can be simplified, if one considers that the system parameters compensate to avoid the exponential growth, that is, , which can be done by the Automatic Gain Control (AGC) subsystem. The remaining part of the equation is a transformation of probability
Considering that is a Gaussian process, the transformation 20 can be solved, giving the probability distribution of the interfering power, ,
The derivative of the output stochastic process, as a function of the input process, in a simplified notation, is
After the substitution of the inverse function, assuming that is a positive parameter, and considering that the exponencial is positive definite function, one obtains
if and null in case . In the preceding equation the following notation is used, , for short.
Therefore, the interfering power has a Lognormal distribution. By a property of the Lognormal probability density function, this also implies that the received signal has a Lognormal distribution.
4. Obtained Results
From the preceding analysis, it is possible to conclude that the random process that represents the interference in a communication system that suffers from an epidemic attack, has a Lognormal probability distribution, instead of the usual assumption of a Gaussian distribution.
This effect is illustrated in Figure 1, that shows the interference caused by the bivariate Lognormal probability density function (pdf), , on a QAM signal, with signal symbols in the sets and .
Note that the signal centered at interferes heavily on the signals centered at and , but the contrary is not true. Also, the interference on the signal centered at can be disregarded on a first approach.
By the same token, the signal centered at interferes heavily on the signals centered at and , but the contrary is no true. Finally, they have a smaller interference on the signal centered at .
It must also be considered, for the conditions established in the paper, that the interference between the symbols on the z axis is weak, compared with the interference between the symbols on the x axis.
That result can be used to compute the symbol or bit error probability for different modulation schemes. As it is known, the Lognormal distribution has a heavy tail, that is, it decays at a much slower pace than the exponential function.
Therefore, an increase in the error probability during the cellular system power adaptation process is thus expected. This could disconnect the call, because maintaining an acceptable error rate is one of the conditions to continue the telephone connection.
The bit error rate for a QAM signal, for the case of a zero mean Gaussian distribution, can be obtained by numerically computing the integral
in which A is the modulated signal amplitude. The equation can be rewritten, using the transformation , , to obtain the error probability.
The preceding result can be simplified to
using the function, which puts into evidence the distribution symmetry, and the fact that the errors are equiprobable.
The theoretical BER of an ideal QAM system can be put in the following format [7],
in which is the energy per bit and is the two-sided power spectral density of the additive white Gaussian noise channel.
The Lognormal distribution is asymmetric, and the influence of the interference that affects symbols and is higher, when one computes the error probability. Most of the error probability is caused by this interference, when the transmission power is high.
The influence of the interference that occurs because of the transmission of symbols and becomes more evident for a low transmission power, because the Lognormal distribution curve is displaced to the left and, eventually, crosses the coordinate axes. In this case, the error probability suddenly increases, causing a discontinuity in the curve.
When the channel is under the influence of an epidemic interference, the combined error probability associated to the symbol transmission approximates the following simplified formula, which approximates the exact value
The transformation, , displaces the interference to the origin of the coordinated system, and the transmitted signal has zero mean. Because of the Lognormal distribution asymmetry, the error probabilities are different for each symbol.
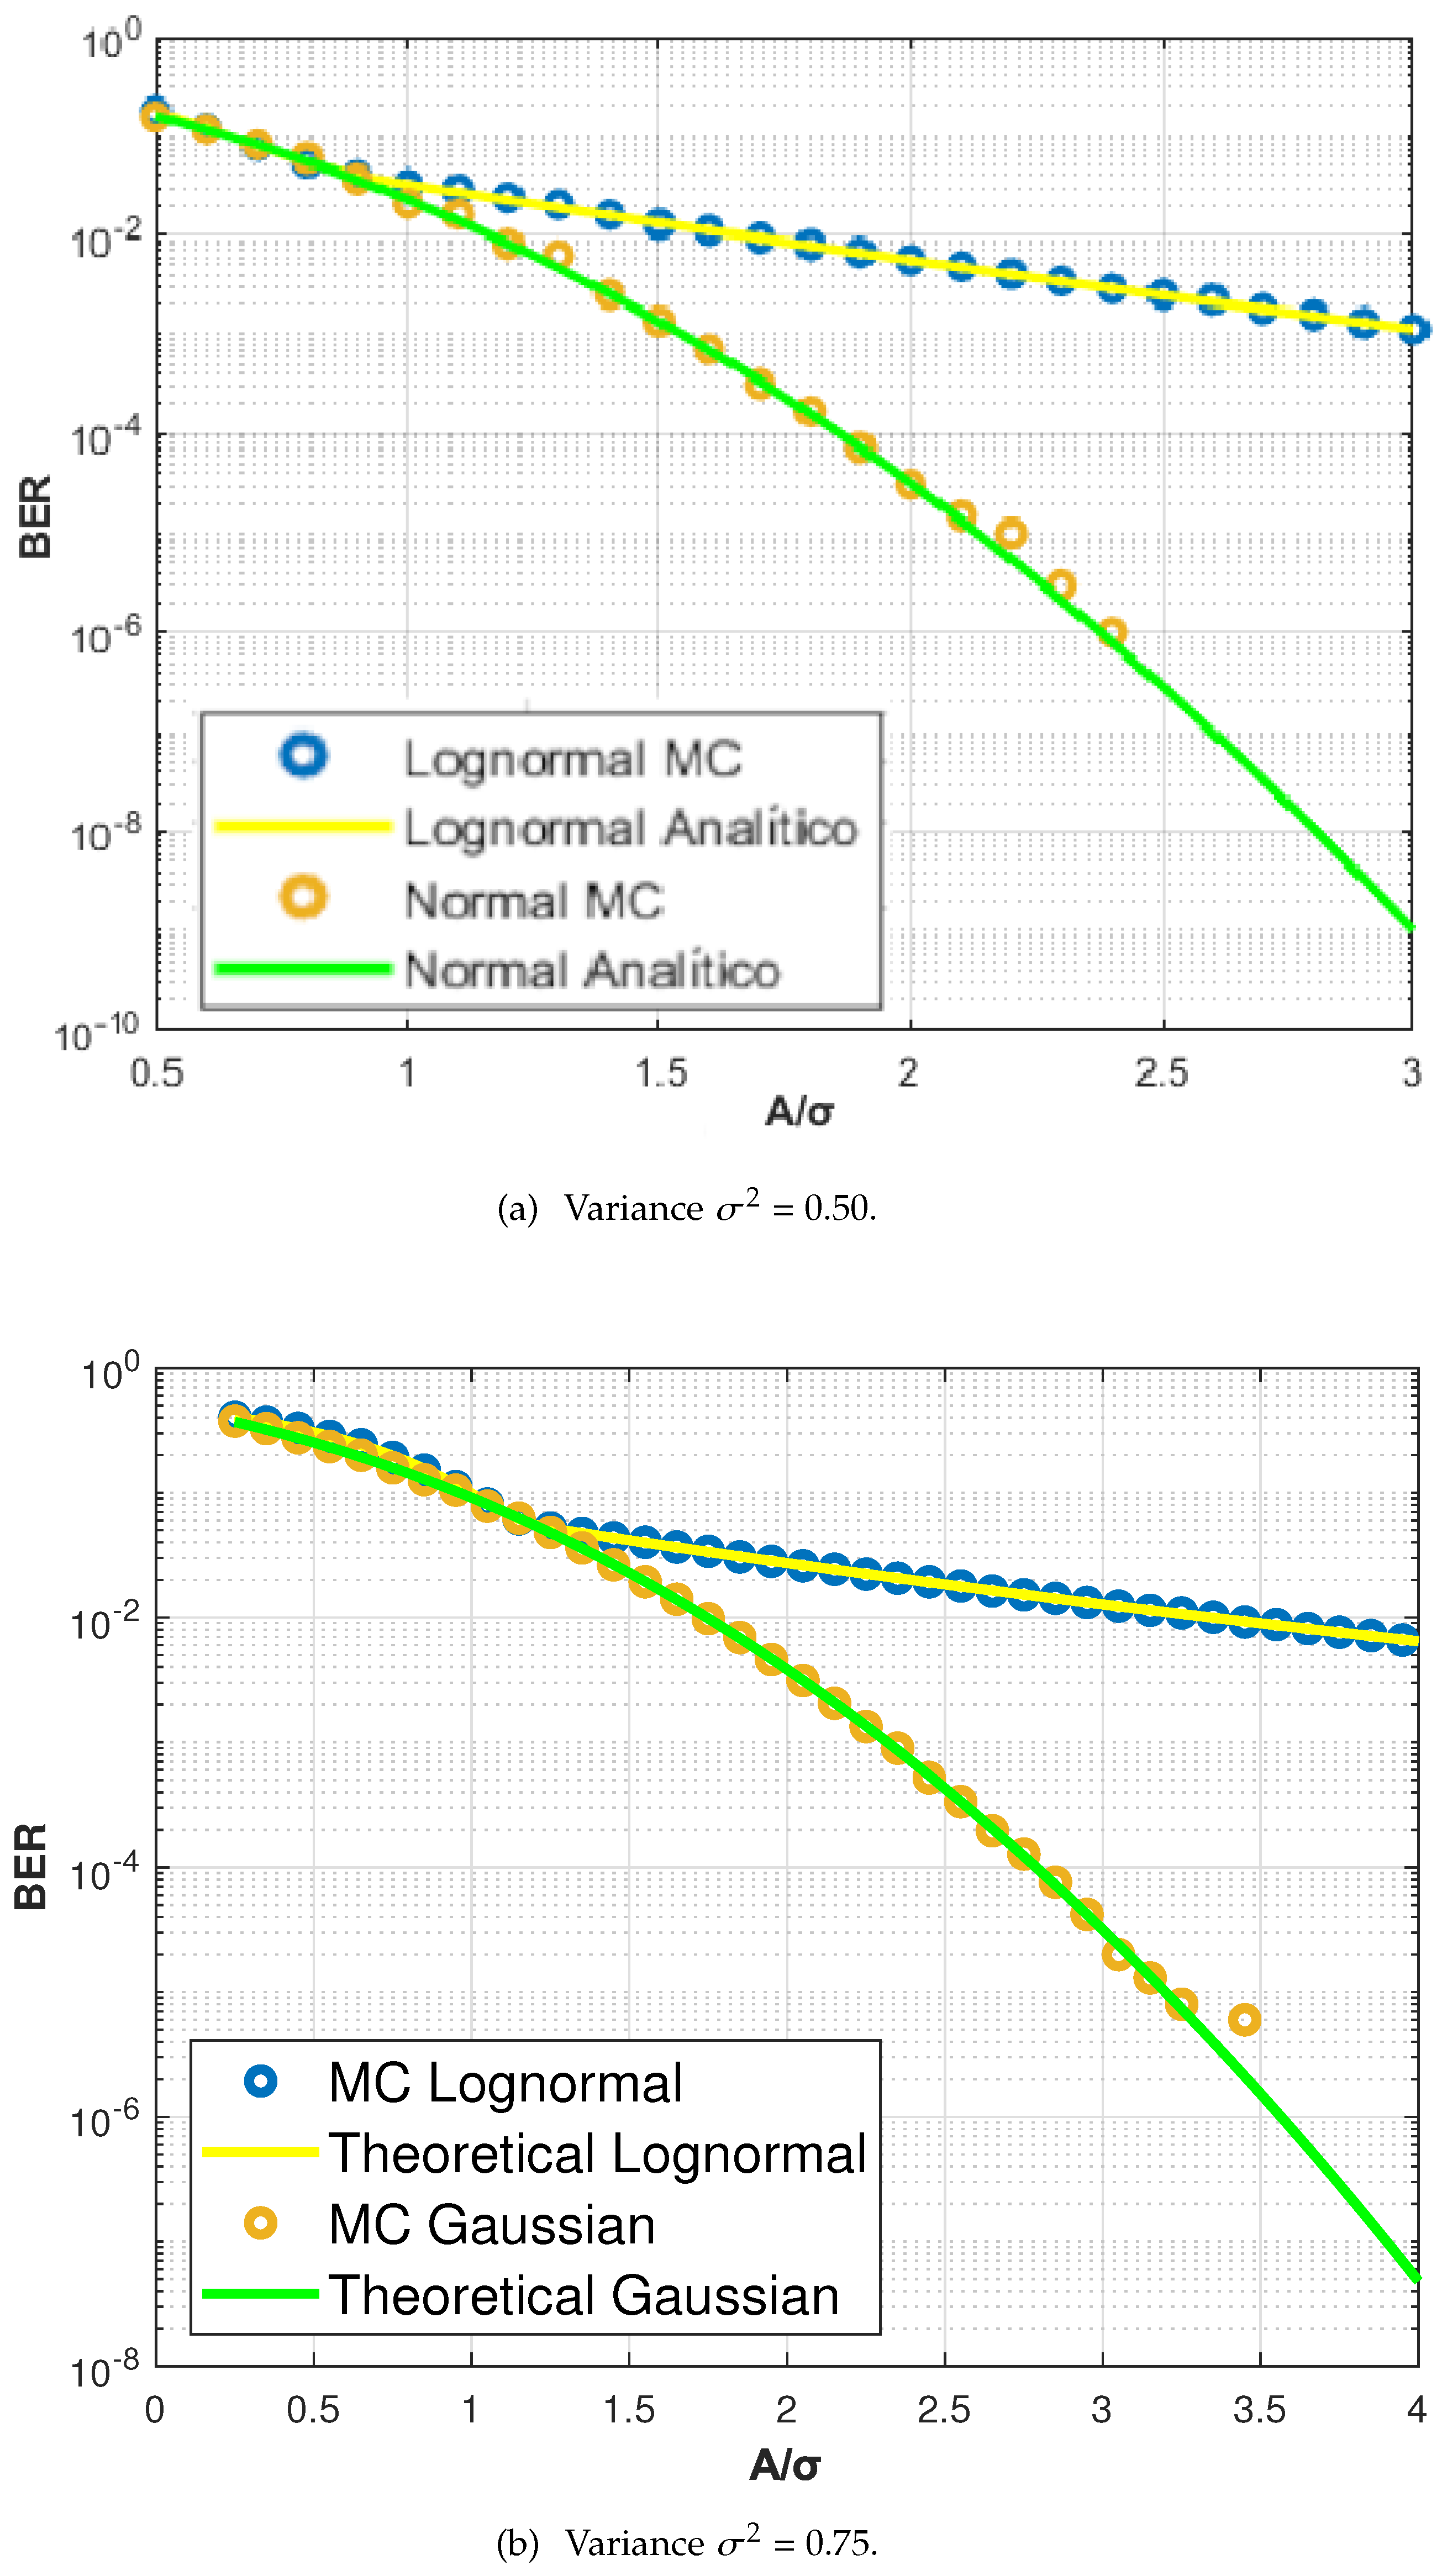
Monte Carlo simulation has been used to test the results, that are compared with analytical plots obtained directly from the resulting formulas. The results are presented in Figsure Figure 2a,b, for the QAM modulation.
It is possible to note, for the simulated variance values, that the bit error probability obtained with the Lognormal distribution remains always above that obtained from the Gaussian distribution, that represents the common noise. As can be observed, the Lognormal BER curve decays at a slow rate, as compared to the Gauss BER plot.
For such a non-stationary process, Itô integration has been used to solve the problem, which, for the defined constraints, resulted in a Lognormal probability density function, that, different from the Gaussian distribution, is asymmetrical. The long term interference average and variance values follow exponential curves, which depend on certain system parameters.
5. Discussion
Itô integration has been used to solve the problem of stochastic modeling for a QAM transmission subject to the epidemic interference fffect. Considering the constraints the mathematical solution resulted in a Lognormal probability density function that is asymetrical, in contrast with the Gaussian distribution that is symmetrical for all dimensions. The long term interference average and variance values follow exponential curves, which depend on certain system parameters [8].
6. Conclusions
In most analyses, it is usual to assume a stationary channel to compute the symbol or bit error probability, because the system is in a stable state, or to simplify the analysis considering that the non-stationary environment is mathematically complex.
On the other hand, it is well known that the interference is usually dependent on the state of the communications network, for fixed telephony, and also for cellular systems. For instance, if the users decide to access the network all of a sudden, the traffic modelling, as well as the interference, becomes non-stationary.
This article presented a mathematical model for the effect of an interference accumulation, caused by a sudden increase of users in a QAM digital cellular system, which is also called an information outbreak or epidemic interference.
This results in a Lognormal distribution for the interference, and for such a heavy tail distribution, there is an expected increase in the error probability during the adaptation process. In the near future, the author plans to develop more complete mathematical and computational models to include M-QAM and other modulation formats.
Funding
This research was funded by the Brazilian National Council for Research and Development (CNPq) grant number 303854/2021-9.
Acknowledgments
The author would like to thank the Federal University of Rio Grande do Norte, and the Institute for Advanced Studies in Communicatioons (Iecom), for the administrative and technical support for the research.
Conflicts of Interest
The authors declare no conflicts of interest.
References
- Alencar, M. S., and Blake, I. F. The Capacity for a Discrete-State Code Division Multiple Access Channel. IEEE Journal on Selected Areas in Communications 12, 5 (June 1994), 925–937. [CrossRef]
- Brzezniak, Z., and Zastawniak, T. Basic Stochastic Processes. Springer, London, Great Britain, 2006.
- Itô, K. Stochastic integral. Proceedings of the Imperial Academy 8, 20 (1944), 519–524. [CrossRef]
- Itô, K. On a Stochastic Integral Equation. Proceedings of the Imperial Academy 2, 22 (1946), 32–35. [CrossRef]
- Movellan, J. R. Tutorial on Stochastic Differential Equations. Technical report, MPLab Tutorials Version 06.1, 2011.
- Reiβ, M. Stochastic Differential Equations. Lecture notes, Institute of Applied Mathematics, University of Heidelberg, 2007.
- Silva, H. S.; Alencar, M. S.; QueirozW. J. L.; Almeida, D. B. T.; Madeiro F. Bit Error Probability of M-QAM Subject to Impulsive Noise and Rayleigh Fading. XXXVI Simpósio Brasileiro de Telecomunicações e Processamento de Sinais (SBrT 2018), Campina Grande, Brasil, Setembro, 2018.
- Alencar, M. S. Traffic Congestion in Social Networks Caused by Epidemic Interference. 2021 IEEE 18th Annual Consumer Communications & Networking Conference (IEEE CCNC 2021 WKSHPS TCB6GN), Las Vegas, USA, January, 2021. [CrossRef]
Figure 1.
The effect of epidemic interference on the probability distribution, , of a QAM signal.
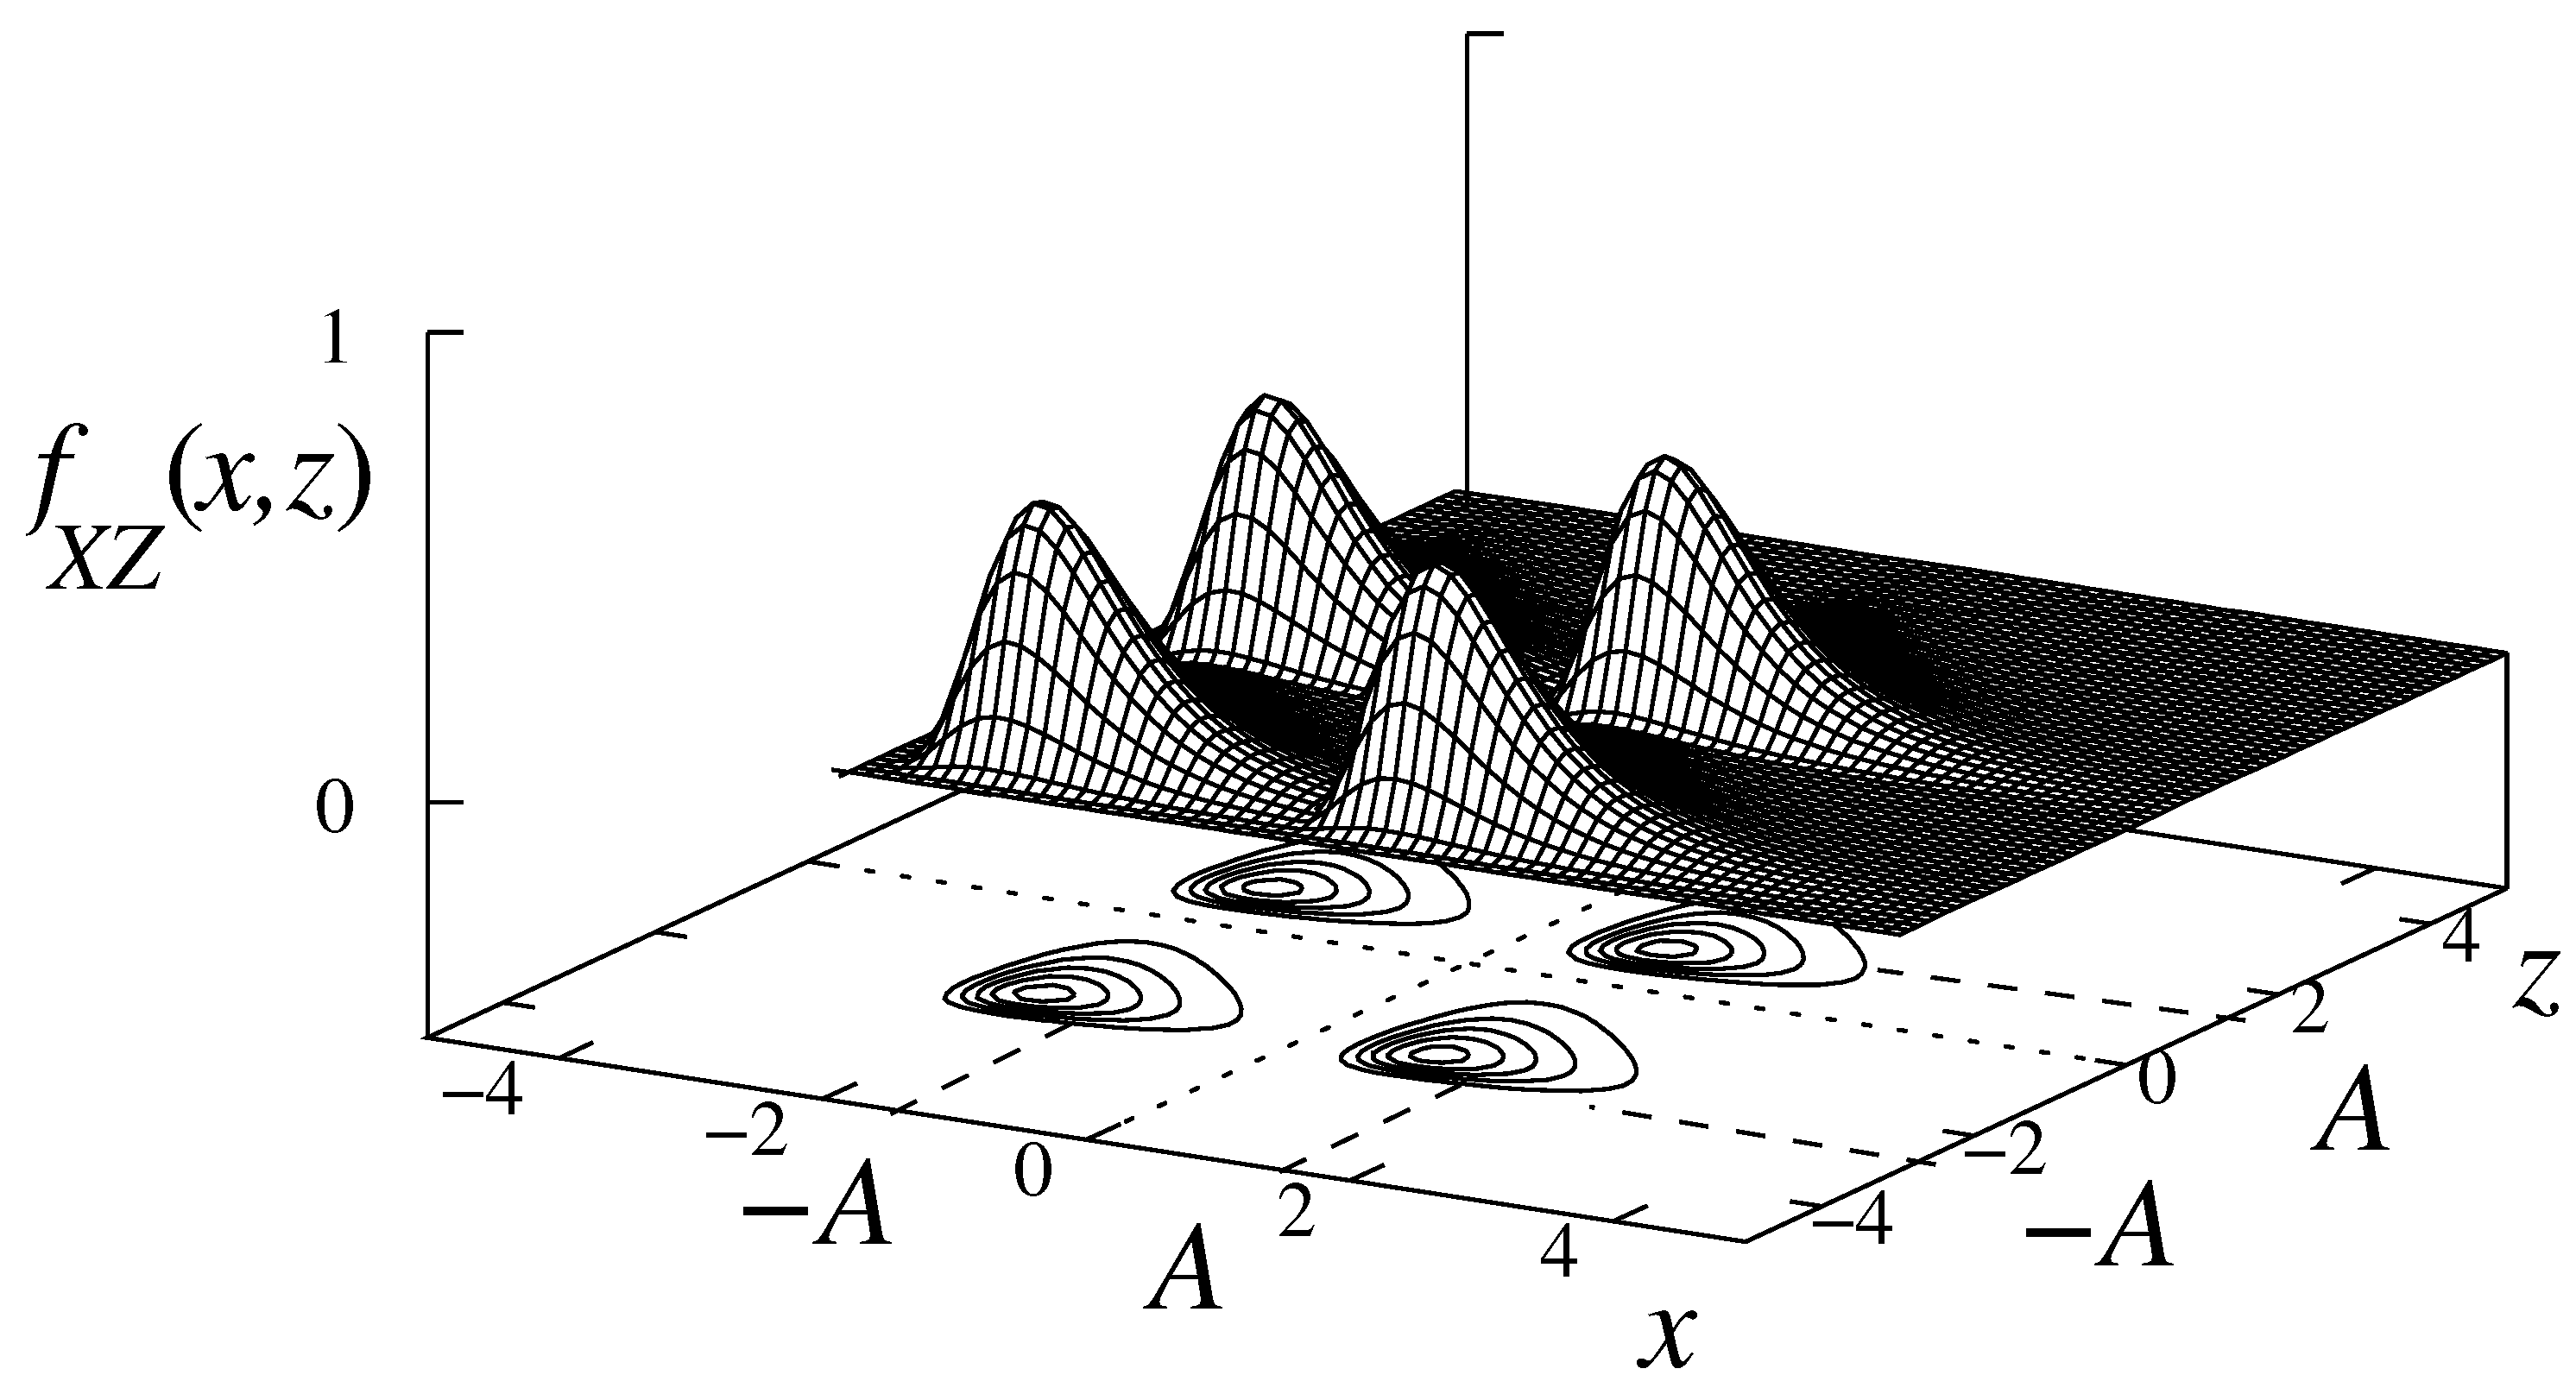
Figure 2.
BER as a function of for QAM modulation.
Disclaimer/Publisher’s Note: The statements, opinions and data contained in all publications are solely those of the individual author(s) and contributor(s) and not of MDPI and/or the editor(s). MDPI and/or the editor(s) disclaim responsibility for any injury to people or property resulting from any ideas, methods, instructions or products referred to in the content. |
© 2024 by the authors. Licensee MDPI, Basel, Switzerland. This article is an open access article distributed under the terms and conditions of the Creative Commons Attribution (CC BY) license (http://creativecommons.org/licenses/by/4.0/).
Copyright: This open access article is published under a Creative Commons CC BY 4.0 license, which permit the free download, distribution, and reuse, provided that the author and preprint are cited in any reuse.


