1. Introduction
The accelerated pace of urbanization and the rapid expansion of construction land have significantly altered urban land use and land cover (LULC) patterns, often involving the conversion of rural or natural landscapes into urban environments. This shift has led to numerous ecological challenges, including a reduction in vegetation cover [
1], heightened soil erosion [
2], intensified urban heat island effects [
3], and a decline in biodiversity [
4]. These factors collectively escalate ecological risks, posing serious threats to environmental stability and human well-being [
5]. In the context of rapid urbanization, it is crucial to develop a scientific understanding of how land use/cover change (LUCC) affect urban ecological environments. Real-time monitoring of ecological quality is, therefore, a critical strategy for addressing the ecological challenges arising from urban development.
Monitoring ecological quality is essential for identifying and assessing ecological issues, providing the scientific foundation necessary for shaping environmental policy, managing natural resources, responding to emergencies, and issuing disaster warnings [
6]. This process plays a pivotal role in promoting environmental protection measures and achieving sustainable development goals. A variety of methodologies have been developed to monitor and assess the ecological environment, with remote sensing technology emerging as a widely adopted approach due to its ability to rapidly gather large-scale surface data. Remote sensing is commonly used to monitor ecological changes through the development of indices that reflect different aspects of ecosystems. For example, the normalized difference vegetation index (NDVI) has been extensively used to monitor vegetation growth and assess environmental conditions [
7,
8,
9,
10]. The land surface temperature (LST) index has been employed to evaluate the effects of urban heat islands [
11,
12]. The standardized precipitation index (SPI) has been applied to forecast drought conditions [
13,
14]. Although these indices capture specific ecological characteristics, they fail to provide a comprehensive evaluation of the complexity and diversity of surface features. Consequently, methods that integrate multiple remote sensing indices have been developed to offer more holistic assessments. The ecological index (EI) systematically incorporates five key ecological factors—biological abundance, vegetation coverage, water network density, land degradation, and environmental pollution—and is widely used for comprehensive evaluations of ecological quality [
15,
16]. The forest disturbance index (FDI) focuses on forest ecosystems, providing precise monitoring and scientific analysis of dynamic changes in these systems by quantifying the frequency and impact of various disturbance events, including natural disasters and human activities [
17,
18]. The MODIS global disturbance index (MGDI) extends this scope to encompass a broad range of global land cover types, aiming to monitor and assess disturbances caused by both natural and anthropogenic factors, thus supplying critical data for global environmental change research [
19,
20]. Despite the considerable benefits of these comprehensive ecological indices in revealing the multidimensional nature of ecological conditions, practical challenges persist, including the determination of appropriate indicator weights and the integration of vast amounts of remote sensing and socio-economic data.
The remote sensing-based ecological index (RSEI) is a comprehensive ecological index based on remotely sensed information, incorporating evaluation indices of greenness, heat, dryness and humidity in the natural ecological environment [
21]. RSEI indicators are readily obtainable and simple to calculate, eliminating the need for subjective weighting and threshold setting [
21,
22]. This approach provides an objective, efficient, and straightforward technique for evaluating urban ecological quality [
23,
24]. RSEI has been extensively applied in the analysis, evaluation, modeling, and prediction of regional ecological quality across various spatial and temporal scales [
25,
26,
27]. Nonetheless, its application in long-term, large-scale ecological monitoring remains hindered by several challenges, including increasing computational demands, the complexity of satellite image preprocessing, the impact of cloud masking on data quality, and the challenge of ensuring the completeness of long time-series data [
28,
29,
30]. The Google Earth Engine (GEE) platform provides a solution by granting convenient access to a wide array of open-source geospatial datasets, allowing users to perform data processing and analysis directly on the platform. This circumvents traditional data acquisition processes, as well as time-consuming preprocessing steps like radiometric and atmospheric corrections [
25]. As a result, GEE is well-suited for constructing RSEI to conduct large-scale, long-term evaluations of ecological quality.
On April 1, 2017, the Chinese government officially established the Xiong’an New Area as the central region for redistributing non-capital functions from Beijing. This decision is a pivotal component of the government’s strategy to promote the coordinated development of the Beijing-Tianjin-Hebei region. In alignment with sustainable development principles, the construction of Xiong’an New Area prioritizes ecological considerations, intending to create a low-energy, low-carbon urban area. Seven years into its development, Xiong’an New Area is at a critical juncture, undergoing large-scale construction and the relocation of non-capital functions from Beijing. Concurrent with the construction process, a multitude of LULC types have undergone a process of mutual conversion, with the most notable being the conversion of the original agricultural land into urban construction land. These conversions in LULC and spatial redistribution of economic activities have profound implications for ecosystem resilience and ecological quality [
31,
32]. A thorough investigation into the relationship between LUCC and ecological quality is essential for informing regional ecological protection policies and promoting the sustainable use of land resources [
33]. Therefore, real-time monitoring of the ecological quality in the Xiong’an New Area is imperative to ensure that construction activities align with eco-city planning goals.
This study focuses on the Xiong’an New Area and aims to develop an intelligent RSEI extraction method using the GEE cloud platform to assess the impact of LUCC on ecological quality under rapid urbanization. The research objectives are: (1) comprehensively evaluate the overall ecological quality of Xiong’an New Area and its trends from 2017 to 2023; (2) systematically analyze the dynamic LUCCs of the region during this period; and (3) investigate the spatio-temporal response of ecological quality to LUCCs. The findings of this study will serve as a critical scientific basis for ecological protection and high-quality sustainable development in the Xiong’an New Area.
2. Materials
2.1. Study Area
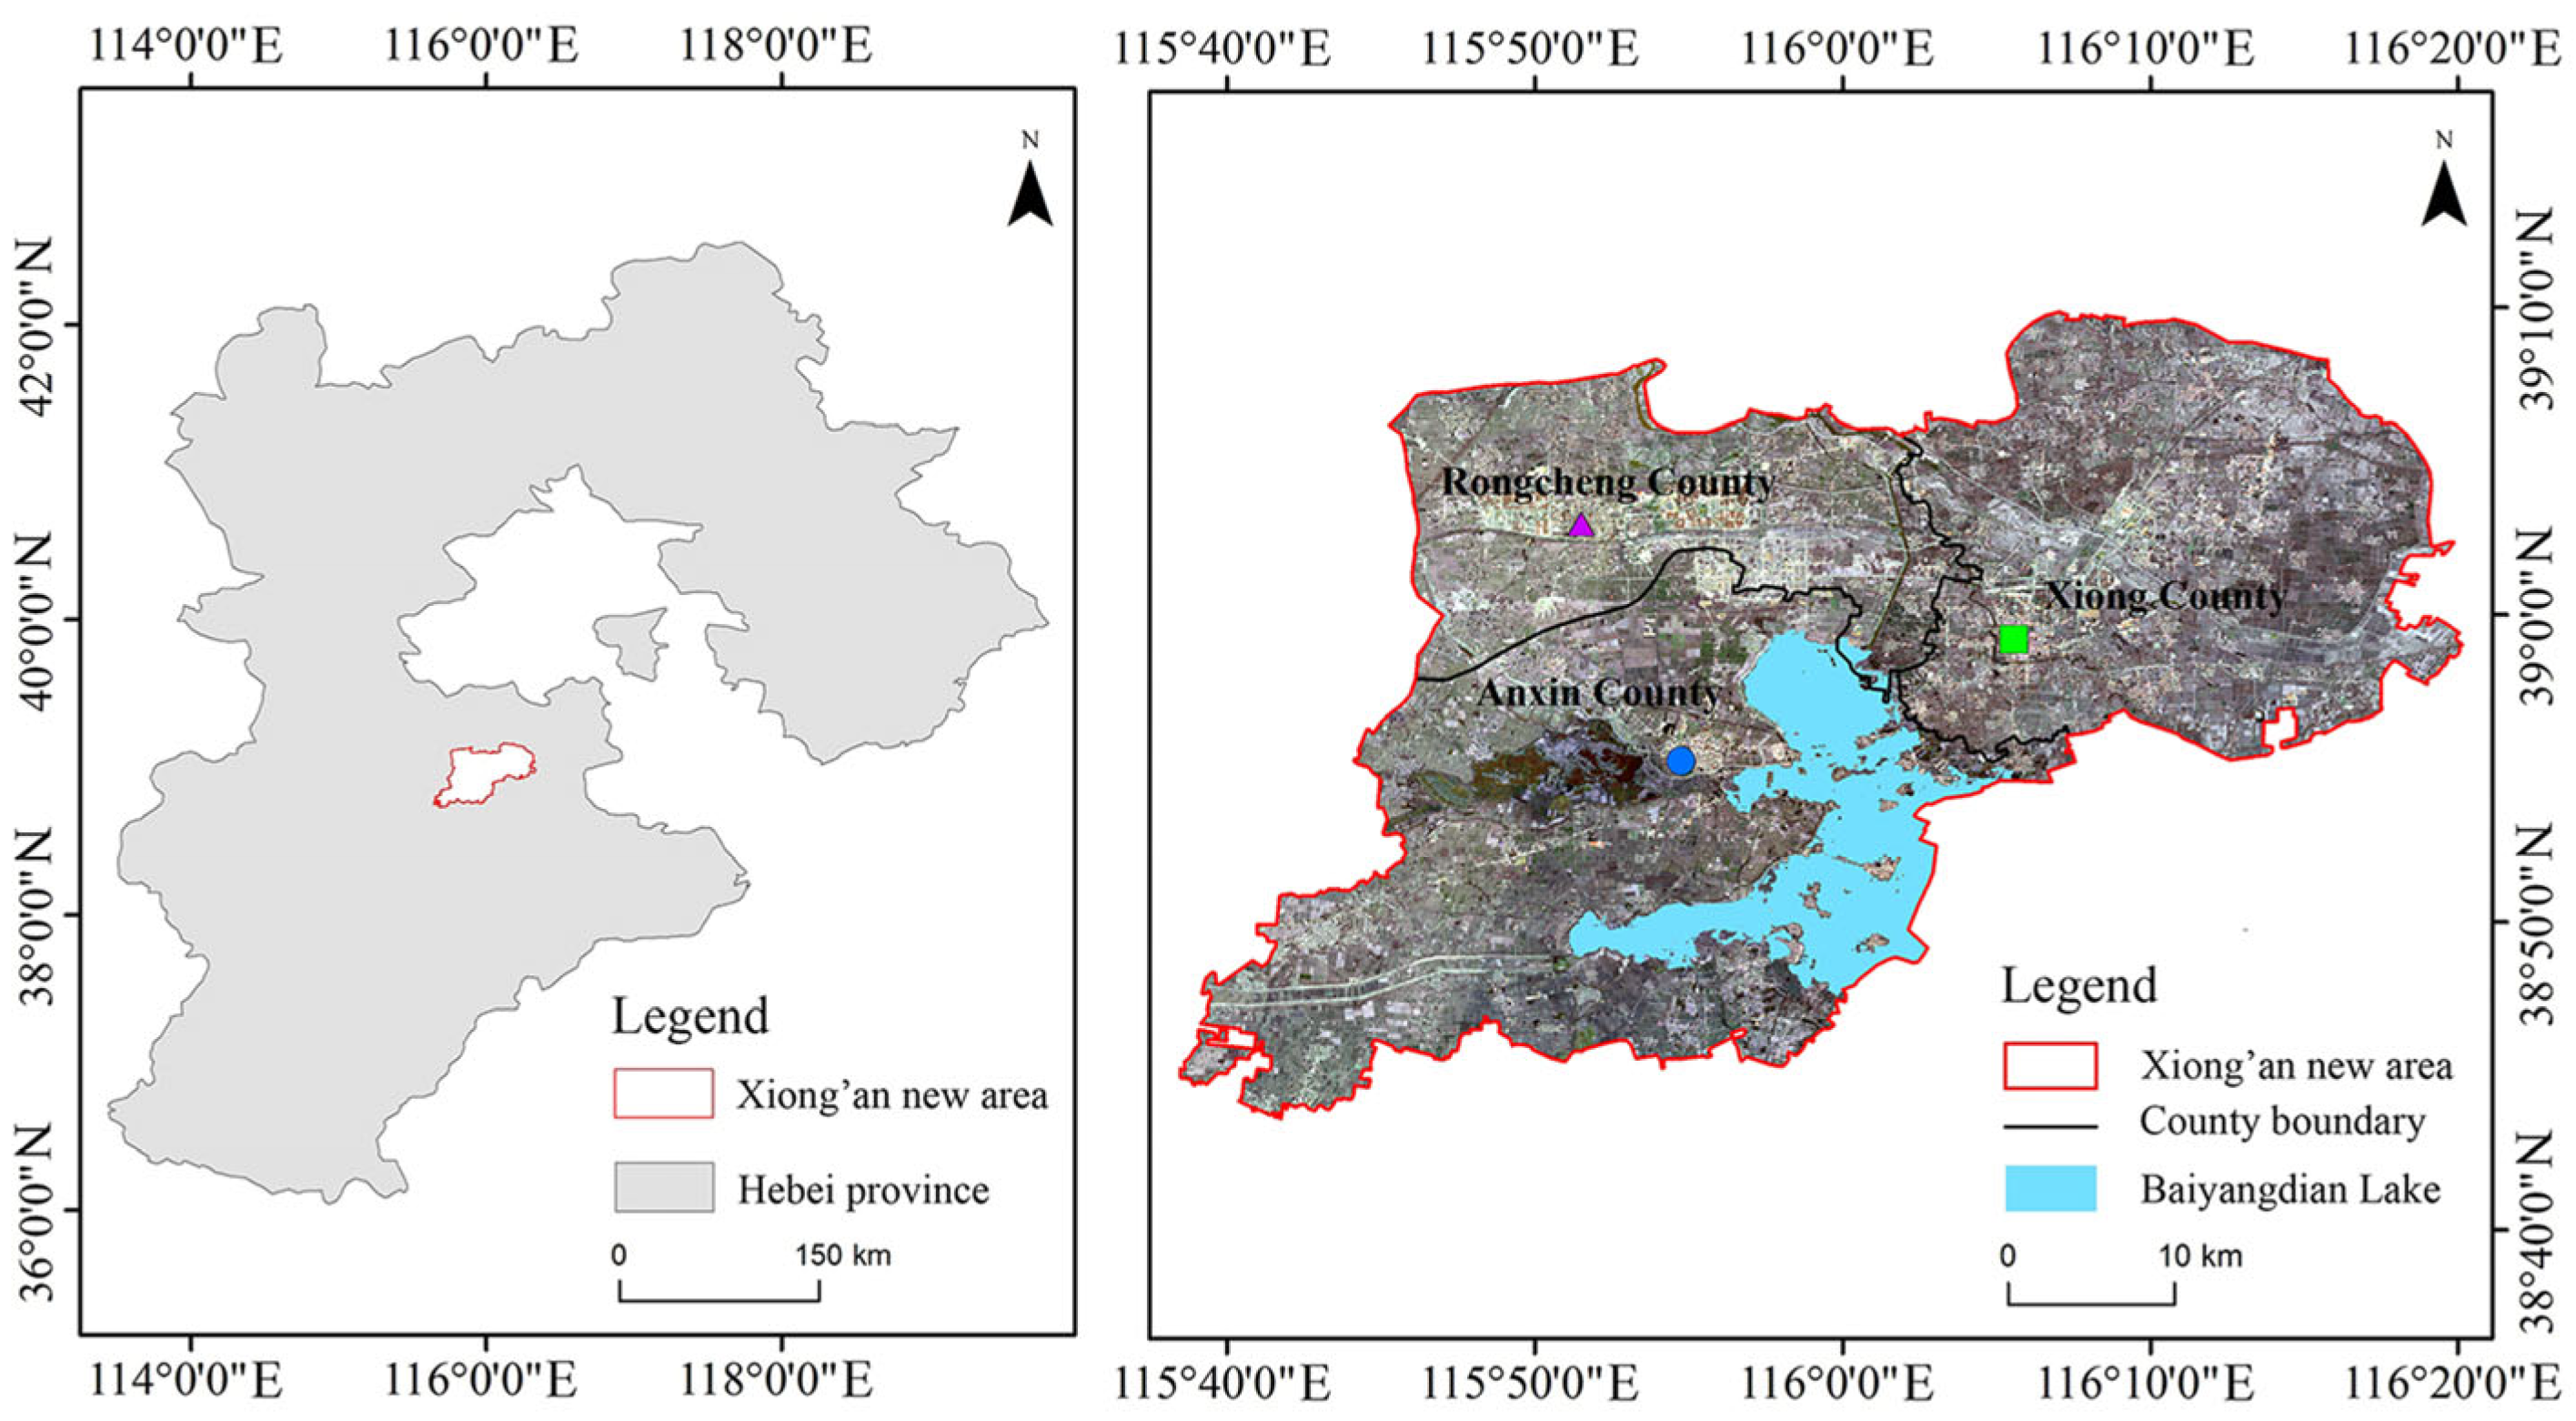
Xiong’an New Area, situated in central Hebei Province (115°38’E-116°19’E, 38°43’N-39°05’N), occupies the leading edge of the alluvial plains bordering the eastern Taihang Mountains (
Figure 1). In its southwestern region lies Baiyangdian Lake, the largest freshwater body in the North China Plain and primarily fed by the Lugou and Daqing Rivers, with a storage capacity of 1.32 billion cubic meters. The area experiences a typical warm temperate, continental monsoon climate, with an average temperature of −4.9 °C in January and 26 °C in July. Xiong’an New Area encompasses Xiong County, Rongcheng County, Anxin County, and several nearby villages and towns, covering approximately 1,770 km
2. By 2023, the population had reached 1,205,000, marking a 16% increase since 2017. Following its establishment, Xiong’an’s urbanization rate surged to 47.05%, demonstrating rapid urban expansion and increased residential mobility.
2.2. Datasets and Preprocessing
2.2.1. Landsat Data and Preprocessing
Landsat images from 2017 to 2023 were selected to calculate the RSEI for Xiong’an New Area during its seven-year construction period. Xiong’an New Area experiences a temperate monsoon climate, with rising temperatures and increasing precipitation from March to May, which initiates the resurgence of vegetation growth. From June to August, average temperatures range between 22°C and 27°C, accompanied by ample precipitation, marking the peak of the growing season. Accordingly, satellite images captured between March and August with less than 50% cloud cover were selected for the RSEI calculation.
Before RSEI calculation, preprocessing steps were undertaken, including cloud removal and water masking. The BQA band, which contains cloud and cloud shadow information, was utilized for image quality assessment based on the Landsat images provided by GEE. Cloud and cloud shadow masks were then generated and merged using the “cloudMask.and(cloudShadowMask)” function to effectively eliminate cloud-related distortions. Additionally, to mitigate the impact of water bodies on RSEI accuracy, the study employed the annual water classification dataset published by the Joint Research Centre (JRC) of the European Commission [
34]. This dataset, derived from 30-meter resolution multispectral images from Landsat 5, 7, and 8, allows for precise global water body identification by calculating water indices such as NDWI and MNDWI, integrated with supervised machine learning algorithms. Water vector data from this dataset was used to generate a water mask on the GEE platform, ensuring accurate exclusion of water bodies in the RSEI calculation.
2.2.2. Land Cover Data
To comprehensively analyze the effects of rapid urbanization on LUCCs in Xiong’an New Area over the past seven years, Sentinel-2 surface cover product was utilized. This product is based on high-resolution multispectral images from the Sentinel-2 satellite and uses deep learning trained on surface samples to achieve high-precision land cover classification [
35]. With a temporal resolution of one year and a spatial resolution of 10 meters, the dataset classifies nine major surface types, including buildings, vegetation, water bodies, cropland, etc. The overall classification accuracy of the dataset reaches 85%, ensuring the scientific rigor and reliability of the study’s results.
3. Methodology
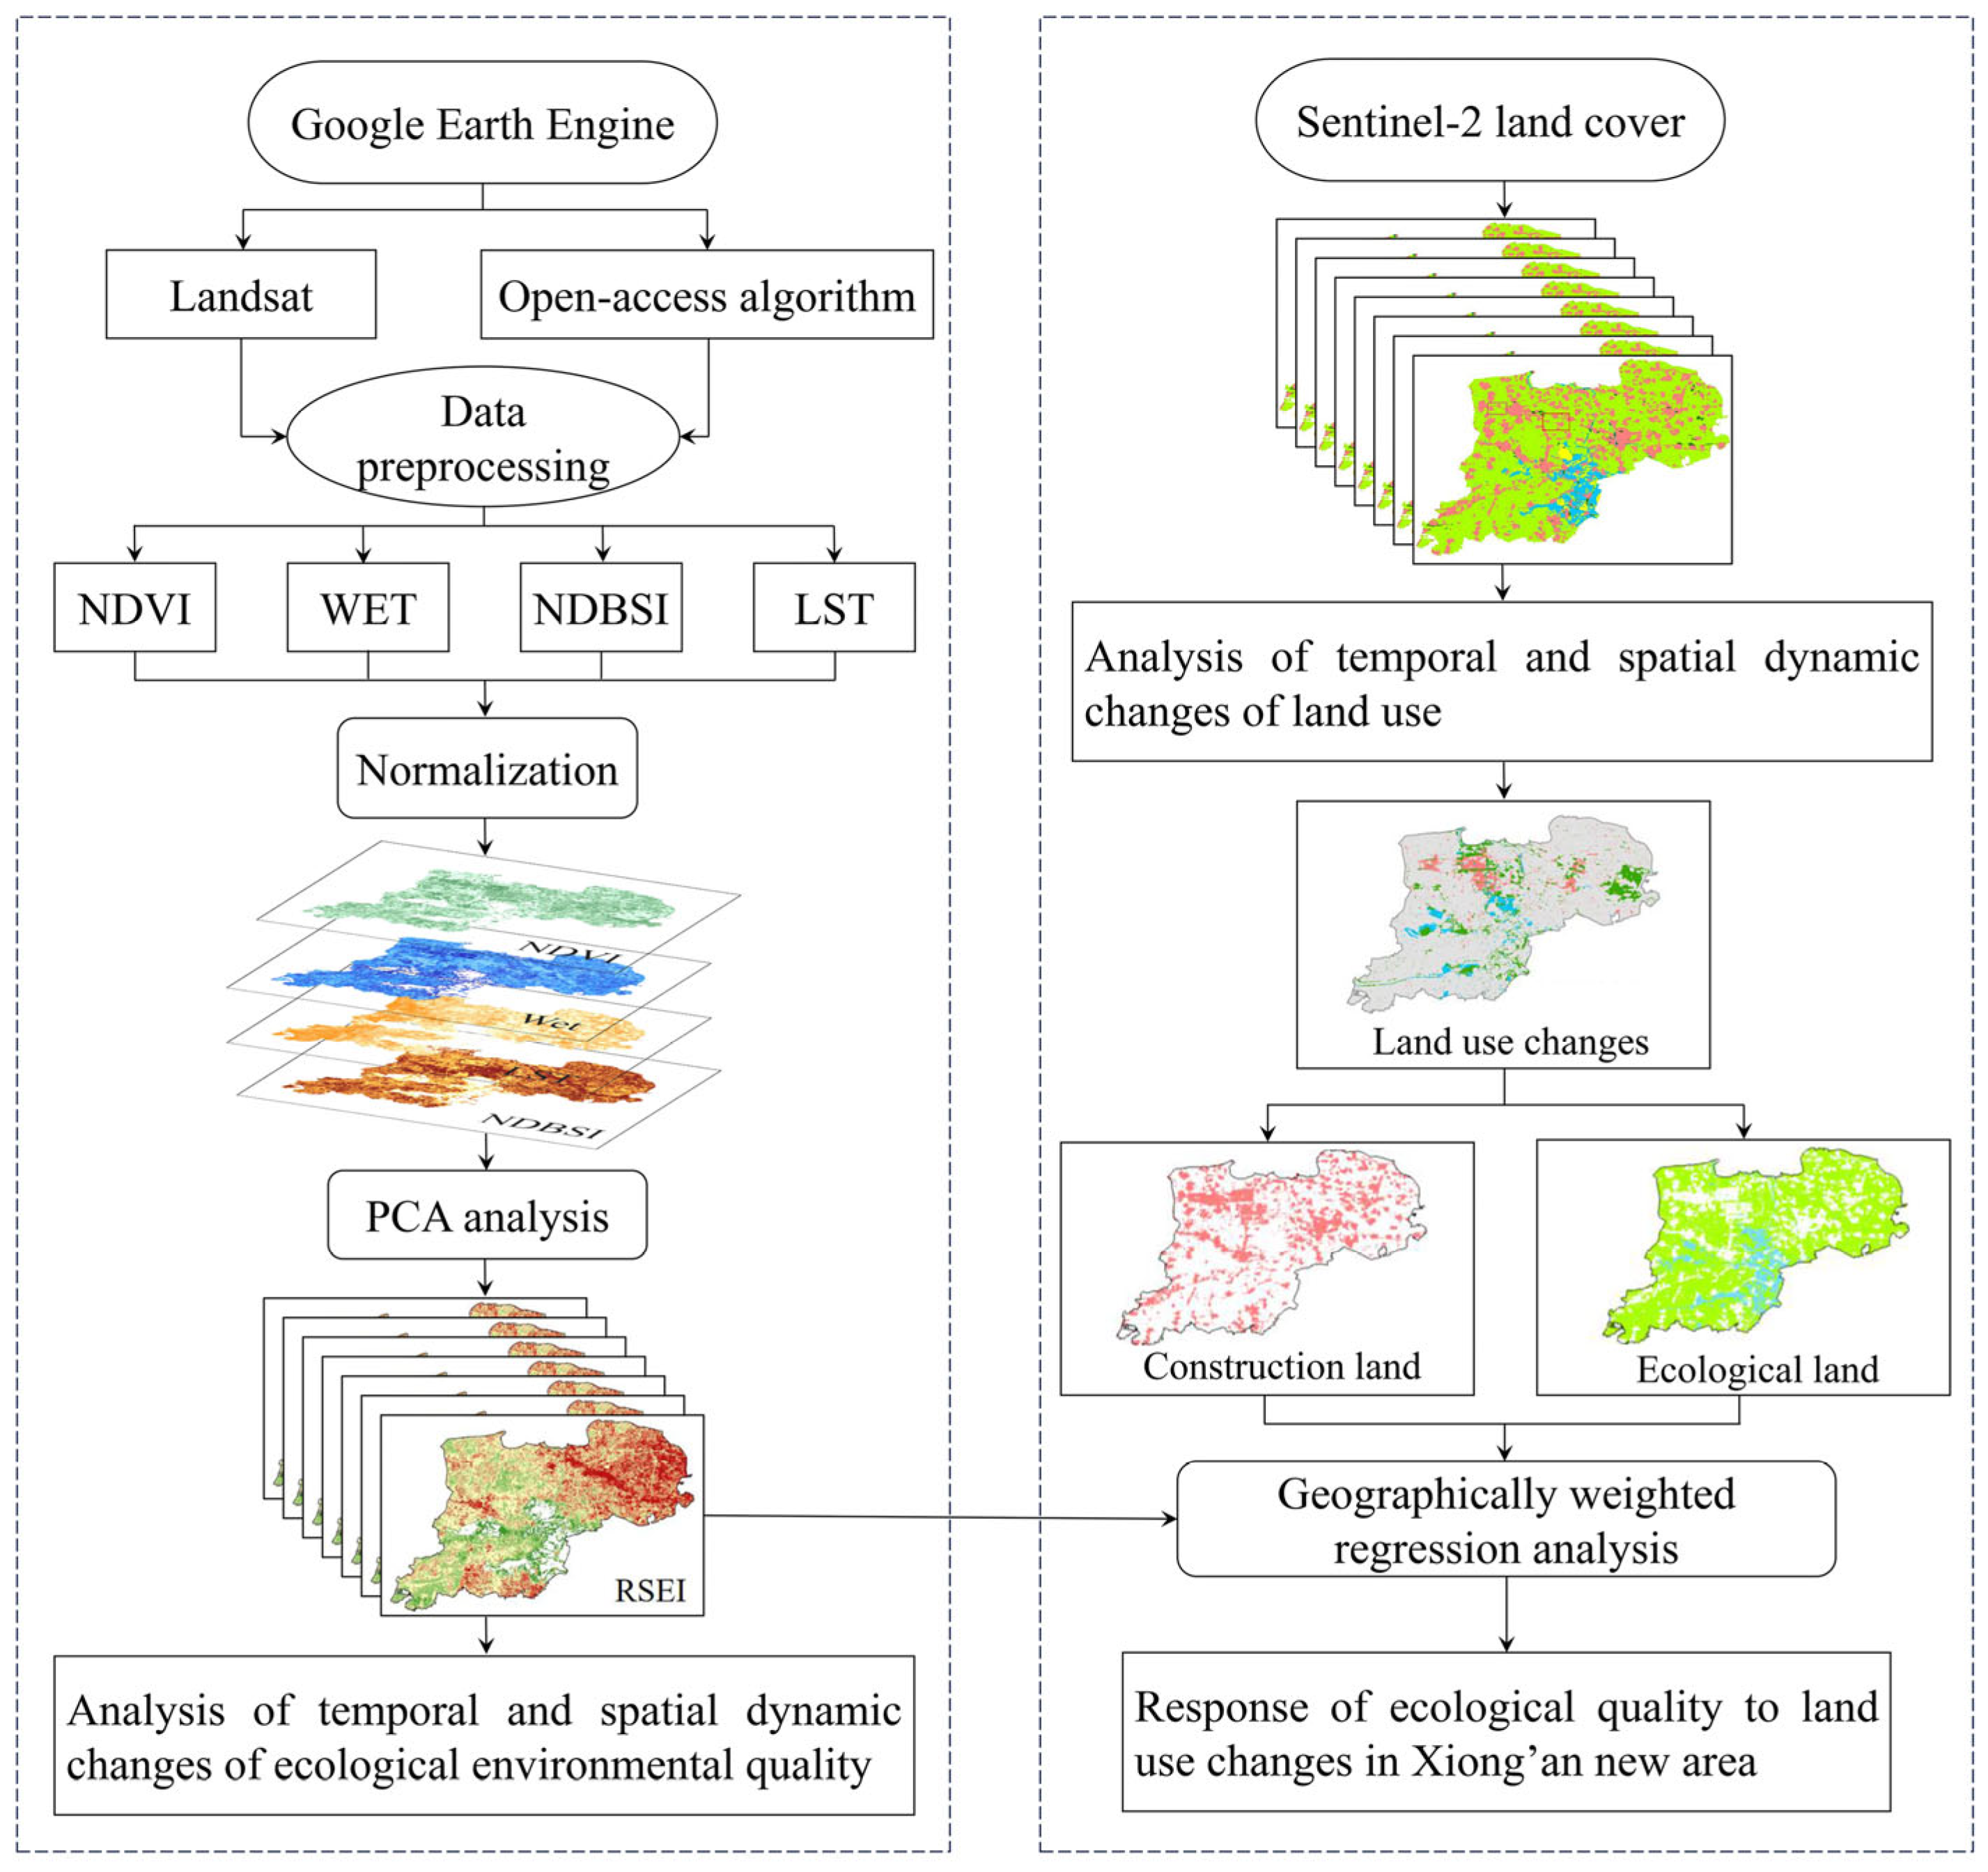
The methodological approach of this study is depicted in
Figure 2. Initially, we employed comprehensive open-source algorithms from the GEE platform, along with Landsat series remote sensing images, to produce RSEI maps for the Xiong’an New Area spanning from 2017 to 2023. These maps were then analyzed to examine the spatio-temporal variations in the region’s ecological quality. Subsequently, utilizing 10-meter resolution land use classification data from Sentinel-2, we extracted and analyzed LULC maps over the same period, focusing on their spatio-temporal dynamics. Finally, we applied the Geographically Weighted Regression (GWR) model to investigate the spatial correlation between ecological quality and LUCC.
3.1. Construction of RSEI
The RSEI is an integrative evaluation system that reflects ecological quality by combining four key indicators: greenness, wetness, dryness, and heat. These indicators are represented in Equation (1), allowing for a direct assessment of ecological conditions. The system predominantly accounts for natural factors, offering a more scientifically sound and balanced weighting of each sub-indicator compared to single-indicator evaluations. Specifically, the normalized difference vegetation index (NDVI), wetness component (Wet), normalized difference built-up soil index (NDBSI), and land surface temperature (LST) are employed as proxy variables for greenness, wetness, dryness, and heat, respectively.
These remote sensing indices were calculated using GEE, which provides extensive computational power and an array of datasets, significantly enhancing both the efficiency and accuracy of the computations [
36,
37].
3.1.1. Greenness Index
The greenness index (NDVI), highly correlated with the leaf area index, plant cover, and biomass, is the most reliable measure of plant growth status [
38,
39]. Using the GEE platform, the NDVI was calculated through the “normalizedDifference” function, an API-integrated tool that automatically addresses missing and invalid data, thereby minimizing computational errors. The formula used is:
where
and
represent the near-infrared band and red band of Landsat data, respectively.
3.1.2. Wetness Index
Wetness is a crucial indicator for evaluating a region’s hydrothermal balance, providing valuable insights into ecological variability. In this study, we utilized the wetness component derived from the tasseled cap transformation to quantify moisture conditions [
40]. The calculation of this component varies based on the design and spectral response characteristics of different Landsat sensors, requiring adjustments in spectral band selection and weight distribution. The corresponding formulas for calculating wetness for various Landsat sensors are:
where
,
,
,
,
, and
represent the blue, green, red, near-infrared, short-wave infrared first, and short-wave infrared second bands of TM and OLI data, respectively.
3.1.3. Dryness Index
The dryness index is a pivotal metric for assessing soil desiccation levels, with its fluctuations serving as direct indicators of soil moisture loss. In this study, we derived the dryness index by integrating the soil index (SI) and the index-based built-up index (IBI), with weighted coefficients designed to minimize the influence of potential disparities between the two indices [
41]. This calculation approach ensures that the effects of bare soil coverage and built-up area coverage are comprehensively considered when evaluating soil desiccation, thus more precisely indicating the degree to which the ecosystem is impacted by drying. The formula for the dryness index is:
where α and β are the weight coefficients of SI and IBI, respectively.
3.1.4. Heat Index
Surface temperature, exacerbated by the “greenhouse effect” of global climate change, significantly affects vegetation patterns and water cycles within ecosystems. To construct the heat index in this study, we utilized the surface temperature dataset (MOD11A1) provided by the moderate resolution imaging spectroradiometer (MODIS) on the GEE platform [
42]. This dataset offers precise daytime and nighttime surface temperature measurements from seven spectral bands and provides composite data across various temporal scales (daily, 8-day, monthly), ensuring compatibility with different research requirements.
3.1.5. Calculation of RSEI
To construct the RSEI, we employed principal component analysis (PCA) to condense the key information from the greenness, wetness, dryness, and heat indicators into the first principal component (PC1). This method allows for the RSEI to be represented as a single composite index, eliminating potential biases arising from manual weighting. Given the different units and value ranges of the indicators, we first normalized all indicator values. These normalized values were then synthesized into a new image via the GEE band combination algorithm. A principal component transformation was applied, and the statistical results of PC1 through PC4 were computed. Given that PC1 encapsulates the most critical information, we standardized only PC1, making the RSEI expression more intuitive. The formula is:
where in Eq. (8),
represents the original remote sensing ecological index; PC1 represents the first principal component. In Eq. (9),
and
represent the minimum and maximum values of the
. The RSEI is a quantitative measure of regional ecological conditions. Its value ranges from 0 to 1, with higher values indicating superior ecological conditions and lower values reflecting ecological degradation.
3.2. Analysis of LUCC
3.2.1. LUCC Dynamic Degree
The LUCC dynamic degree serves as a precise measure of the magnitude and rate of change in a specific land-use category over a defined period [
43]. This metric provides critical insights into the transformation of land resources, forming a solid foundation for forecasting future land use patterns. The formula for this calculation is presented as follows:
100%
where K represents the LUCC dynamics degree; and are the areas at the beginning and end of the given period; is the time span of the given period.
3.2.2. LULC Transfer Matrix
The LULC transfer matrix quantitatively captures the transitions between various LULC types, revealing the rates of conversion from one category to another [
44]. In this study, the transfer matrix is employed to analyze both the direction and magnitude of LULC transitions. The formula for the LULC transfer matrix is expressed as:
where
represents the study area; n represents the land-use type;
,
(
,
= 1, 2, 3, …
) represent the land-use type before and after transformation; and
represents the study area of land-use type i converted to land-use type j.
3.3. Geographically Weighted Regression Analysis
GWR is an advanced analytical approach for detecting spatial heterogeneity based on proximity effects. This technique facilitates the creation of localized regression models at each observation point within the study area [
45]. By doing so, it enables the assessment of spatial variation and its driving factors at different scales, yielding location-specific predictive outcomes. Unlike traditional linear regression models, GWR accommodates the localized influence of spatial entities, thereby enhancing accuracy in examining the relationship between ecological quality and LUCC [
46,
47]. The GWR model is formulated as:
where
represents the dependent variable value at point
, expressed as ecological quality in this study;
represents the independent variable value at point
, replaced by land use intensity change;
represents the coordinates of the observation point;
is the intercept variable;
is the regression coefficient;
is the random disturbance term.
4. Results
4.1. Spatio-Temporal Heterogeneity in Ecological Quality
The PCA results in
Table 1 reveal that PC1 consistently accounted for more than 60% of the variance from 2017 to 2023, effectively capturing the primary characteristics of the four indicators. Notably, WET, NDVI, NDBSI, and LST contributed significantly and stably to PC1 compared to PC2 through PC4. Over the seven-year period, the influence of these variables on PC2, PC3, and PC4 fluctuated, reinforcing the rationale for selecting PC1 as the foundation for constructing the RSEI.
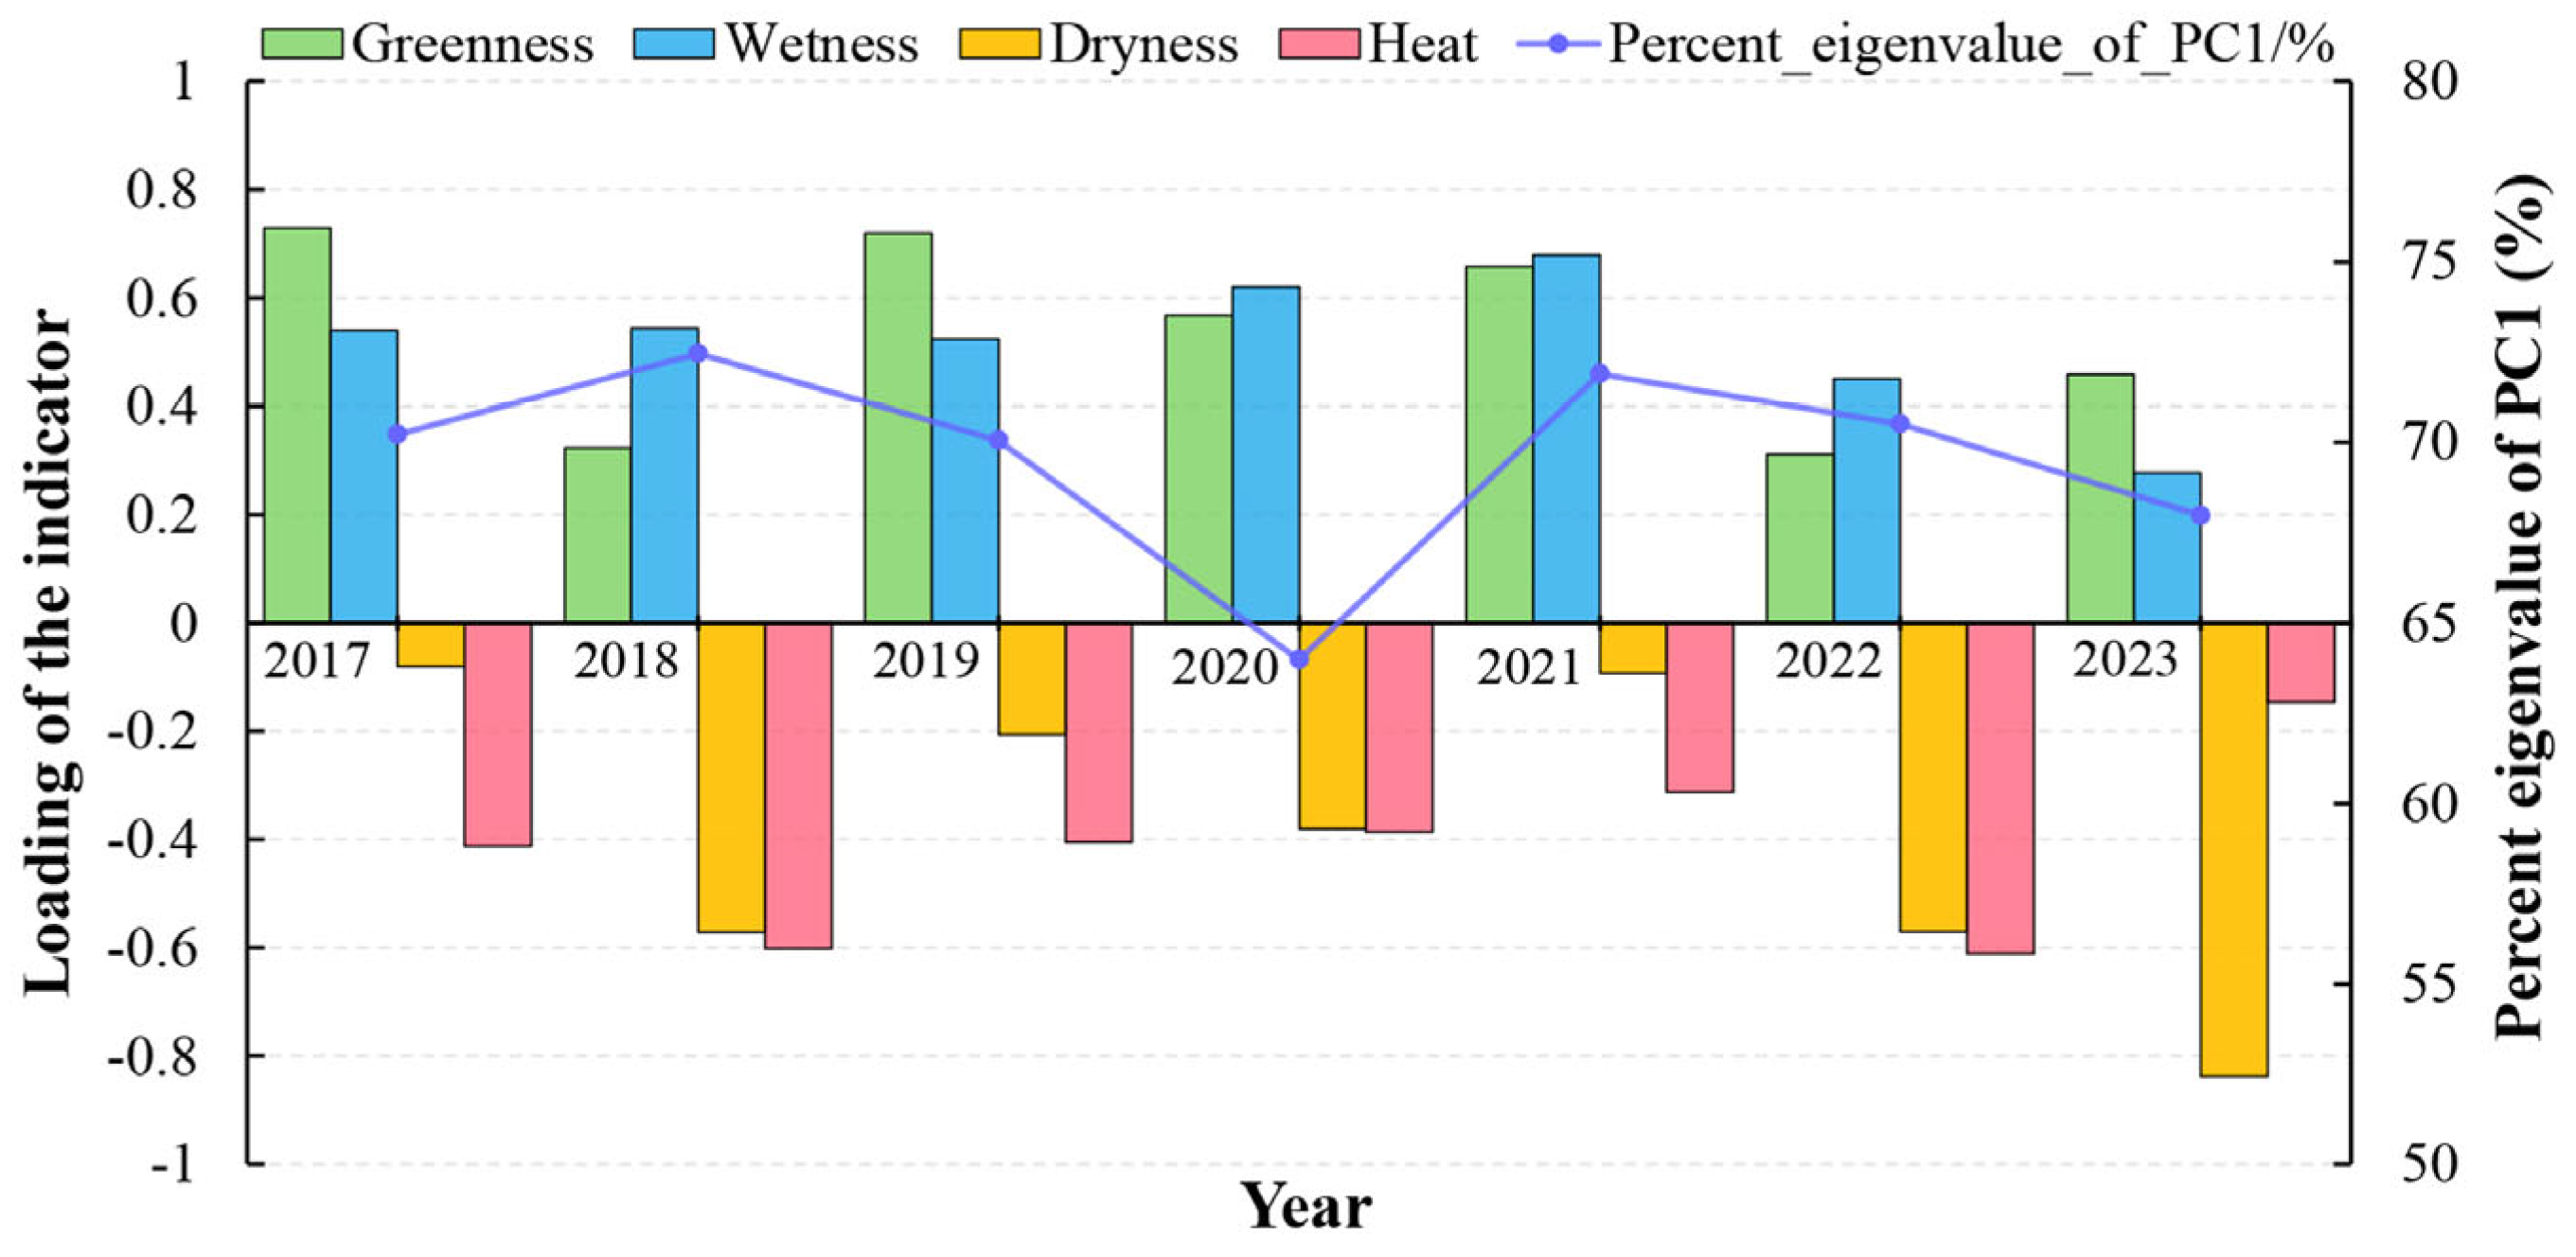
Analysis of PC1 (
Figure 3) demonstrates a positive correlation between the loadings of WET and NDVI, suggesting their beneficial impact on the ecological environment. In contrast, NDBSI and LST are negatively correlated, implying potential adverse effects. These findings are consistent with the current state of the ecological environment. However, the temporal variation in the loadings of these four indicators reflects the complex interactions between environmental factors—such as climate, soil, vegetation, and human activities—that collectively influence changes in RSEI. Despite minor fluctuations in PC1’s eigenvalue percentages, particularly the dip to 63.98% in 2020, the value remains stable at around 70% in other periods, underscoring the robustness of PC1 in explaining the variability in RSEI.
Table 1.
Principal component analysis results of RSEI from 2017 to 2023.
Table 1.
Principal component analysis results of RSEI from 2017 to 2023.
| Year |
Indicators |
PC1 |
PC2 |
PC3 |
PC4 |
| 2017 |
NDVI |
0.729 |
−0.149 |
0.667 |
−0.038 |
| WET |
0.540 |
0.112 |
−0.599 |
−0.581 |
| NDBSI |
−0.081 |
−0.980 |
−0.137 |
−0.123 |
| LST |
−0.412 |
0.076 |
0.422 |
−0.803 |
| Eigenvalue |
0.046 |
0.014 |
0.005 |
0.000 |
| Percent eigenvalue |
70.22% |
21.17% |
7.82% |
0.78% |
| 2018 |
NDVI |
0.323 |
0.692 |
0.393 |
−0.014 |
| WET |
0.544 |
−0.313 |
−0.384 |
−0.634 |
| NDBSI |
−0.571 |
−0.533 |
0.825 |
−0.172 |
Table 1.
Principal component analysis results of RSEI from 2017 to 2023 (continued).
Table 1.
Principal component analysis results of RSEI from 2017 to 2023 (continued).
| Year |
Indicators |
PC1 |
PC2 |
PC3 |
PC4 |
| 2018 |
LST |
−0.602 |
0.372 |
0.127 |
−0.753 |
| Eigenvalue |
0.037 |
0.007 |
0.006 |
0.000 |
| Percent eigenvalue |
72.46% |
14.55% |
12.09% |
0.90% |
| 2019 |
NDVI |
0.720 |
−0.212 |
0.660 |
−0.005 |
| WET |
0.524 |
0.001 |
−0.575 |
−0.628 |
| NDBSI |
−0.206 |
−0.970 |
−0.087 |
−0.094 |
| LST |
−0.405 |
0.119 |
0.475 |
−0.772 |
| Eigenvalue |
0.042 |
0.012 |
0.005 |
0.000 |
| Percent eigenvalue |
70.05% |
20.36% |
8.94% |
0.64% |
| 2020 |
NDVI |
0.568 |
−0.322 |
0.758 |
0.003 |
| WET |
0.620 |
−0.141 |
−0.522 |
−0.568 |
| NDBSI |
−0.380 |
−0.915 |
−0.104 |
−0.092 |
| LST |
−0.386 |
0.120 |
0.377 |
−0.818 |
| Eigenvalue |
0.036 |
0.011 |
0.008 |
0.000 |
| Percent eigenvalue |
63.98% |
20.60% |
14.77% |
0.65% |
| 2021 |
NDVI |
0.658 |
−0.300 |
−0.690 |
0.006 |
| WET |
0.679 |
0.196 |
0.566 |
0.425 |
| NDBSI |
−0.093 |
−0.930 |
0.317 |
0.154 |
| LST |
−0.312 |
0.070 |
−0.319 |
0.891 |
| Eigenvalue |
0.032 |
0.008 |
0.004 |
0.000 |
| Percent eigenvalue |
71.89% |
17.98% |
9.76% |
0.36% |
| 2022 |
NDVI |
0.311 |
0.632 |
−0.469 |
0.532 |
| WET |
0.451 |
−0.205 |
0.660 |
0.563 |
| NDBSI |
−0.570 |
−0.453 |
−0.282 |
0.623 |
| LST |
−0.611 |
0.593 |
0.512 |
0.105 |
| Eigenvalue |
0.067 |
0.019 |
0.007 |
0.001 |
| Percent eigenvalue |
70.51% |
20.28% |
7.79% |
1.42% |
| 2023 |
NDVI |
0.459 |
0.365 |
−0.473 |
0.543 |
| WET |
0.277 |
−0.185 |
0.783 |
0.539 |
| NDBSI |
−0.838 |
−0.267 |
−0.295 |
0.638 |
| LST |
−0.146 |
0.871 |
0.275 |
0.082 |
| Eigenvalue |
0.041 |
0.015 |
0.003 |
0.000 |
| Percent eigenvalue |
67.97% |
24.80% |
6.44% |
0.79% |
From 2017 to 2023, the average RSEI in the Xiong’an New Area exhibited a general upward trend (
Figure 4a), reflecting continuous improvement in the region's overall ecological quality. Notably, following the announcement of the Xiong’an New Area construction plan in 2017, the average RSEI dropped sharply from 0.57 to 0.45 between 2017 and 2018, highlighting the significant impact of initial urban construction on the ecological environment. Nevertheless, as construction progressed, the average RSEI fluctuated but steadily recovered, rising from 0.45 in 2018 to 0.76 in 2023, indicating the region’s strong emphasis on ecological protection throughout the development process. To more accurately assess improvements in ecological quality, RSEI values were categorized into five levels: excellent (0.8–1.0), good (0.6–0.8), moderate (0.4–0.6), fair (0.2–0.4), and poor (0–0.2). Detailed trend analysis of each level (
Figure 4b) reveals that in 2017, areas with moderate or higher ecological quality (i.e., excellent and good) comprised 42.98% of the total area. However, this proportion dramatically declined to 14.80% in 2018, further confirming the adverse effects of early construction on the ecological environment. From 2019 onward, this trend reversed, with the proportion of moderate and above levels increasing annually: 40.8% in 2019, 45.3% in 2020, 51.6% in 2021, 53.5% in 2022, and reaching 71.1% in 2023. These data underscore the substantial recovery of ecological quality in Xiong’an New Area and validate the success of its green and livable urban development strategy.
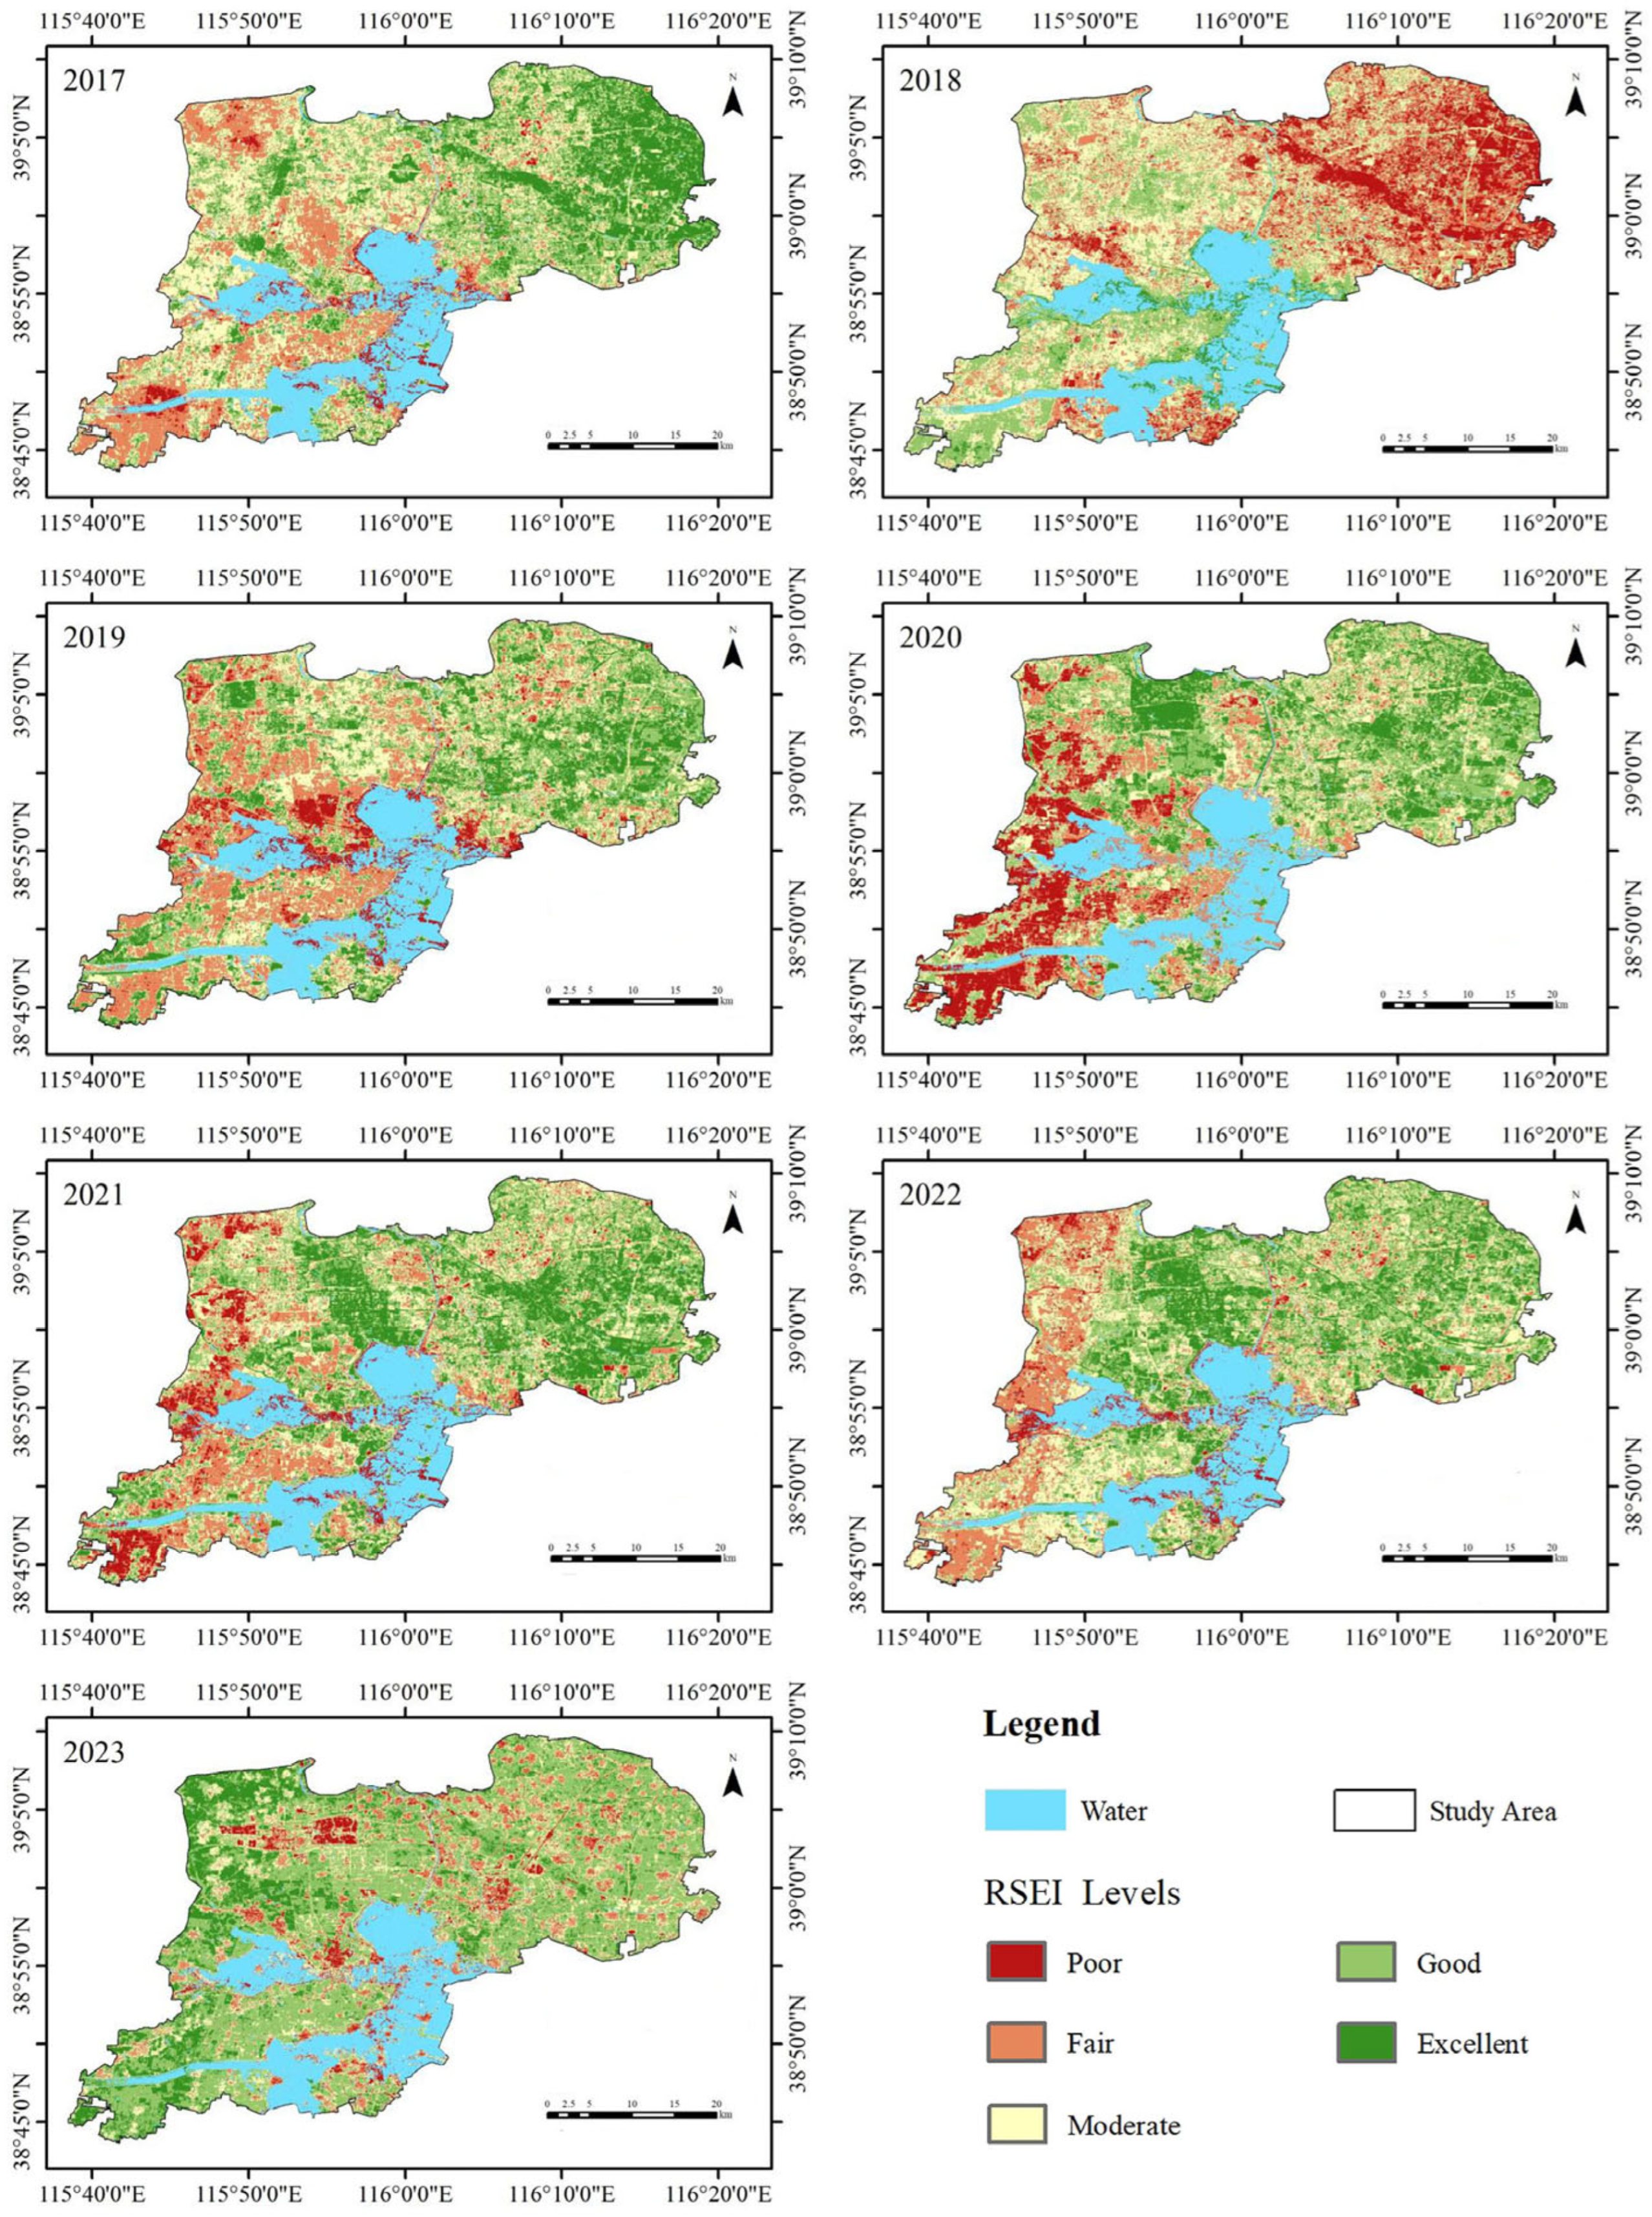
Figure 5 illustrates the spatio-temporal distribution of RSEI in Xiong’an New Area from 2017 to 2023. The most significant fluctuations in RSEI occurred in the northeast and southwest regions. From 2017 to 2018, there was a marked decline in RSEI values in the northeast, followed by a recovery and subsequent decline from 2018 to 2023. Nonetheless, the 2023 RSEI value remained considerably higher than in 2018. In the southwest, RSEI values reached their lowest point in 2020 and increased annually from 2021 to 2023. Regarding spatial distribution, the lowest RSEI values were concentrated in the southwestern region, urban areas of the three counties, and around Baiyangdian Lake, while higher RSEI values were observed in the northeast and southern regions of Anxin County. This distribution suggests a strong correlation between ecological quality and LULC, with distinct spatial heterogeneity and the presence of hot and cold spot clusters. Cold spots were primarily found on artificial surfaces, flooded lands around Baiyangdian, and oil extraction areas in Xiong County. In contrast, hot spots were concentrated in forested areas of Anxin County, wetlands sustained by Baiyangdian, and along riverbanks. The boundary regions between hot and cold spots were dominated by permanent farmland, where ecological quality ranged from moderate to poor.
4.2. Spatio-Temporal Heterogeneity of LULC
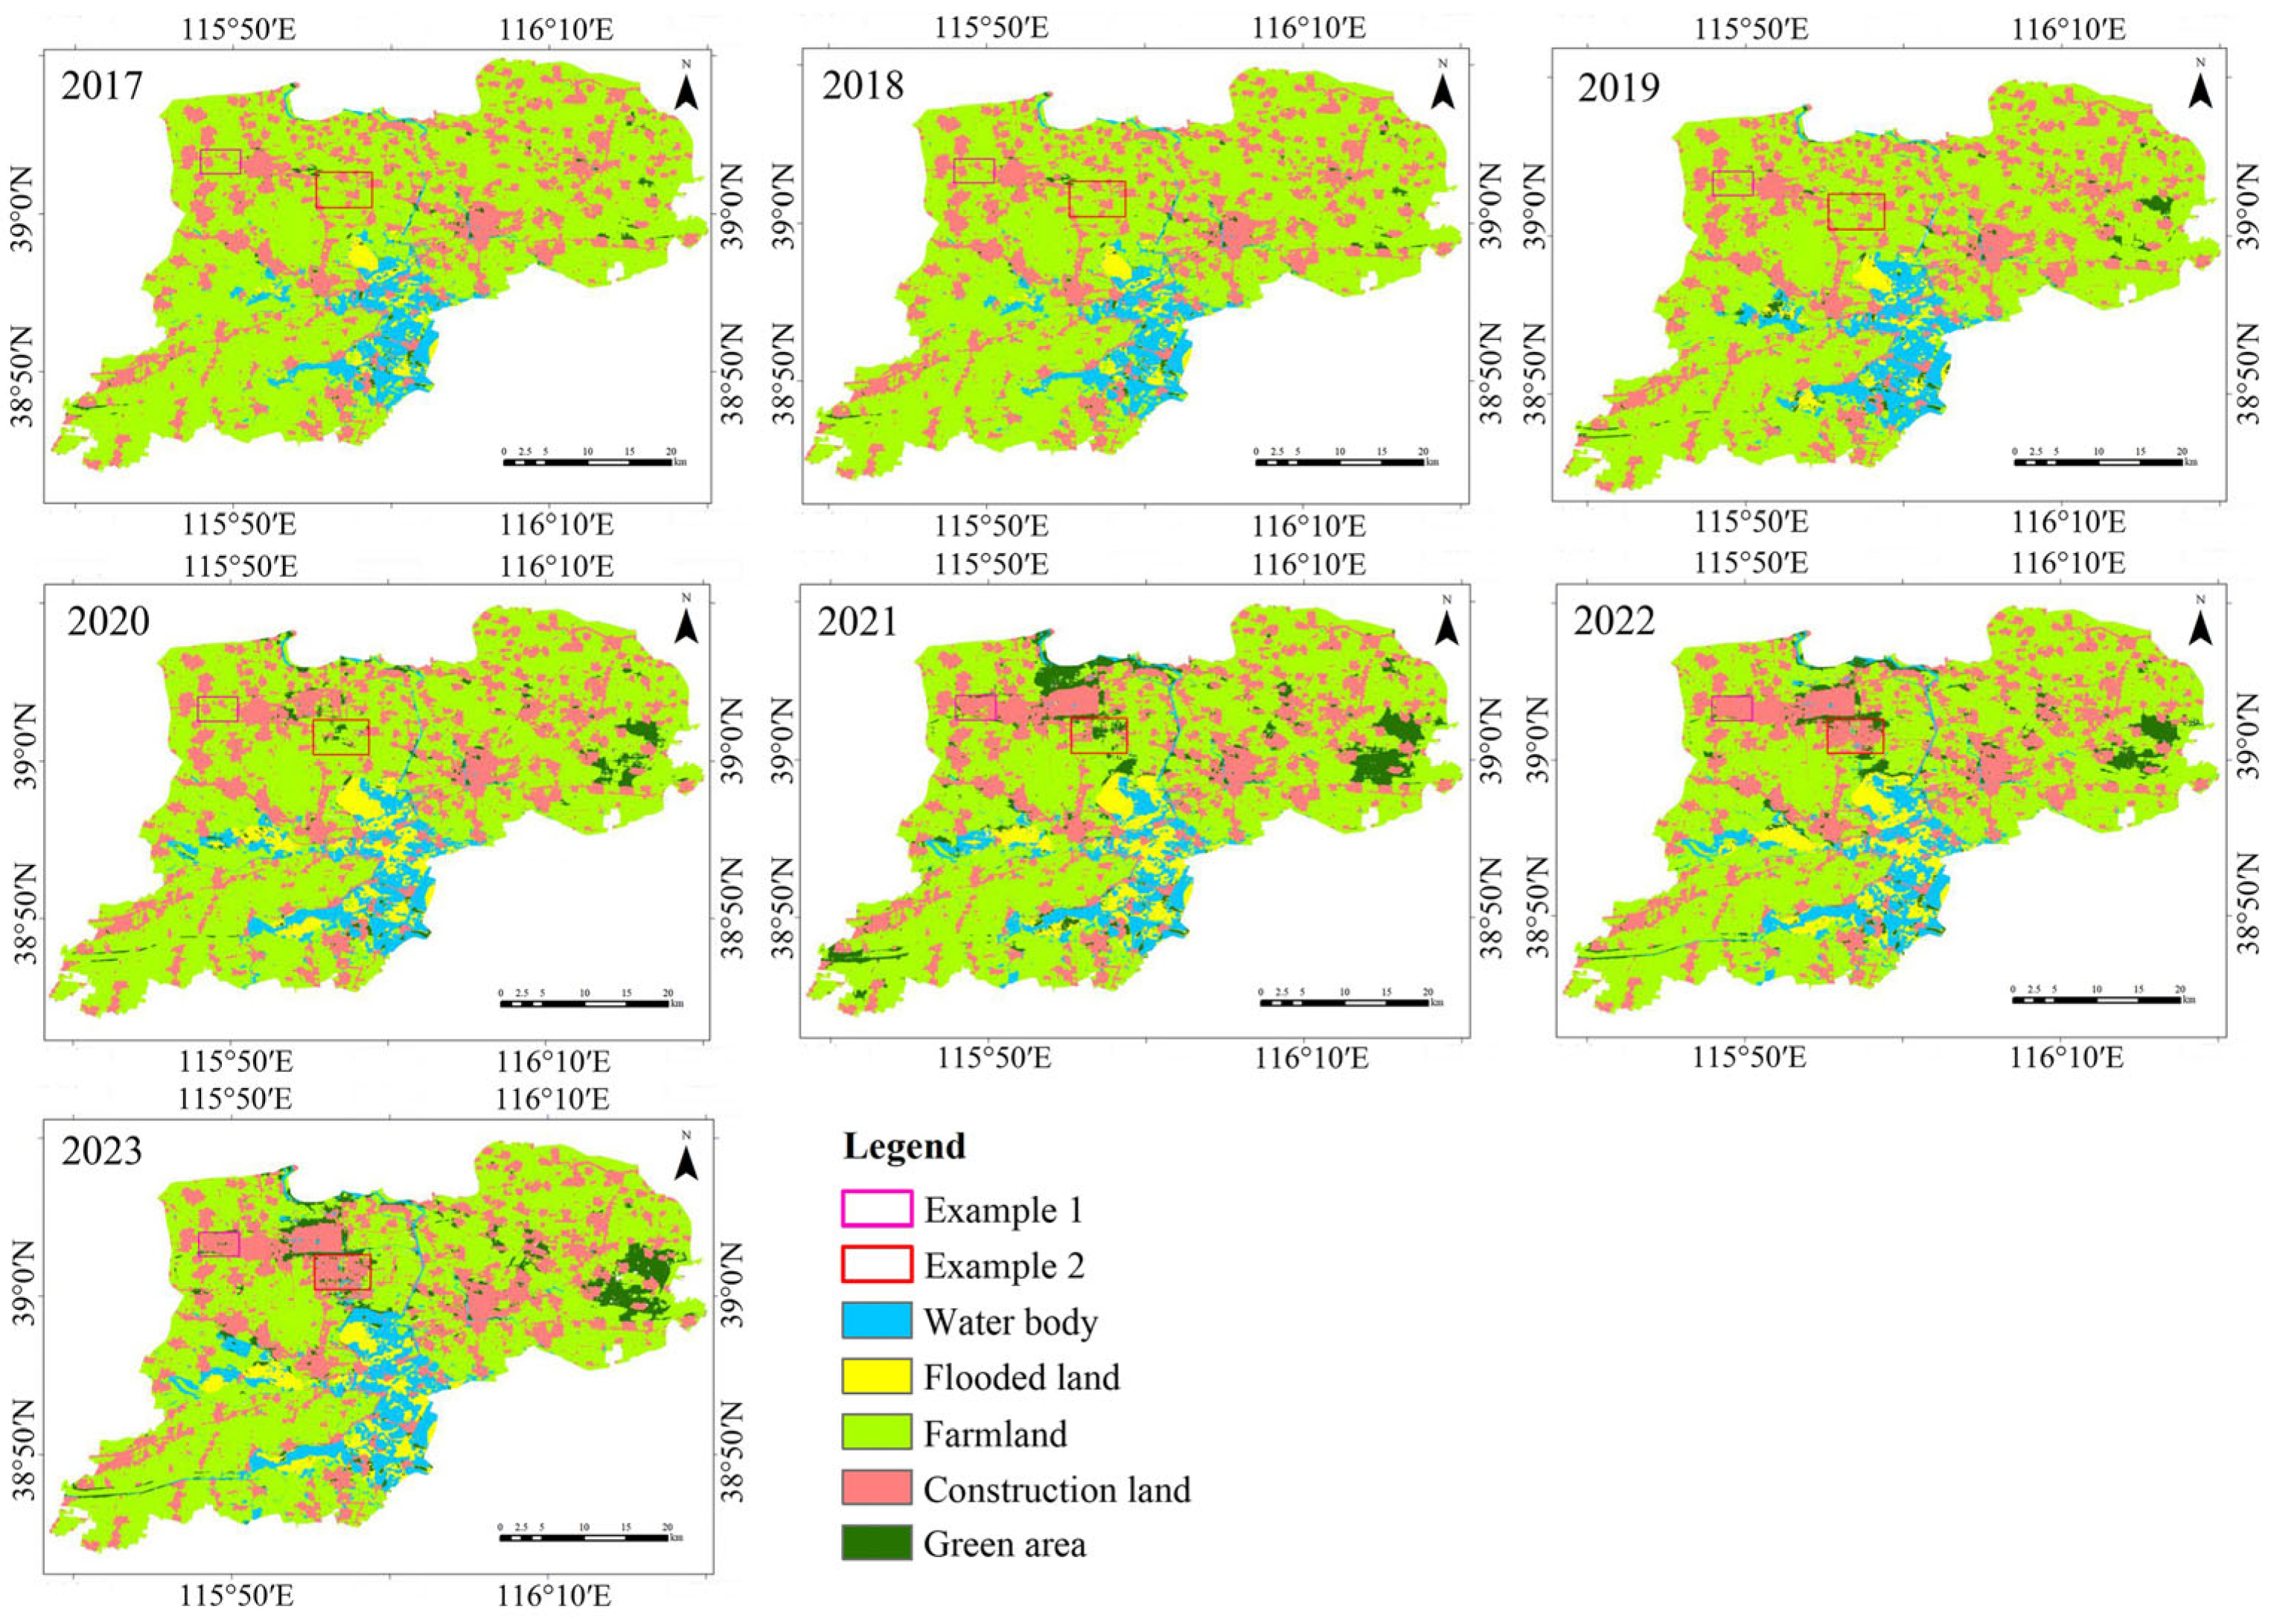
The spatial distribution map of land use in Xiong’an New Area from 2017 to 2023 (
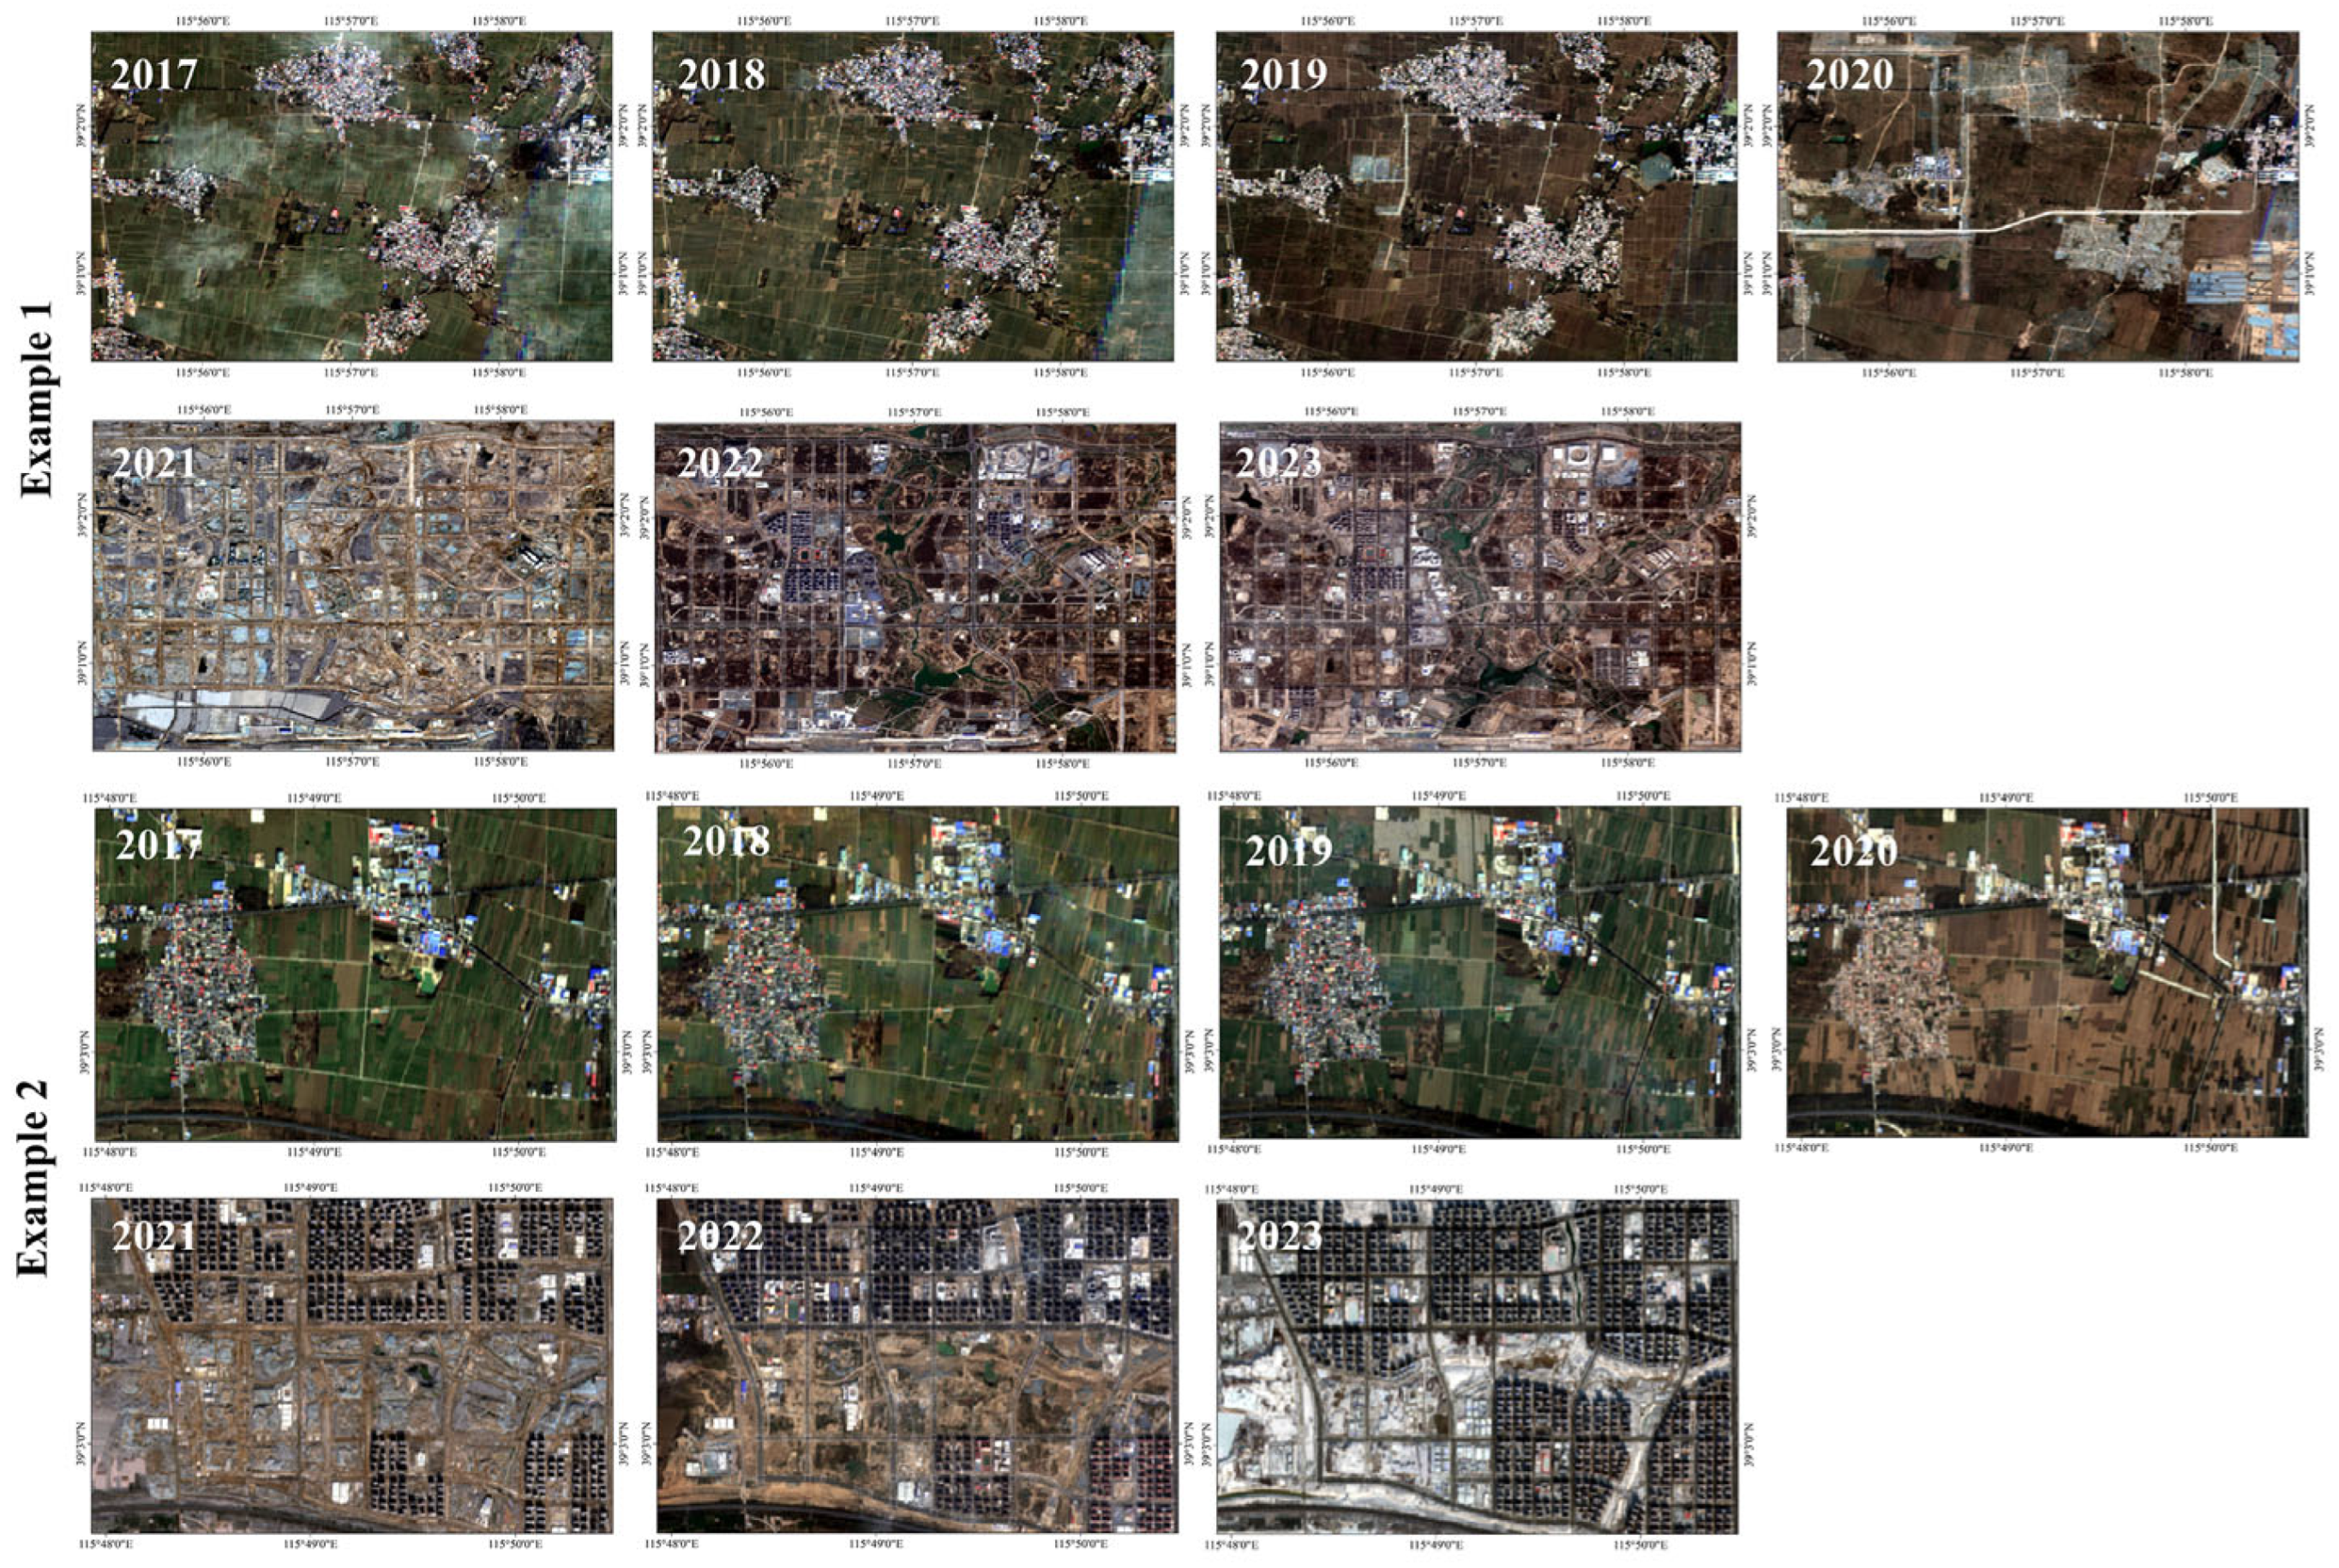
Figure 6) shows a consistent decline in farmland, which remains the most prevalent land use type in the region. Construction land is primarily concentrated in the urban areas of Rongcheng County, Xiong County, and Anxin County, with significant expansion noted in Rongcheng’s built-up area. As shown in
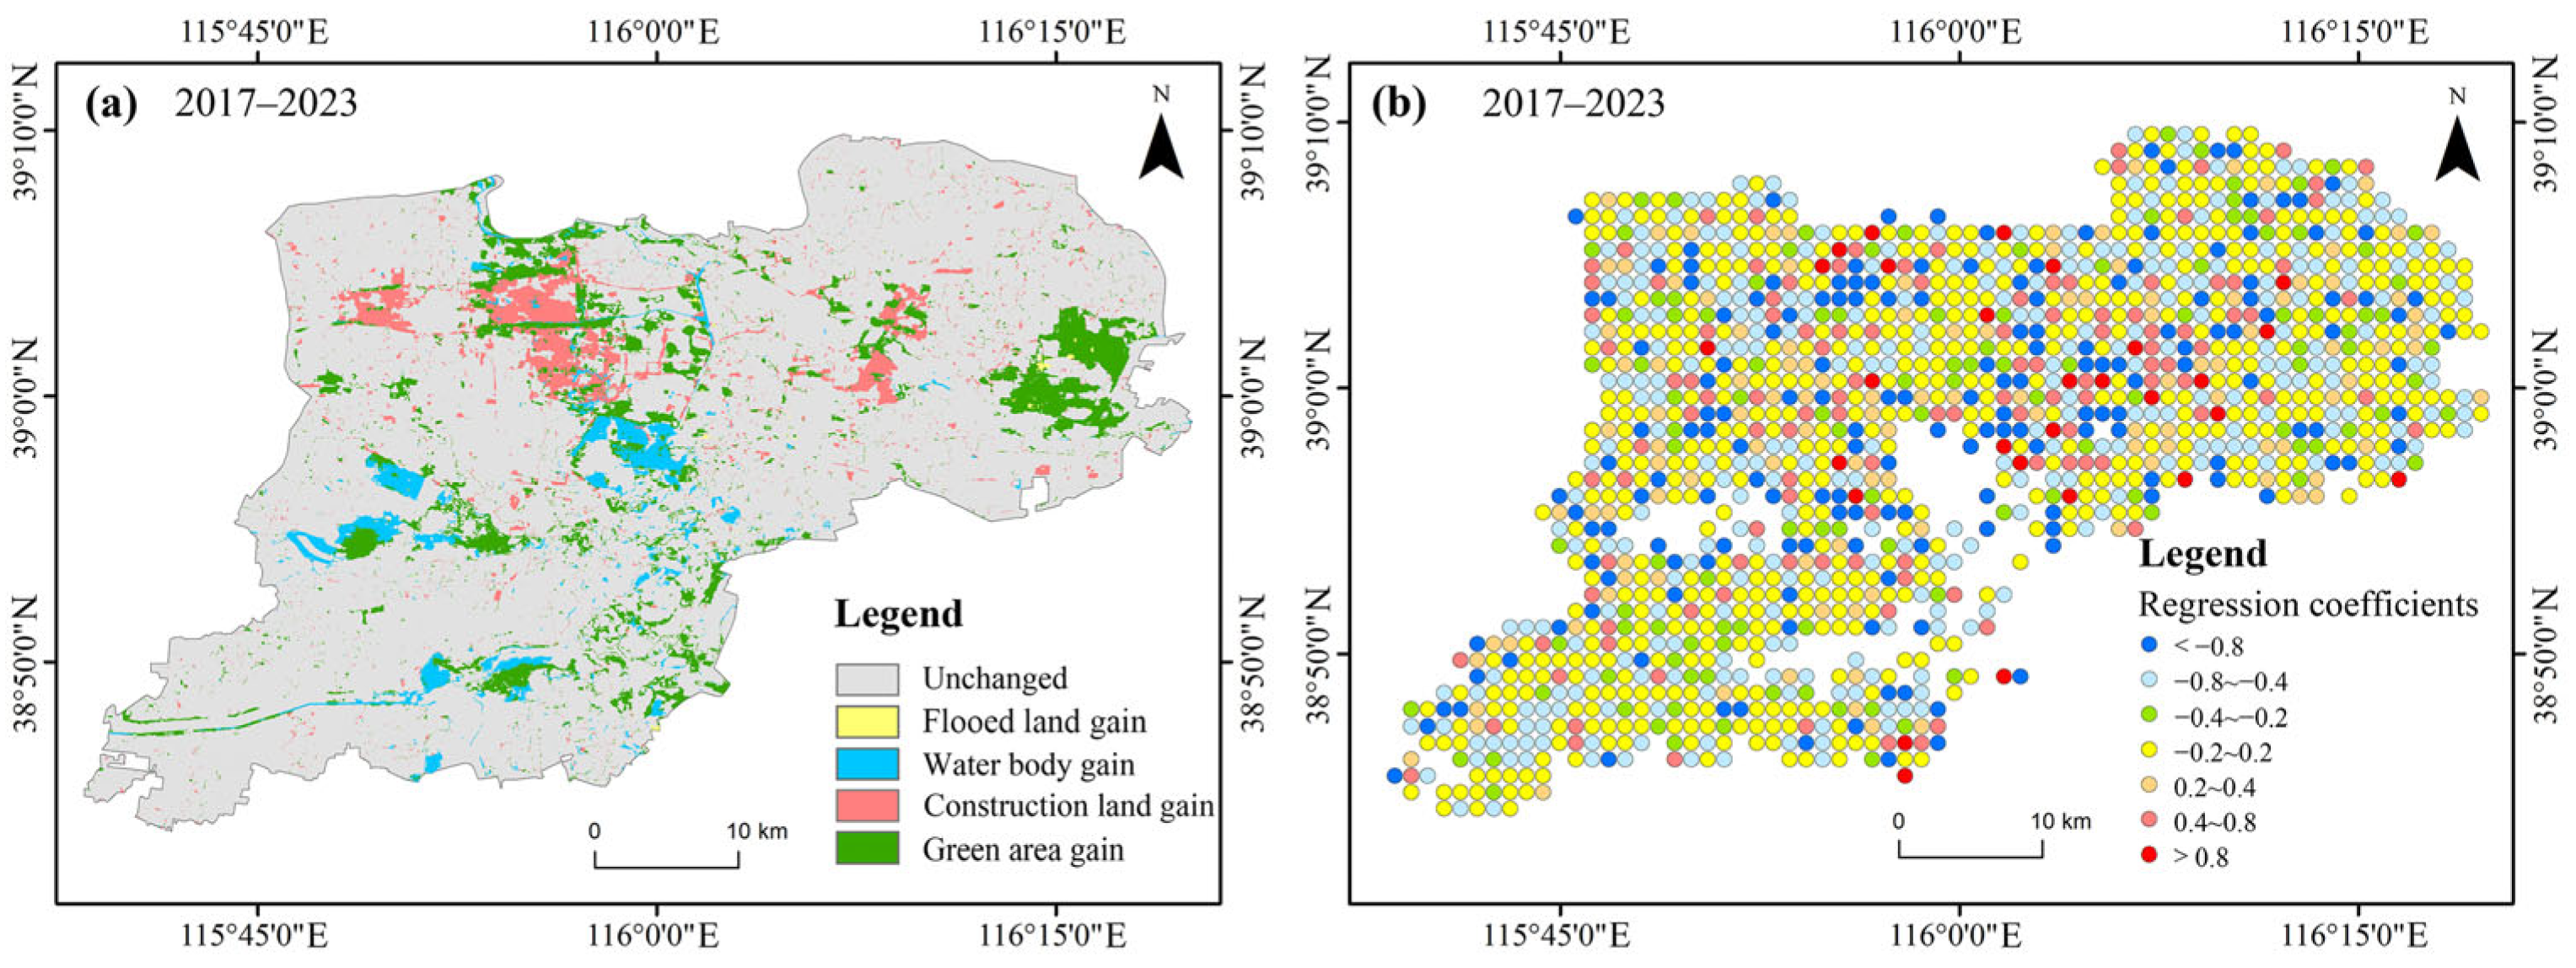
Figure 7 (Examples 1 and 2), a considerable portion of farmland has been converted into construction land. Notably, the green areas in the eastern part of the region have also experienced substantial growth. Water resources are concentrated in the vicinity of Baiyangdian, situated in the southeastern part of the region. The majority of flooded land is located in the area surrounding Baiyangdian.
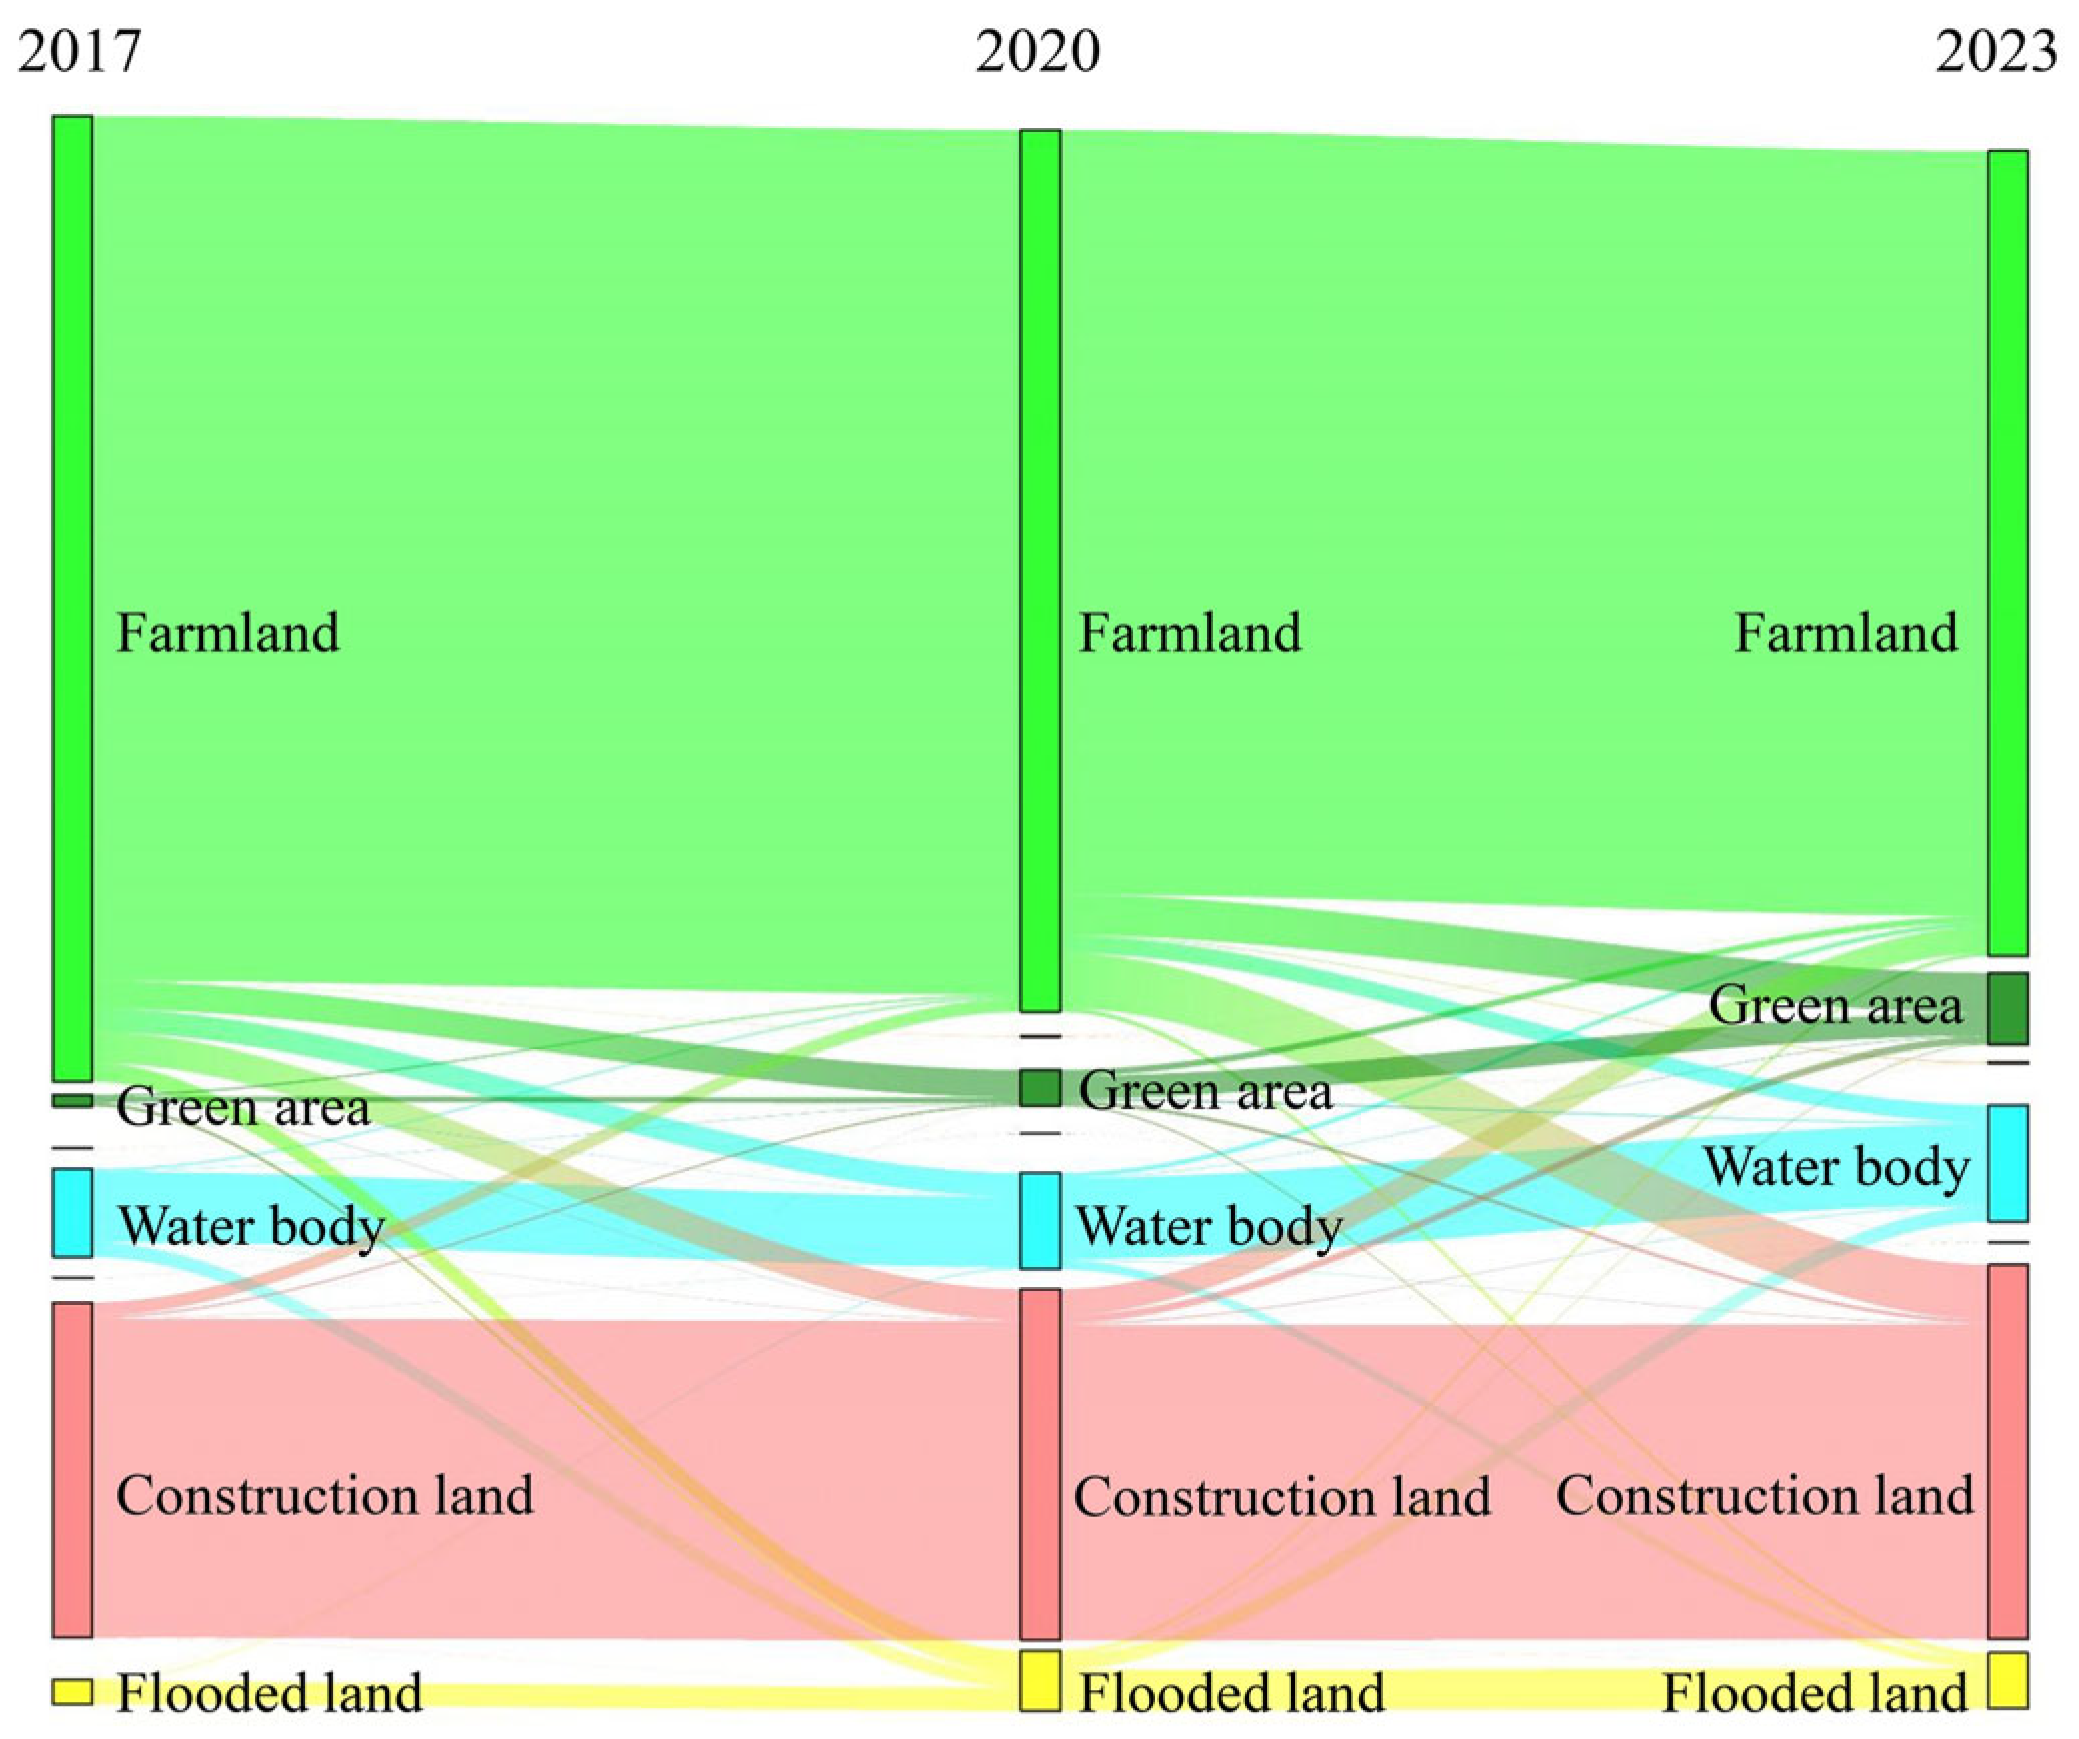
Table 2 and
Figure 8 highlight the changes in land types in Xiong’an New Area since its establishment. Farmland has persistently decreased from 1,053.45 km
2 in 2017 to 878.39 km
2 in 2023, an average annual reduction rate of 2.77% over the seven-year period.
Figure 8 illustrates the varied transitions of farmland into construction land, water bodies, flooded lands, and green areas, underscoring significant shifts in the land use structure. Among these transitions, the expansion of green areas stands out with an average annual growth rate of 82.92%, adding 65.55 km
2 and representing the fastest-growing land category, primarily due to farmland conversion. Flooded land follows with an annual growth rate of 20.45% and an area increase of 33.62 km
2, largely due to the conversion of farmland and water bodies. Similarly, water bodies have steadily expanded at an annual growth rate of 5.47%, increasing by 31.5 km
2, primarily through the conversion of farmland and flooded land. Construction land, reflecting urban expansion, grew at an annual rate of 1.94%, adding 42.81 km
2, predominantly through farmland conversion. Although the construction of Xiong’an New Area has significantly reduced farmland, the LUCCs have not been limited to construction land; rather, they have frequently shifted towards water bodies, flooded lands, and green areas. This pattern reflects the Xiong’an New Area’s guiding philosophy, encapsulated by the triad of green, ecological, and livable. This approach emphasizes the need to advance ecological land development in parallel with urban growth, fostering a harmonious balance between human activity and the natural environment.
4.3. Response of Ecological Quality to LUCC
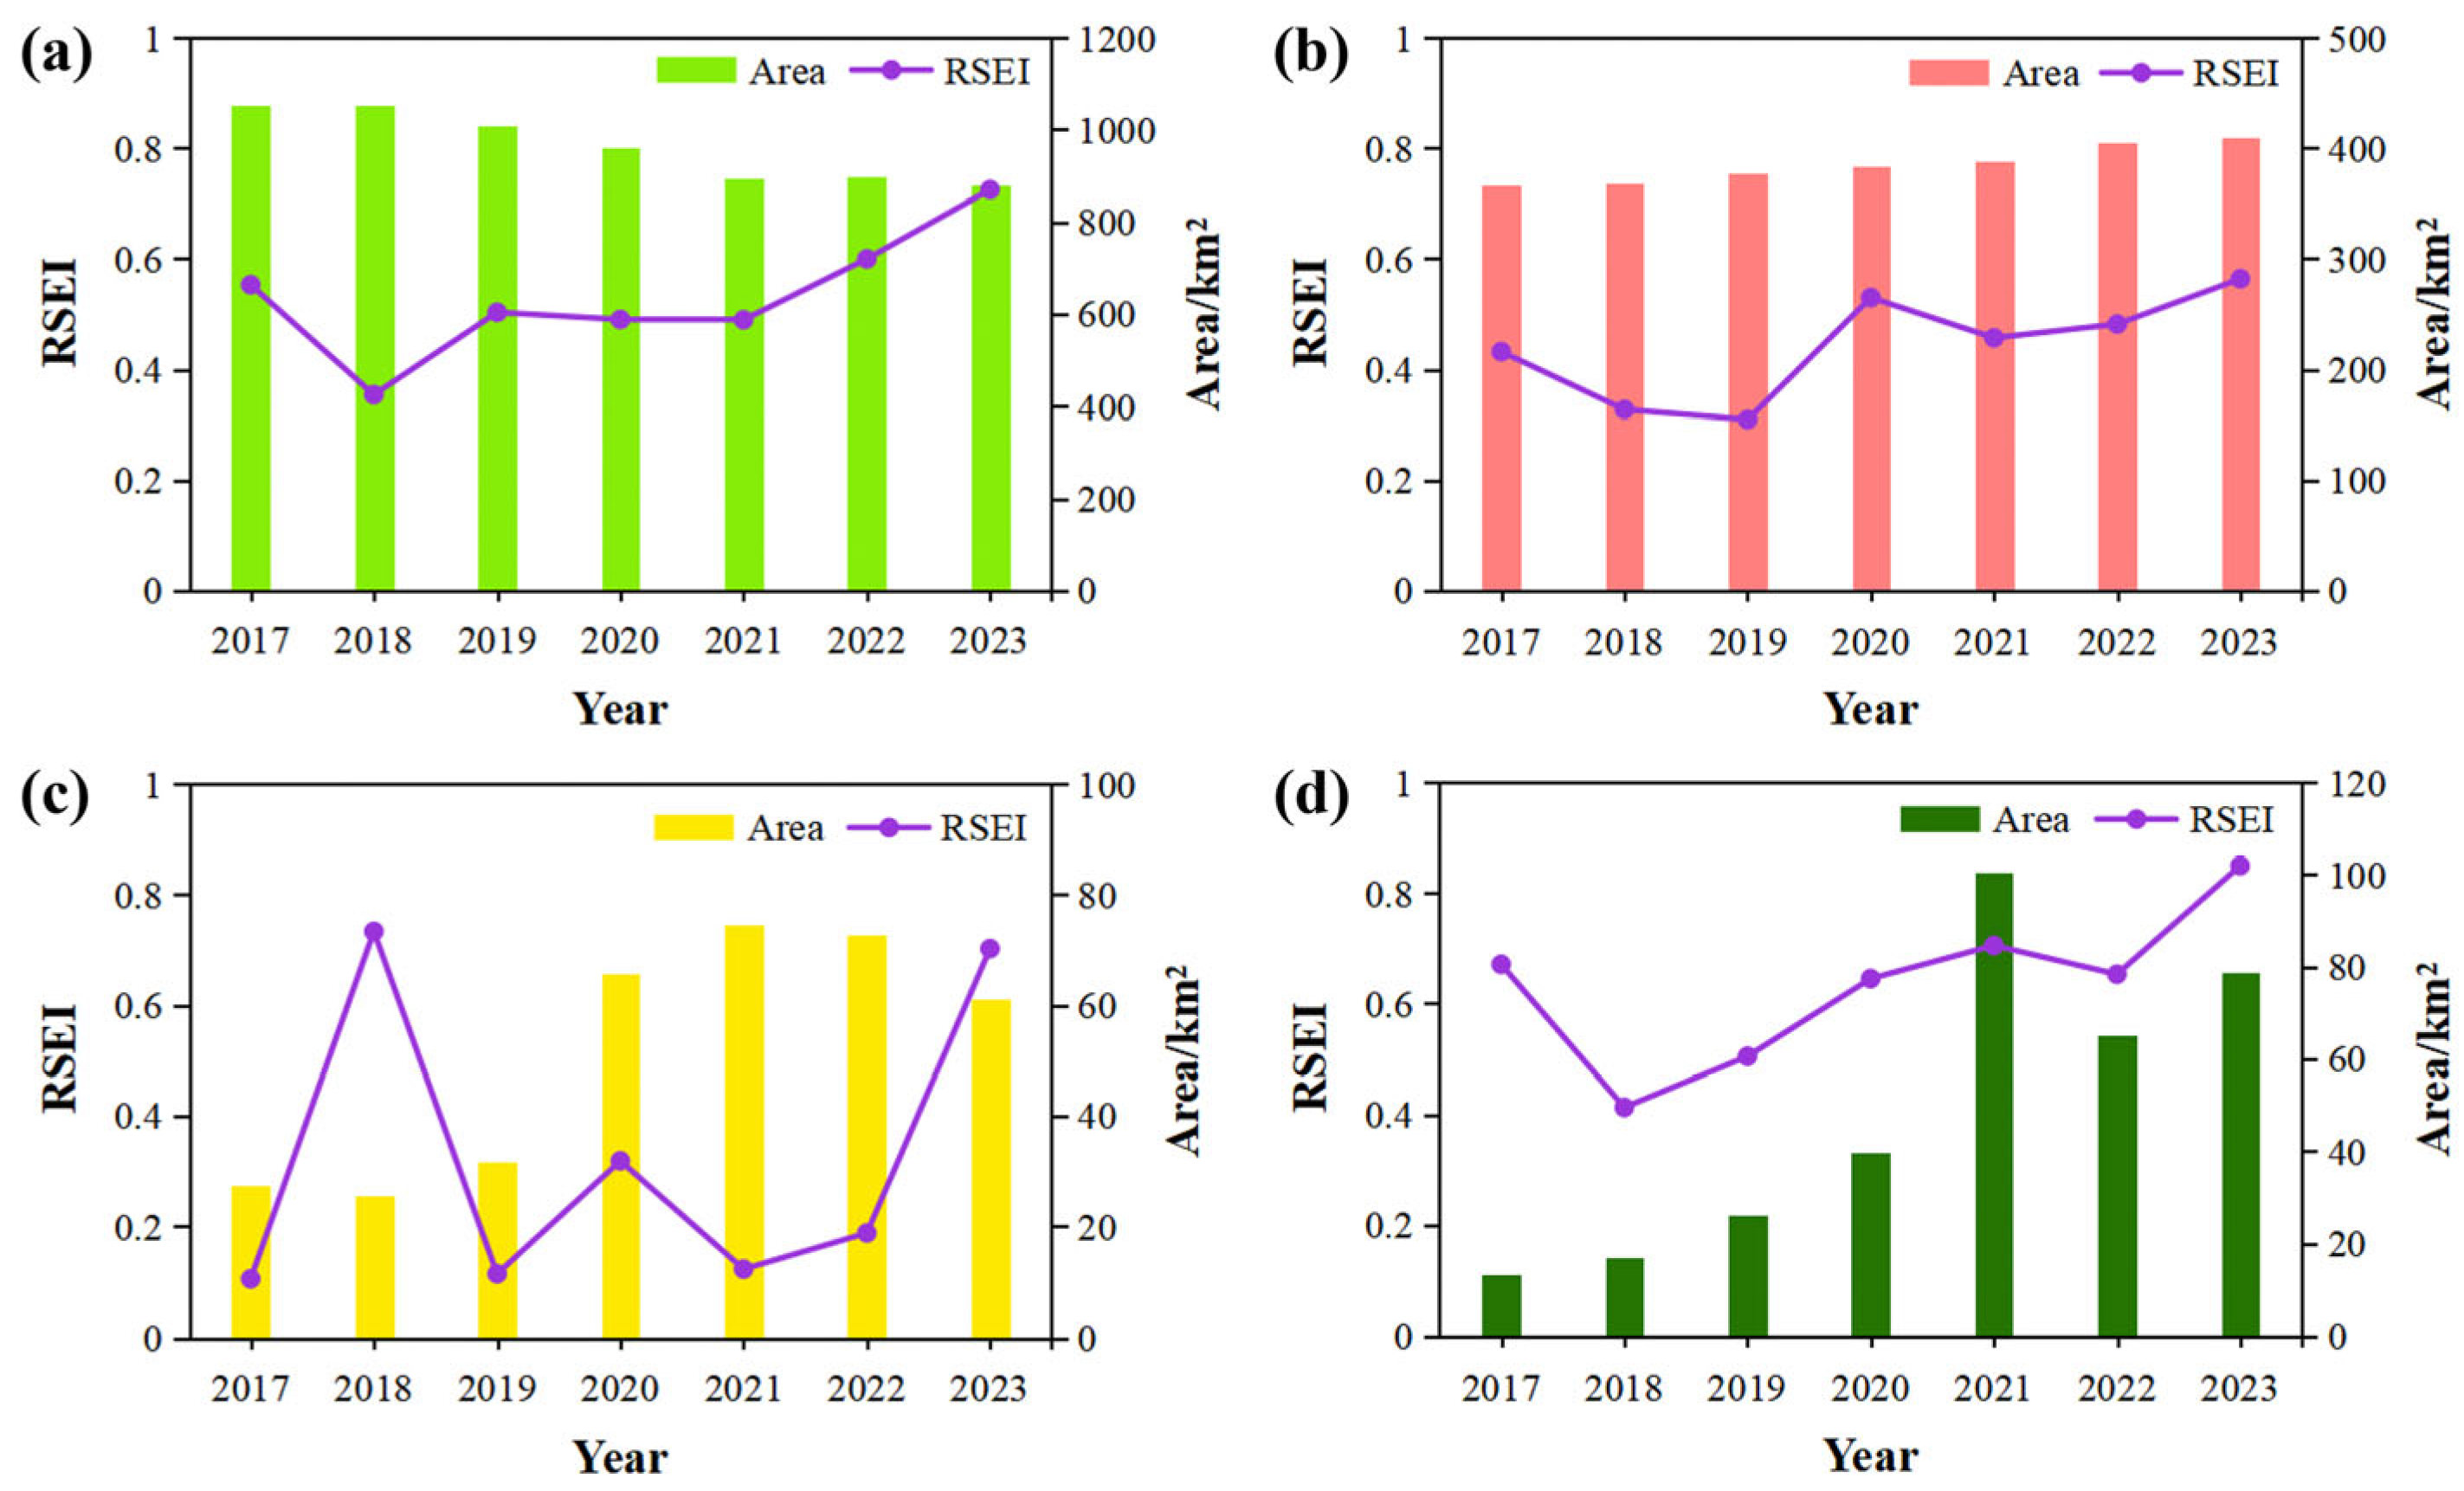
Figure 9 illustrates the changes in ecological quality and the dynamics of four major land use types—farmland, construction land, flooded land, and green areas—in Xiong’an New Area from 2017 to 2023.
Figure 9a shows a gradual reduction in farmland, with a sharper decline in the early years, followed by a slower reduction after 2021. During this period, the average RSEI of farmland increased significantly from 0.55 in 2017 to 0.73 in 2023, reflecting a 33% improvement in ecological quality. As farmland plays a foundational role in Xiong’an New area’s land use, its RSEI trend has been pivotal in shaping the region’s overall ecological quality. A notable instance of this is the temporary decrease in farmland RSEI in 2018, which aligns with the overall RSEI trend of the region (
Figure 4a). Meanwhile, construction land expanded, with its RSEI dropping by 28% between 2017 and 2019, followed by a recovery between 2020 and 2023. This pattern reflects the gradual mitigation of the initial negative impacts of construction on ecological quality. The area of flooded land exhibited overall growth. However, its RSEI showed significant fluctuations. This is directly linked to the distinctive vegetation growth cycles and dynamic land type transitions of the flooded land. As seen in
Figure 8, the expansion of flooded land was largely due to transitions from water bodies and farmland. Specifically, the conversion of water bodies to flooded land, where the short-term ecological condition resembled that of bare land, had adverse effects on the ecological environment. Green areas, meanwhile, consistently expanded, emerging as a key indicator of urban greening. Despite the RSEI for green areas reaching a nadir of 0.41 in 2018 and experiencing fluctuations in 2022, it generally trended upward, reaching 0.85 in 2023—a 27% increase. This expansion signals positive improvements in the urban ecological environment, which is crucial for enhancing residents' quality of life and fostering ecological balance.
To further elucidate the relationship between LUCC and ecological quality, a GWR model was applied to establish a quantitative spatial relationship between the two variables. The model employed an adaptive method to determine optimal weights, with the bandwidth selected using the corrected Akaike Information Criterion (AICc). The changes in ecological quality and LULC were extracted using a 1 km × 1 km grid, followed by regression analysis via the GWR tool. The results, summarized in
Table 3, indicate a high goodness-of-fit, with an adjusted R
2 of 0.68, confirming that the GWR model is well-suited for the data.
Figure 10 presents the spatial distribution of ecological quality responses to LUCCs in Xiong’an New Area from 2017 to 2023. The findings reveal that areas with the greatest urban expansion exhibit a negative spatial correlation between ecological quality and construction land, indicating that such expansion often degrades ecological quality. However, in some areas, there exists a positive correlation between ecological quality and construction land, primarily due to a significant increase in green areas, where the positive ecological impacts outweigh the negative effects of construction expansion. The regression coefficient for farmland is relatively low, suggesting a weak response to ecological quality changes. As urban fringe land expands, farmland is increasingly converted to construction land, particularly along the urban boundaries. This shift results in a strong negative correlation between ecological quality and construction land in these areas. In contrast, green areas and the Baiyangdian Wetland show a strong positive correlation with ecological quality, demonstrating that the expansion of these ecological lands has had a substantial positive effect on the region’s environmental health. Additionally, policy support in areas like the northern lakeshore of Baiyangdian and the southern mining regions of Xiong County has prioritized wetland restoration and mining area rehabilitation. The appropriate use and transformation of flooded lands have enabled the establishment of large-scale ecological green areas, such as reed wetlands, thereby significantly improving ecological quality. Overall, while the expansion of construction land poses threats to ecological quality, the growth of urban green spaces and the extension of Baiyangdian Wetland have been pivotal in driving significant improvements in the region’s overall ecological health.
5. Discussion
5.1. Improvement of Ecological Environment Quality and Driving Factors
As a central component of the Beijing-Tianjin-Hebei coordinated development strategy, Xiong’an New Area experienced rapid urbanization between 2017 and 2023. During this period, construction land expanded from 367.09 km
2 to 409.90 km
2, an increase of 12%. Despite this rapid urban growth, the overall ecological quality of the Xiong’an New Area has remained high, with a continuous upward trajectory (
Figure 4a). This achievement reflects substantial progress in ecological governance and underscores the potential of policy-driven initiatives integrated with scientific planning.
The government of Xiong’an New Area implemented a series of comprehensive measures to restore and protect the ecological environment. These initiatives include large-scale afforestation, wetland ecosystem restoration, and the rational expansion of water bodies, all of which have significantly improved the region’s greenness and wetness indices. Furthermore, these efforts have indirectly enhanced soil quality and moderated surface temperatures, culminating in a substantial improvement in the overall ecological quality of the area. These actions not only demonstrate the government’s strong commitment to ecological priority and green development but also highlight its capacity for effective scientific planning and policy execution. Moreover, the improvement in ecological quality is attributable to scientific land use planning and the establishment of rigorous environmental regulation systems. In its planning processes, Xiong’an New Area prioritized environmental protection, preventing extensive ecological degradation during urbanization. This careful land use planning has preserved the integrity of key ecological functional zones, ensuring the stability of the region's natural systems.
In summary, the ability of Xiong’an New Area to sustain and improve its ecological quality amidst rapid urbanization results from a combination of factors, including policy guidance, scientific planning, and ecological restoration efforts. This success serves as a model for other regions undergoing urbanization, offering insights into advancing ecological civilization and sustainable development.
5.2. Impact of LUCC on the Ecological Quality
LUCC exerts a significant influence on the ecological quality. The transformation of LULC types during the development of Xiong’an New Area has led to complex effects on regional ecological quality. Specifically, the expansion of ecological land—such as water bodies, wetlands, and green areas—has increased vegetation cover, contributing to greater ecosystem stability. This, in turn, has positively affected the local ecological quality. However, the expansion of built-up areas, particularly those that are not ecologically sustainable, poses a considerable threat to the ecological environment. The growth of impervious surfaces associated with urbanization disrupts natural hydrological cycles [
48] and increases the risk of urban flooding [
49] and water pollution [
50], and negatively impacting urban microclimates by intensifying the heat island effect [
51].
Spatio-temporal variations in LULC create spatial heterogeneity in their ecological impacts, corroborating the findings of Yang et al. [
24] and Hu et al. [
27]. For example, LUCCs around Baiyangdian Lake, including wetland restoration and water area expansion, has had a discernibly positive impact on regional ecological quality. Conversely, urban expansion in Xiong’an New Area has resulted in ecological degradation in surrounding areas. Since its inception, Xiong’an New Area has emphasized ecological restoration and protection through measures such as wetland restoration and green area expansion. Despite the clarity of these policies, their practical implementation is facing ongoing challenges, particularly balancing the need for construction land with ecological protection. Looking forward, Xiong’an New Area must enhance policy enforcement and continuously optimize its land-use structure to ensure the sustainable improvement of ecological quality. Decision-makers need to carefully balance development and conservation as urban areas continue to expand.
5.3. Strategies for Harmonizing Urbanization and Ecological Protection
Achieving a harmonious integration of urbanization and ecological protection in Xiong’an New Area is critical for sustainable urban development. As urbanization progresses, significant changes in LULC have occurred, particularly the conversion of agricultural land into construction land (
Figure 8). Despite urban growth, the region has upheld its principle of ecological priority and green development [
52]. This has been realized through strategies aimed at enhancing ecological quality, such as expanding green areas, protecting wetlands, and safeguarding water resources. Although initial urbanization negatively impacted the environment, rigorous ecological protection measures have progressively restored and improved the region’s ecological quality. To synergize urbanization and ecological protection, ecological spatial configurations must be carefully considered in planning. This includes establishing ecological corridors, expanding urban green areas, and enlarging wetlands to facilitate the dynamic interaction between ecological systems and urban development. Moreover, strict regulations on construction land expansion are necessary, with a focus on utilizing existing urban areas to prevent disorganized sprawl and its detrimental effects on ecosystems. The application of advanced remote sensing technologies for real-time environmental monitoring can further assist decision-makers by providing precise data, enabling them to refine land use planning and adjust strategies to ensure simultaneous improvements in both ecological and urban systems. Finally, the establishment of a robust policy and regulatory framework is crucial for balancing urbanization and ecological protection. Clear laws and regulations, coupled with strong enforcement and public engagement, are essential to ensure the effective implementation of these policies and foster a collaborative environment for sustainable urban growth.
In conclusion, the urbanization of Xiong’an New Area should not be approached narrowly, solely emphasizing the rapid expansion of the economy and infrastructure. Although these aspects are critical for accelerating urban modernization, it is essential to prioritize the protection of the ecological environment to prevent irreversible damage. Therefore, Xiong’an New Area must adopt a long-term perspective and proactively implement strategies that prioritize ecological considerations. This emphasis on fostering harmony between human activities and nature will not only facilitate the attainment of mutual benefits across economic, social, and environmental dimensions but also serve as a valuable exemplar for other regions experiencing rapid urbanization.
5.4. Limitations and Prospects
This study utilized the RSEI and GWR models to analyze the evolution of ecological quality in Xiong’an New Area and its response to LUCCs. However, several limitations require further attention. First, while remote sensing data provide comprehensive ecological monitoring, their spatial and temporal resolution may overlook subtle ecological changes. Moreover, the interpretation of remote sensing data depends on remote sensing inversion models based on surface features, which may lead to oversimplifying some complex surface phenomena. Future studies should integrate higher-resolution remote sensing data with ground-based observations to improve the accuracy and reliability of ecological assessments through multi-source data fusion. Second, although the GWR model is effective for identifying local relationships between LUCC and ecological quality, it has limitations in generalizing land use patterns across larger regions. Additionally, the model does not account for potential time-lag effects between LUCC and ecological changes, which may result in incomplete reflections of the impacts. Future research could employ more sophisticated models, such as deep learning and spatio-temporal data analysis, to better capture the dynamic effects of LUCCs on ecological quality. Finally, while this study focused on LUCC’s impact on ecological quality, other factors, such as policy interventions, socio-economic development, and climate change, also influence ecological dynamics. Future research should adopt a more comprehensive approach by incorporating these factors through multi-variable models to deepen the understanding of the complex interactions between urbanization and ecological change.
6. Conclusions
LUCC is the most critical determinant influencing ecological quality during urbanization. This study examines the Xiong’an New Area, aiming to analyze LUCCs and its ecological ramifications. The ecological quality changes in the Xiong’an New Area were evaluated using the RSEI derived from Landsat imagery on the GEE cloud platform, covering the period from 2017 to 2023. The spatio-temporal heterogeneity of LULC was further analyzed through the LUCC dynamic degree and LULC transfer matrix, utilizing Sentinel-2 land use data. Subsequently, a GWR model was employed to elucidate the influence of LUCC on regional ecological quality.
The results indicate that, from 2017 to 2023, the average RSEI in the Xiong’an New Area exhibited an overall upward trend, signifying a gradual improvement in the region's ecological conditions, which remain above a moderate level. Spatially, the areas exhibiting the lowest ecological quality are concentrated in the southwestern region, the urban centers of the three counties, and the vicinity of Baiyangdian Lake. In contrast, moderate to high ecological quality is observed in the northeastern and southern sections of Anxin County. This spatial heterogeneity underscores the significant impact of various land use types on ecological quality. Over the past seven years, urbanization has led to a reduction of nearly 17% in farmland, while construction land has expanded by approximately 12%. Concurrently, the Xiong’an New Area has prioritized ecological protection and restoration, facilitating the effective conversion of farmland into the Baiyangdian Wetland and urban green areas, thereby significantly enhancing regional ecological quality. The GWR model revealed a positive correlation between changes in ecological land and ecological quality, whereas alterations in construction land and farmland were negatively correlated with ecological quality. Notably, in rapidly urbanizing areas, ecological quality demonstrated a pronounced responsiveness to shifts in construction land. Although the expansion of construction land has adversely affected ecological quality, the significant increase in urban green areas and the Baiyangdian Wetland has markedly enhanced overall ecological conditions. Consequently, as the Xiong’an New Area continues to urbanize, it is imperative to prioritize the optimization of land use and intensify efforts in ecological protection and restoration to ensure the sustained improvement of regional ecological quality.
Author Contributions
Conceptualization, Q.S. and Q.J.; methodology, Q.S. and R.Q; software, Q.J., R.Q. and C.W; validation, Q.J., H.X. and X.Z.; formal analysis, R.Q. and Q.J.; investigation, X.Z. and H.X.; resources, Q.S.; data curation, Q.S., R.Q. and C.W.; writing—original draft preparation, Q.S.; writing—review and editing, Q.S., Q.J. and X.Z; visualization, Q.S., R.Q. and C.W; supervision, W.H. and B.Z; project administration, W.H. and B.Z.; funding acquisition, Q.S. All authors have read and agreed to the published version of the manuscript.
Funding
This research was funded by Key R&D and Promotion Special Project of Henan Province, grant number 242102110342.
Data Availability Statement
Conflicts of Interest
The authors declare no conflicts of interest.
References
- Kafy, A.A.; Faisal, A.-A.; Al Rakib, A.; Fattah, M.A.; Rahaman, Z.A.; Sattar, G.S. Impact of vegetation cover loss on surface temperature and carbon emission in a fastest-growing city, Cumilla, Bangladesh. Build. Environ. 2022, 208, 108573. [Google Scholar] [CrossRef]
- Borrelli, P.; Robinson, D.A.; Fleischer, L.R.; Lugato, E.; Ballabio, C.; Alewell, C.; Meusburger, K.; Modugno, S.; Schütt, B.; Ferro, V.; et al. An assessment of the global impact of 21st century land use change on soil erosion. Nat. Commun. 2017, 8, 1–13. [Google Scholar] [CrossRef] [PubMed]
- Shahfahad, *!!! REPLACE !!!*; Naikoo, M., W.; Islam, A. R. M. T.; Mallick, J.; Rahman, A. Land use/land cover change and its impact on surface urban heat island and urban thermal comfort in a metropolitan city. Urban Clim. 2022, 41, 101052. [Google Scholar] [CrossRef]
- Newbold, T.; Bentley, L.F.; Hill, S.L.; Edgar, M.J.; Horton, M.; Su, G.; Şekercioğlu, Ç.H.; Collen, B.; Purvis, A. Global effects of land use on biodiversity differ among functional groups. Funct. Ecol. 2020, 34, 684–693. [Google Scholar] [CrossRef]
- Guo, X.; Zhang, Y.; Guo, D.; Lu, W.; Xu, H. J How does ecological protection redline policy affect regional land use and ecosystem services? Environ. Impact Asses. Rev. 2023, 100, 107062. [Google Scholar] [CrossRef]
- Pata, U.K.; Caglar, A.E.; Kartal, M.T.; Depren, S.K. Evaluation of the role of clean energy technologies, human capital, urbanization, and income on the environmental quality in the United States. J. Clean. Prod. 2023, 402, 136802. [Google Scholar] [CrossRef]
- Fung, T.; Siu, W. Environmental quality and its changes, an analysis using NDVI. Int. J. Remote Sens. 2000, 21, 1011–1024. [Google Scholar] [CrossRef]
- Ozyavuz, M.; Bilgili, B.C.; Salici, A. Determination of vegetation changes with NDVI method. J. Environ. Prot. Ecol. 2015, 16, 264–273. [Google Scholar]
- Piedallu, C.; Chéret, V.; Denux, J.P.; Perez, V.; Azcona, J.S.; Seynave, I.; Gégout, J.C. Soil and climate differently impact NDVI patterns according to the season and the stand type. Sci. Total Environ. 2019, 651, 2874–2885. [Google Scholar] [CrossRef]
- Jiang, L.; Liu, Y.; Wu, S.; Yang, C. Analyzing ecological environment change and associated driving factors in China based on NDVI time series data. Ecol. Indic. 2021, 129, 107933. [Google Scholar] [CrossRef]
- Moazzam, M.F.U.; Doh, Y.H.; Lee, B.G. Impact of urbanization on land surface temperature and surface urban heat Island using optical remote sensing data: A case study of Jeju Island, Republic of Korea. Build. Environ. 2022, 222, 109368. [Google Scholar] [CrossRef]
- Xu, X.; Pei, H.; Wang, C.; Xu, Q.; Xie, H.; Jin, Y.; Feng, Y.; Tong, X.; Xiao, C. Long-term analysis of the urban heat island effect using multisource Landsat images considering inter-class differences in land surface temperature products. Sci. Total Environ. 2023, 858, 159777. [Google Scholar] [CrossRef] [PubMed]
- Belayneh, A.; Adamowski, J.; Khalil, B.; Ozga-Zielinski, B. Long-term SPI drought forecasting in the Awash River Basin in Ethiopia using wavelet neural network and wavelet support vector regression models. J. Hydrol. 2014, 508, 418–429. [Google Scholar] [CrossRef]
- Pham, Q.B.; Yang, T.C.; Kuo, C.M.; Tseng, H.W.; Yu, P.S. Coupling singular spectrum analysis with least square support vector machine to improve accuracy of SPI drought forecasting. Water Resour. Manag. 2021, 35, 847–868. [Google Scholar] [CrossRef]
- Wang, C. , Jiang, Q., Shao, Y., Sun, S., Xiao, L., Guo, J. Ecological environment assessment based on land use simulation: A case study in the Heihe River Basin. Sci. Total Environ. 2019, 697, 133928. [Google Scholar] [CrossRef]
- Zhao, W.; Yan, T.; Ding, X.; Peng, S.; Chen, H.; Fu, Y.; Zhou, Z. Response of ecological quality to the evolution of land use structure in Taiyuan during 2003 to 2018. Alex. Eng. J. 2021, 60, 1777–1785. [Google Scholar] [CrossRef]
- Healey, S.P.; Cohen, W.B.; Zhiqiang, Y.; Krankina, O.N. Comparison of Tasseled Cap-based Landsat data structures for use in forest disturbance detection. Remote Sens. Environ. 2005, 97, 301–310. [Google Scholar] [CrossRef]
- Ren, F.; Xu, J.; Wu, Y.; Li, T.; Li, M. Analysis of eco-environmental quality of an urban forest park using LTSS and modified RSEI from 1990 to 2020—A case study of Zijin mountain national forest Park, Nanjing, China. Forests 2023, 14, 2458. [Google Scholar] [CrossRef]
- Mildrexler, D.J.; Zhao, M.; Running, S.W. Testing a MODIS global disturbance index across North America. Remote Sens. Environ. 2009, 113, 2103–2117. [Google Scholar] [CrossRef]
- Dutta, D.; Das, P.K.; Paul, S.; Sharma, J.R.; Dadhwal, V.K. Assessment of ecological disturbance in the mangrove forest of Sundarbans caused by cyclones using MODIS time-series data (2001–2011). Nat. Hazards 2015, 79, 775–790. [Google Scholar] [CrossRef]
- Xu, H. A Remote sensing urban ecological index and its application. Acta Ecol. Sin. 2013, 33, 7853–7862. (In Chinese) [Google Scholar]
- Xu, H.; Wang, Y.; Guan, H.; Shi, T.; Hu, X. Detecting ecological changes with a remote sensing based ecological index (RSEI) produced time series and change vector analysis. Remote Sens. 2019, 11, 2345. [Google Scholar] [CrossRef]
- Sun, C.; Li, X.; Zhang, W.; Li, X. Evolution of ecological security in the tableland region of the Chinese loess plateau using a remote-sensing-based index. Sustainability 2020, 12, 3489. [Google Scholar] [CrossRef]
- Yang, Z.; Sun, C.; Ye, J.; Gan, C.; Li, Y.; Wang, L.; Chen, Y.J.R.S. Spatio-temporal heterogeneity of ecological quality in Hangzhou greater bay area (HGBA) of china and response to land use and cover change. Remote Sens. 2022, 14, 5613. [Google Scholar] [CrossRef]
- Shan, W.; Jin, X.; Ren, J.; Wang, Y.; Xu, Z.; Fan, Y.; Gu, Z.; Hong, C.; Lin, J.; Zhou, Y. Ecological environment quality assessment based on remote sensing data for land consolidation. J. Clean. Prod. 2019, 239, 118126. [Google Scholar] [CrossRef]
- Yuan, B.; Fu, L.; Zou, Y.; Zhang, S.; Chen, X.; Li, F.; Deng, Z.; Xie, Y. Spatiotemporal change detection of ecological quality and the associated affecting factors in Dongting Lake Basin, based on RSEI. J. Clean. Prod. 2021, 302, 126995. [Google Scholar] [CrossRef]
- Hu, C.; Song, M.; Zhang, A. Dynamics of the eco-environmental quality in response to land use changes in rapidly urbanizing areas: A case study of Wuhan, China from 2000 to 2018. J. Geogr. Sci. 2023, 33, 245–265. [Google Scholar] [CrossRef]
- Xiong, Y.; Xu, W.; Lu, N.; Huang, S.; Wu, C.; Wang, L.; Dai, F.; Kou, W. Assessment of spatial–temporal changes of ecological environment quality based on RSEI and GEE: A case study in Erhai Lake Basin, Yunnan province, China. Ecol. Indic. 2021, 125, 107518. [Google Scholar] [CrossRef]
- Huang, H.; Chen, W.; Zhang, Y.; Qiao, L.; Du, Y. Analysis of ecological quality in Lhasa Metropolitan Area during 1990–2017 based on remote sensing and Google Earth Engine platform. J. Geogr. Sci. 2021, 31, 265–280. [Google Scholar] [CrossRef]
- Duo, L.; Wang, J.; Zhang, F.; Xia, Y.; Xiao, S.; He, B. Assessing the Spatiotemporal Evolution and Drivers of Ecological Environment Quality Using an Enhanced Remote Sensing Ecological Index in Lanzhou City, China. Remote Sens. 2023, 15, 4704. [Google Scholar] [CrossRef]
- Airiken, M.; Zhang, F.; Chan, N.W.; Kung, H.-T. Assessment of spatial and temporal ecological environment quality under land use change of urban agglomeration in the North Slope of Tianshan, China. Environ. Sci. Pollut. Res. 2022, 29, 12282–12299. [Google Scholar] [CrossRef] [PubMed]
- Wang, Y.; He, Y.; Fan, J.; Olsson, L.; Scown, M. Balancing urbanization, agricultural production and ecological integrity: A cross-scale landscape functional and structural approach in China. Land Use Policy 2024, 141, 107156. [Google Scholar] [CrossRef]
- Yang, Y. Evolution of habitat quality and association with land-use changes in mountainous areas: A case study of the Taihang Mountains in Hebei Province, China. Ecol. Indic. 2021, 129, 107967. [Google Scholar] [CrossRef]
- Pekel, J.-F.; Cottam, A.; Gorelick, N.; Belward, A.S. High-resolution mapping of global surface water and its long-term changes. Nature 2016, 540, 418–422. [Google Scholar] [CrossRef] [PubMed]
- Karra, K.; Kontgis, C.; Statman-Weil, Z.; Mazzariello, J.C.; Mathis, M.; Brumby, S.P. Global land use/land cover with Sentinel 2 and deep learning. In Proceedings of the 2021 IEEE international geoscience and remote sensing symposium IGARSS, IEEE; 2021; pp. 4704–4707. [Google Scholar]
- Wang, L.; Diao, C.; Xian, G.; Yin, D.; Lu, Y.; Zou, S.; Erickson, T.A. A summary of the special issue on remote sensing of land change science with Google earth engine. Remote Sens. Environ. 2020, 248, 112002. [Google Scholar] [CrossRef]
- Peng, X.; Zhang, S.; Peng, P.; Chen, A.; Li, Y.; Wang, J.; Bai, M. Unraveling the Ecological Tapestry: A Comprehensive Assessment of Changtang Nature Reserve’s Ecological and Environmental Using RSEI and GEE. Land 2023, 12, 1581. [Google Scholar] [CrossRef]
- Carlson, T.N.; Ripley, D.A. On the relation between NDVI, fractional vegetation cover, and leaf area index. Remote Sens. Environ. 1997, 62, 241–252. [Google Scholar] [CrossRef]
- Bajocco, S.; Ginaldi, F.; Savian, F.; Morelli, D.; Scaglione, M.; Fanchini, D.; Raparelli, E.; Bregaglio, S.U.M. On the use of NDVI to estimate LAI in field crops: Implementing a conversion equation library. Remote Sens. 2022, 14, 3554. [Google Scholar] [CrossRef]
- Baig, M.H.A.; Zhang, L.; Shuai, T.; Tong, Q. Derivation of a tasselled cap transformation based on Landsat 8 at-satellite reflectance. Remote Sens. Lett. 2014, 5, 423–431. [Google Scholar] [CrossRef]
- Xu, H. A new index for delineating built-up land features in satellite imagery. Int. J Remote Sens. 2008, 29, 4269–4276. [Google Scholar] [CrossRef]
- Wan, Z.; Hook, S.; Hulley, G. MODIS/Terra Land Surface Temperature/Emissivity Daily L3 Global 1km SIN Grid V061 [Data set]. NASA EOSDIS Land Processes Distributed Active Archive Center. Accessed 2024-09-29. 2021. [Google Scholar] [CrossRef]
- Ferraz, S.F.d.B.; Vettorazzi, C.A.; Theobald, D.M. Using indicators of deforestation and land-use dynamics to support conservation strategies: A case study of central Rondônia, Brazil. For. Ecol. Manage. 2009, 257, 1586–1595. [Google Scholar] [CrossRef]
- Winkler, K.; Fuchs, R.; Rounsevell, M.; Herold, M. Global land use changes are four times greater than previously estimated. Nat. Commun. 2021, 12, 2501. [Google Scholar] [CrossRef] [PubMed]
- Wheeler, D.C. Geographically weighted regression. In Handbook of regional science; Springer: Berlin Heidelberg, 2021; pp. 1895–1921. [Google Scholar]
- Fan, X.; Gu, X.; Yu, H.; Long, A.; Tiando, D.S.; Ou, S.; Li, J.; Rong, Y.; Tang, G.; Zheng, Y. The spatial and temporal evolution and drivers of habitat quality in the Hung River Valley. Land 2021, 10, 1369. [Google Scholar] [CrossRef]
- Bian, C.; Yang, L.; Zhao, X.; Yao, X.; Xiao, L. The Impact of Human Activity Expansion on Habitat Quality in the Yangtze River Basin. Land 2024, 13, 908. [Google Scholar] [CrossRef]
- Shuster, W.D.; Bonta, J.; Thurston, H.; Warnemuende, E.; Smith, D.R. Impacts of impervious surface on watershed hydrology: A review. Urban Water J. 2005, 2, 263–275. [Google Scholar] [CrossRef]
- Feng, B.; Zhang, Y.; Bourke, R. Urbanization impacts on flood risks based on urban growth data and coupled flood models. Nat. Hazards 2021, 106, 613–627. [Google Scholar] [CrossRef]
- Wang, Z.; Zhang, S.; Peng, Y.; Wu, C.; Lv, Y.; Xiao, K.; Zhao, J.; Qian, G. Impact of rapid urbanization on the threshold effect in the relationship between impervious surfaces and water quality in shanghai, China. Environ. Pollut. 2020, 267, 115569. [Google Scholar] [CrossRef]
- Morabito, M.; Crisci, A.; Guerri, G.; Messeri, A.; Congedo, L.; Munafò, M. Surface urban heat islands in Italian metropolitan cities: Tree cover and impervious surface influences. Sci. Total Environ. 2021, 751, 142334. [Google Scholar] [CrossRef]
- Xu, B. China’s National New Areas in the ecological transition. Environ. Dev. Sustain. 2023, 25, 3747–3770. [Google Scholar] [CrossRef]
|
Disclaimer/Publisher’s Note: The statements, opinions and data contained in all publications are solely those of the individual author(s) and contributor(s) and not of MDPI and/or the editor(s). MDPI and/or the editor(s) disclaim responsibility for any injury to people or property resulting from any ideas, methods, instructions or products referred to in the content. |
© 2024 by the authors. Licensee MDPI, Basel, Switzerland. This article is an open access article distributed under the terms and conditions of the Creative Commons Attribution (CC BY) license (http://creativecommons.org/licenses/by/4.0/).

