Submitted:
24 October 2024
Posted:
25 October 2024
You are already at the latest version
Abstract
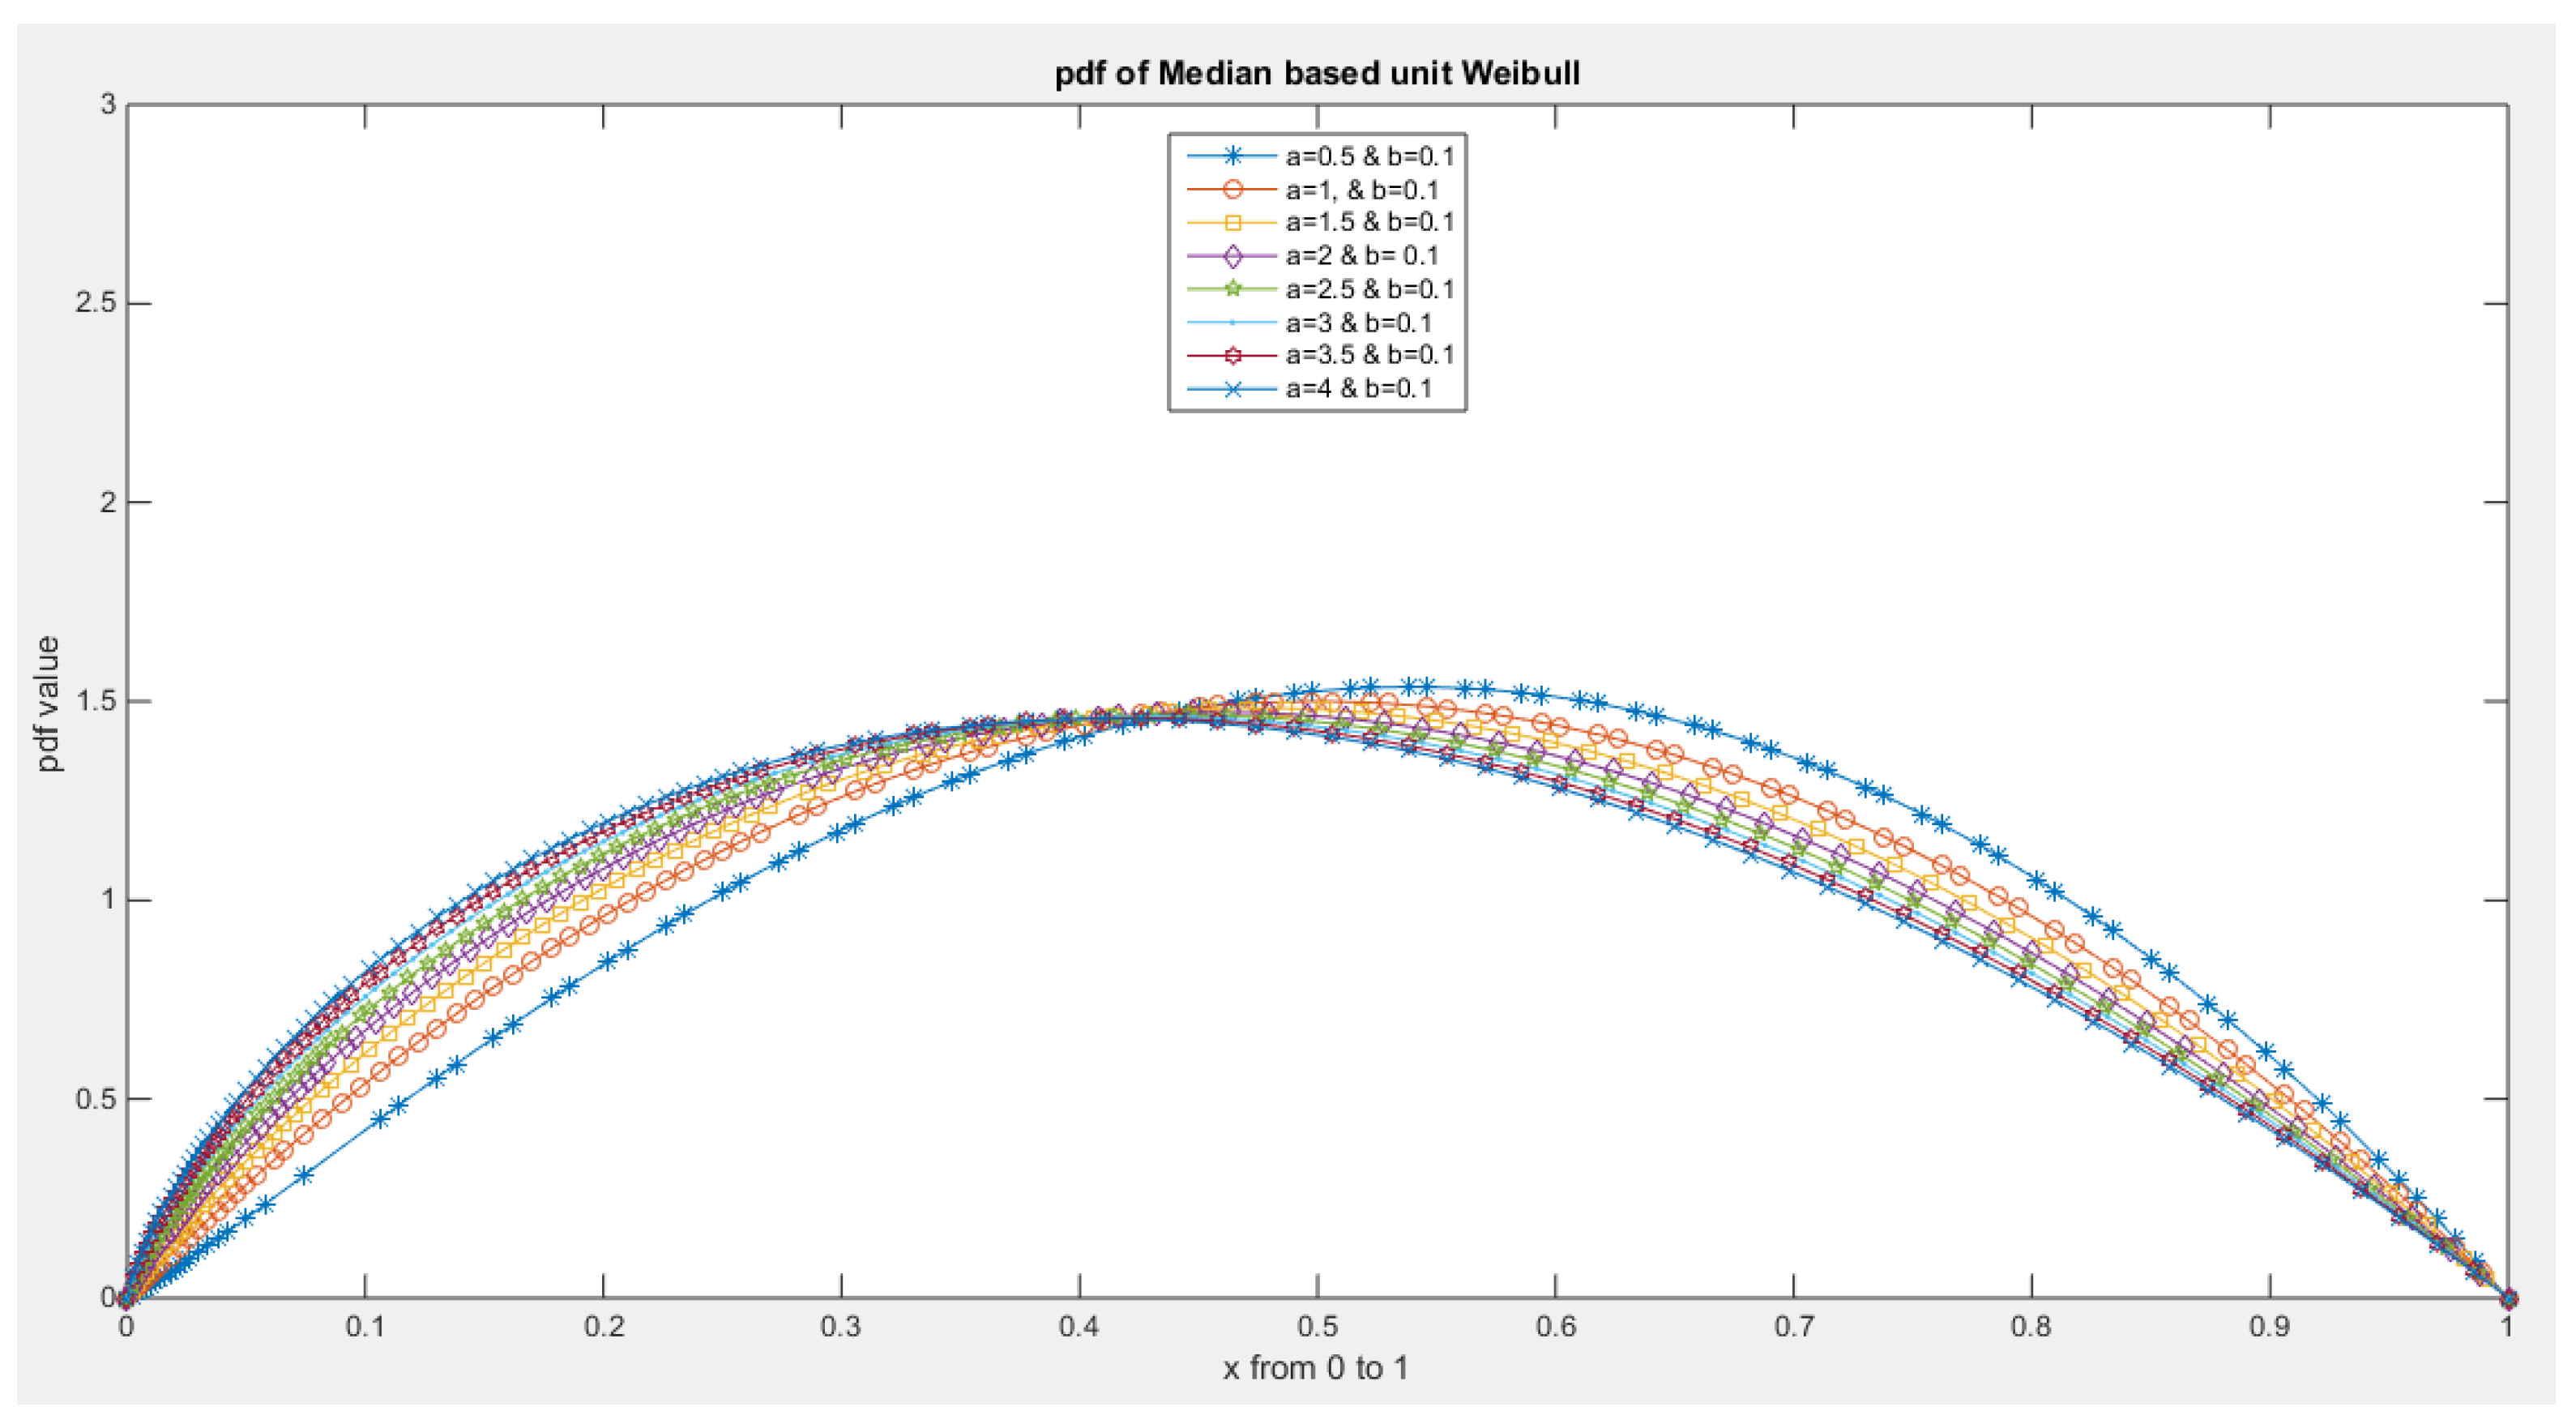
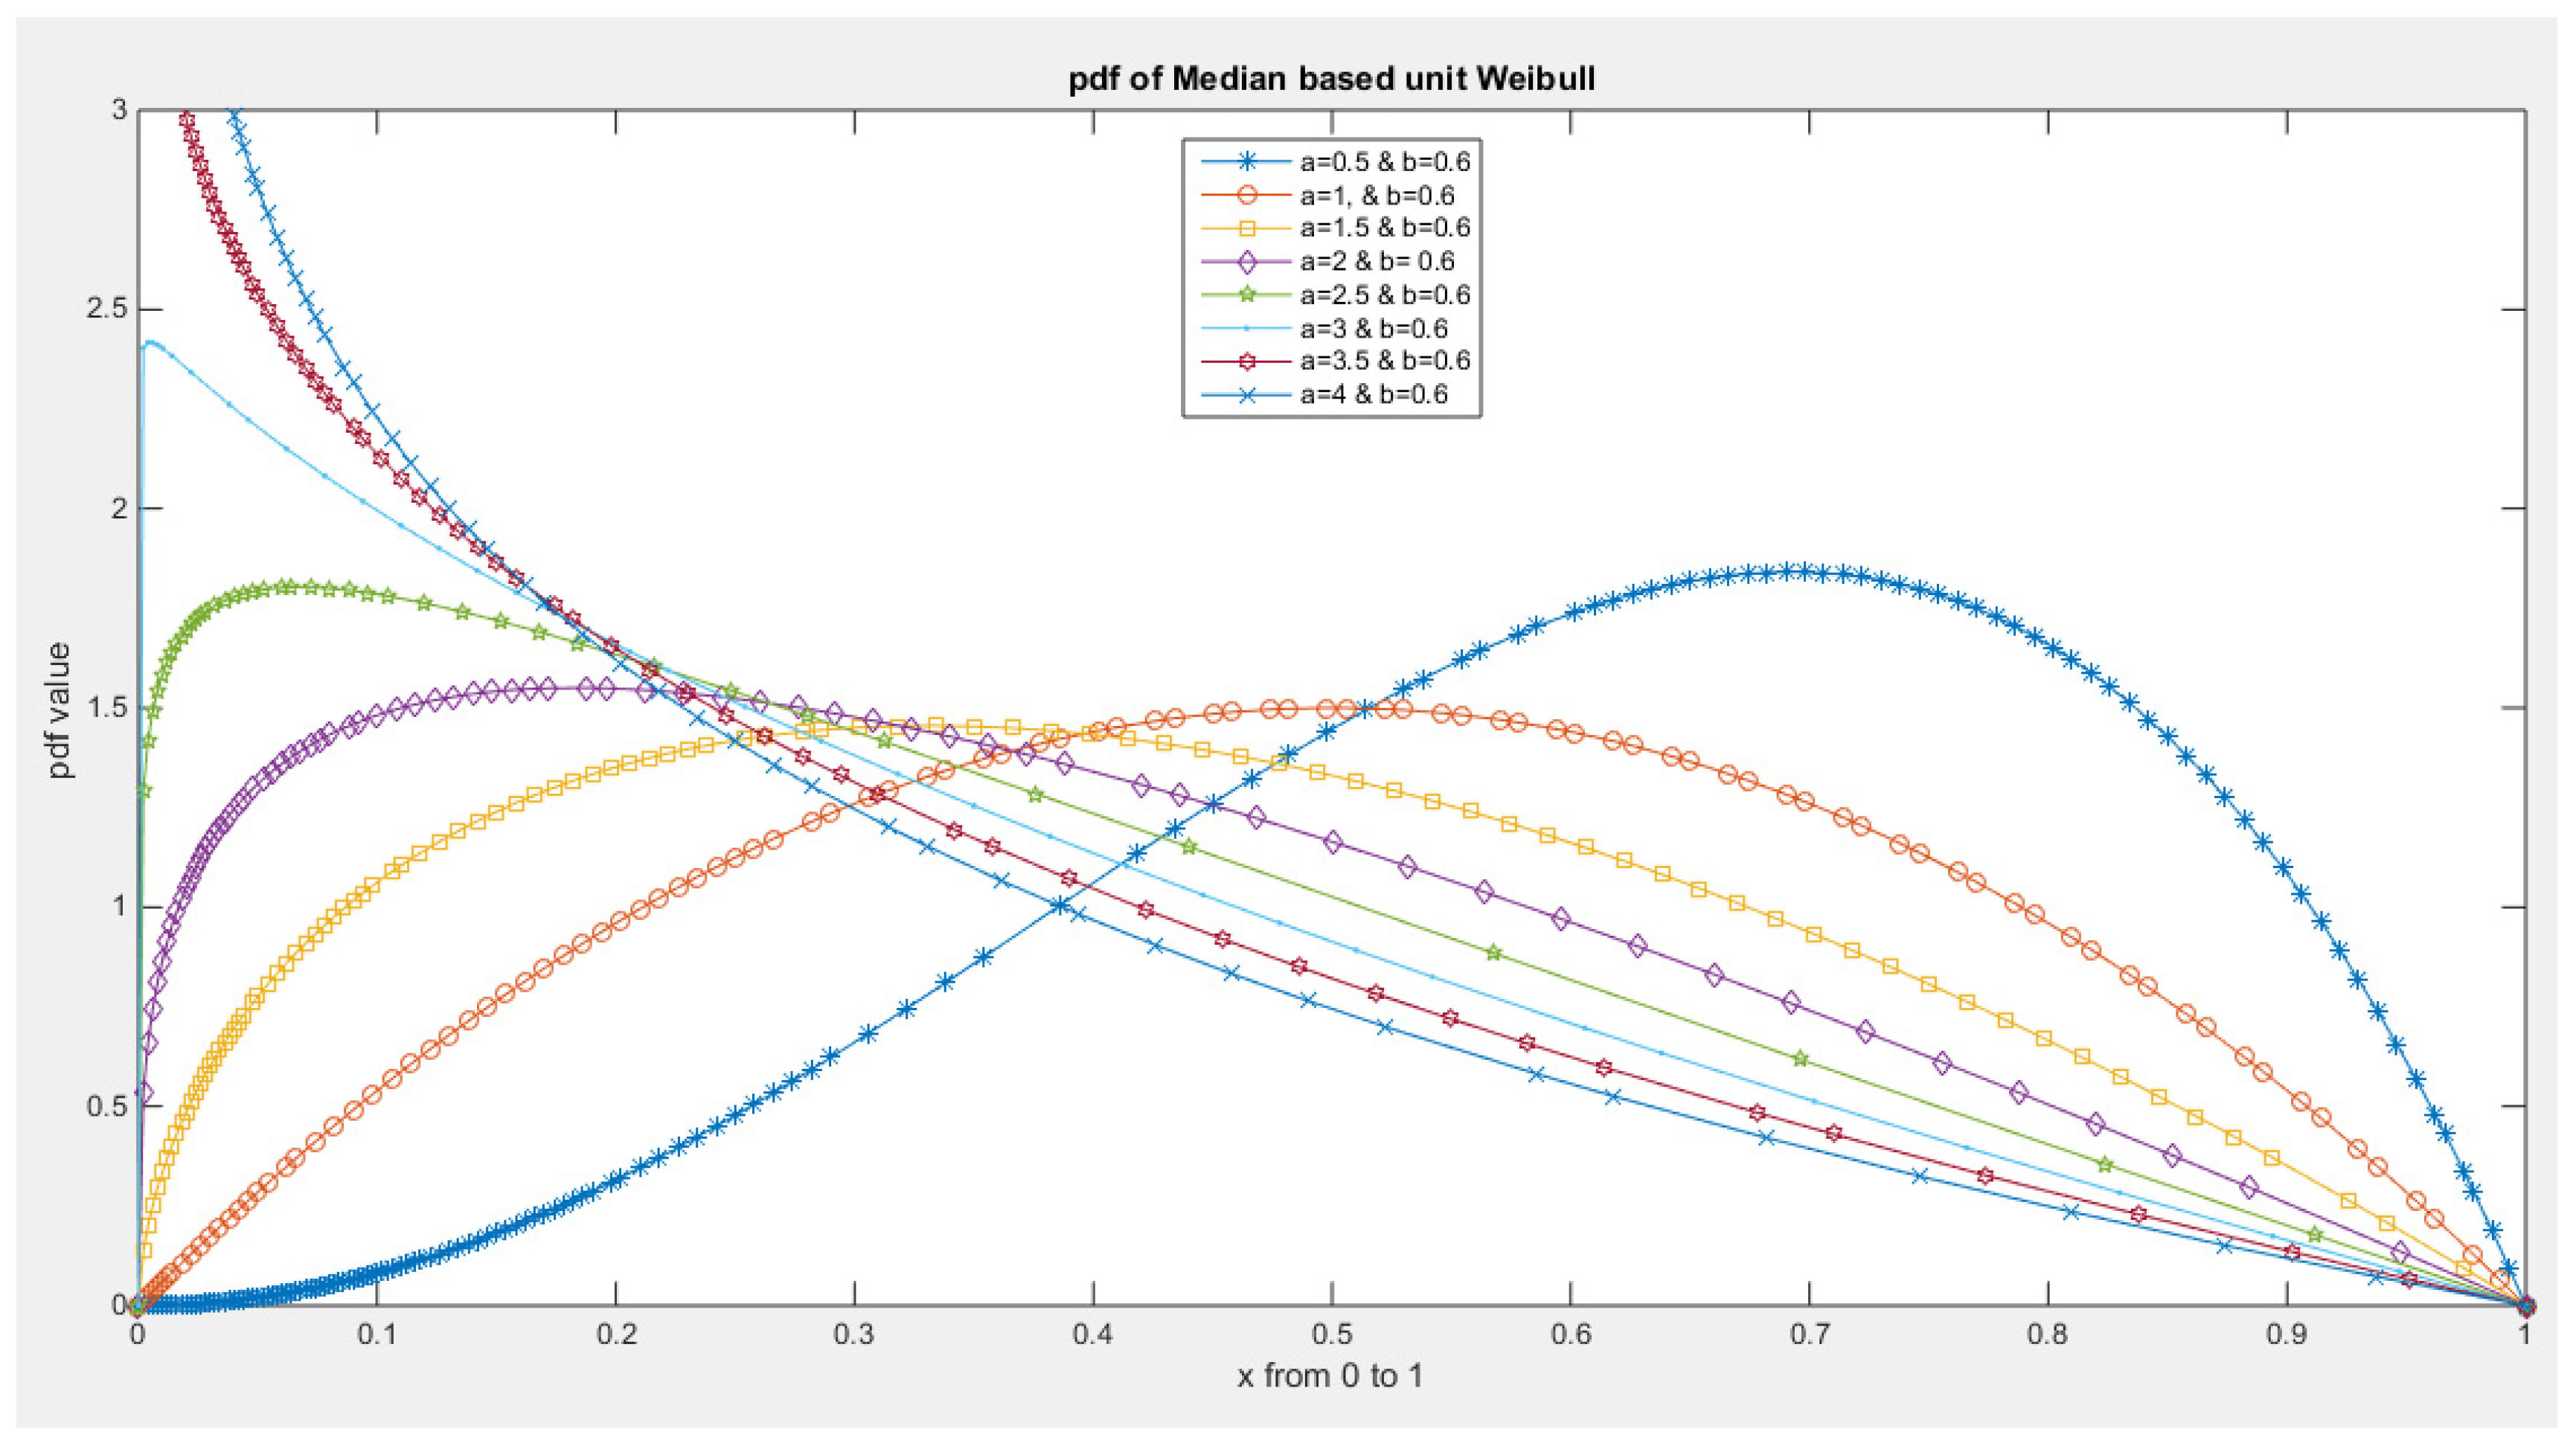
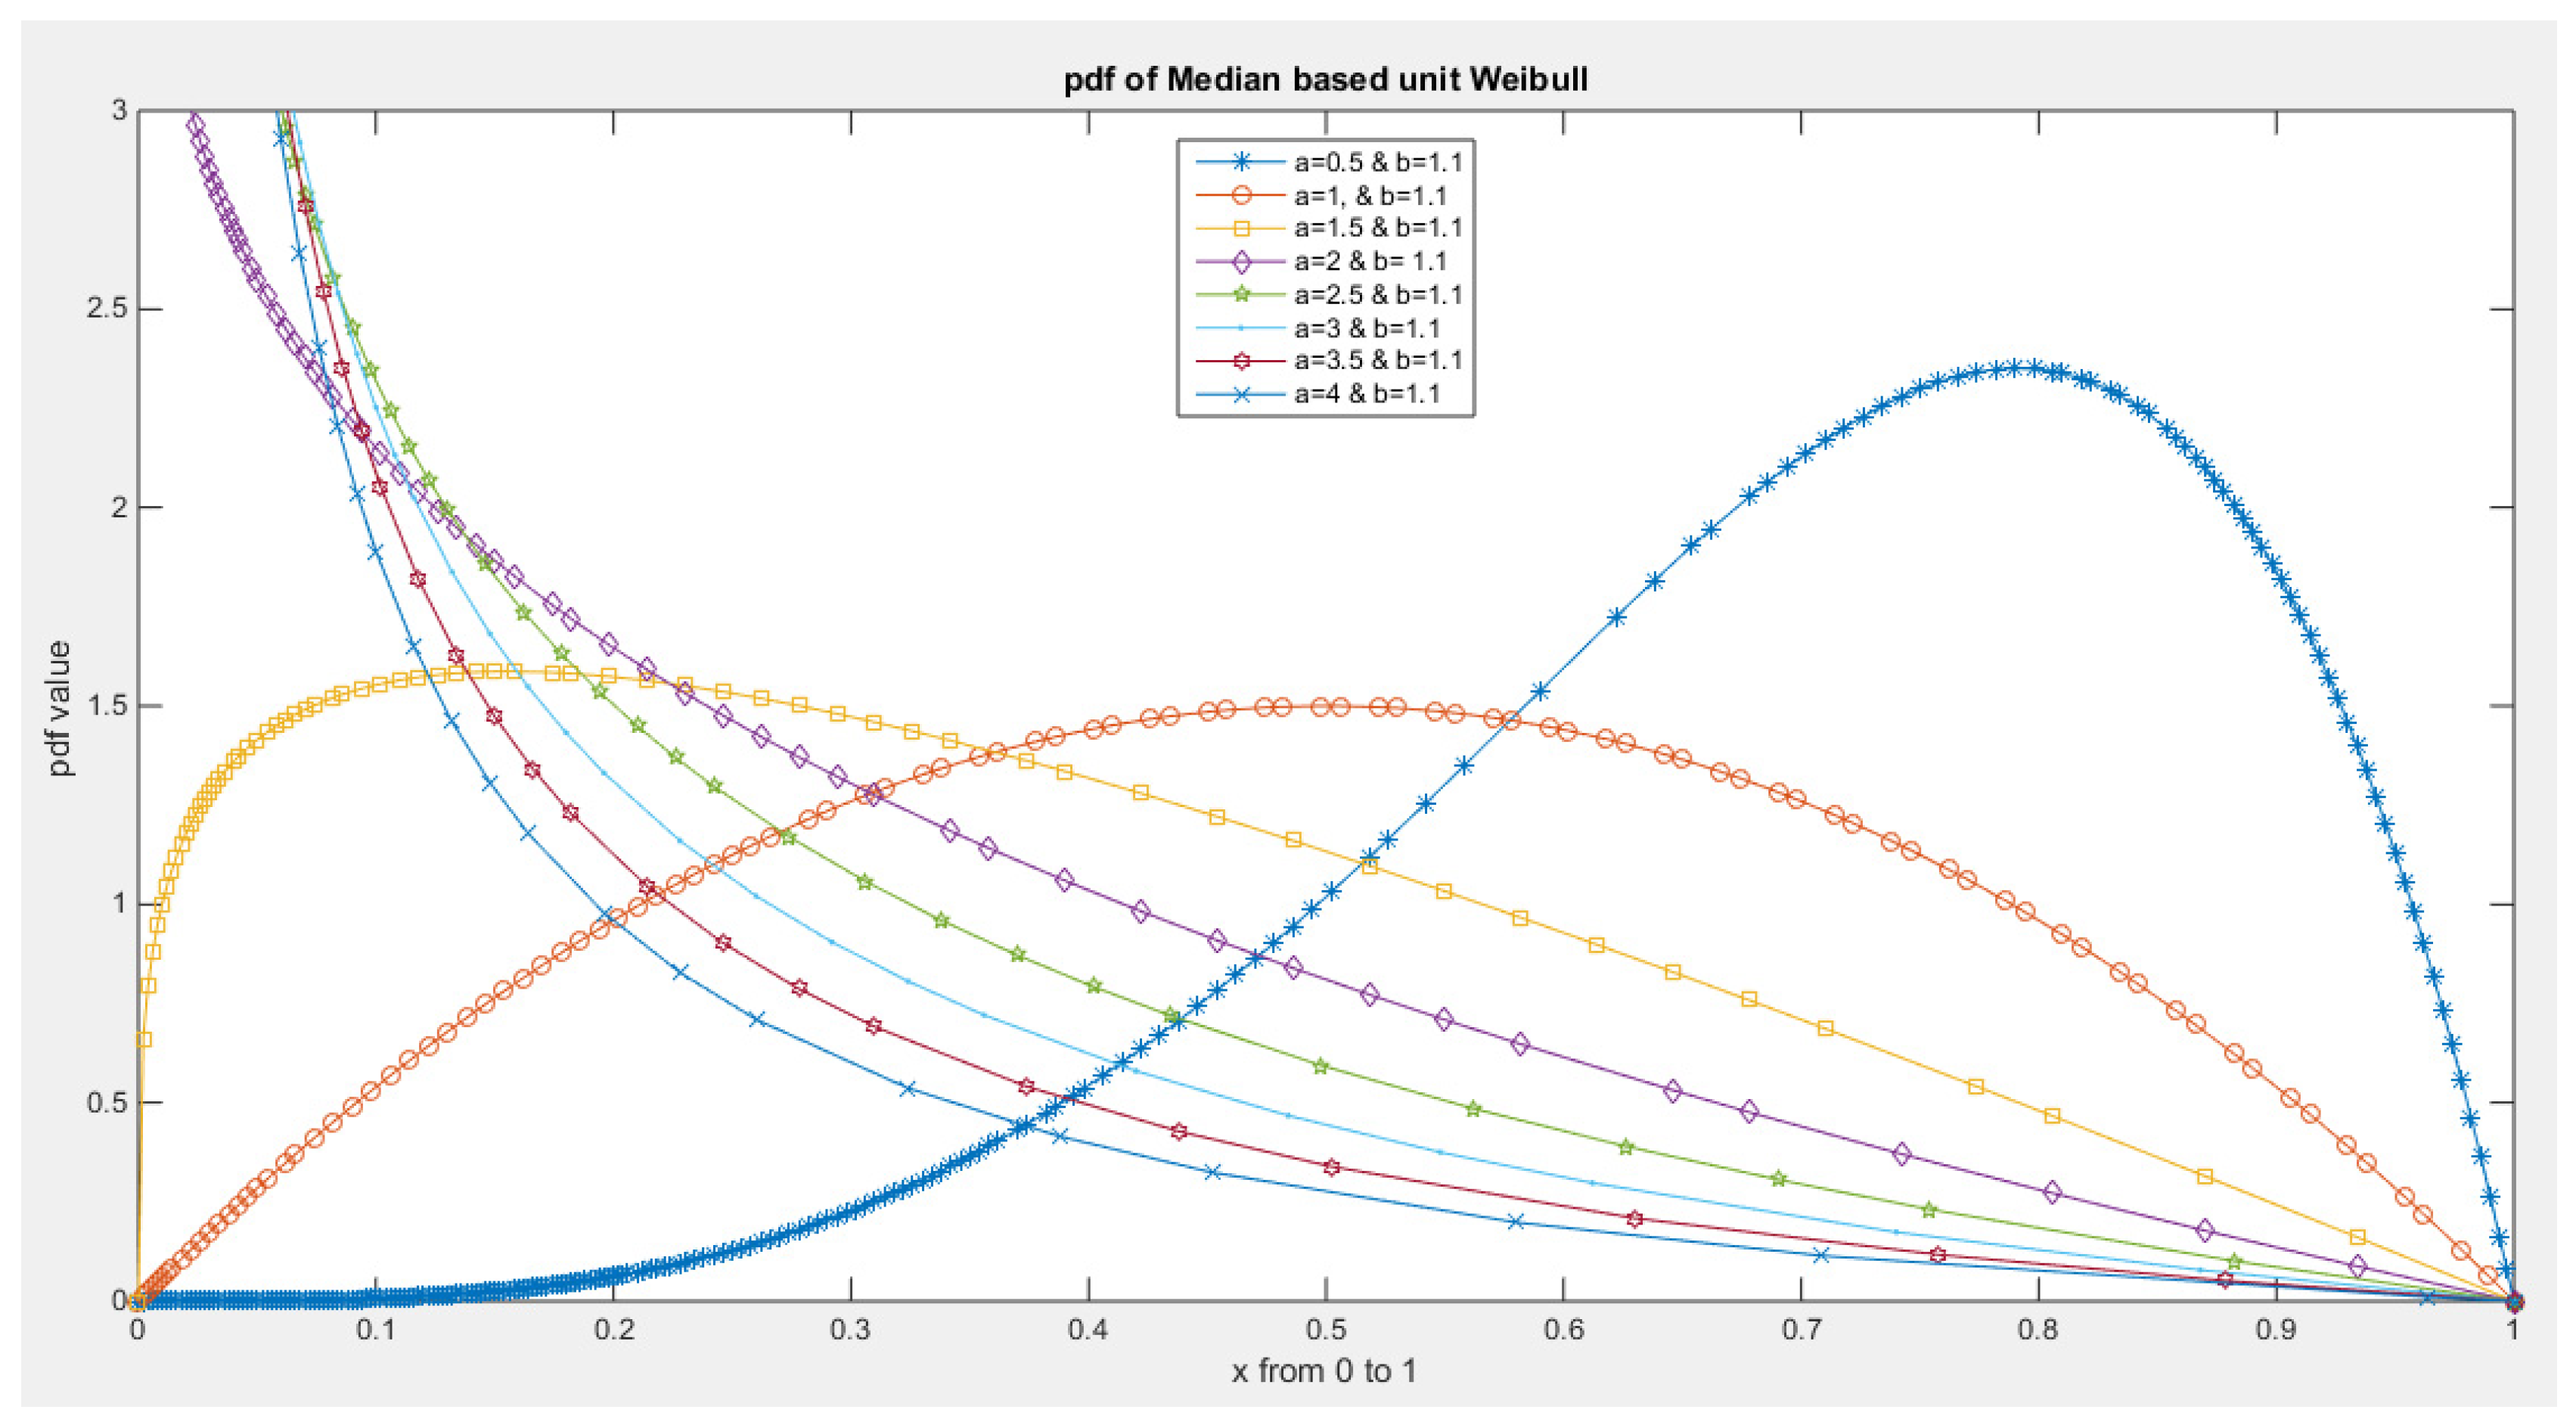
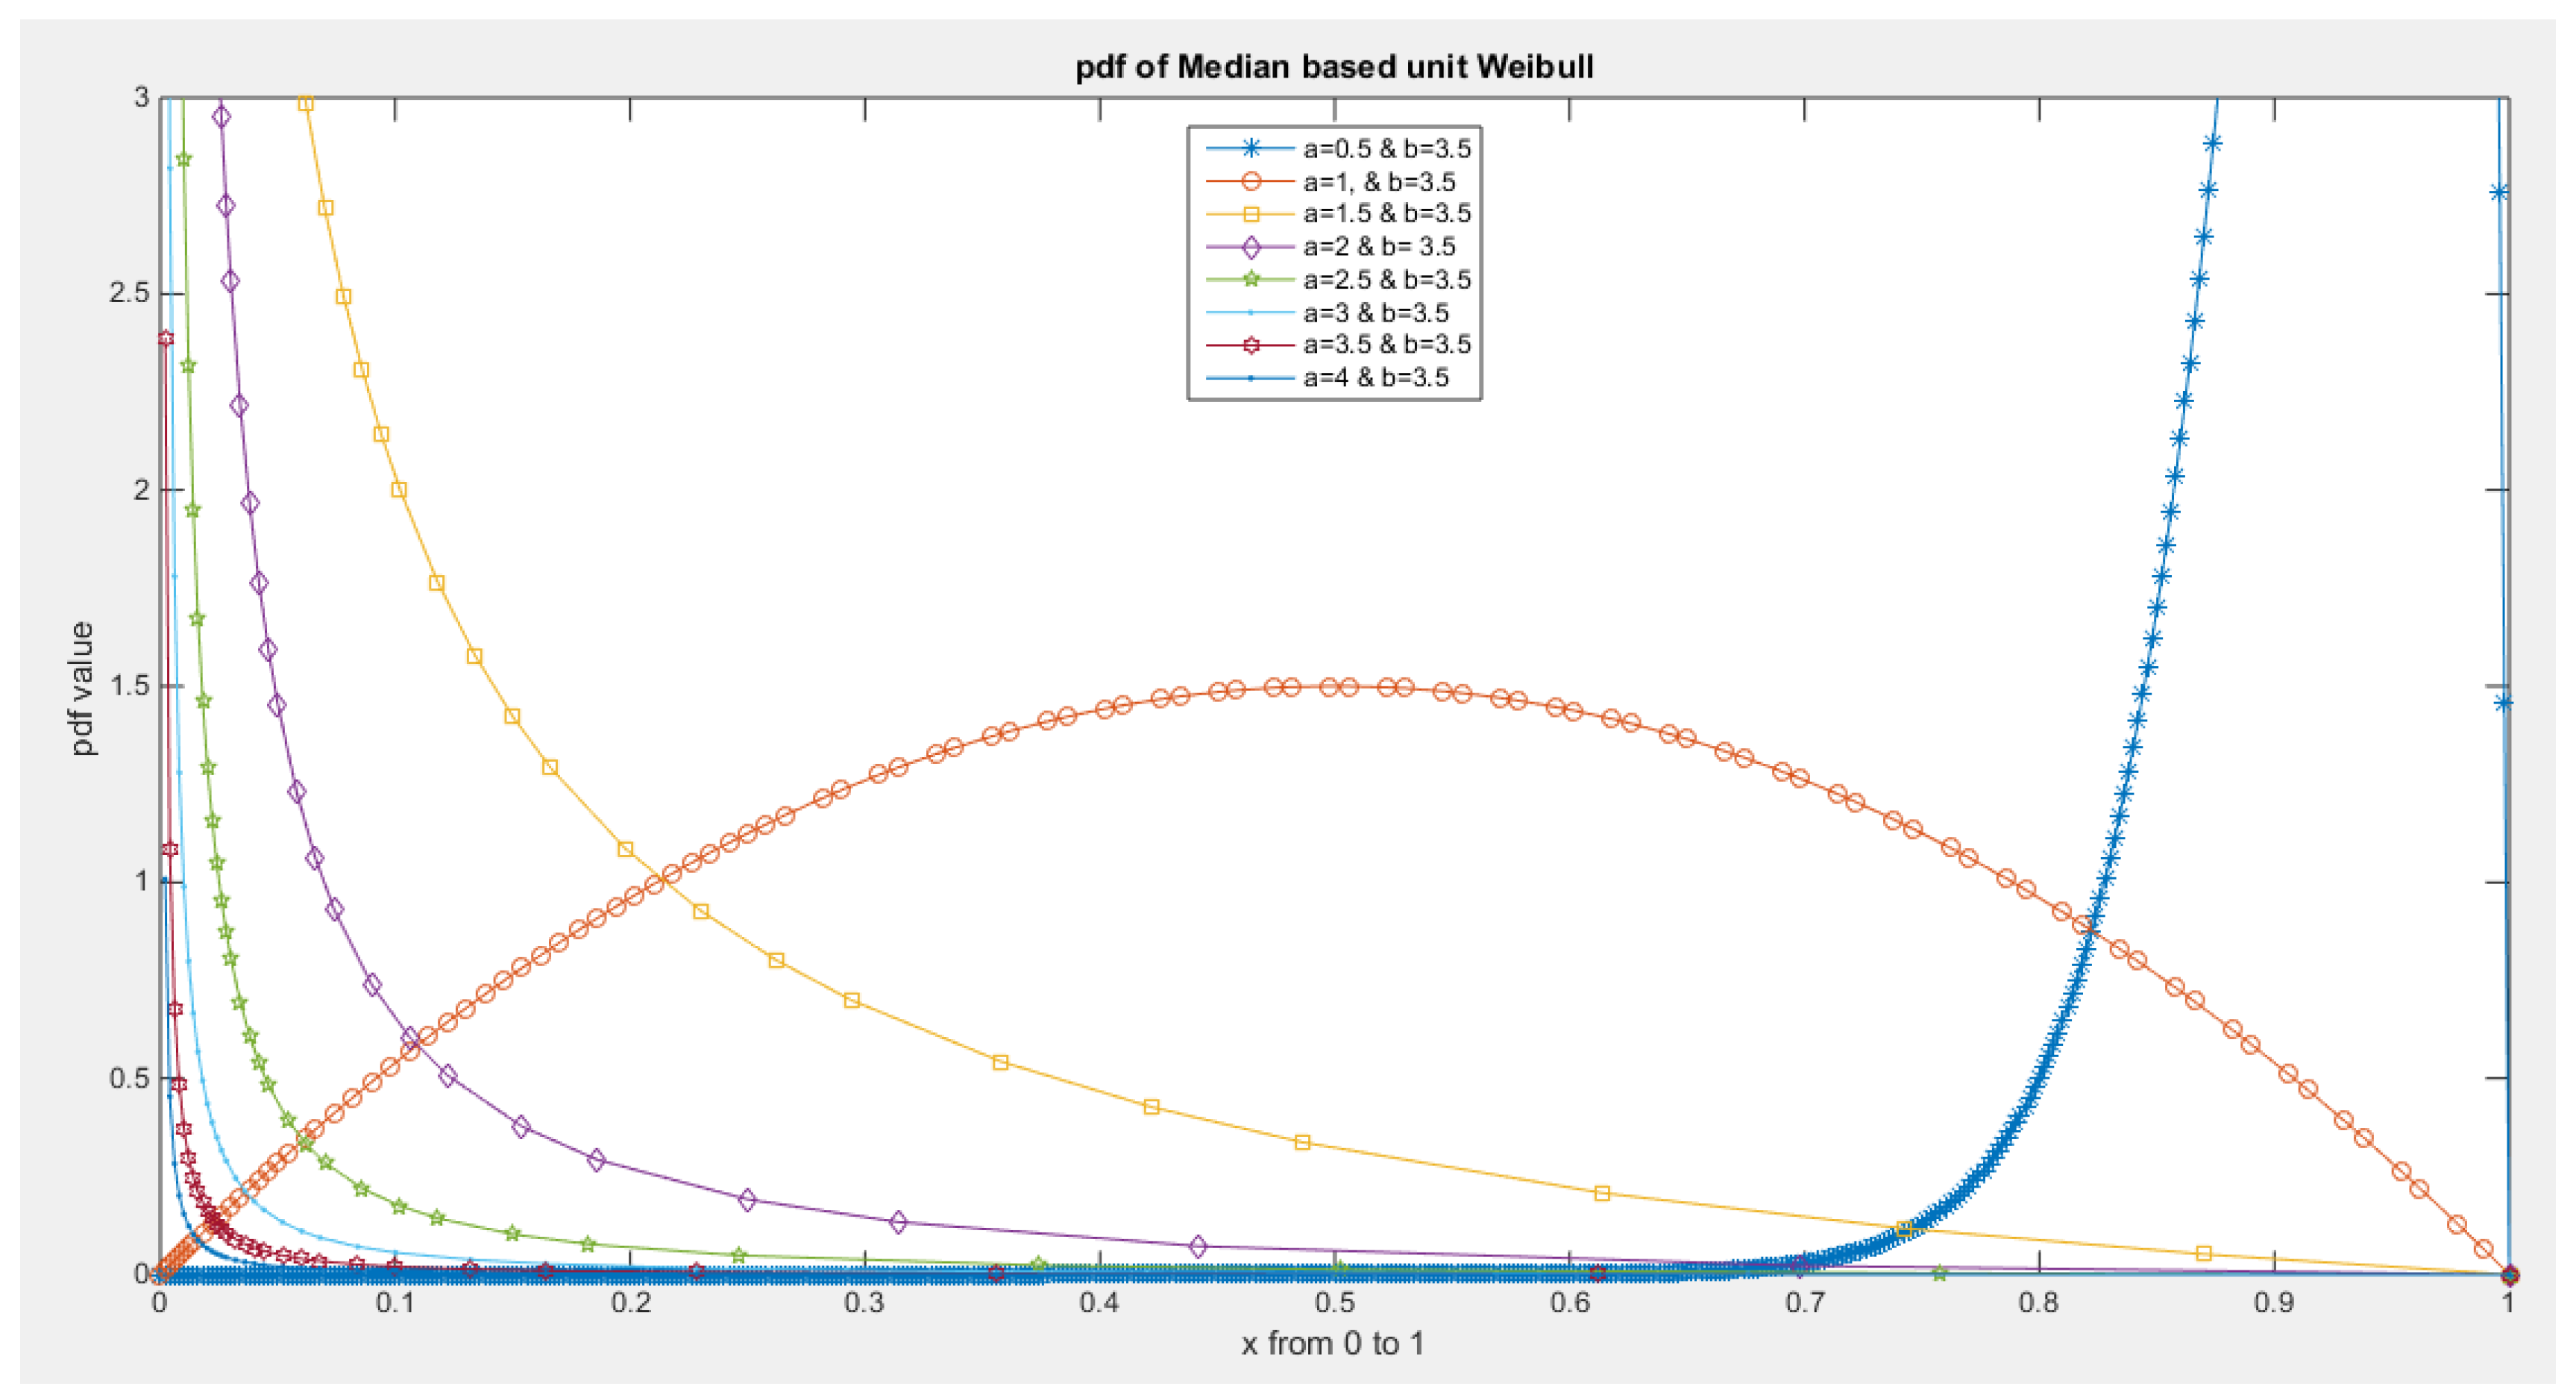
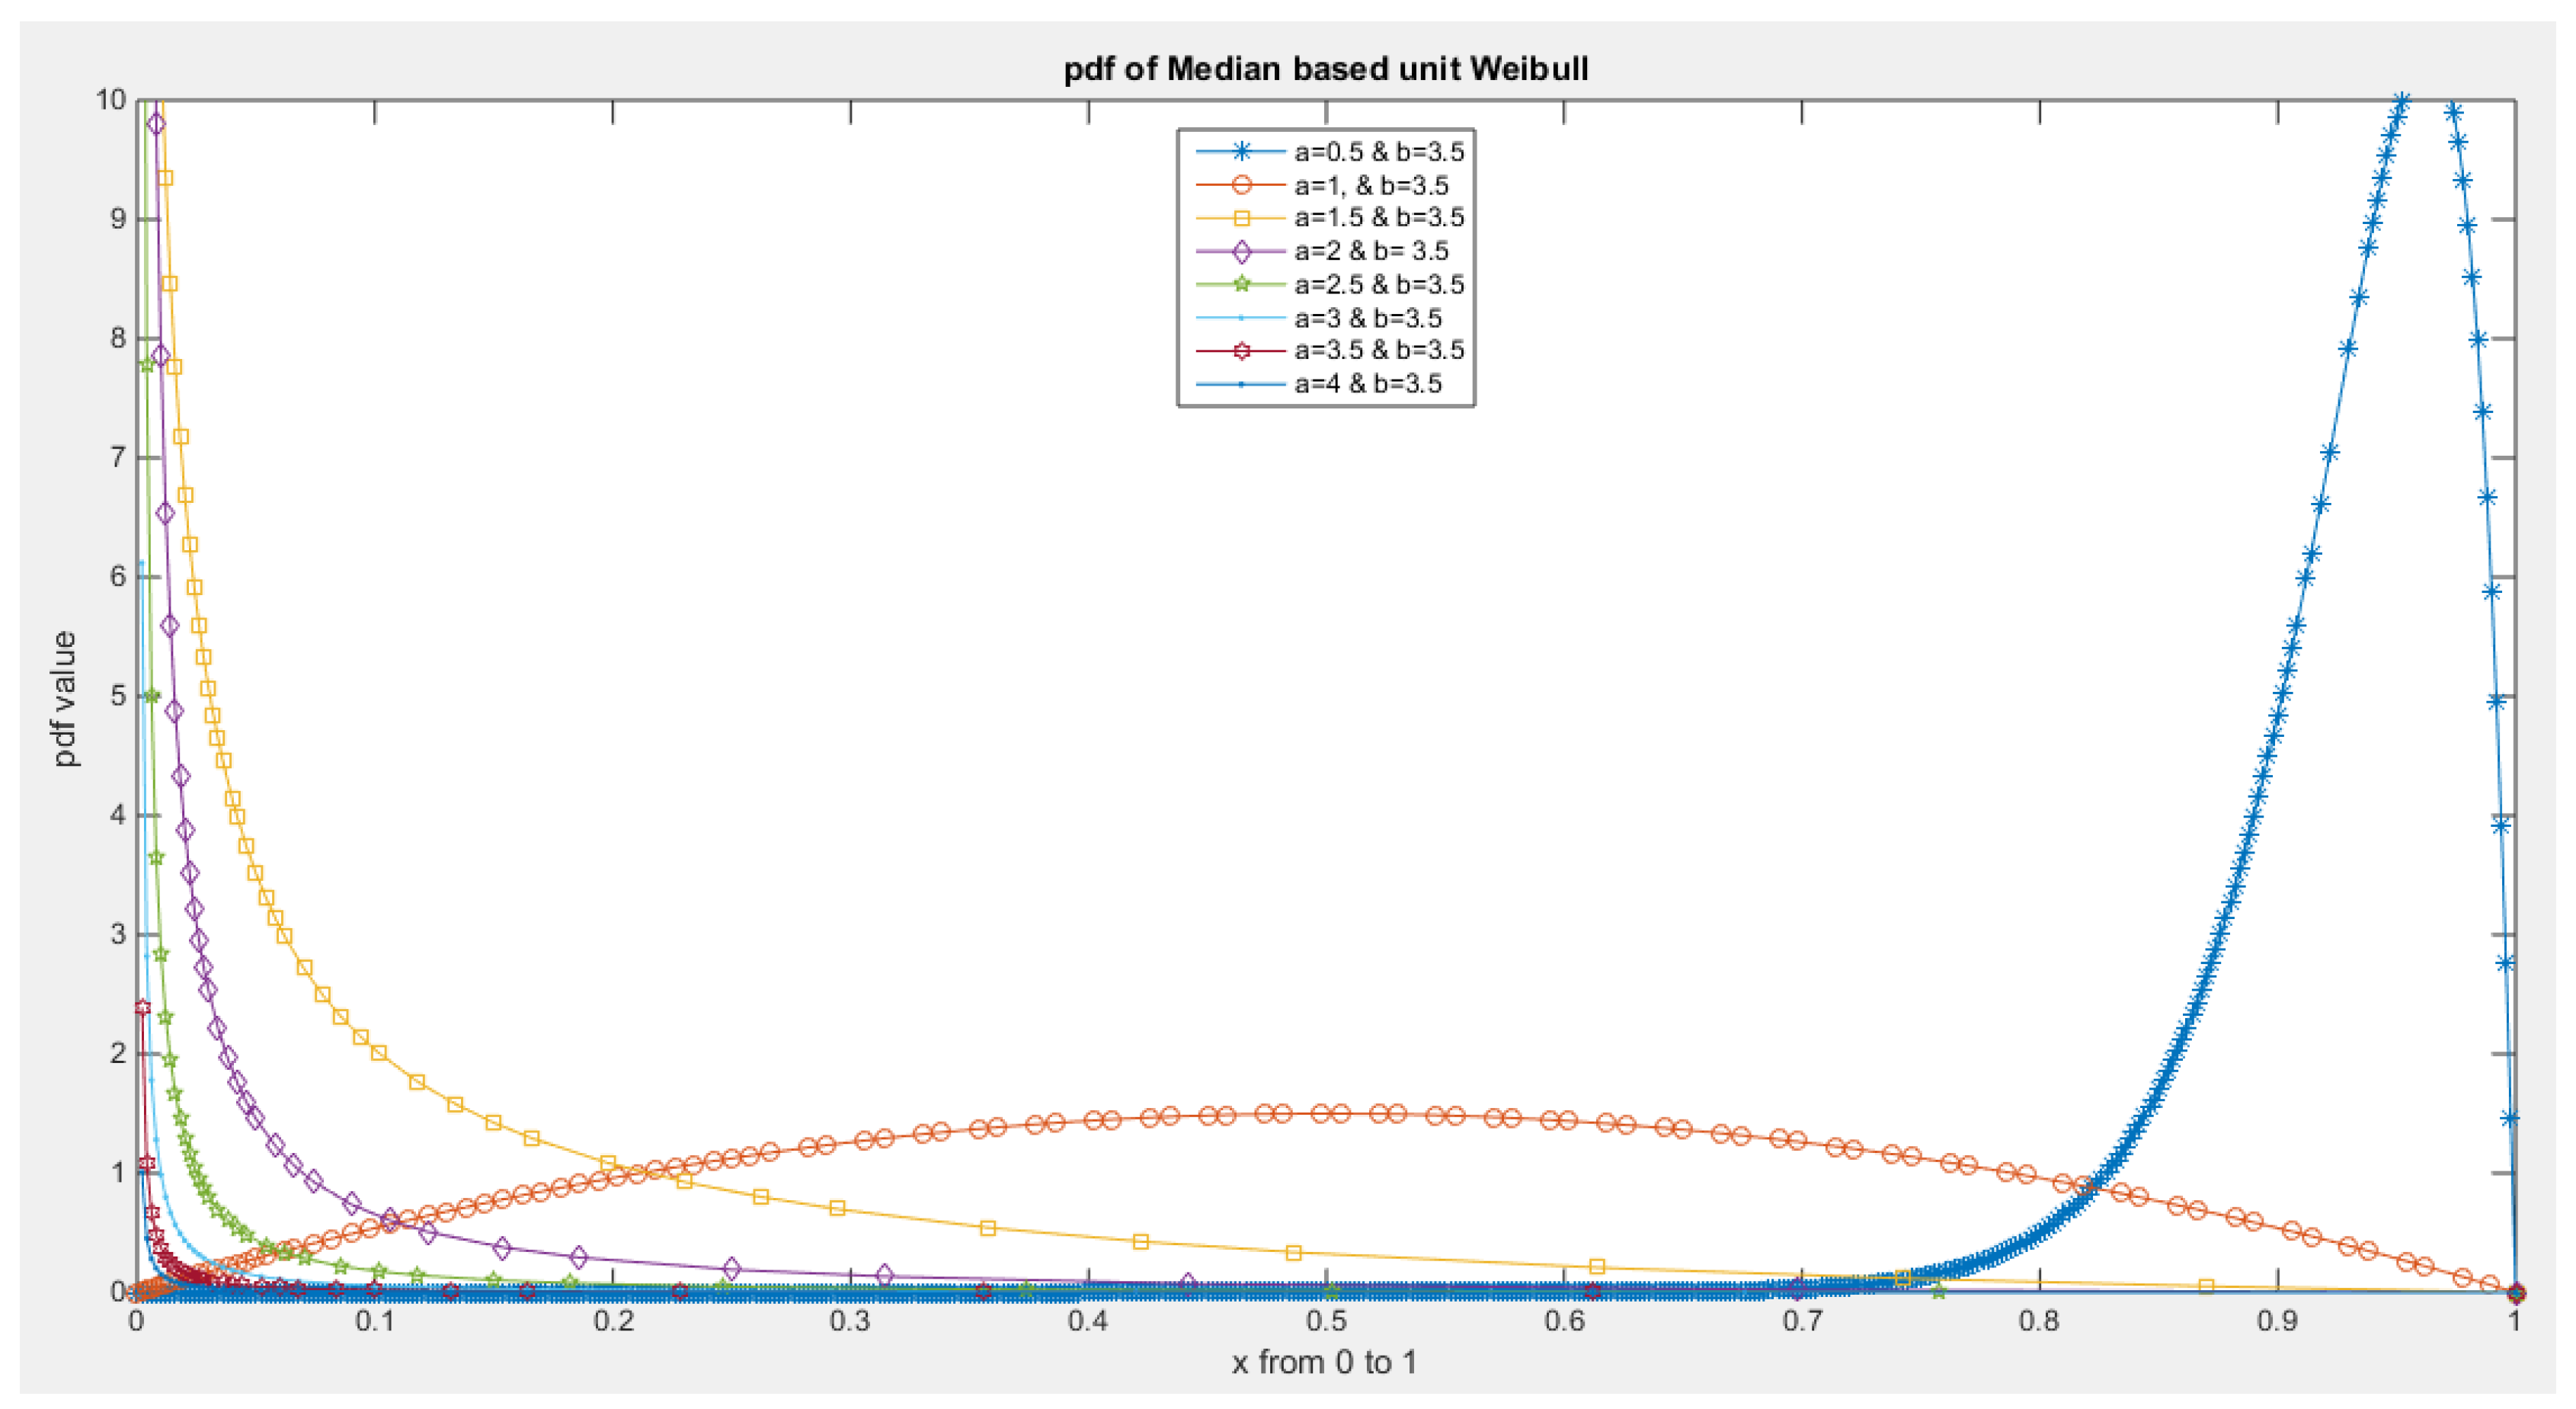
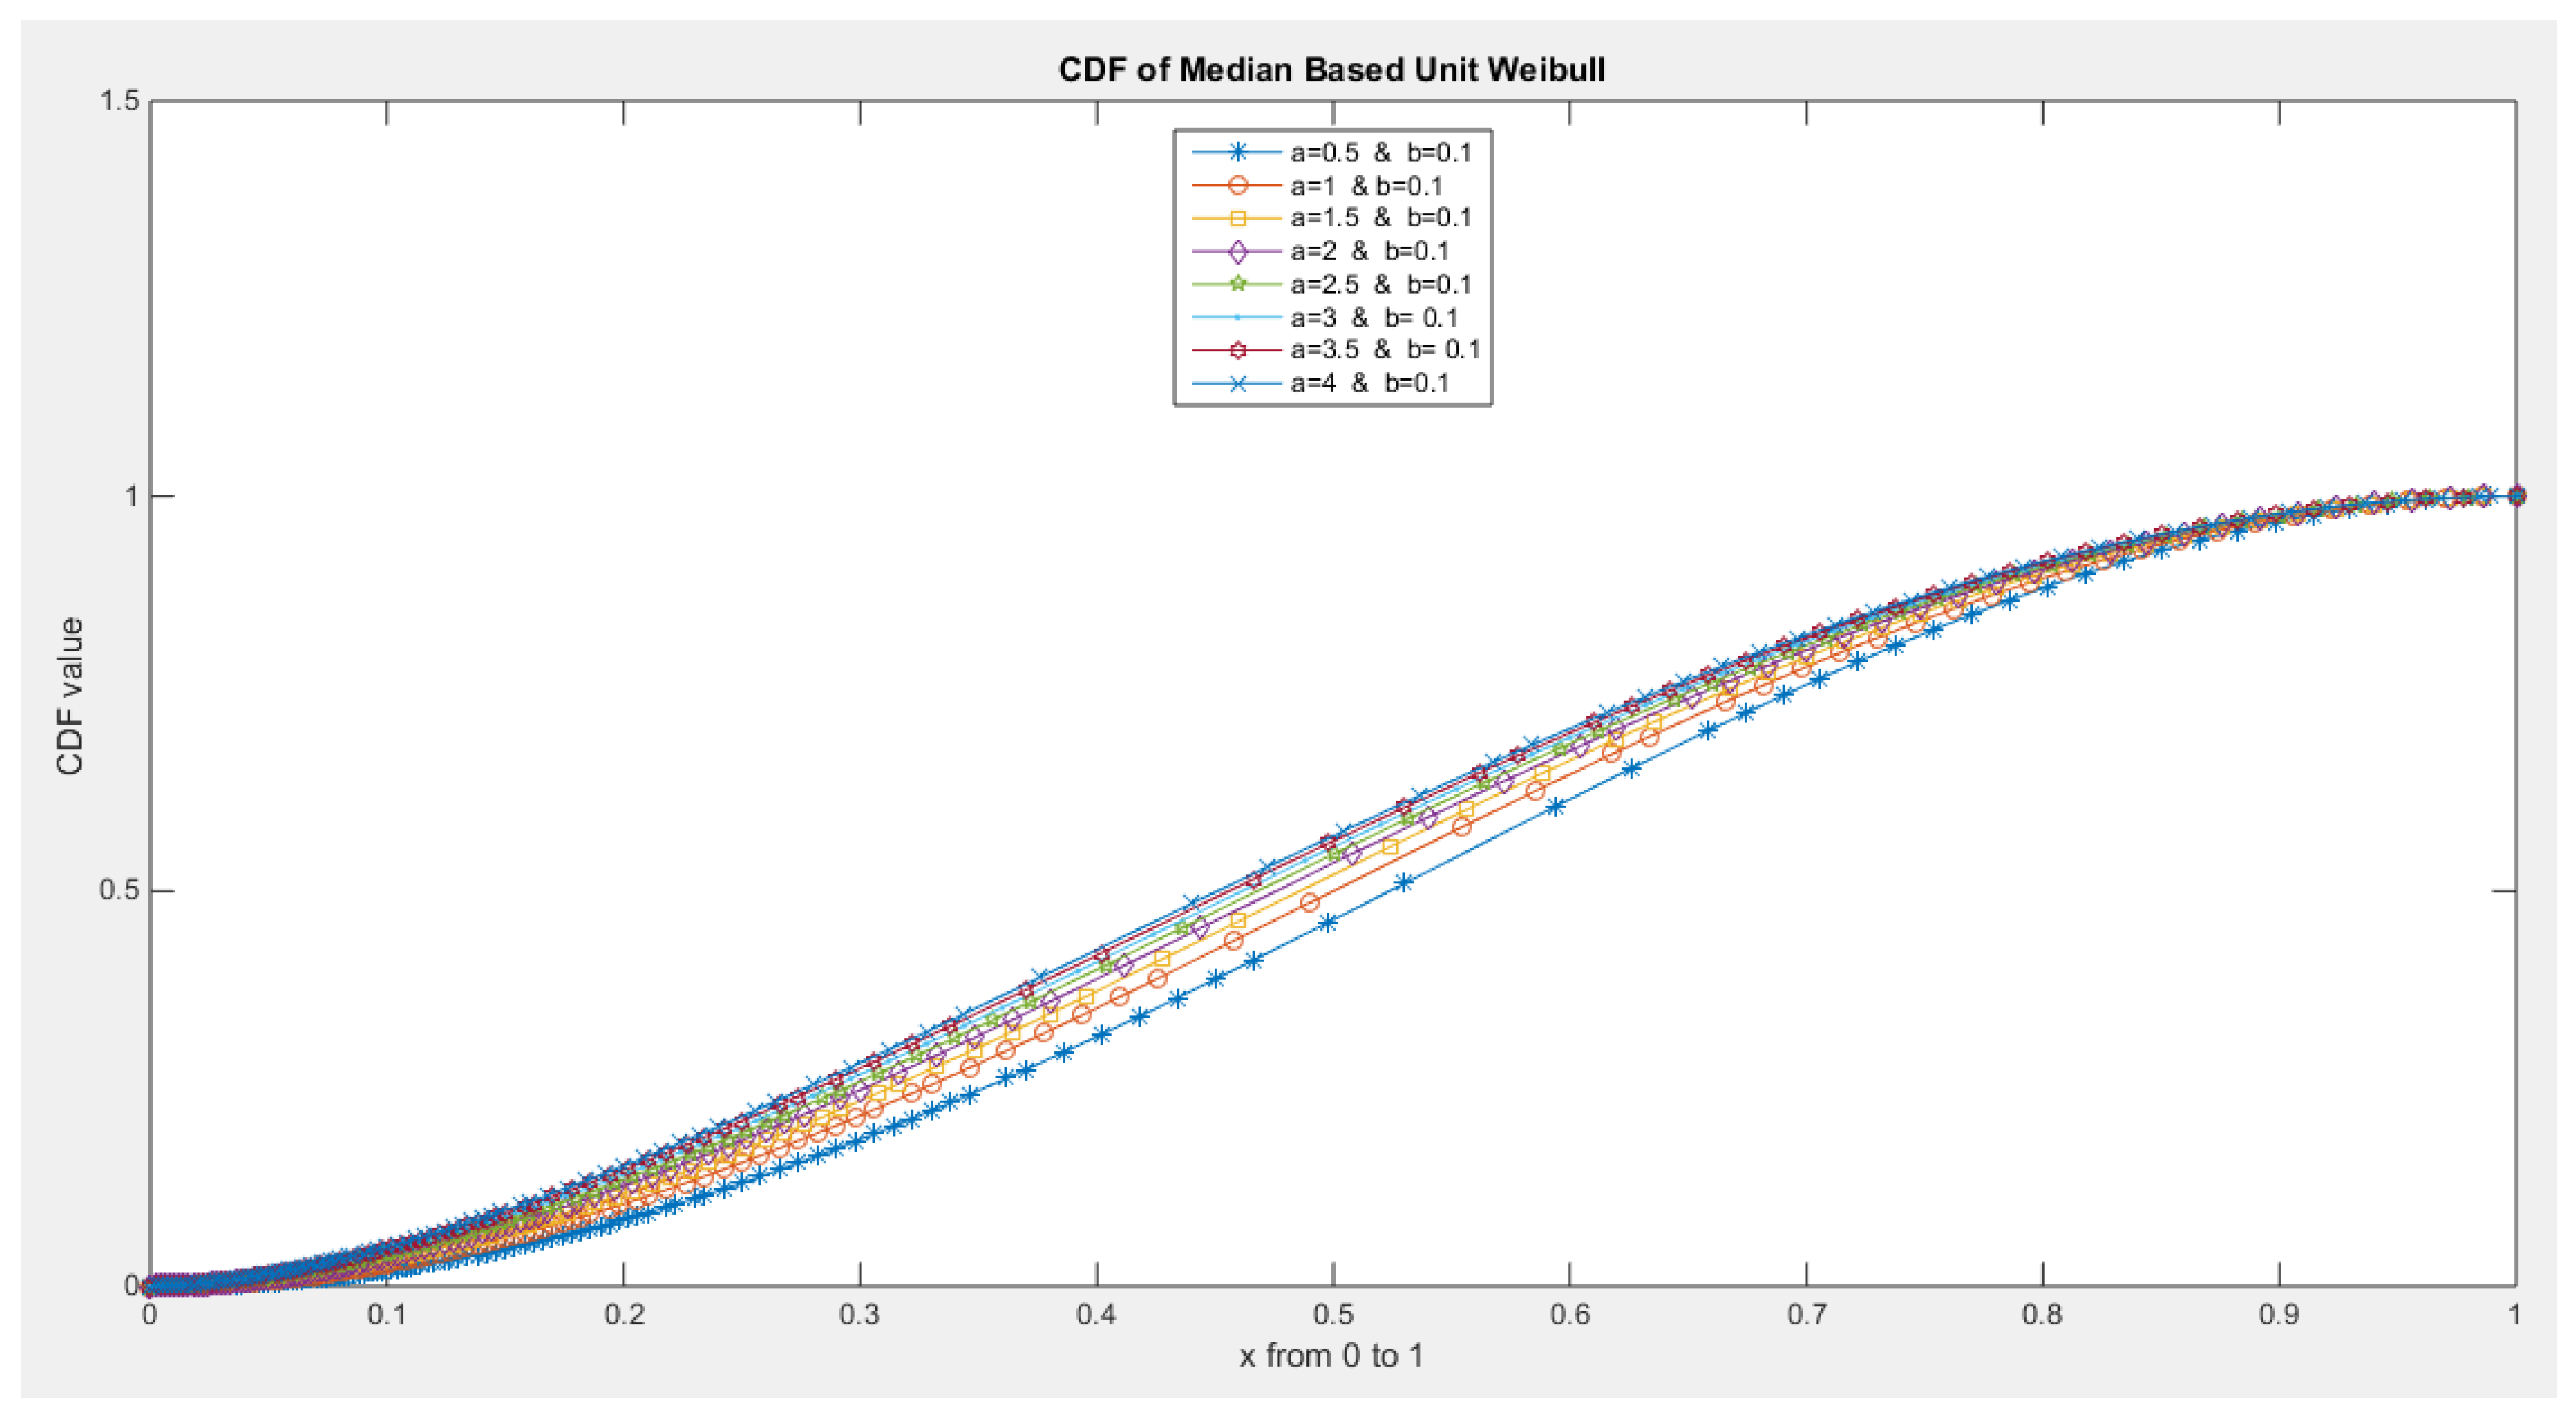
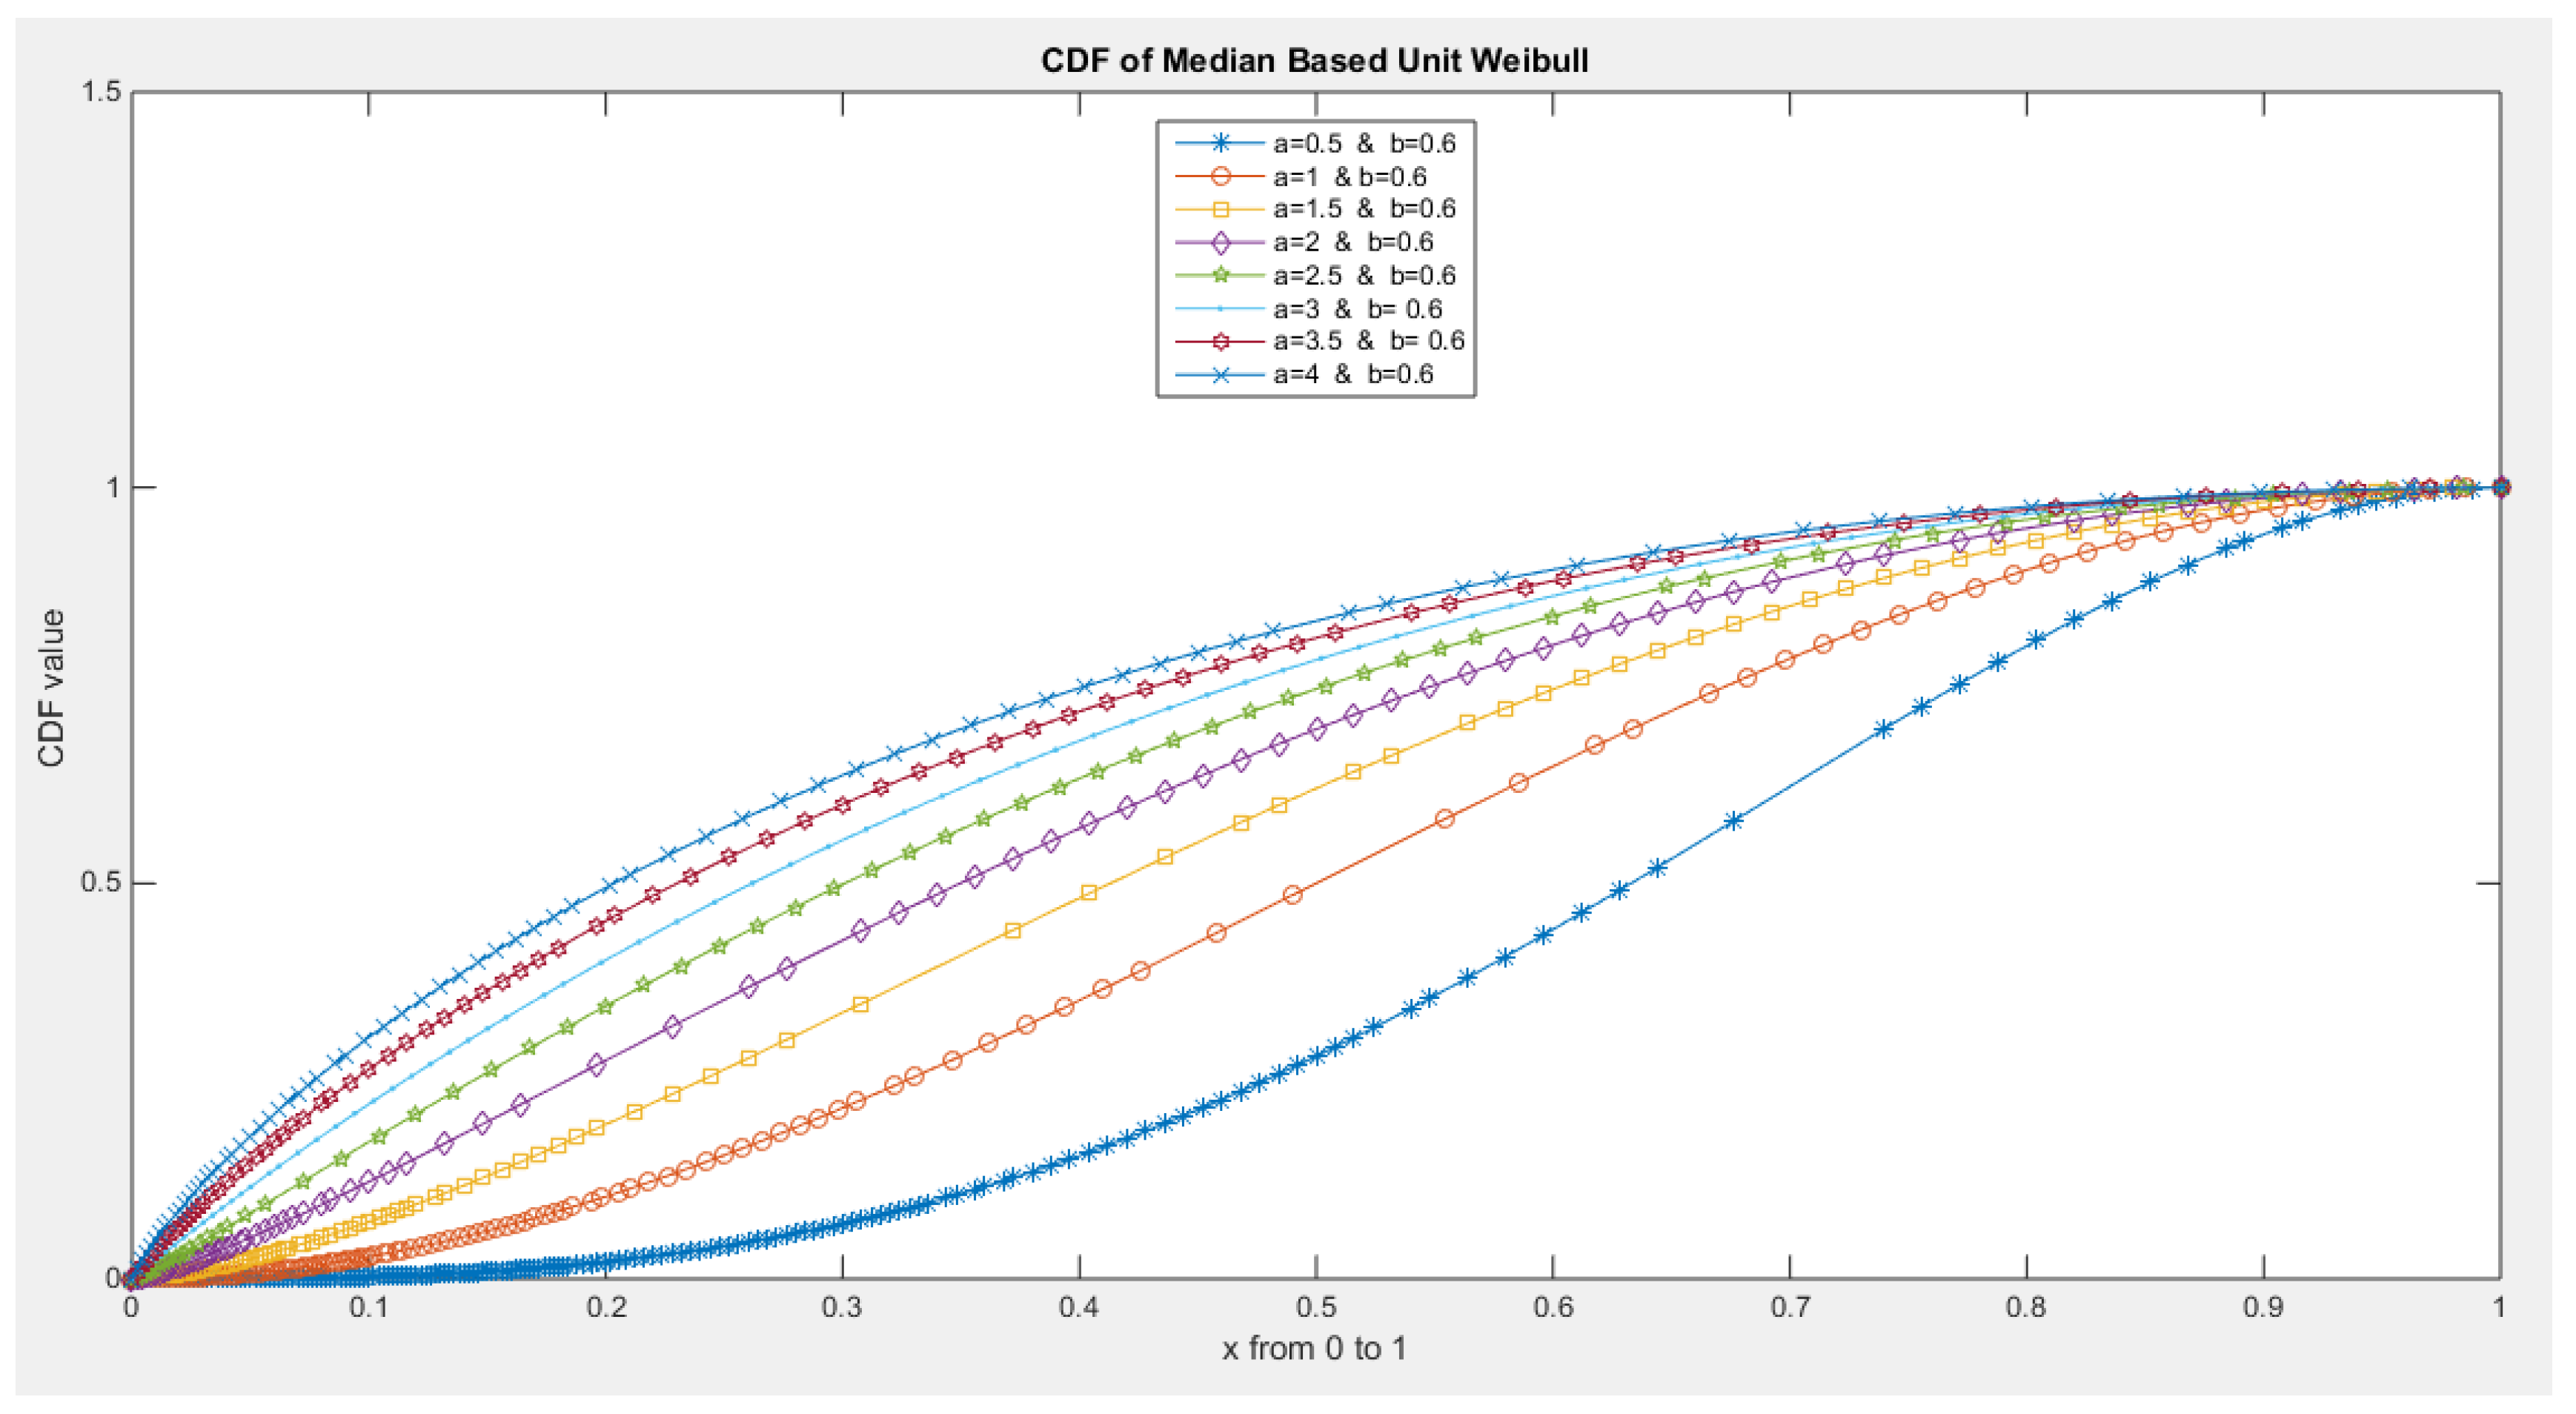
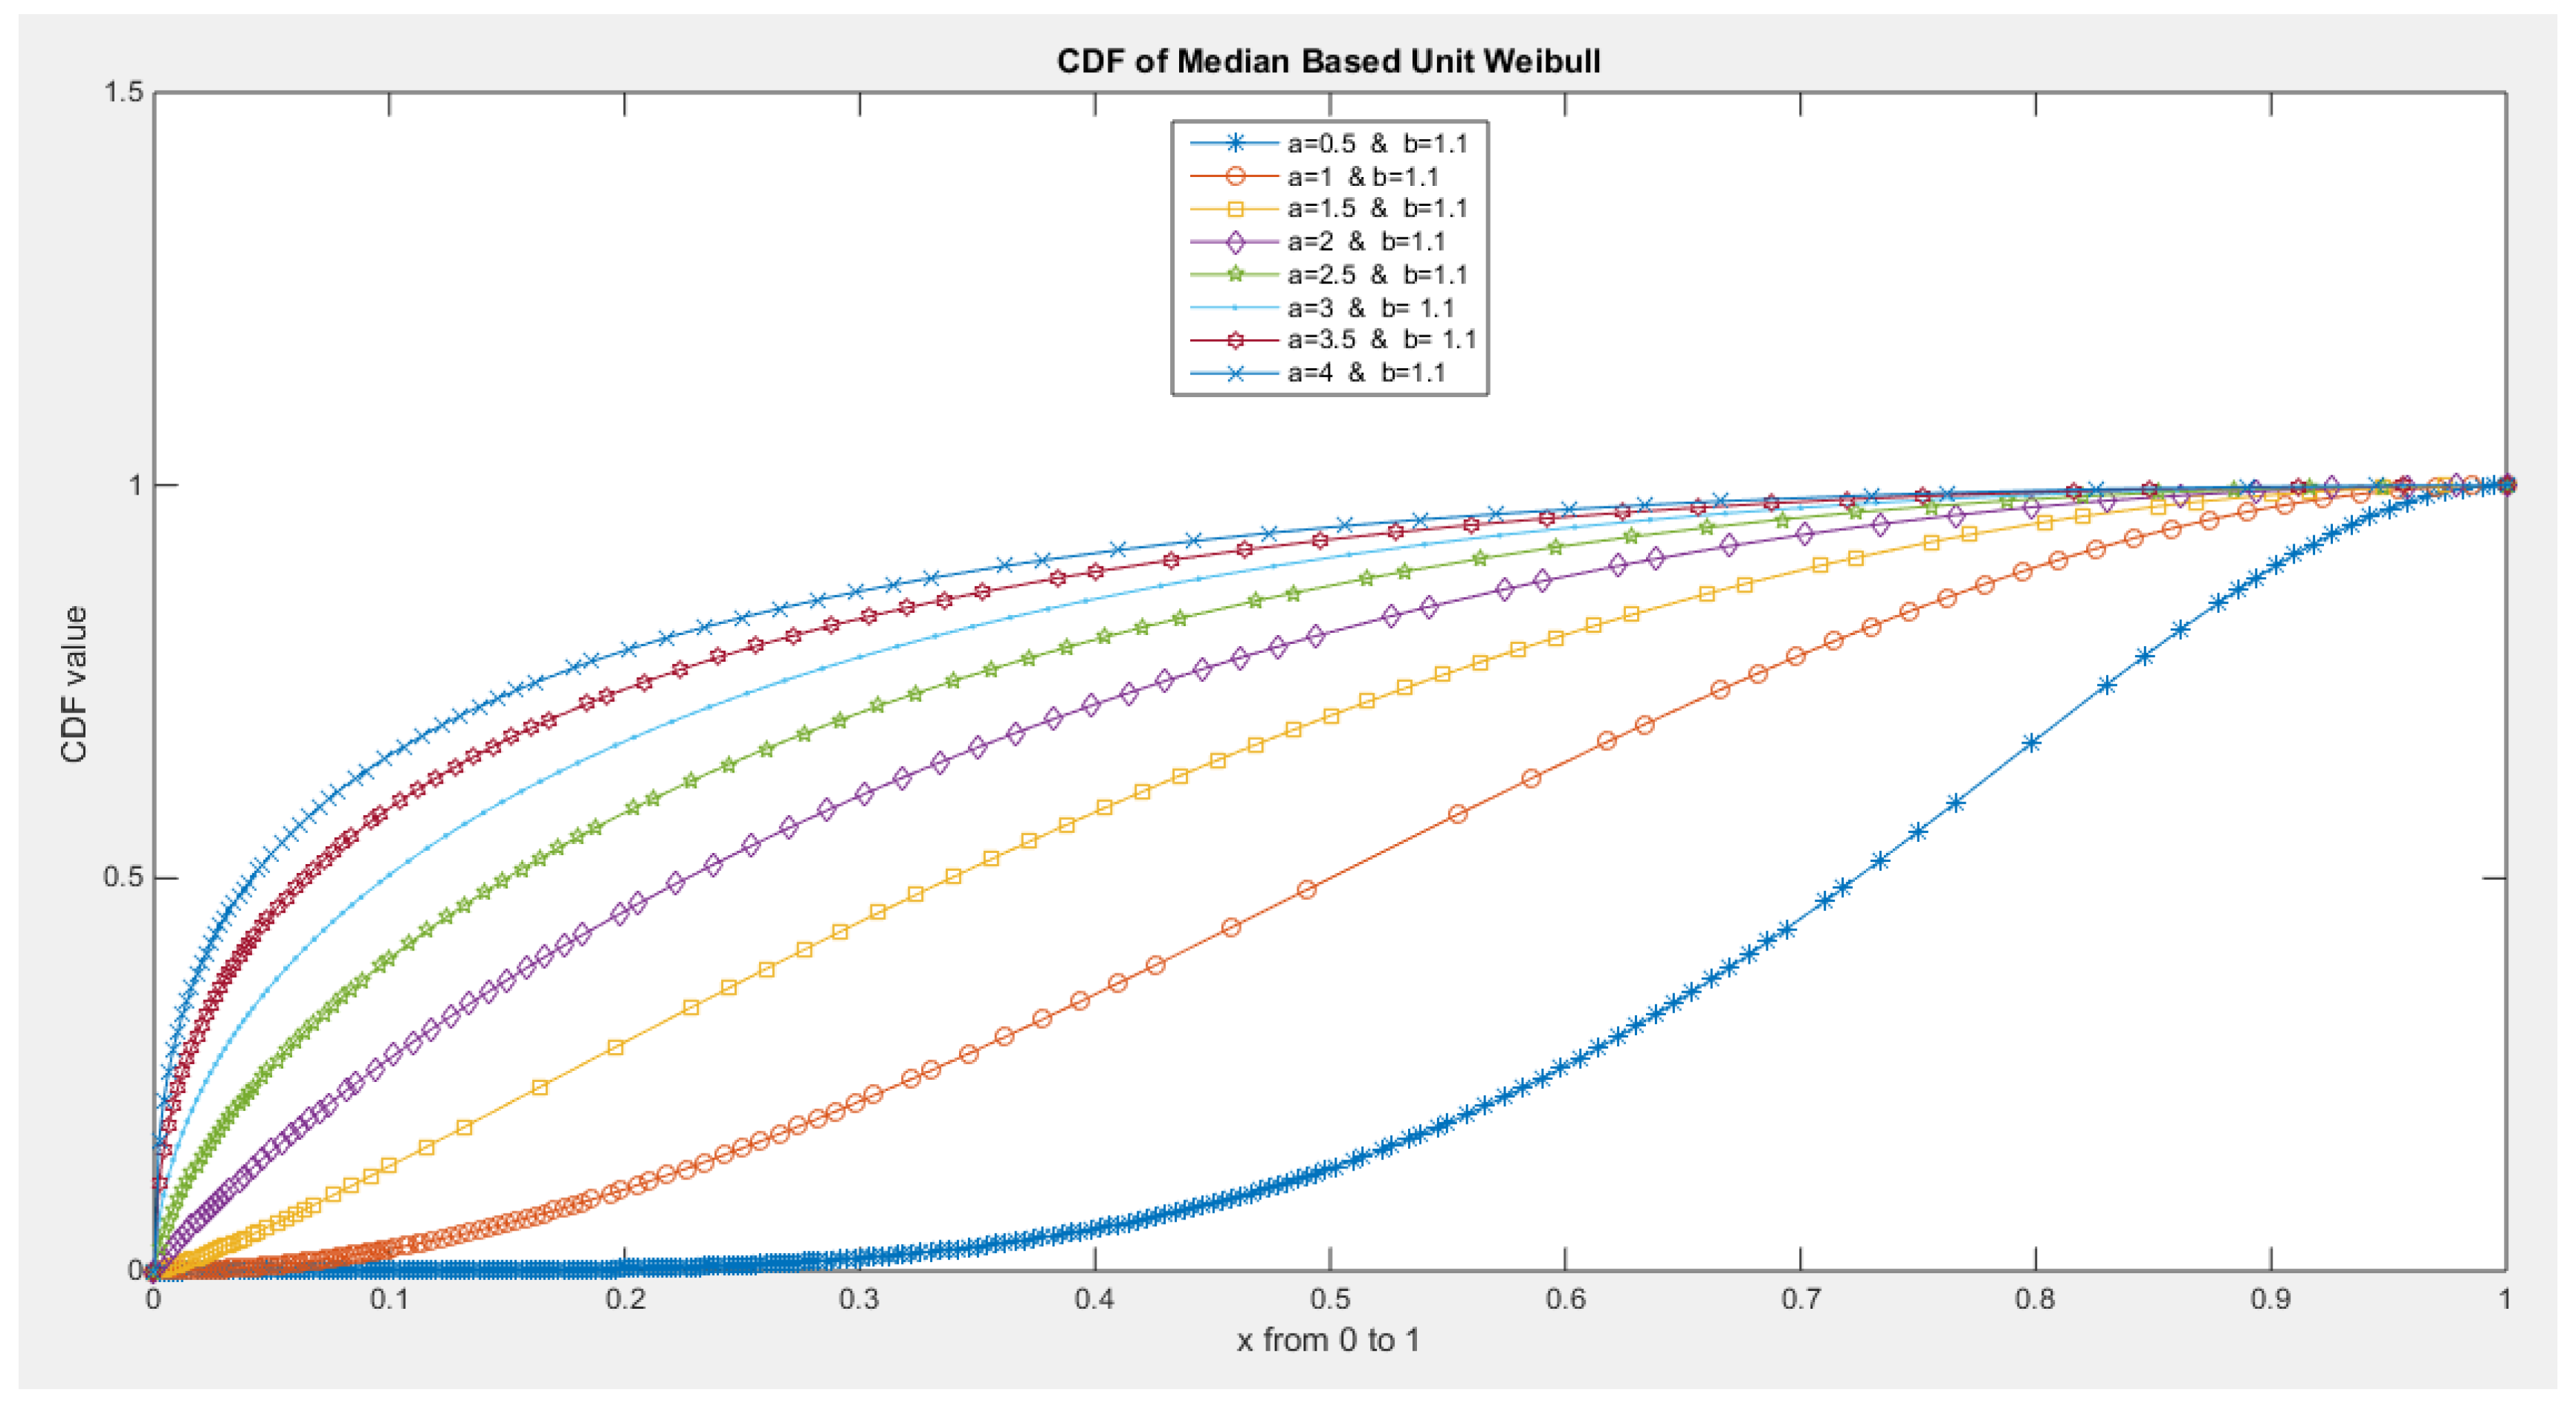
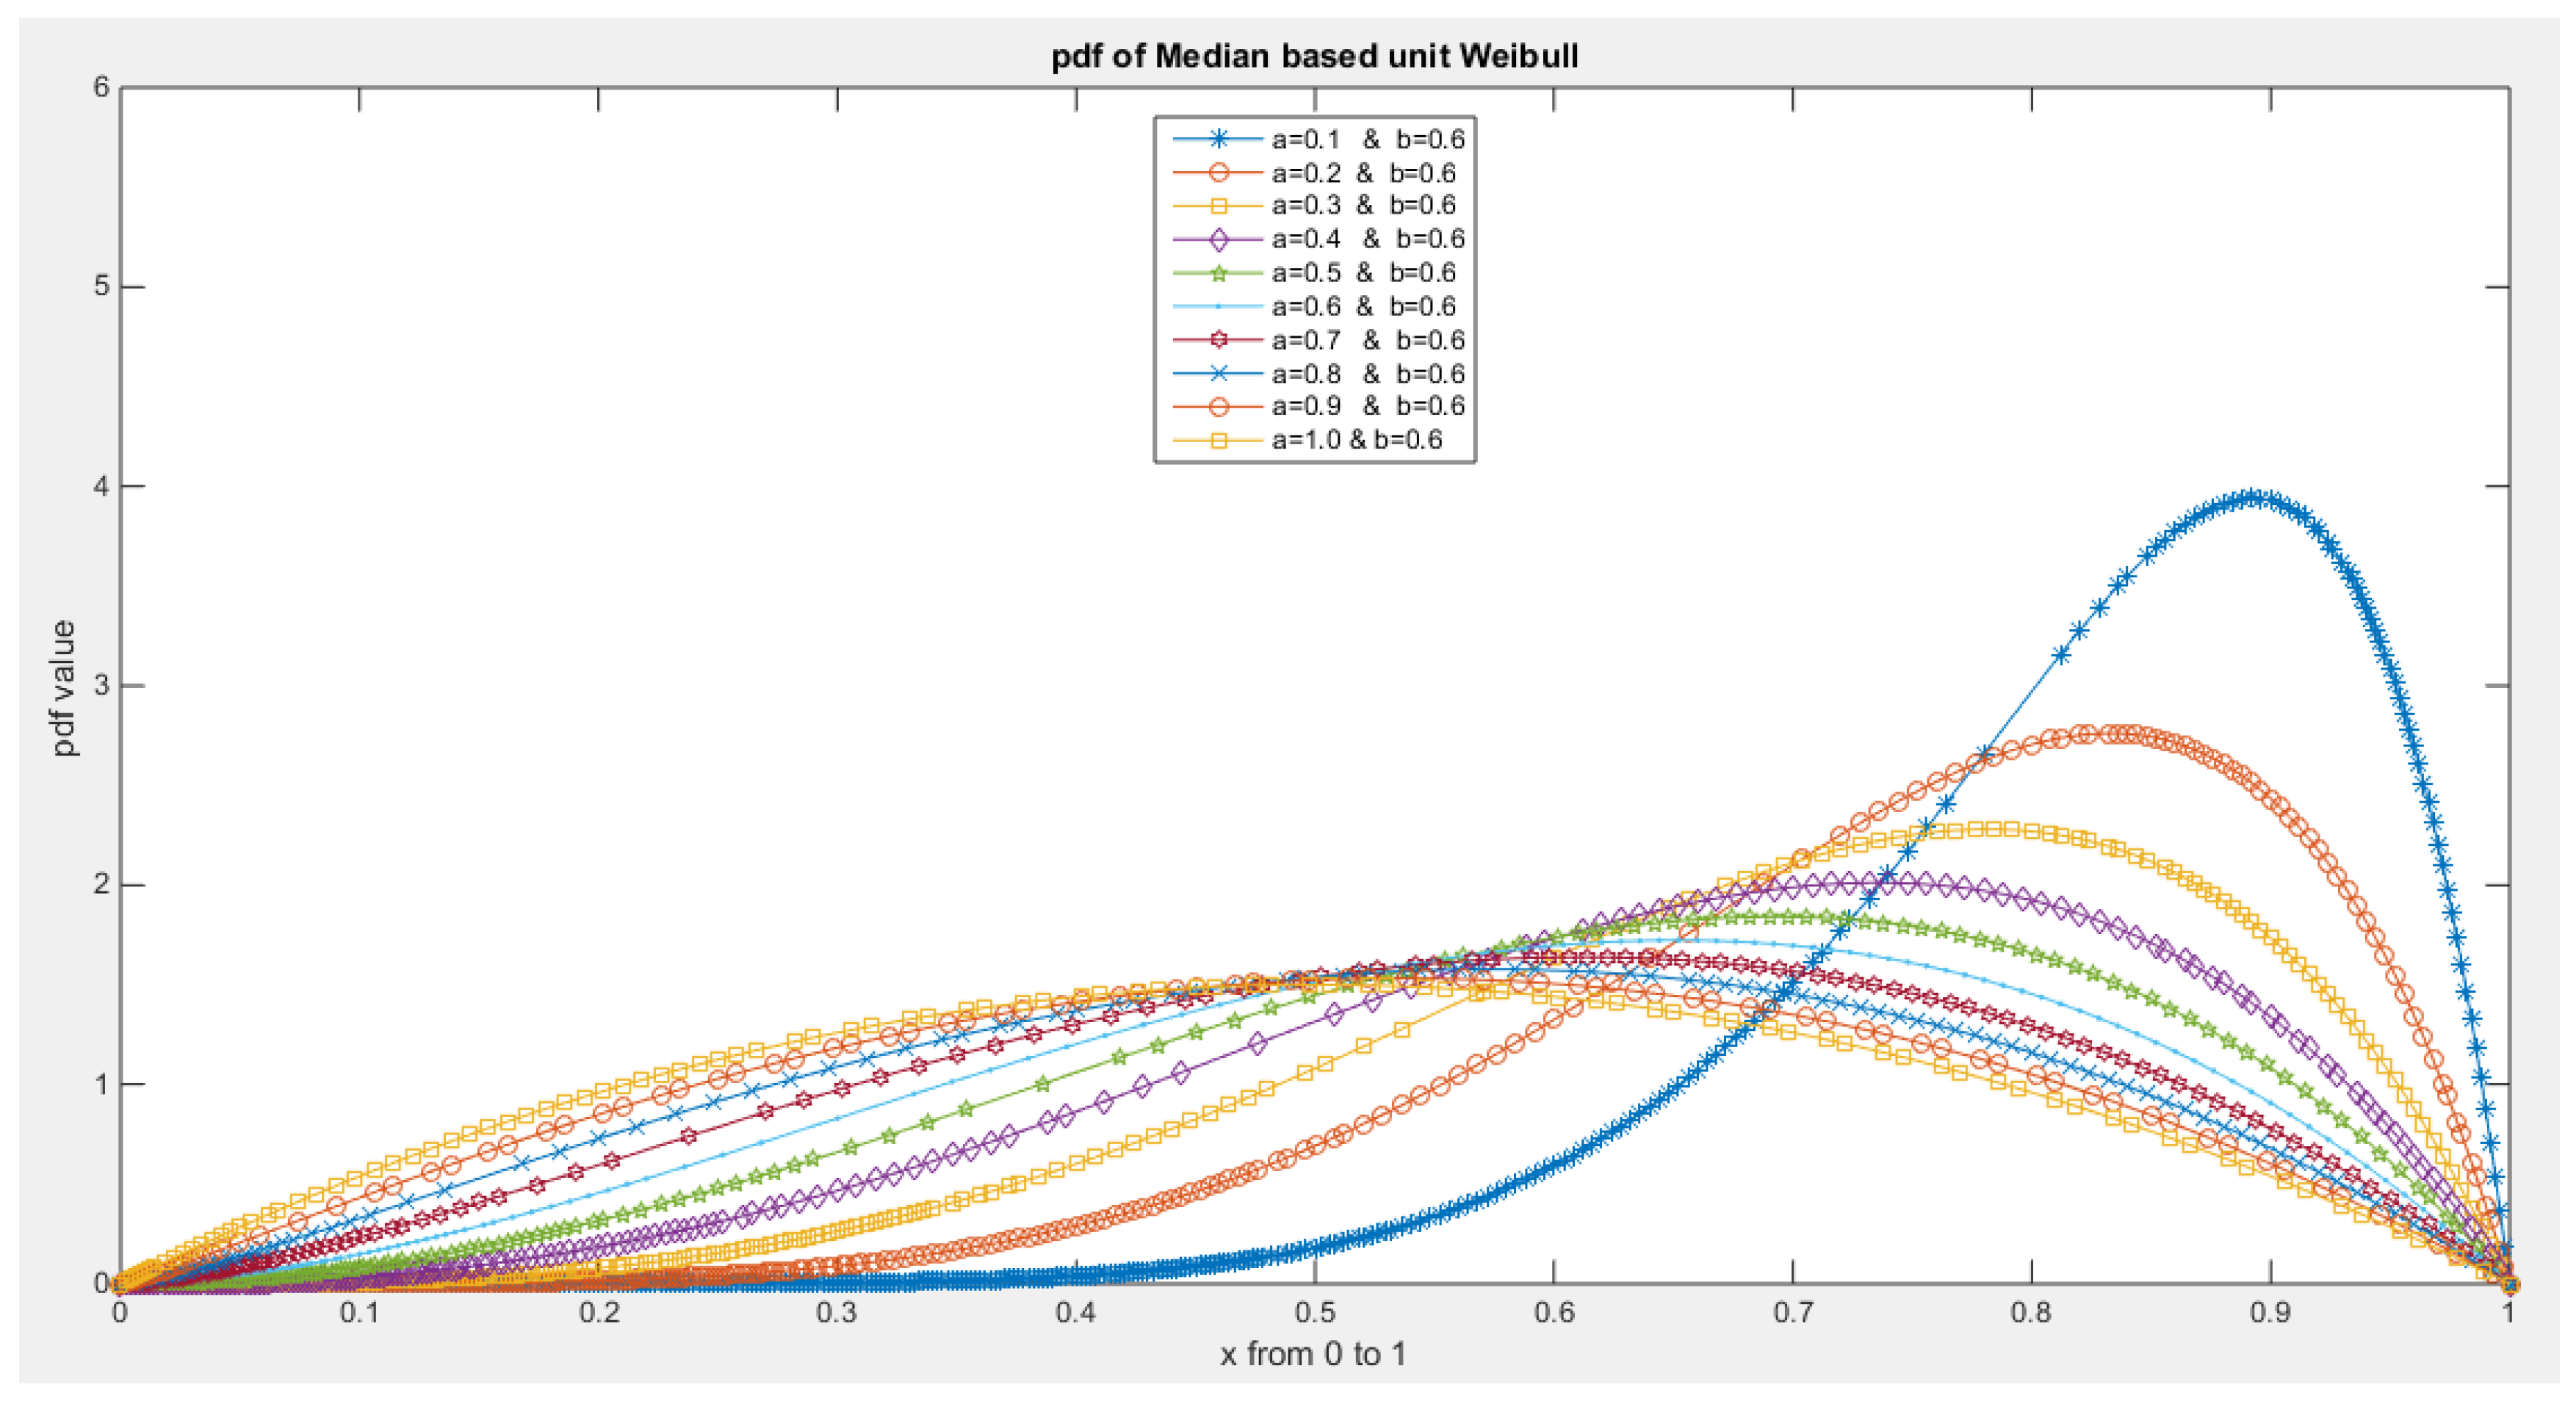
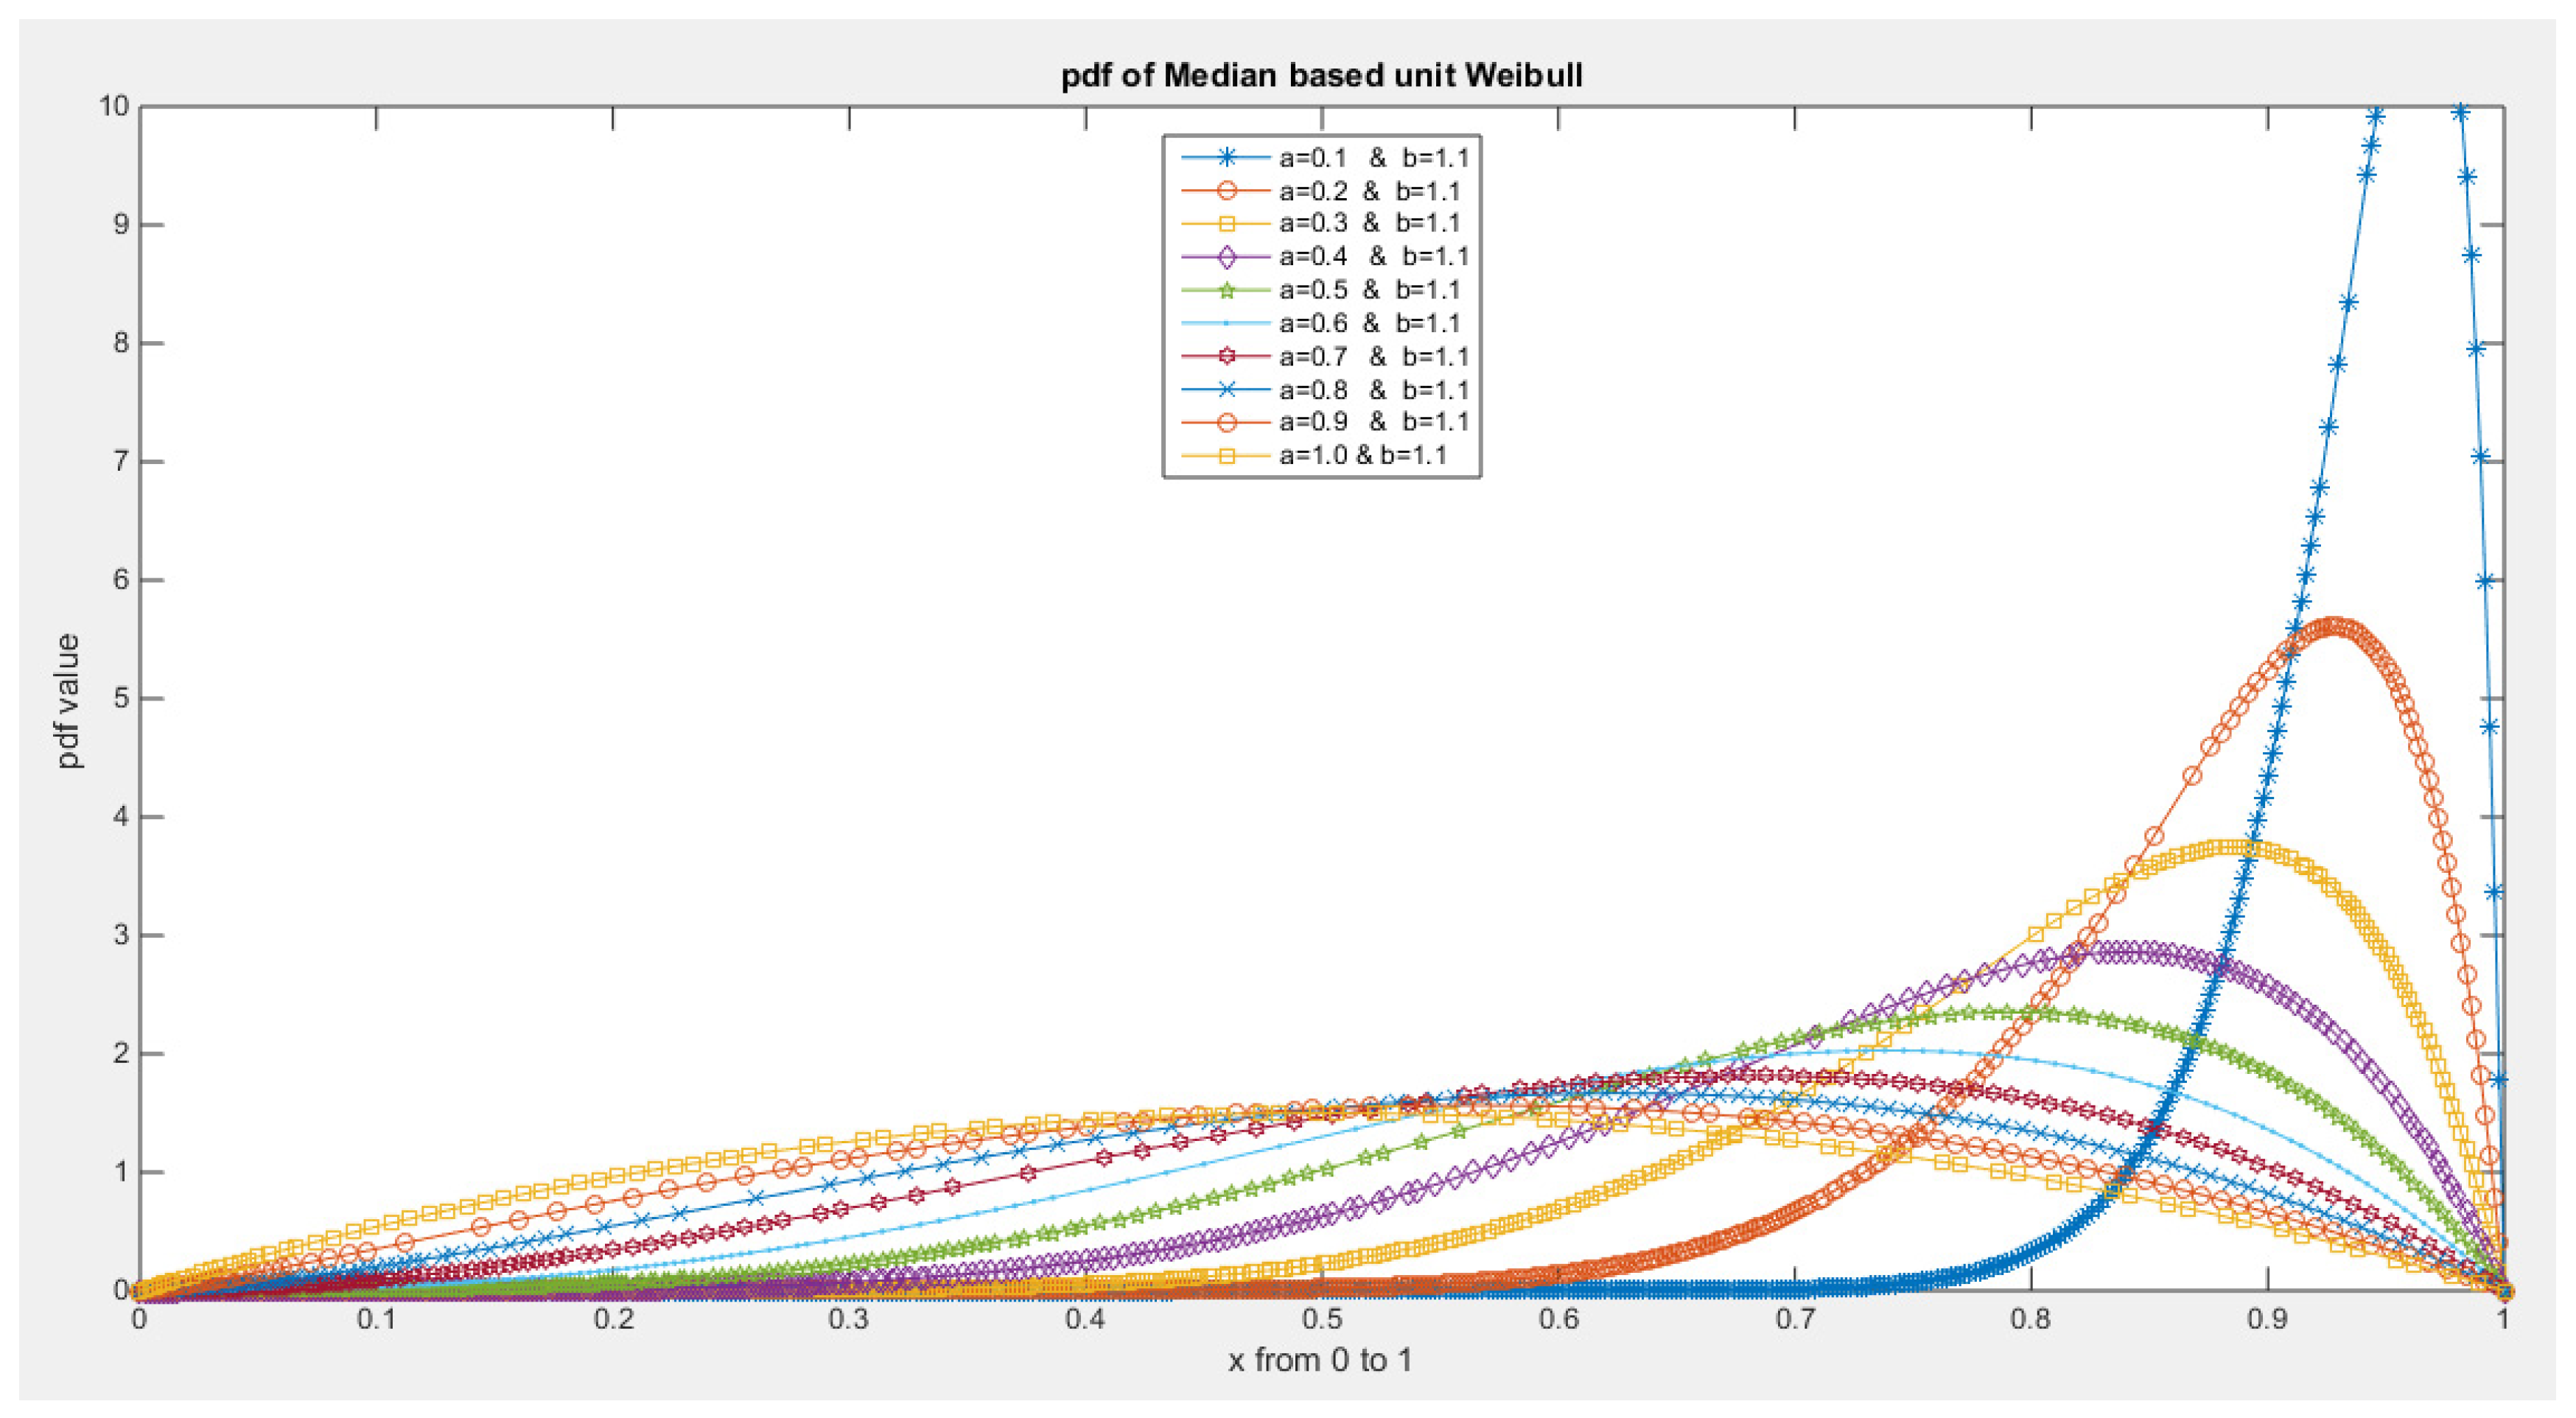
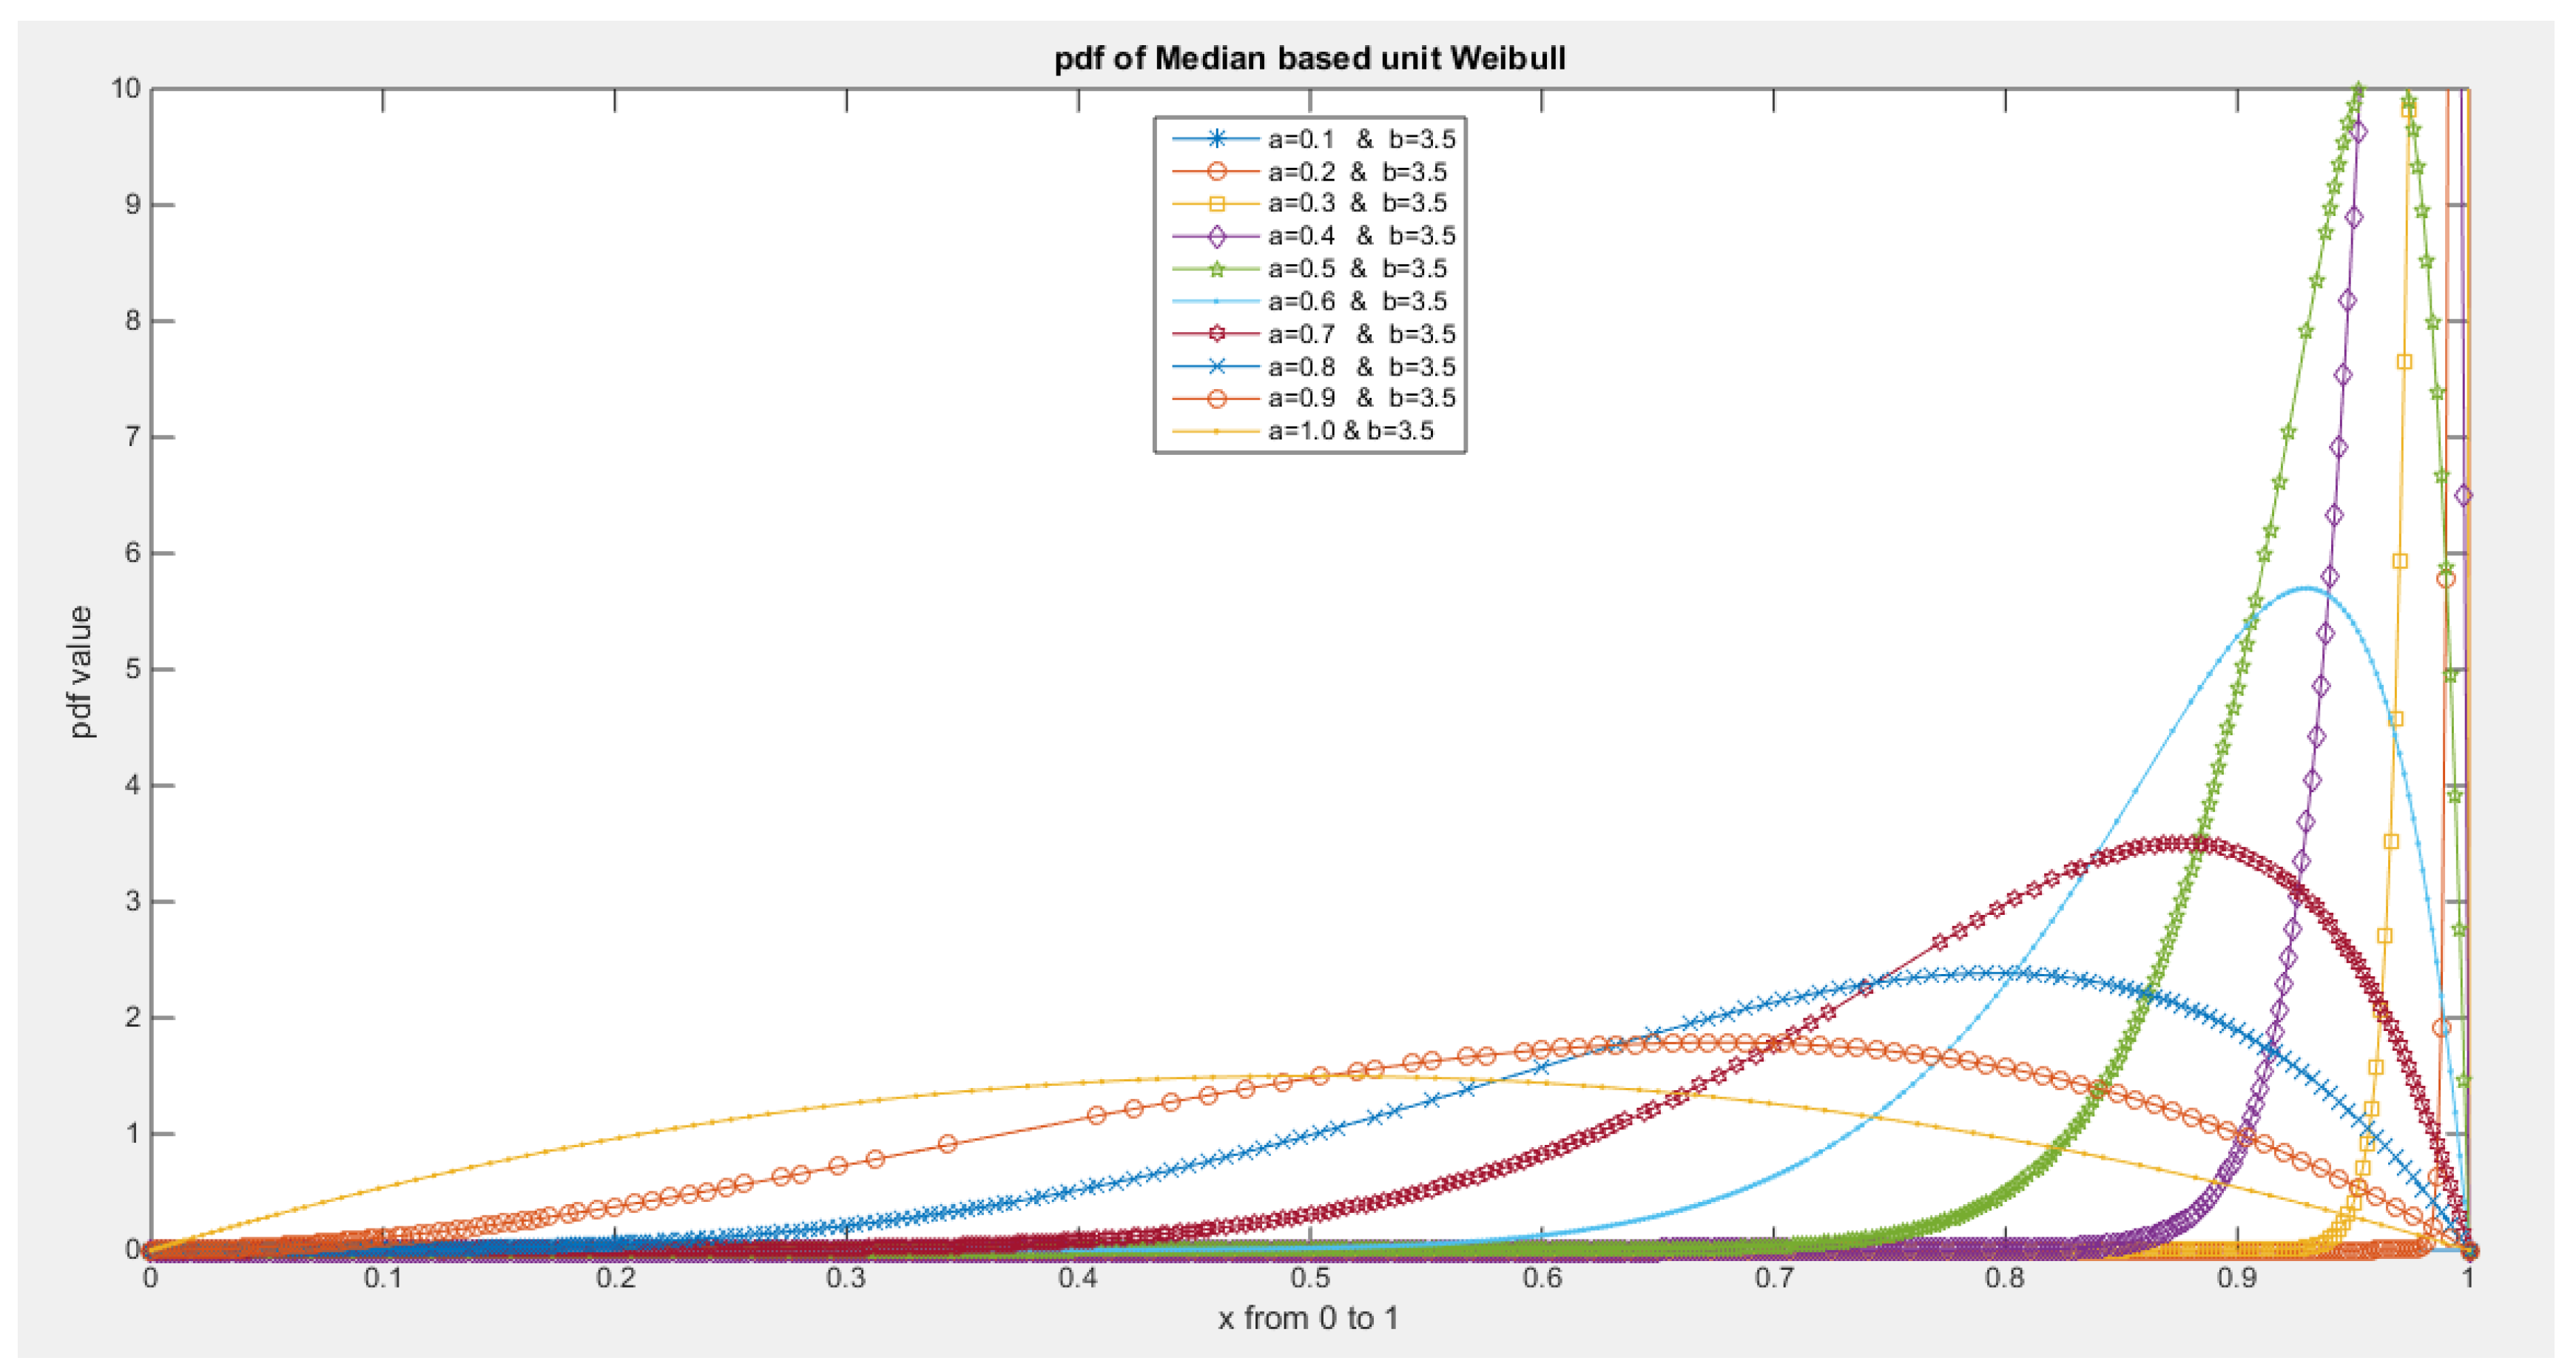
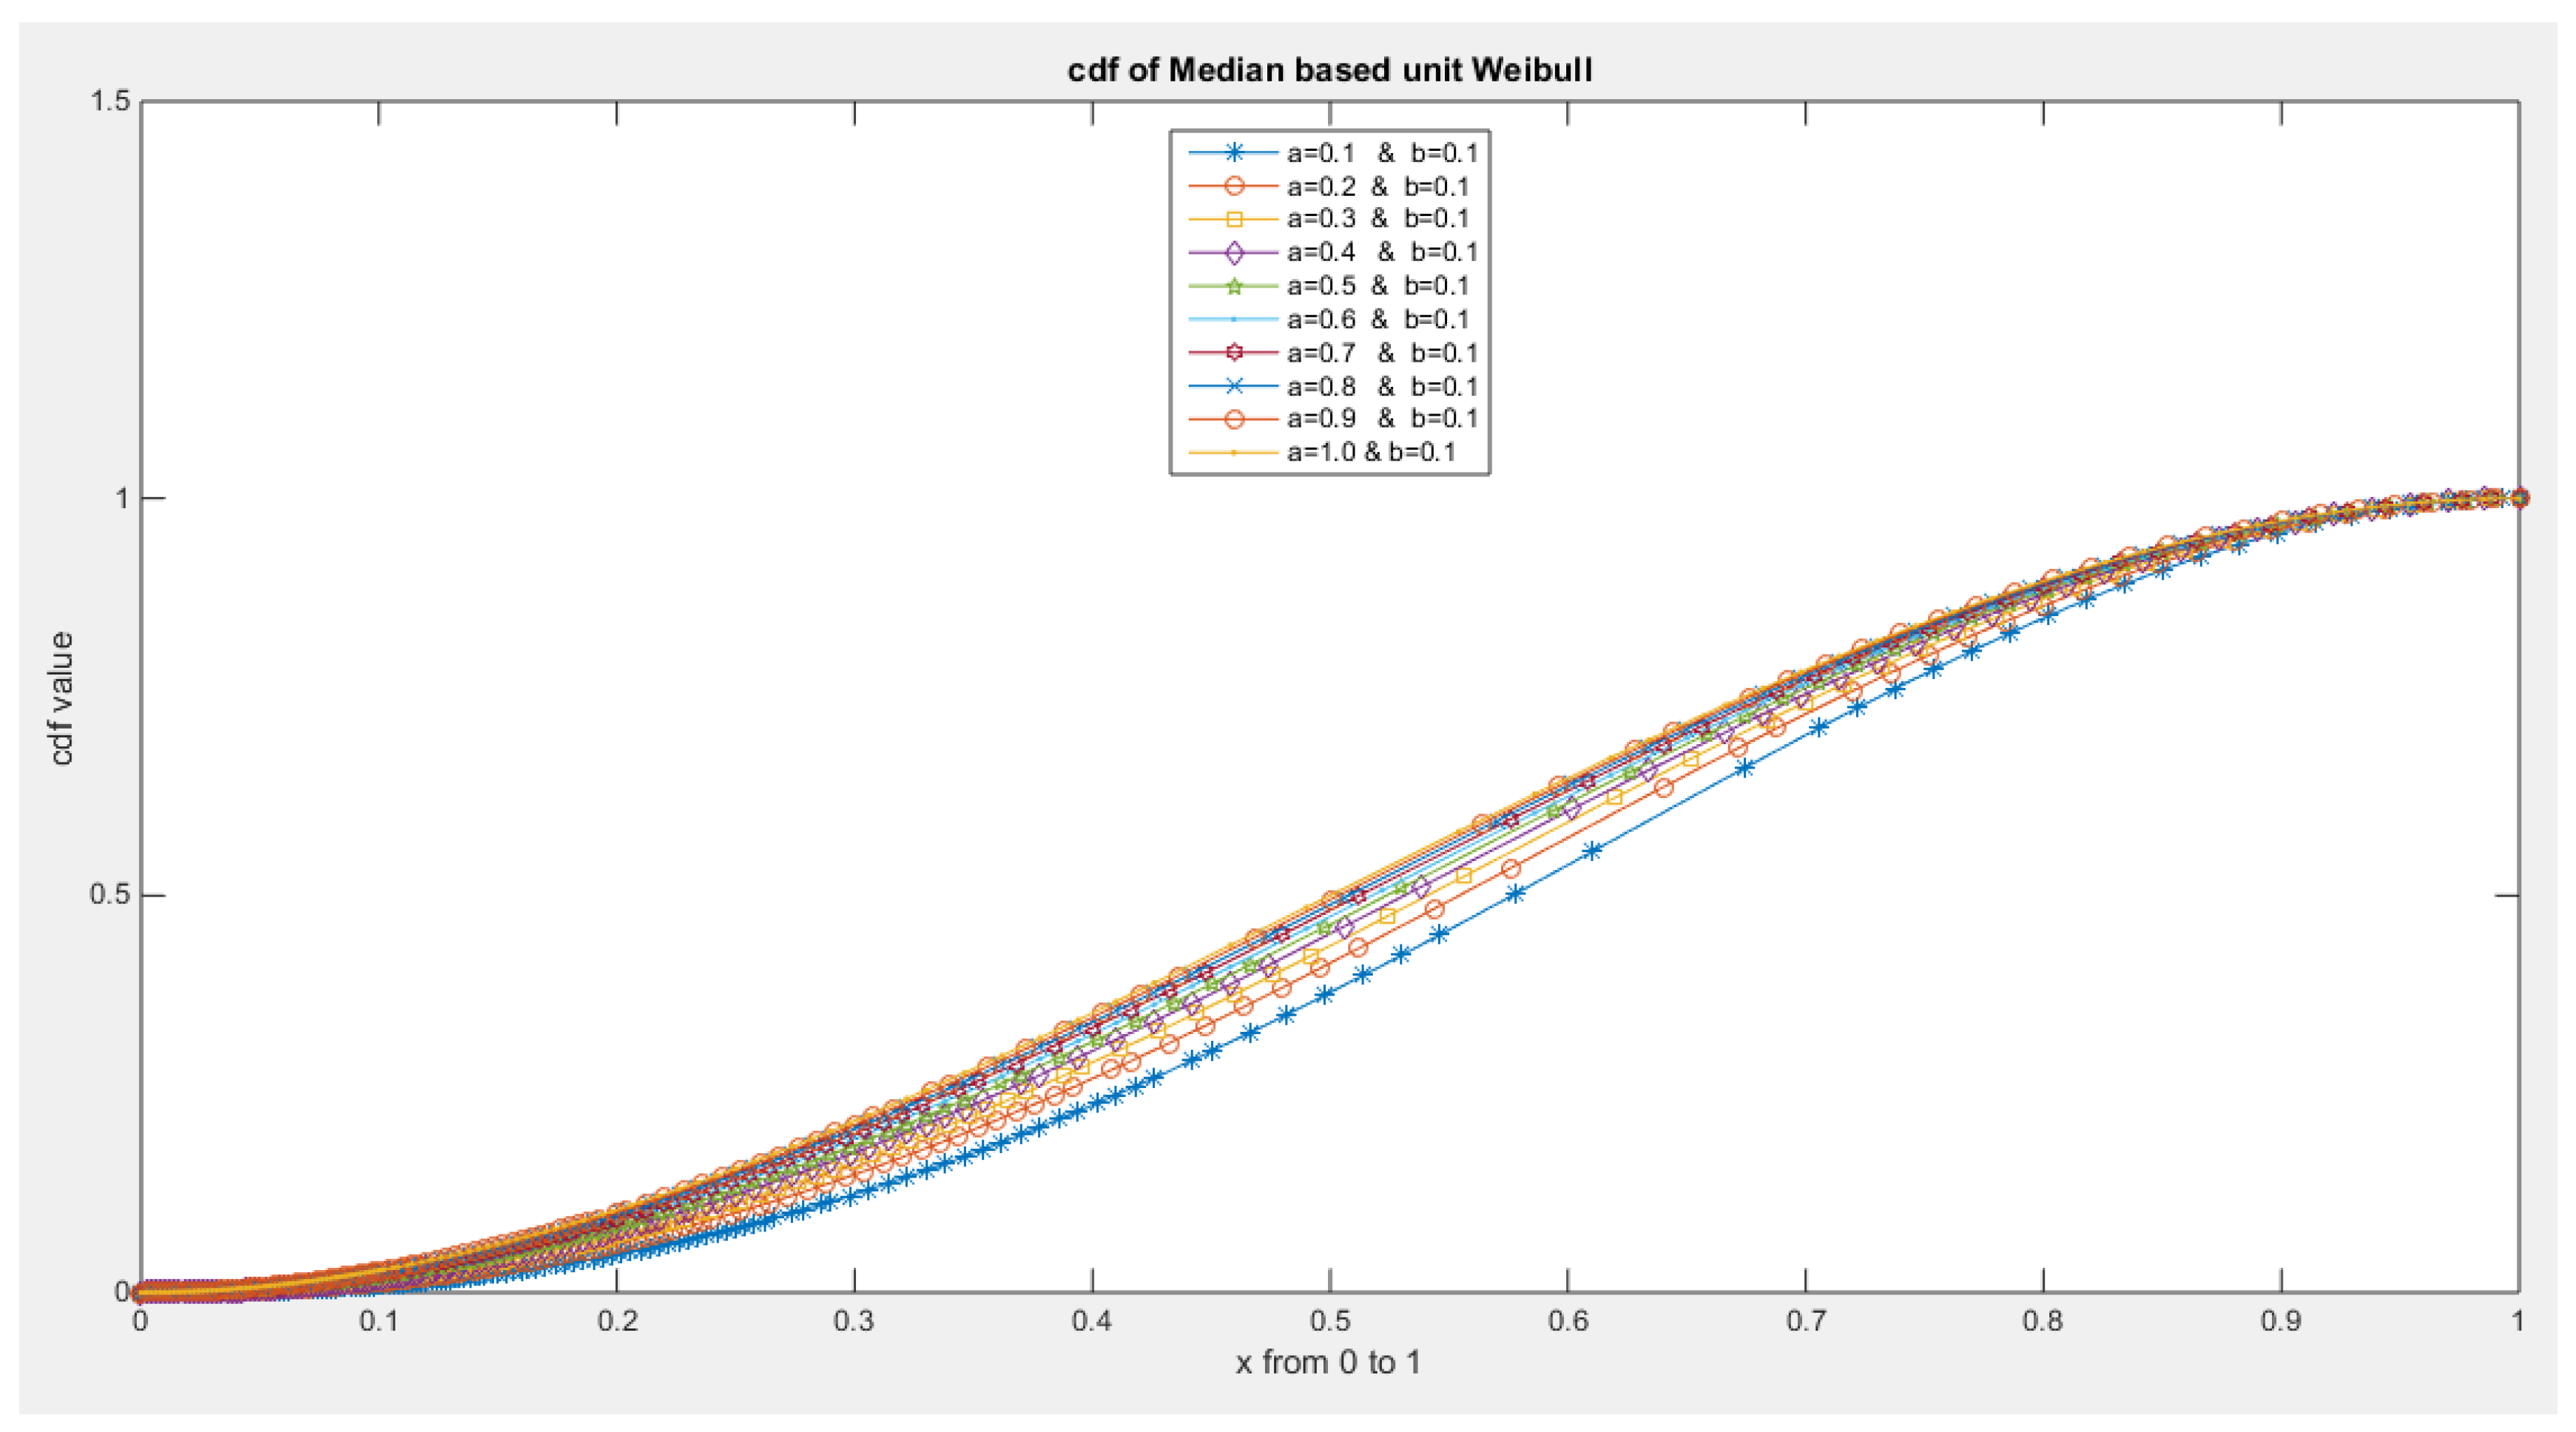
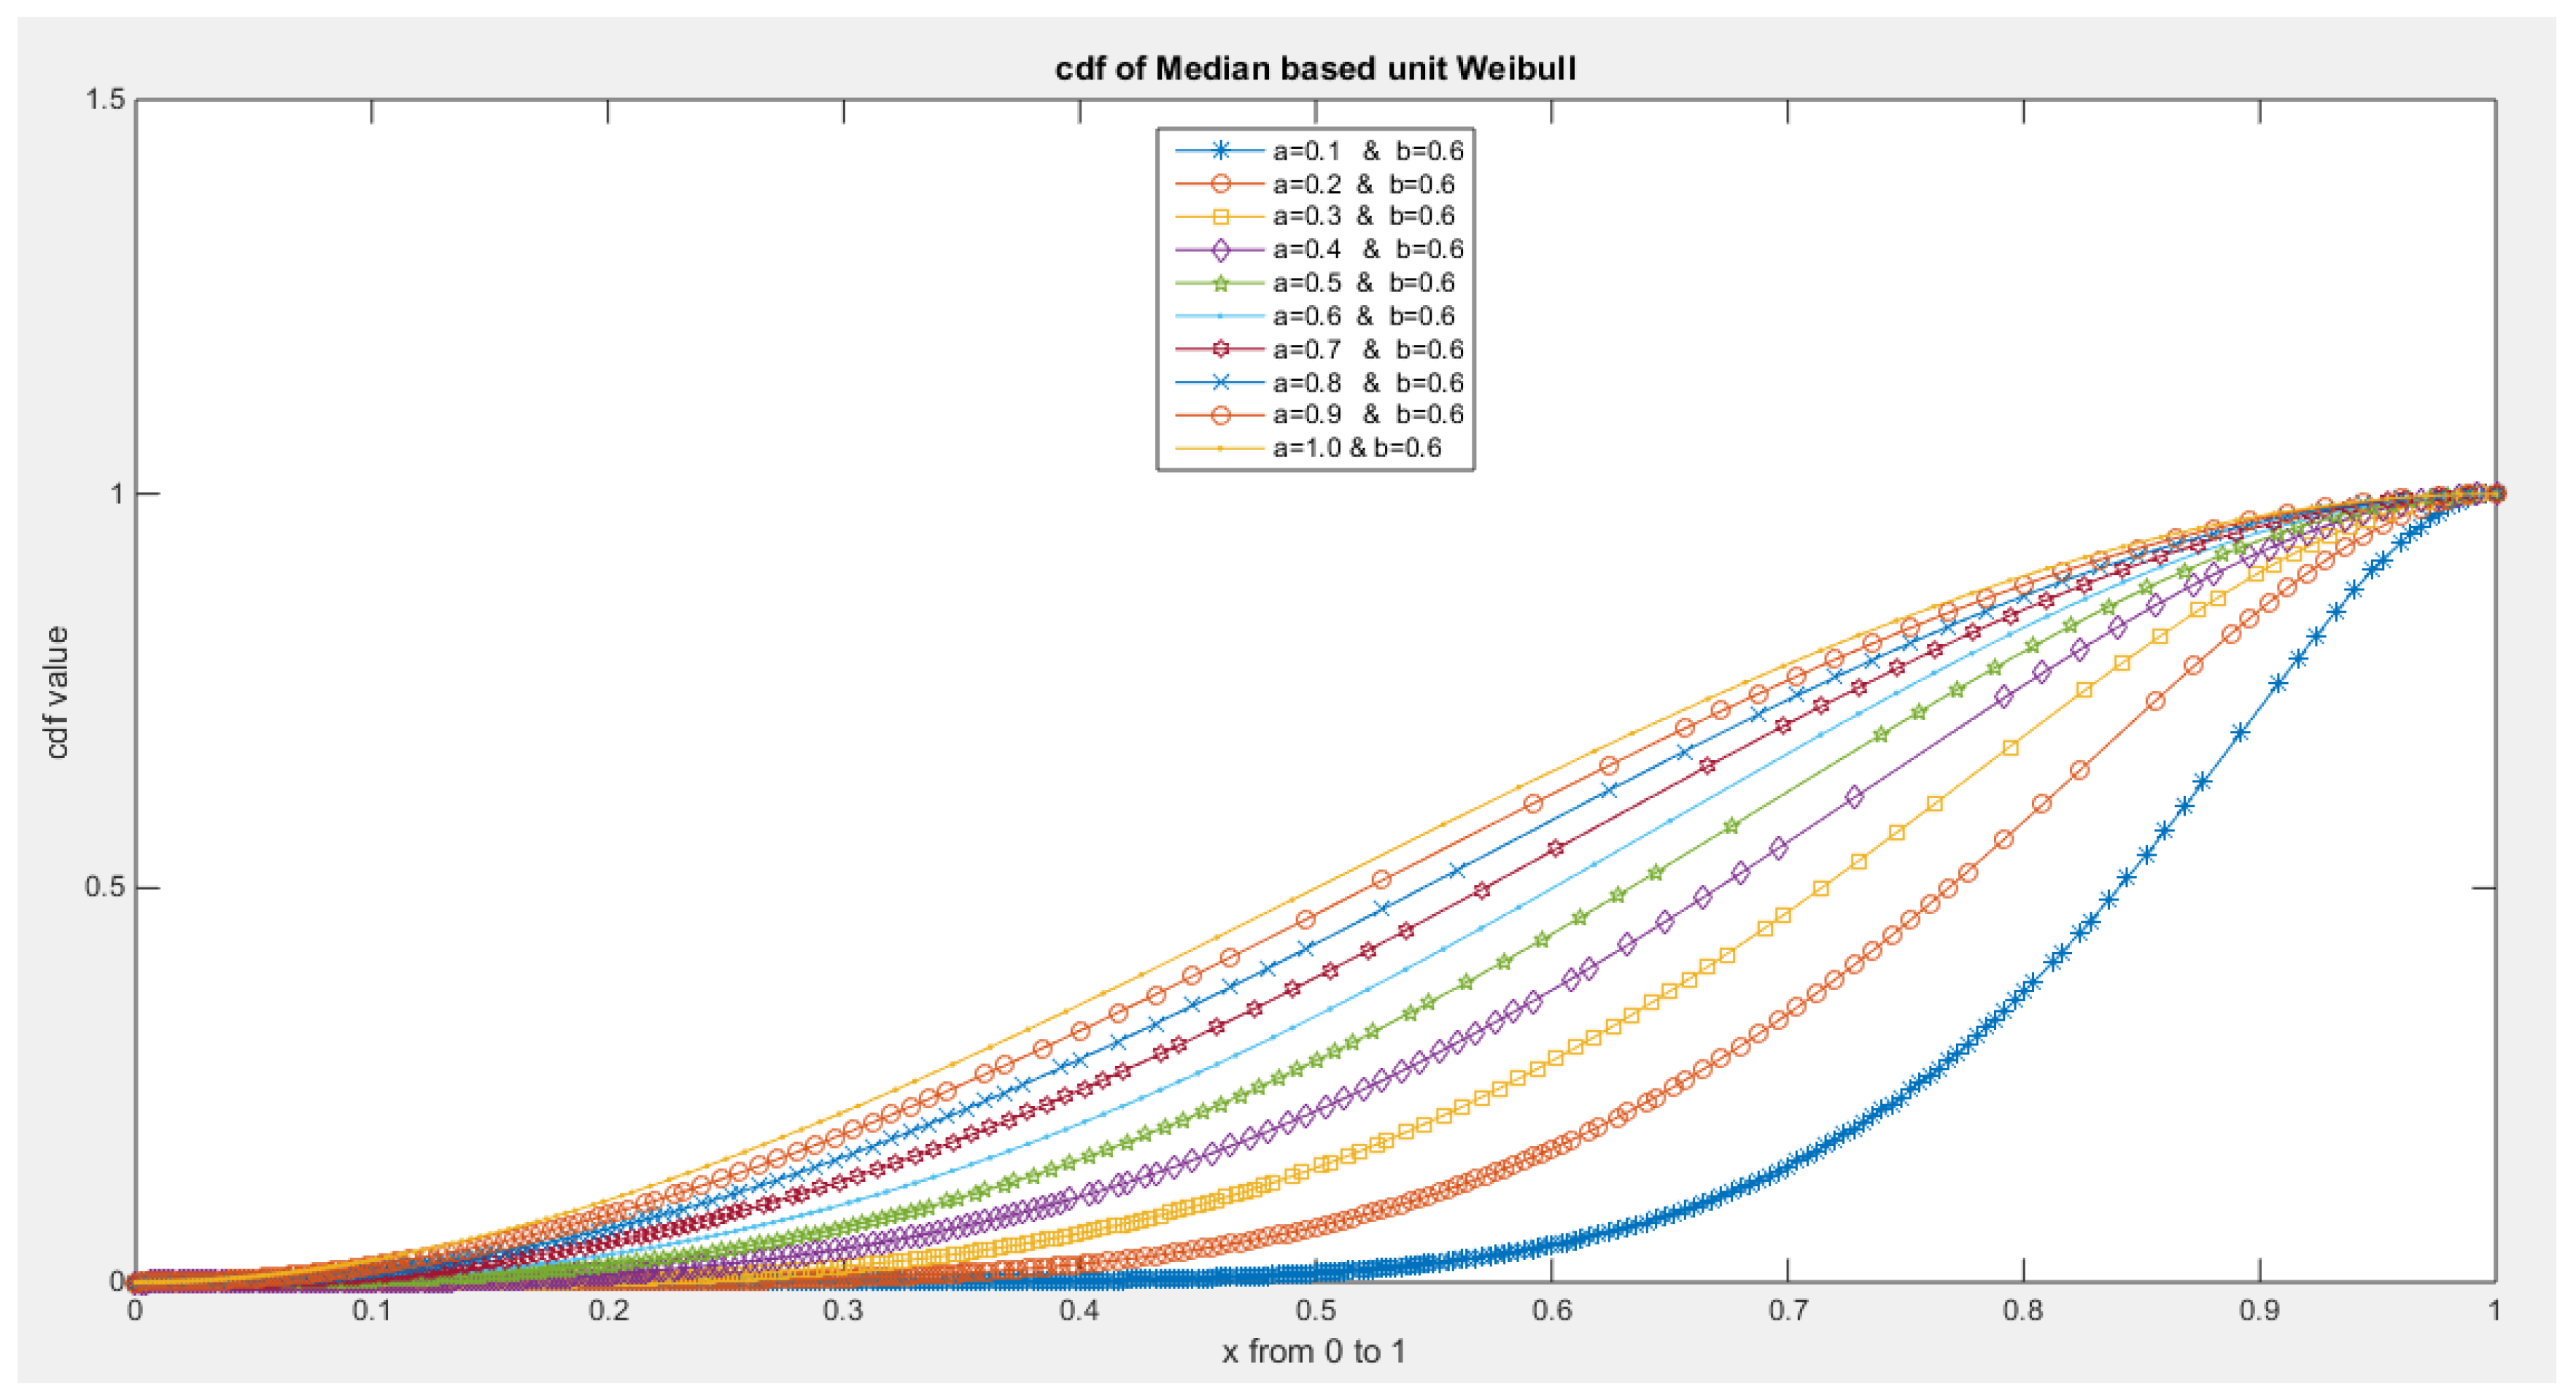
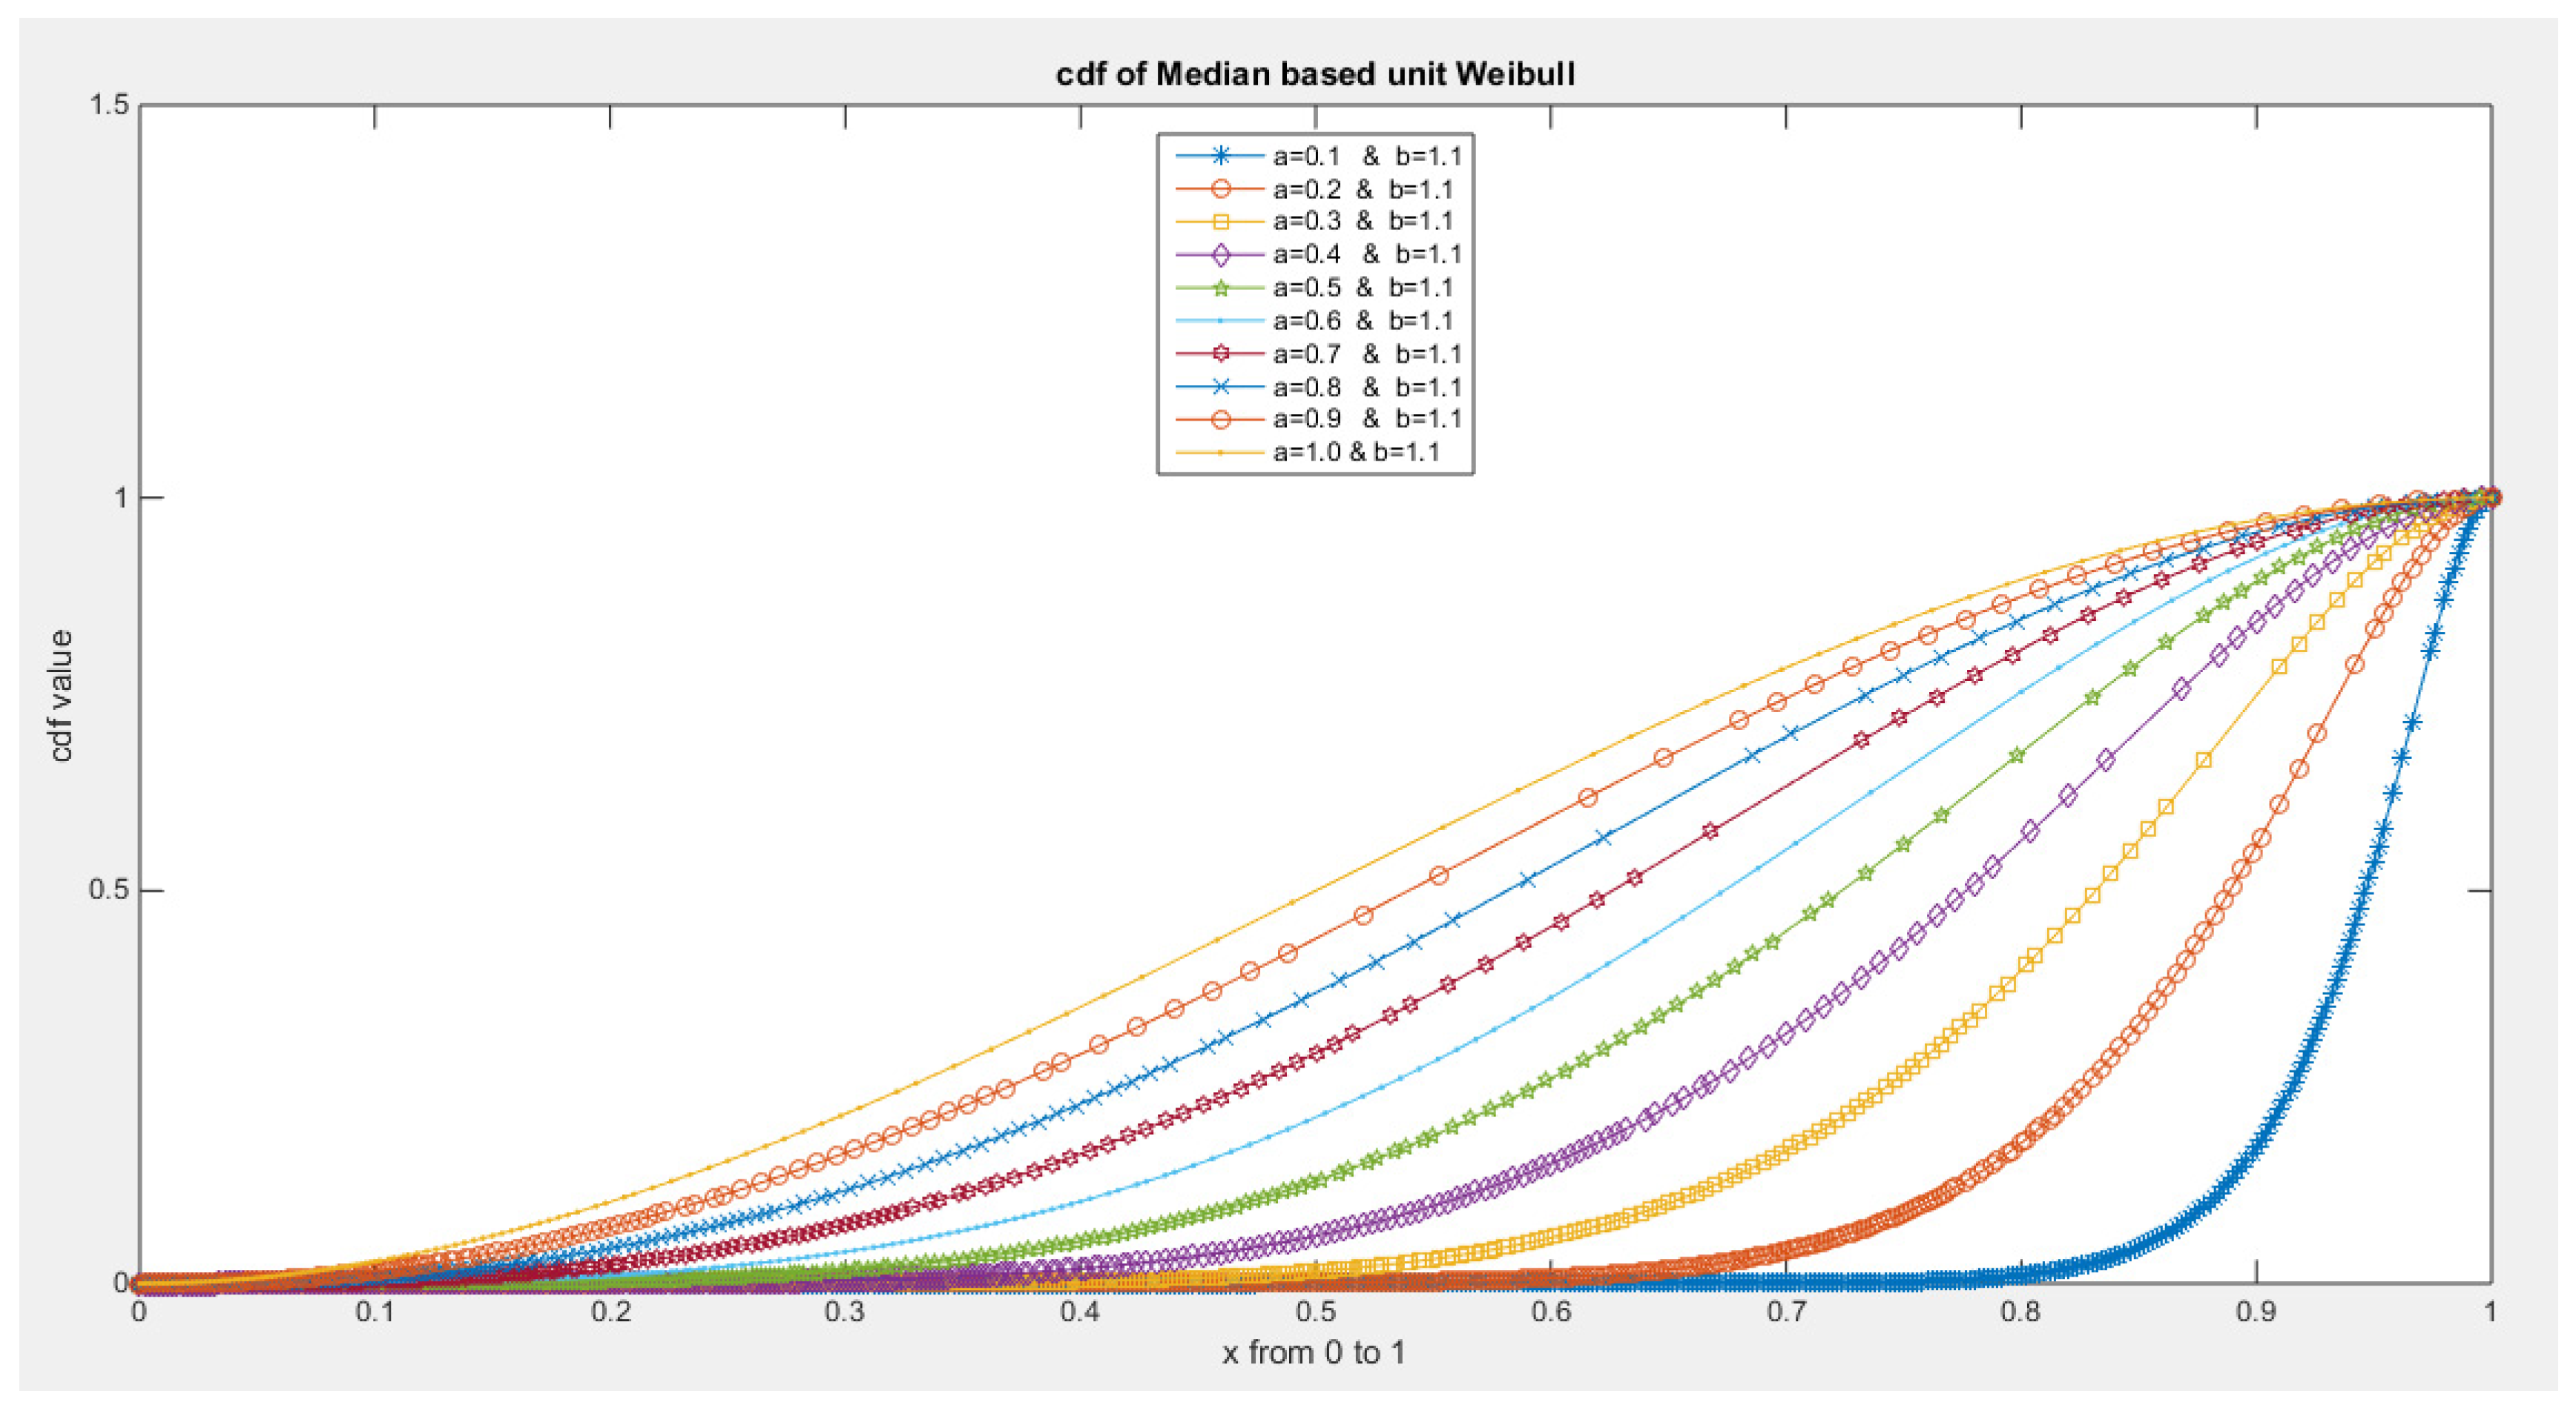
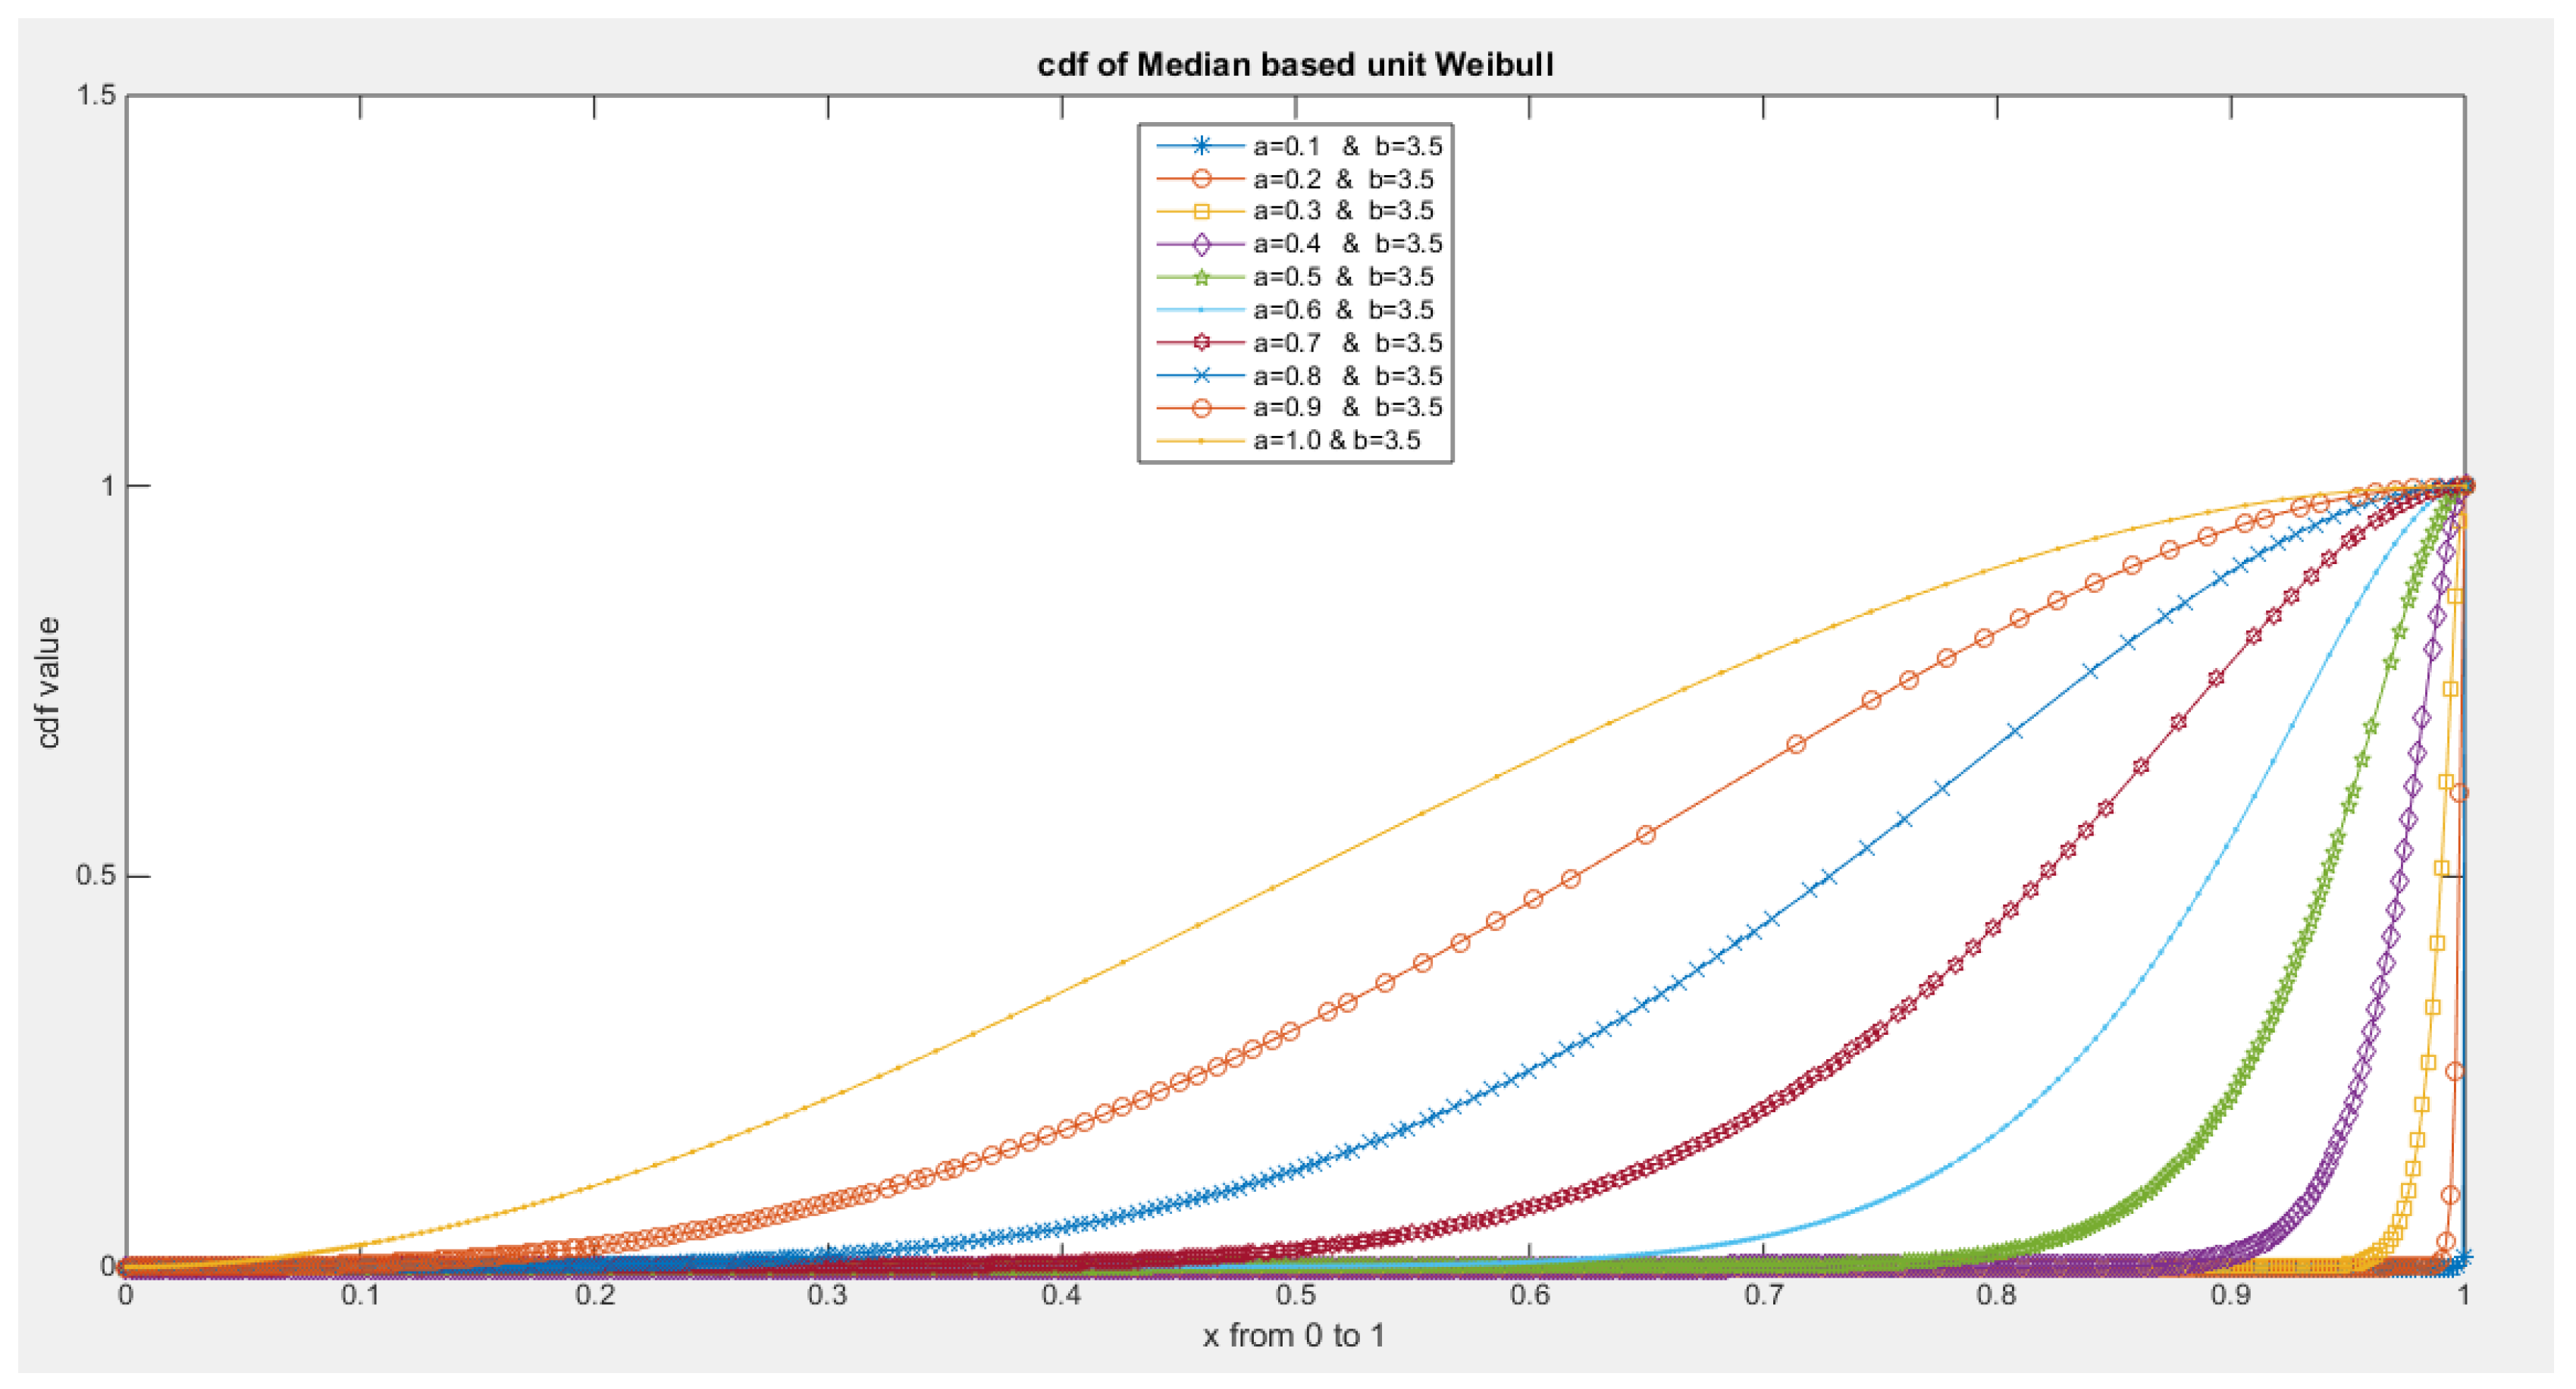
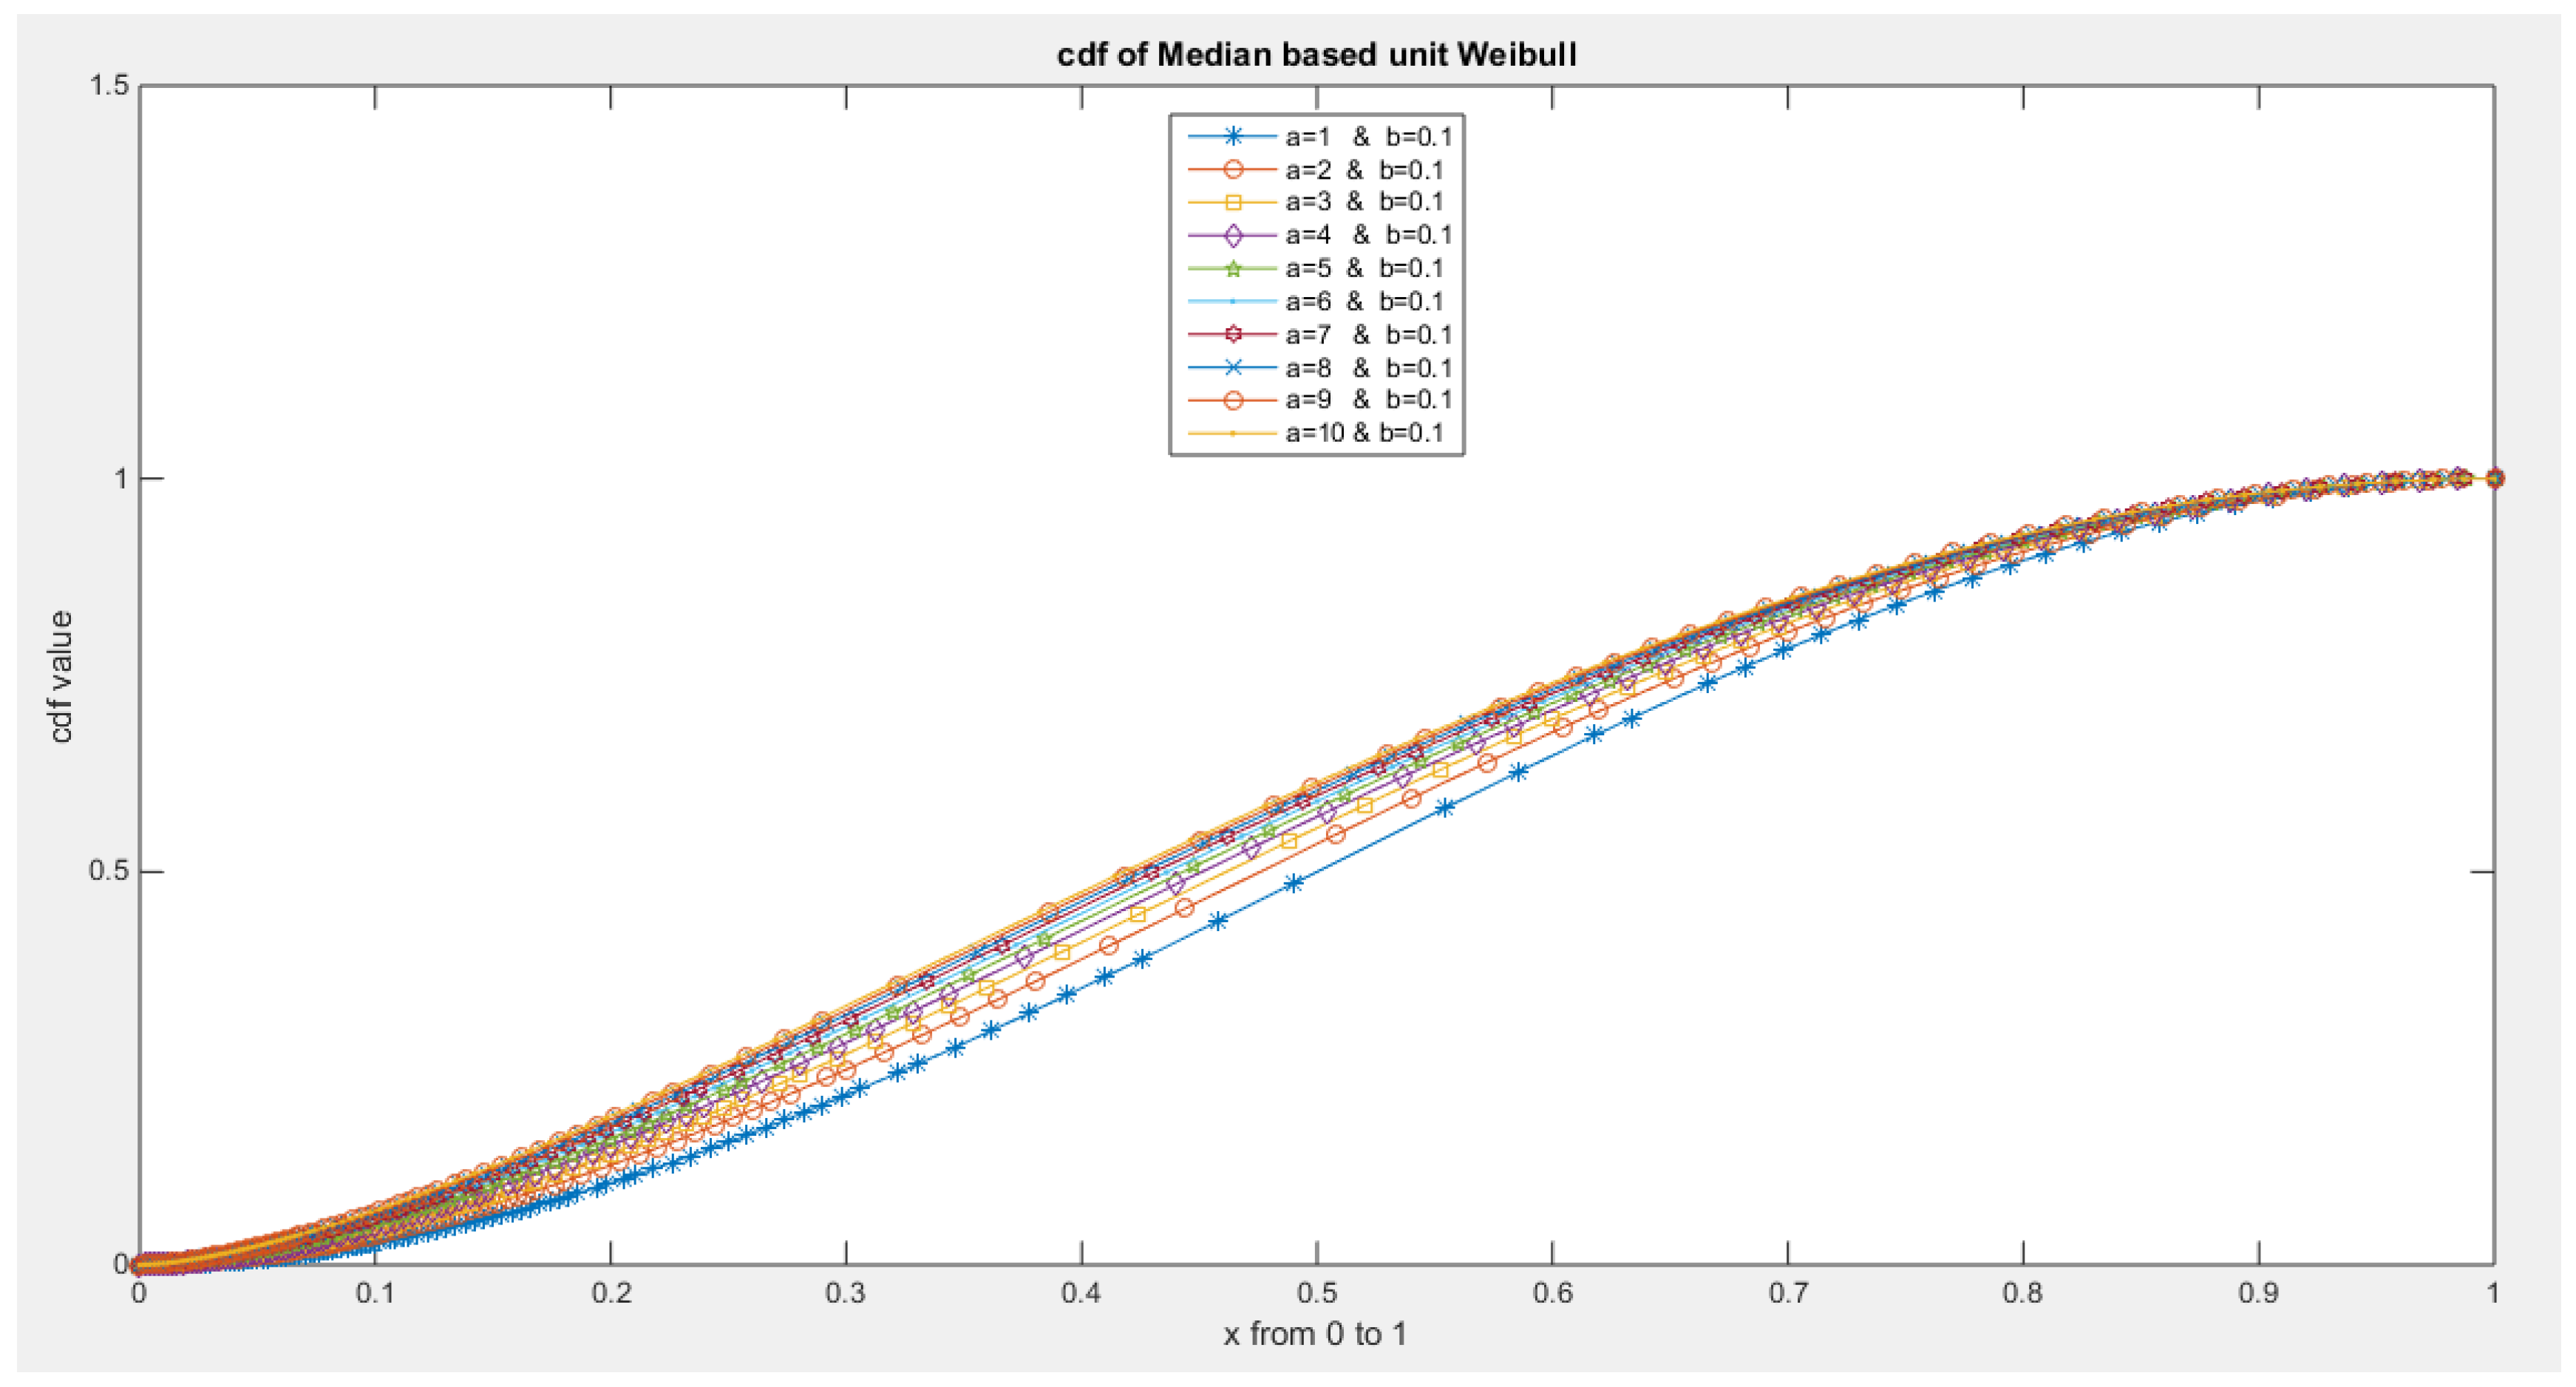
A new 2 parameter unit Weibull distribution is defined on the unit interval (0,1). The methodology of deducing its PDF, some of its properties and related functions are discussed. The paper is supplied by many figures illustrating the new distribution and how this can make it illegible to fit a wide range of skewed data. The new distribution holds a name (Attia) as a nickname.
Keywords:
Introduction
- 1)
- Johnson SB distribution (Johnson, 1949).
- 2)
- Beta distribution (Eugene et al., 2002).
- 3)
- Unit Johnson (SU ) distribution (Gündüz & Korkmaz, 2020).
- 4)
- Topp- Leone distribution (Topp & Leone, 1955).
- 5)
- Unit Gamma (Consul & Jain, 1971; Grassia, 1977; Mazucheli et al., 2018b; Tadikamalla, 1981).
- 6)
- Unit Logistic distribution (Tadikamalla & Johnson, 1982).
- 7)
- Kumaraswamy distribution (Kumaraswamy, 1980).
- 8)
- Unit Burr-III (Modi & Gill, 2020).
- 9)
- Unit modified Burr-III (Haq et al., 2023).
- 10)
- Unit Burr-XII (Korkmaz & Chesneau, 2021).
- 11)
- Unit-Gompertz (Mazucheli, Maringa, et al., 2019).
- 12)
- Unit-Lindely (Mazucheli, Menezes, et al., 2019).
- 13)
- Unit-Weibull (Mazucheli et al., 2020).
- 14)
- Unit Muth distribution (Maya et al., 2024).
Section 1
Methodology
Derivation of the MBUW Distribution
Section 2
Some of the Properties of the New Distribution ( MBUW)
- 1-
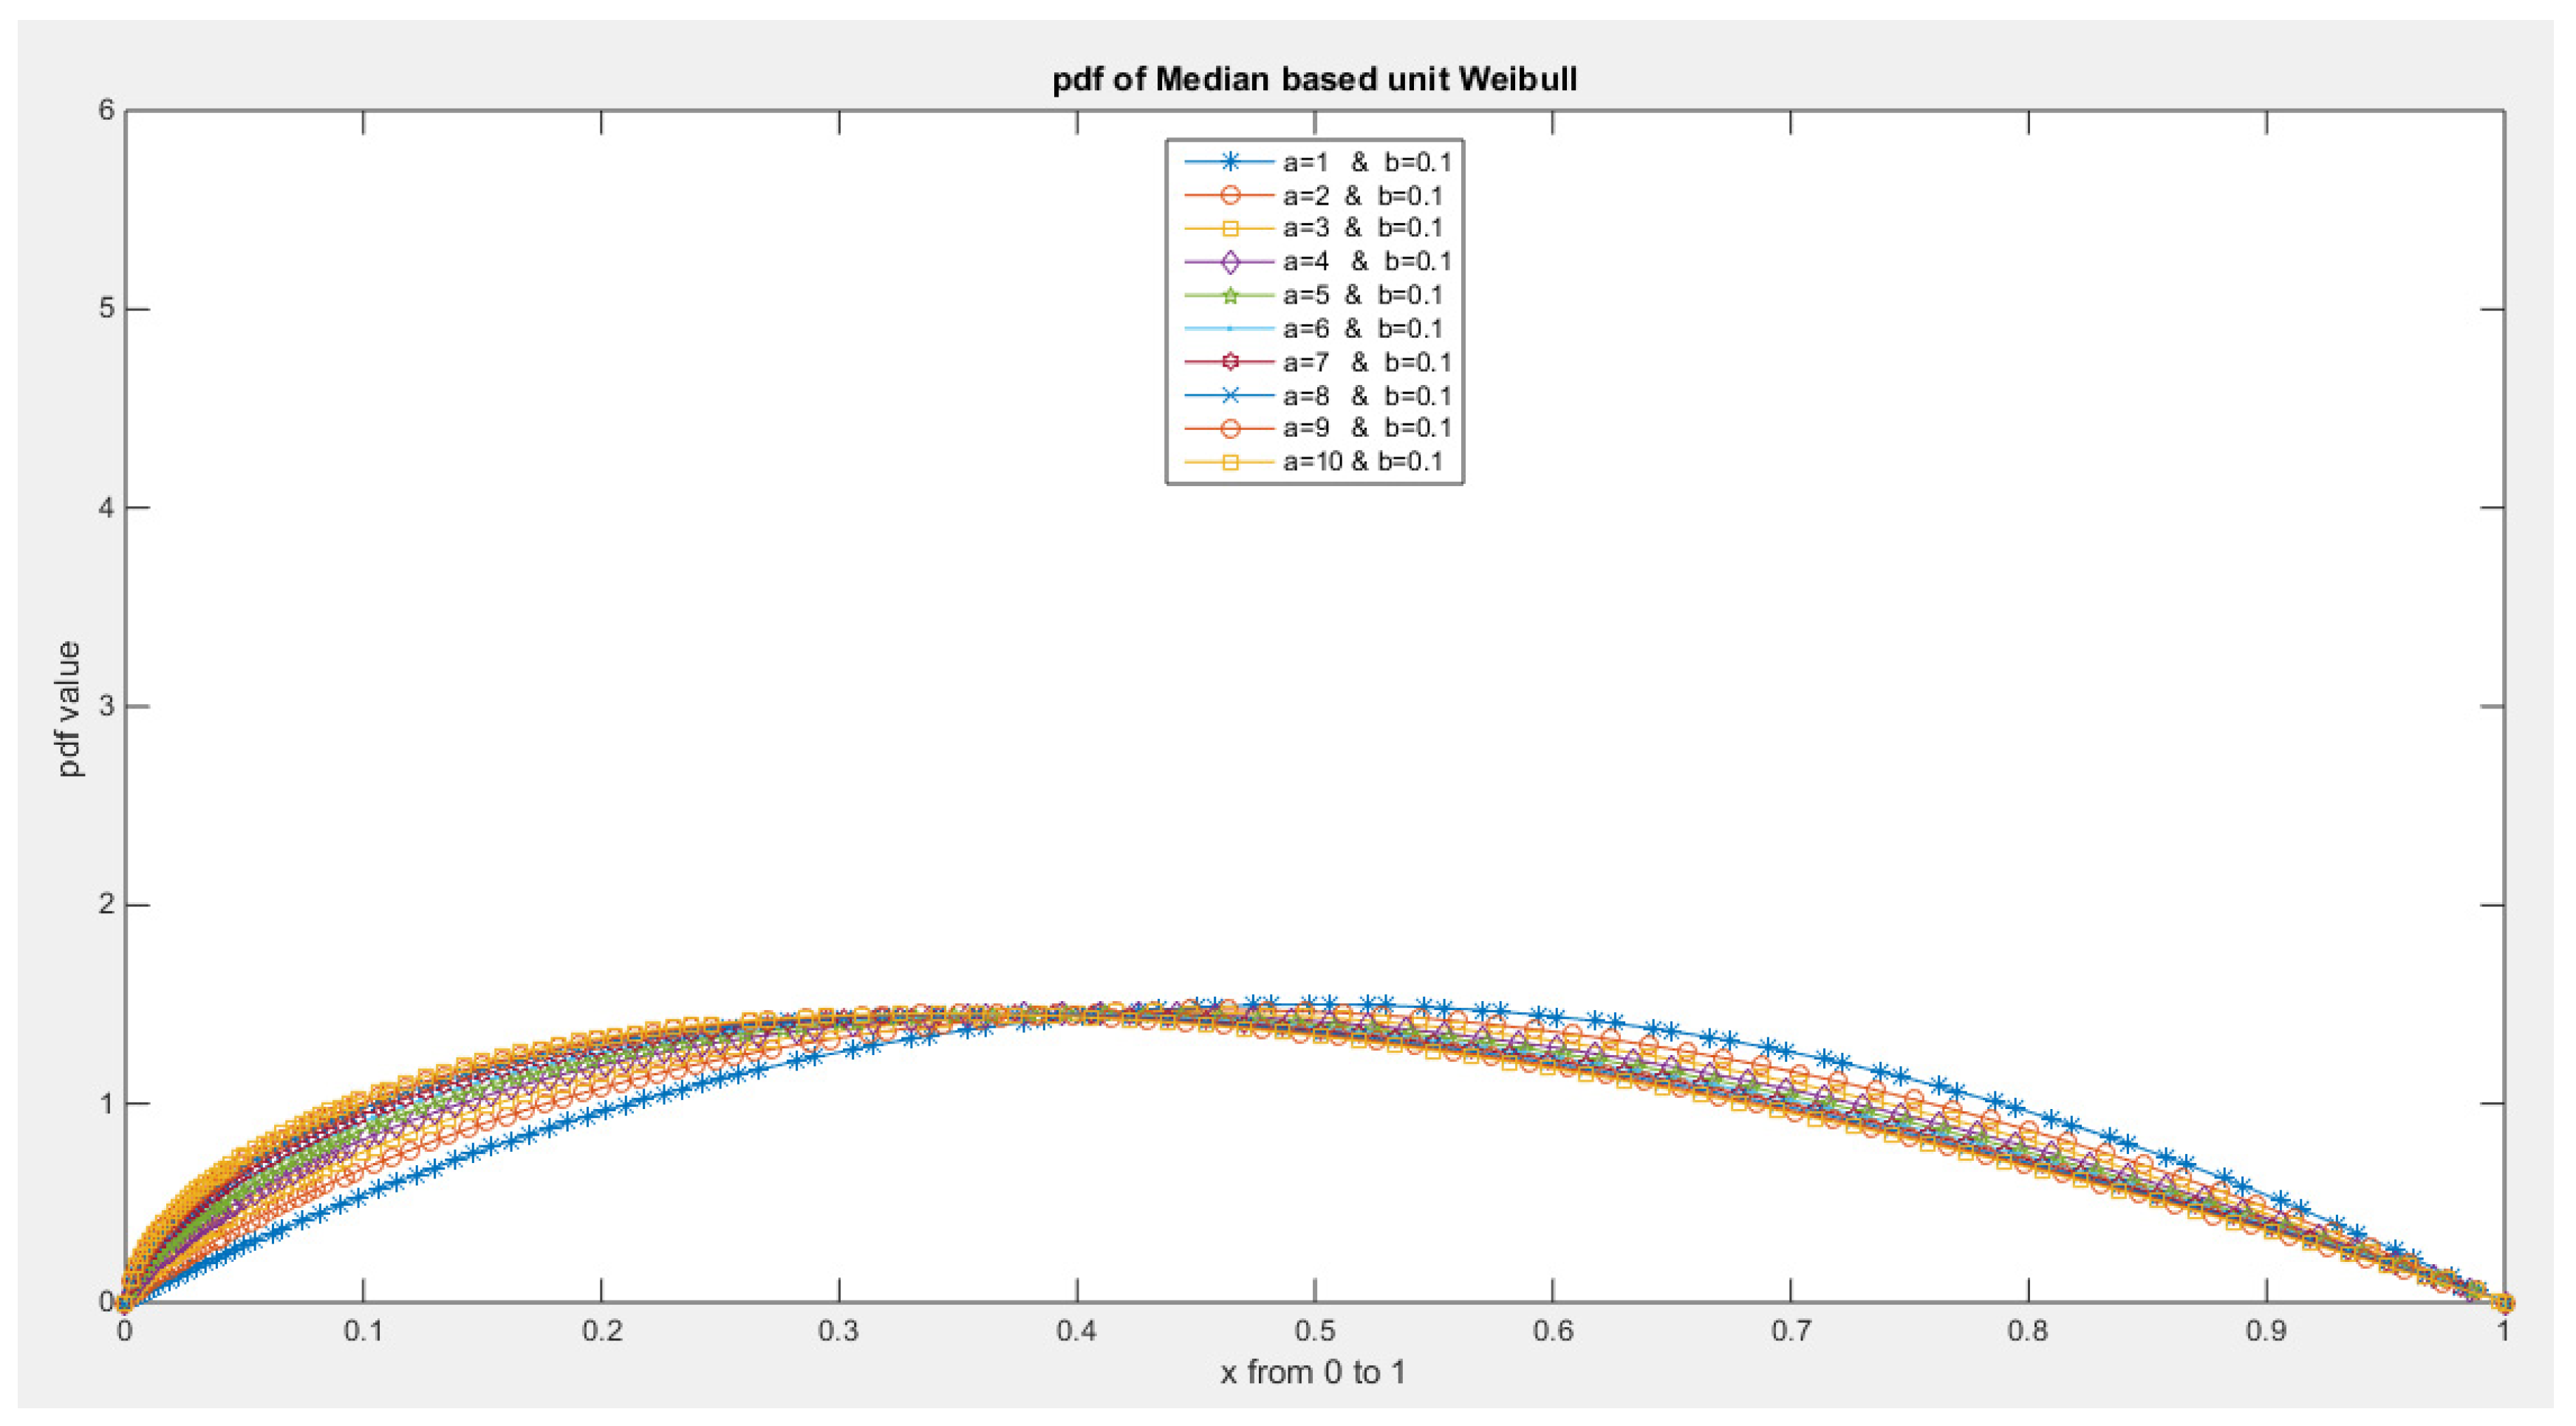
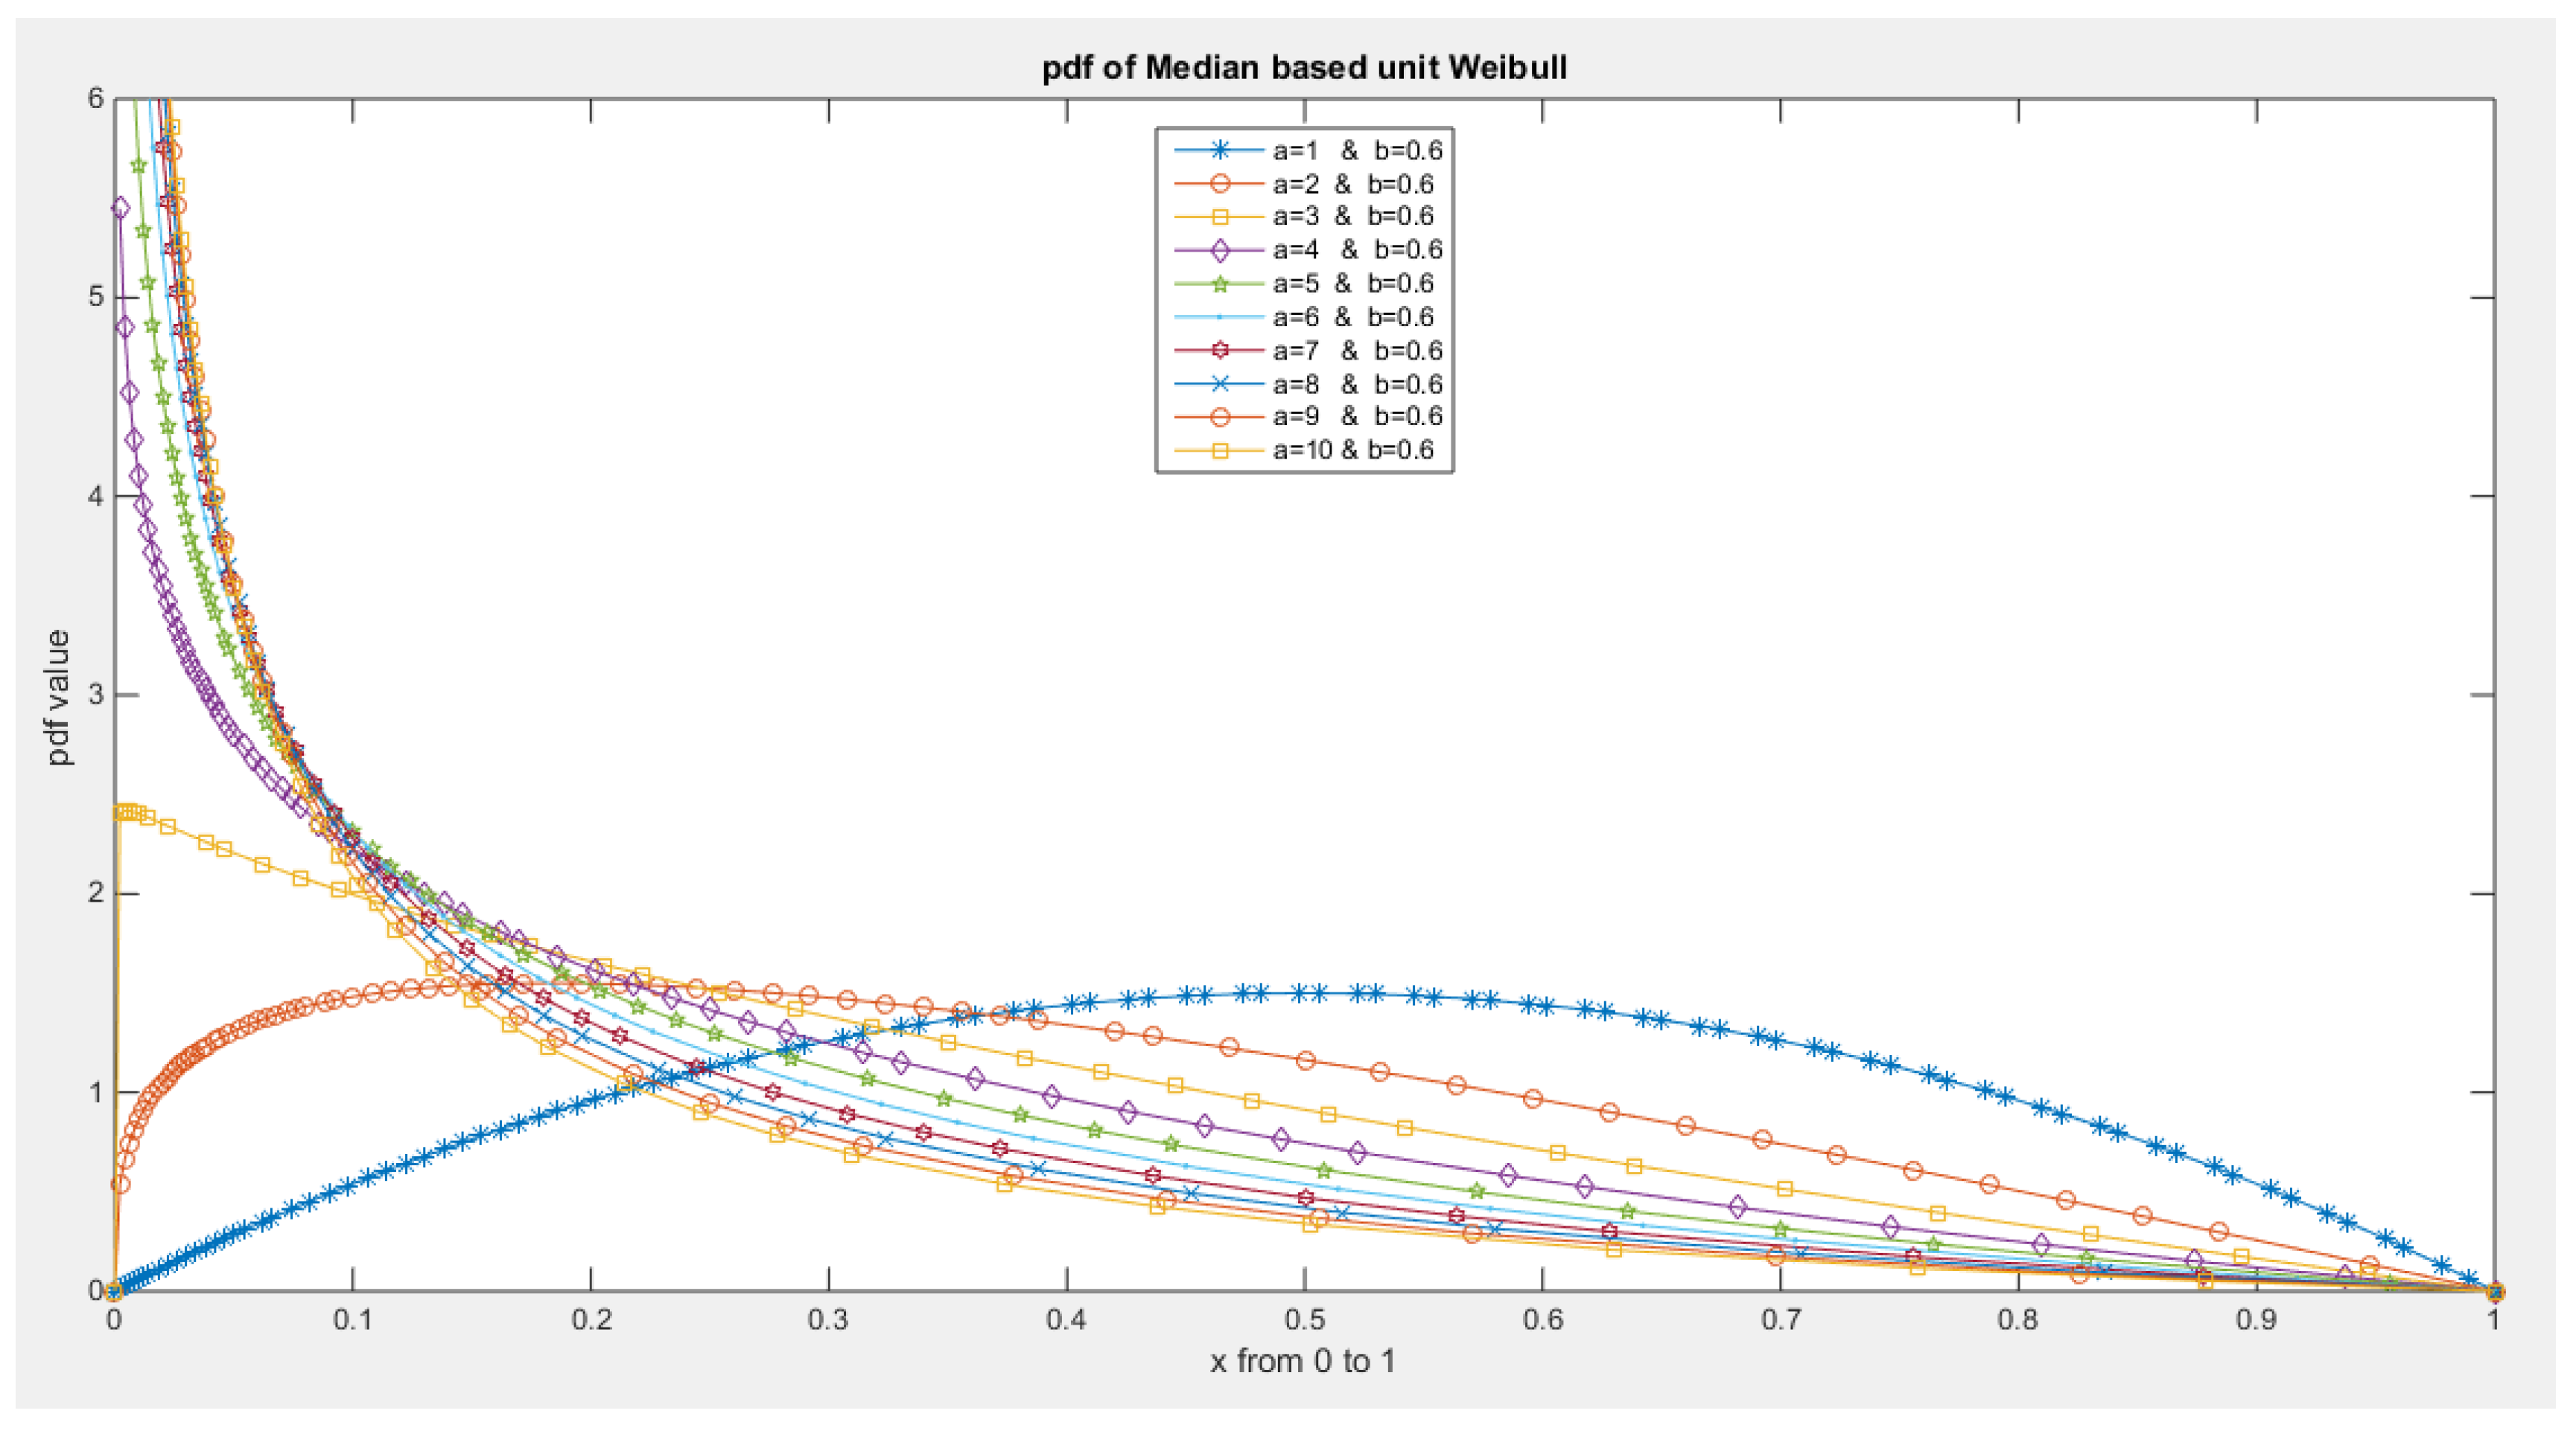
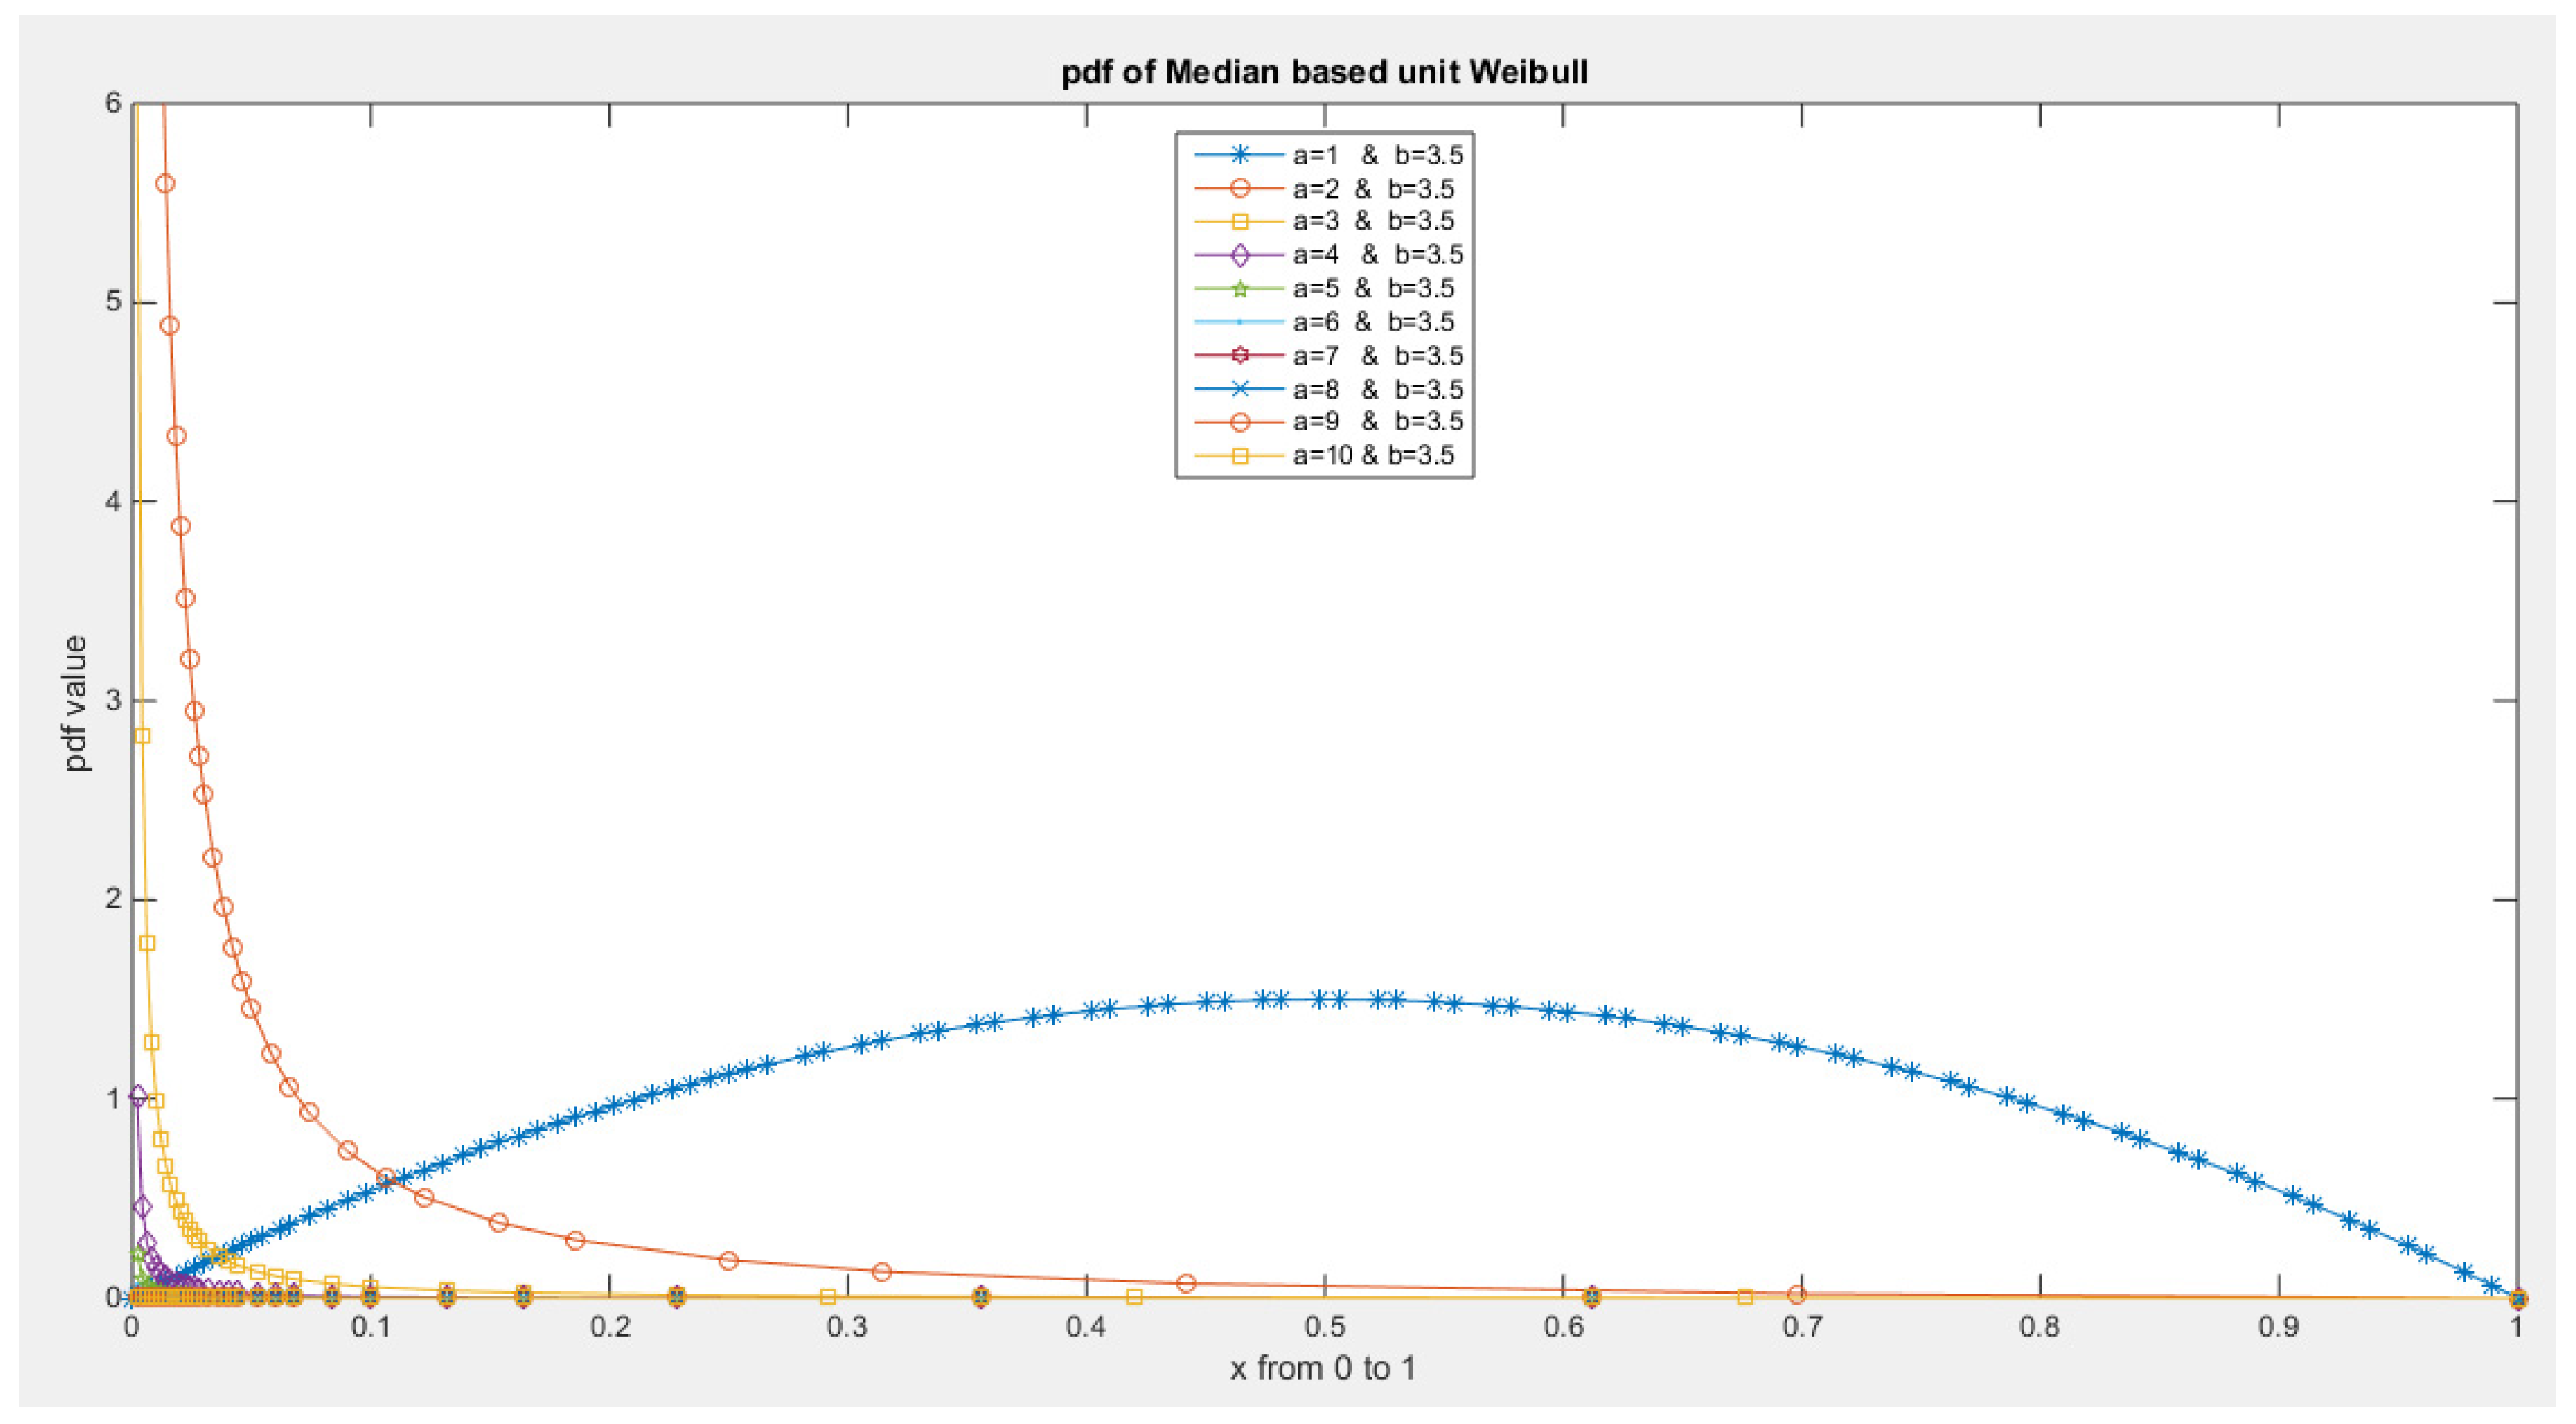
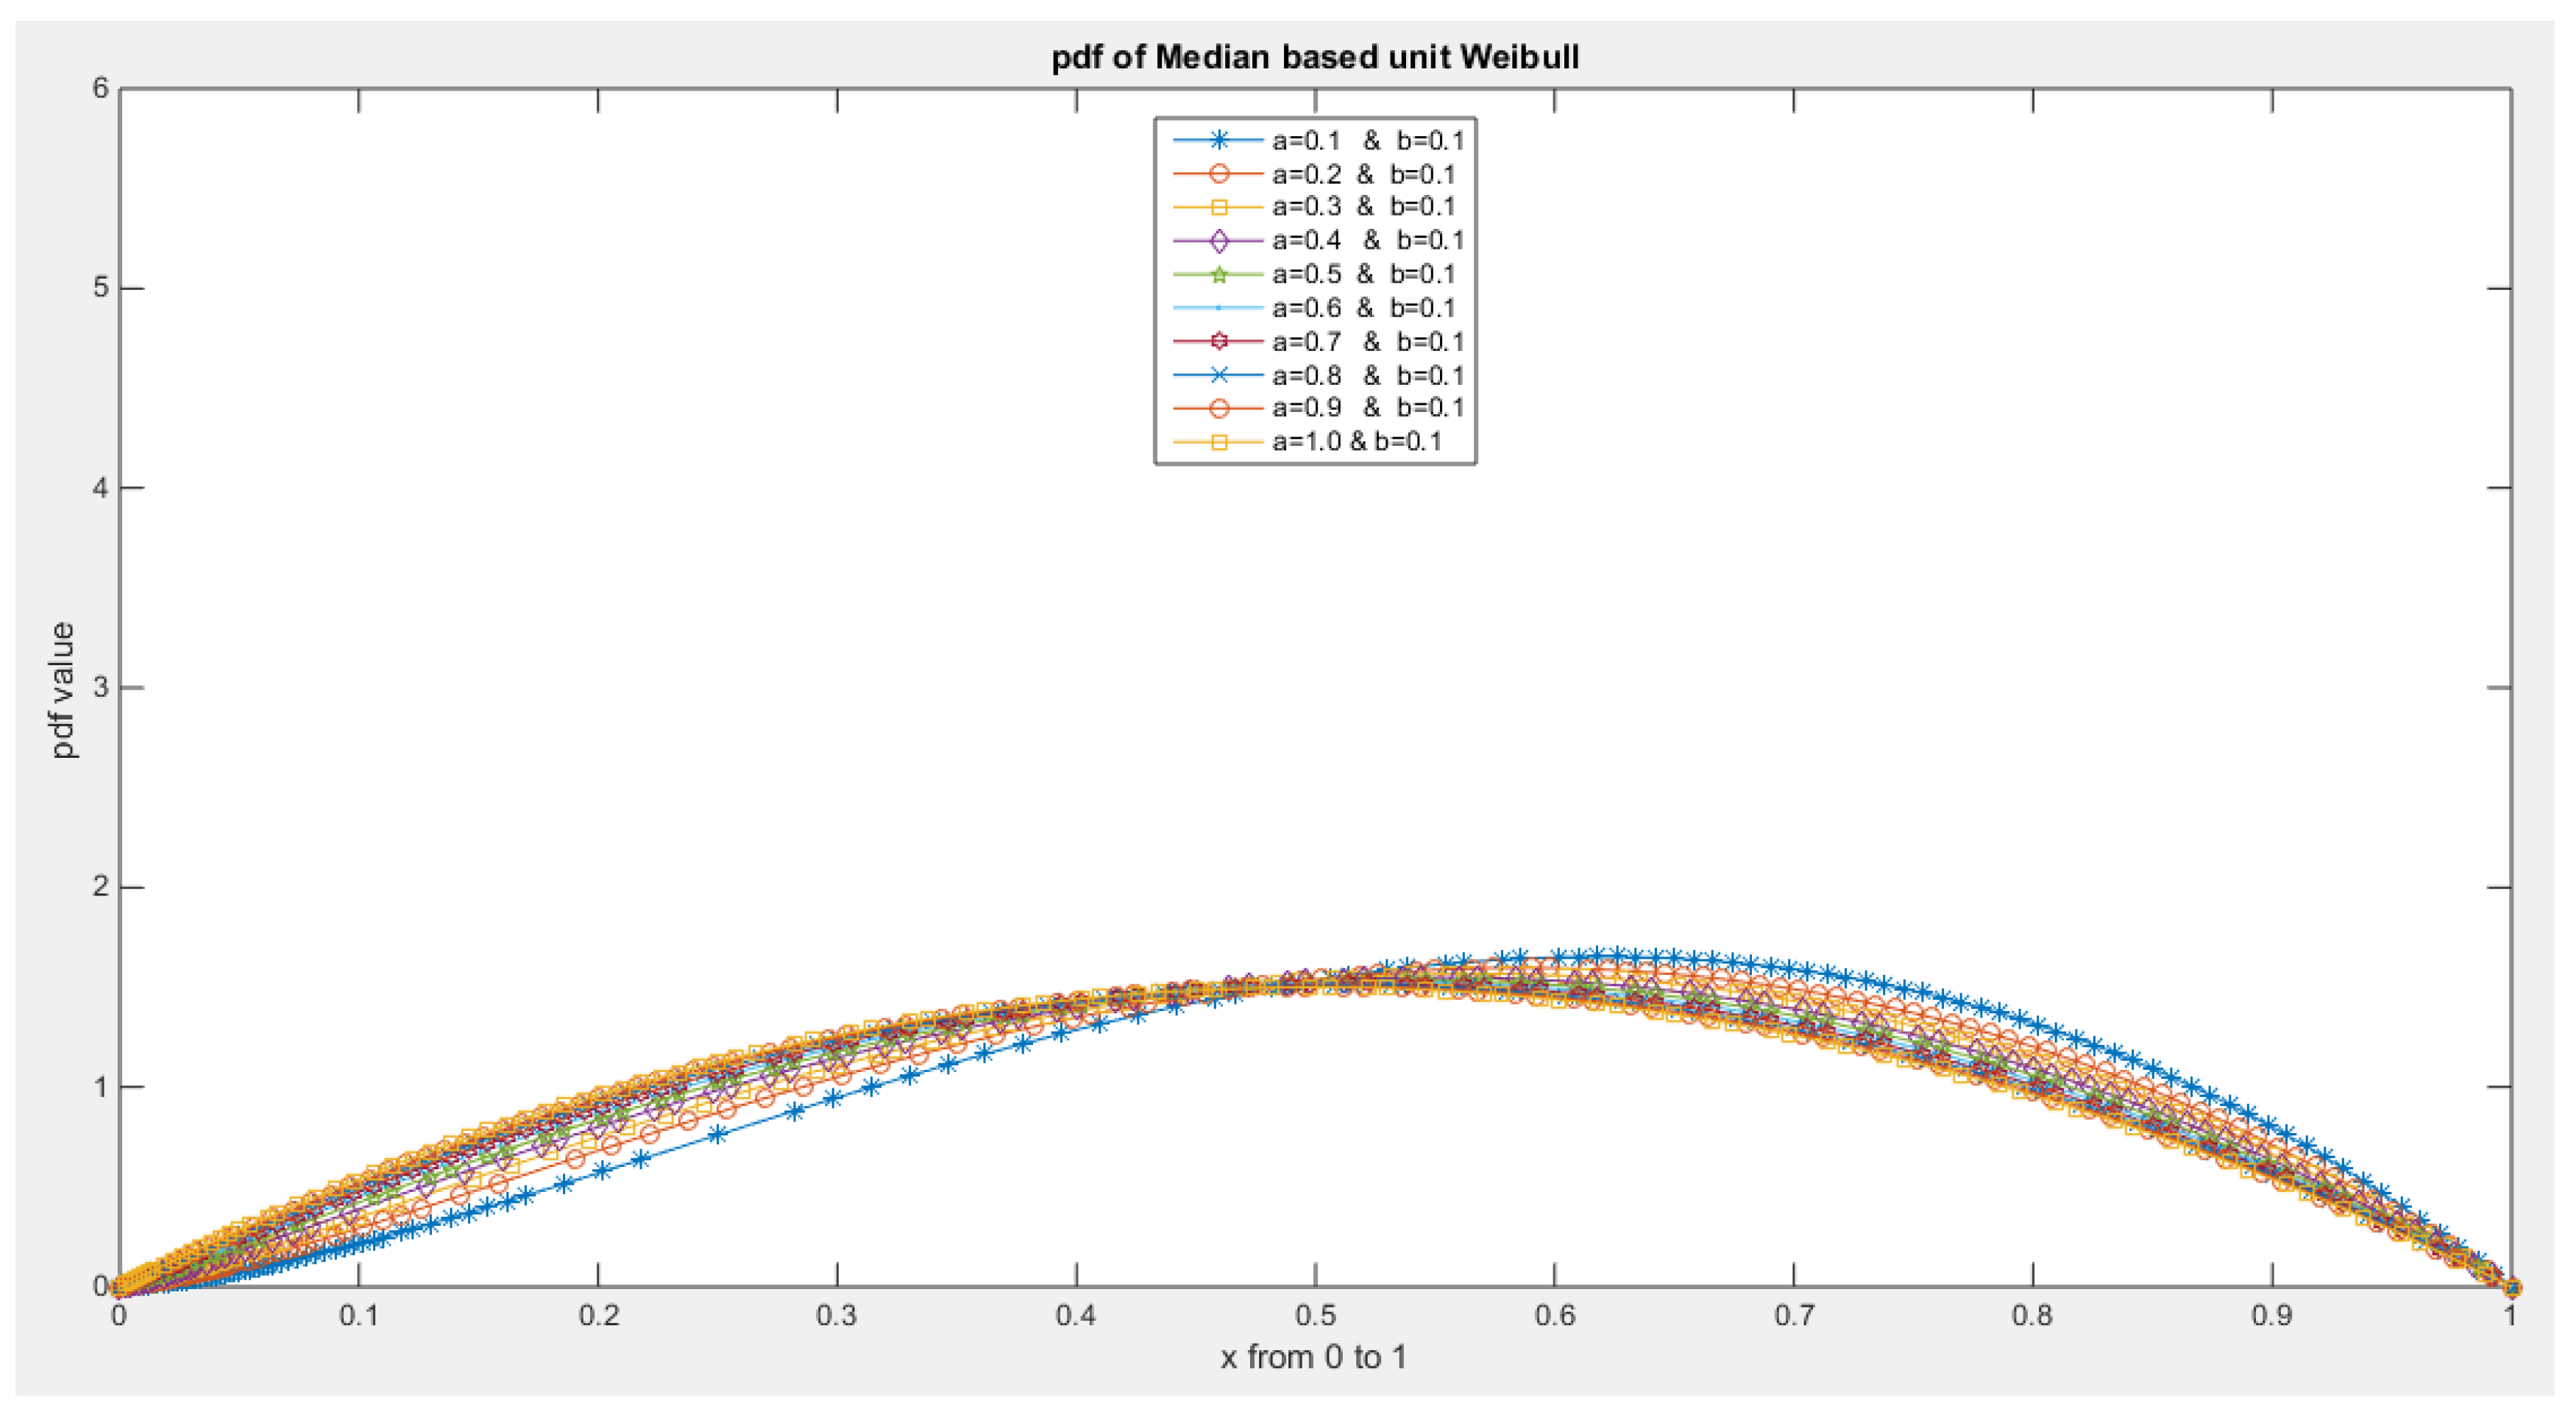
- The following is the pdf :
- 2-
- The following is the CDF:
- 3-
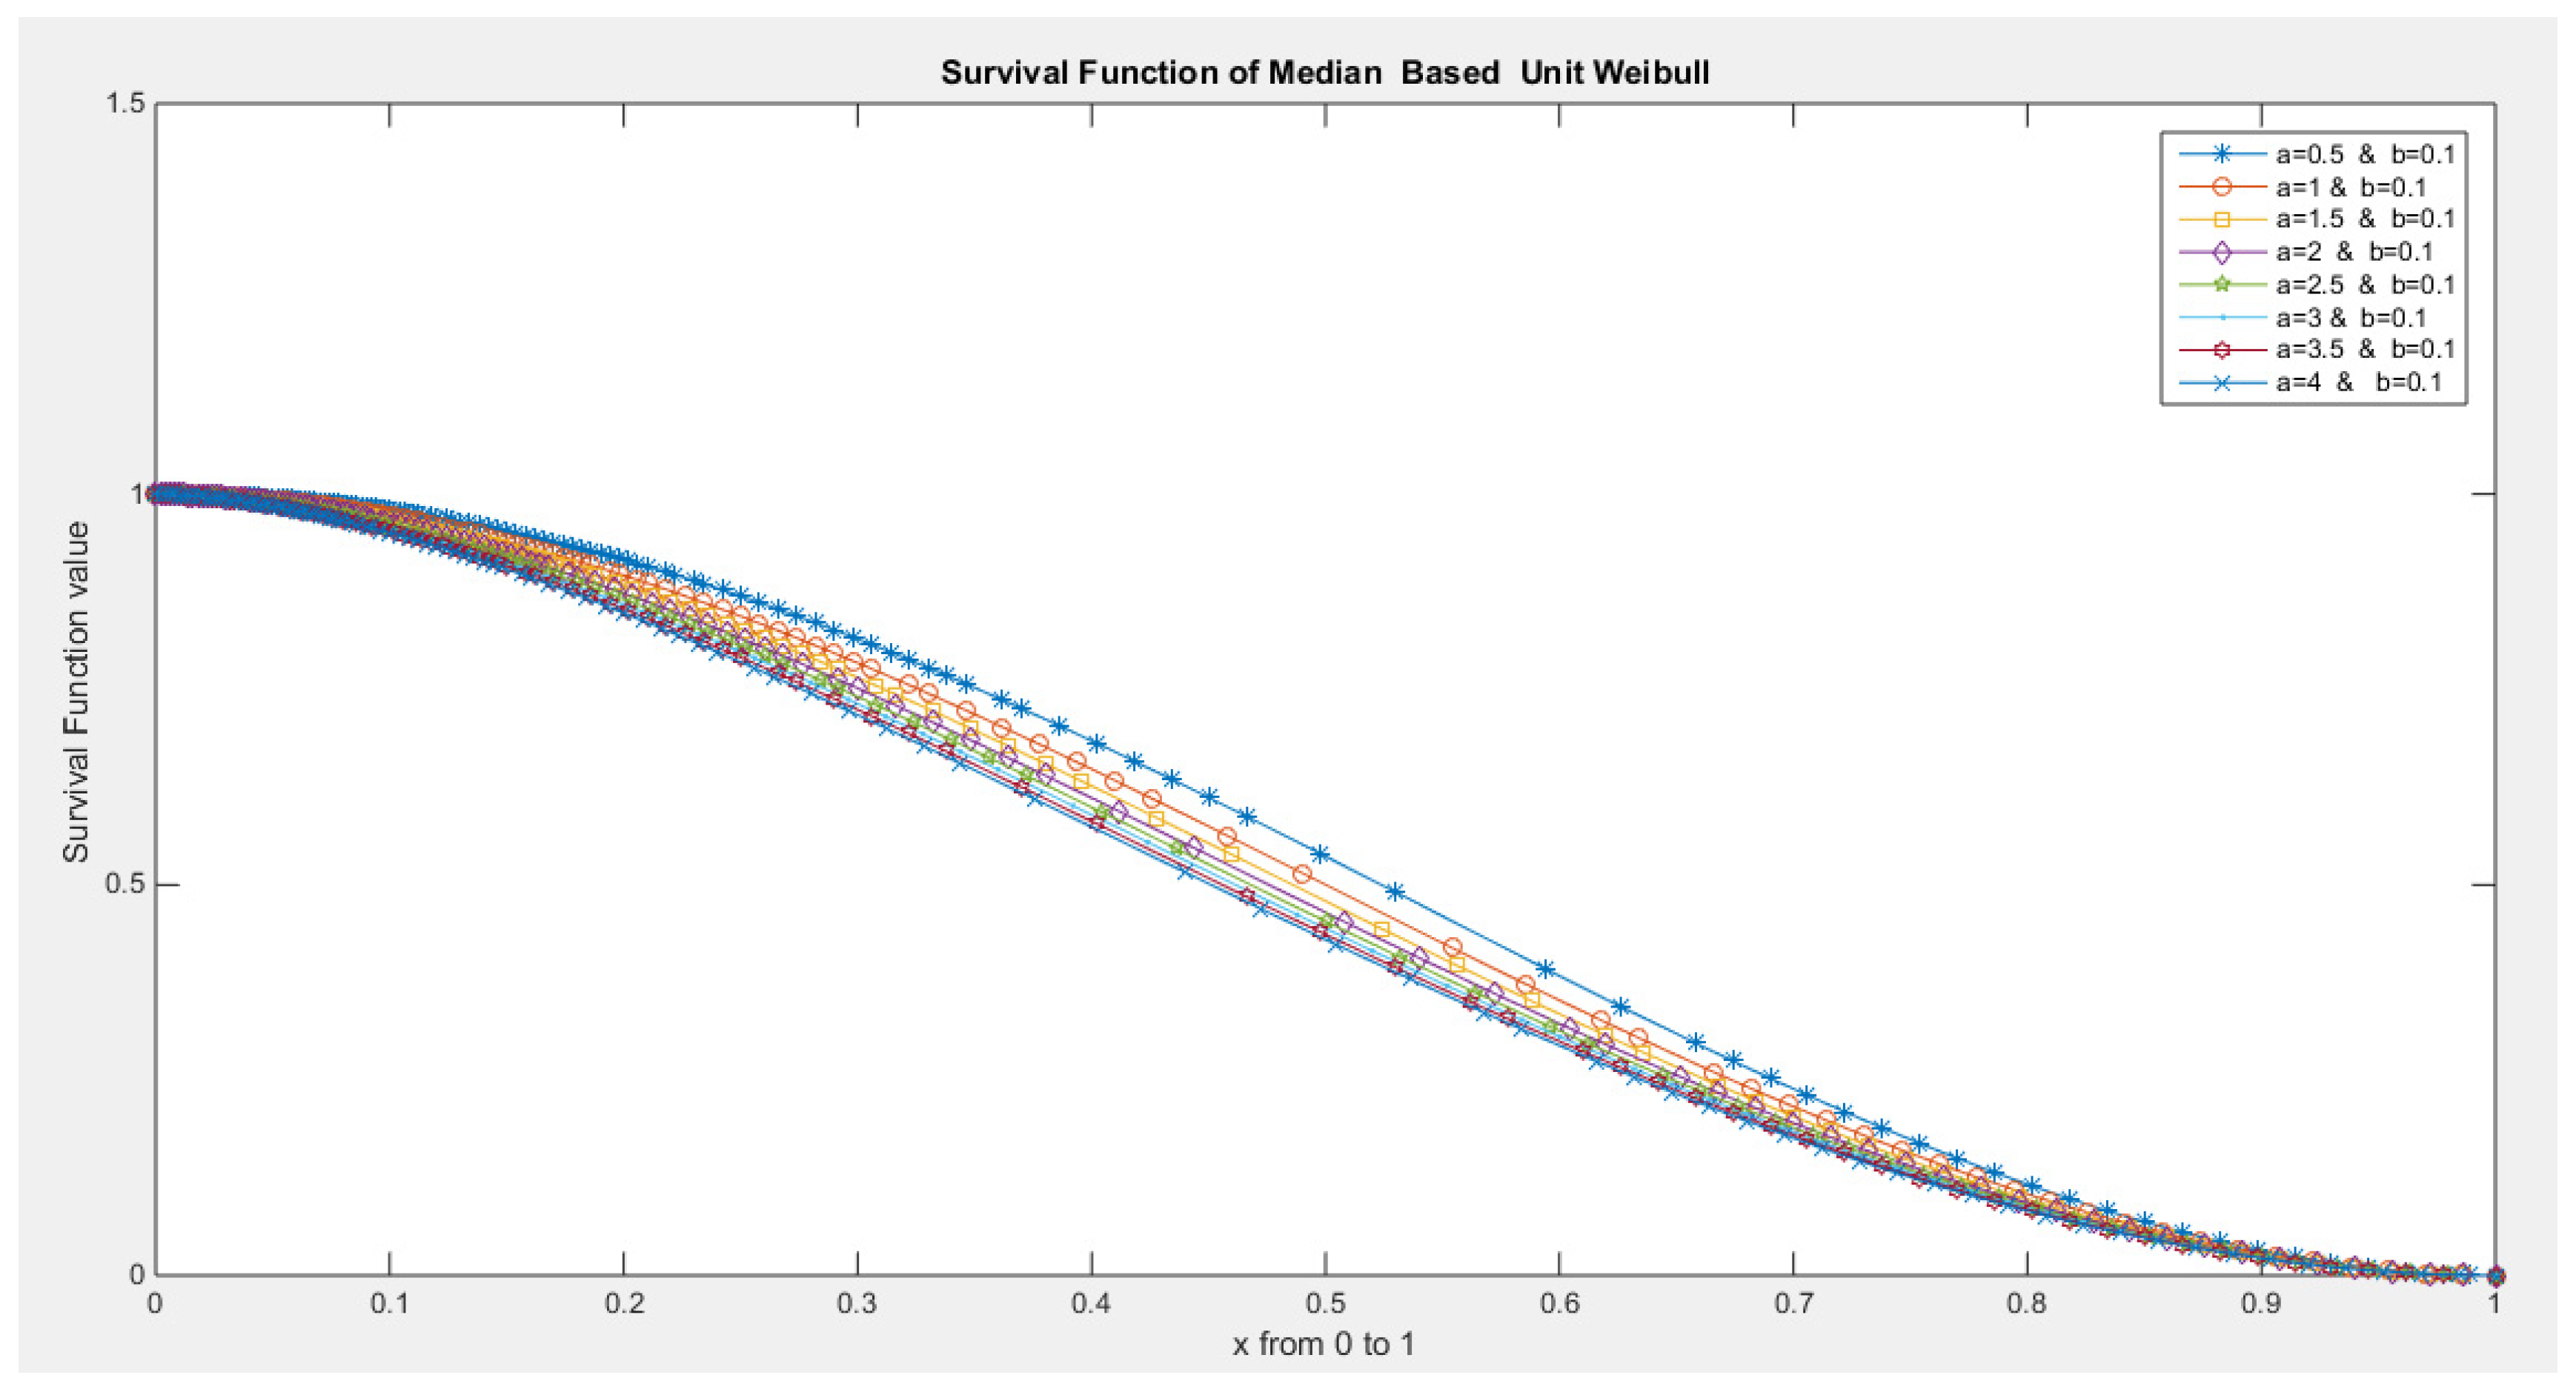
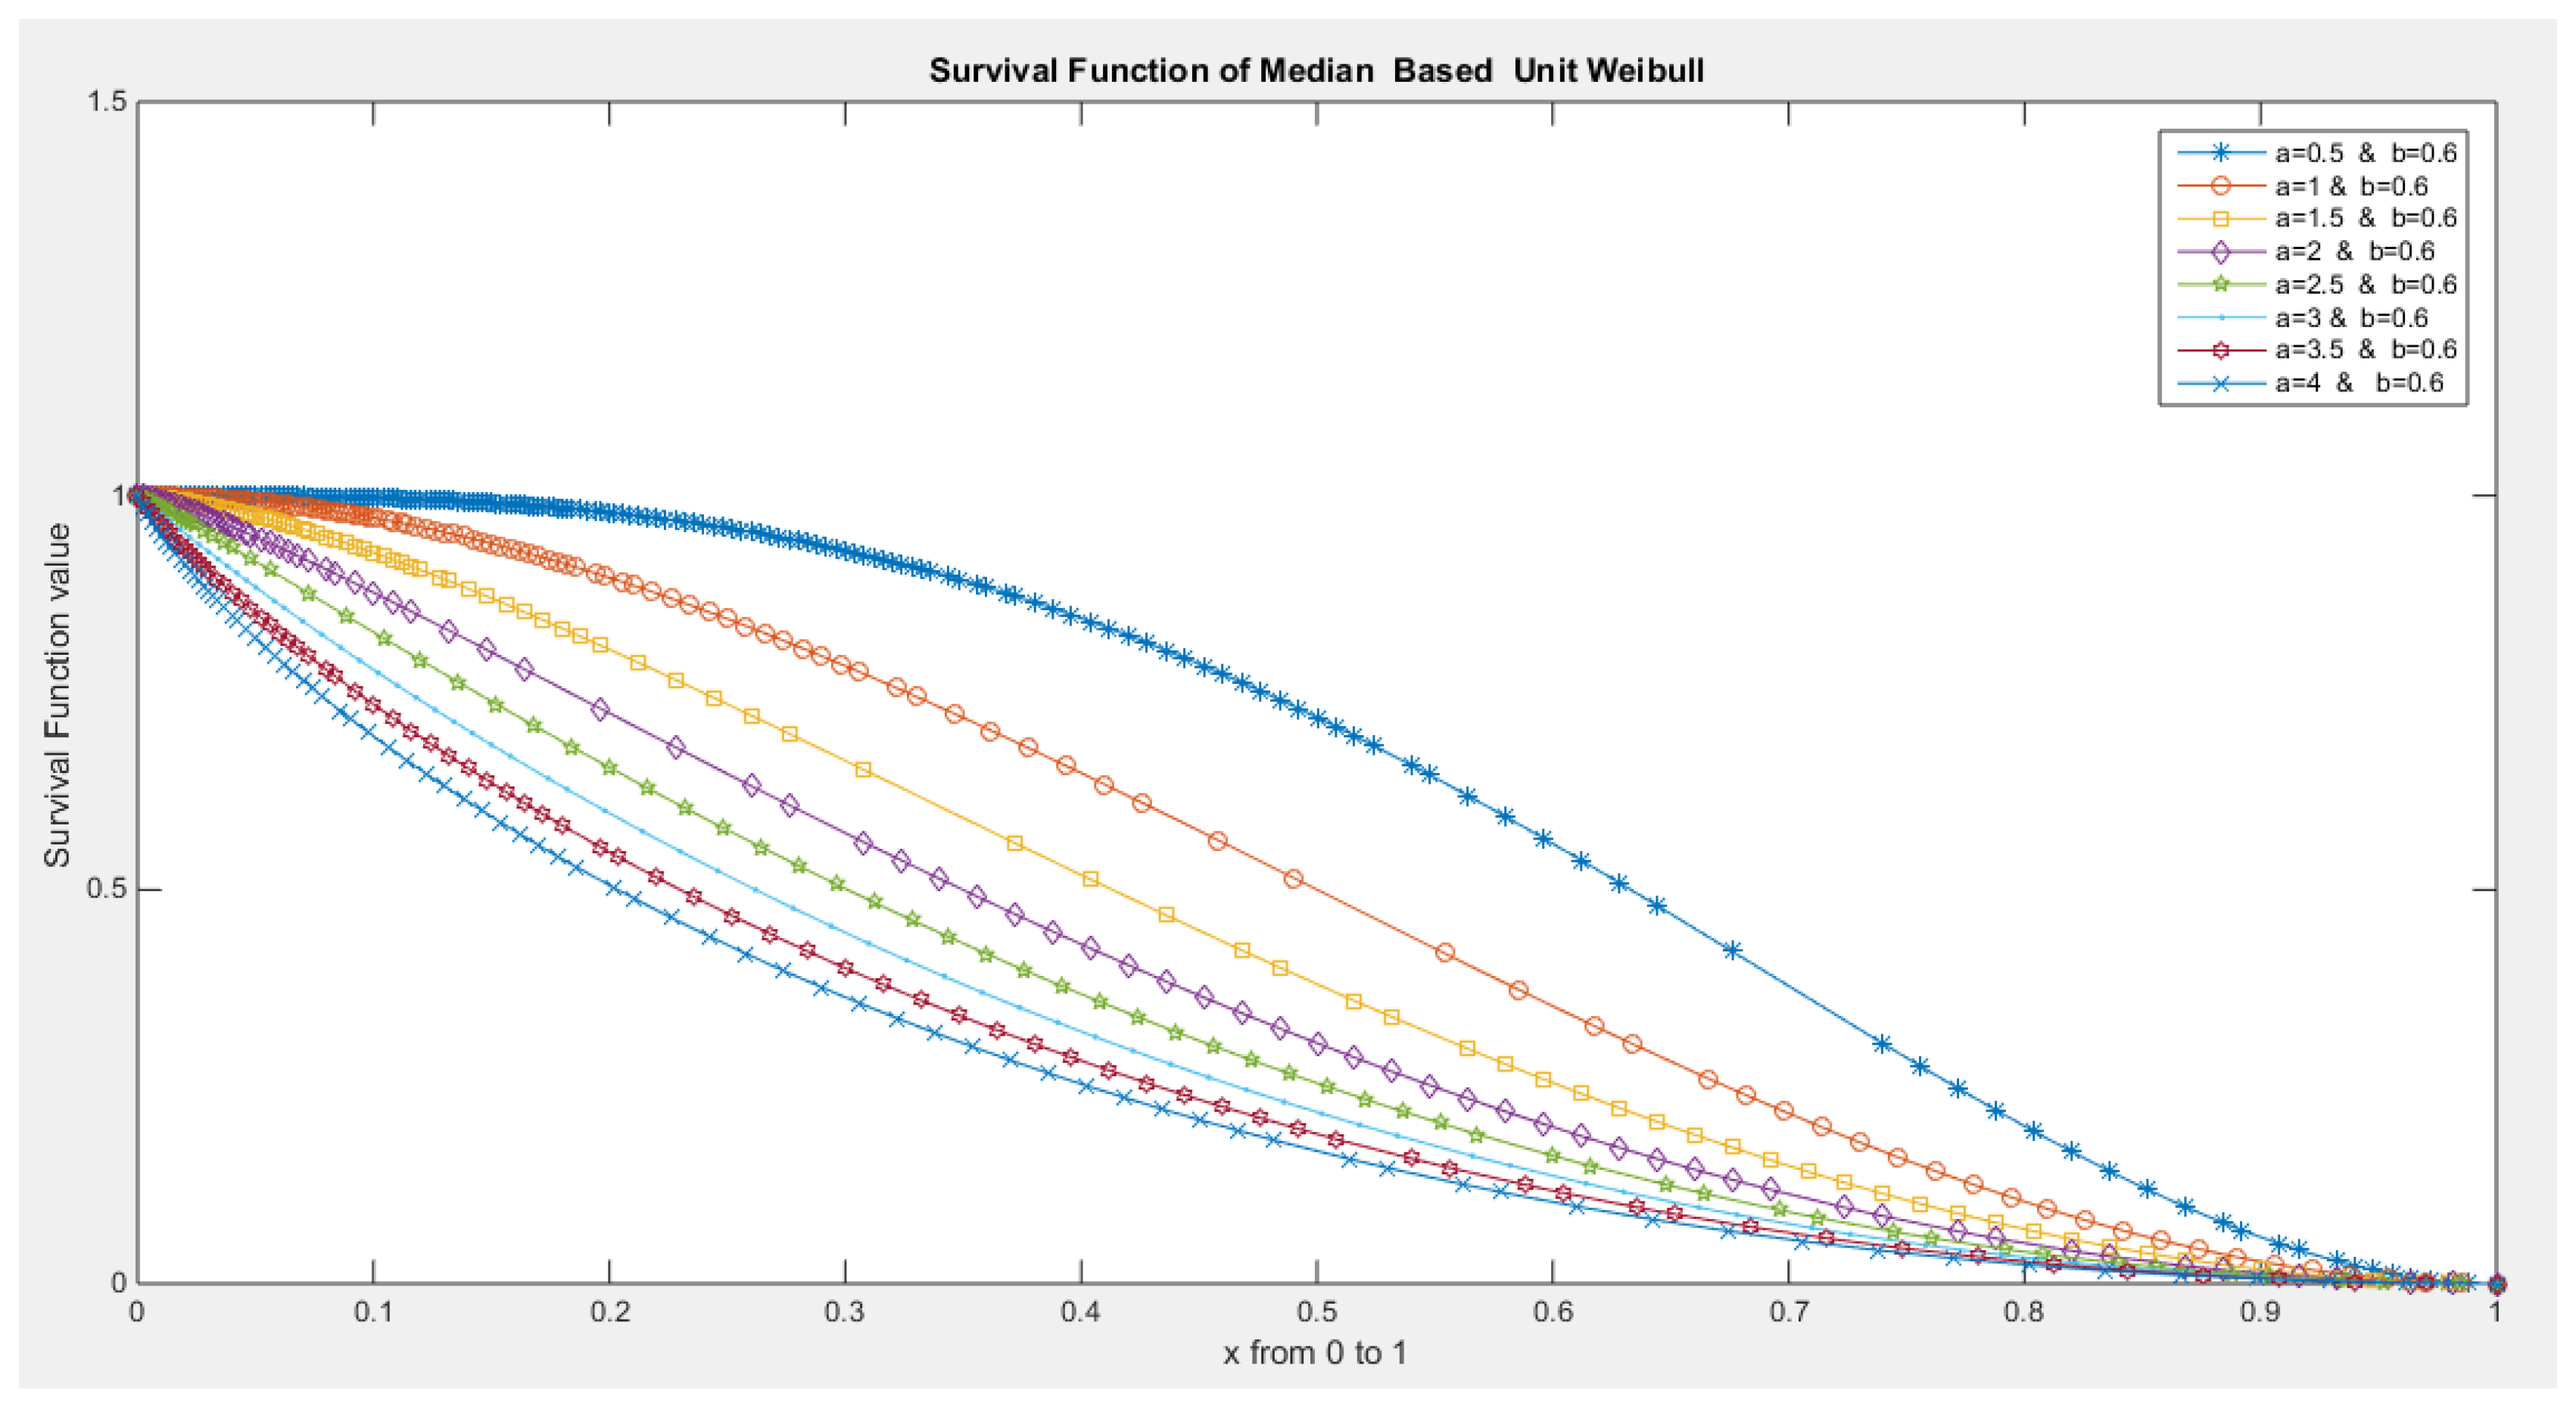
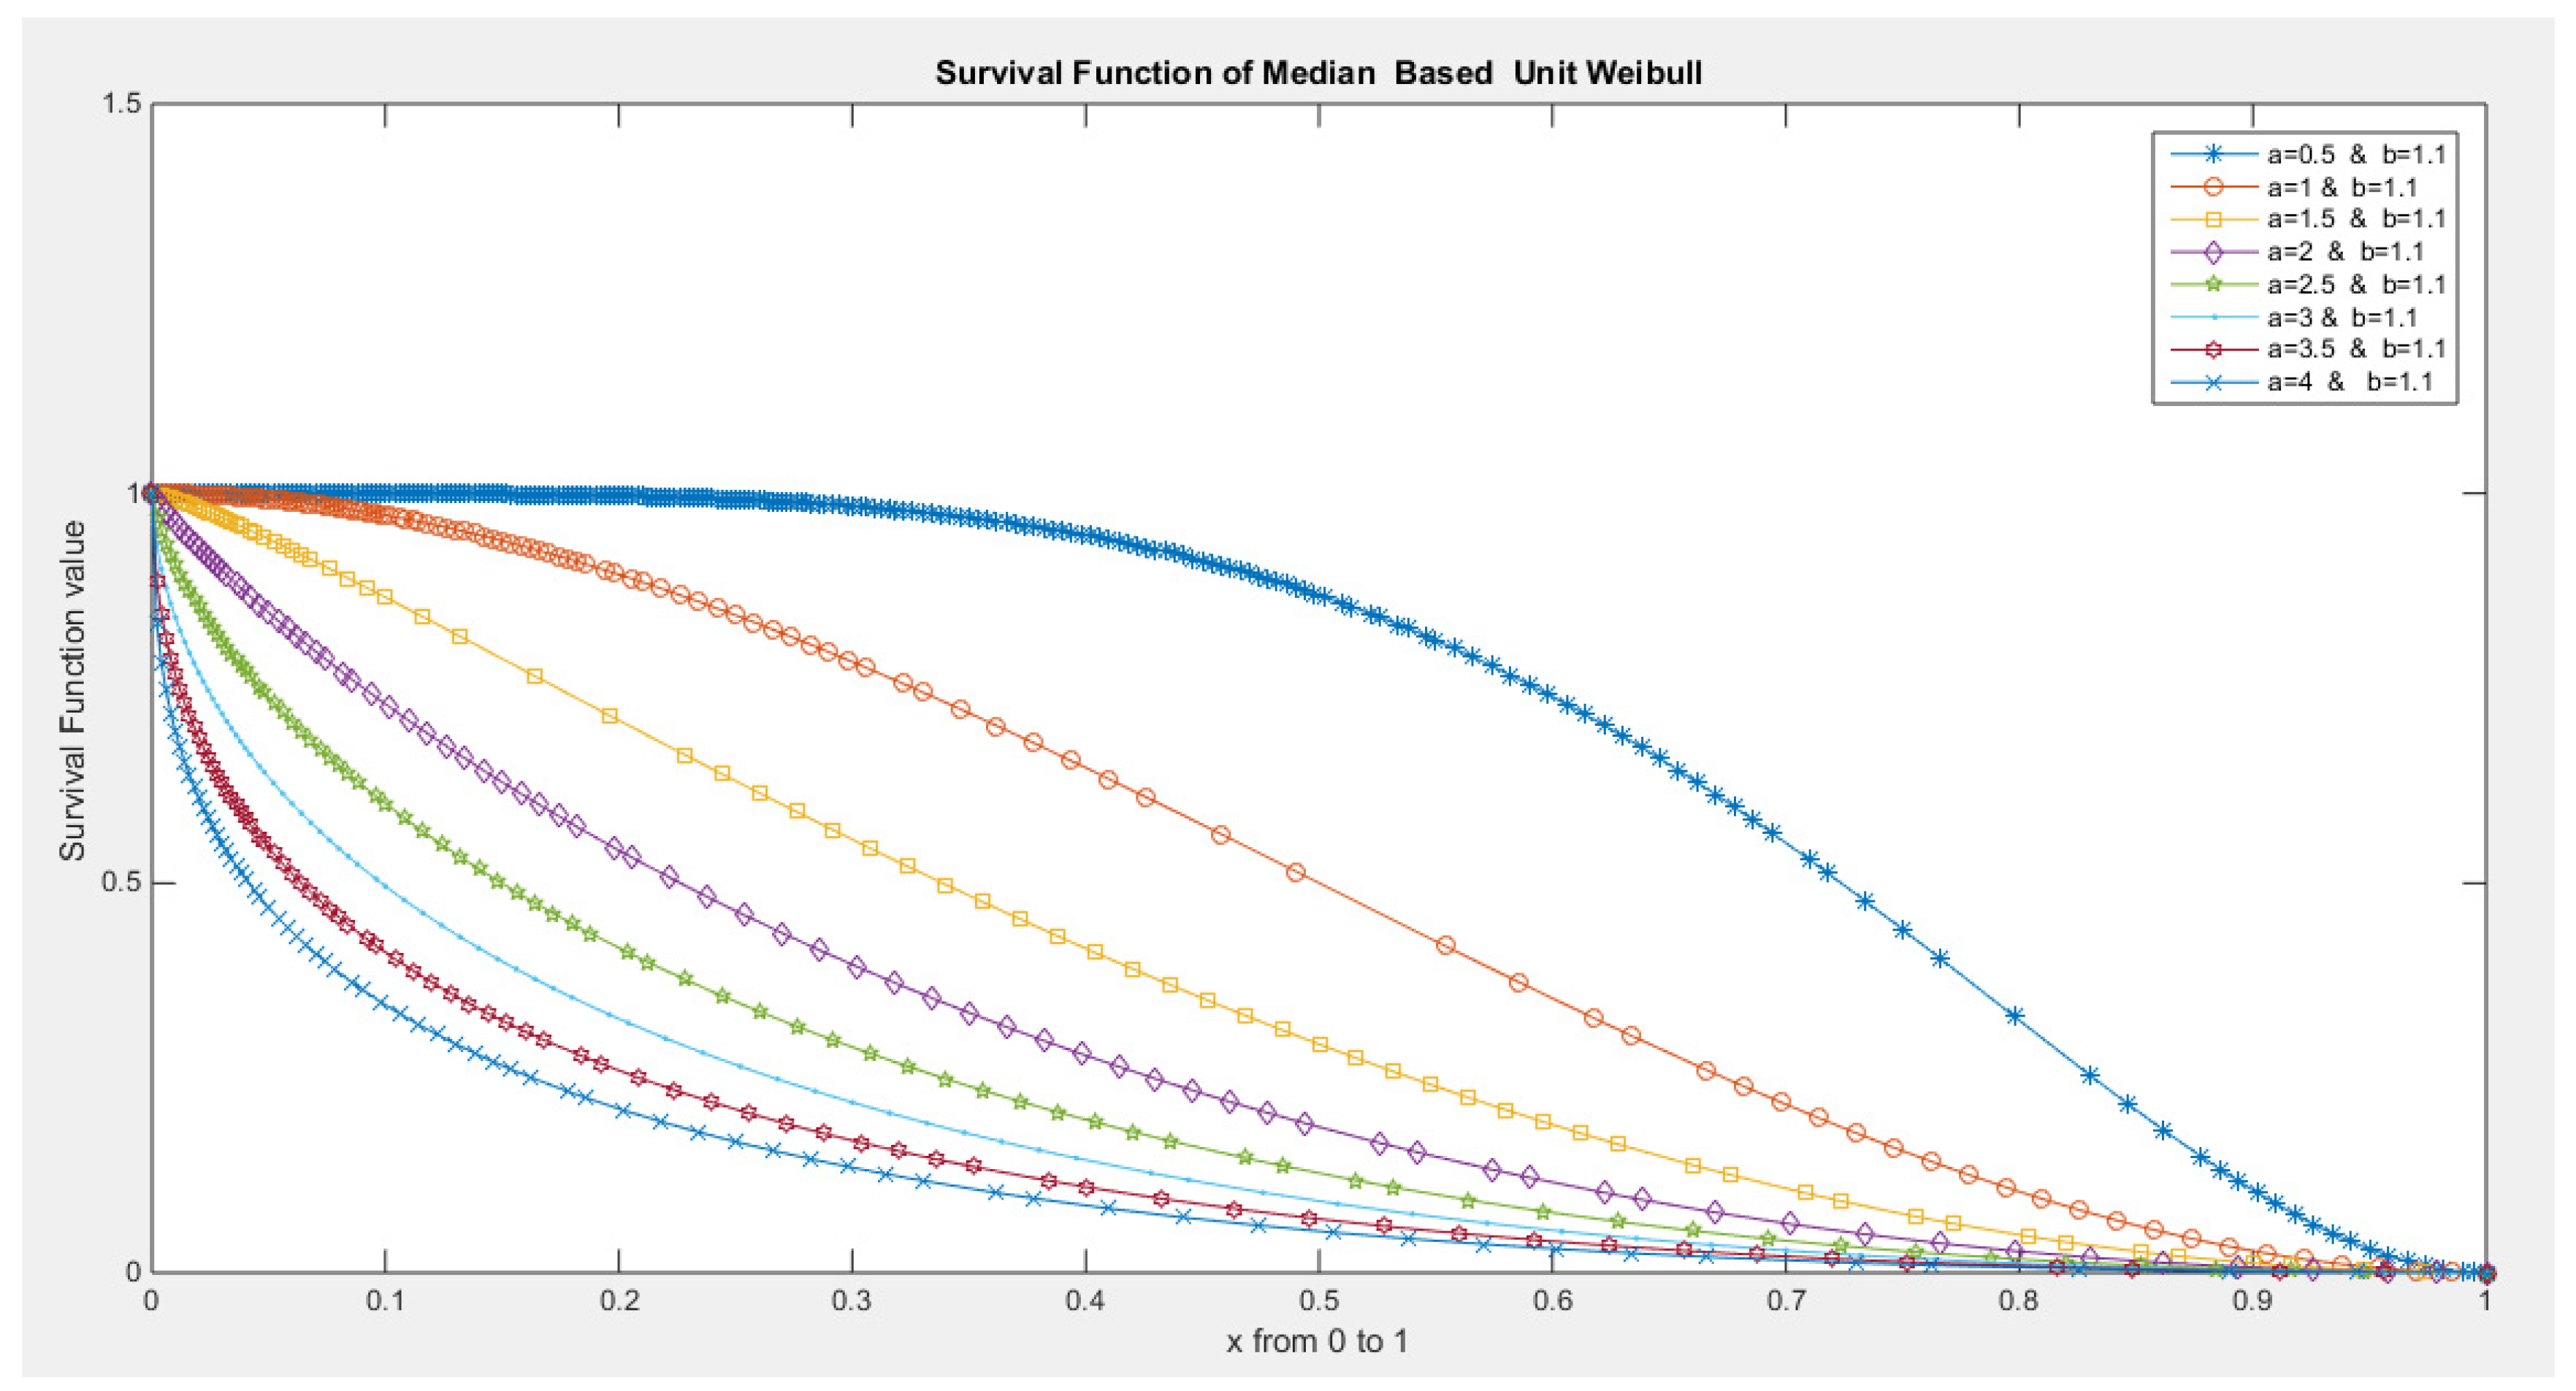
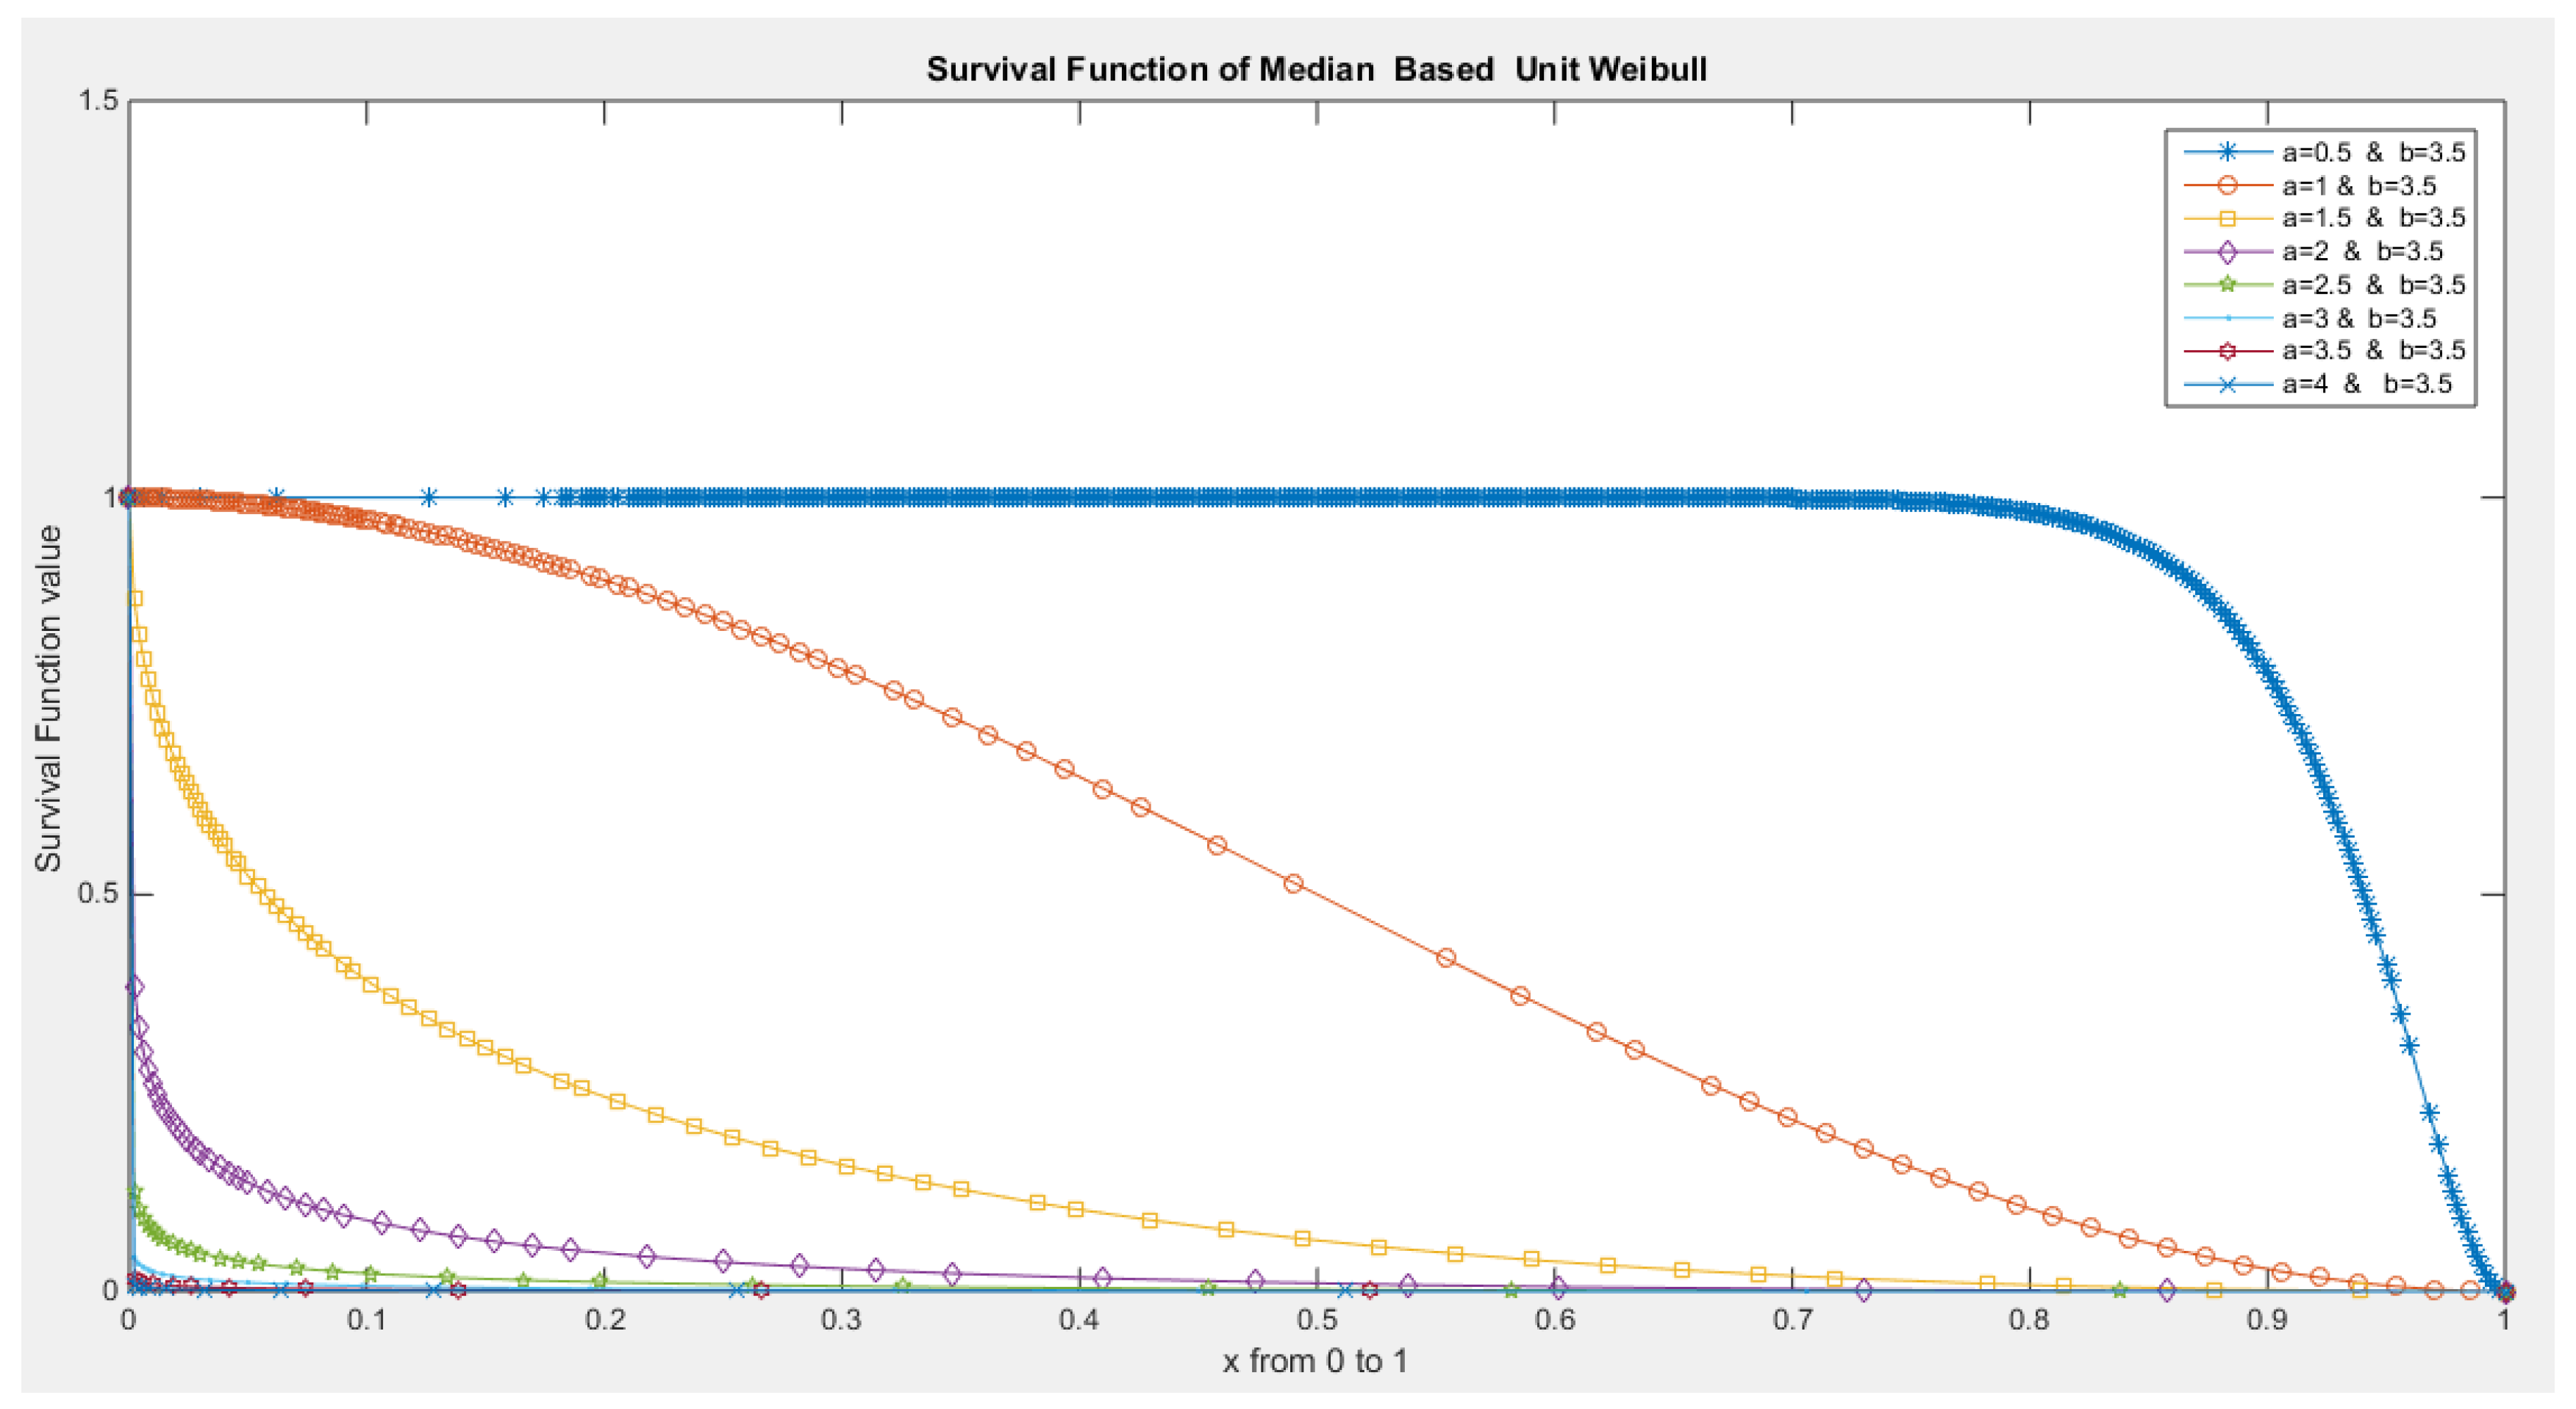
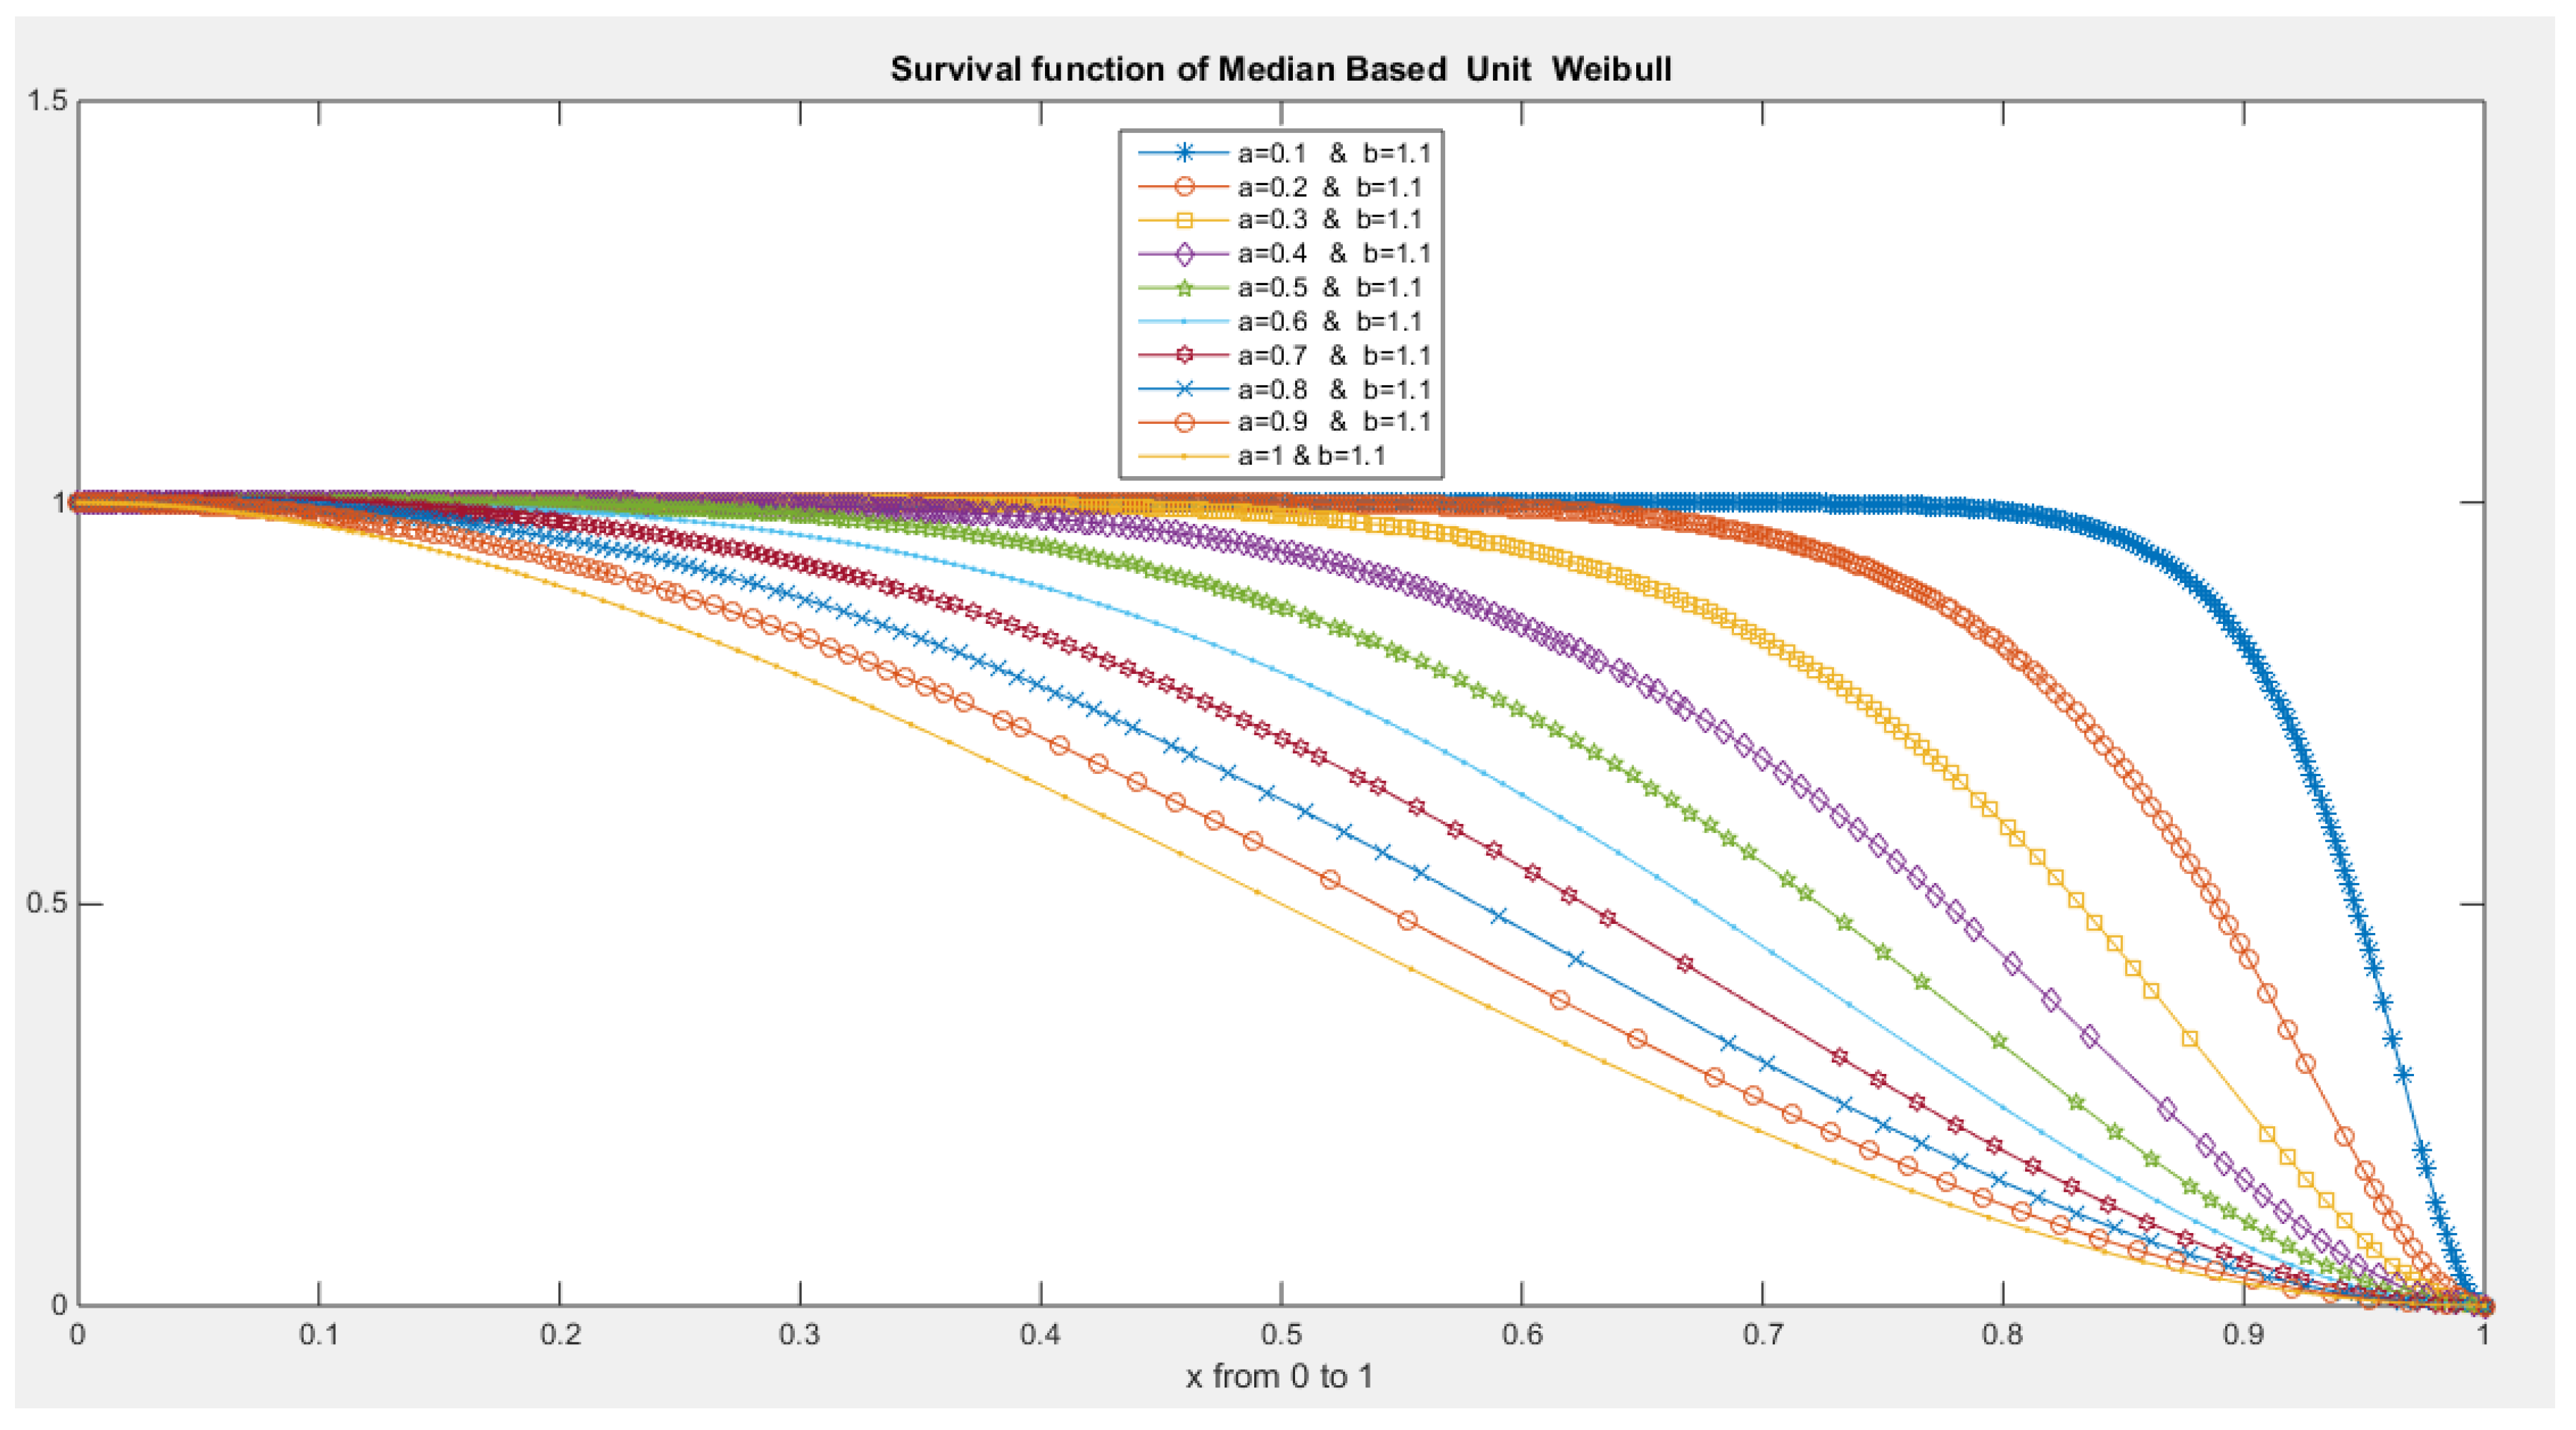
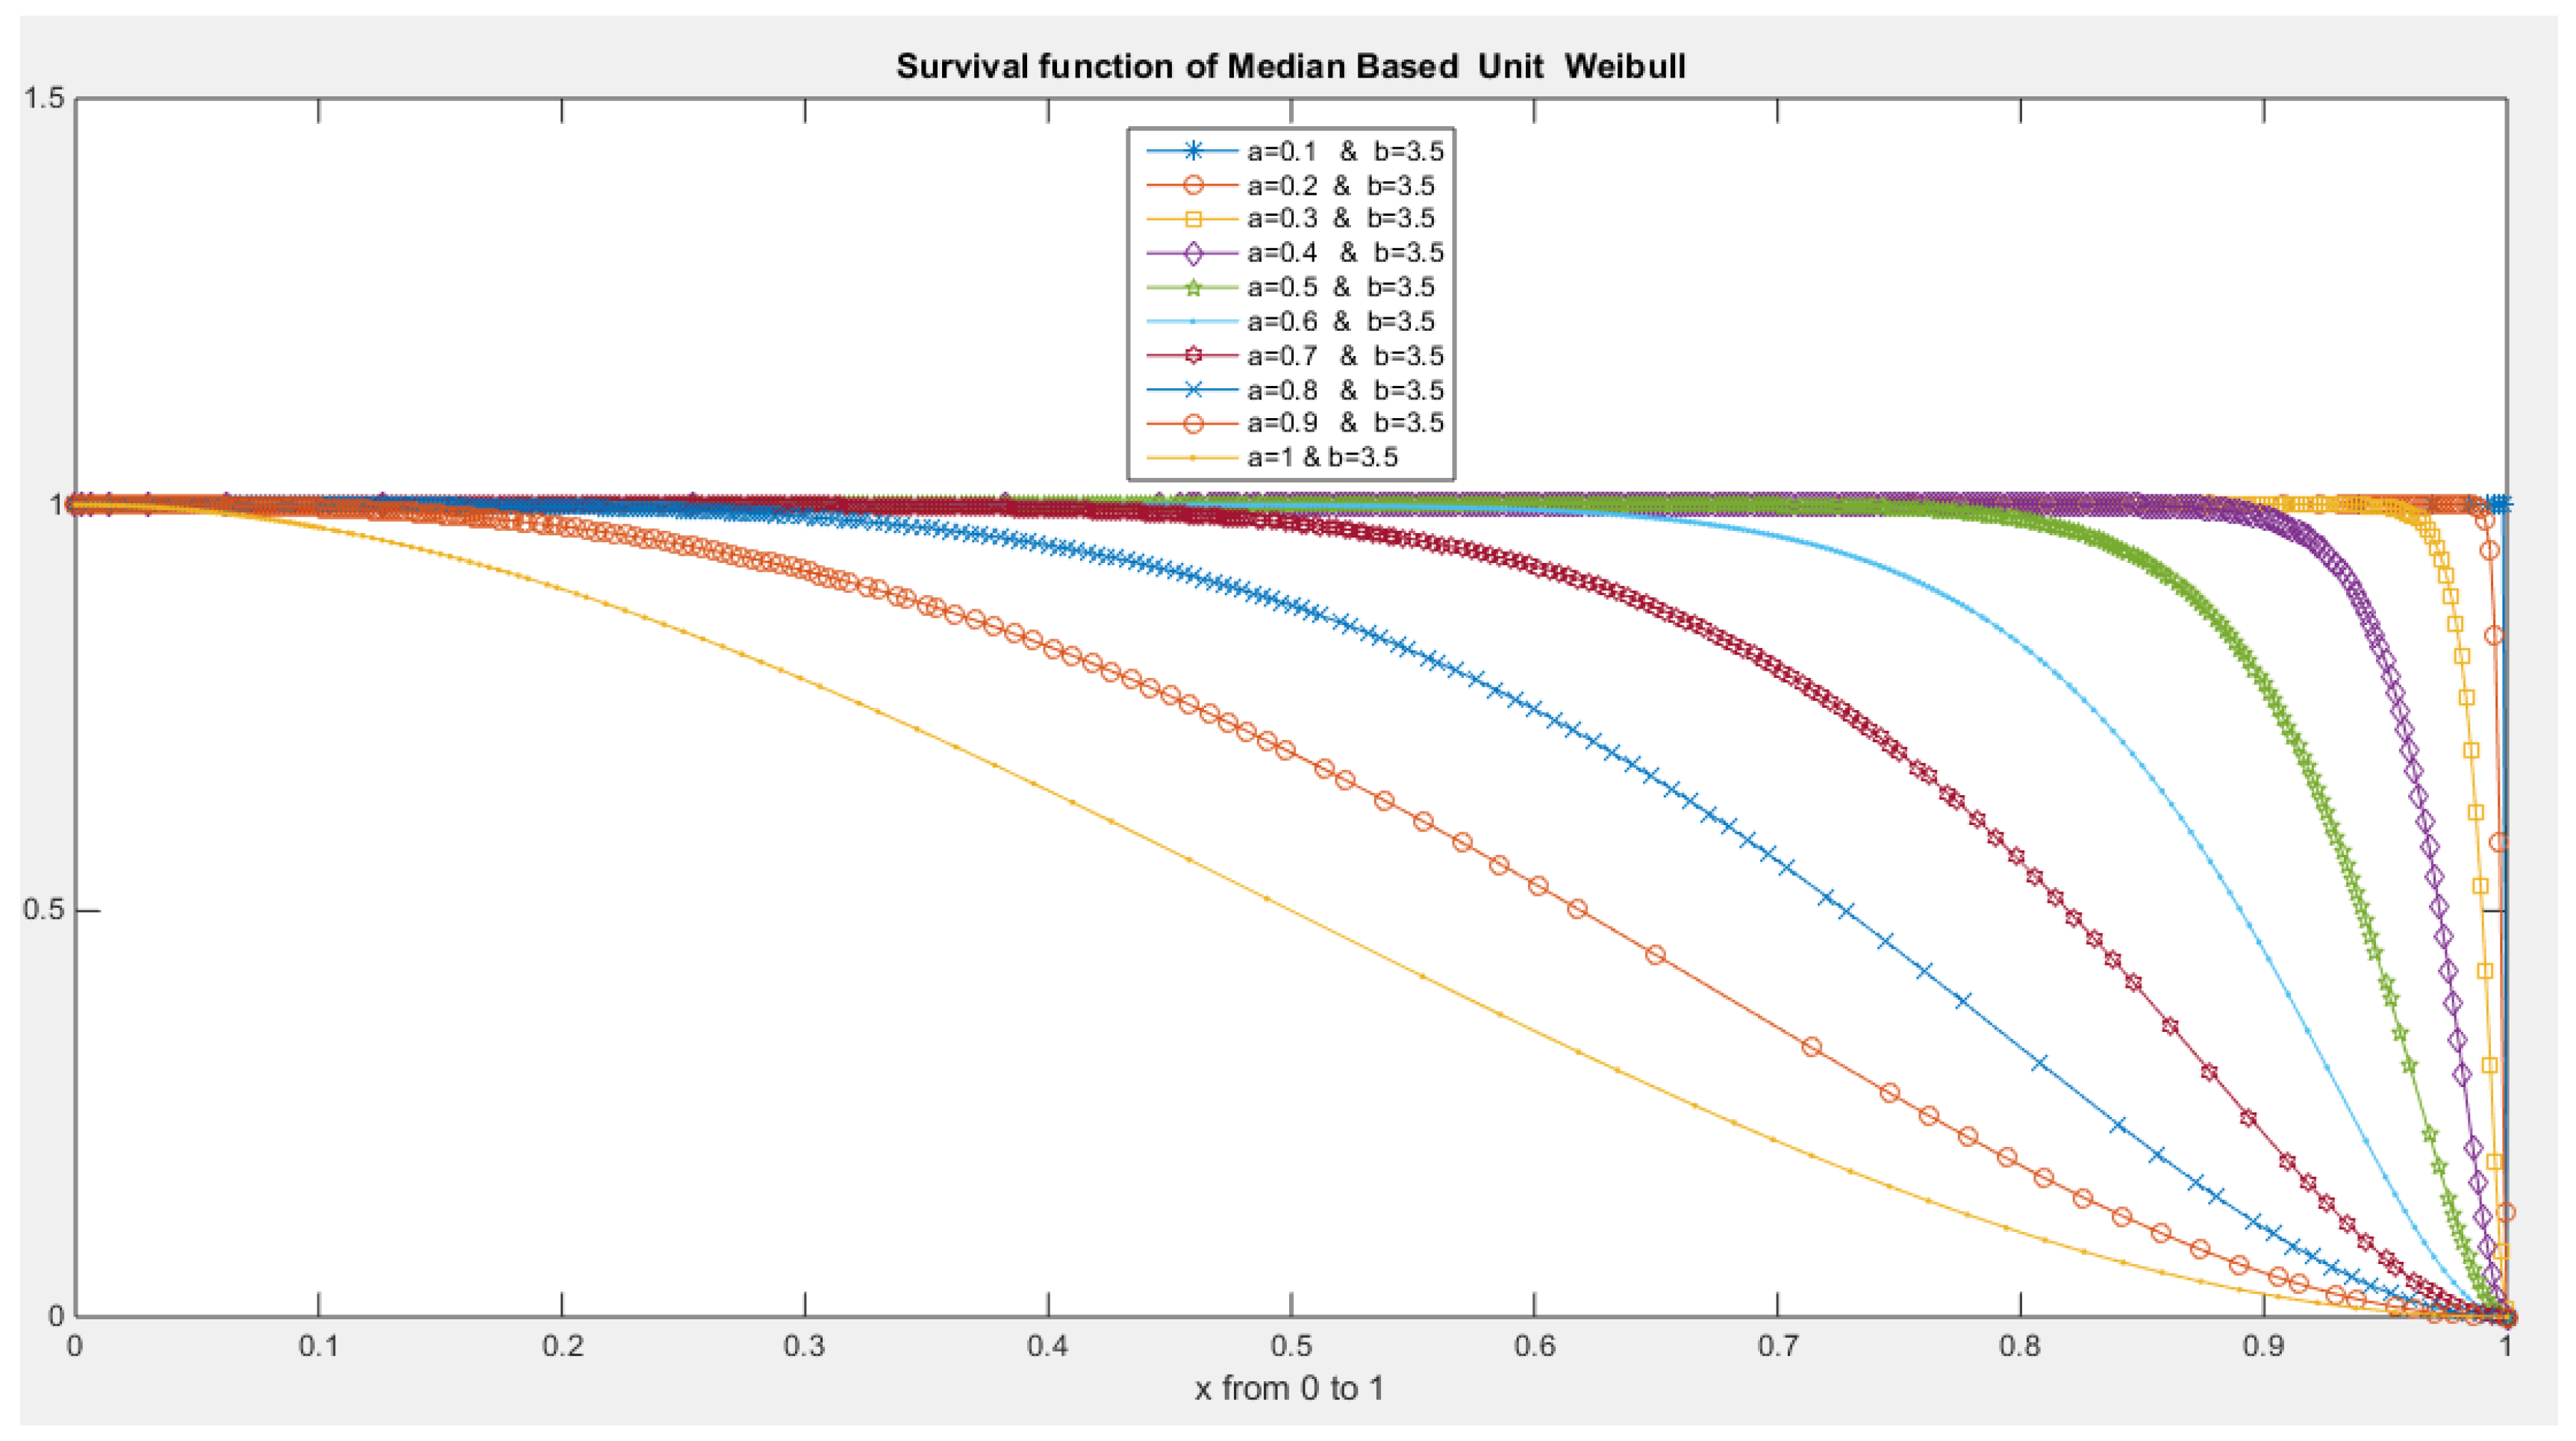
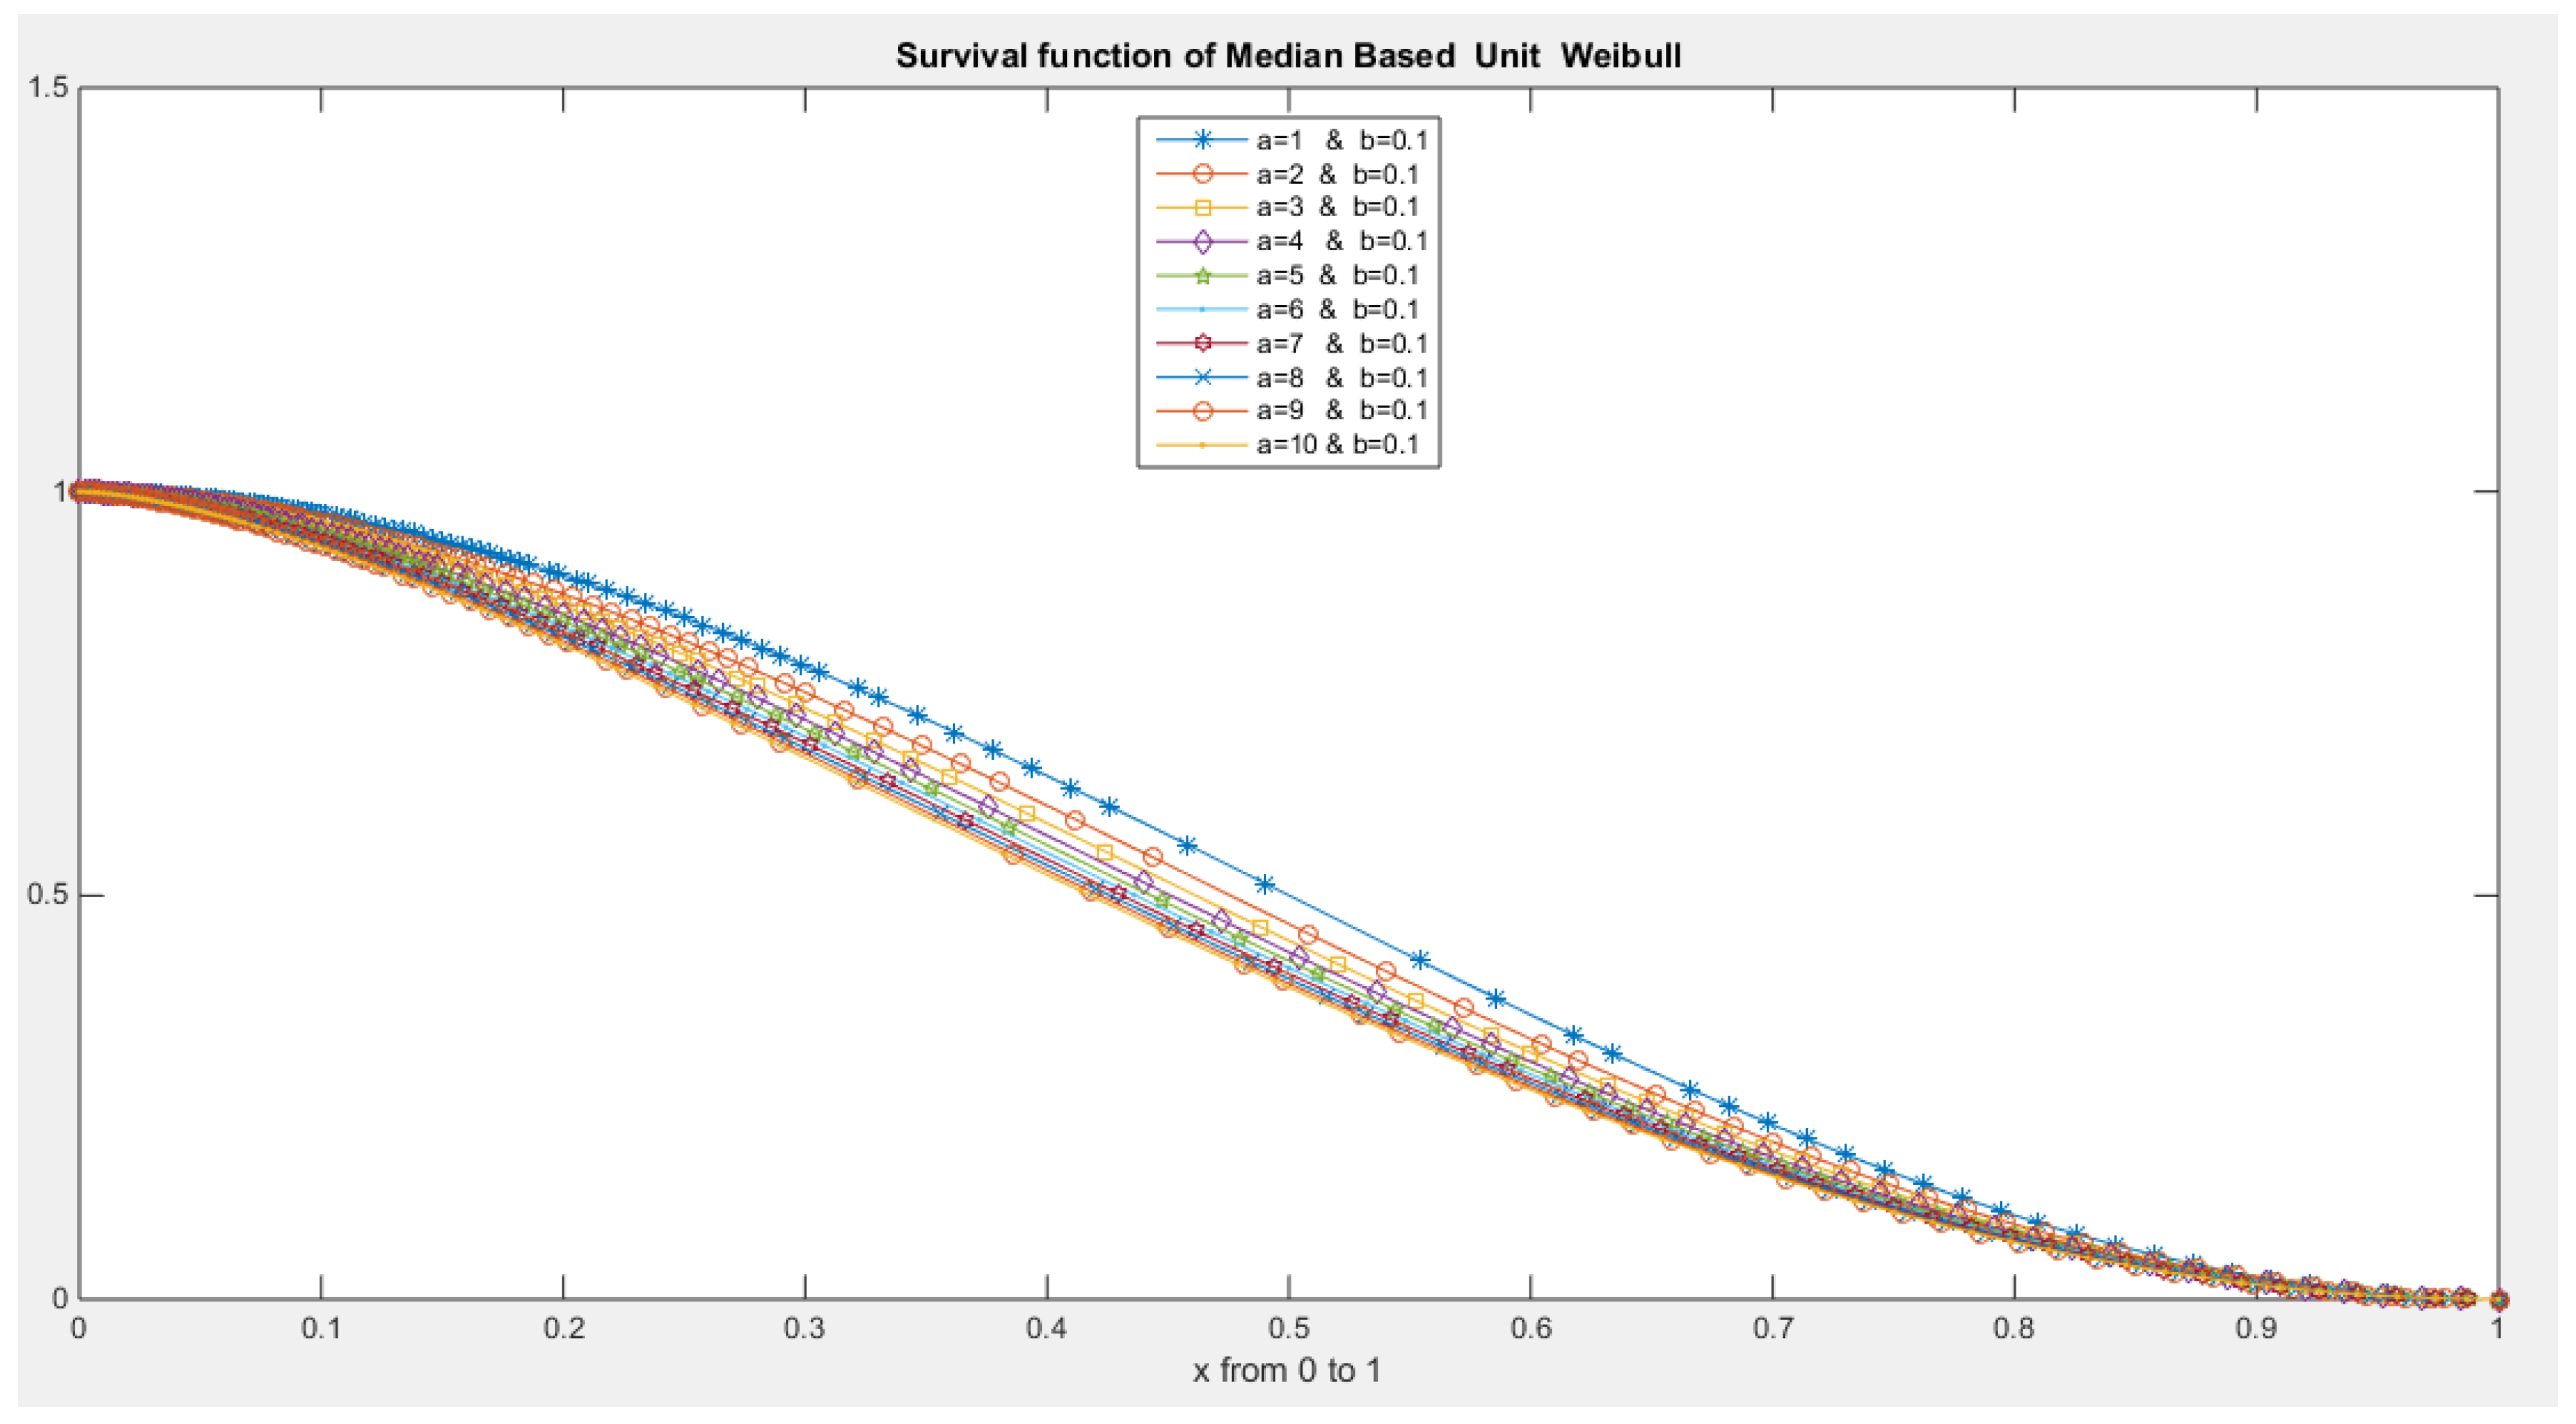
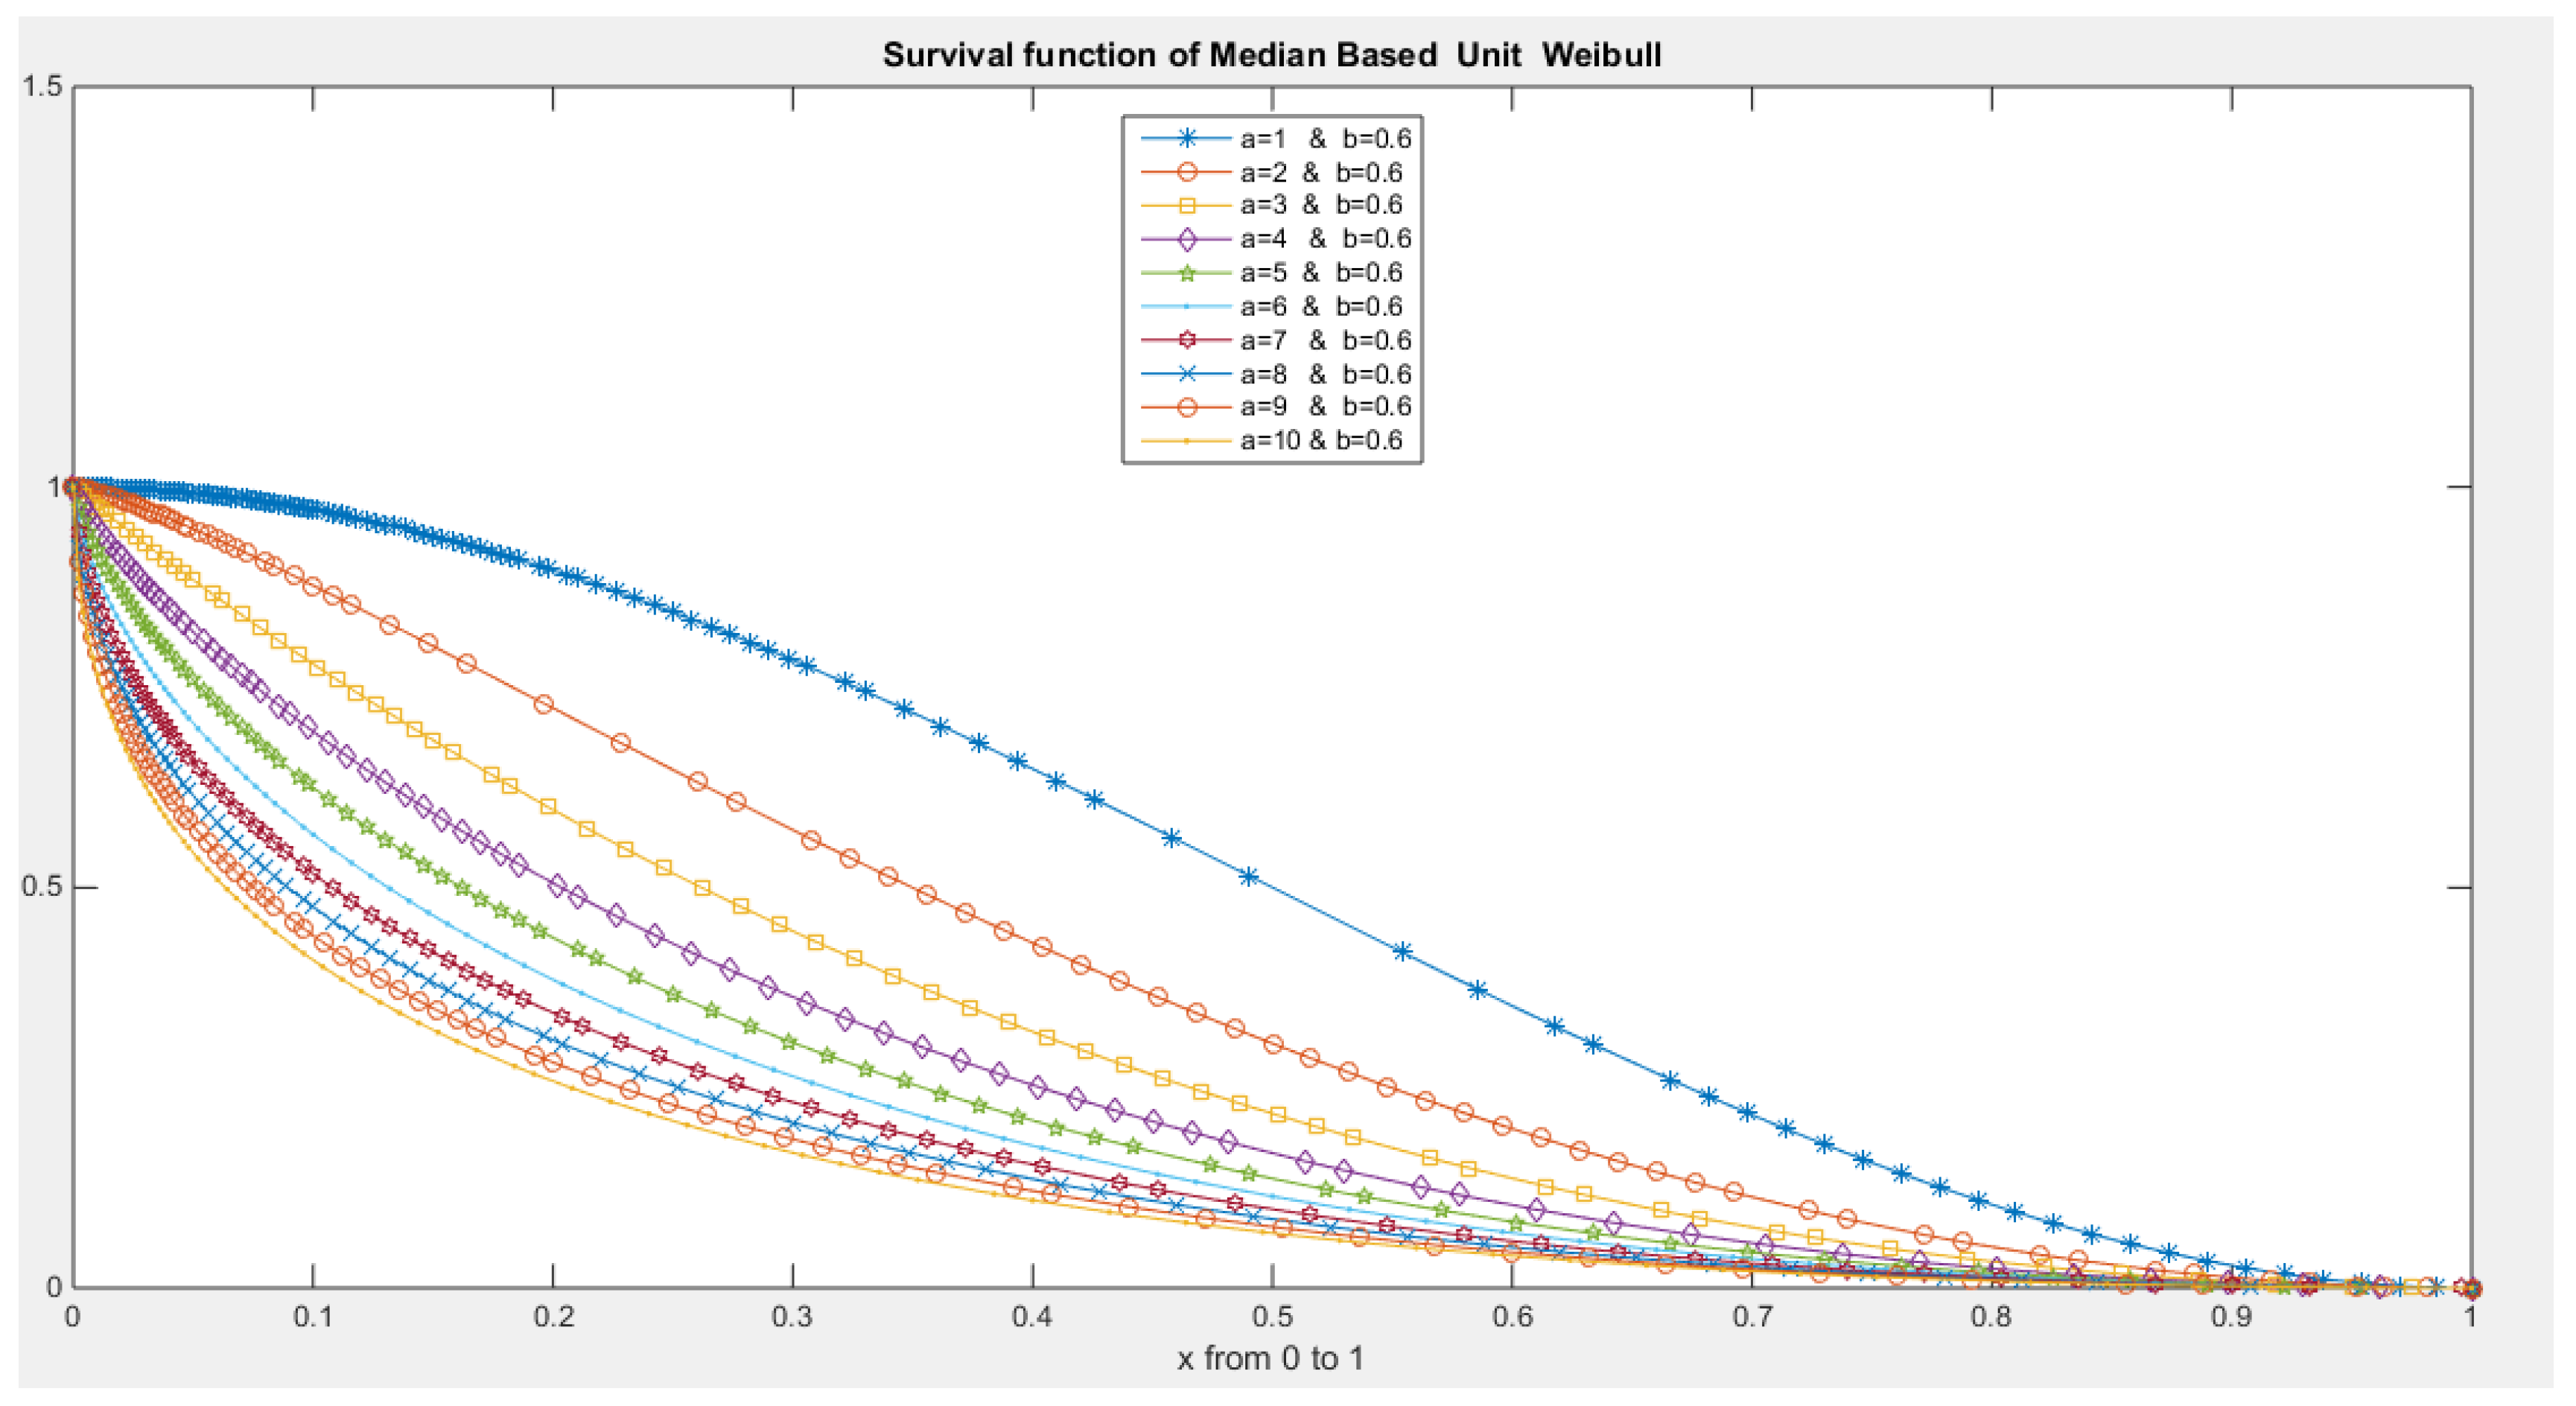
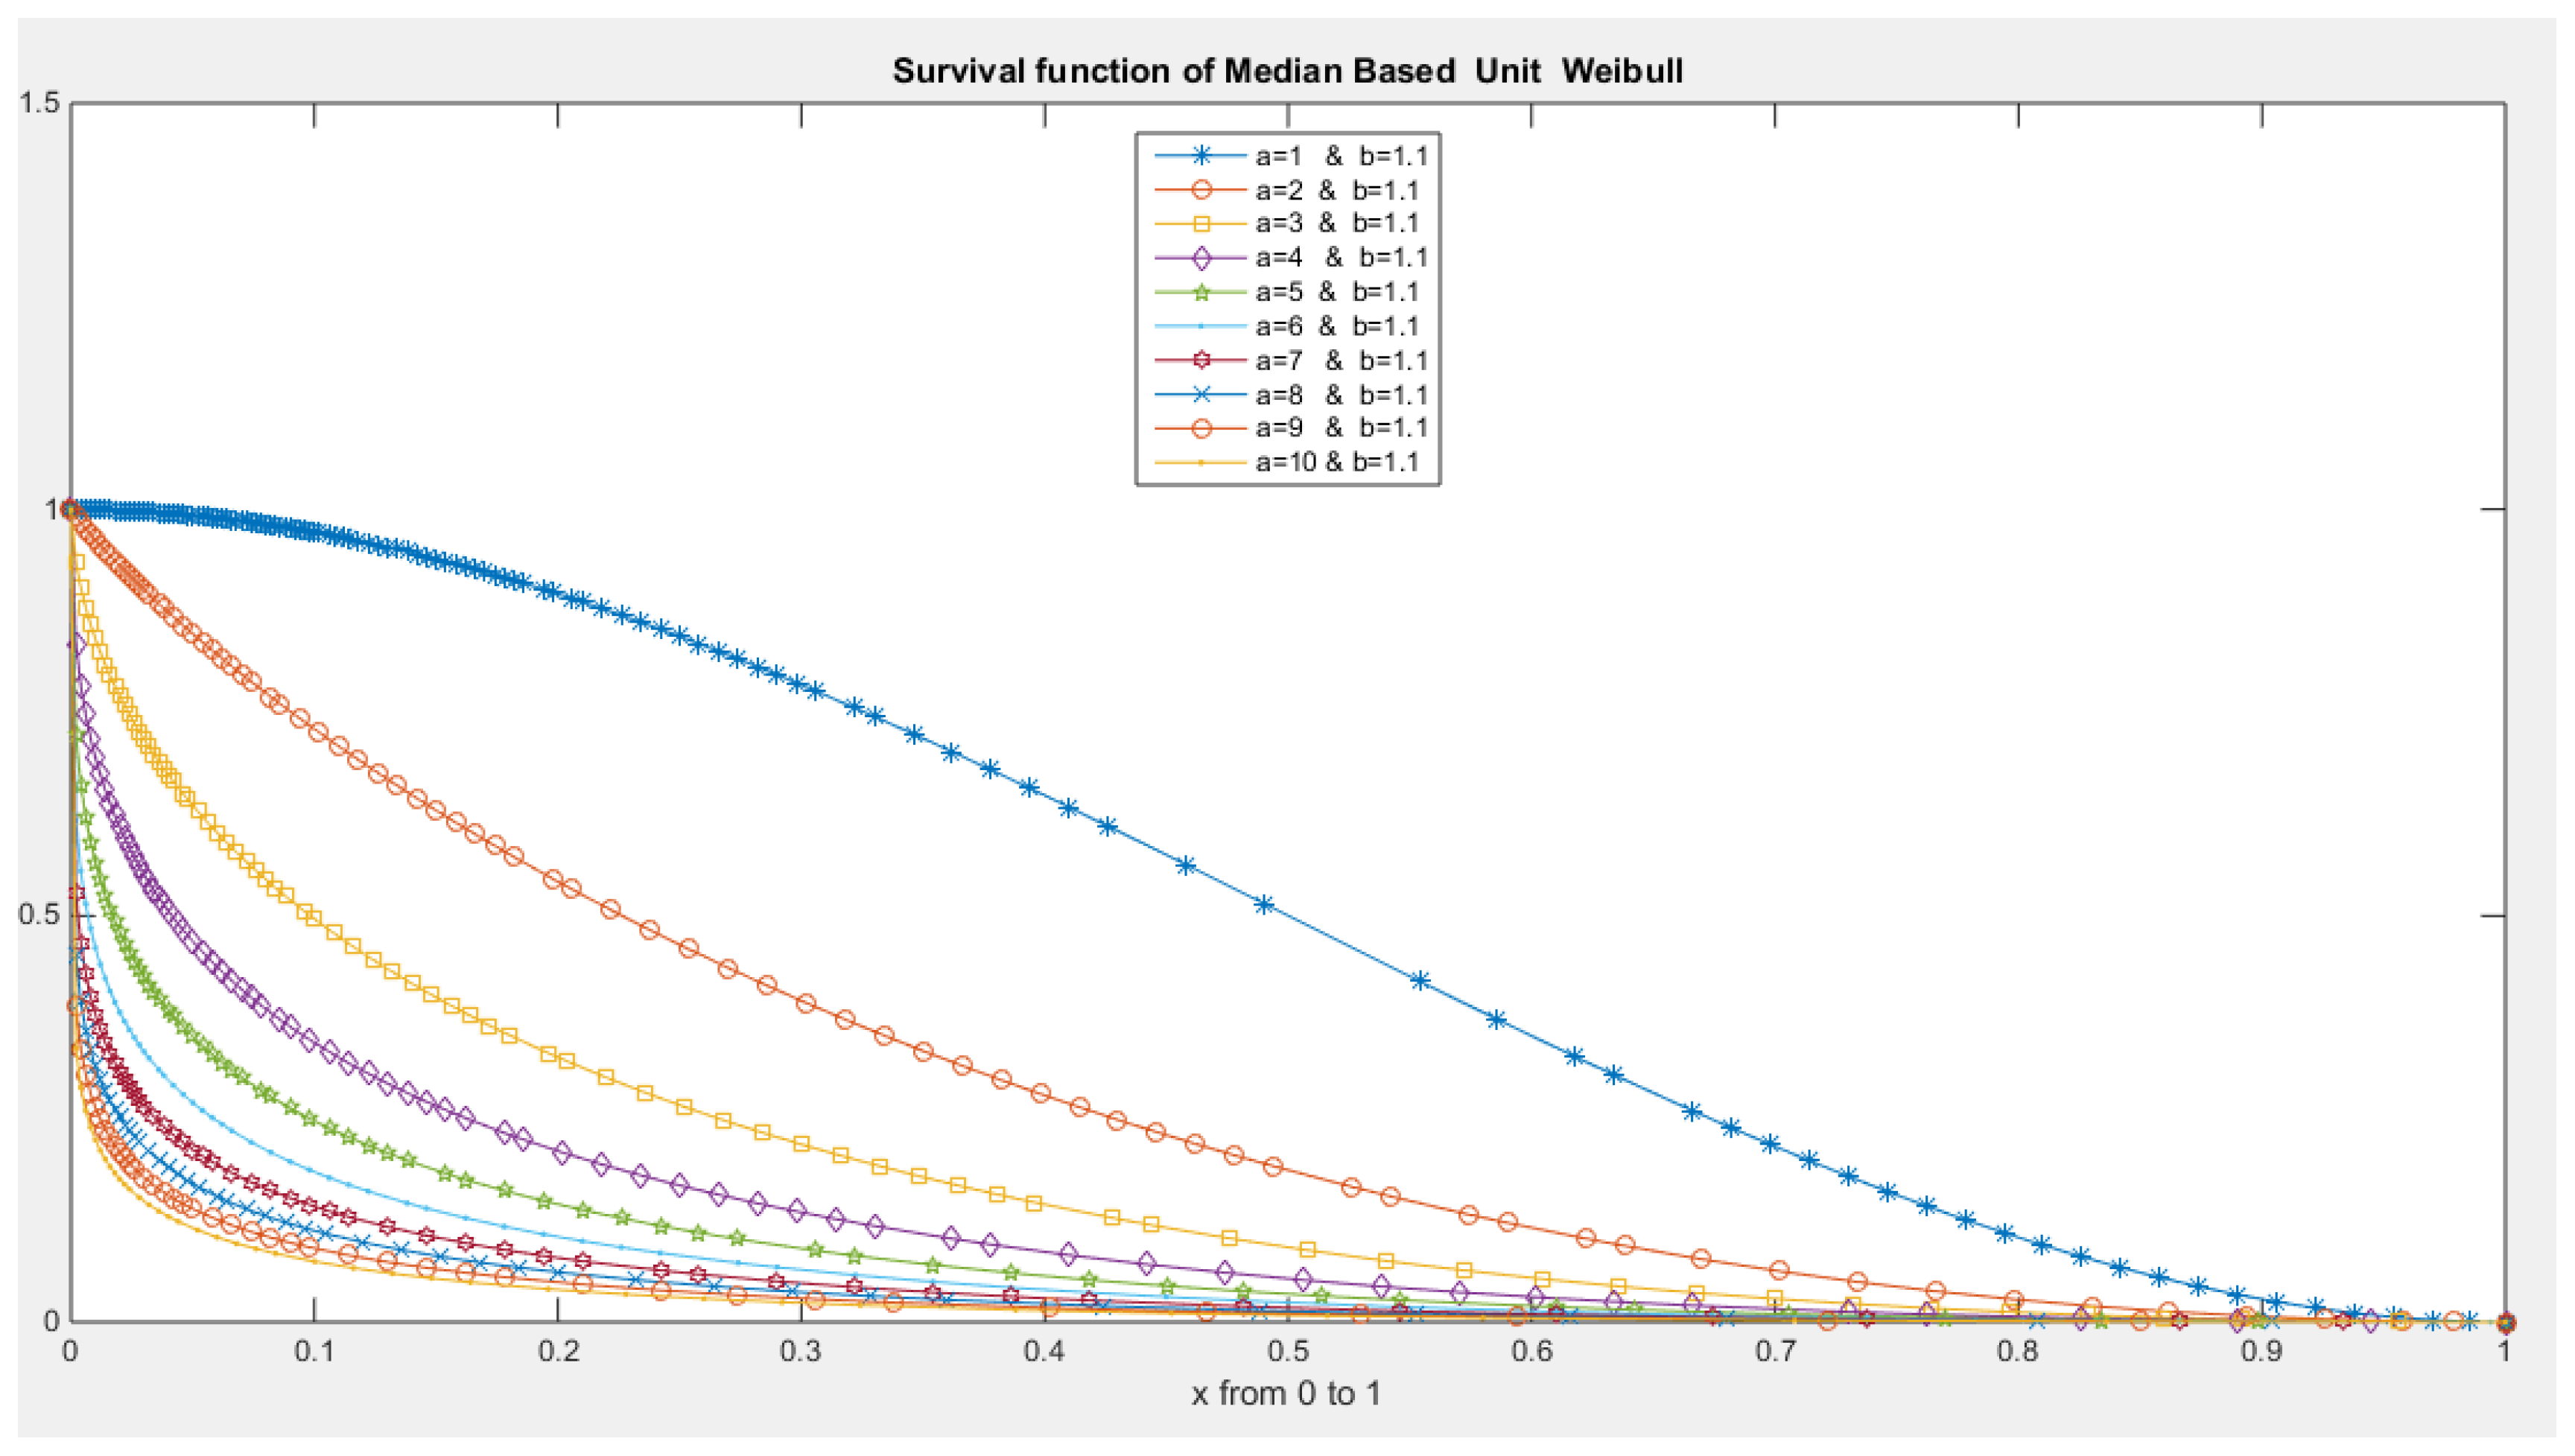
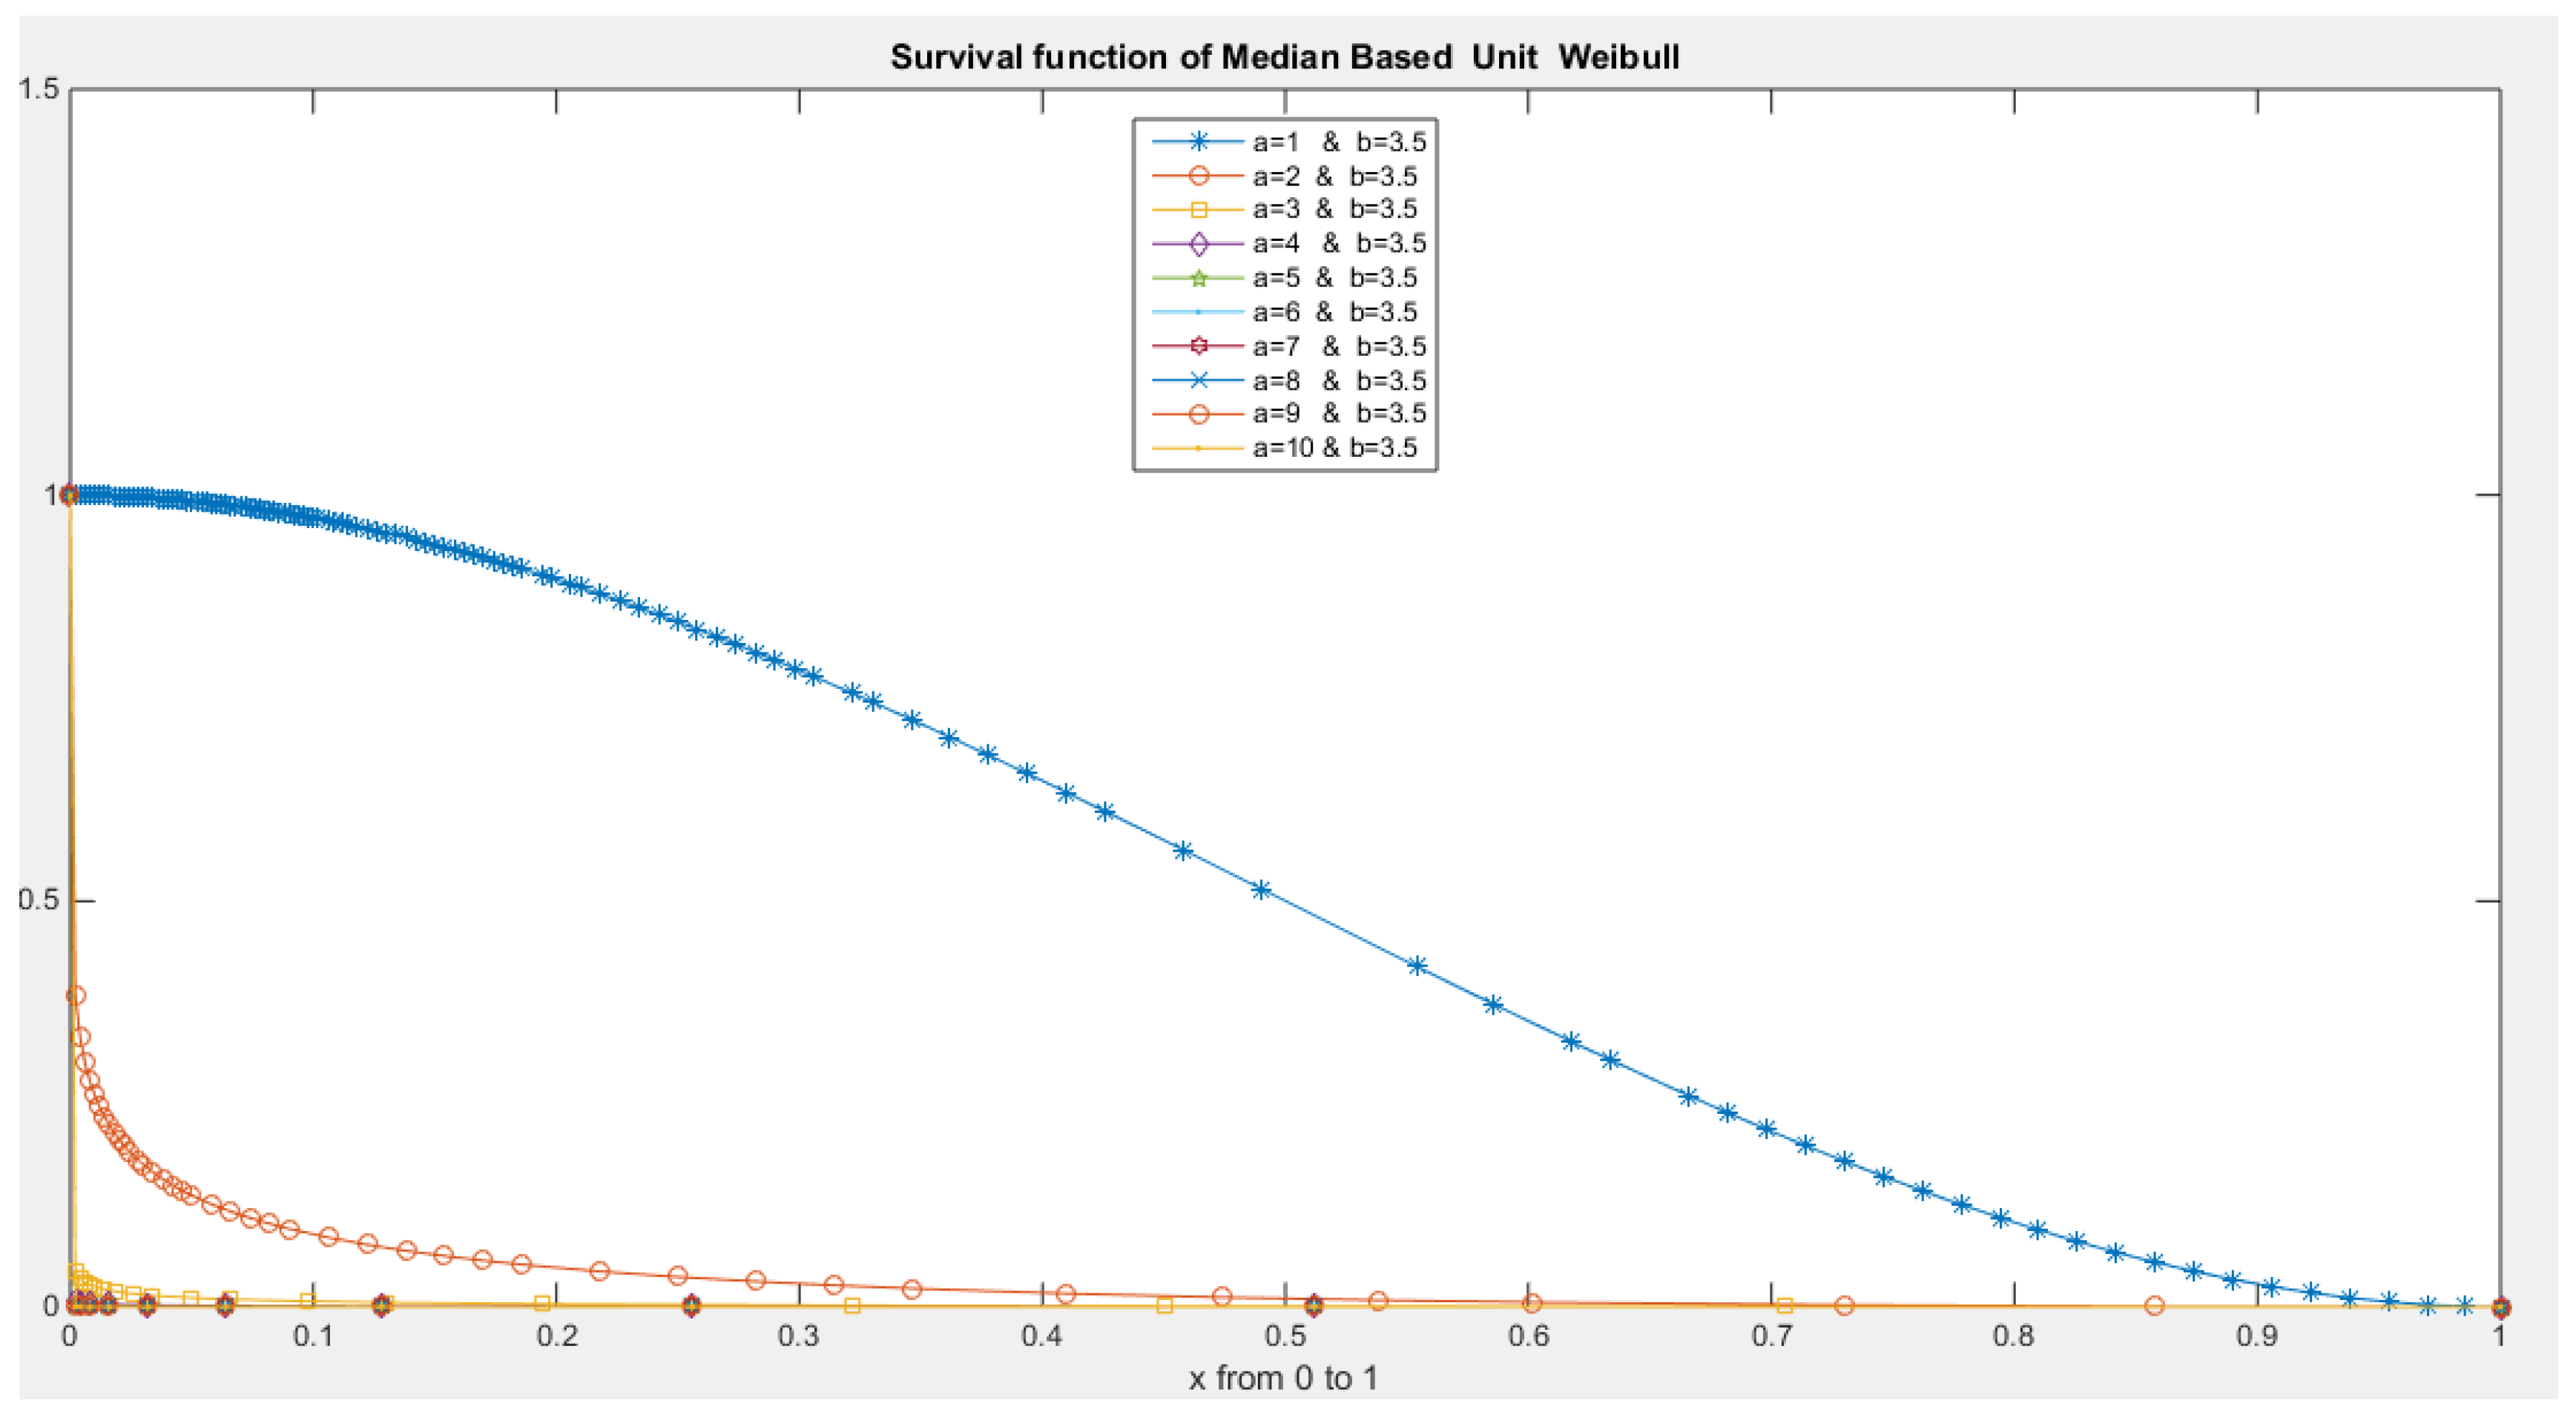
- The following is the survival function :
- 4-
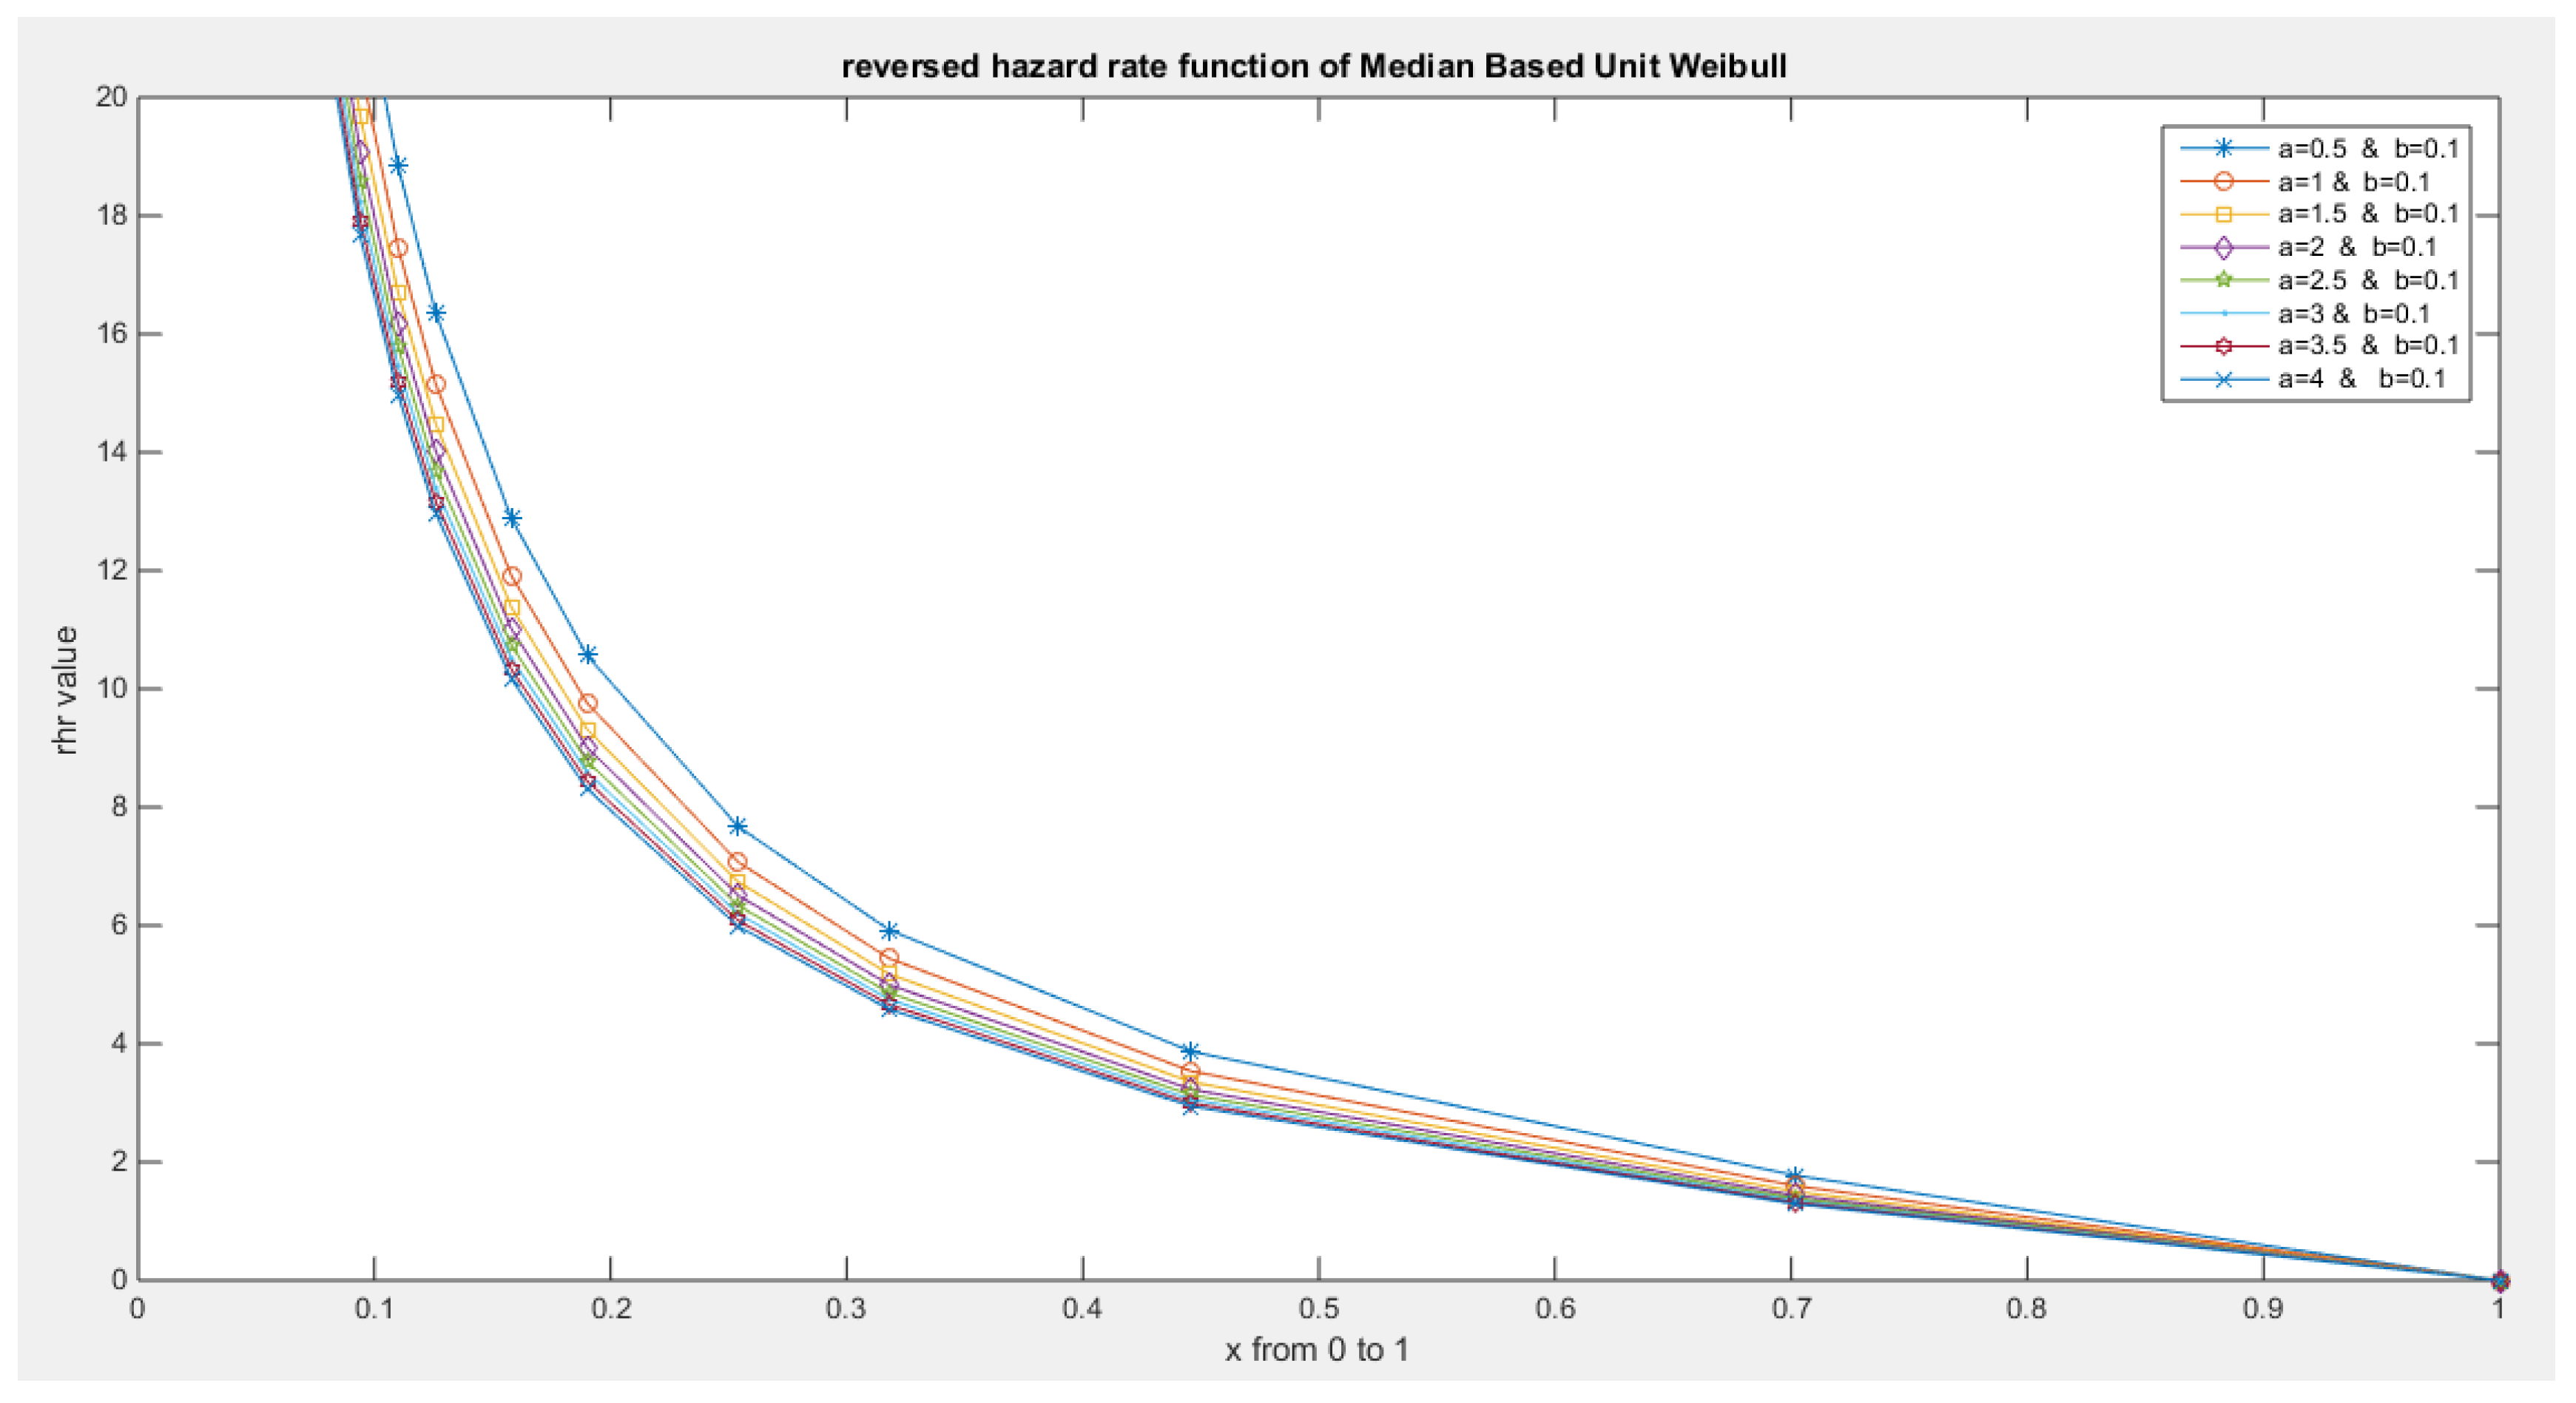
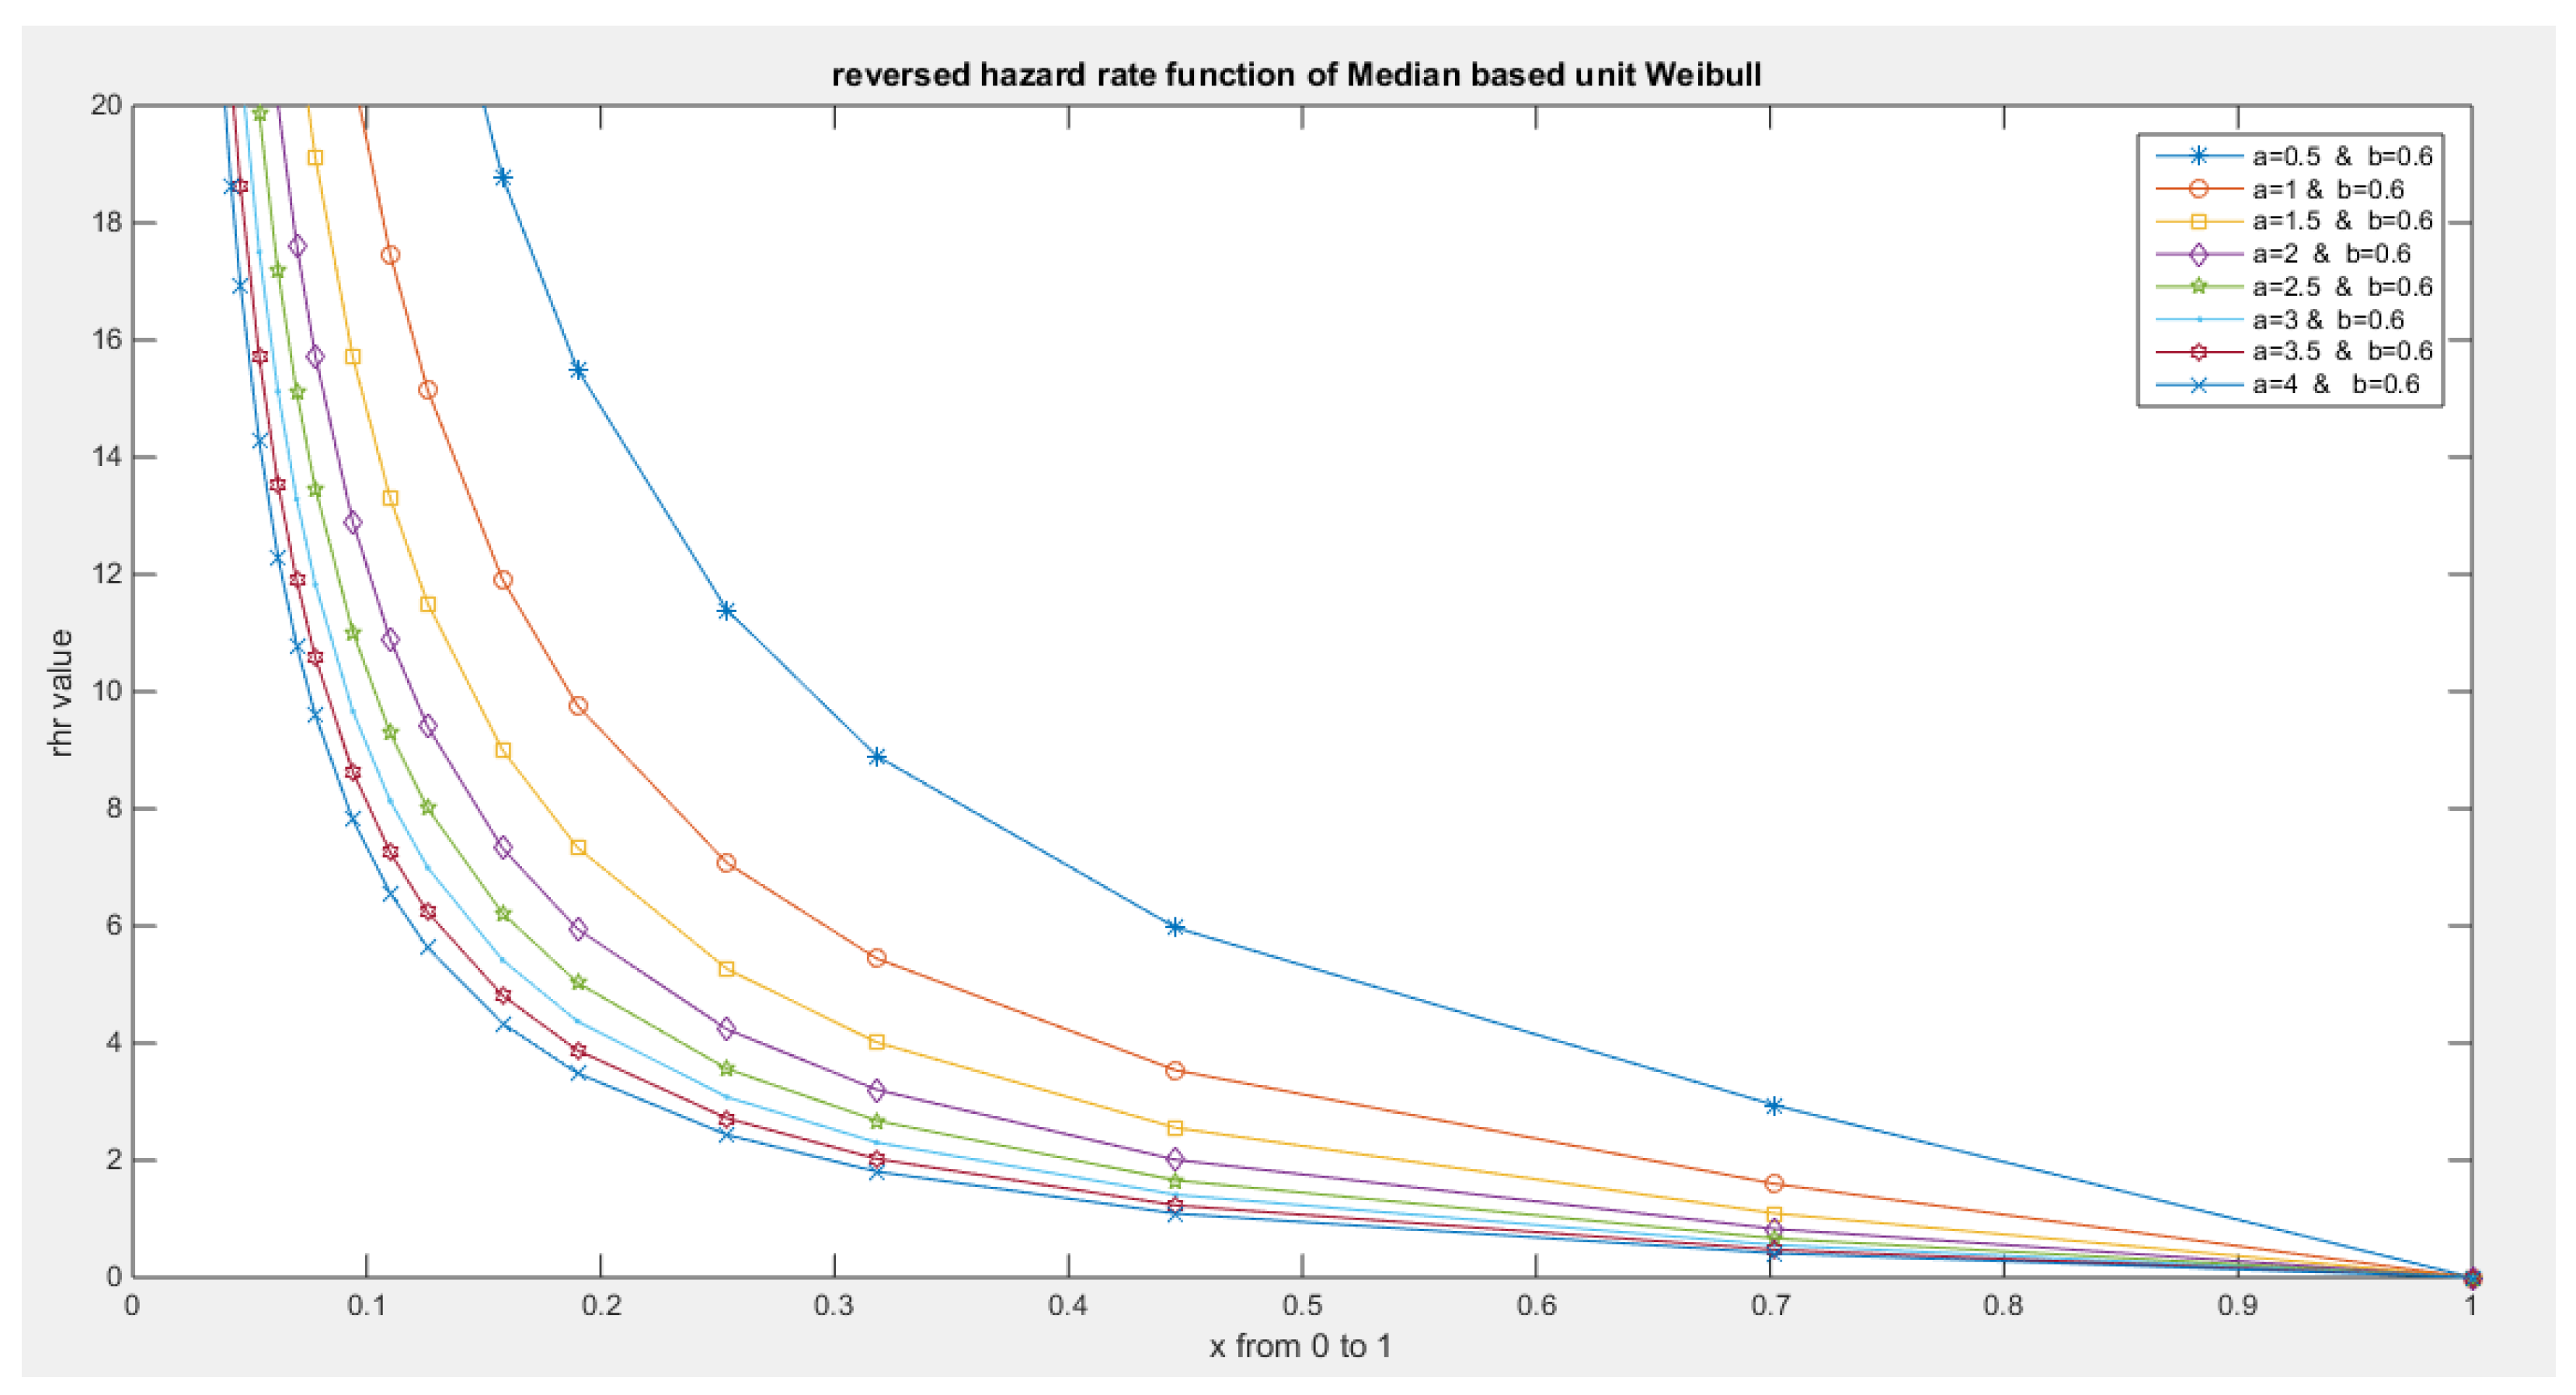
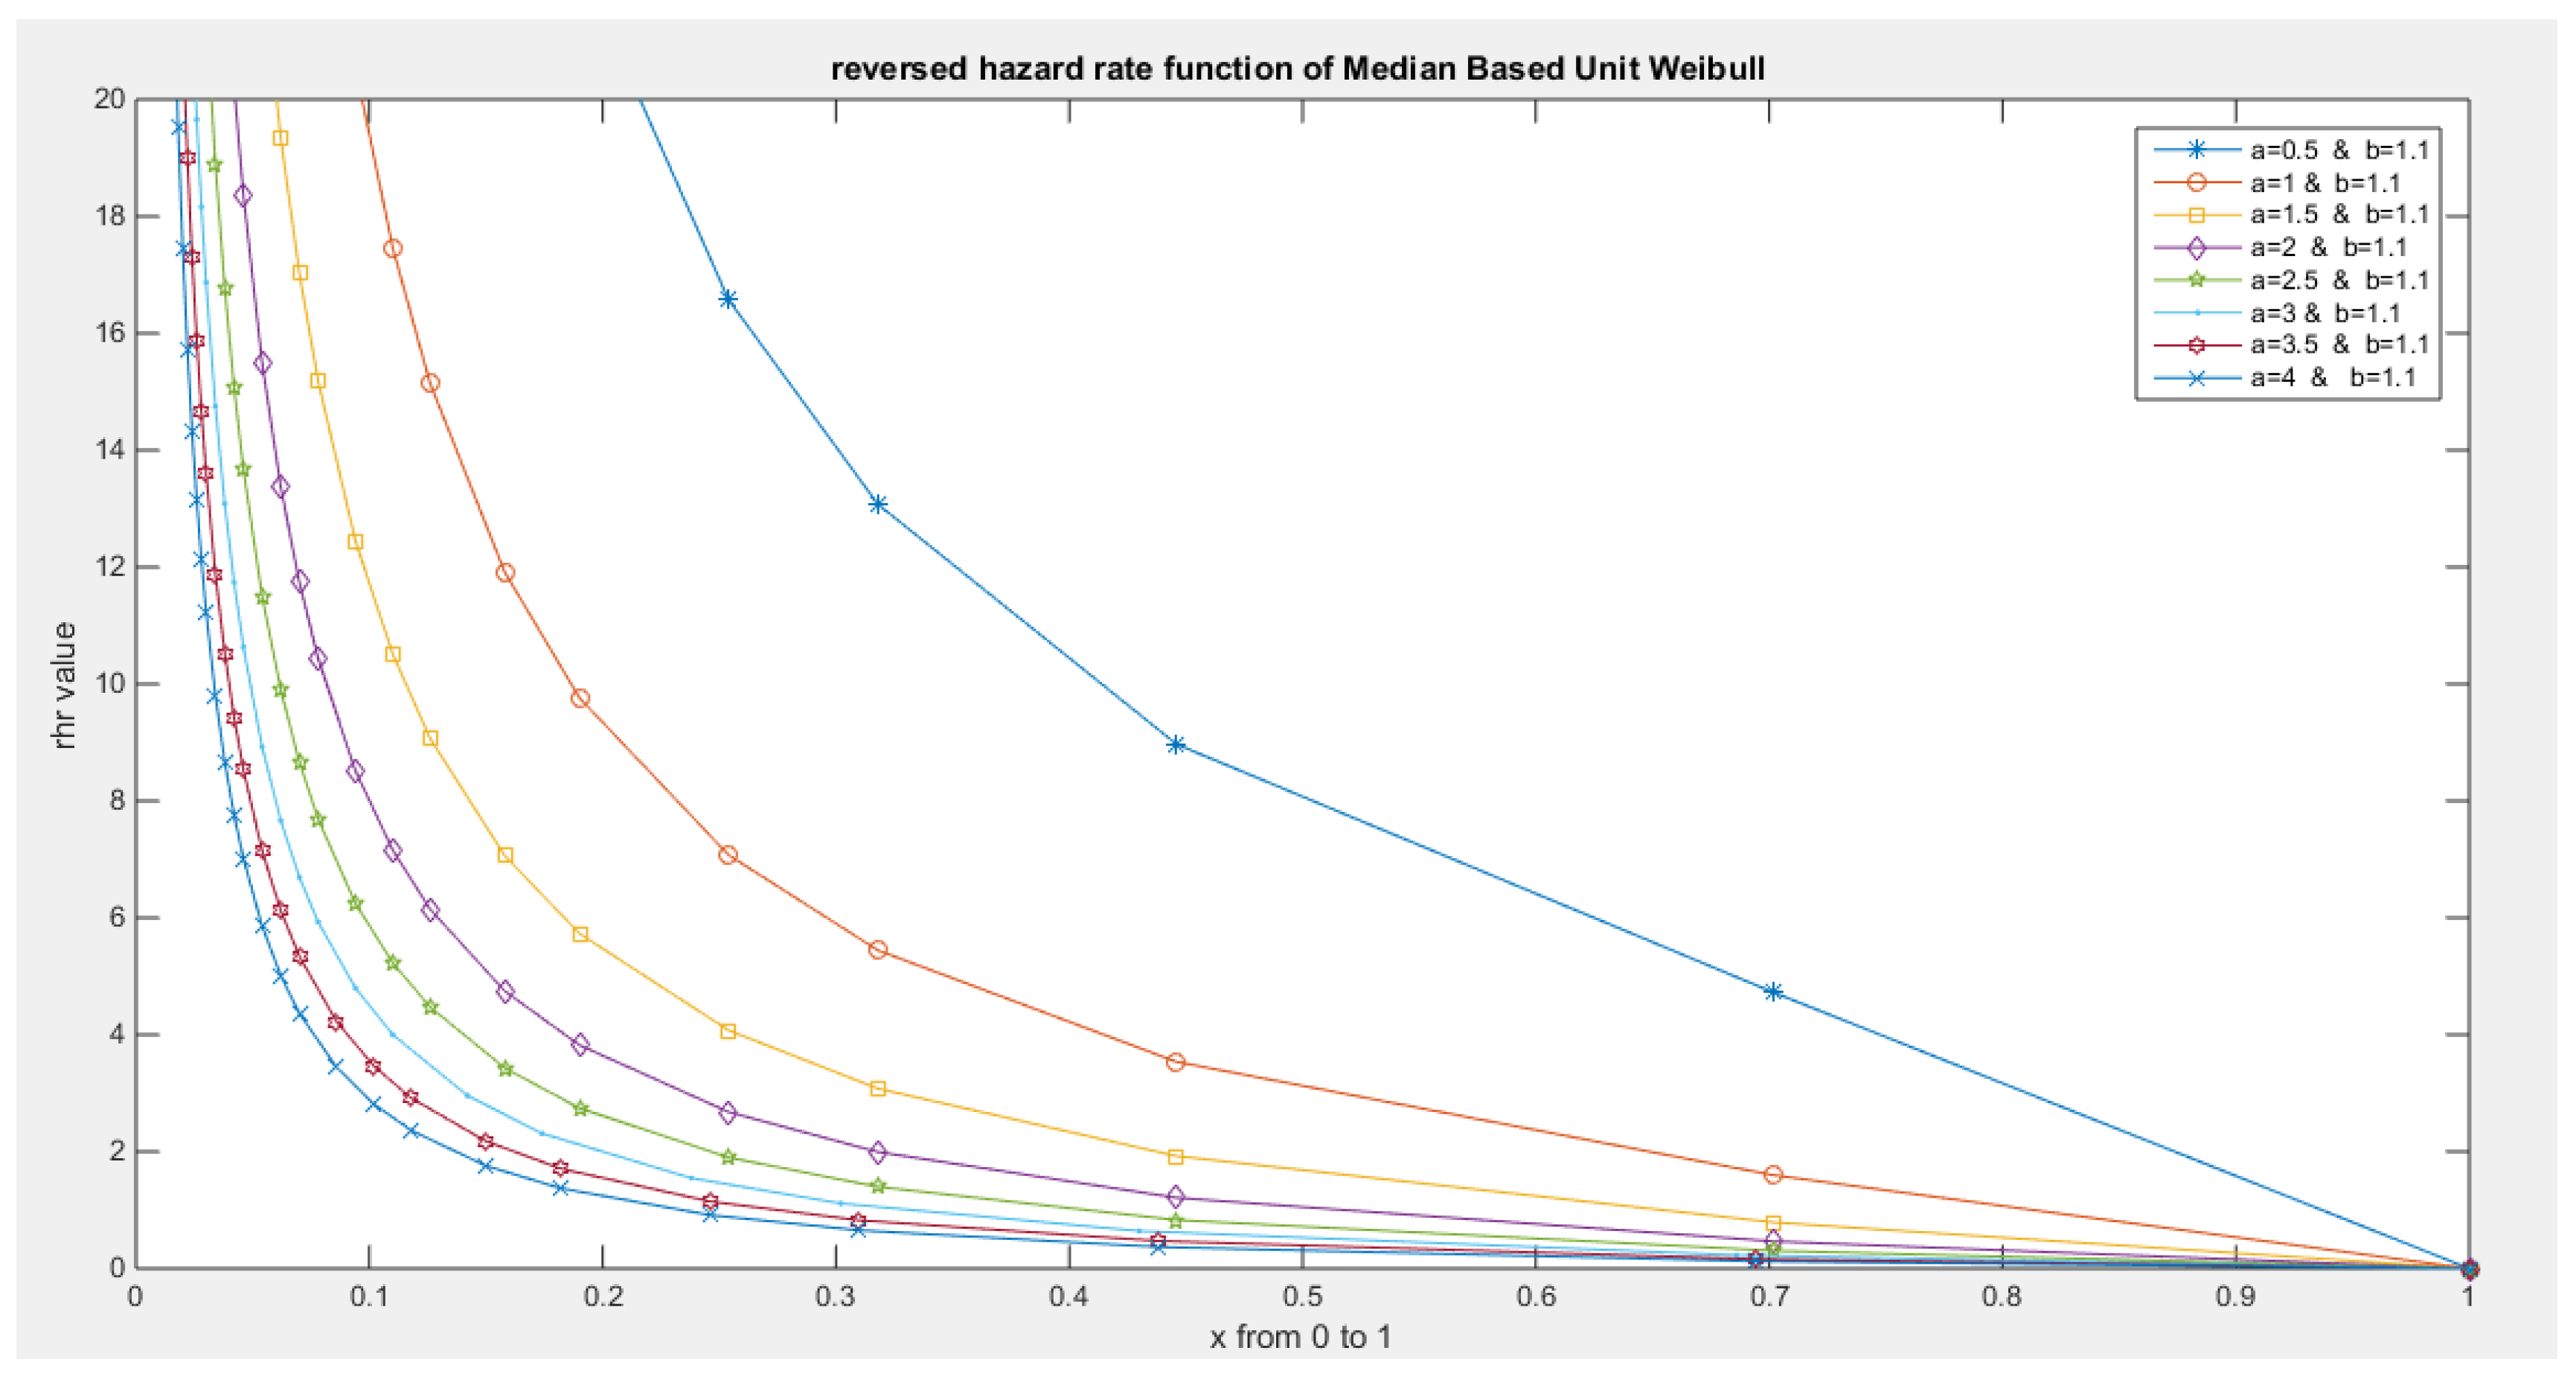
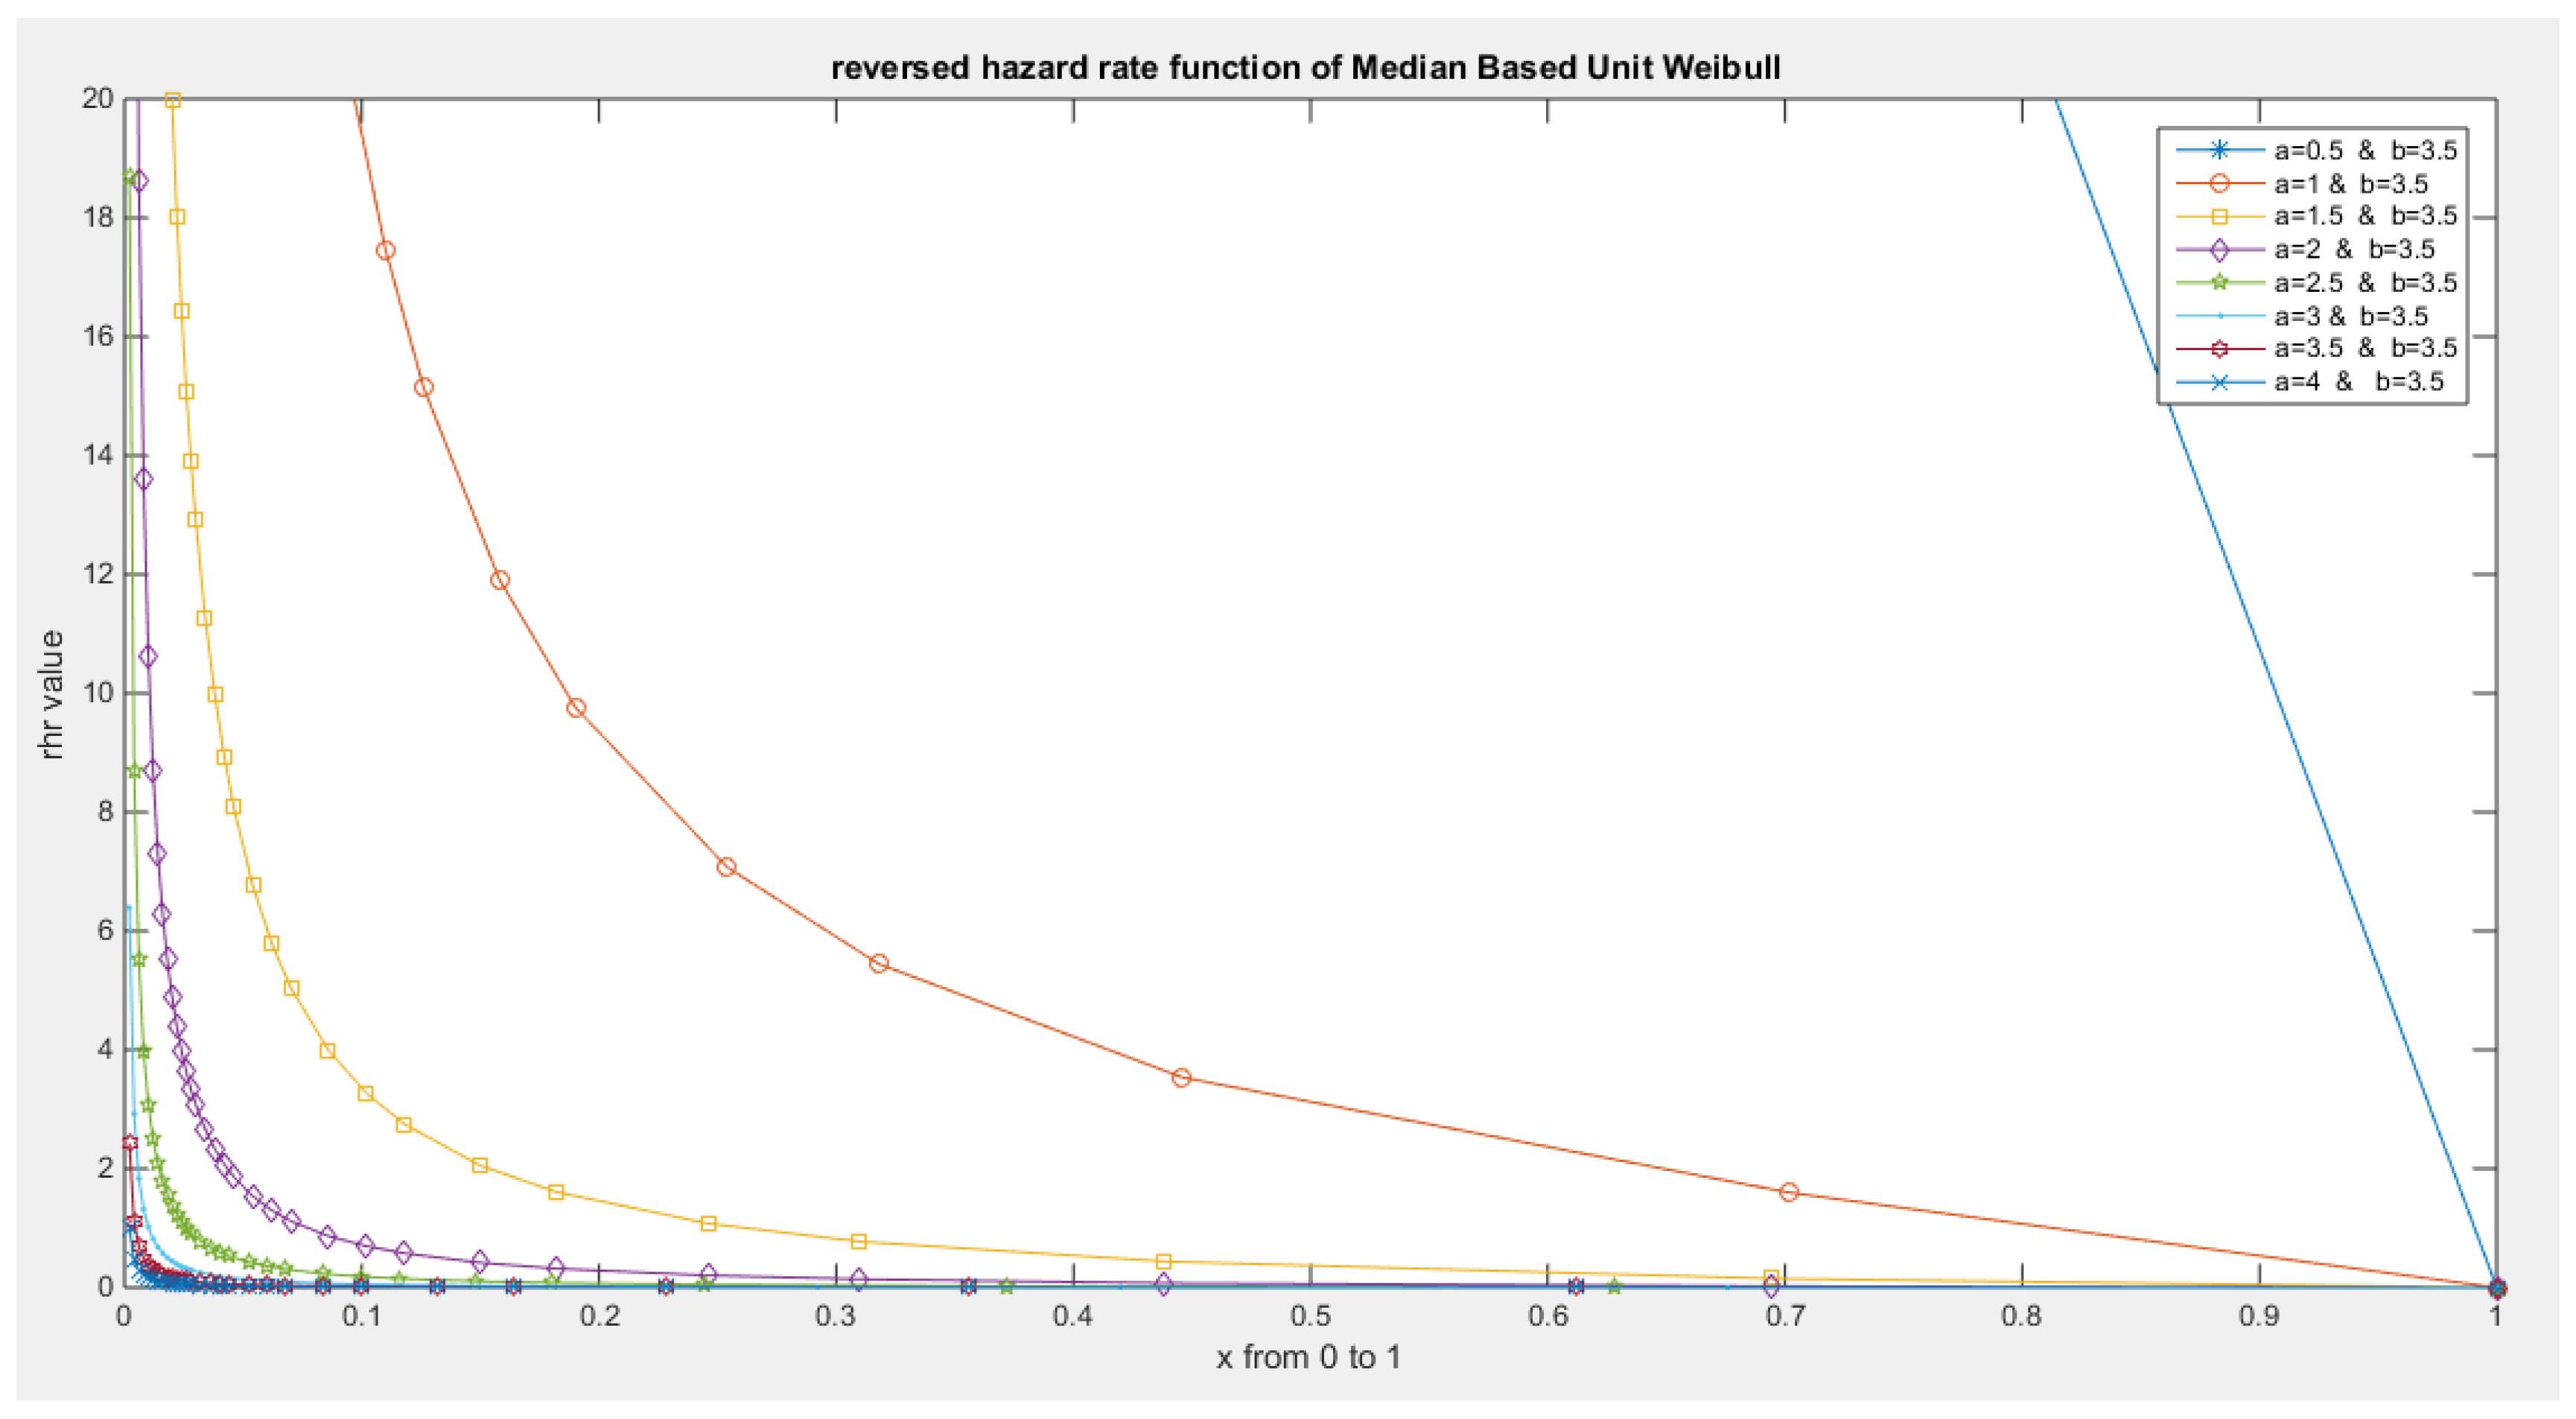
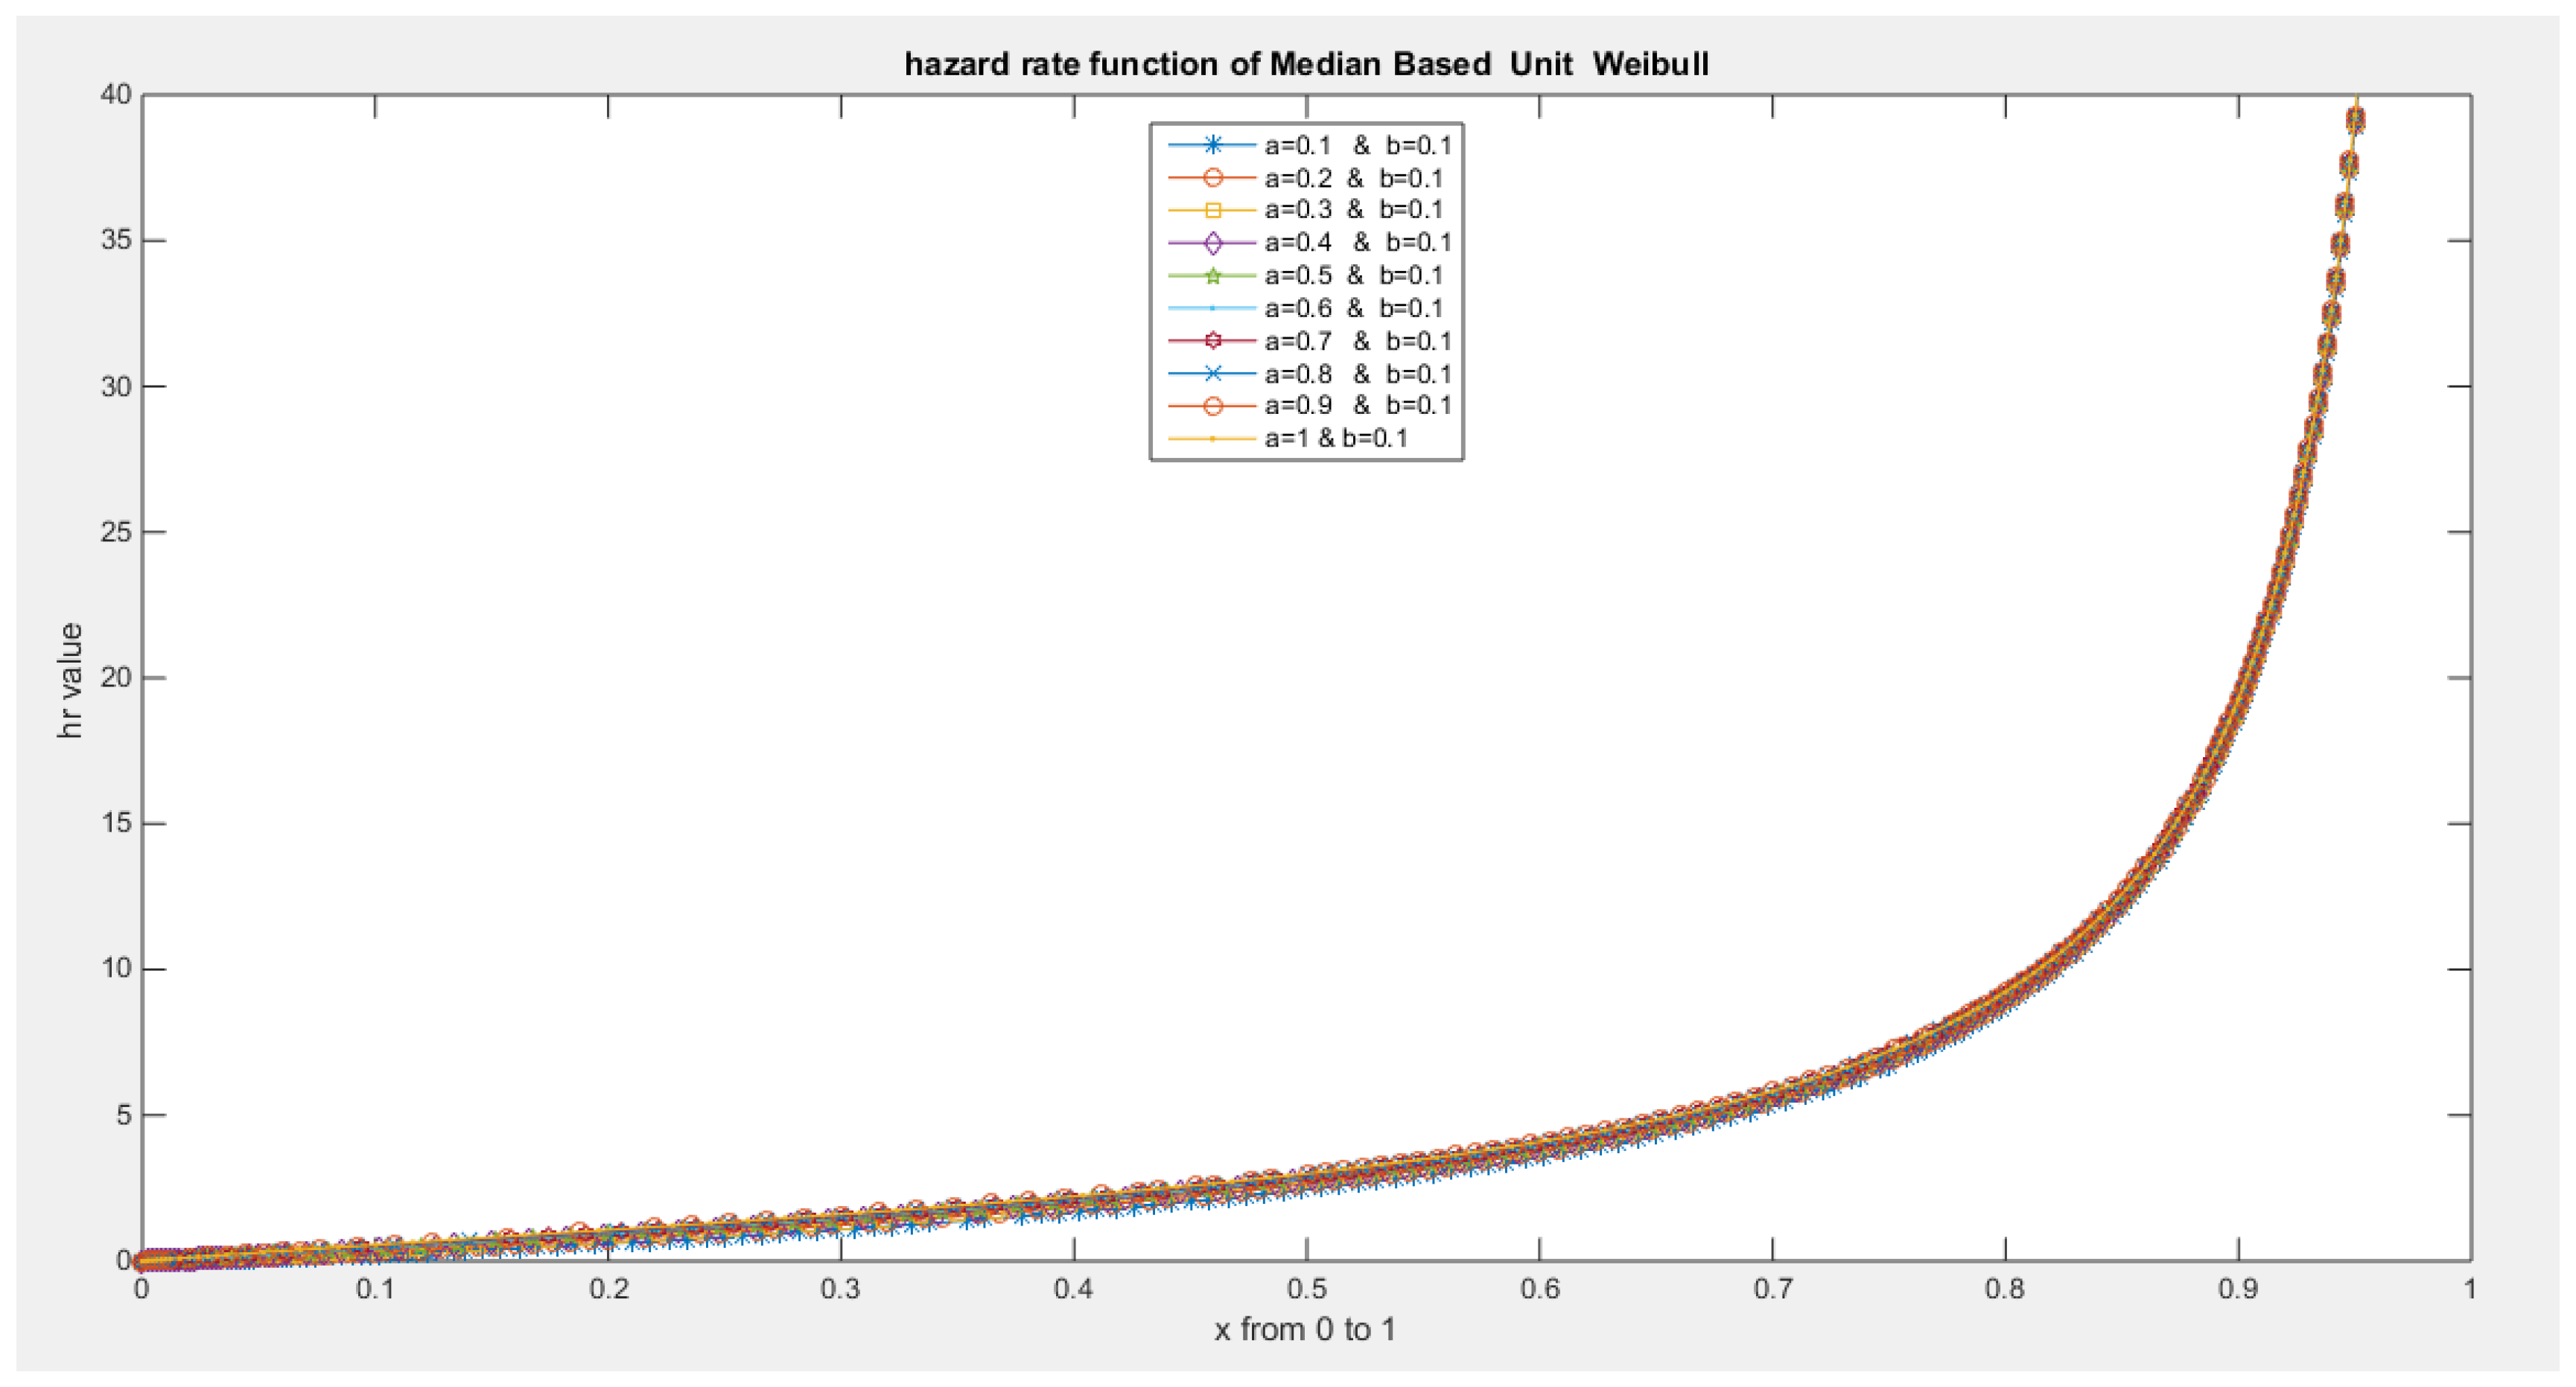
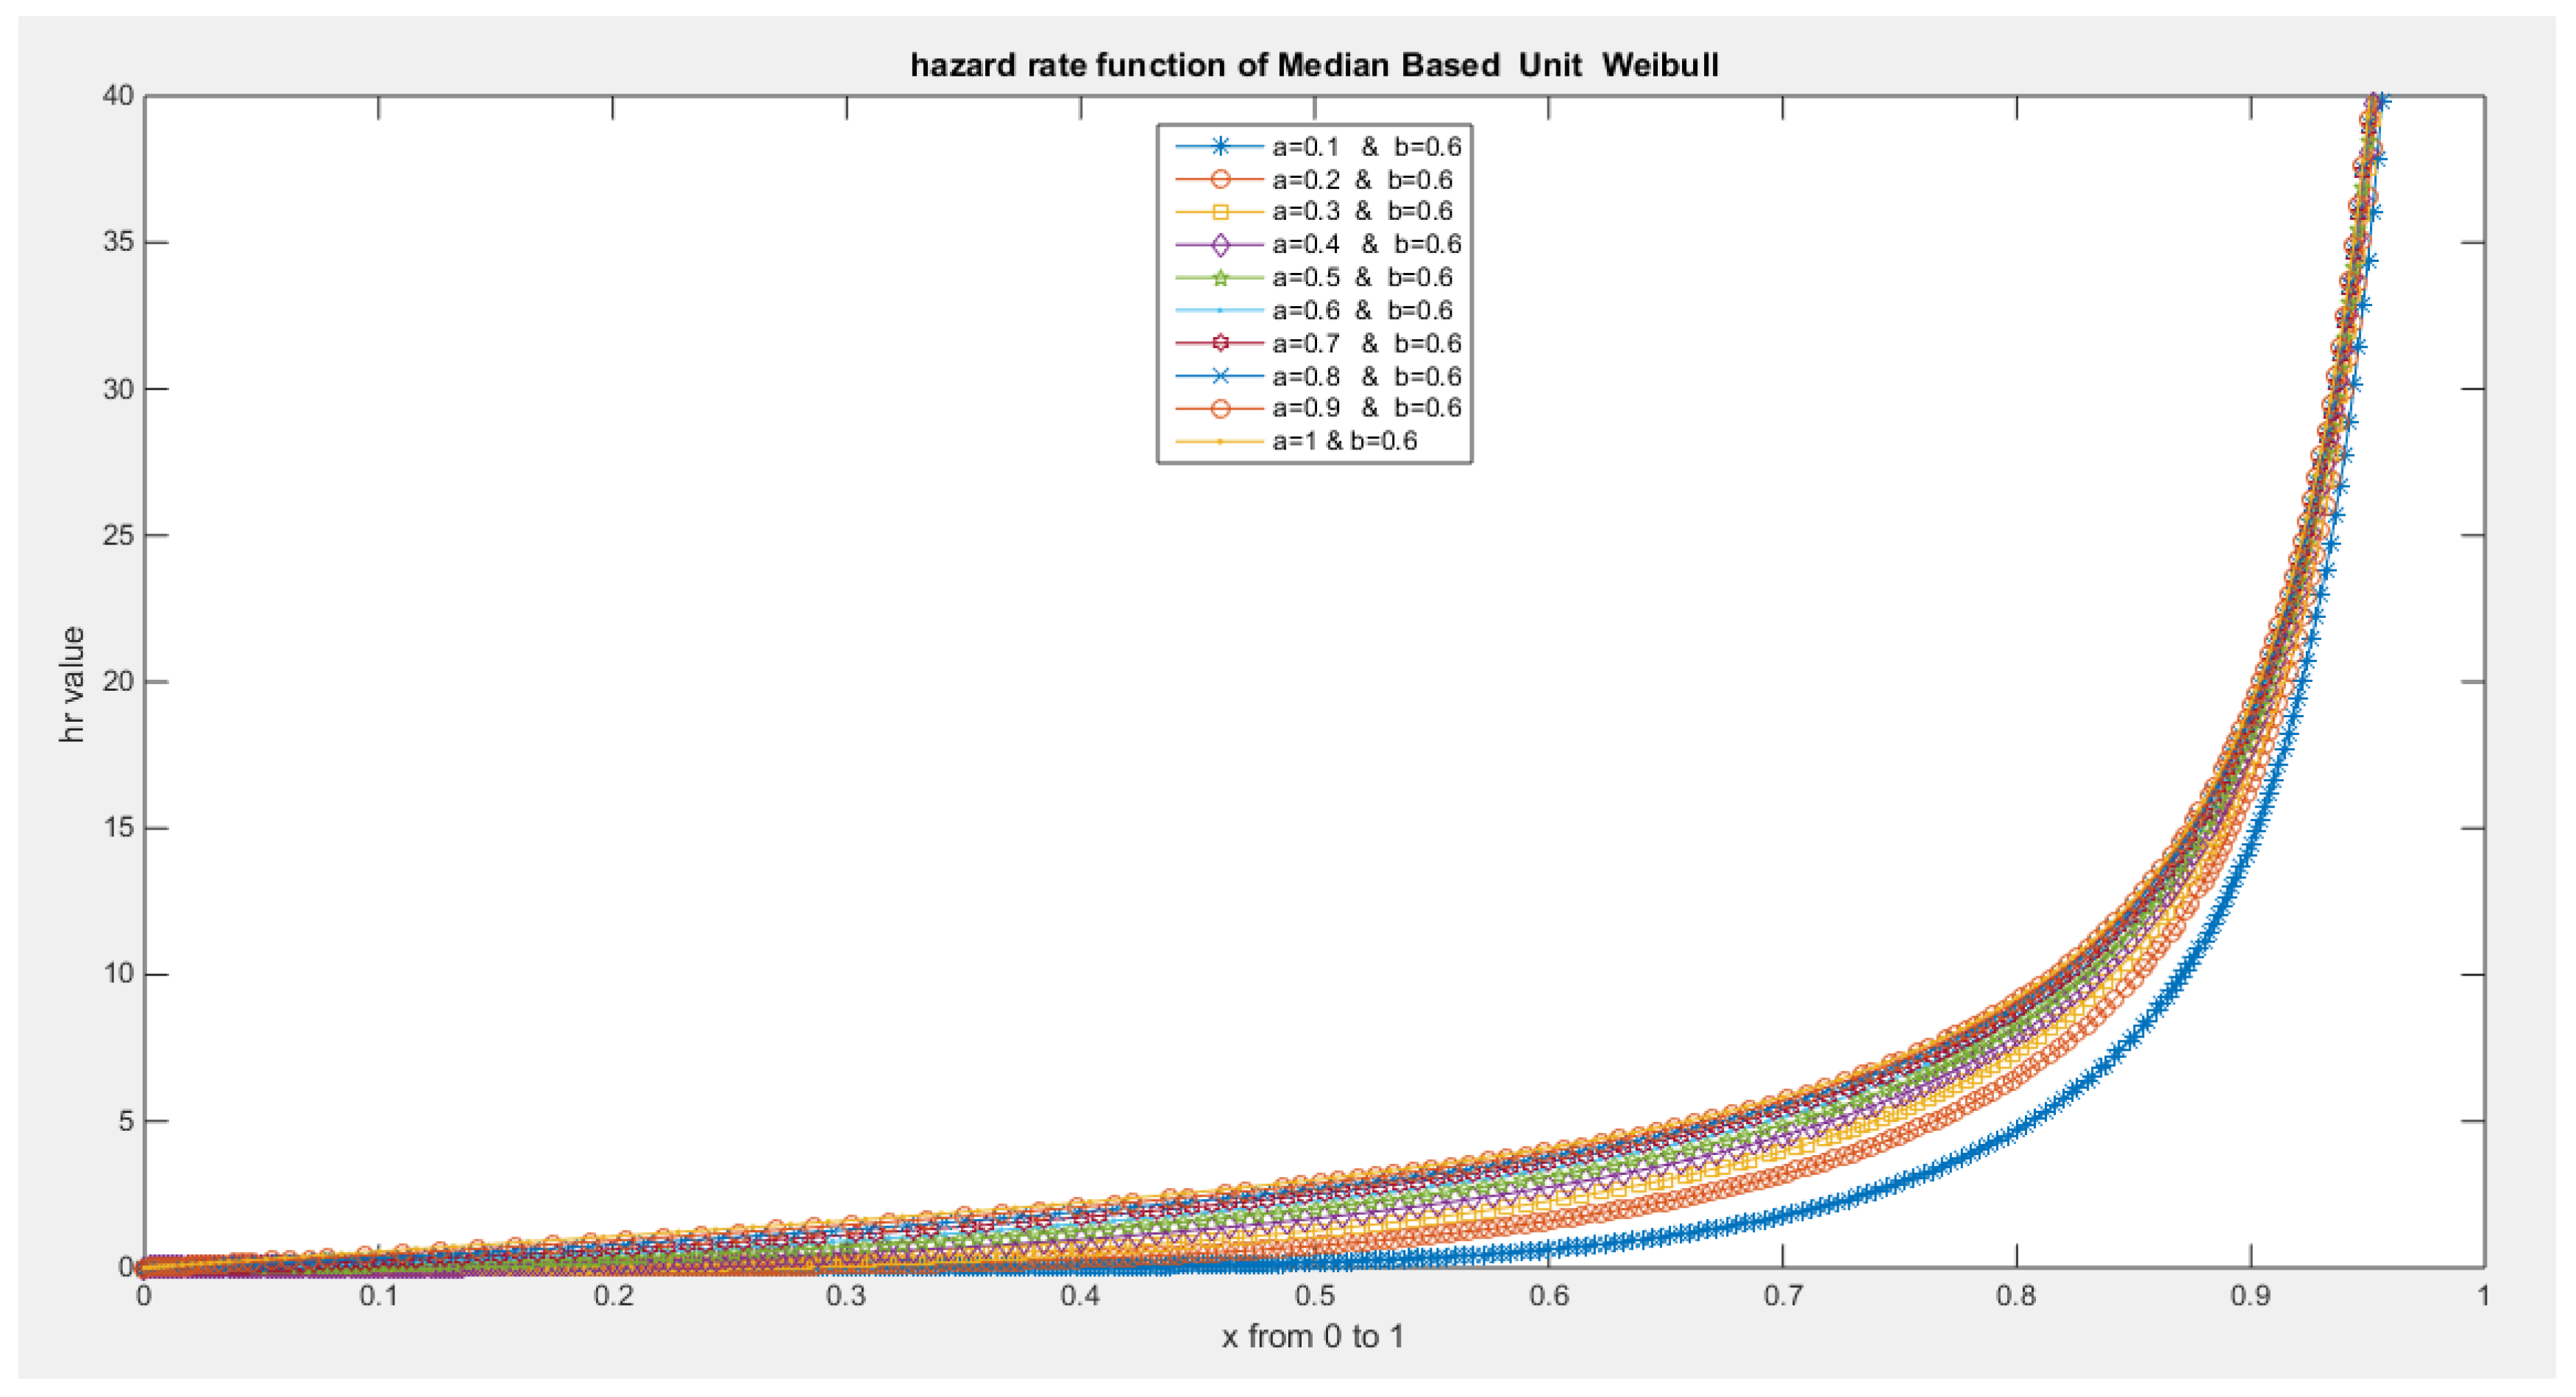
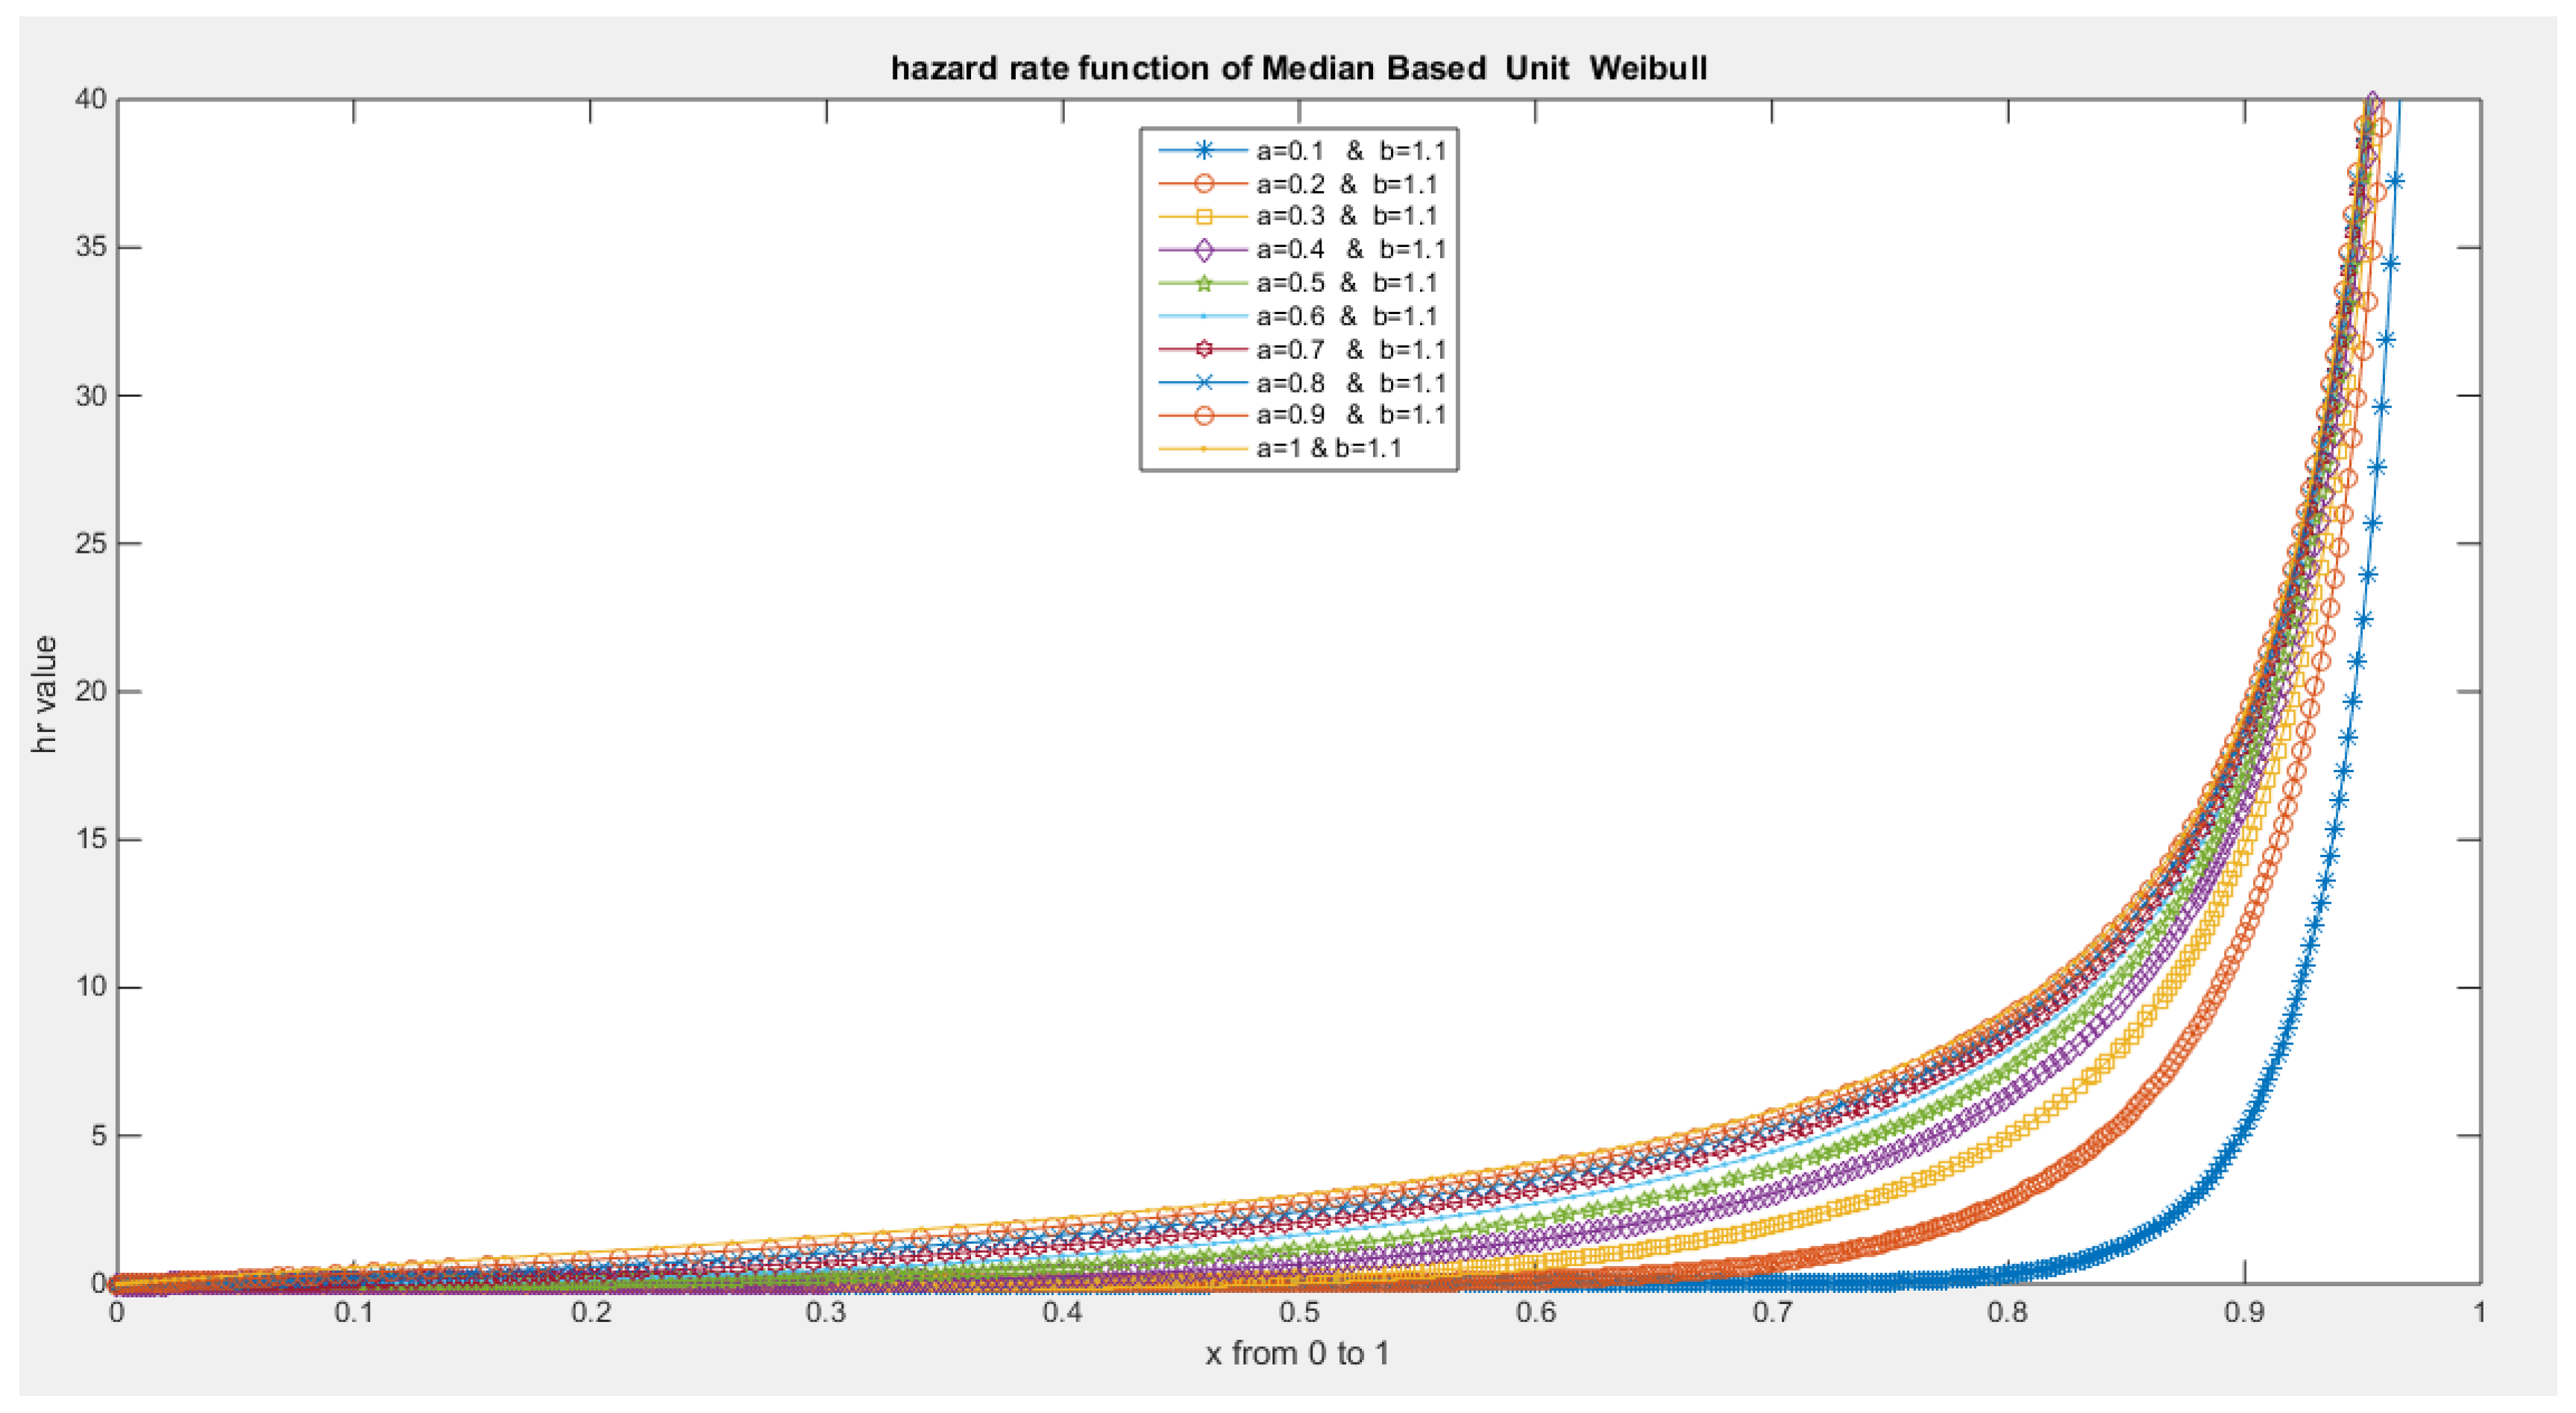
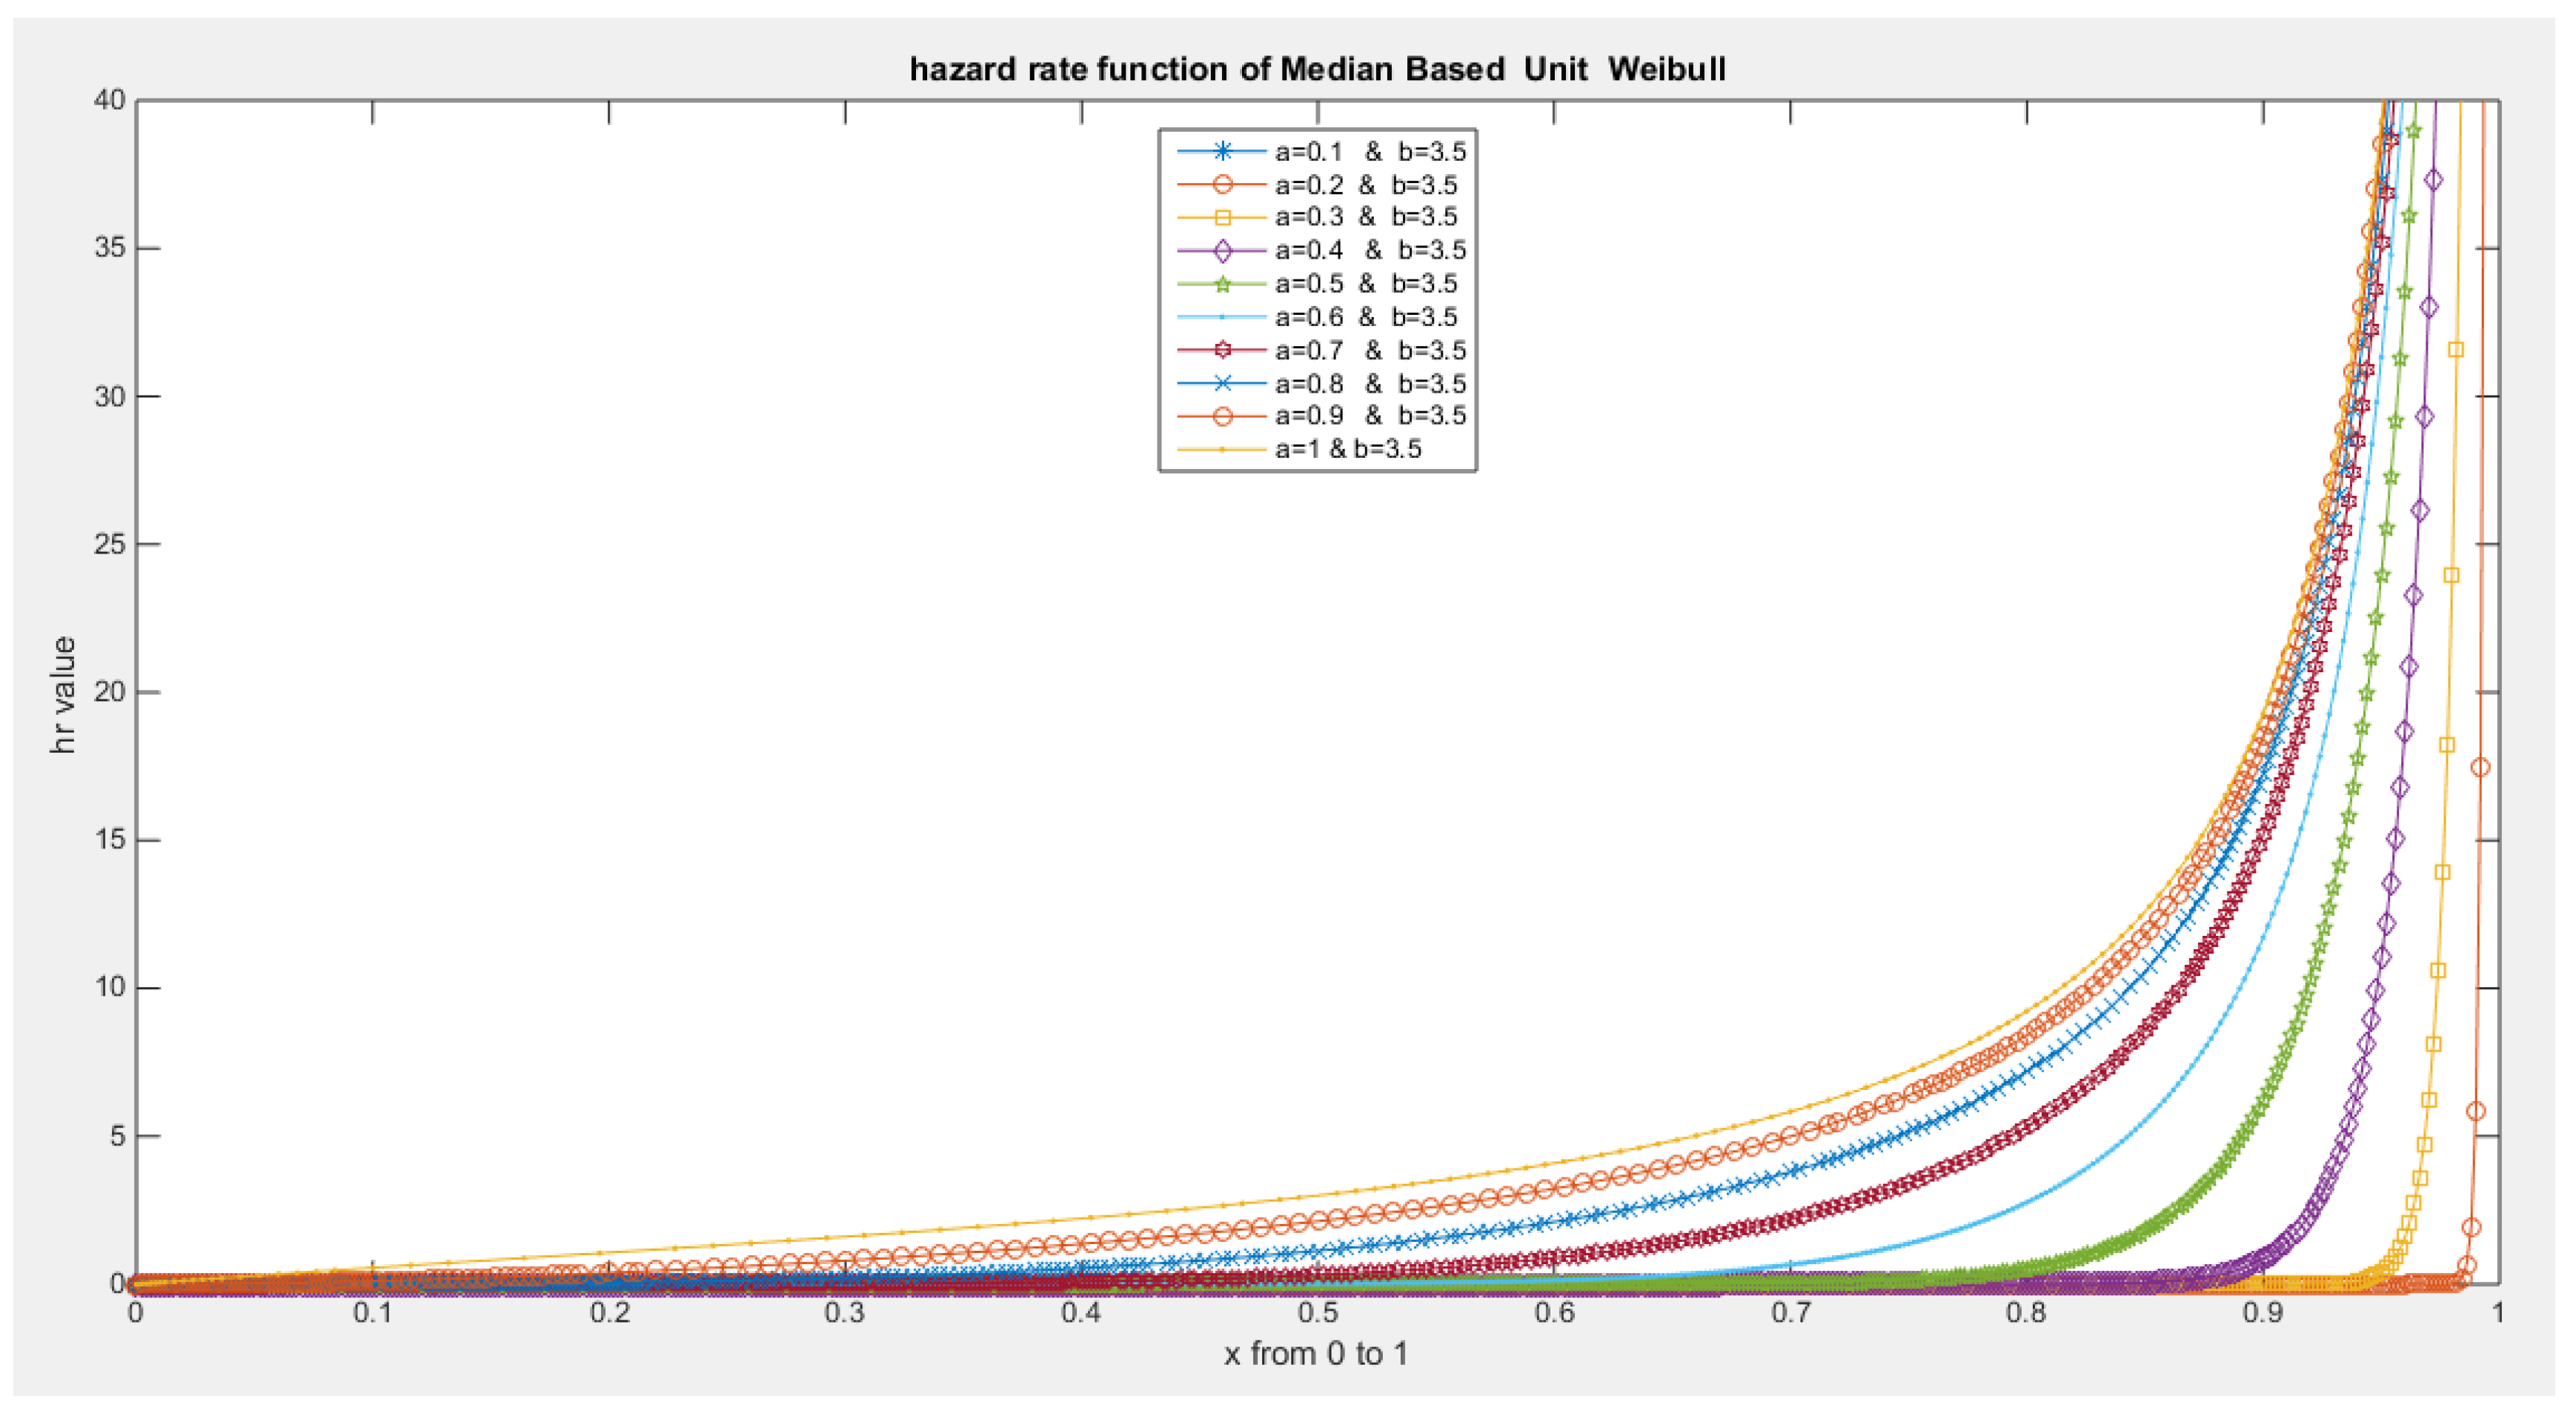
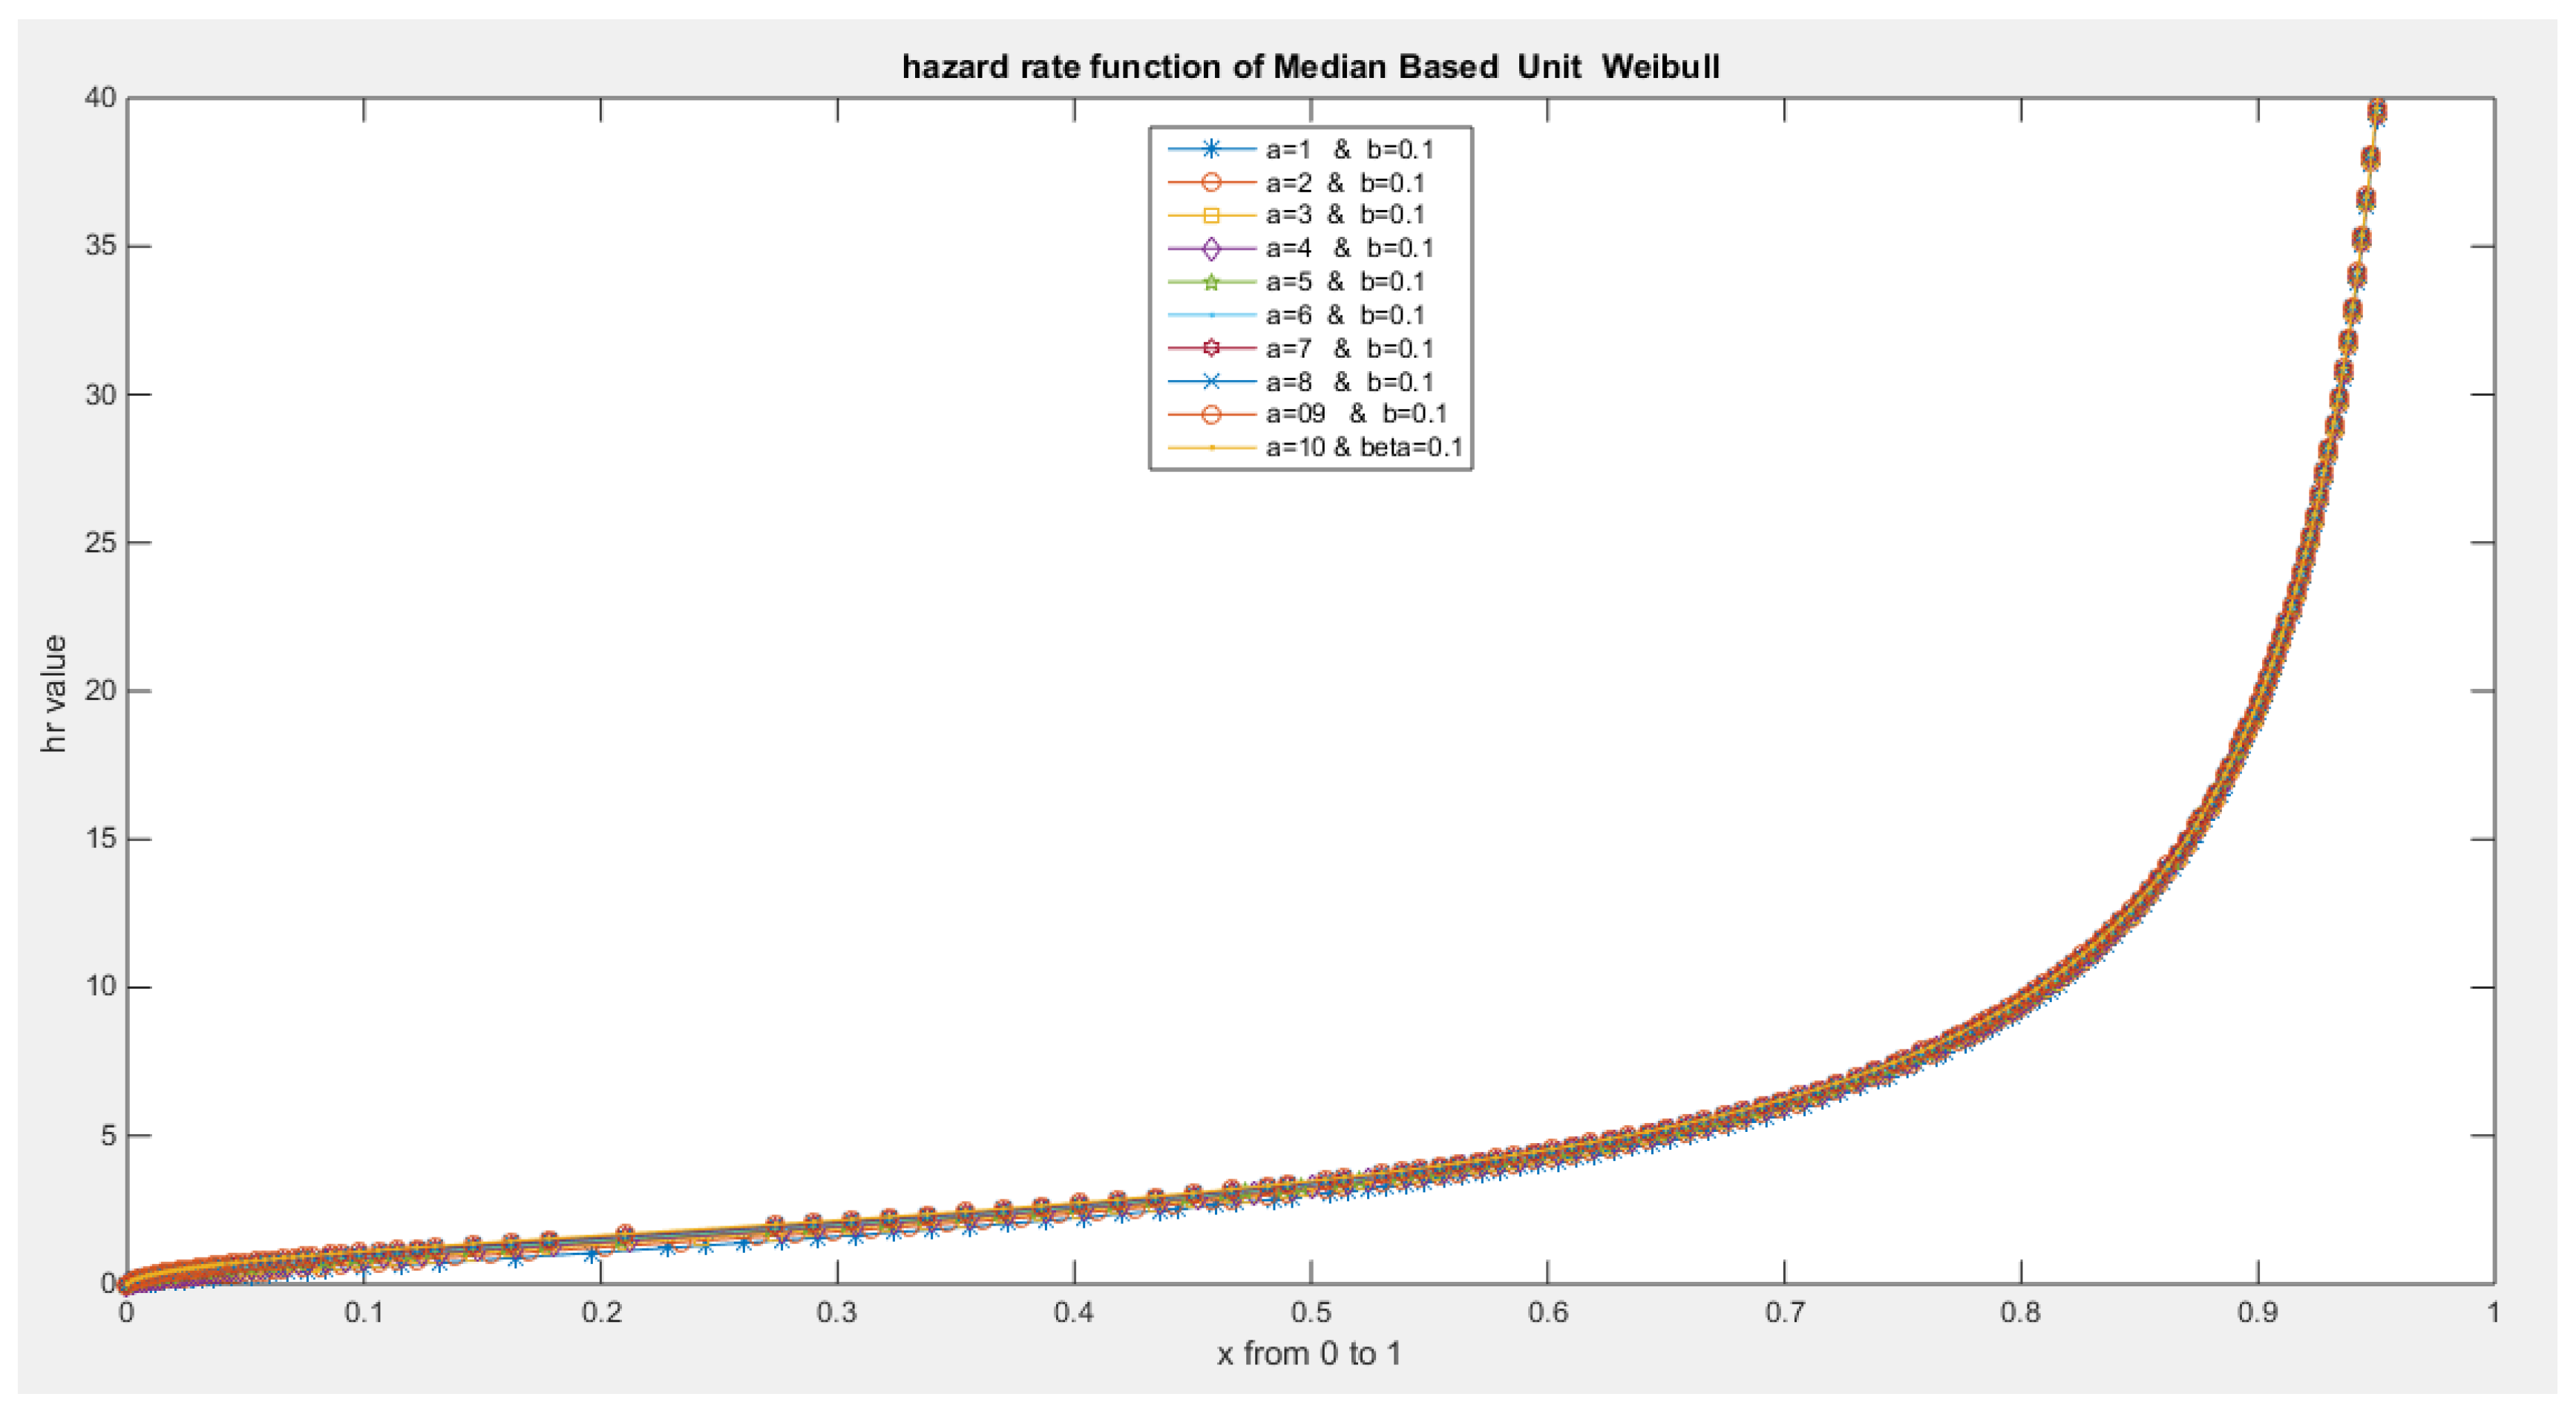
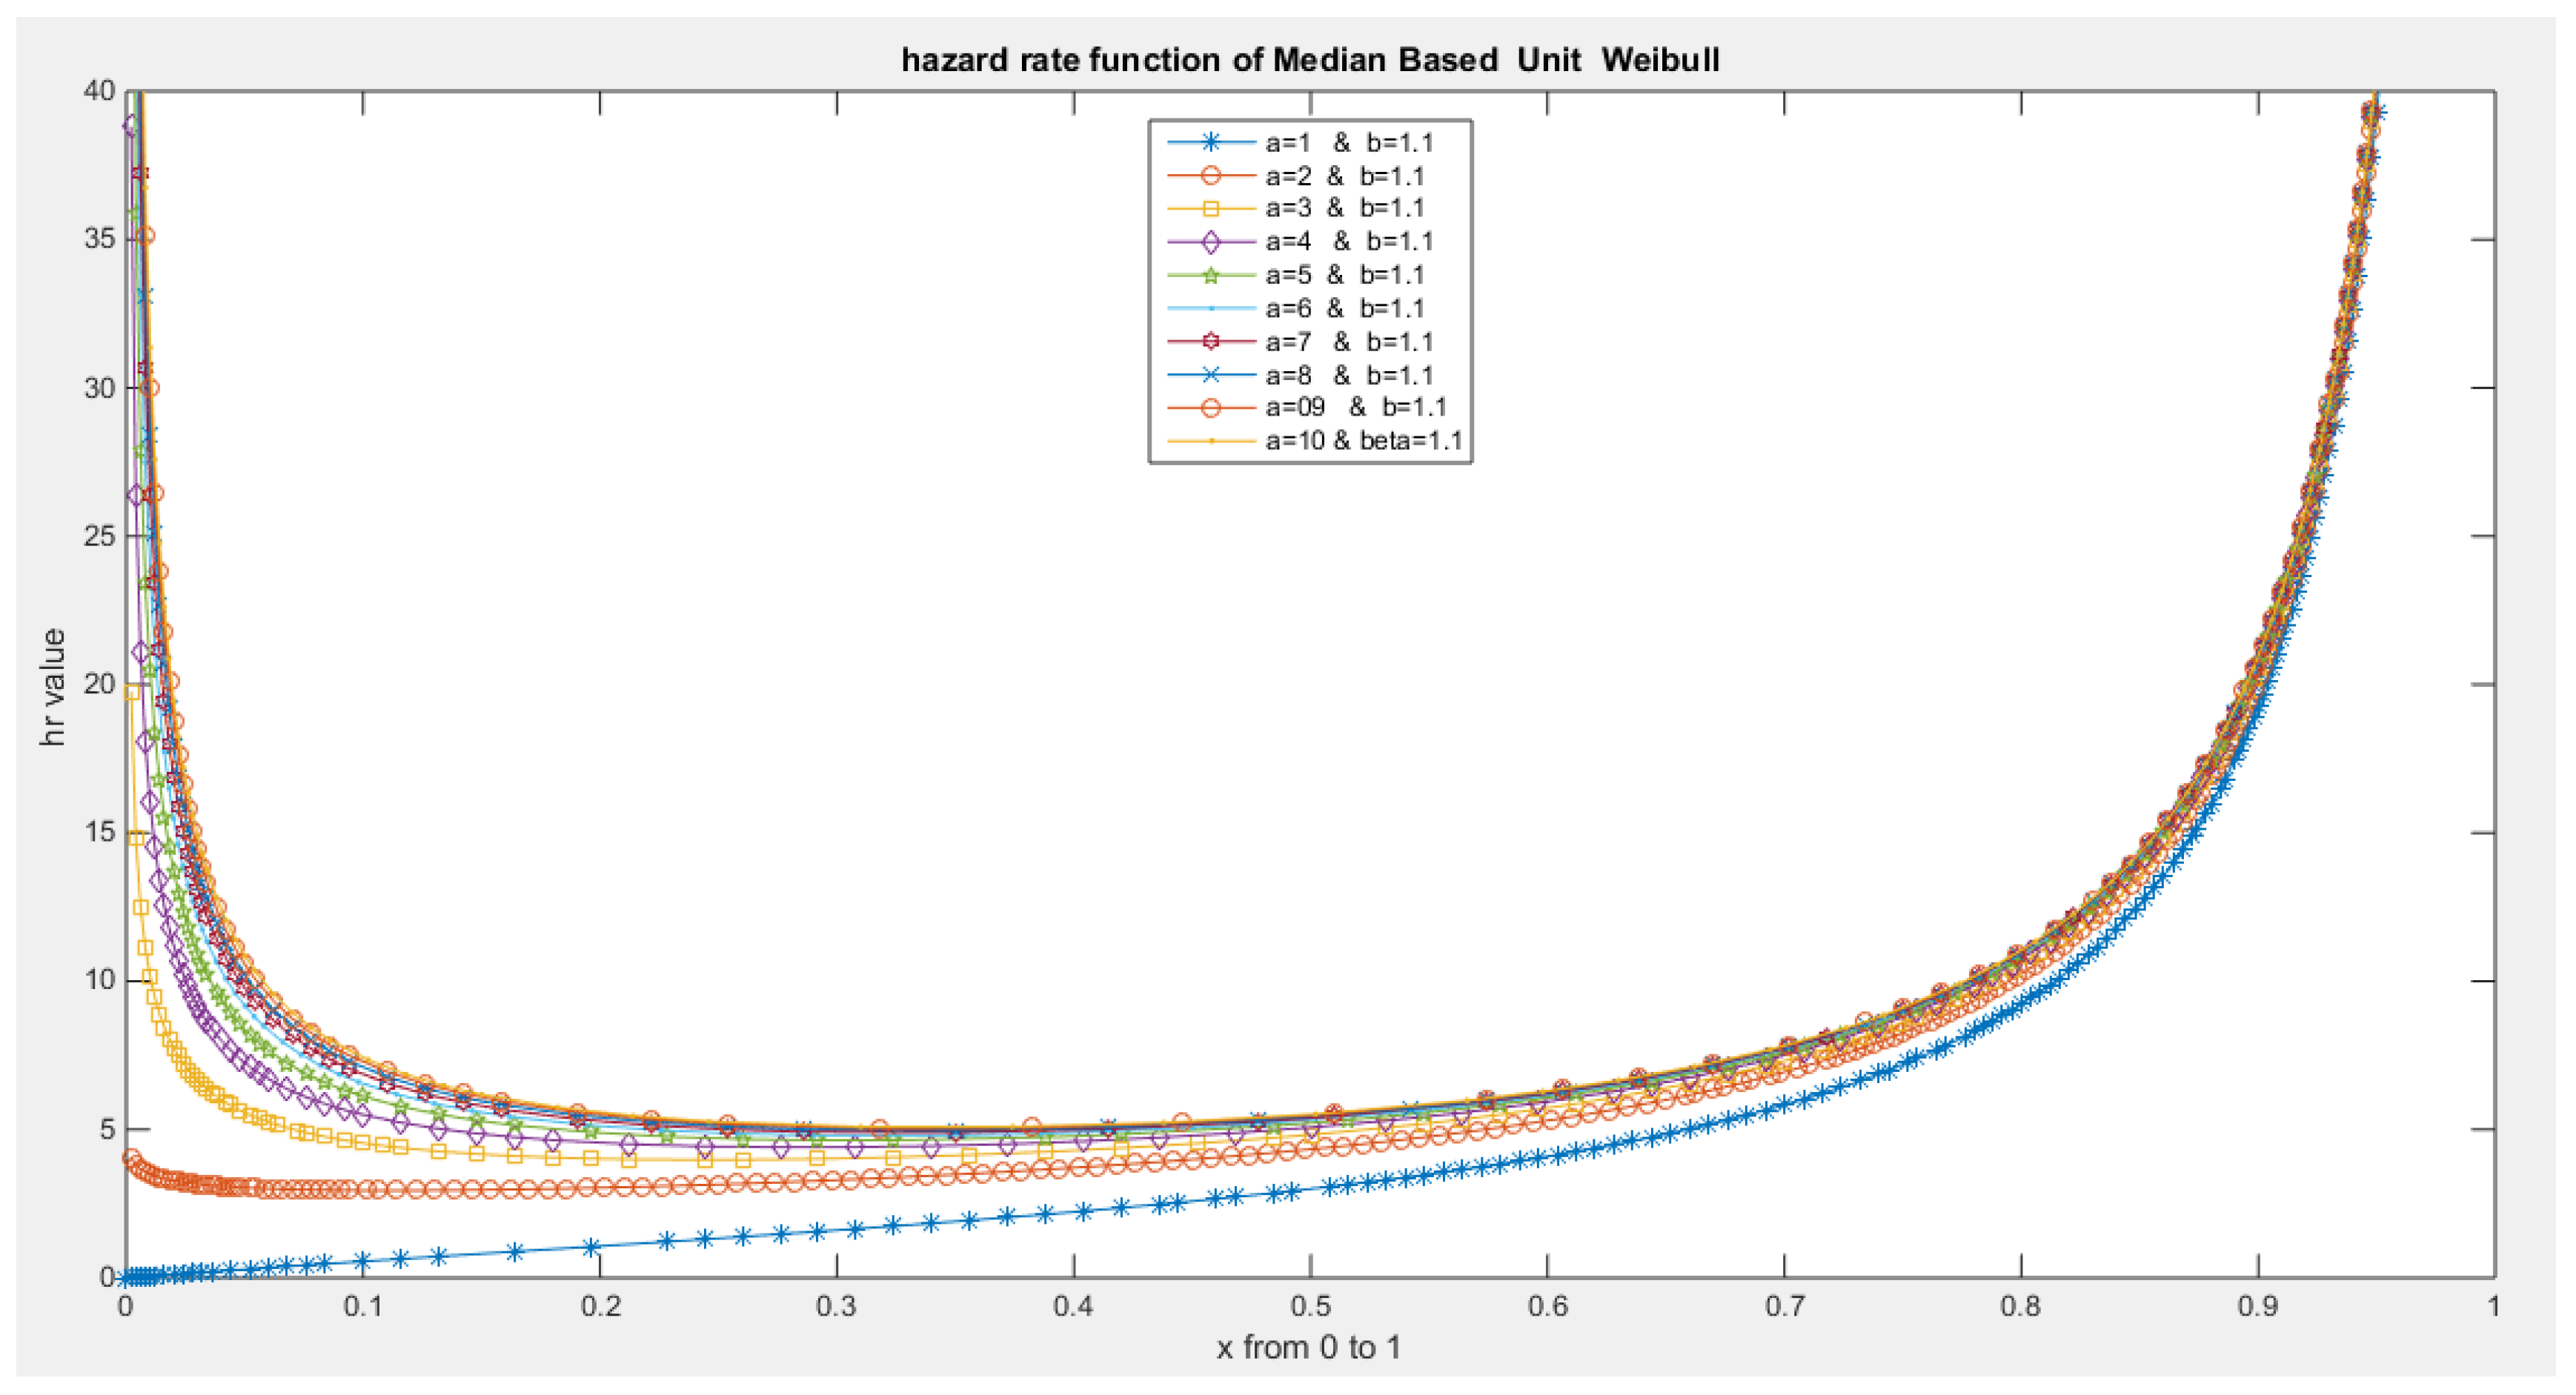
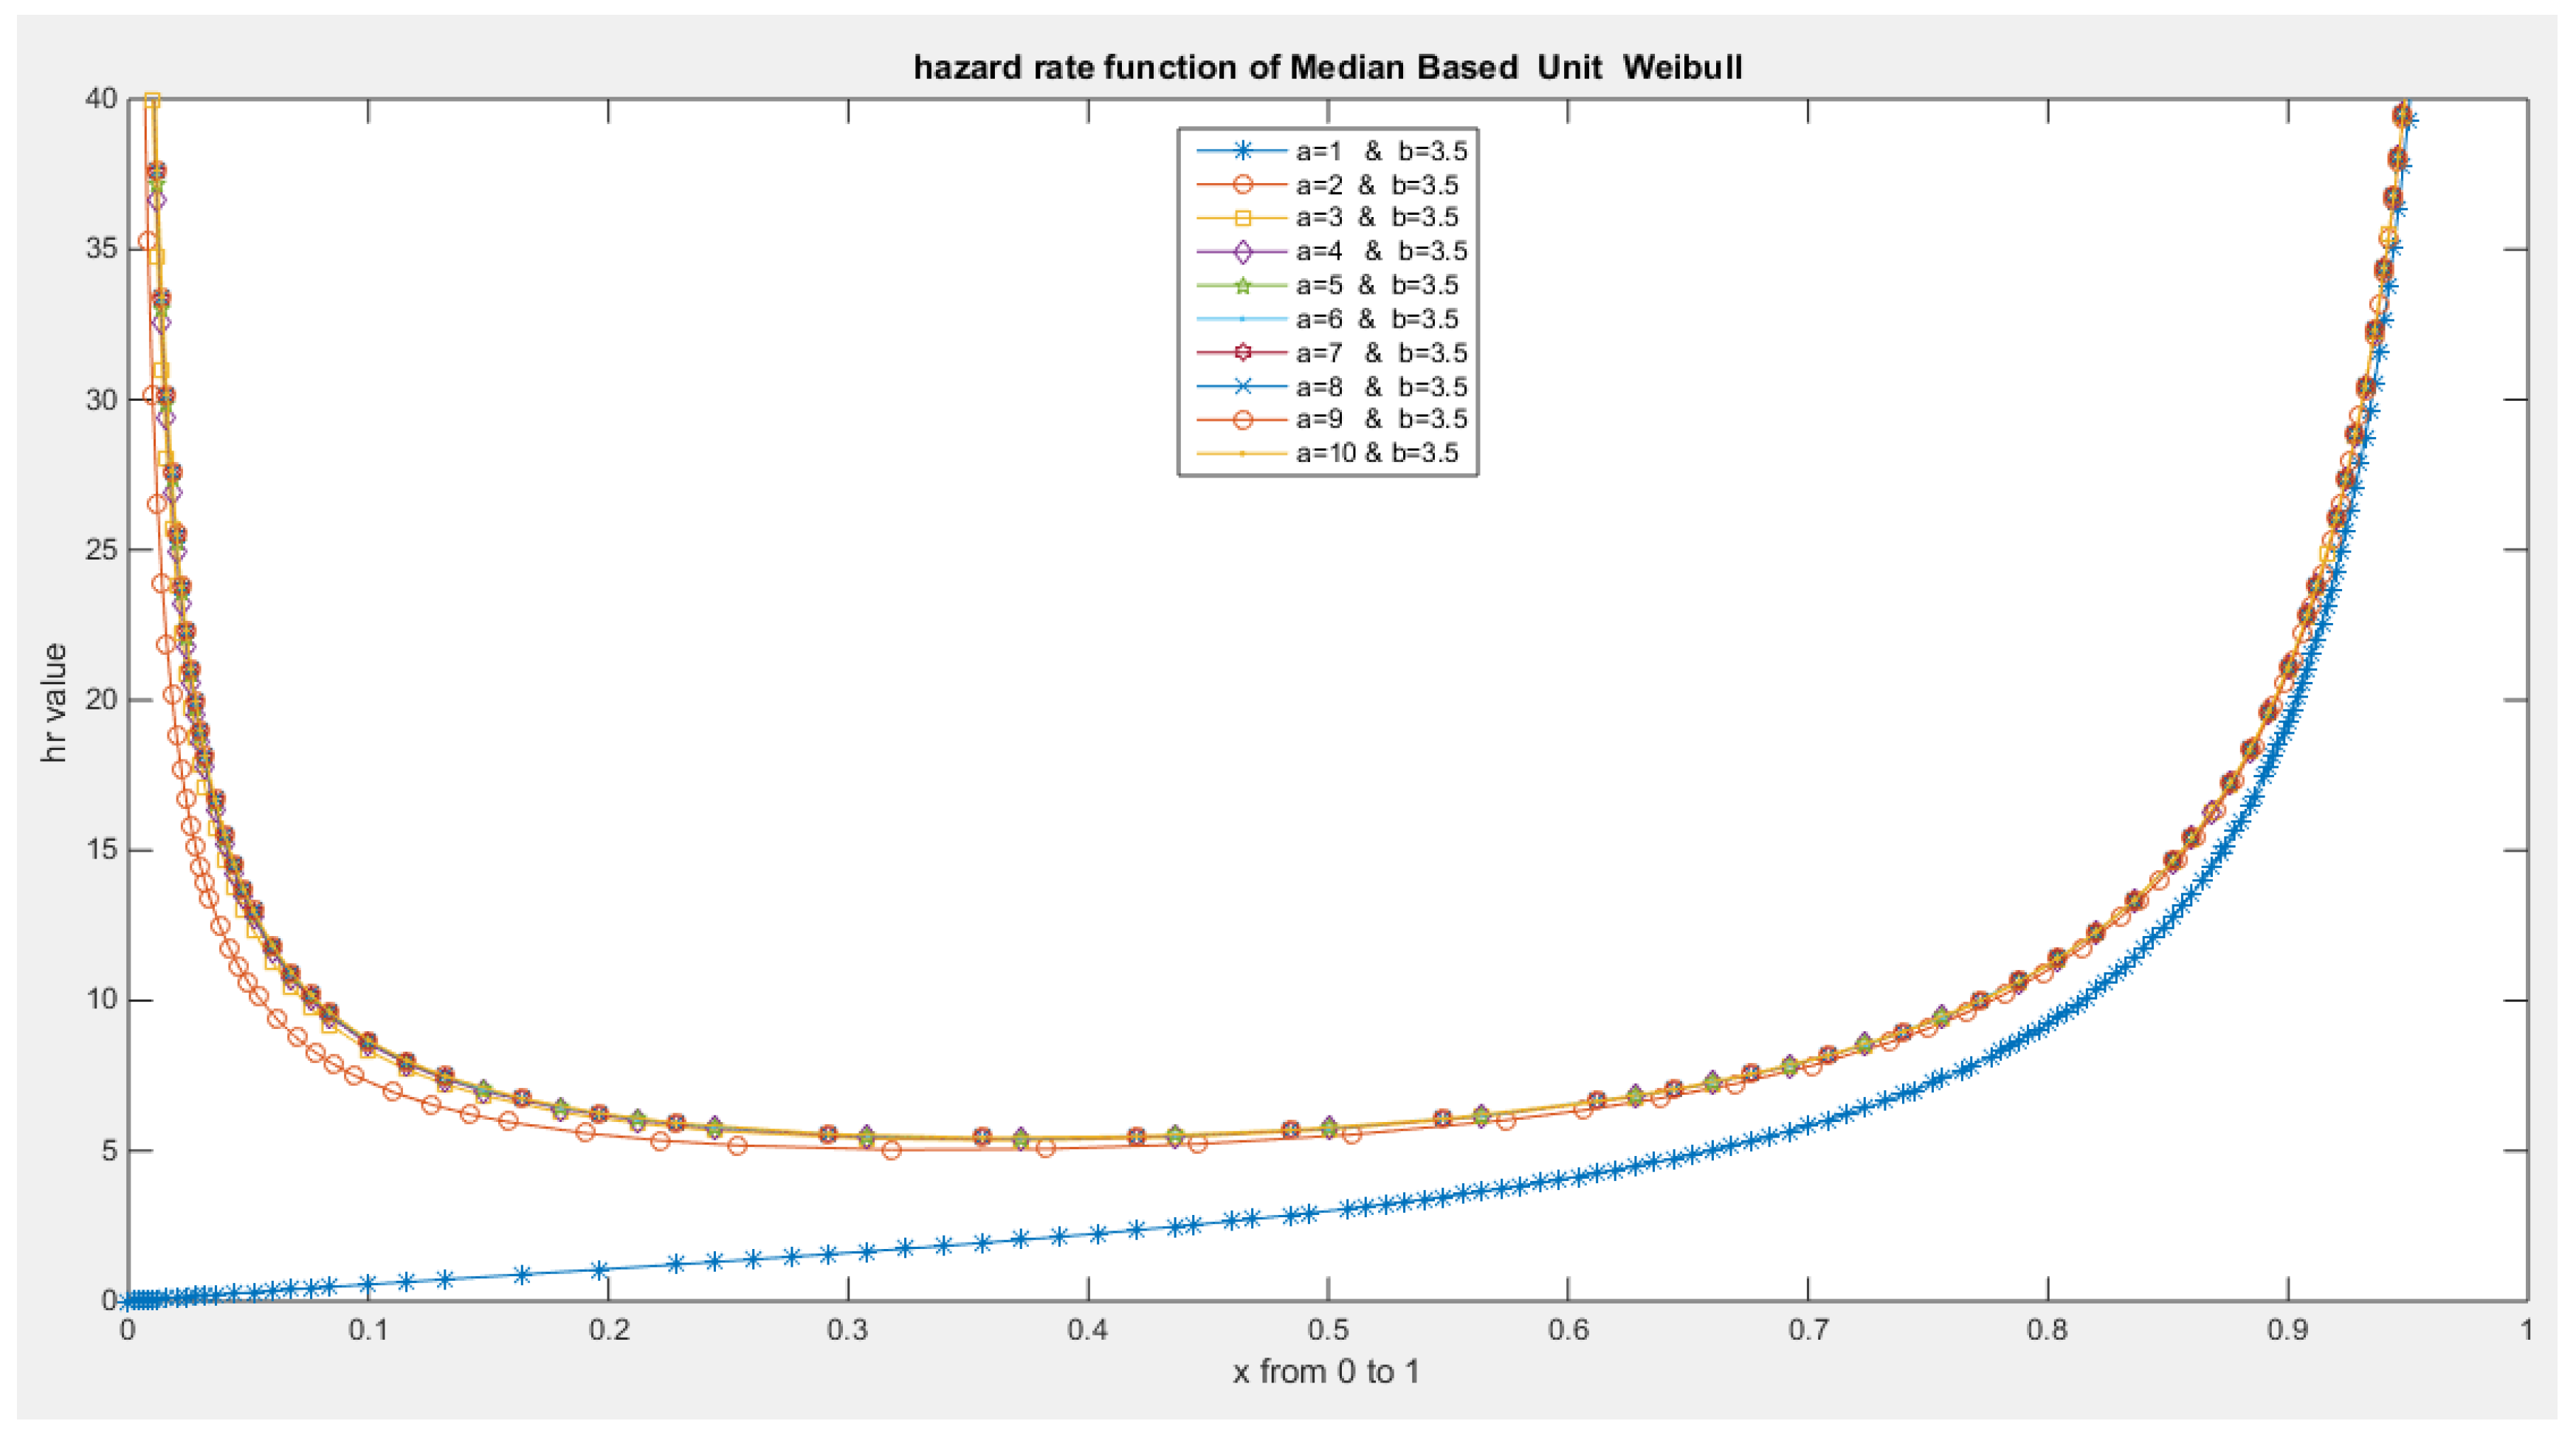
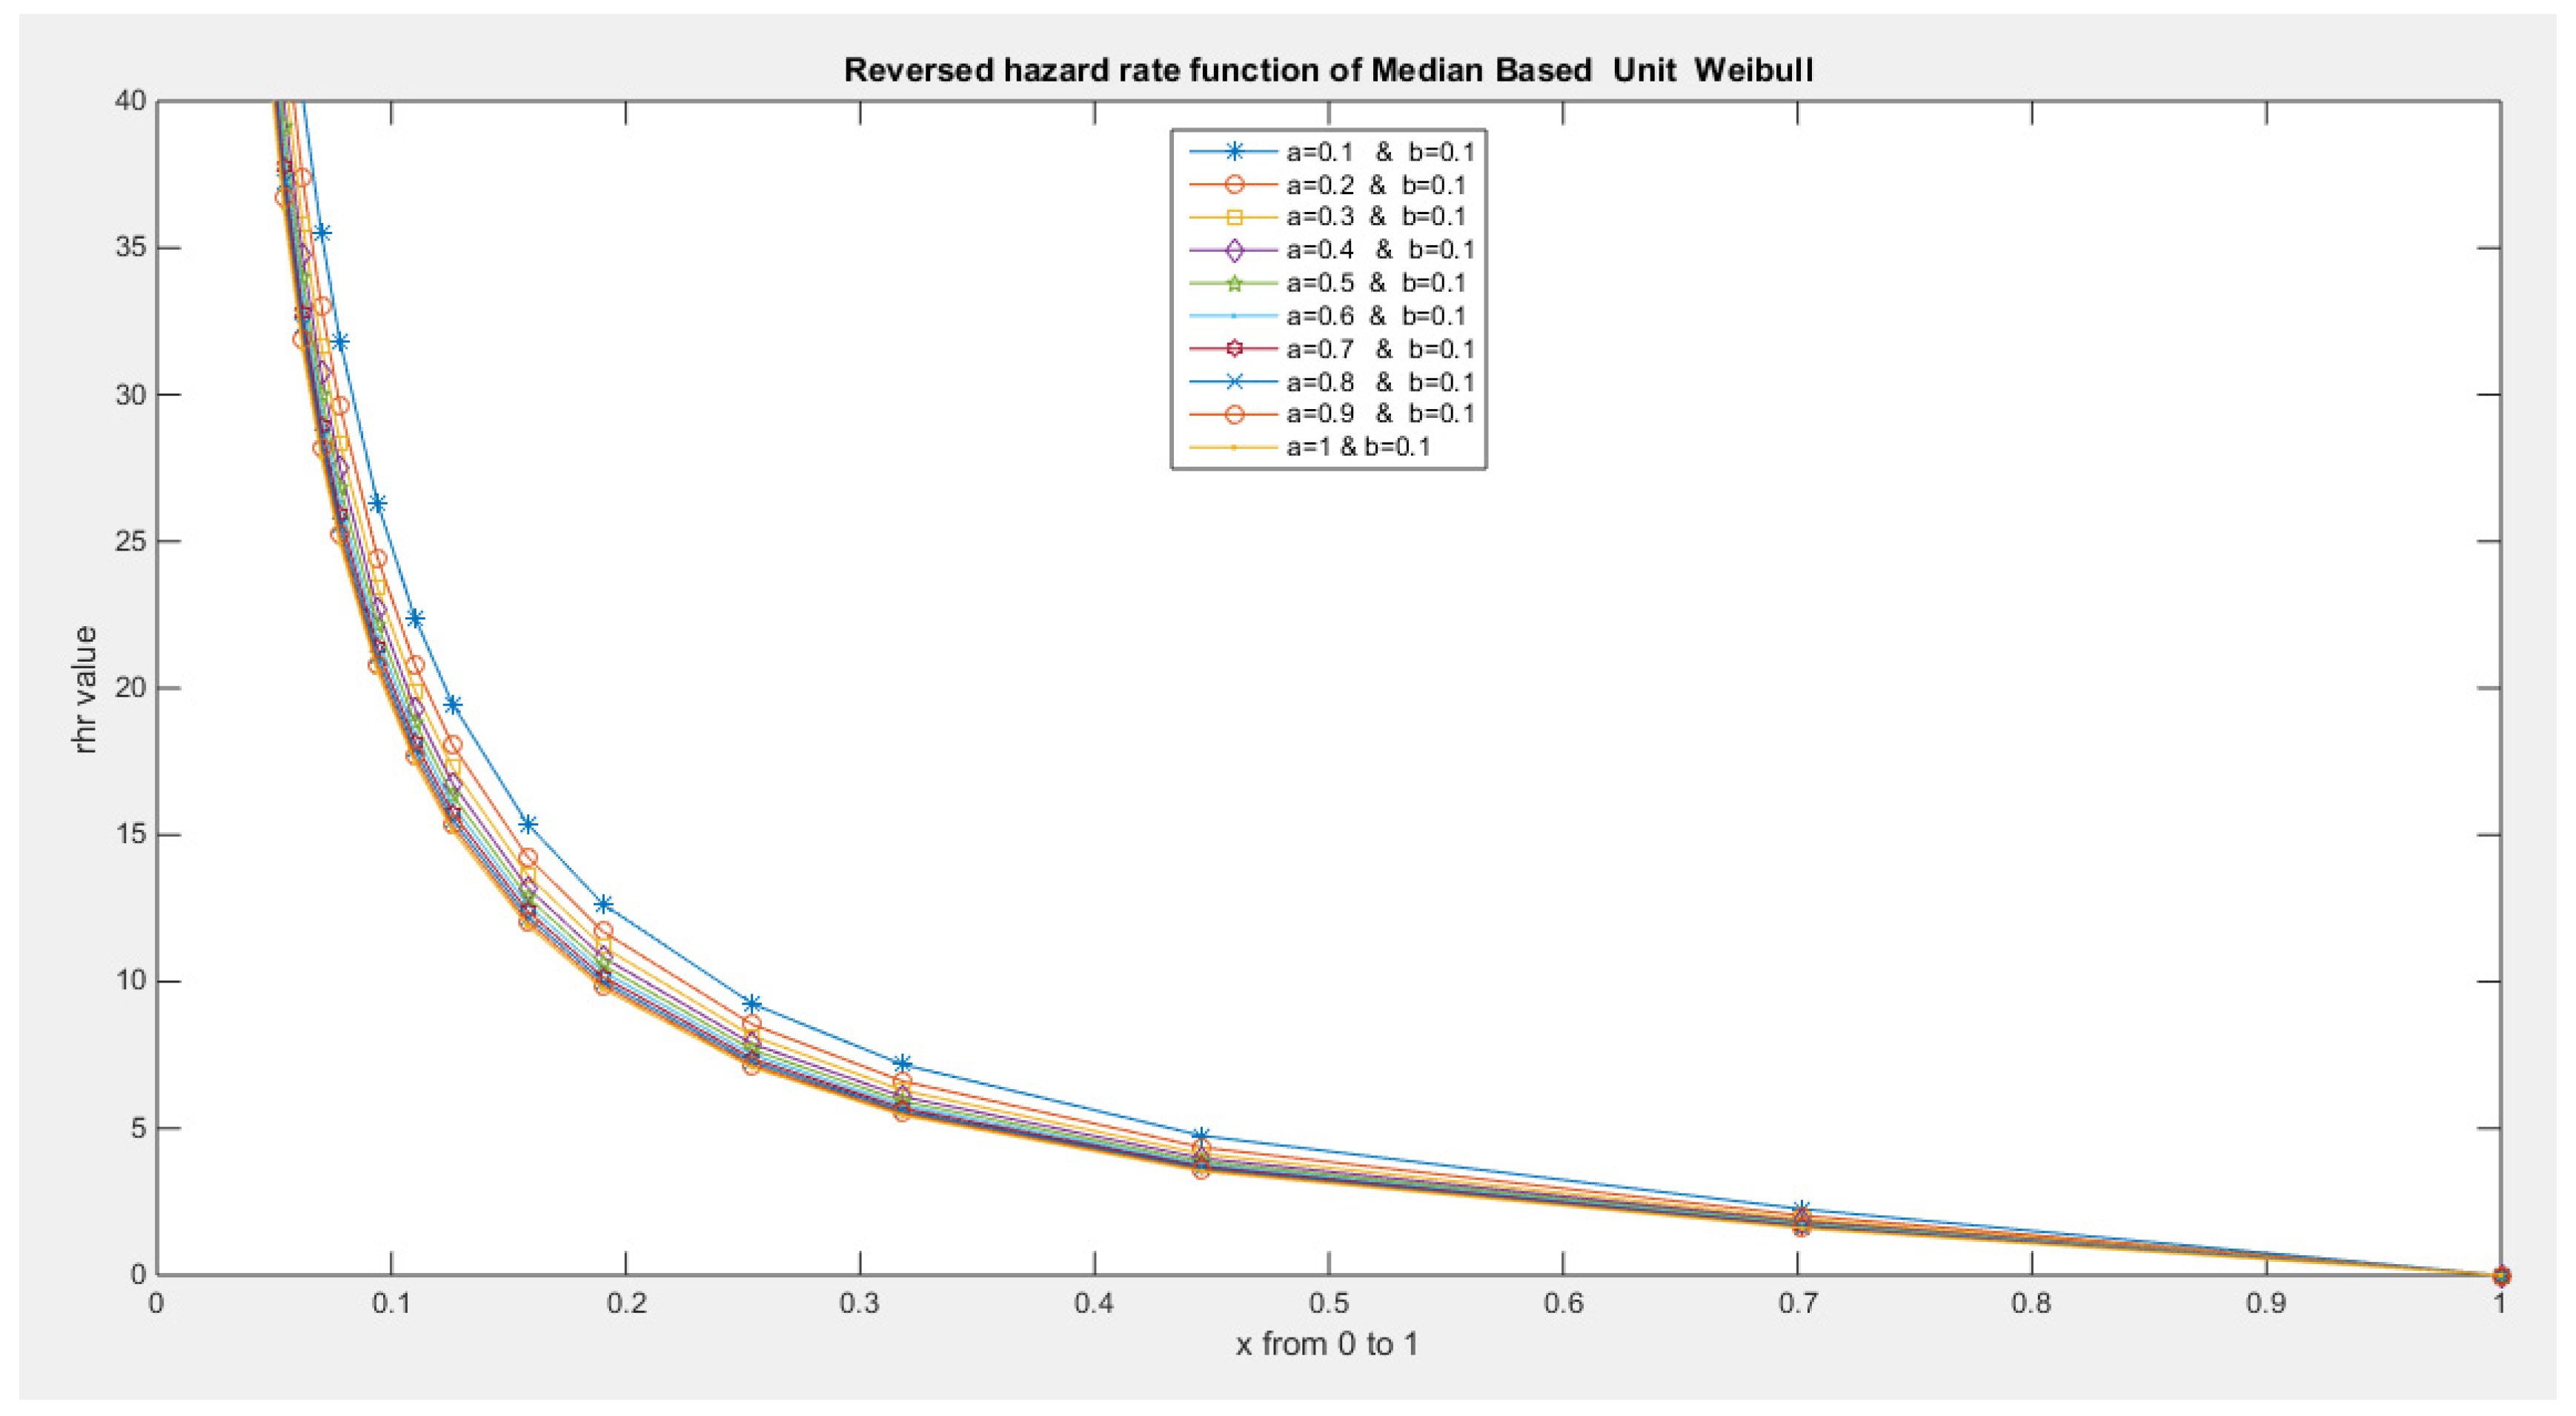
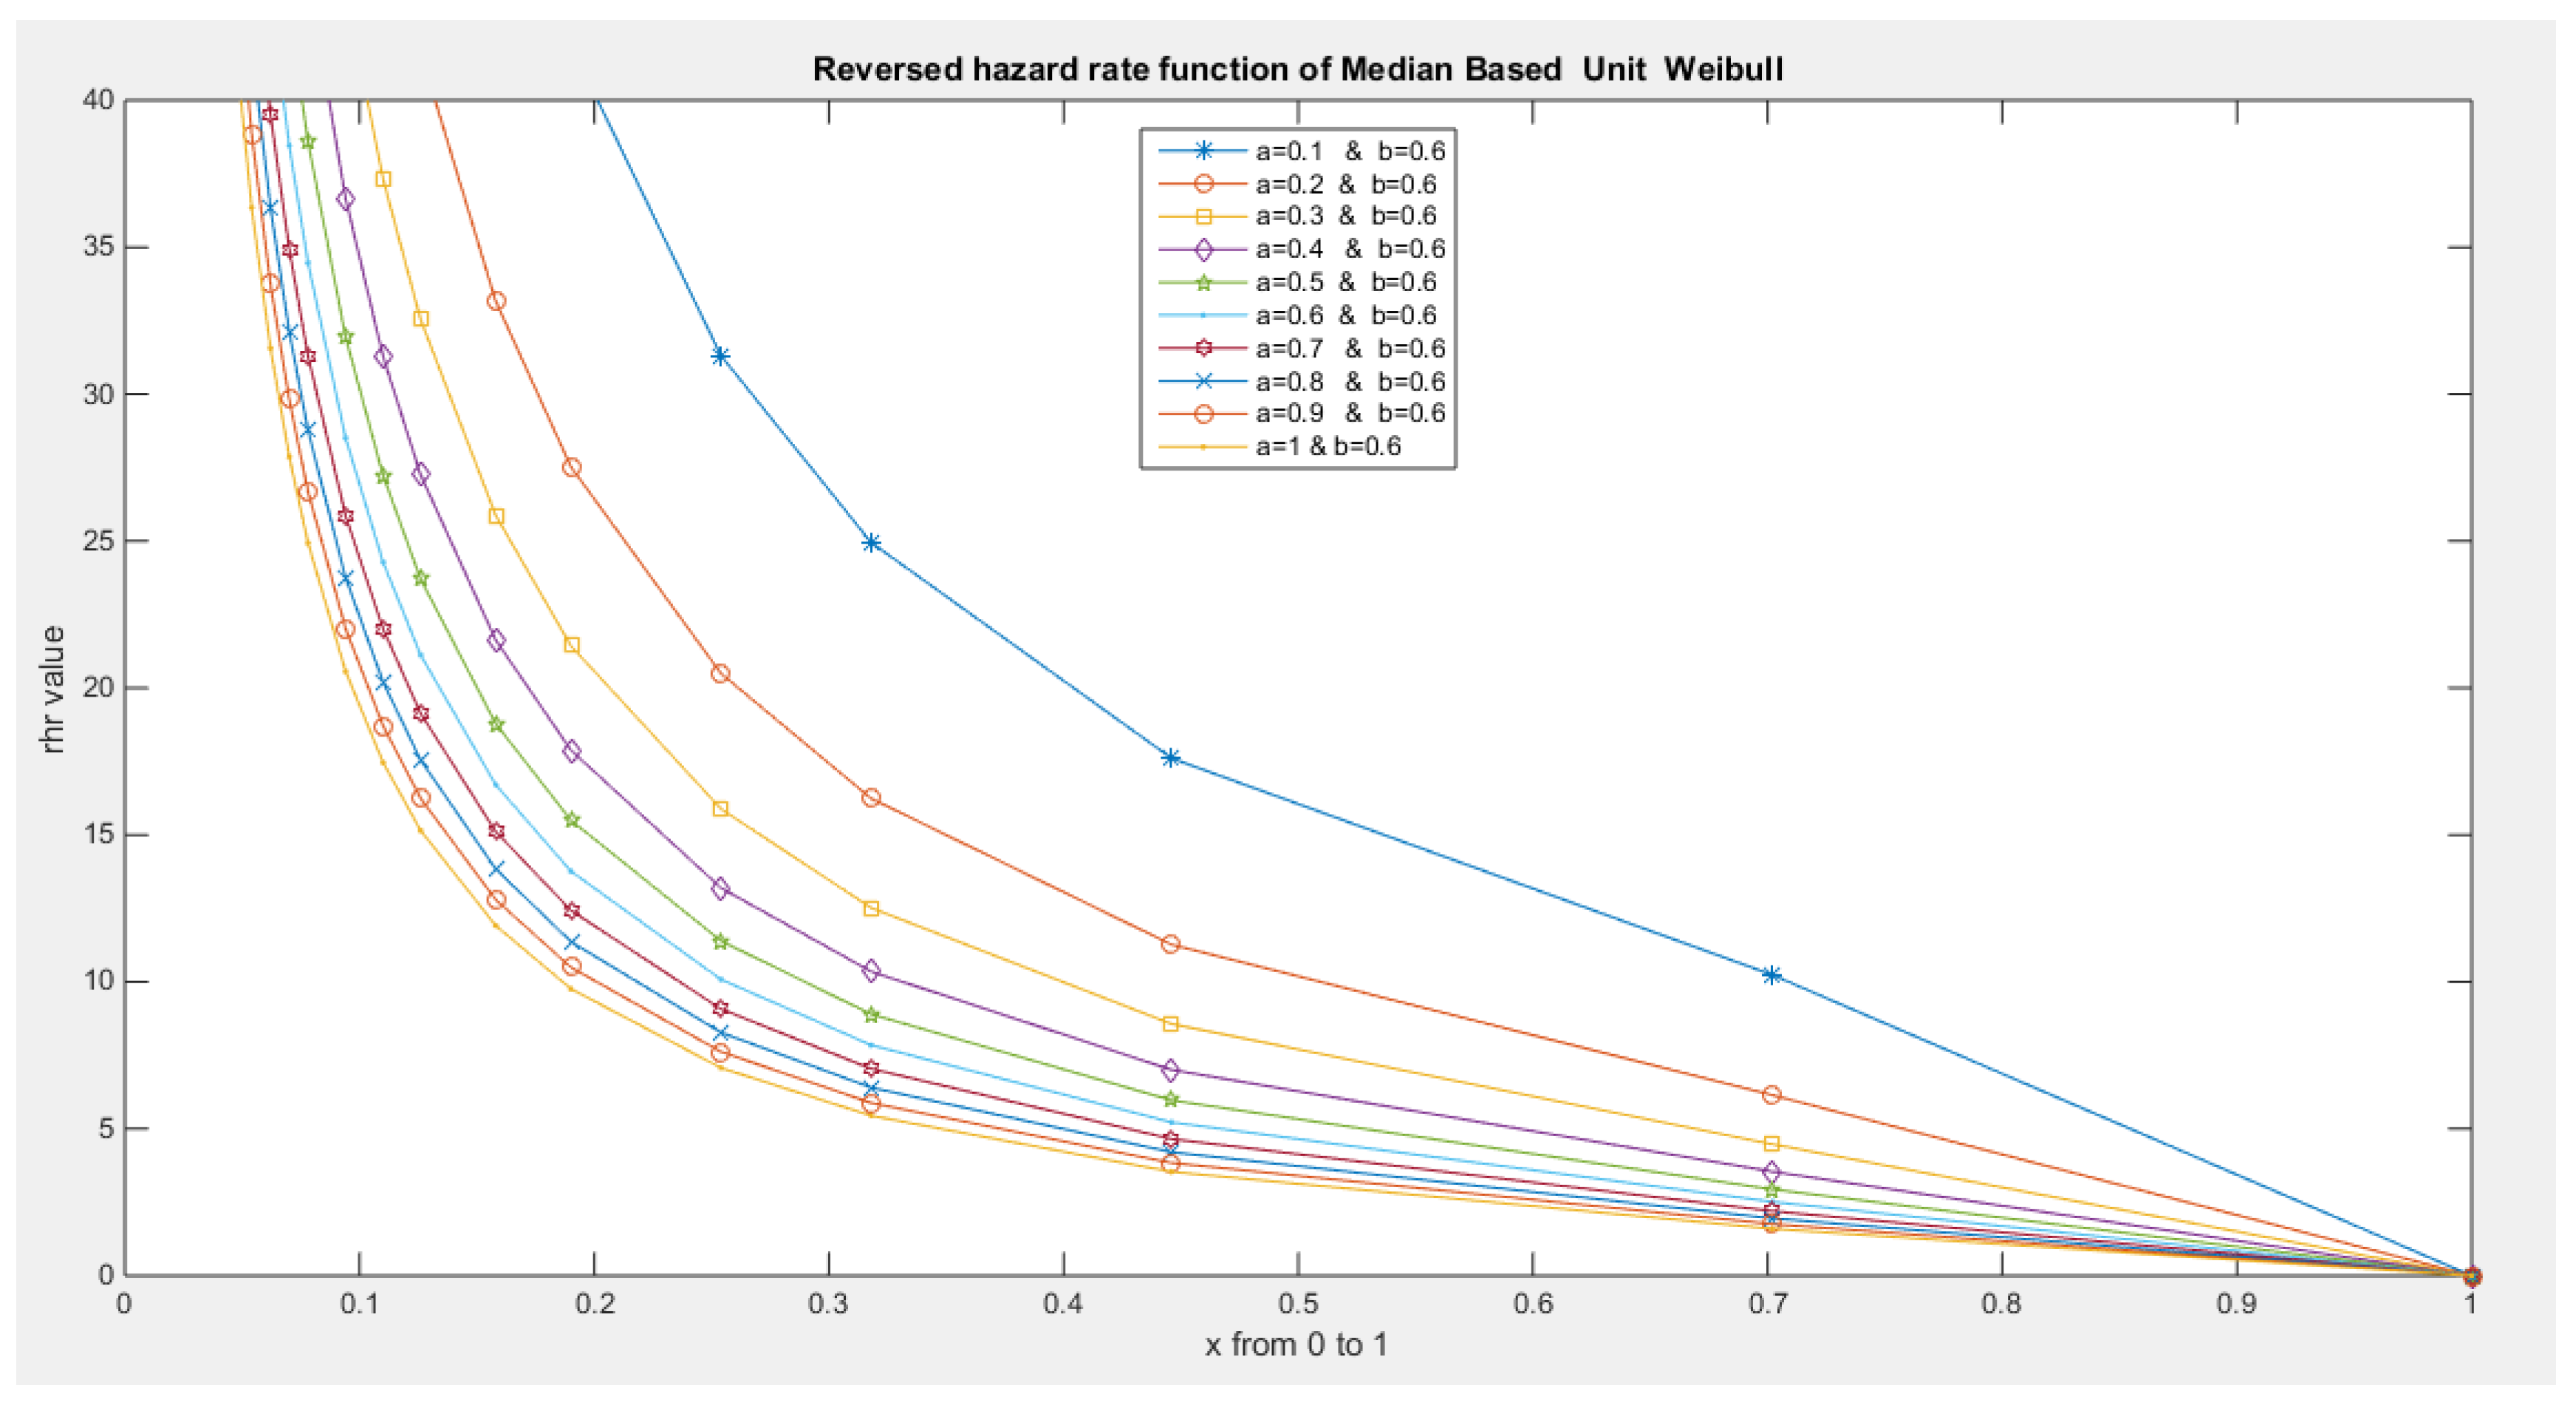
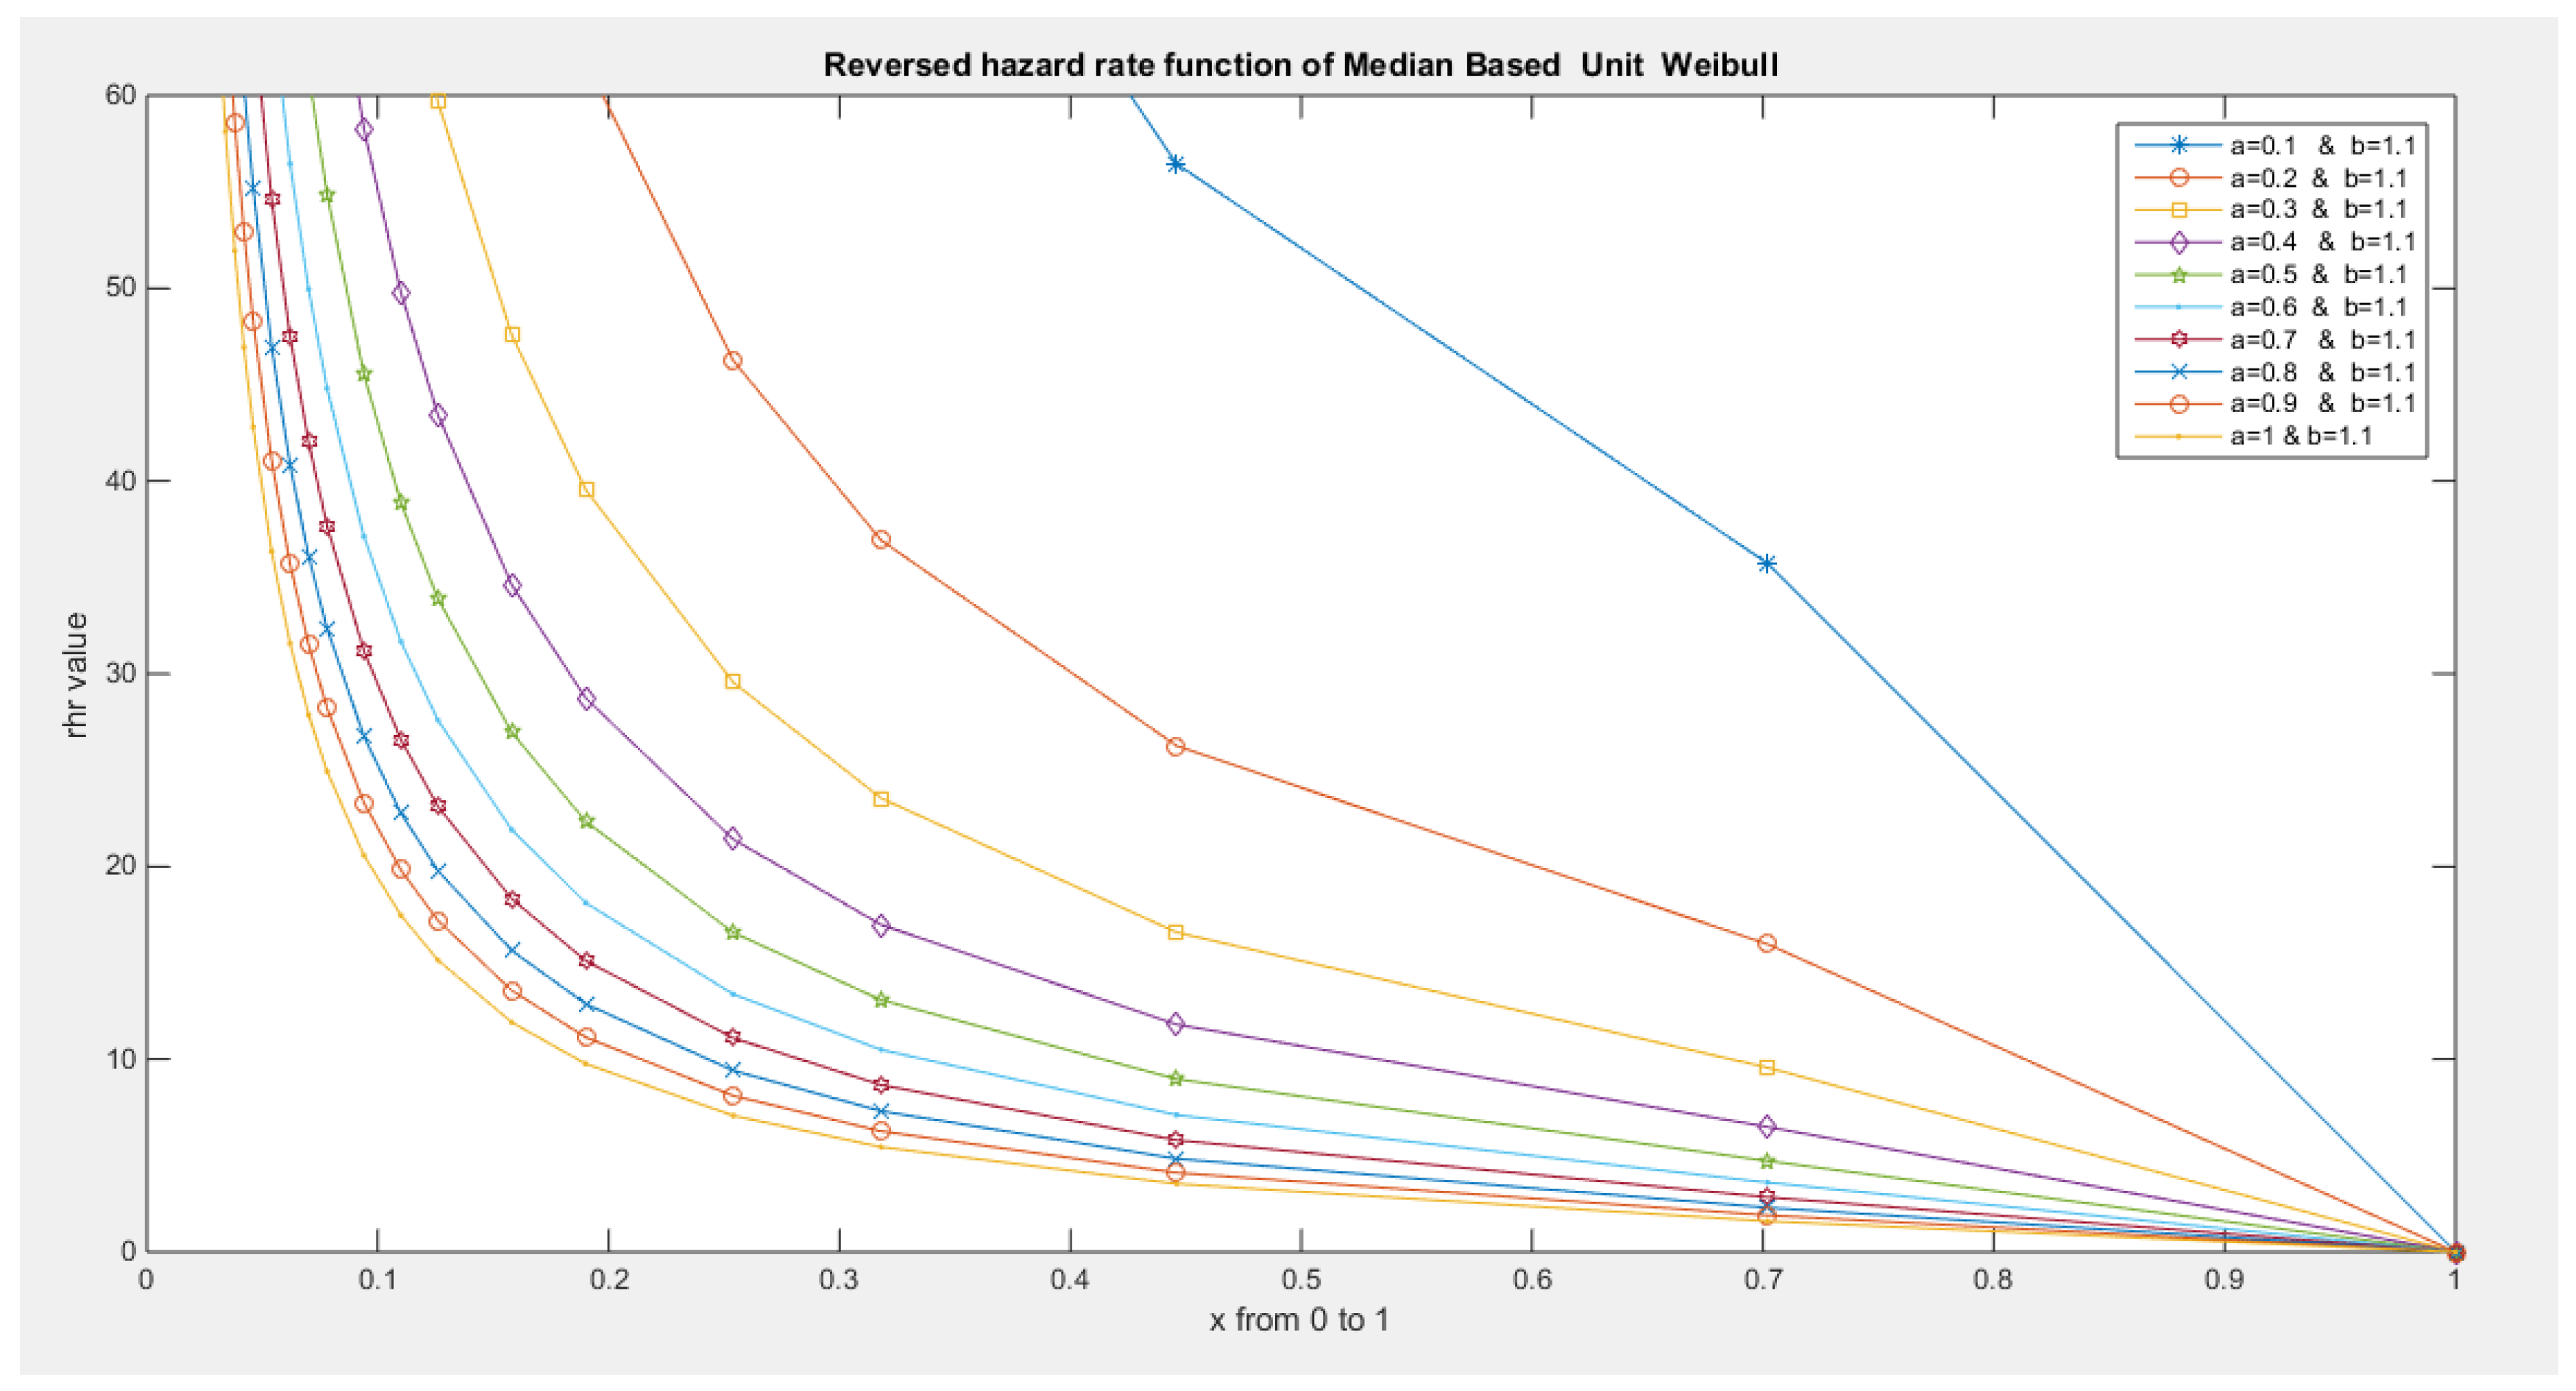
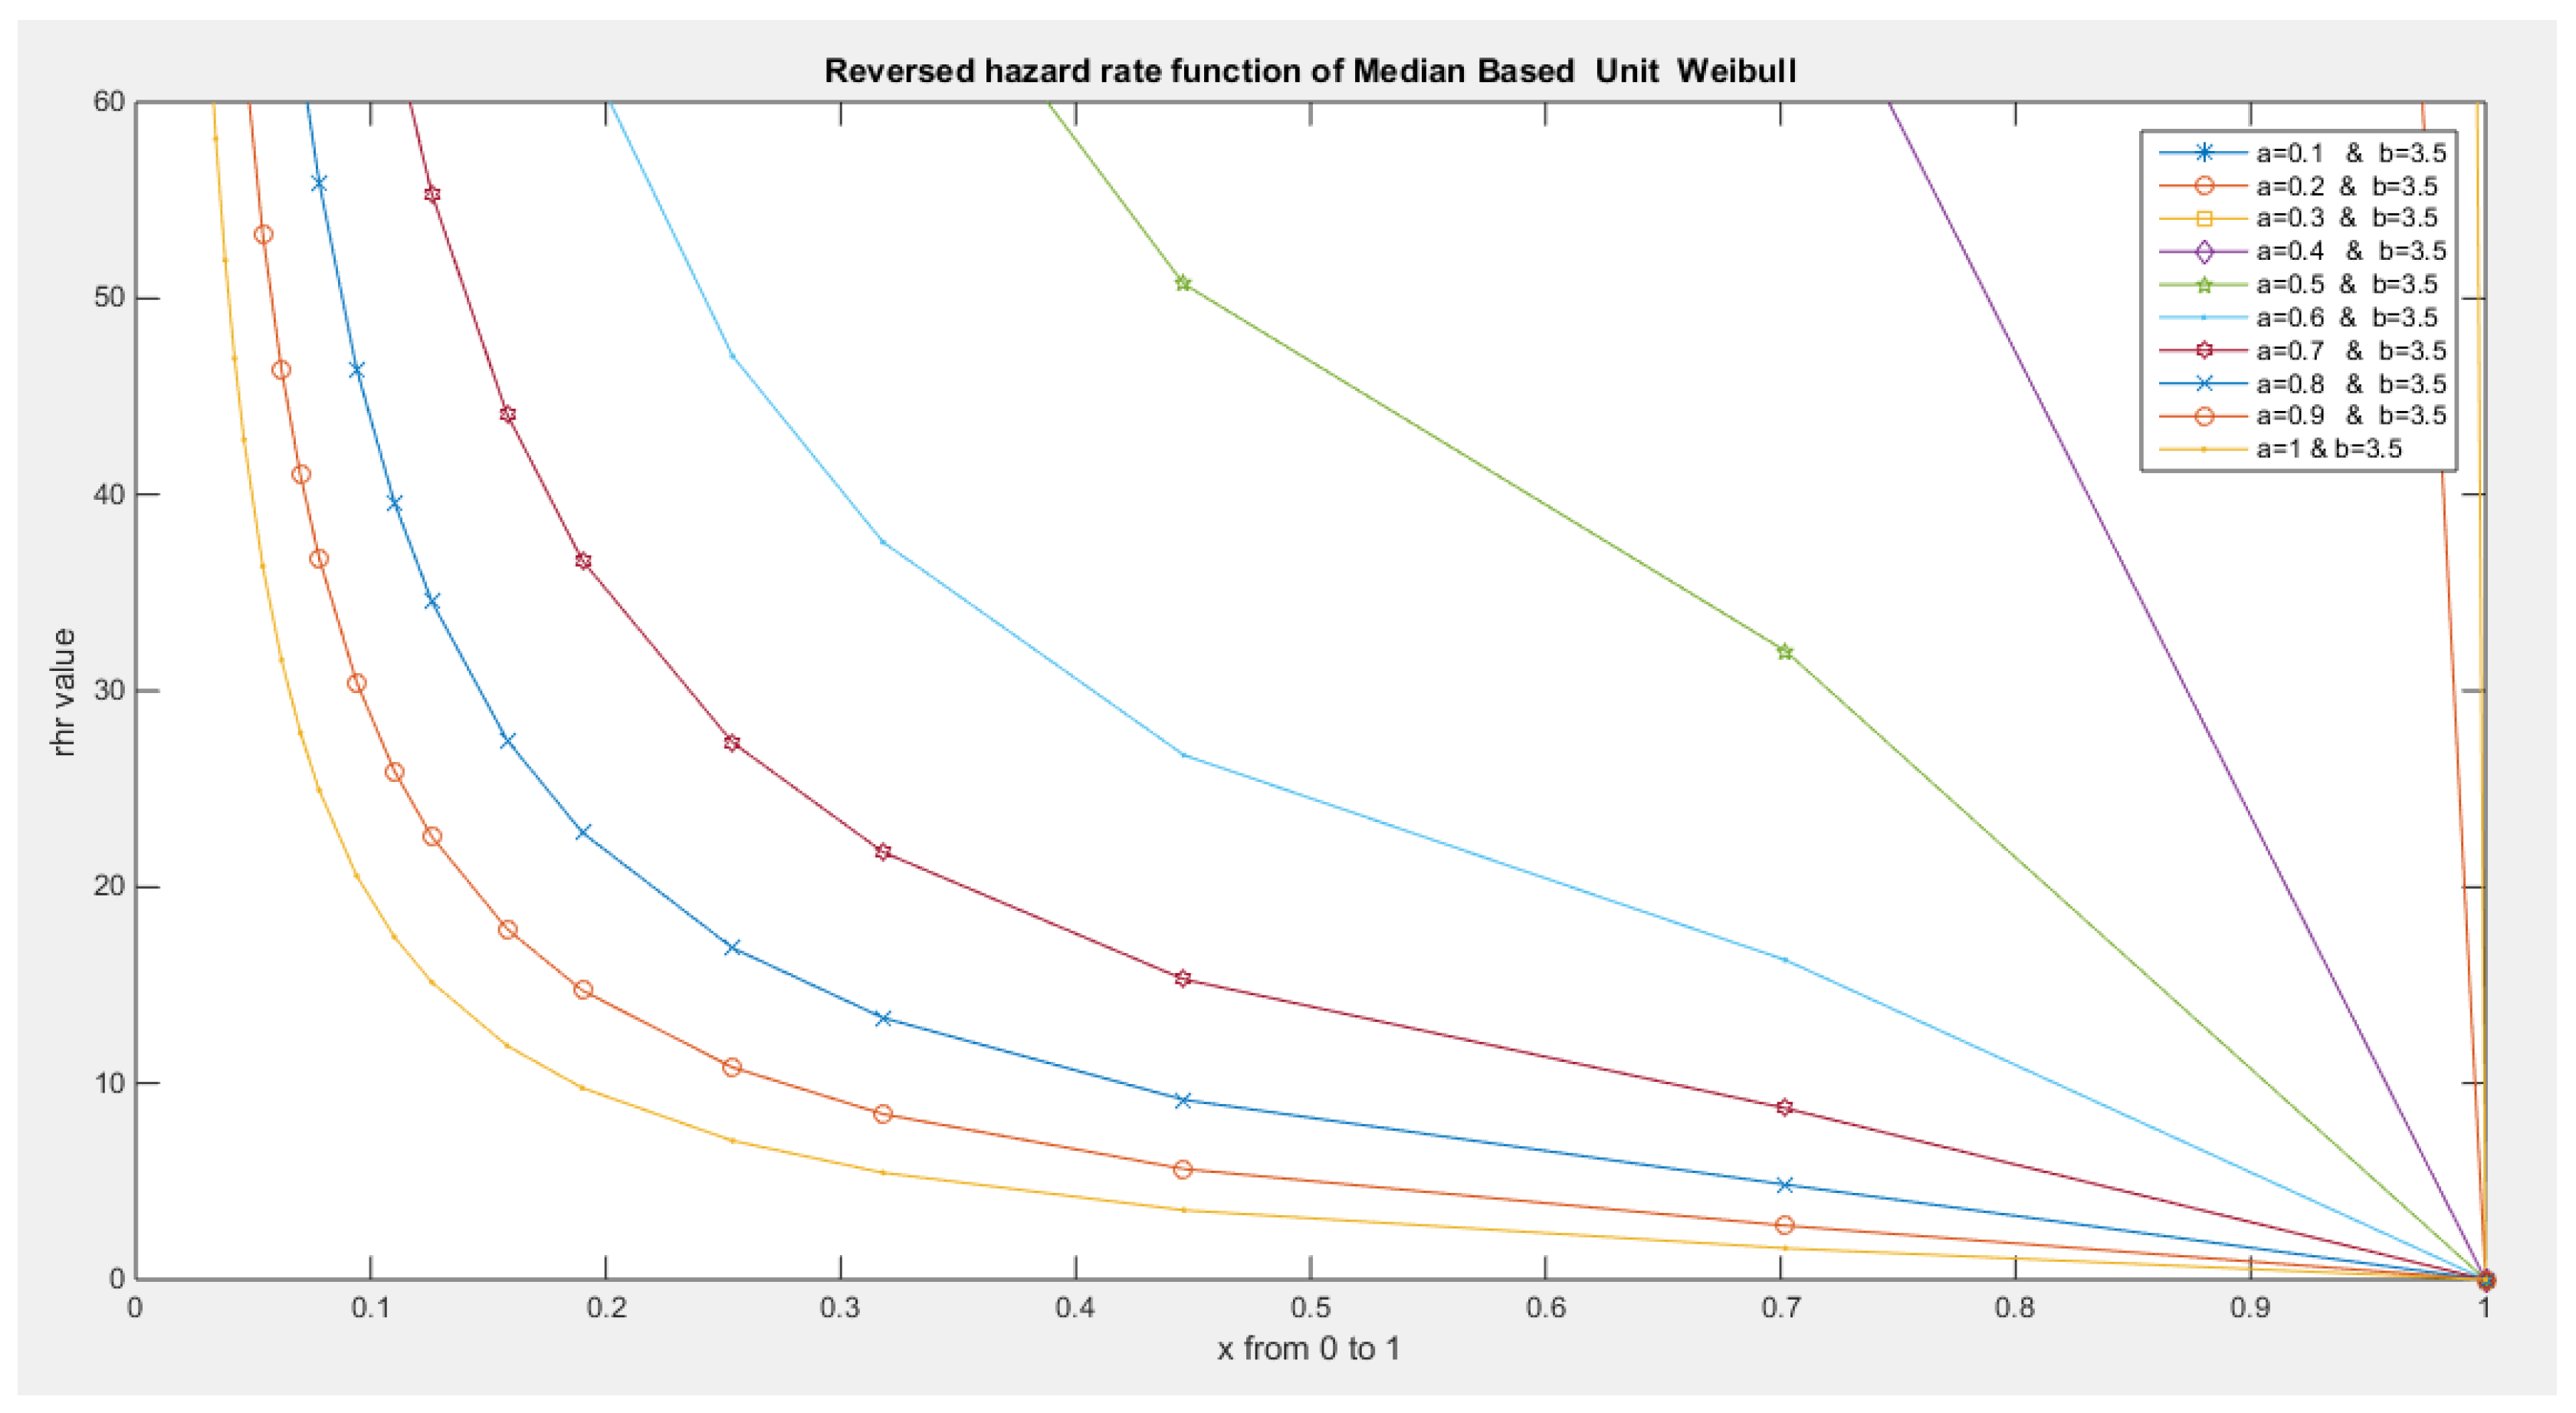
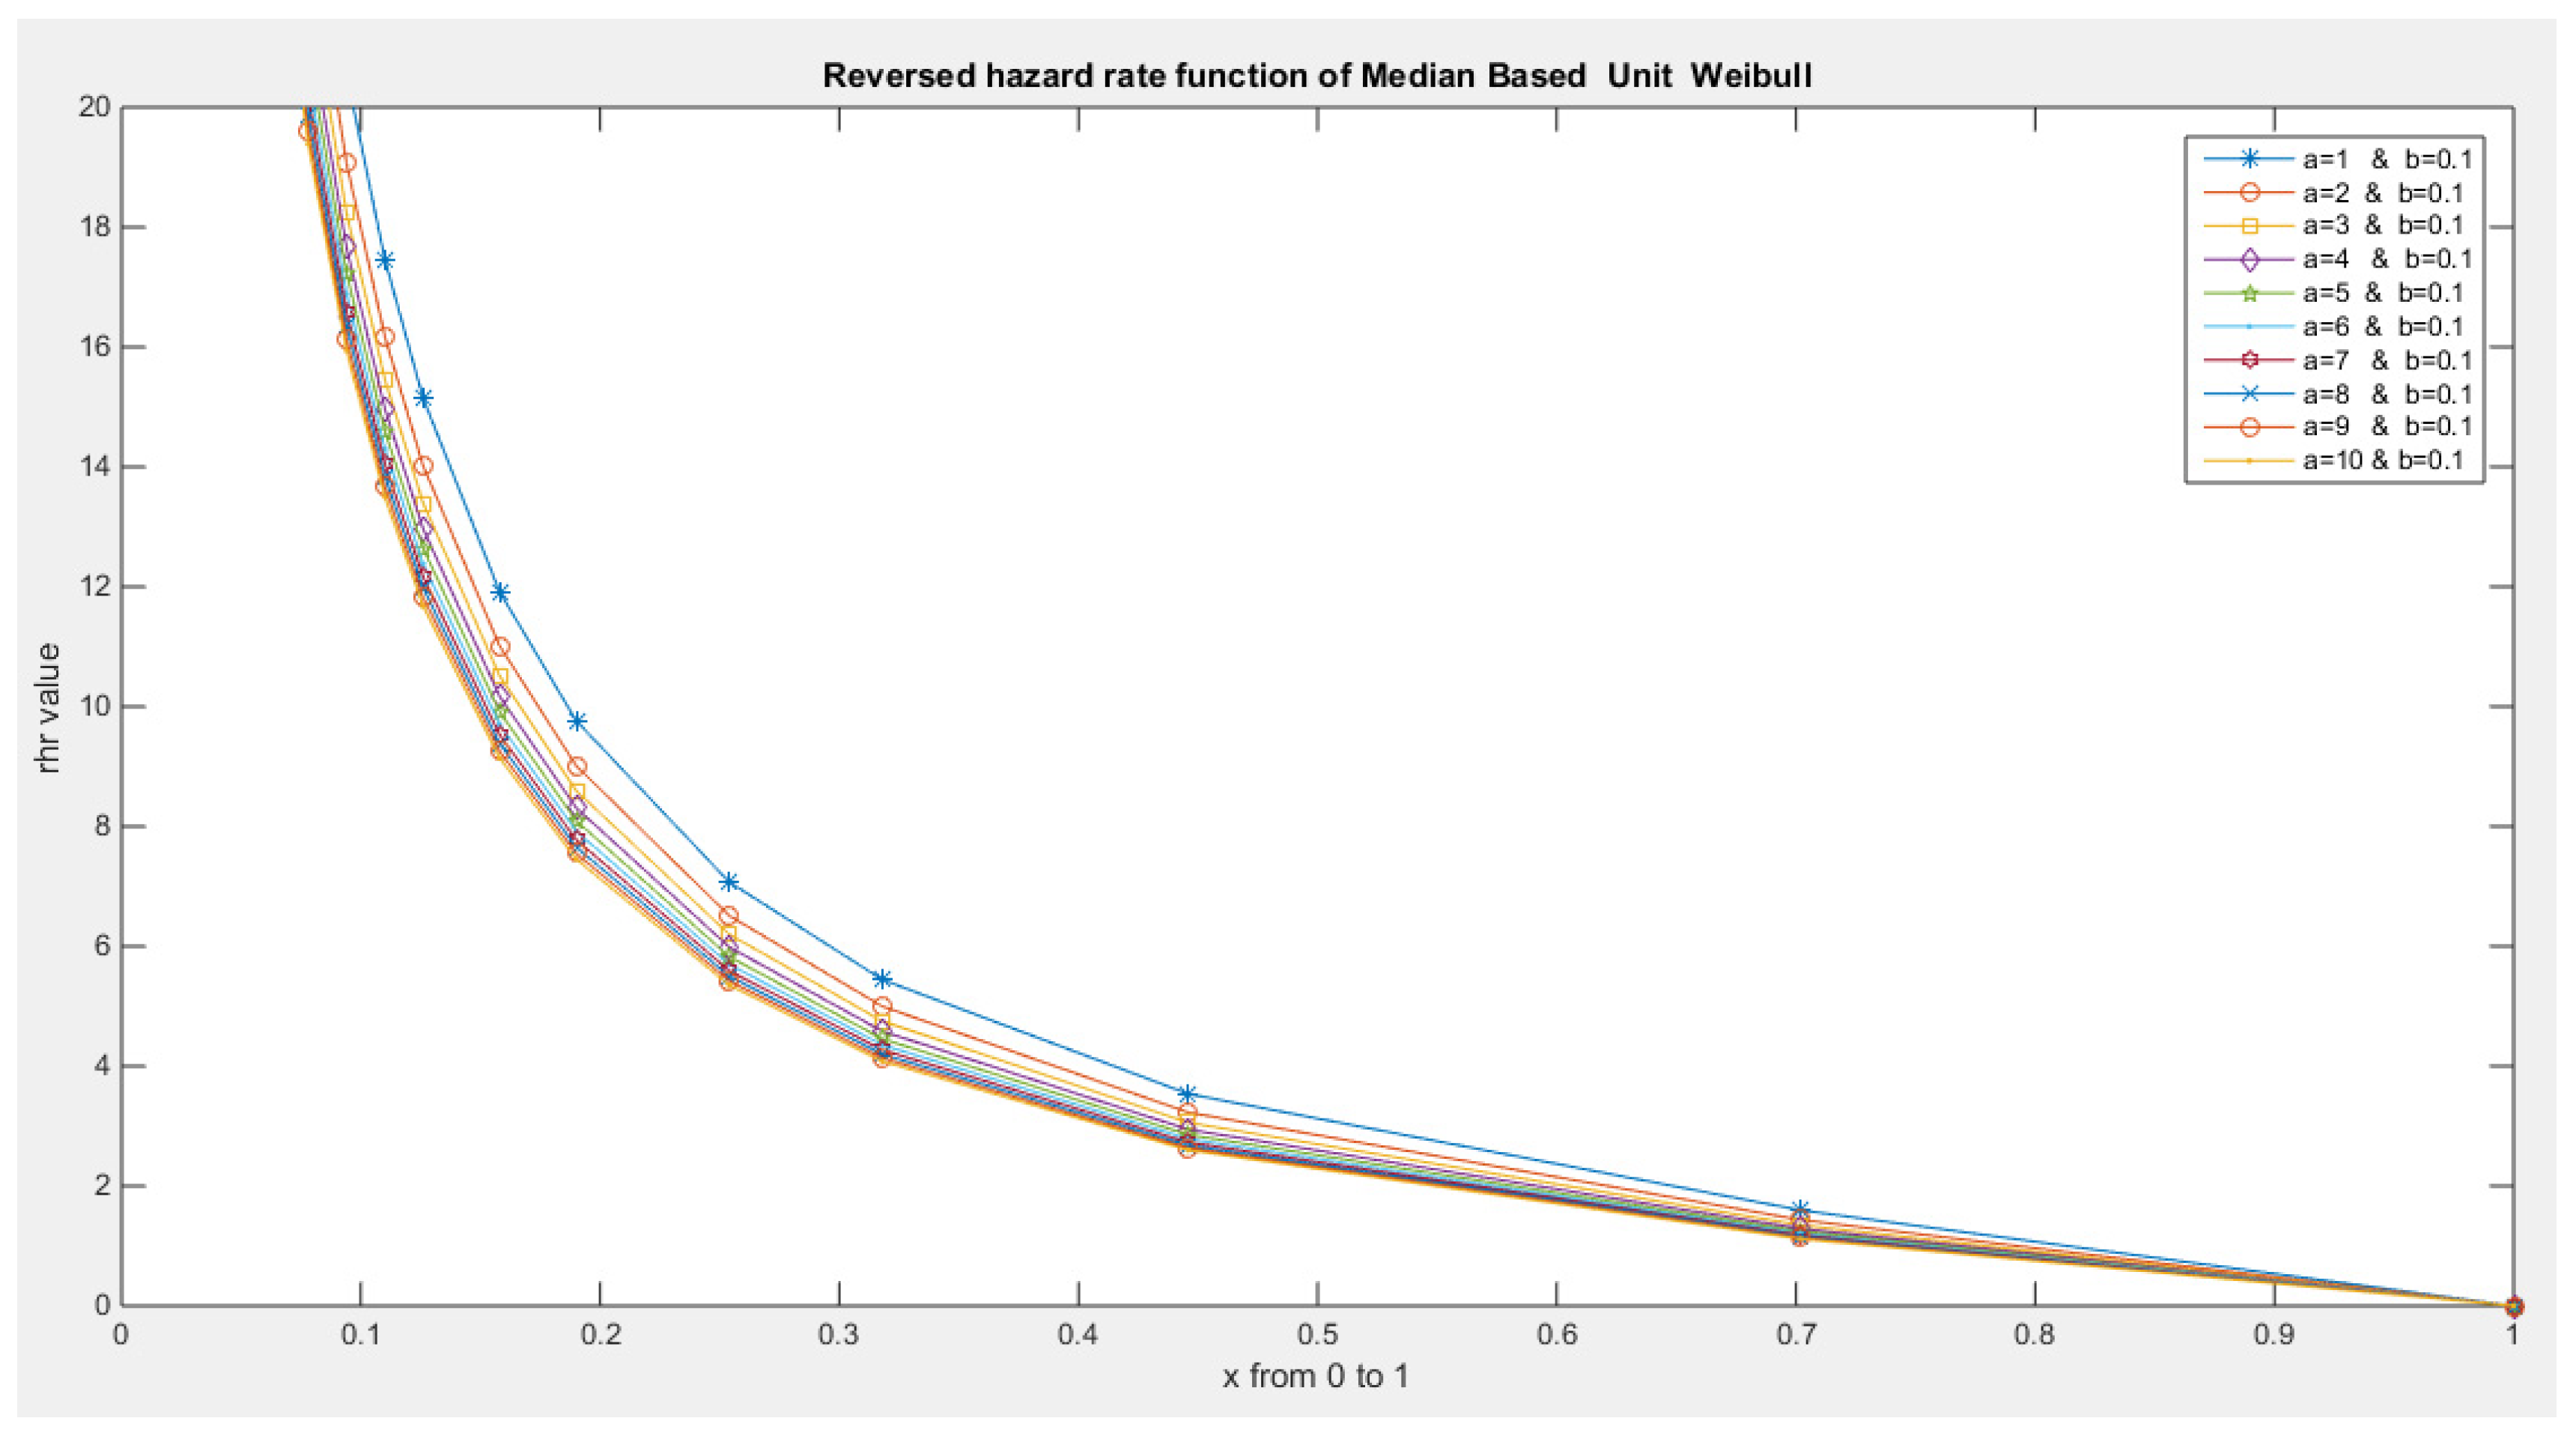
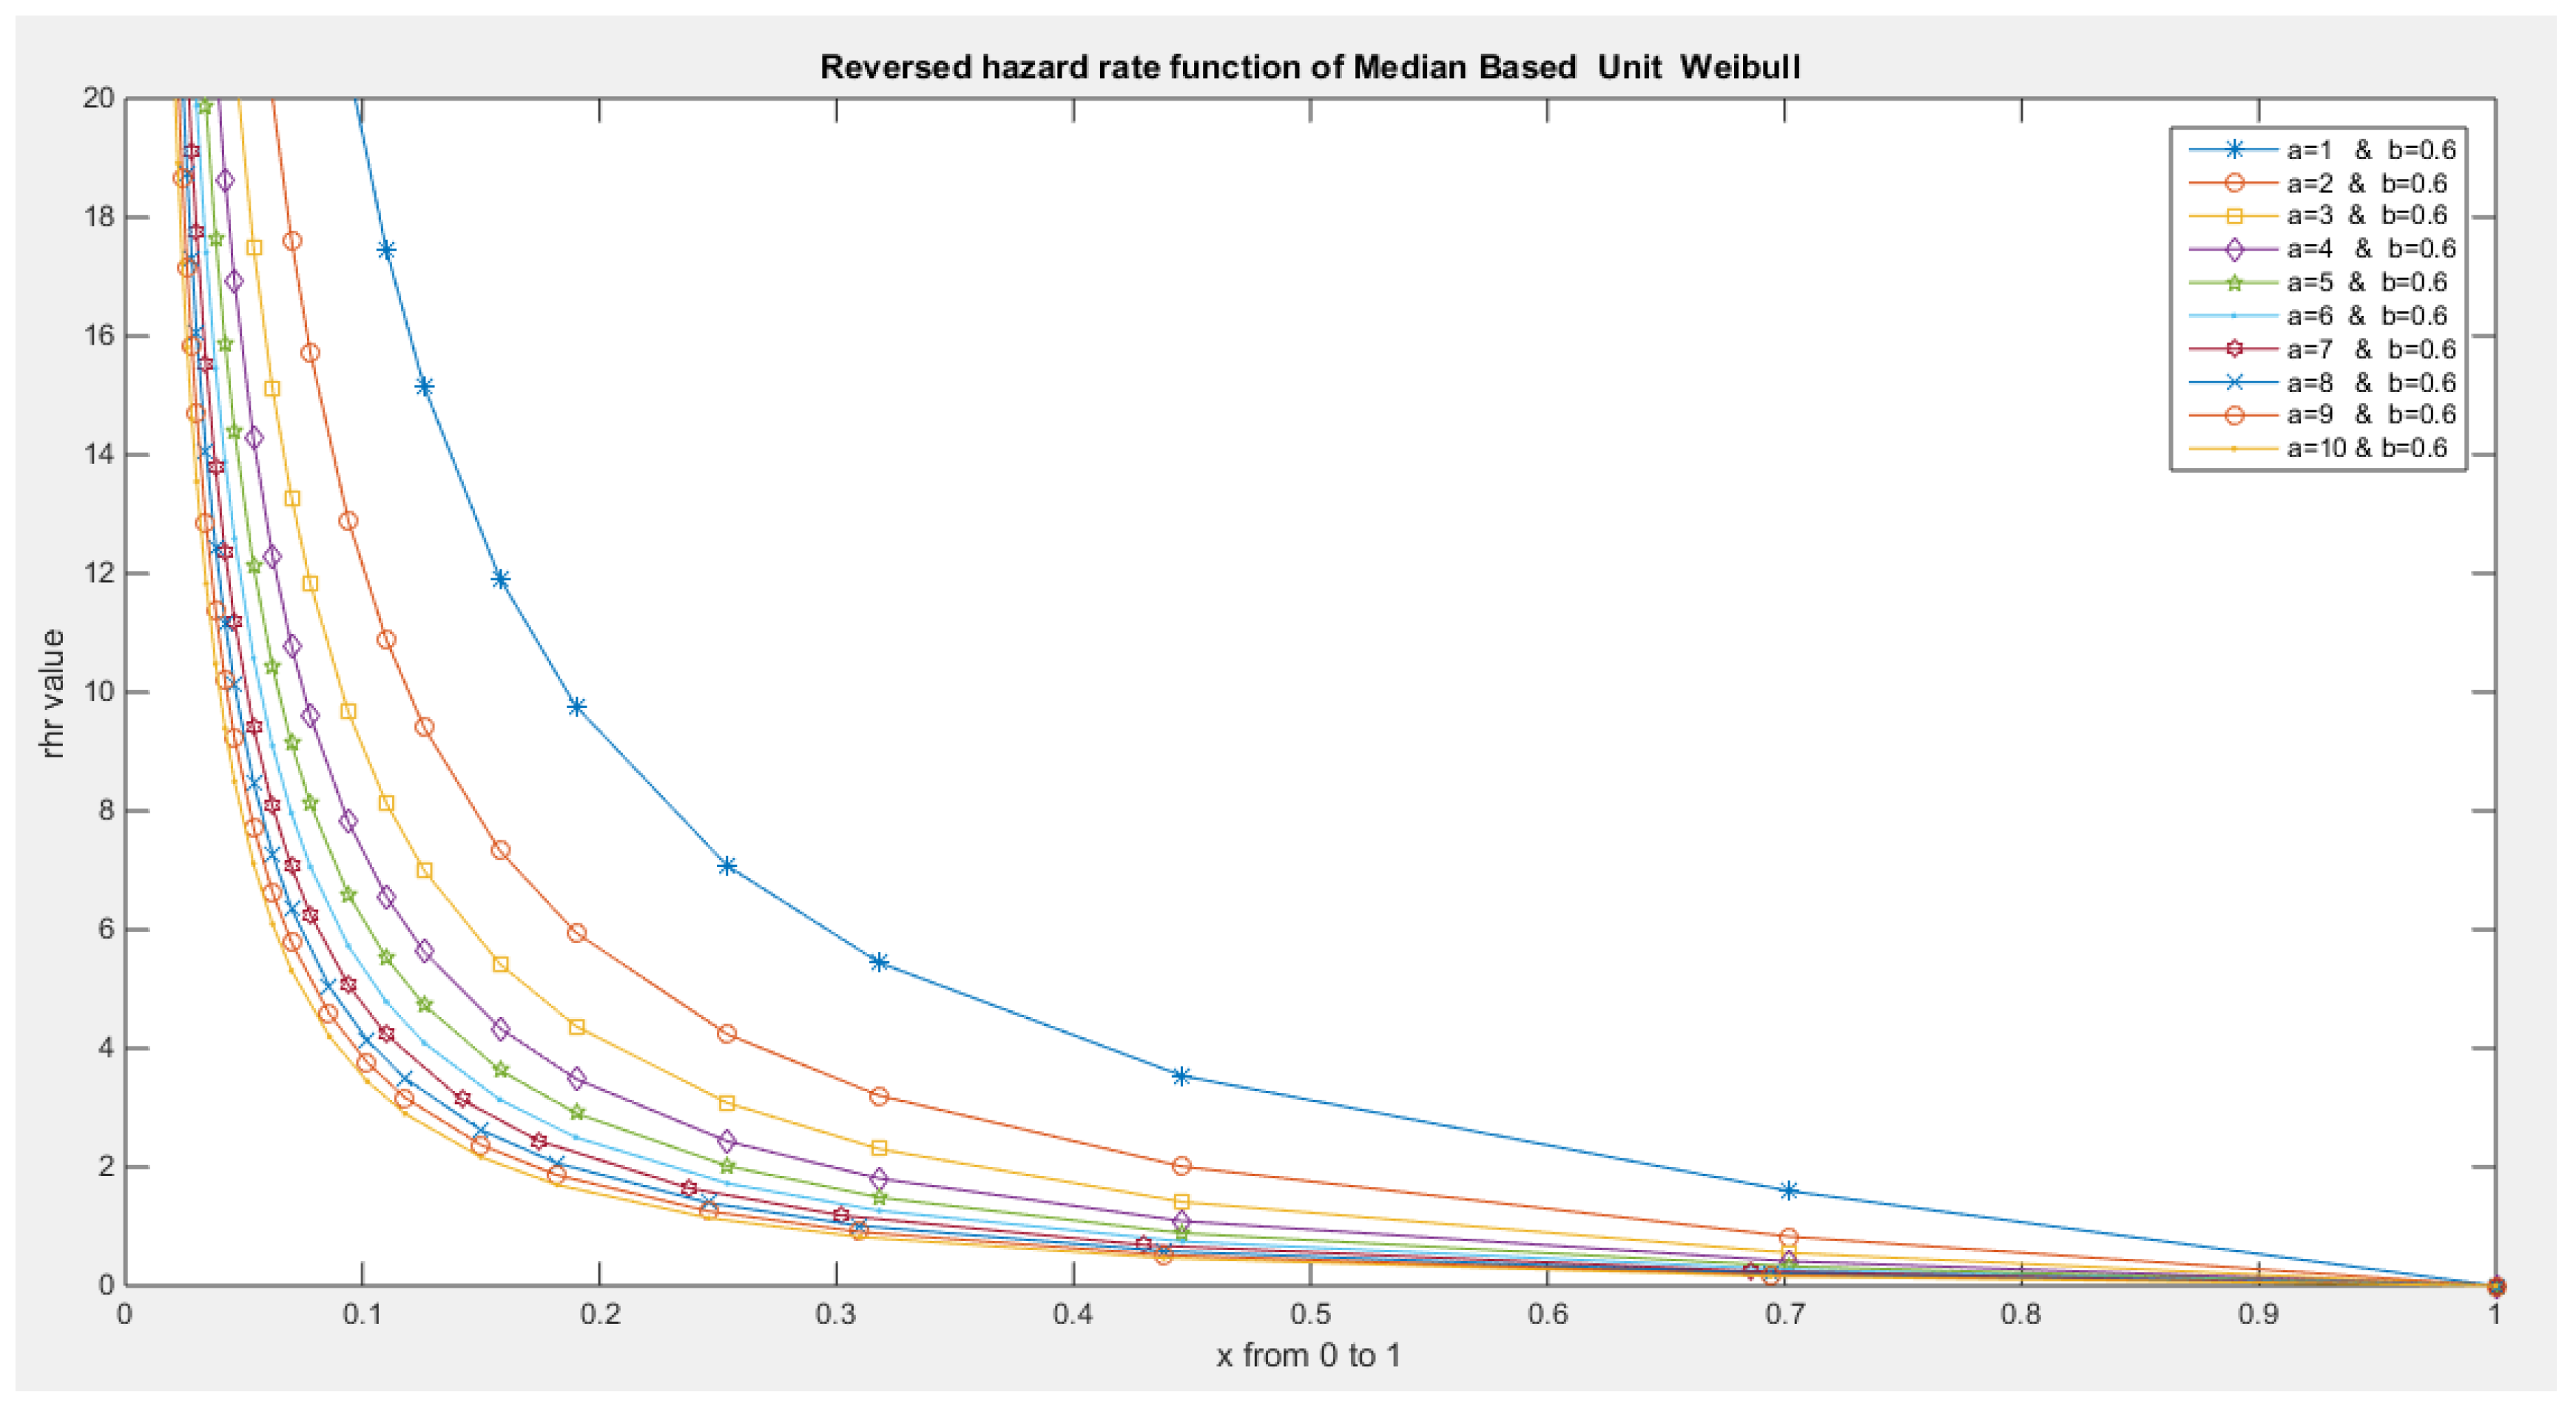
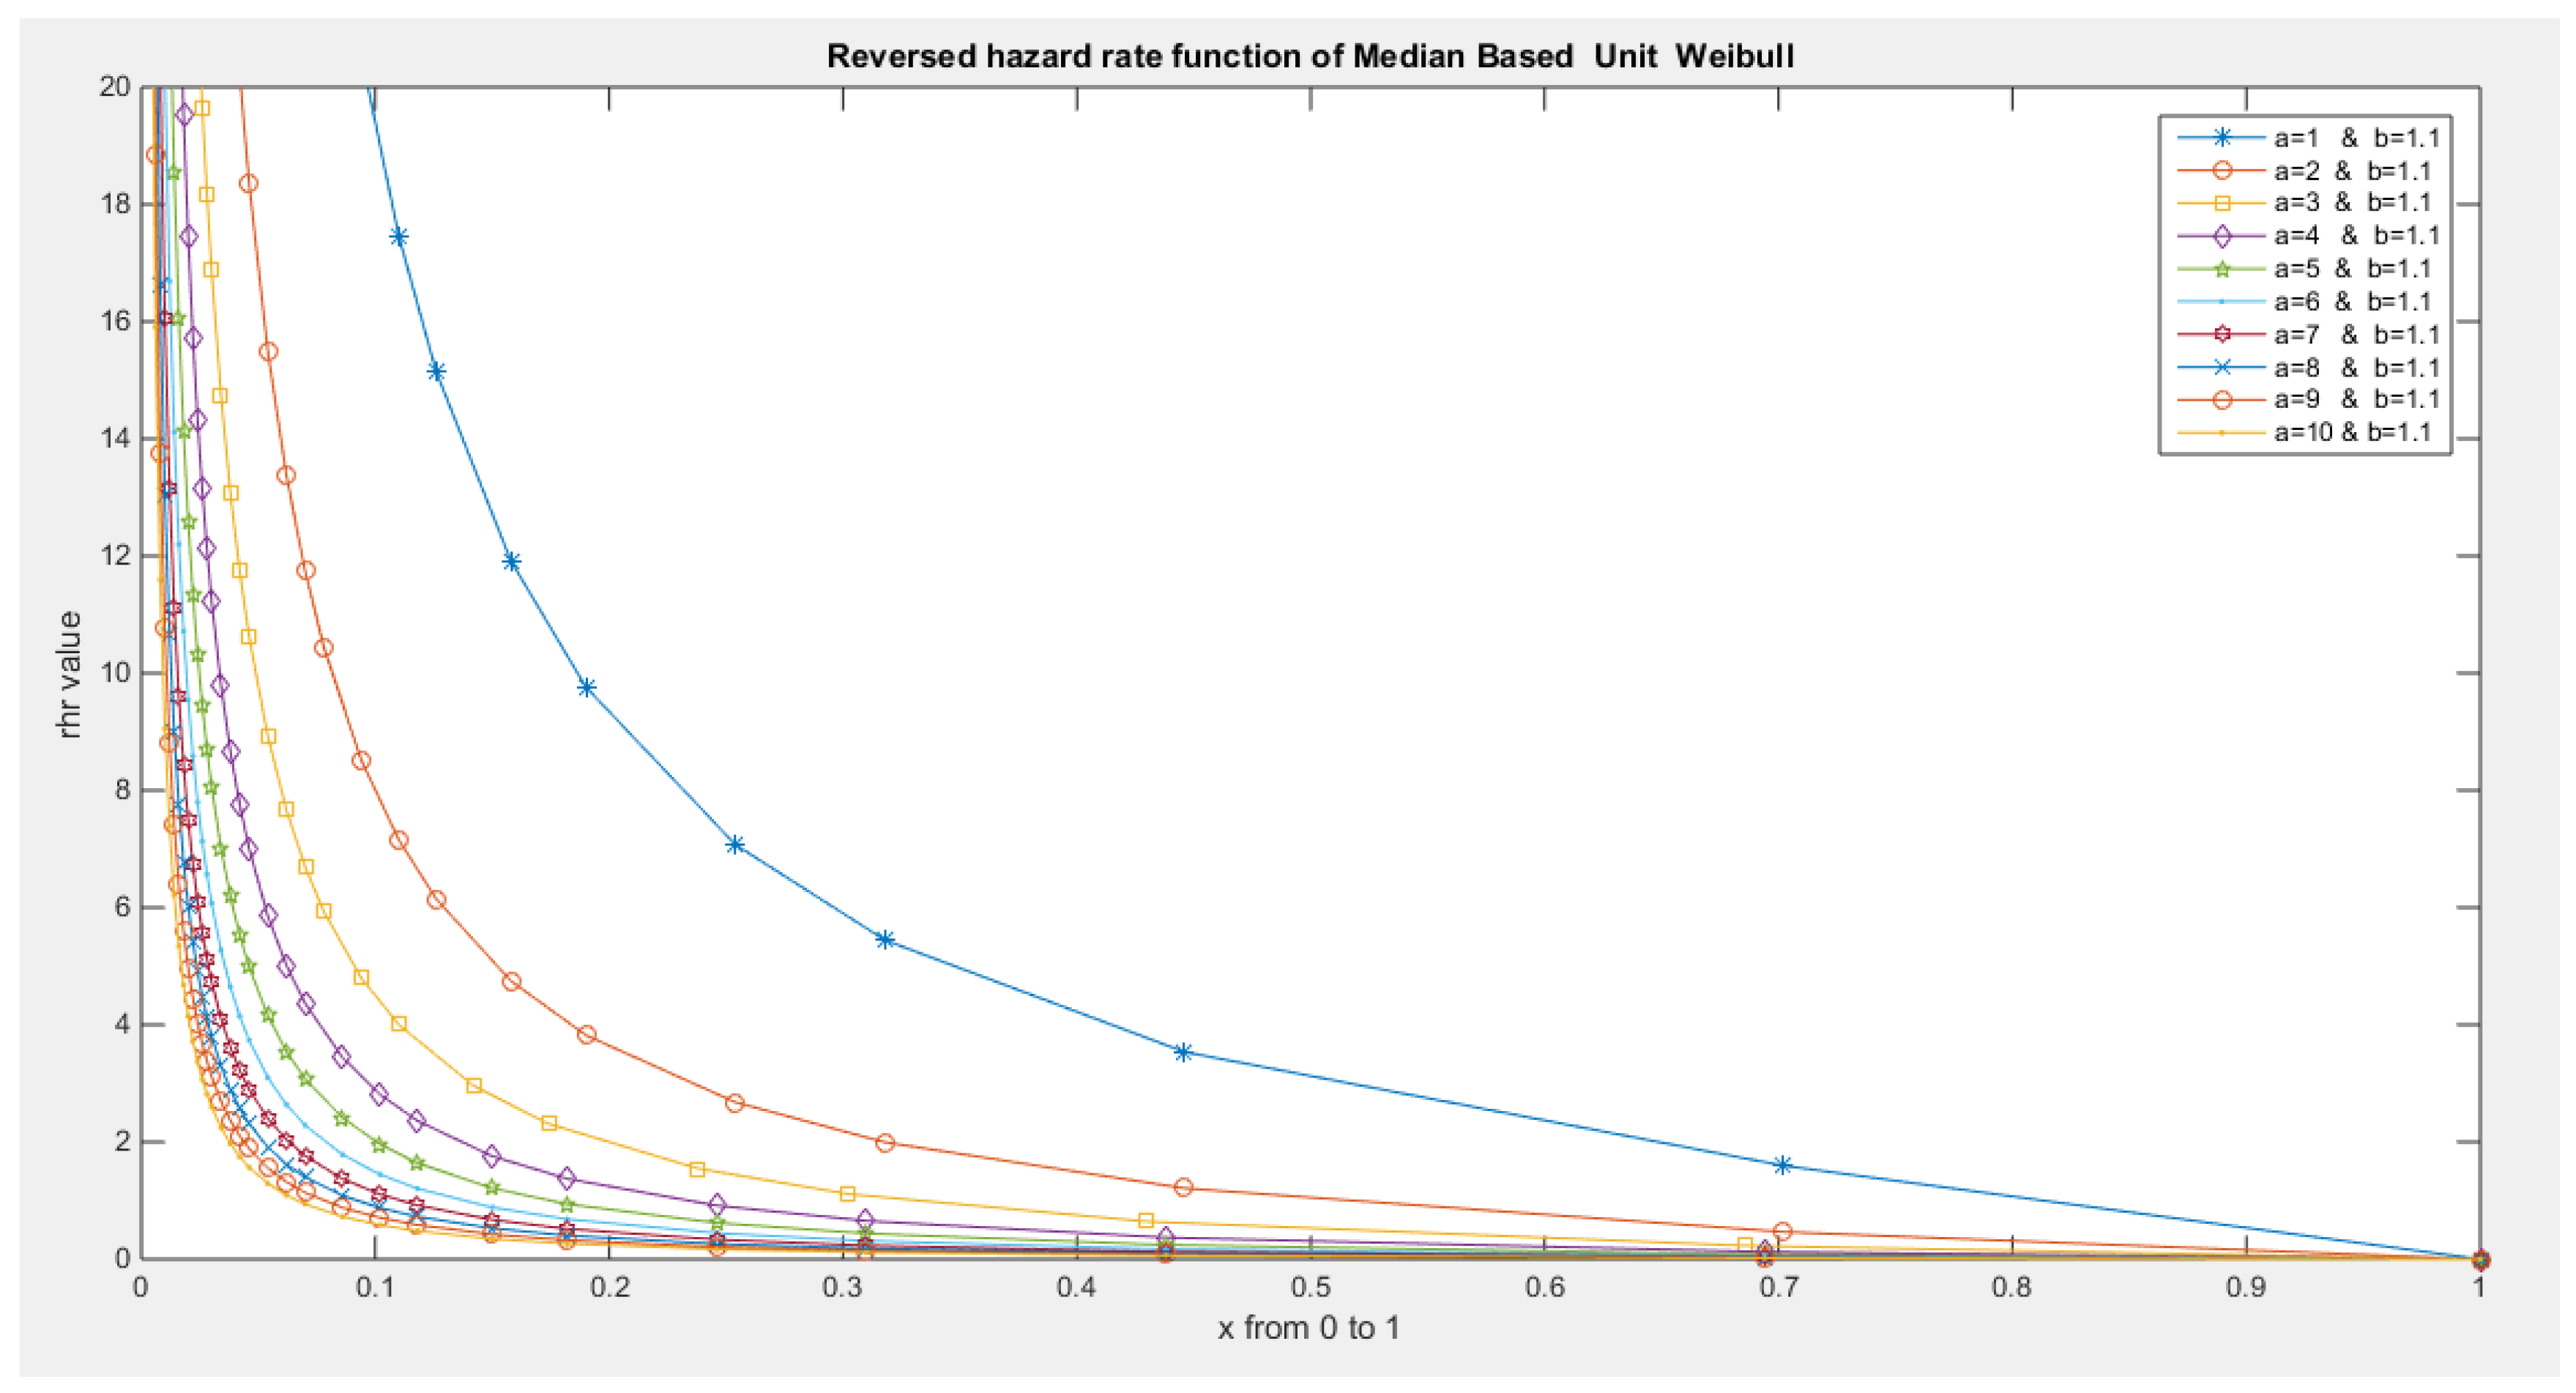
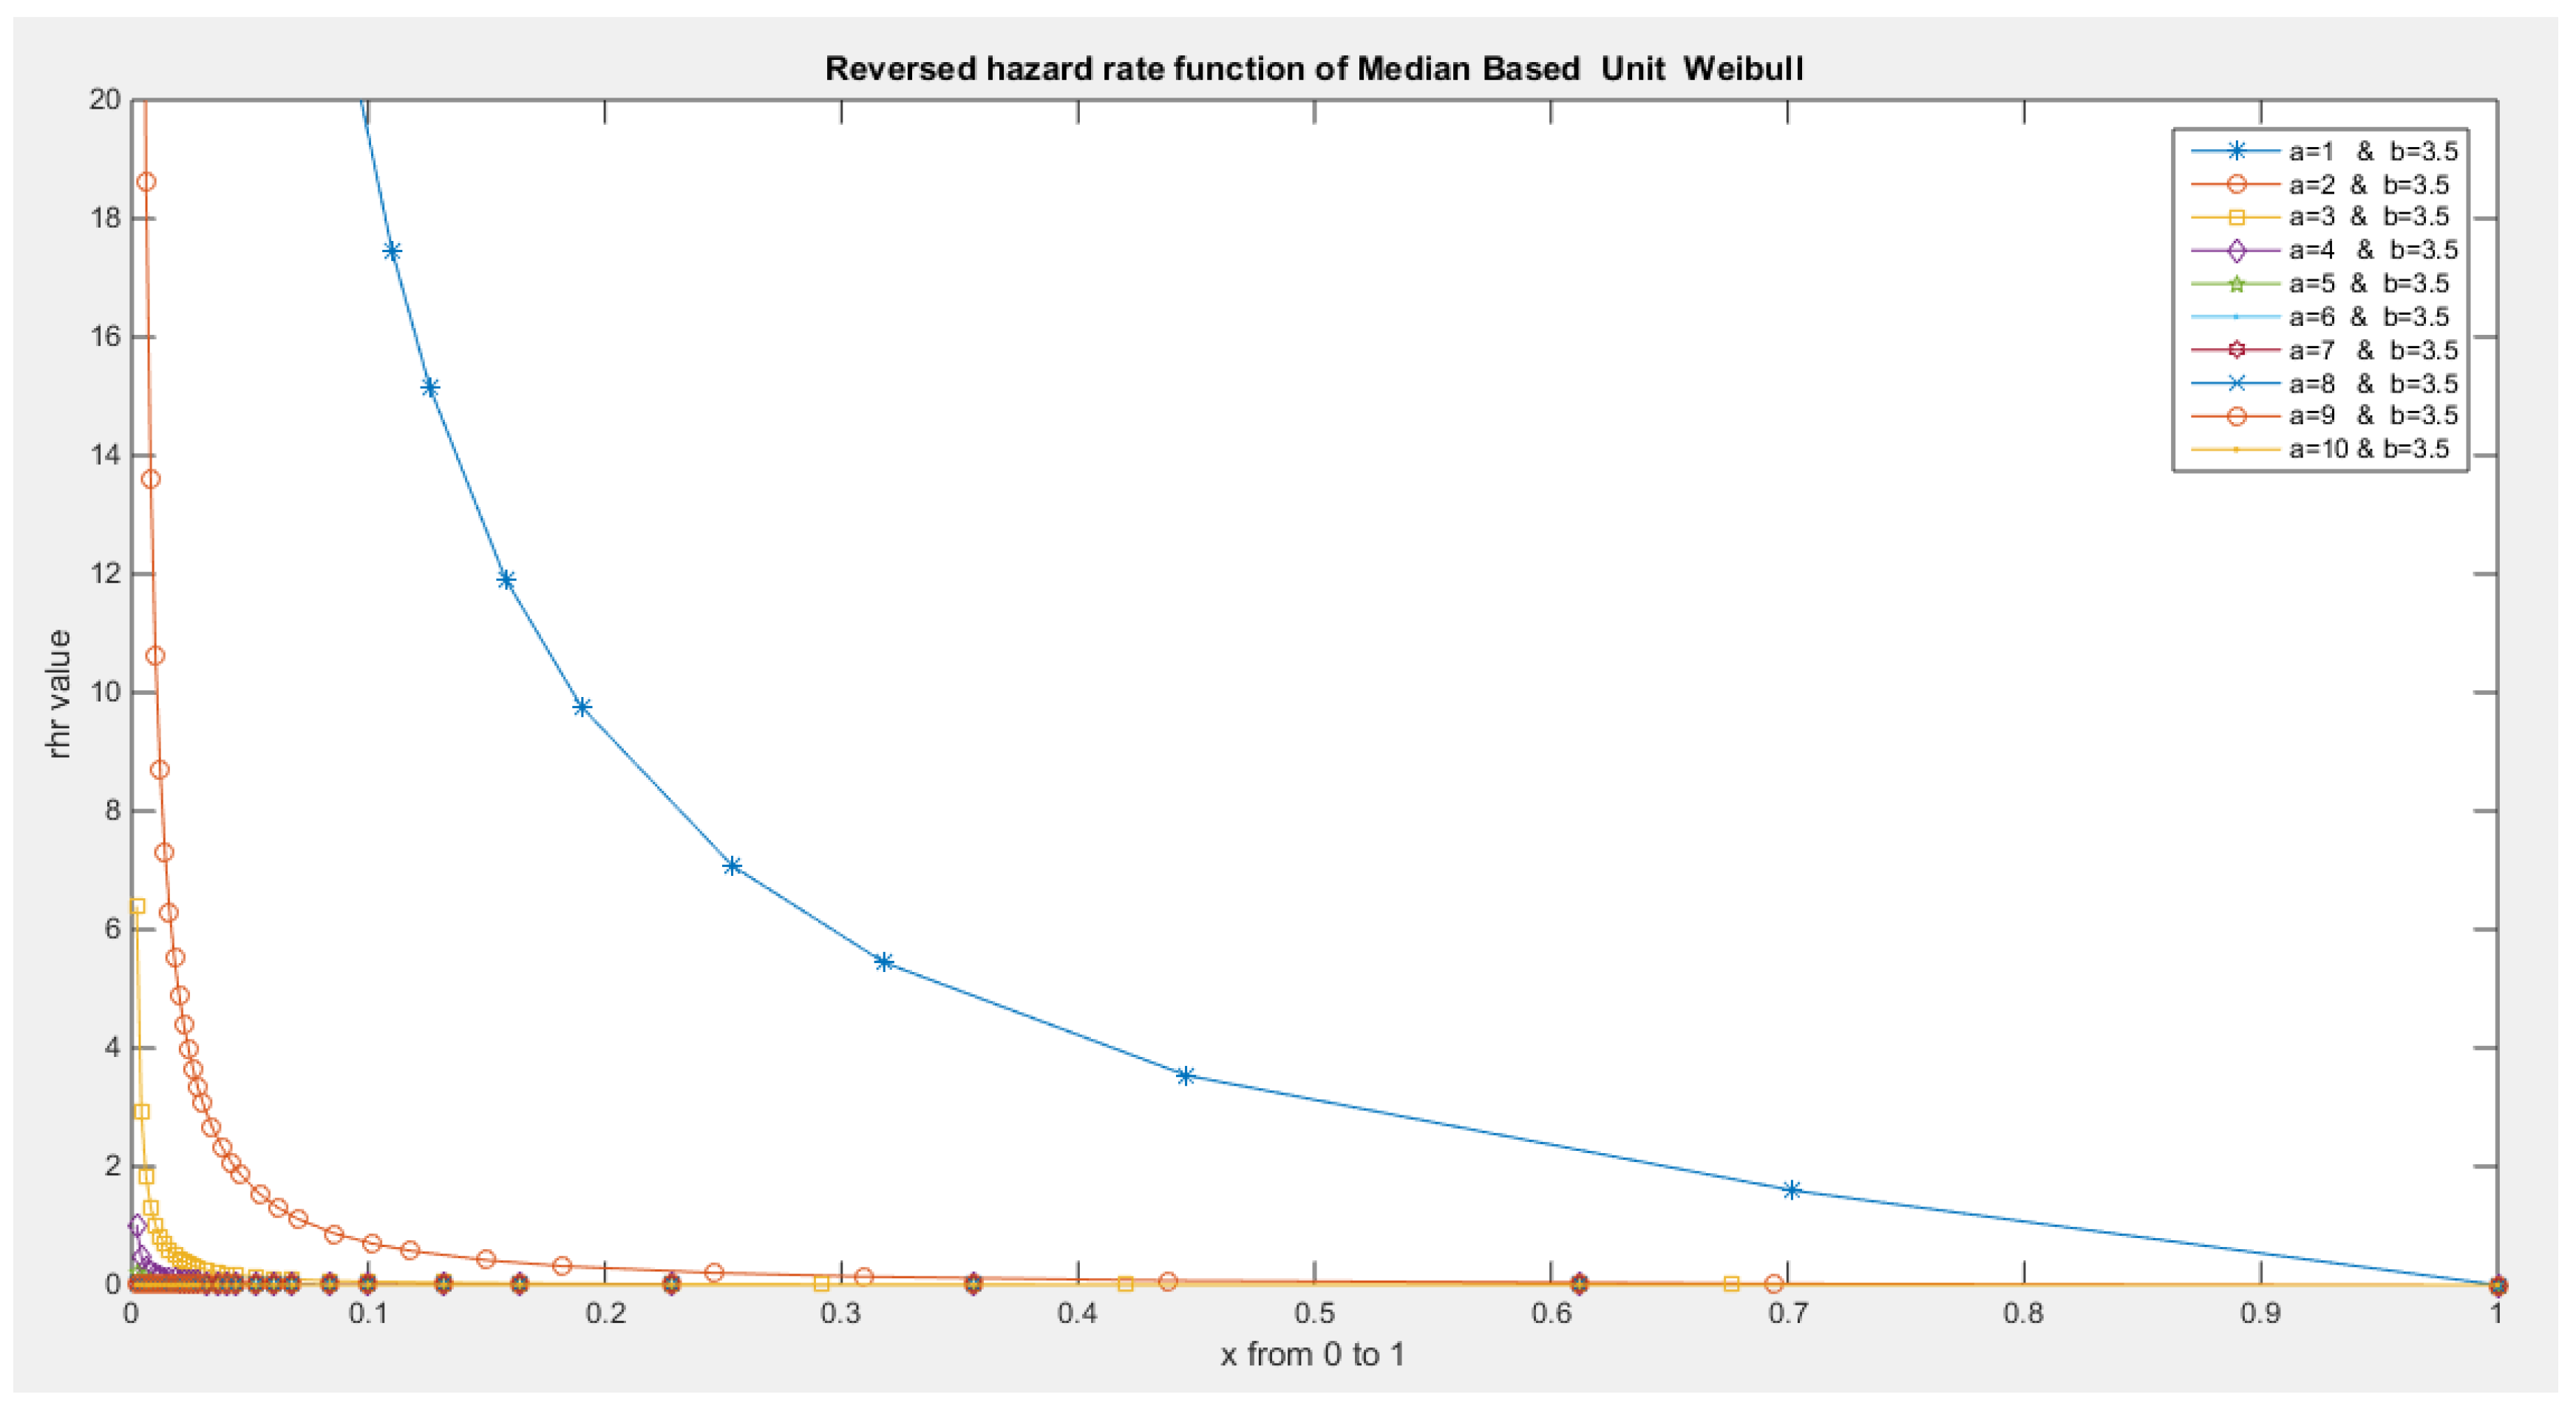
- The following is the hazard function (hf) and reversed hazard function (rhf) respectively:
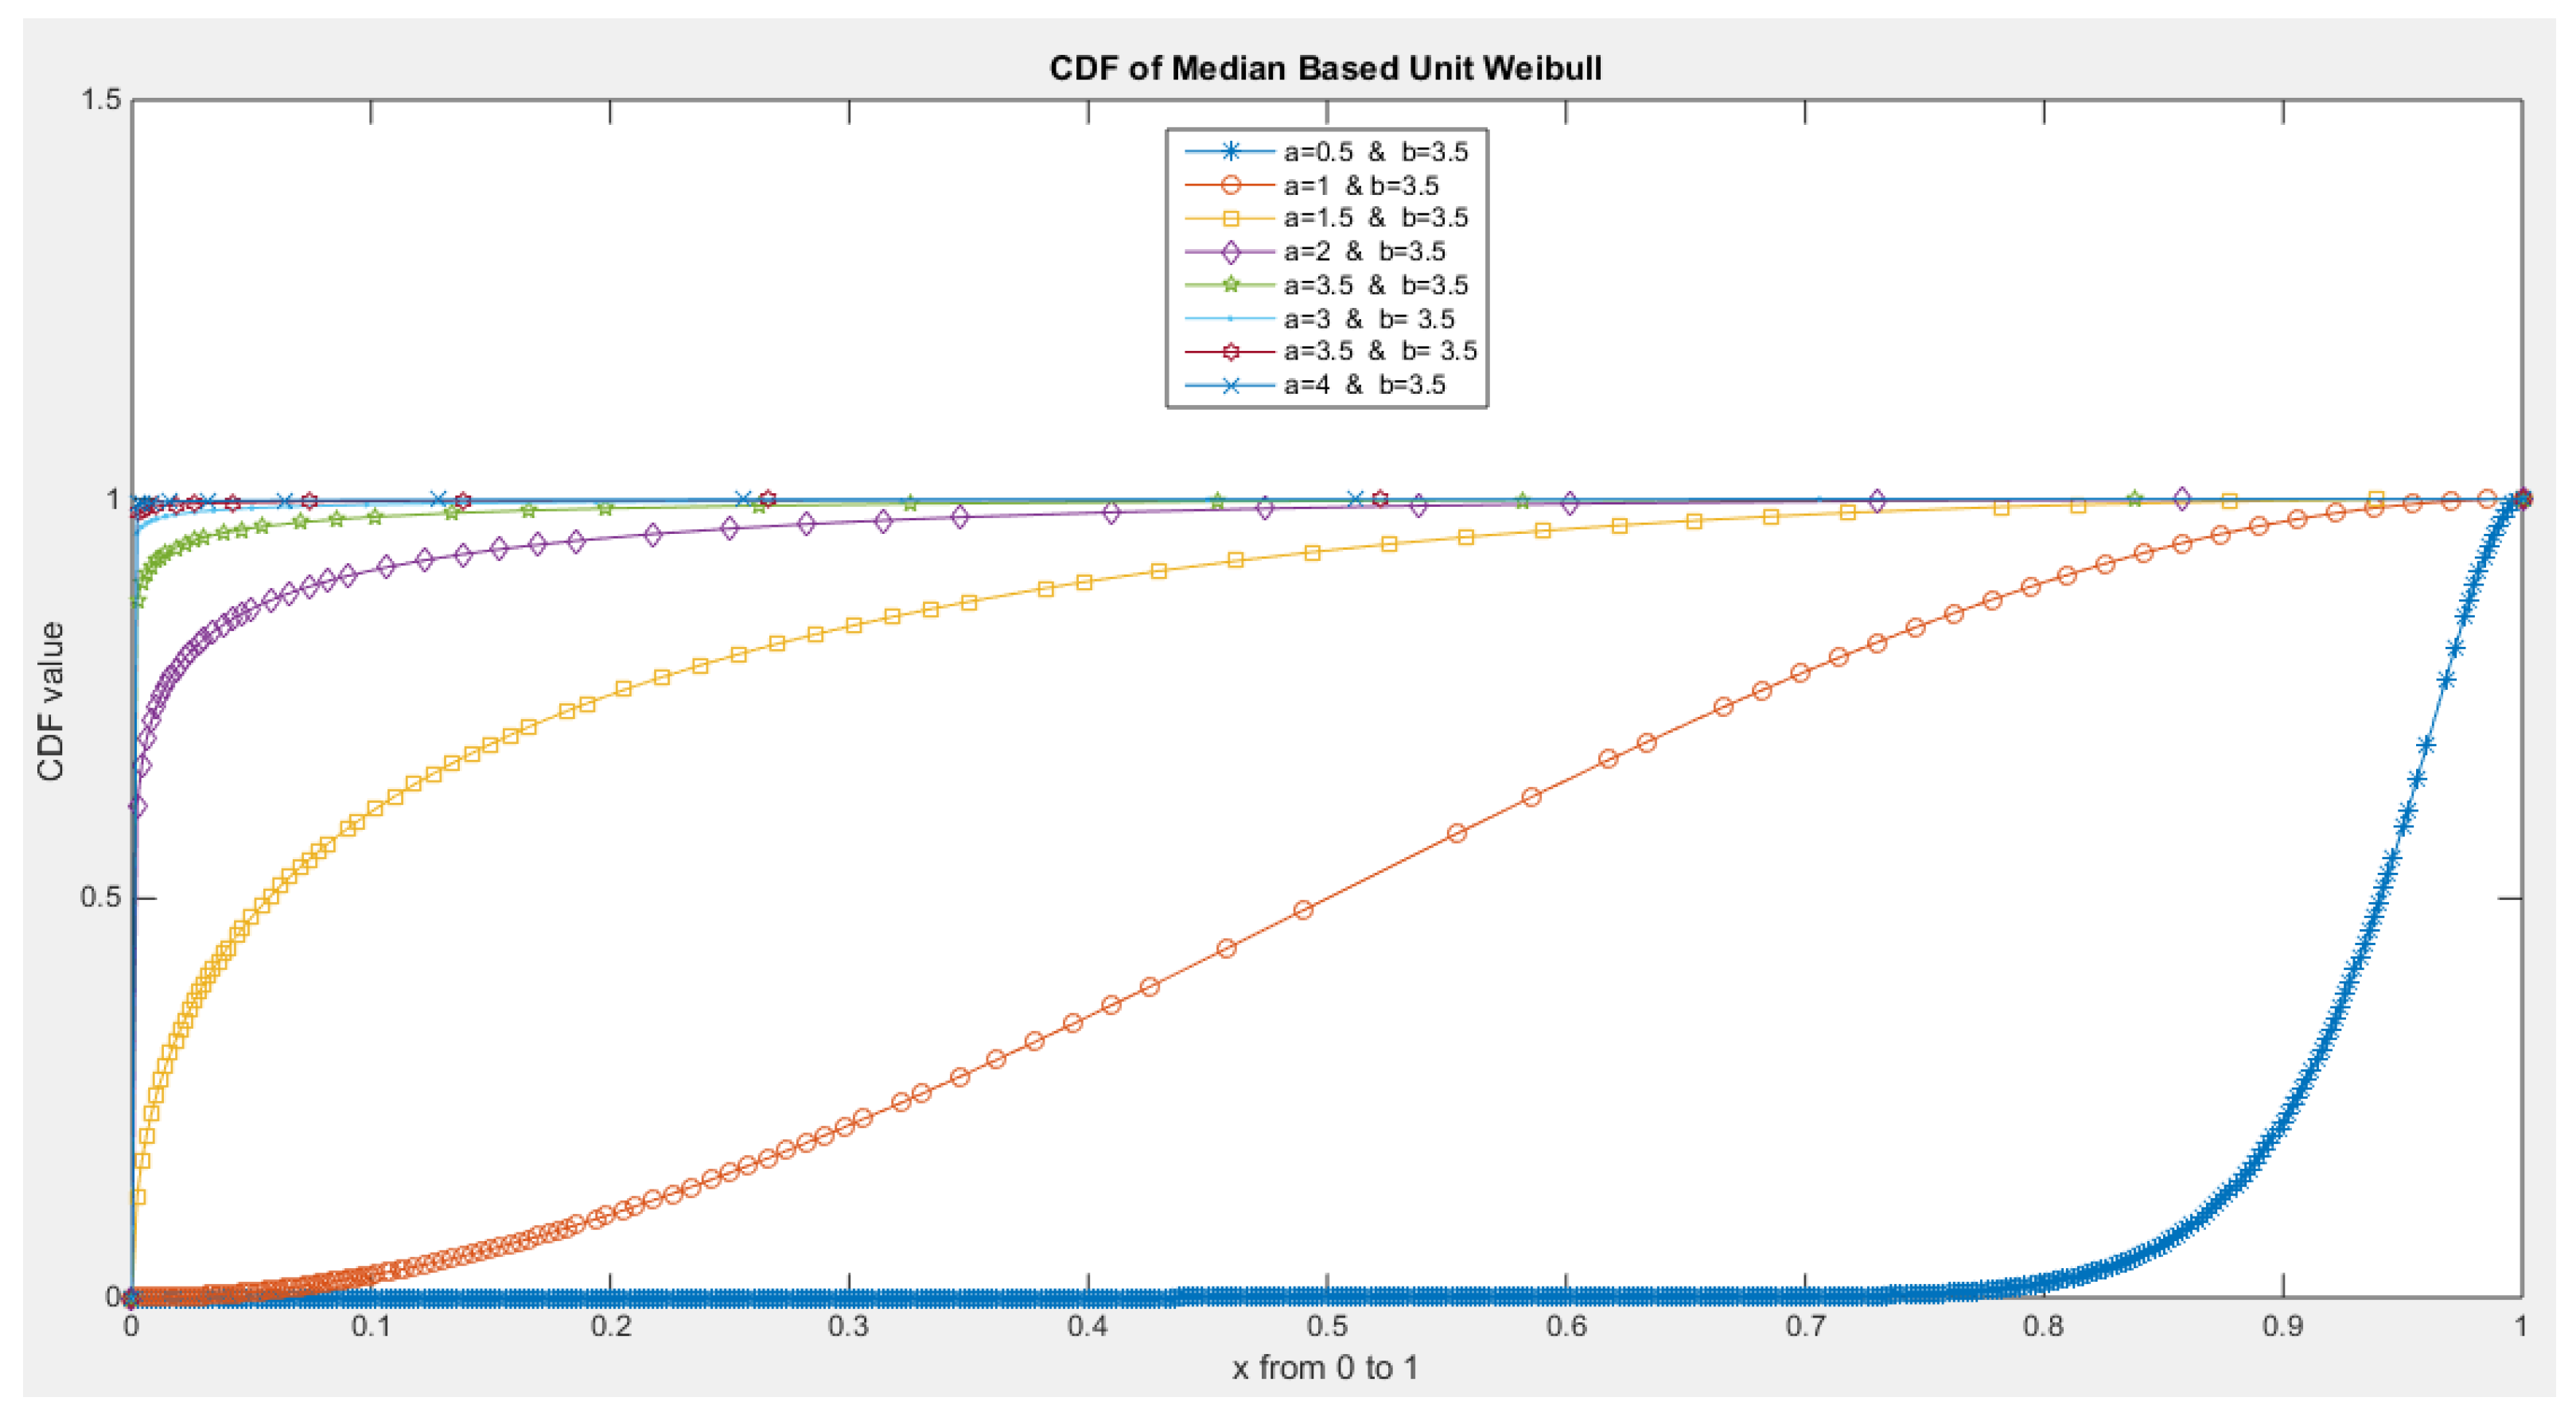

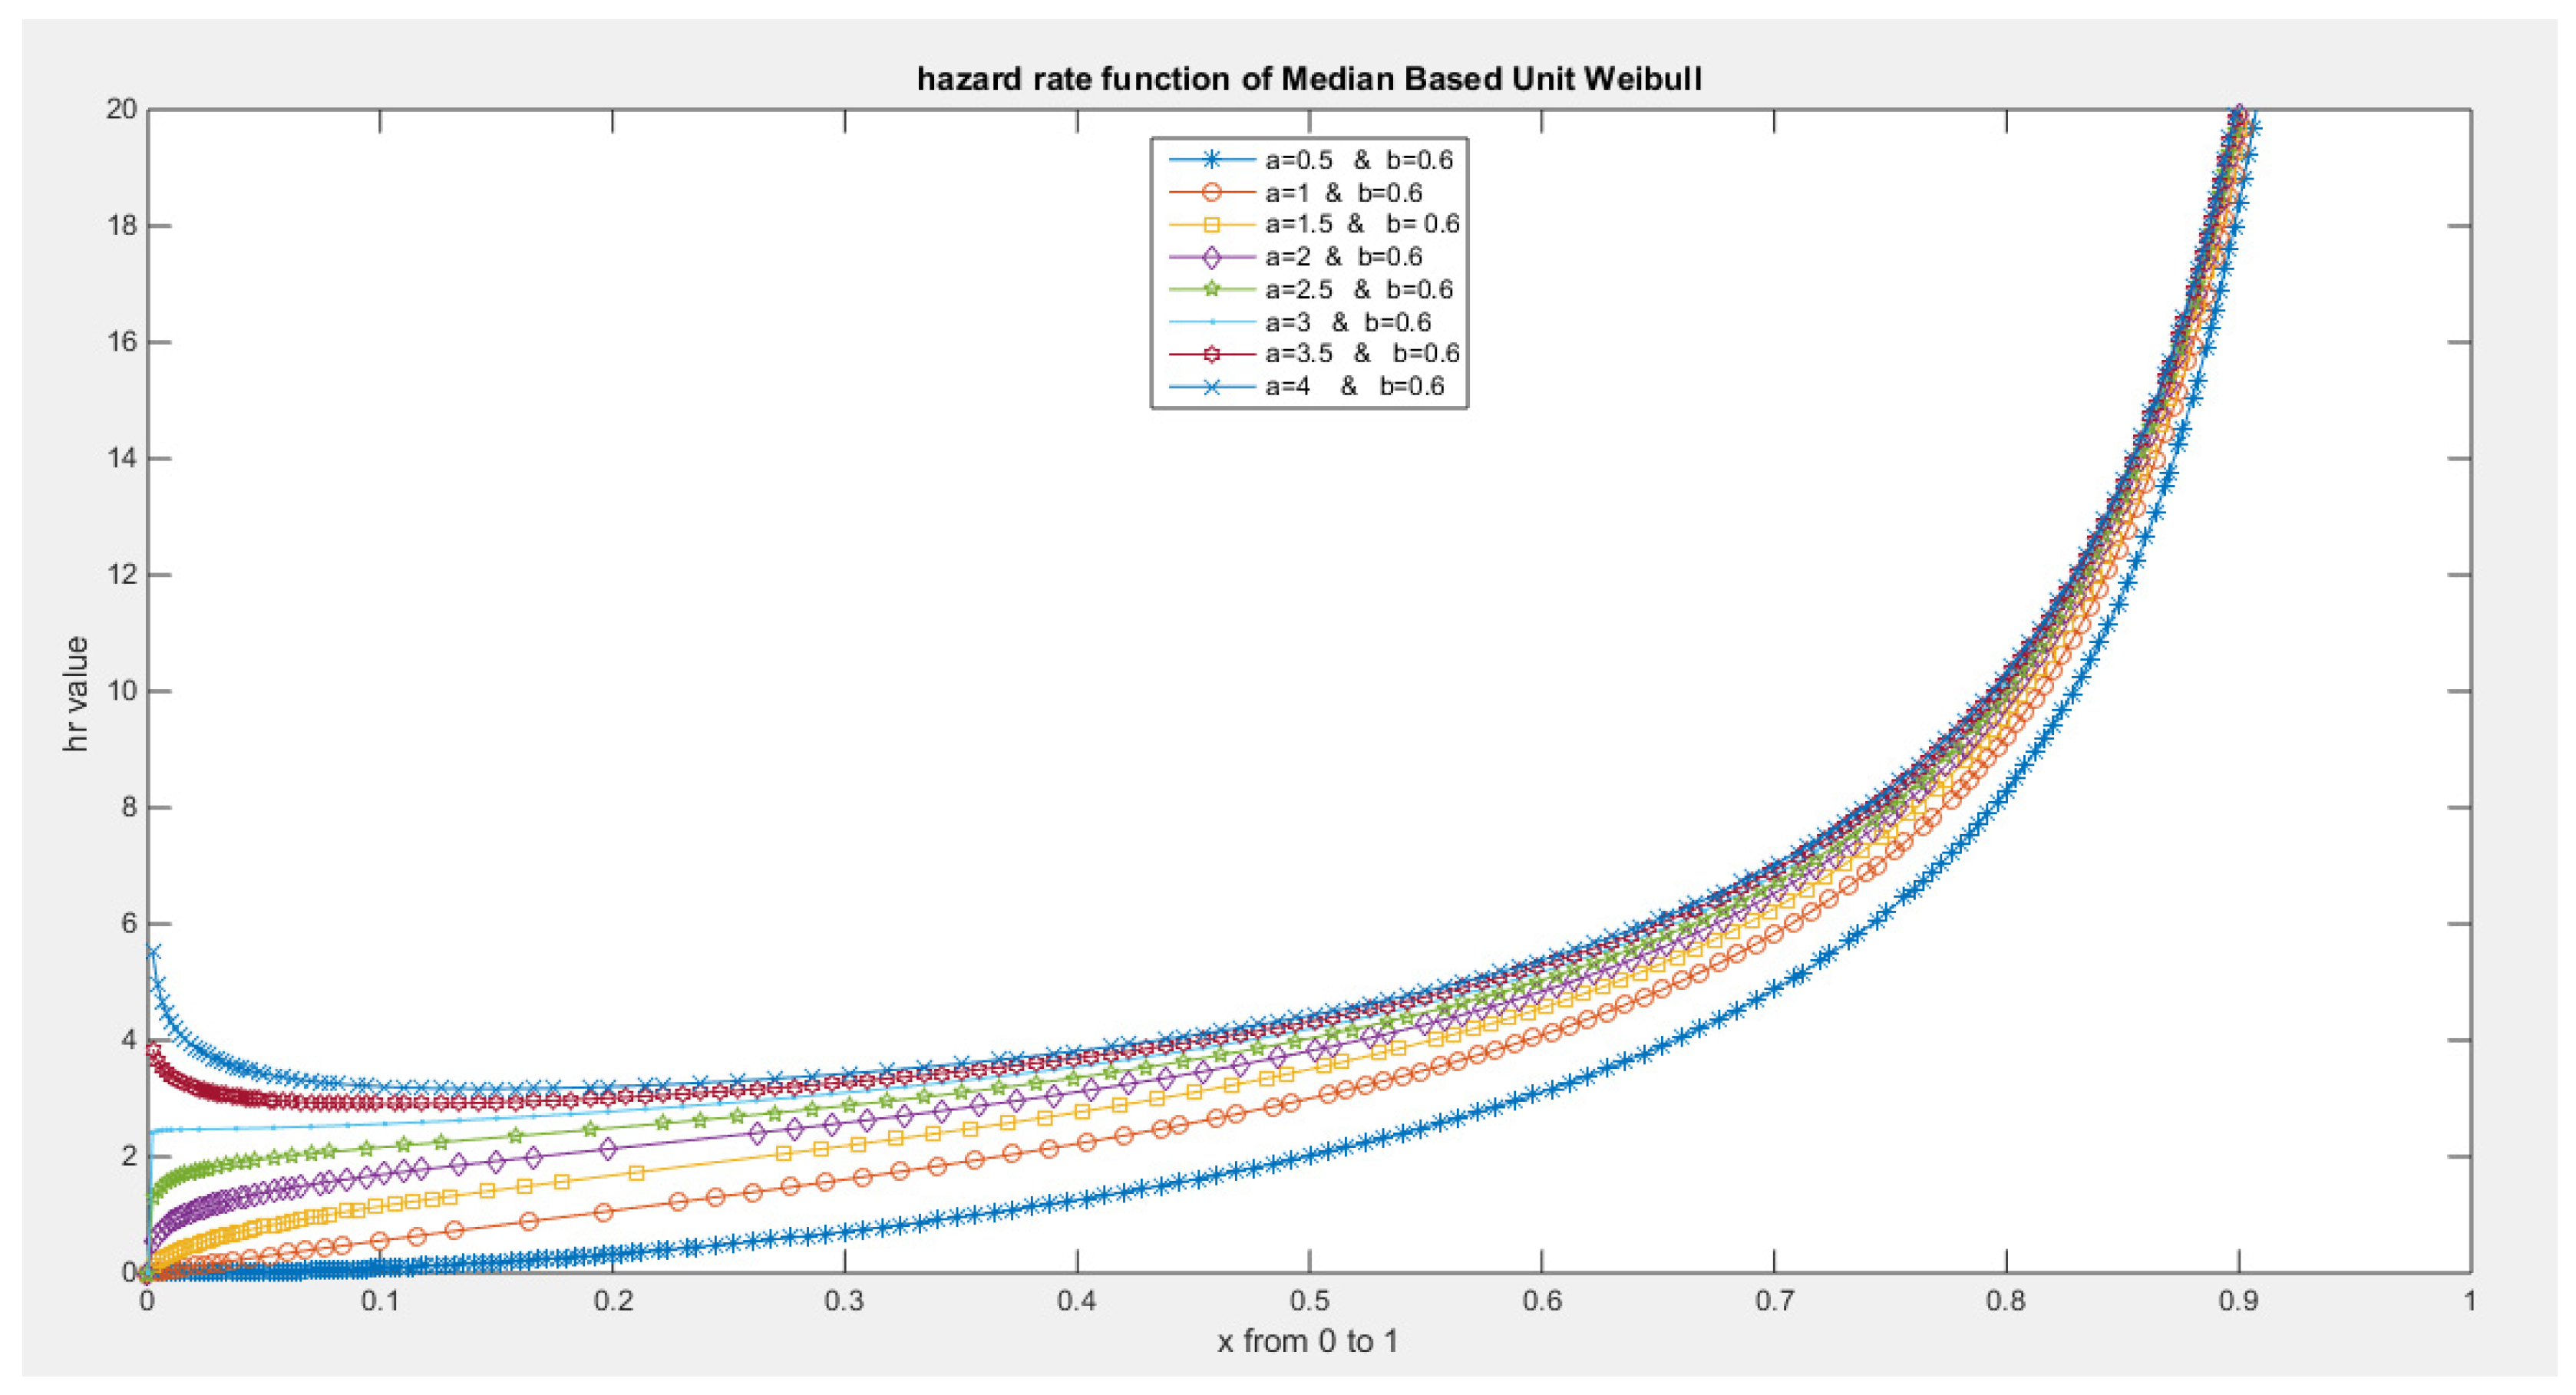
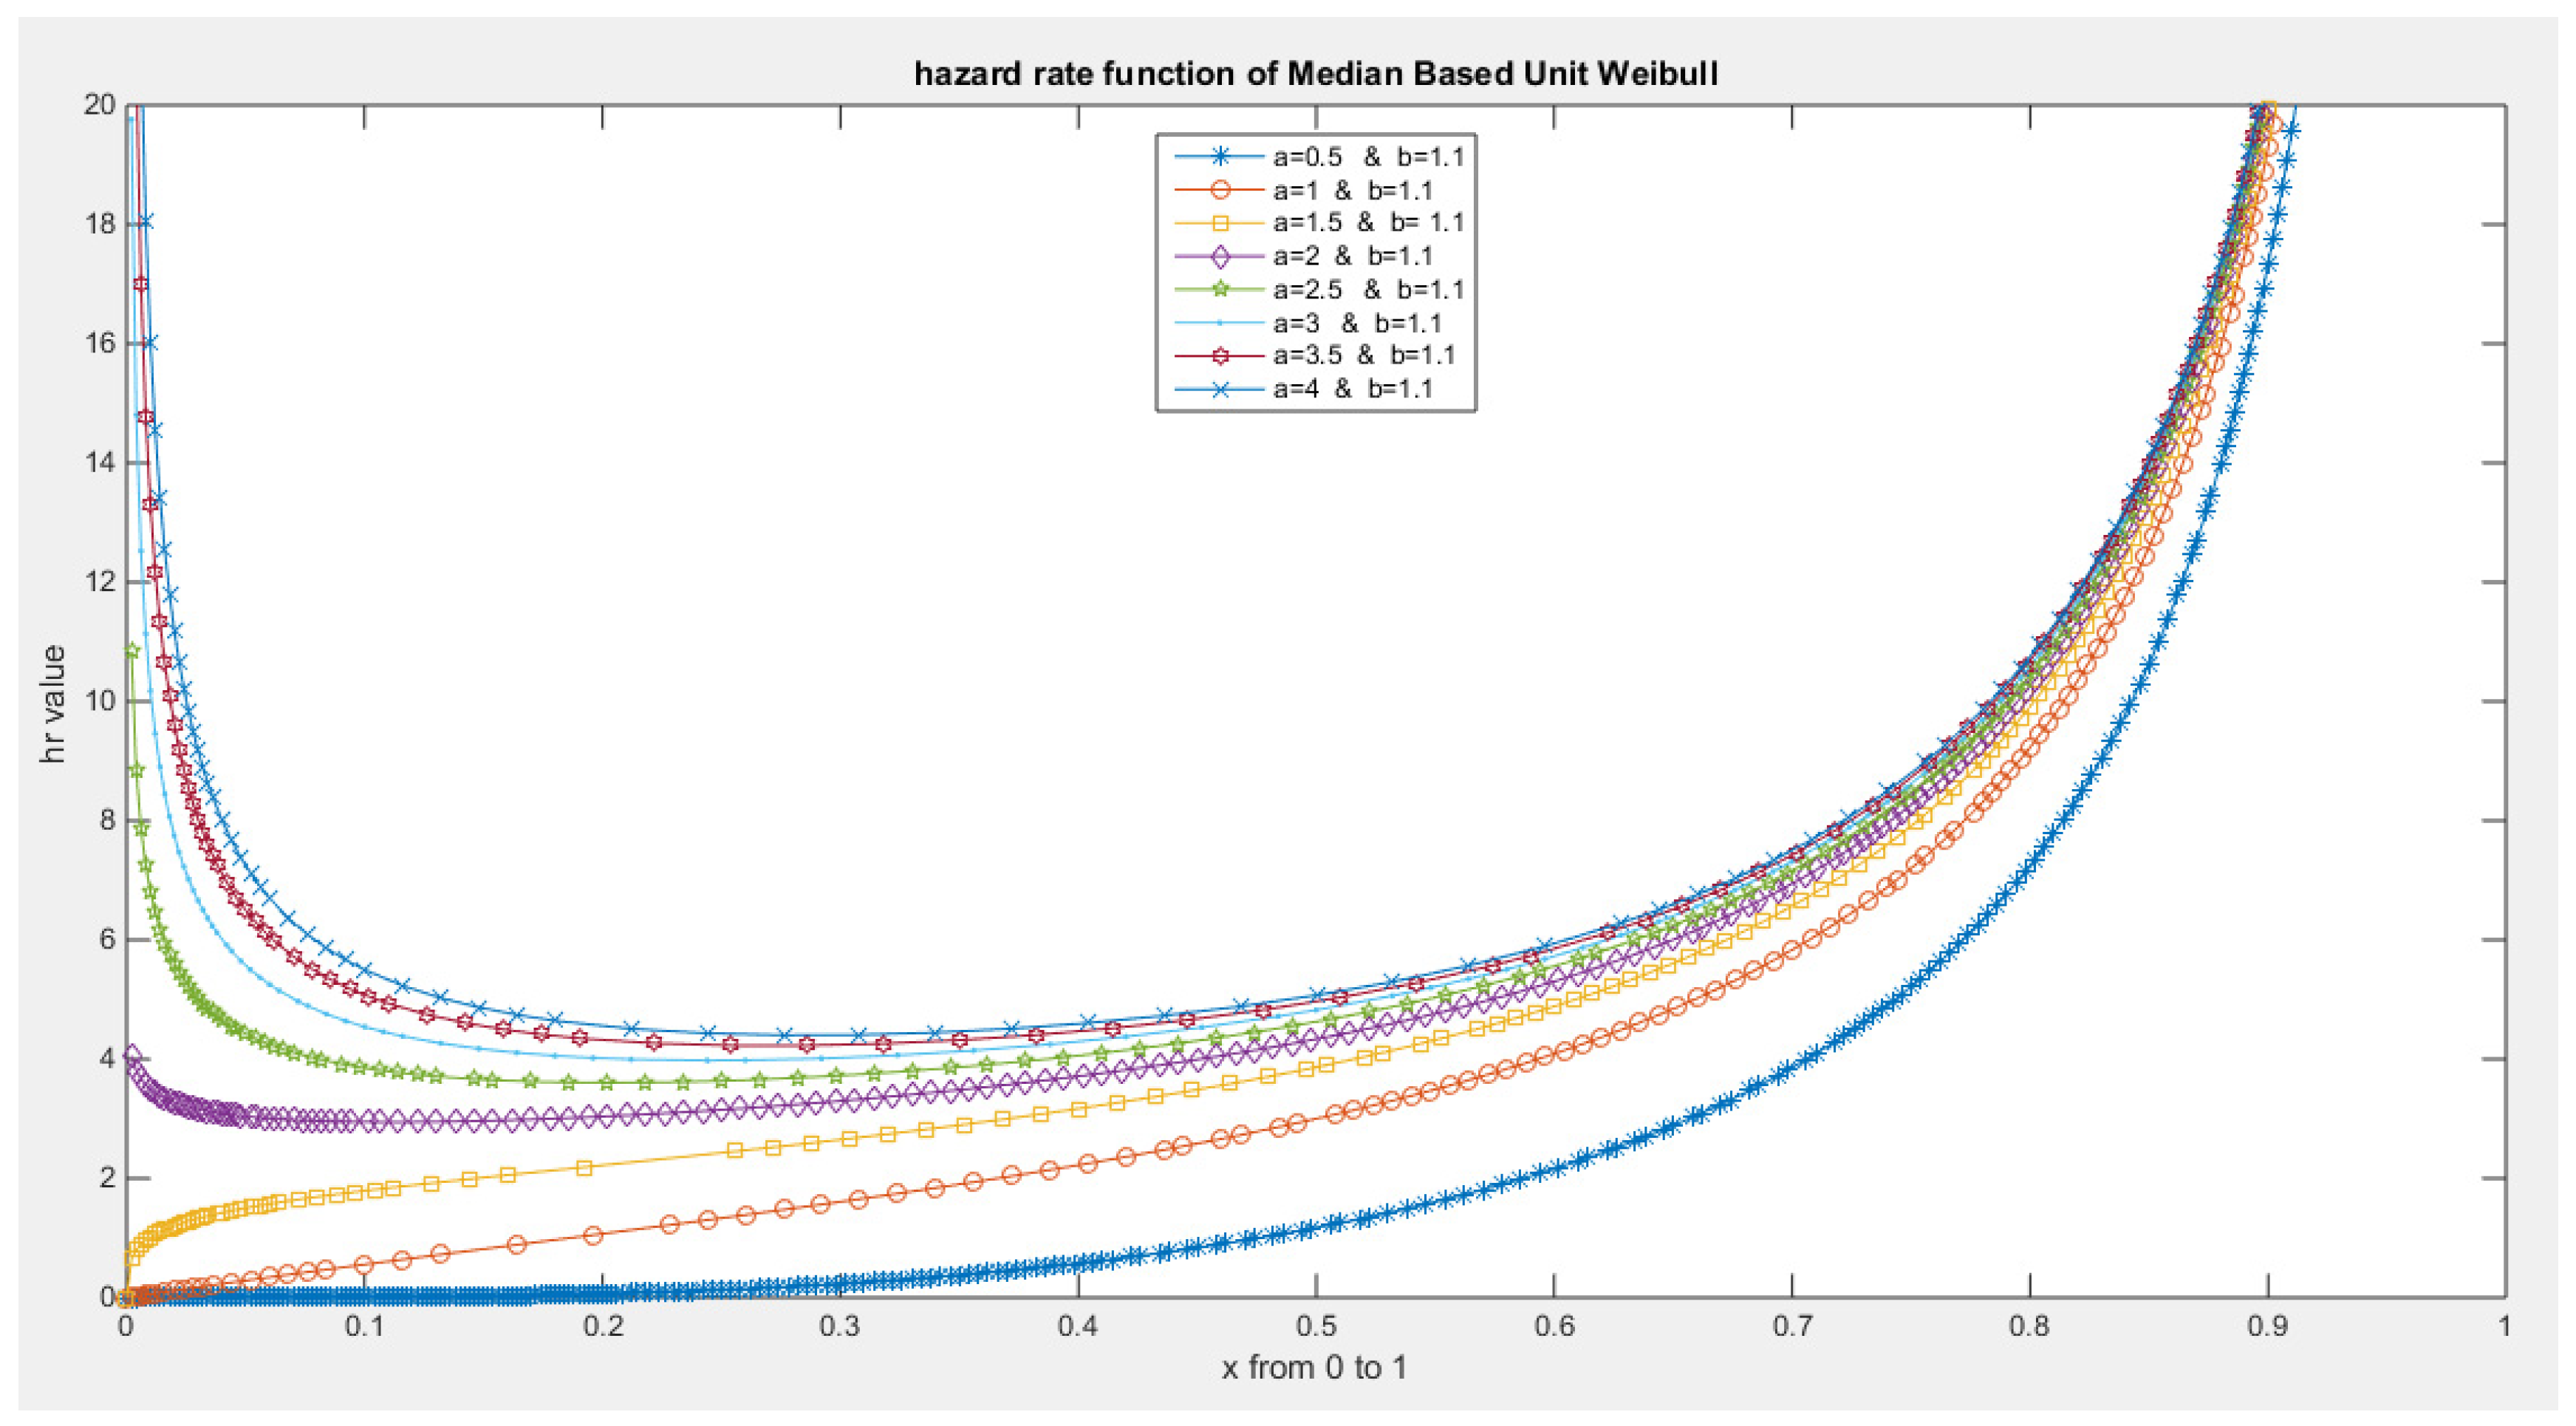
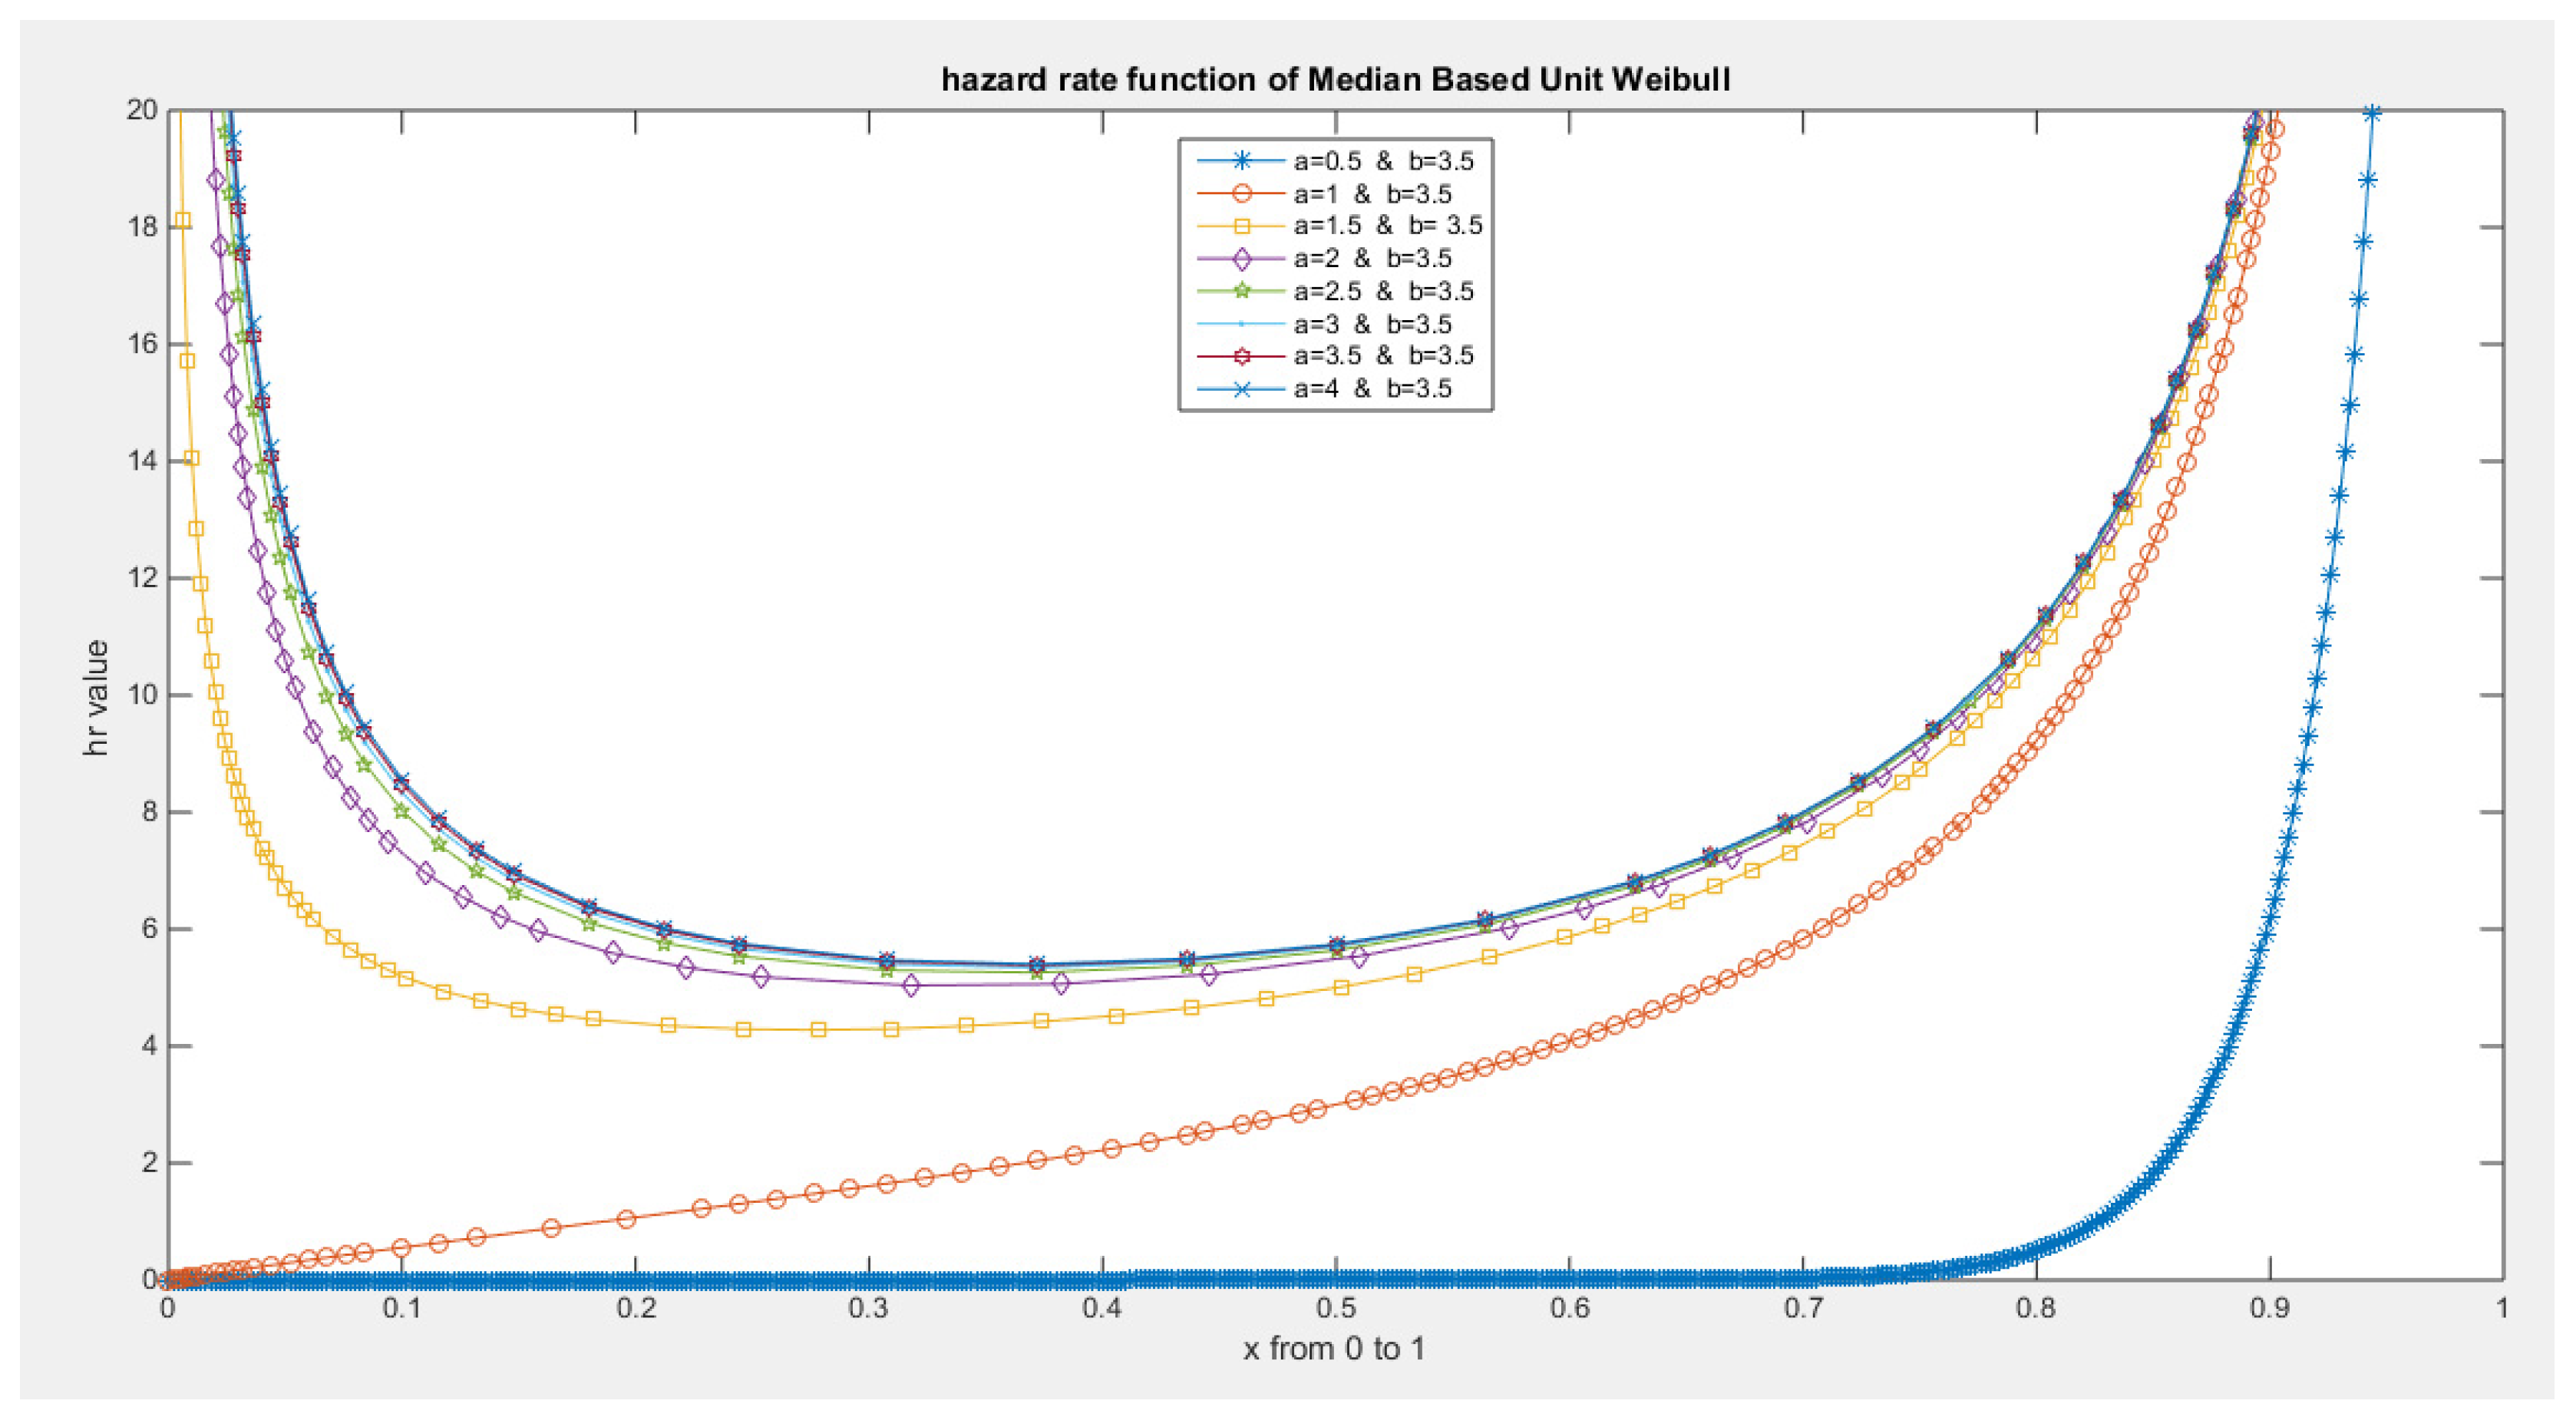

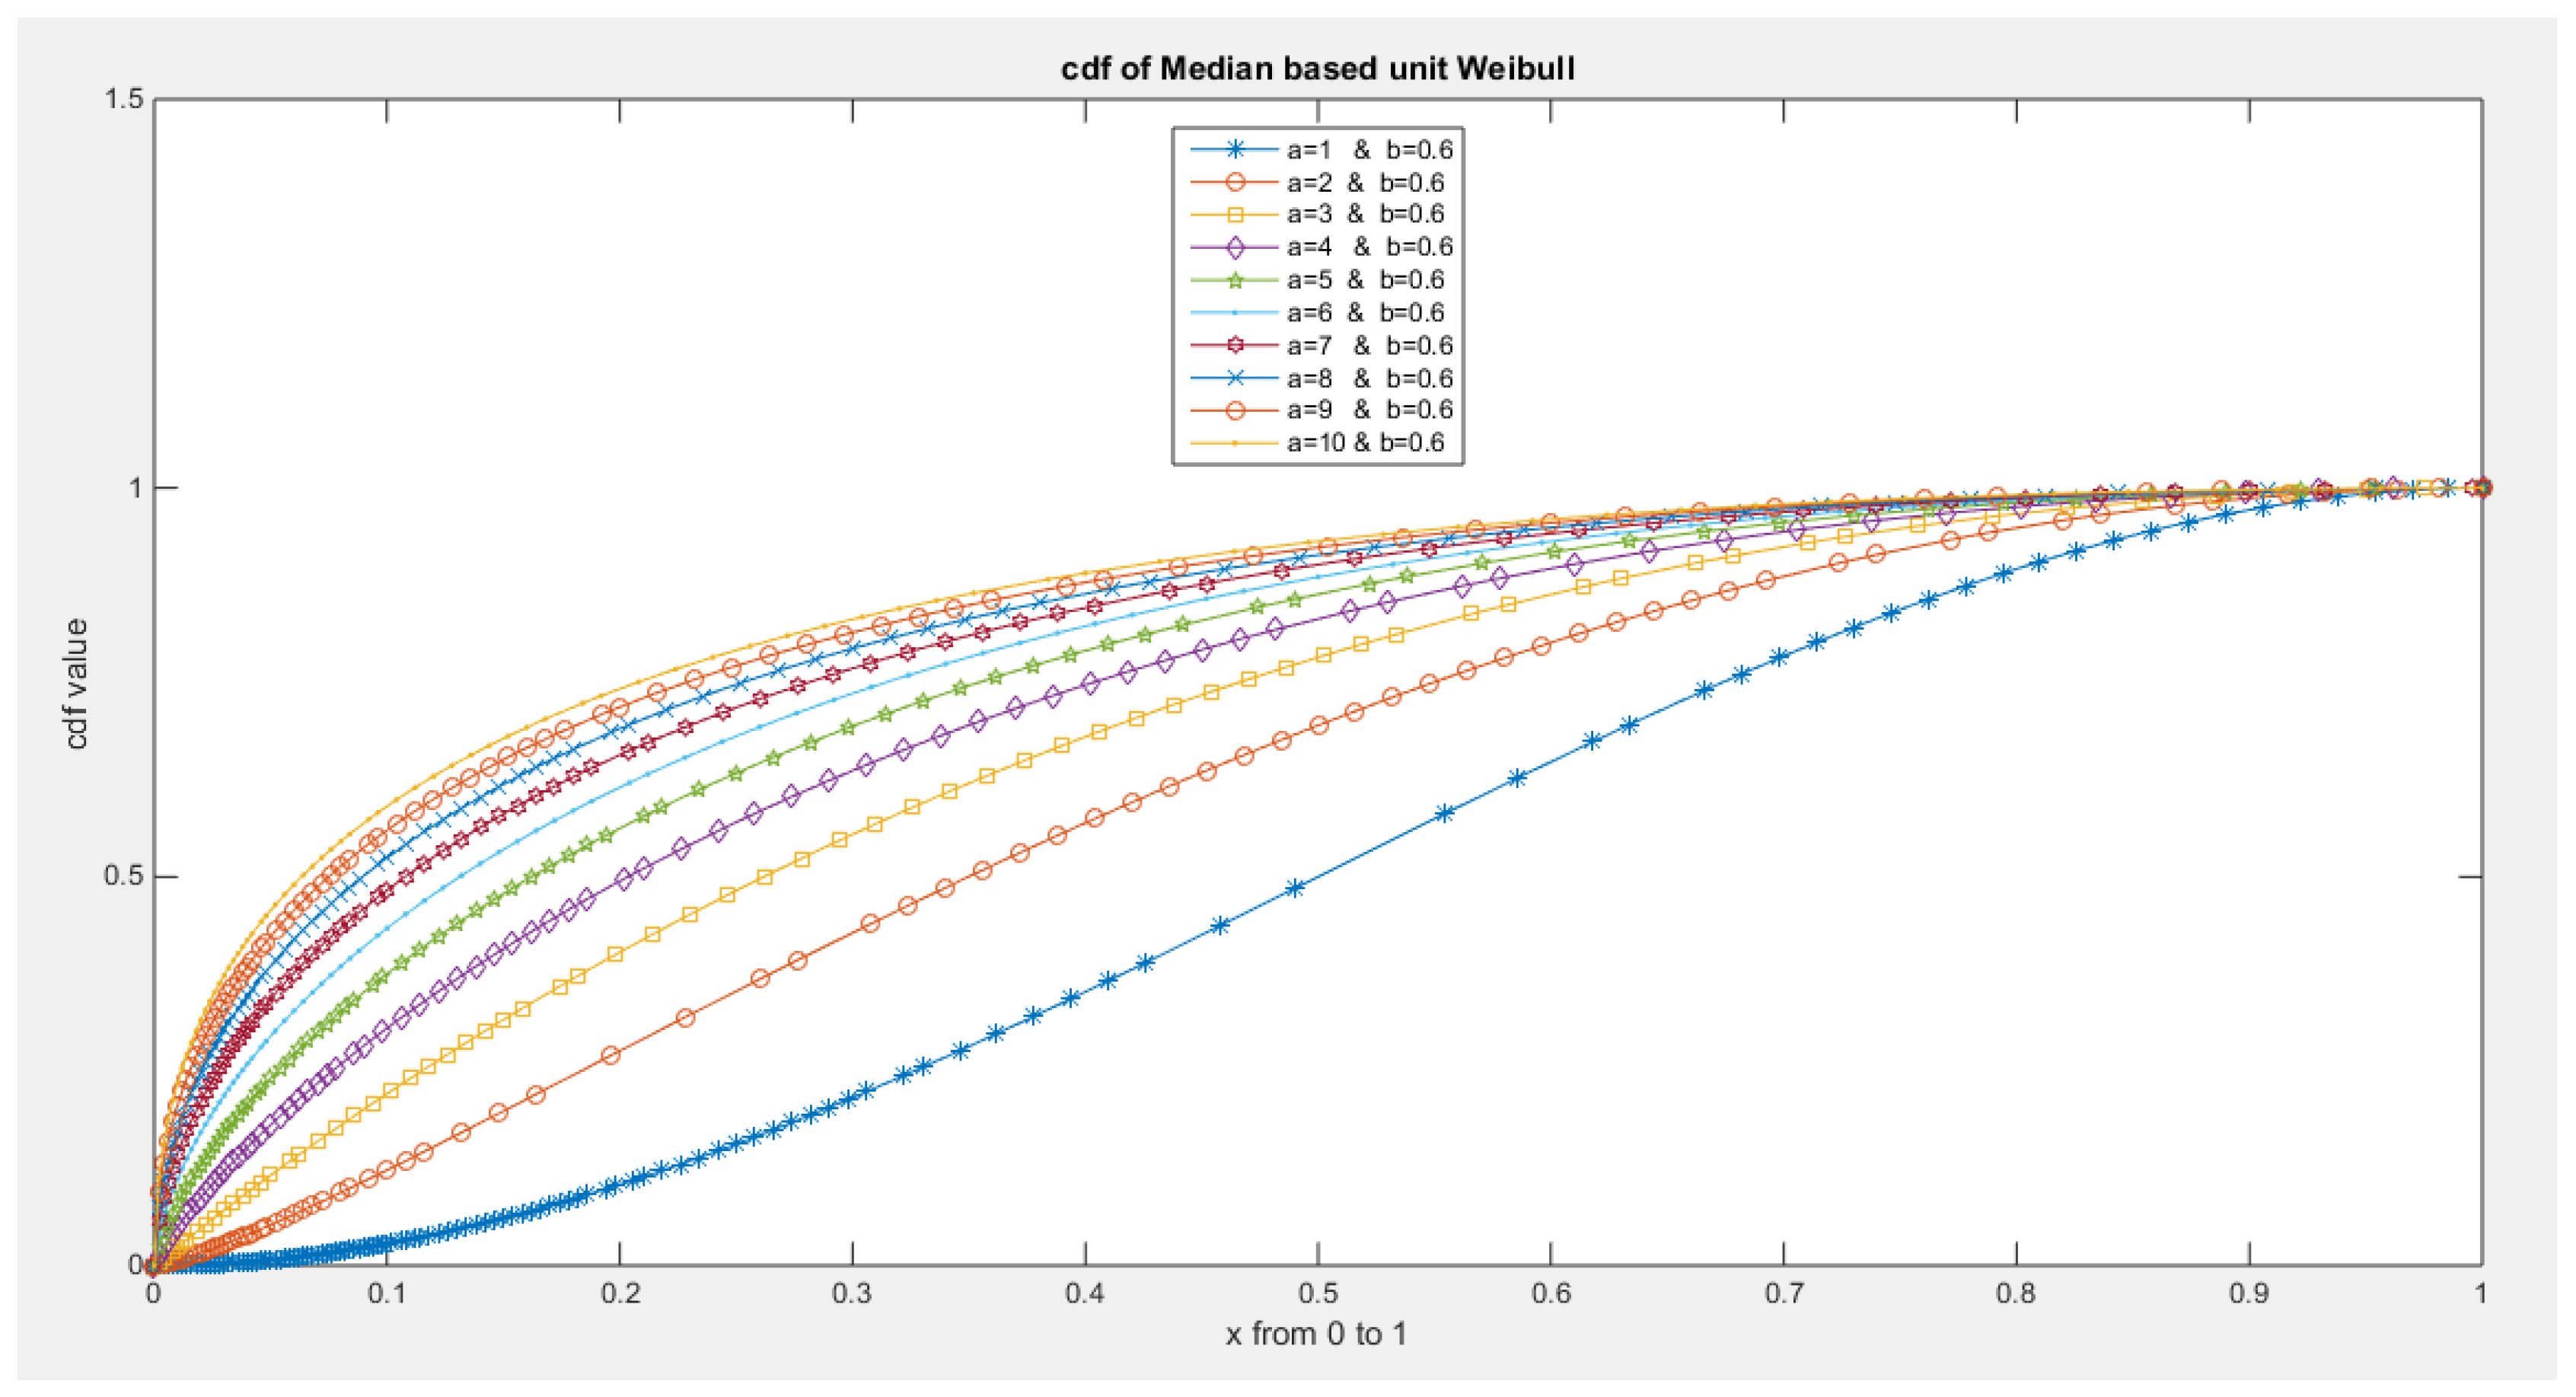
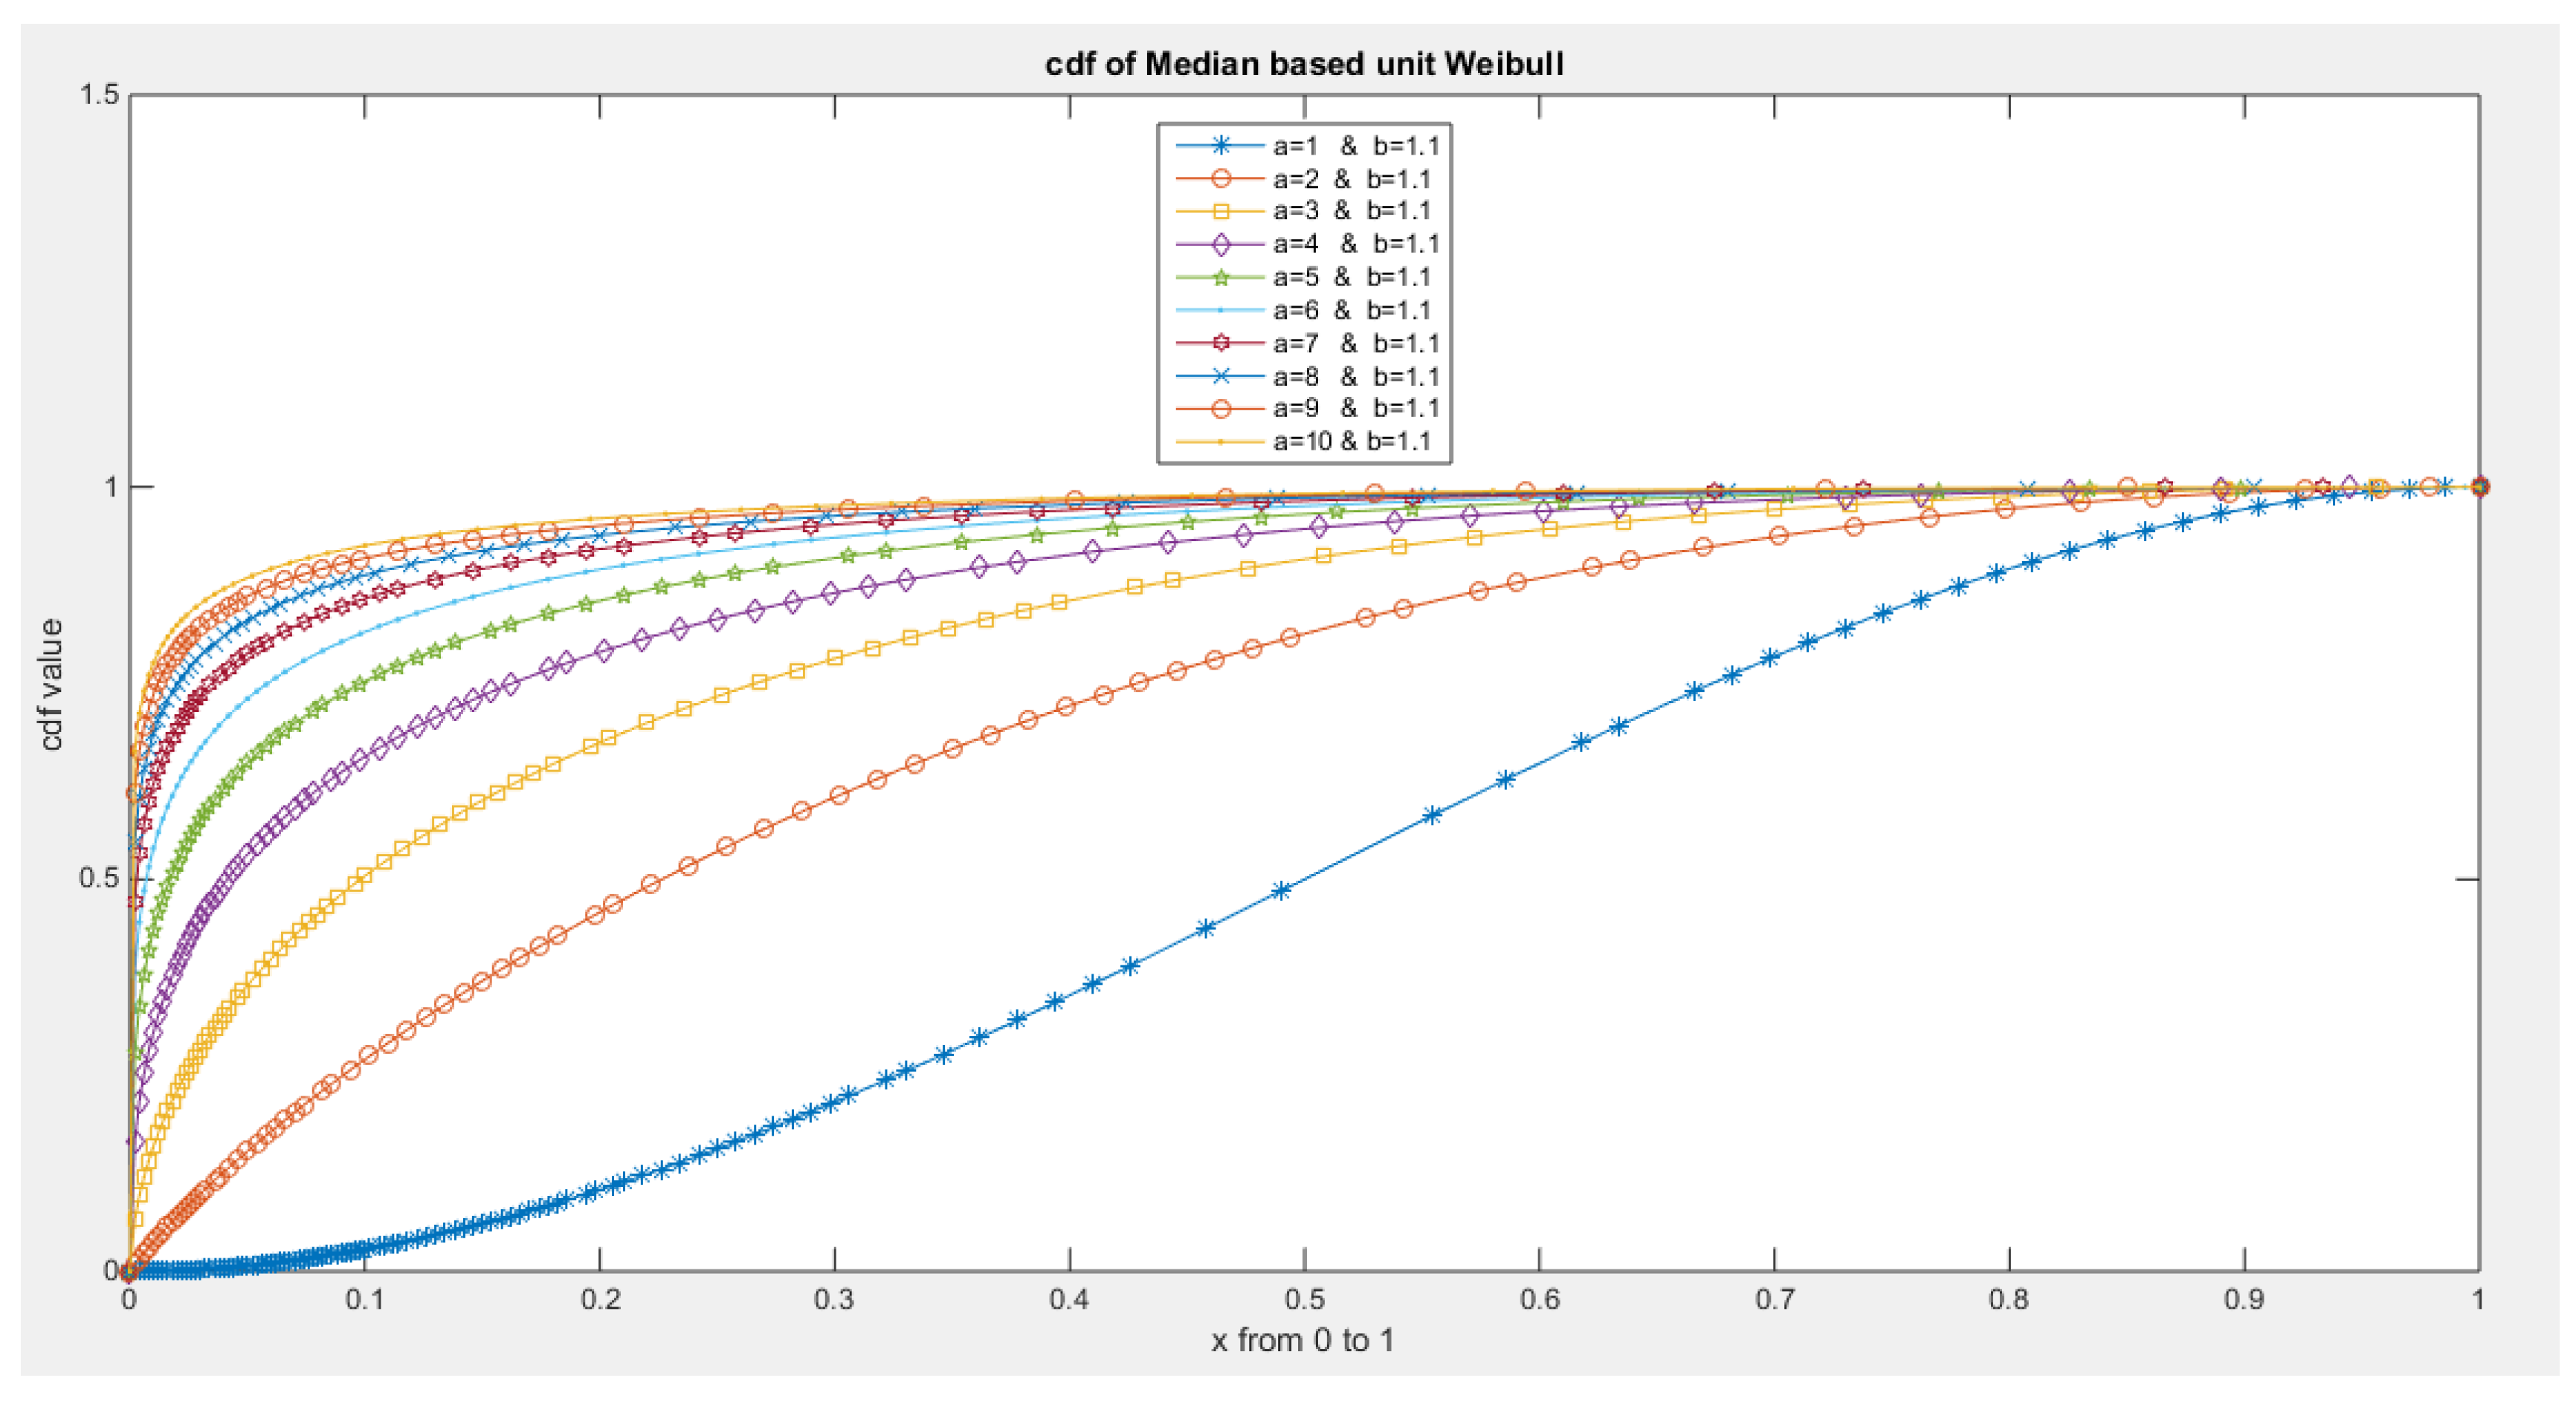
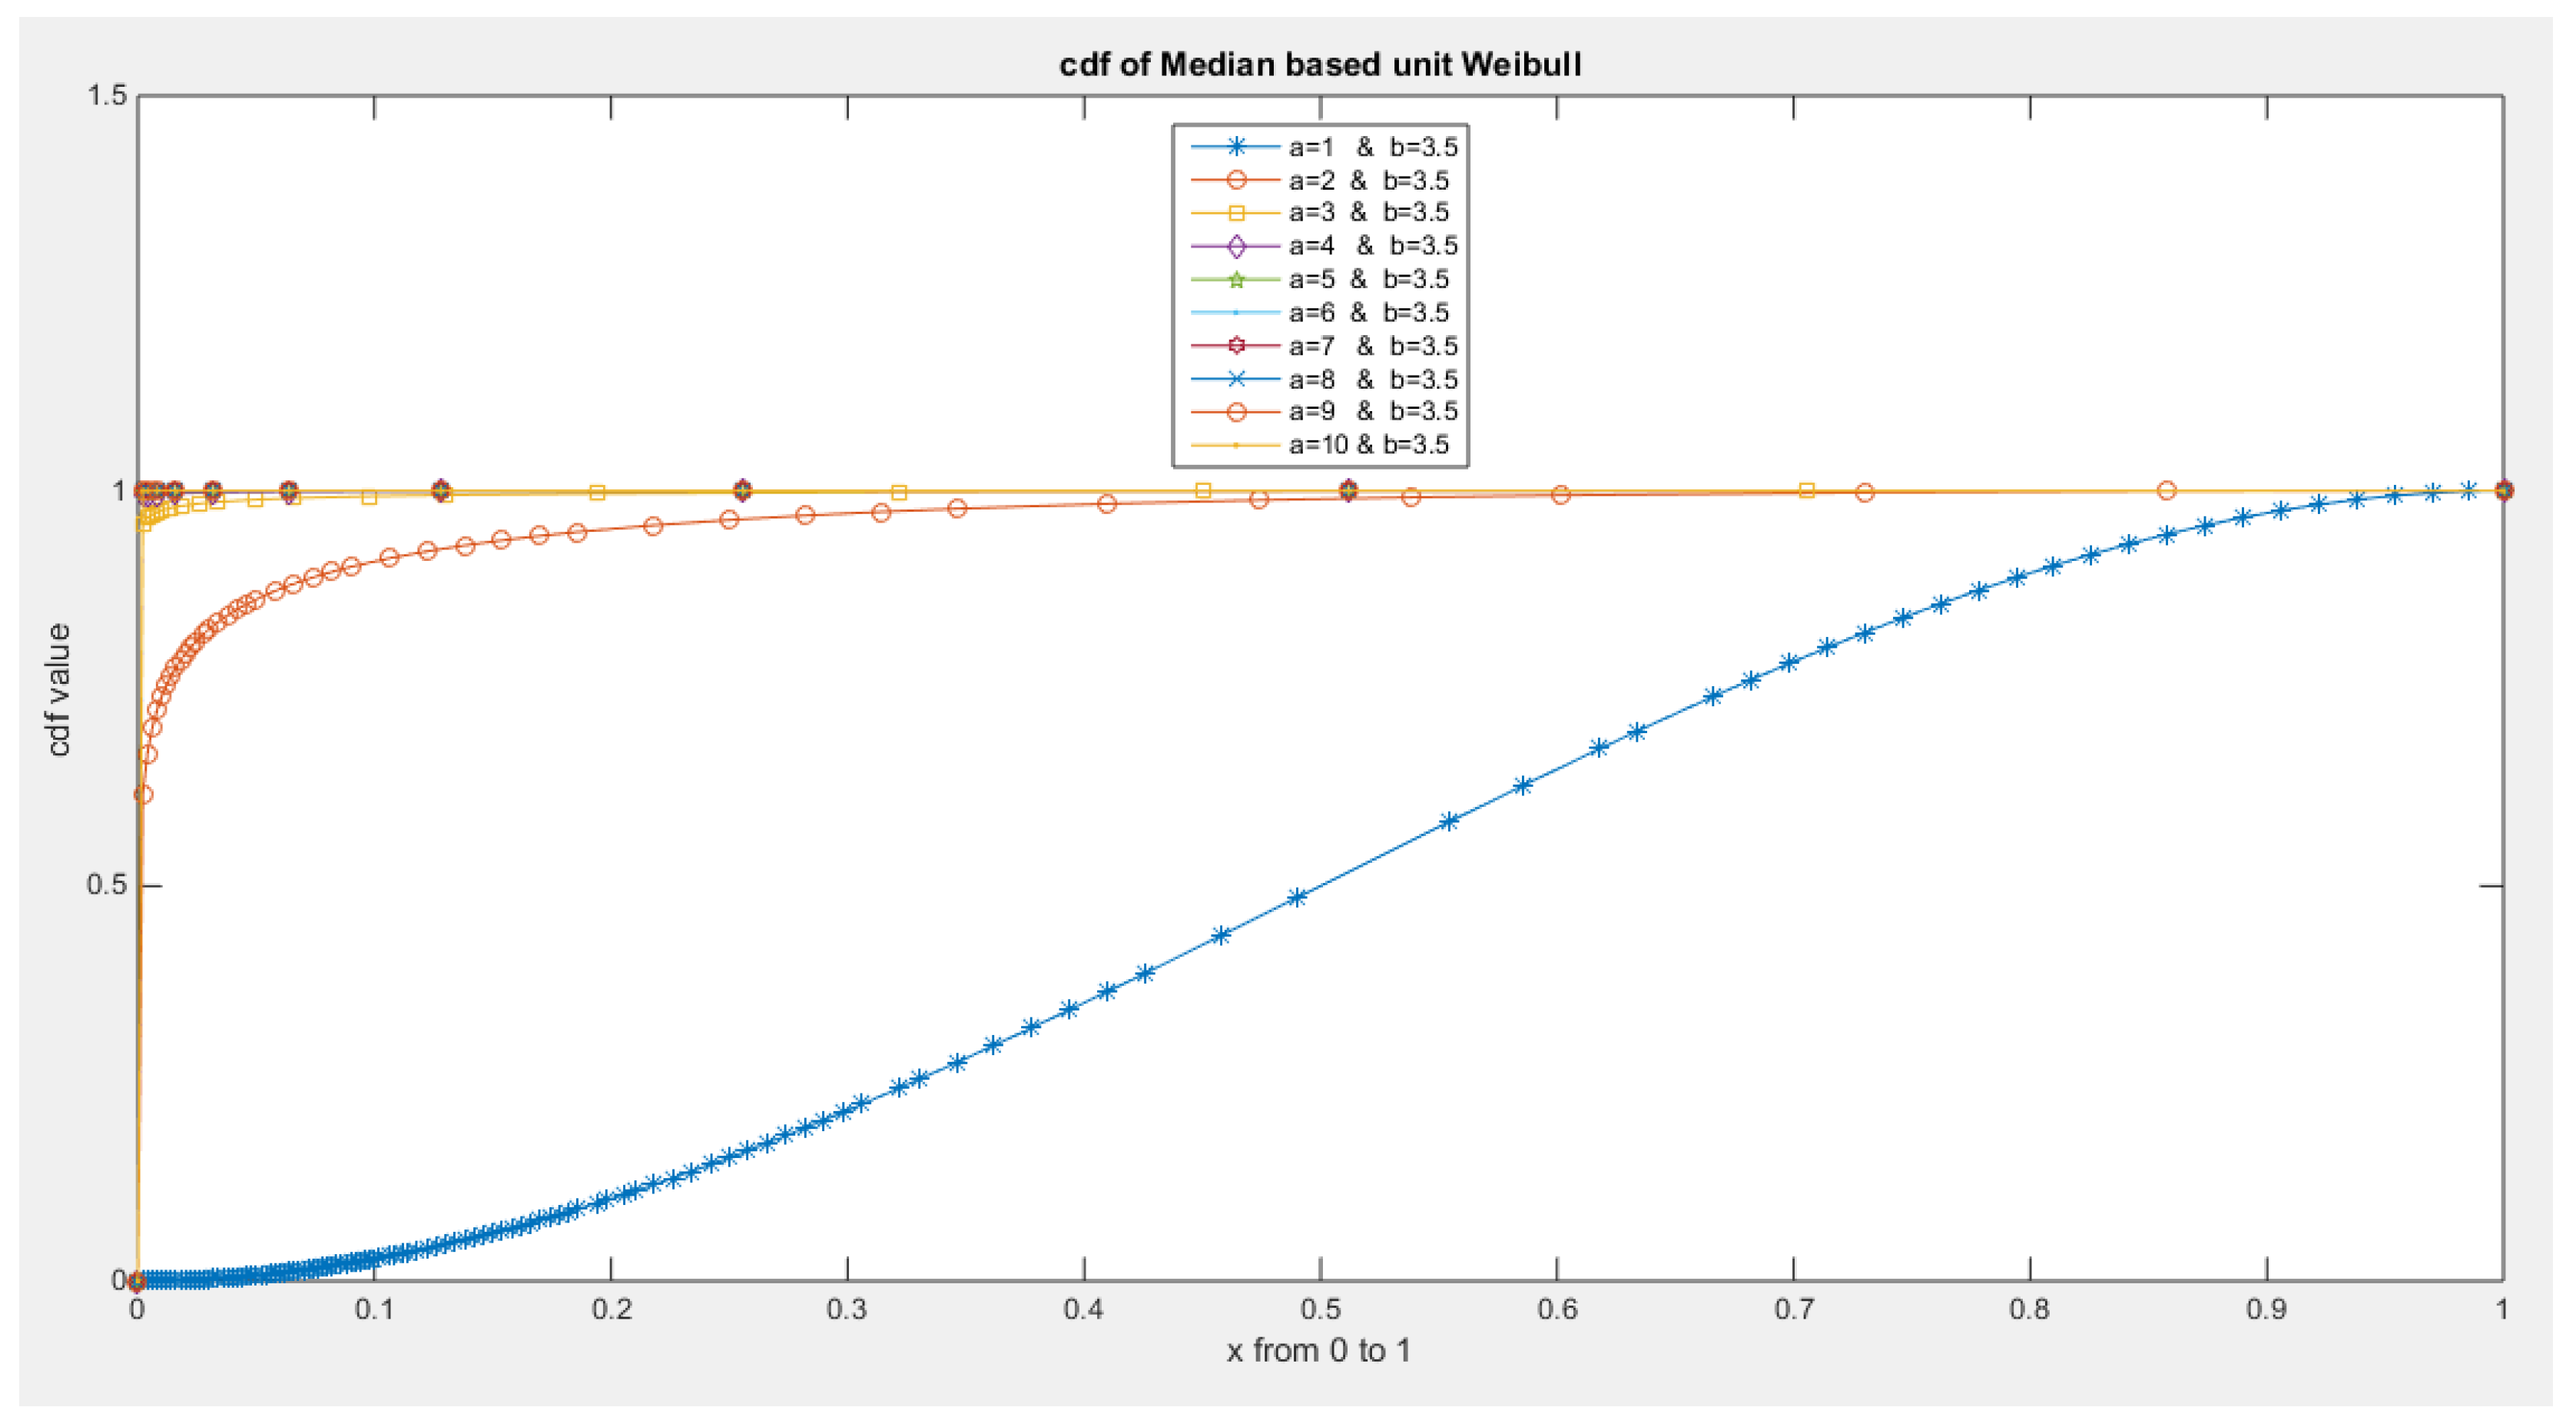

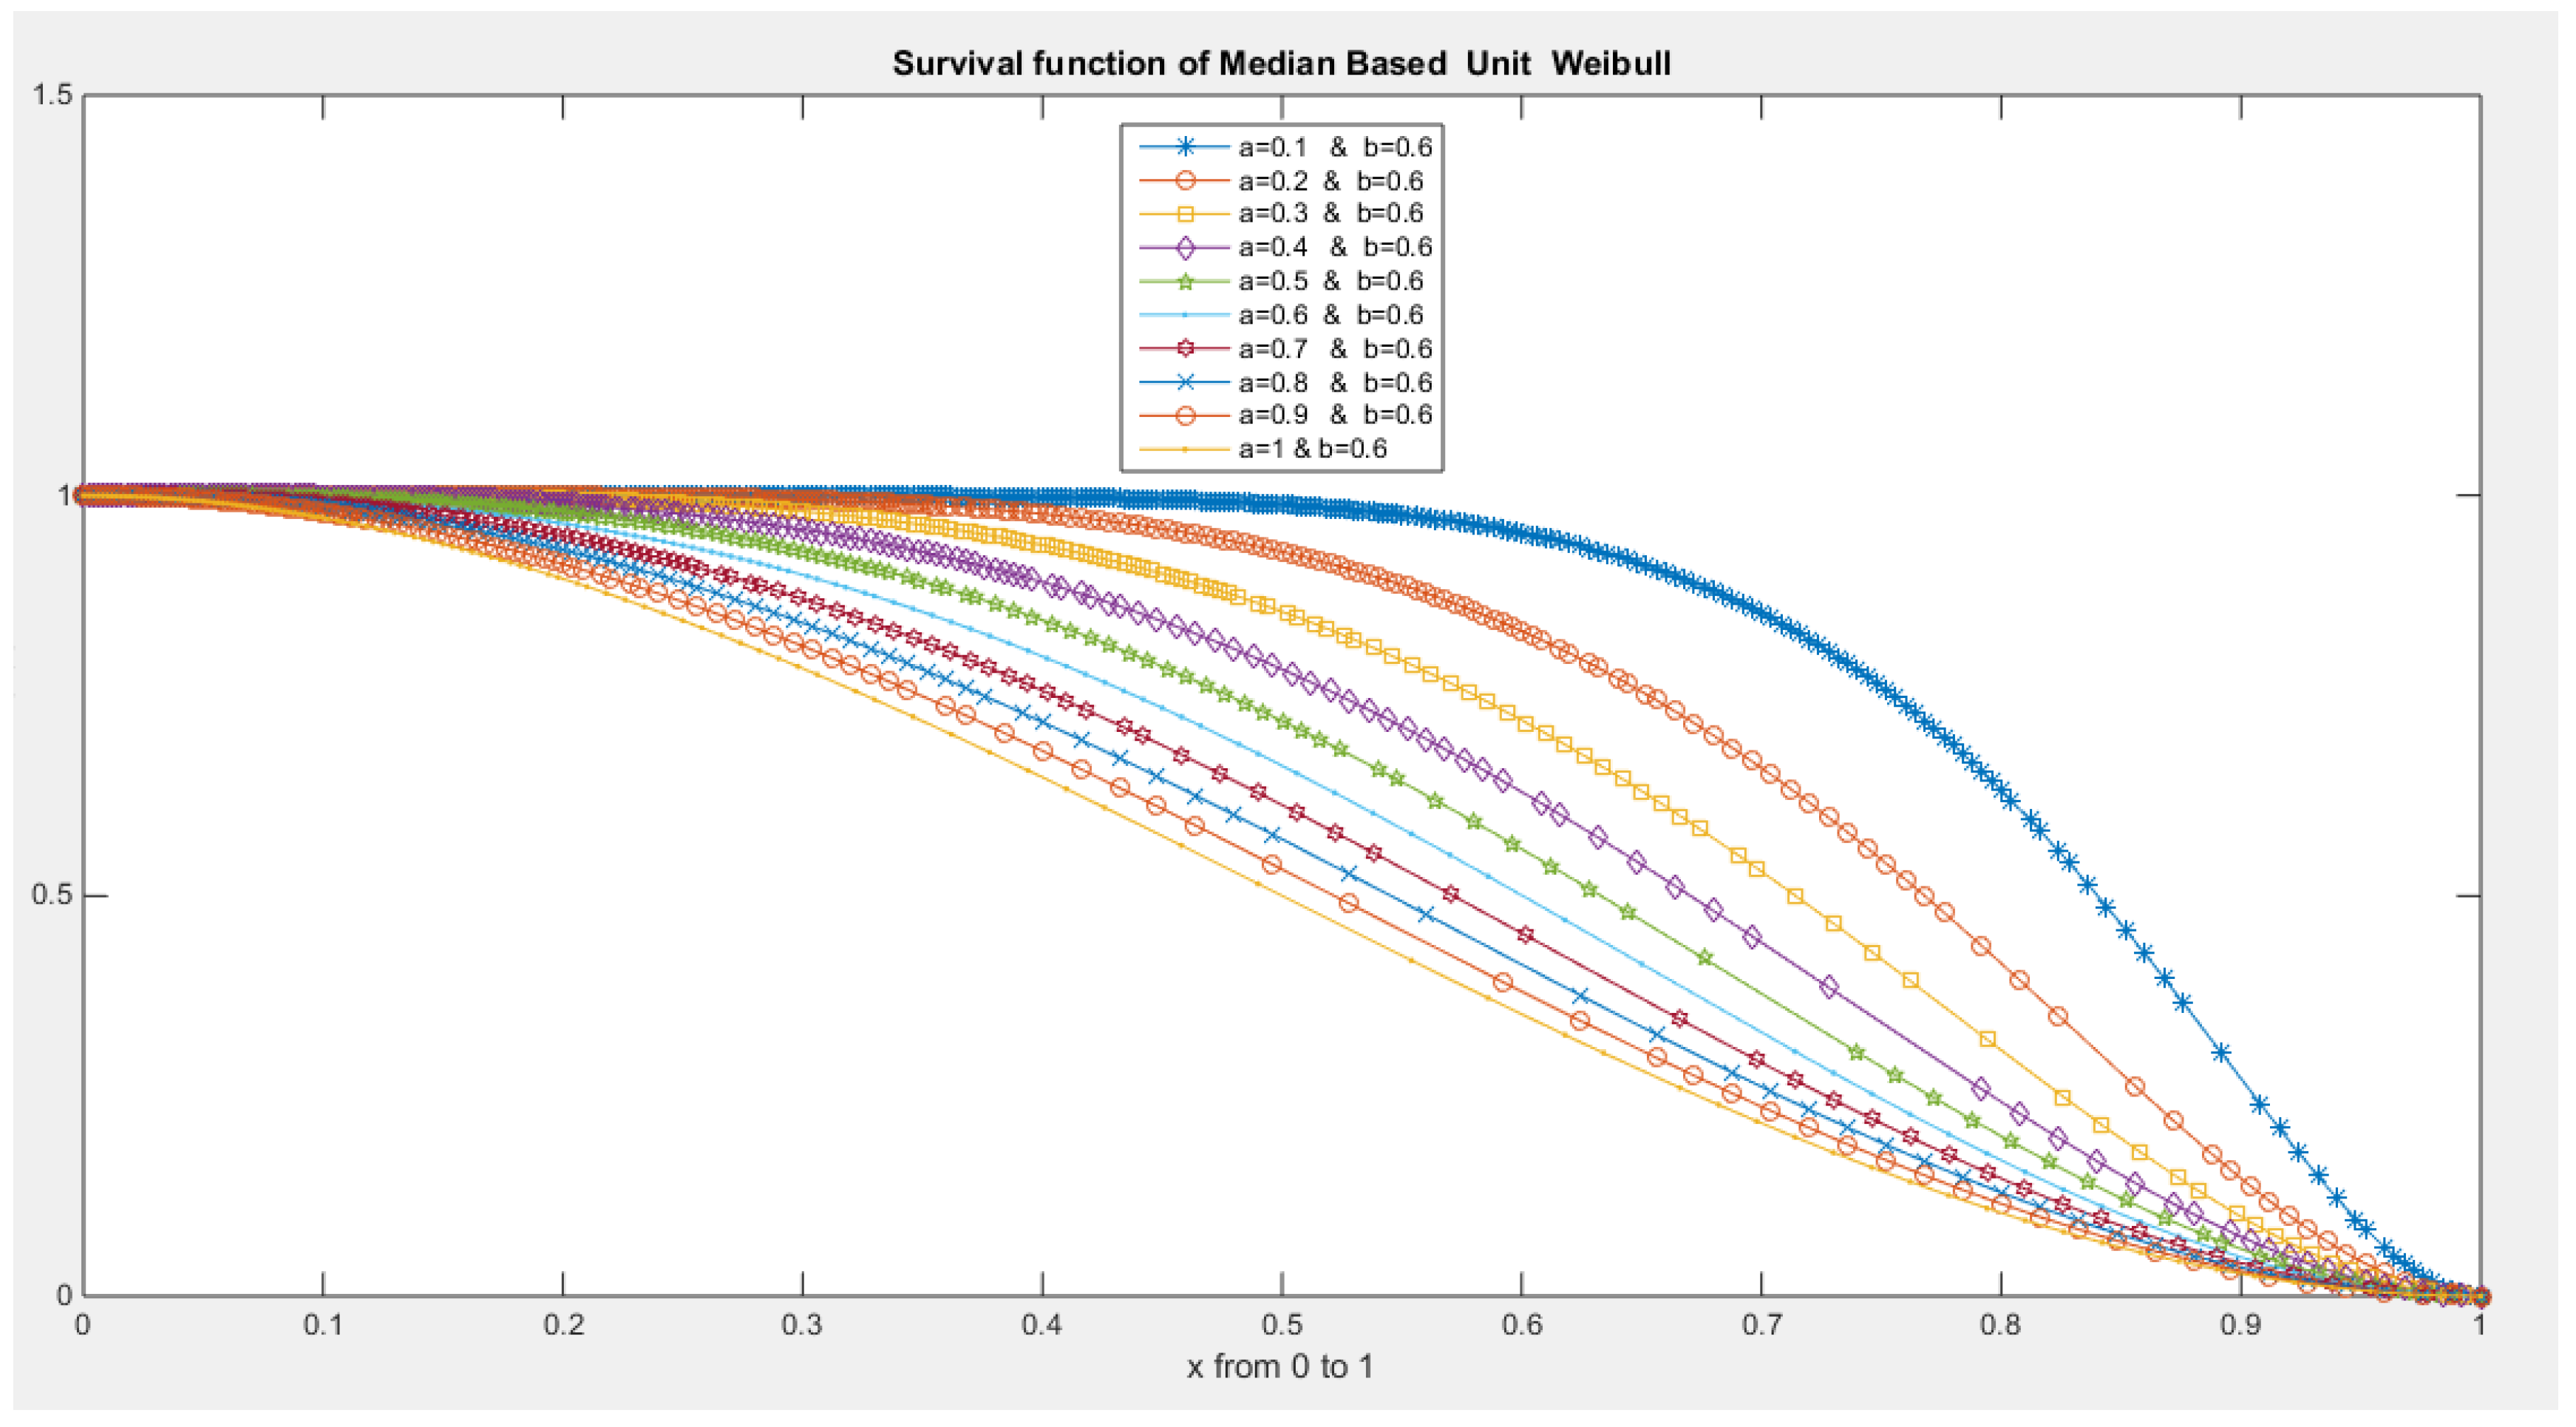

- 5-
- Quantile Function:
- 1-
- Generate uniform random variable (0,1): .
- 2-
- Choose alpha and beta levels
- 3-
- Substitute the above values of u (0,1) and the chosen alpha and beta in the quantile function, to obtain y distributed as
- 6-
- rth Raw Moments:
- 7-
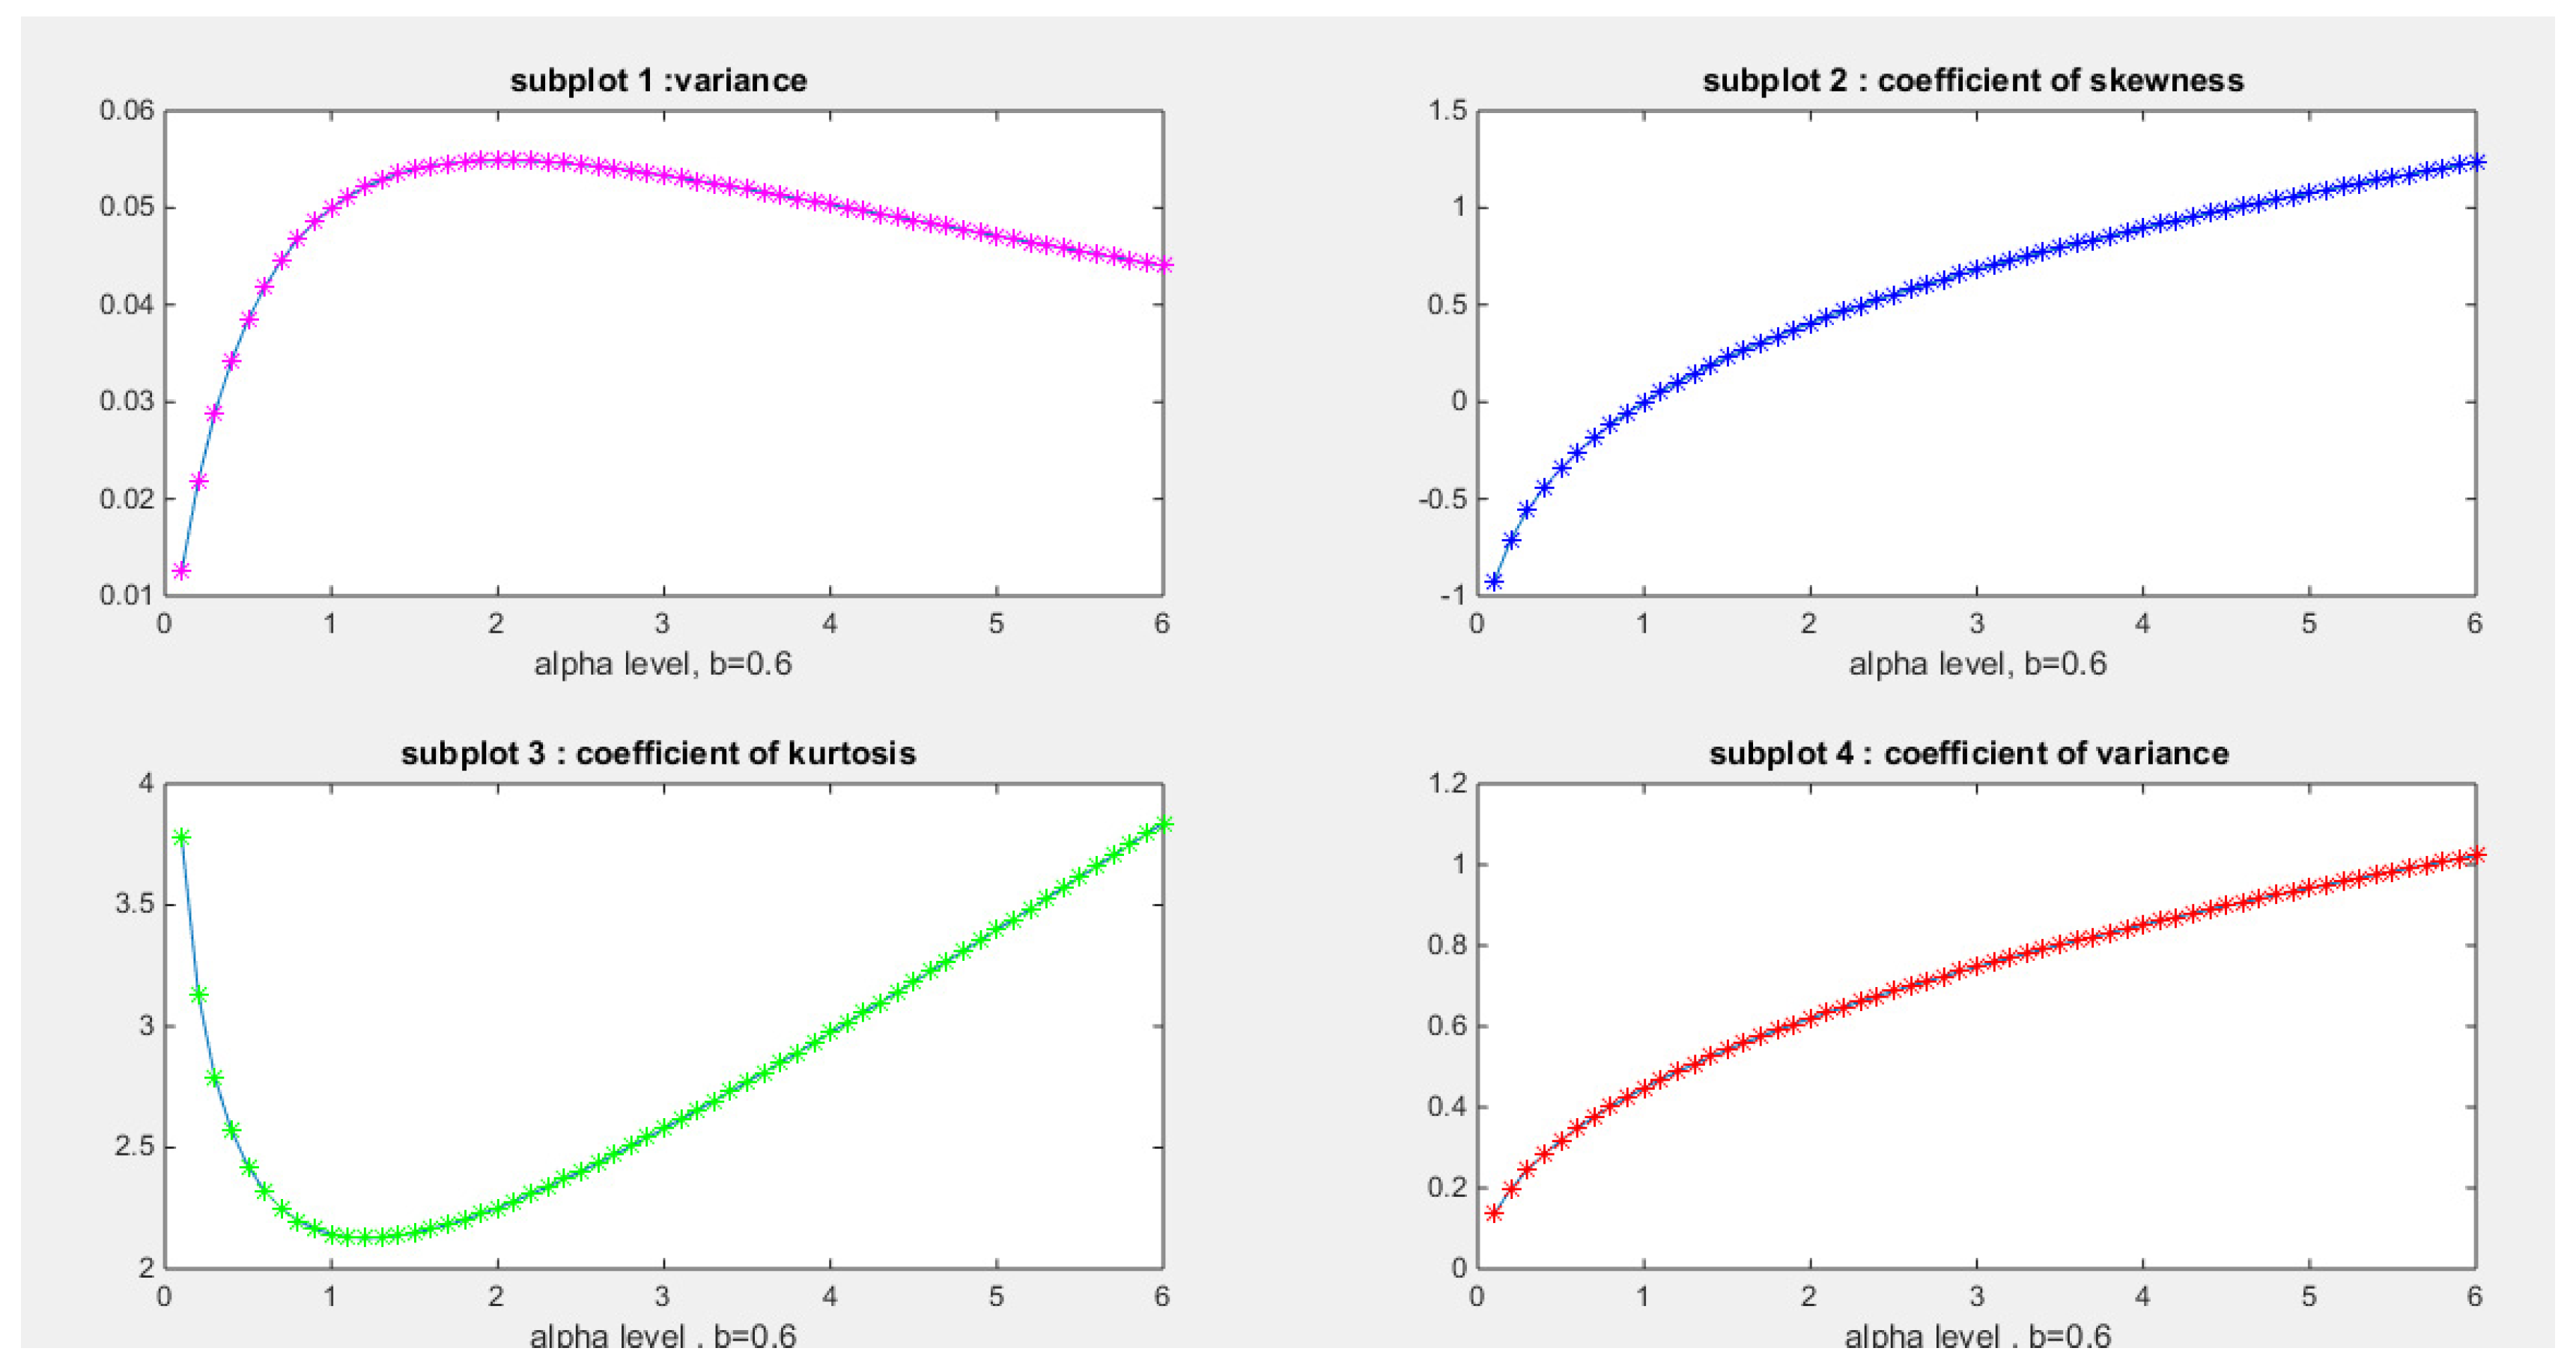
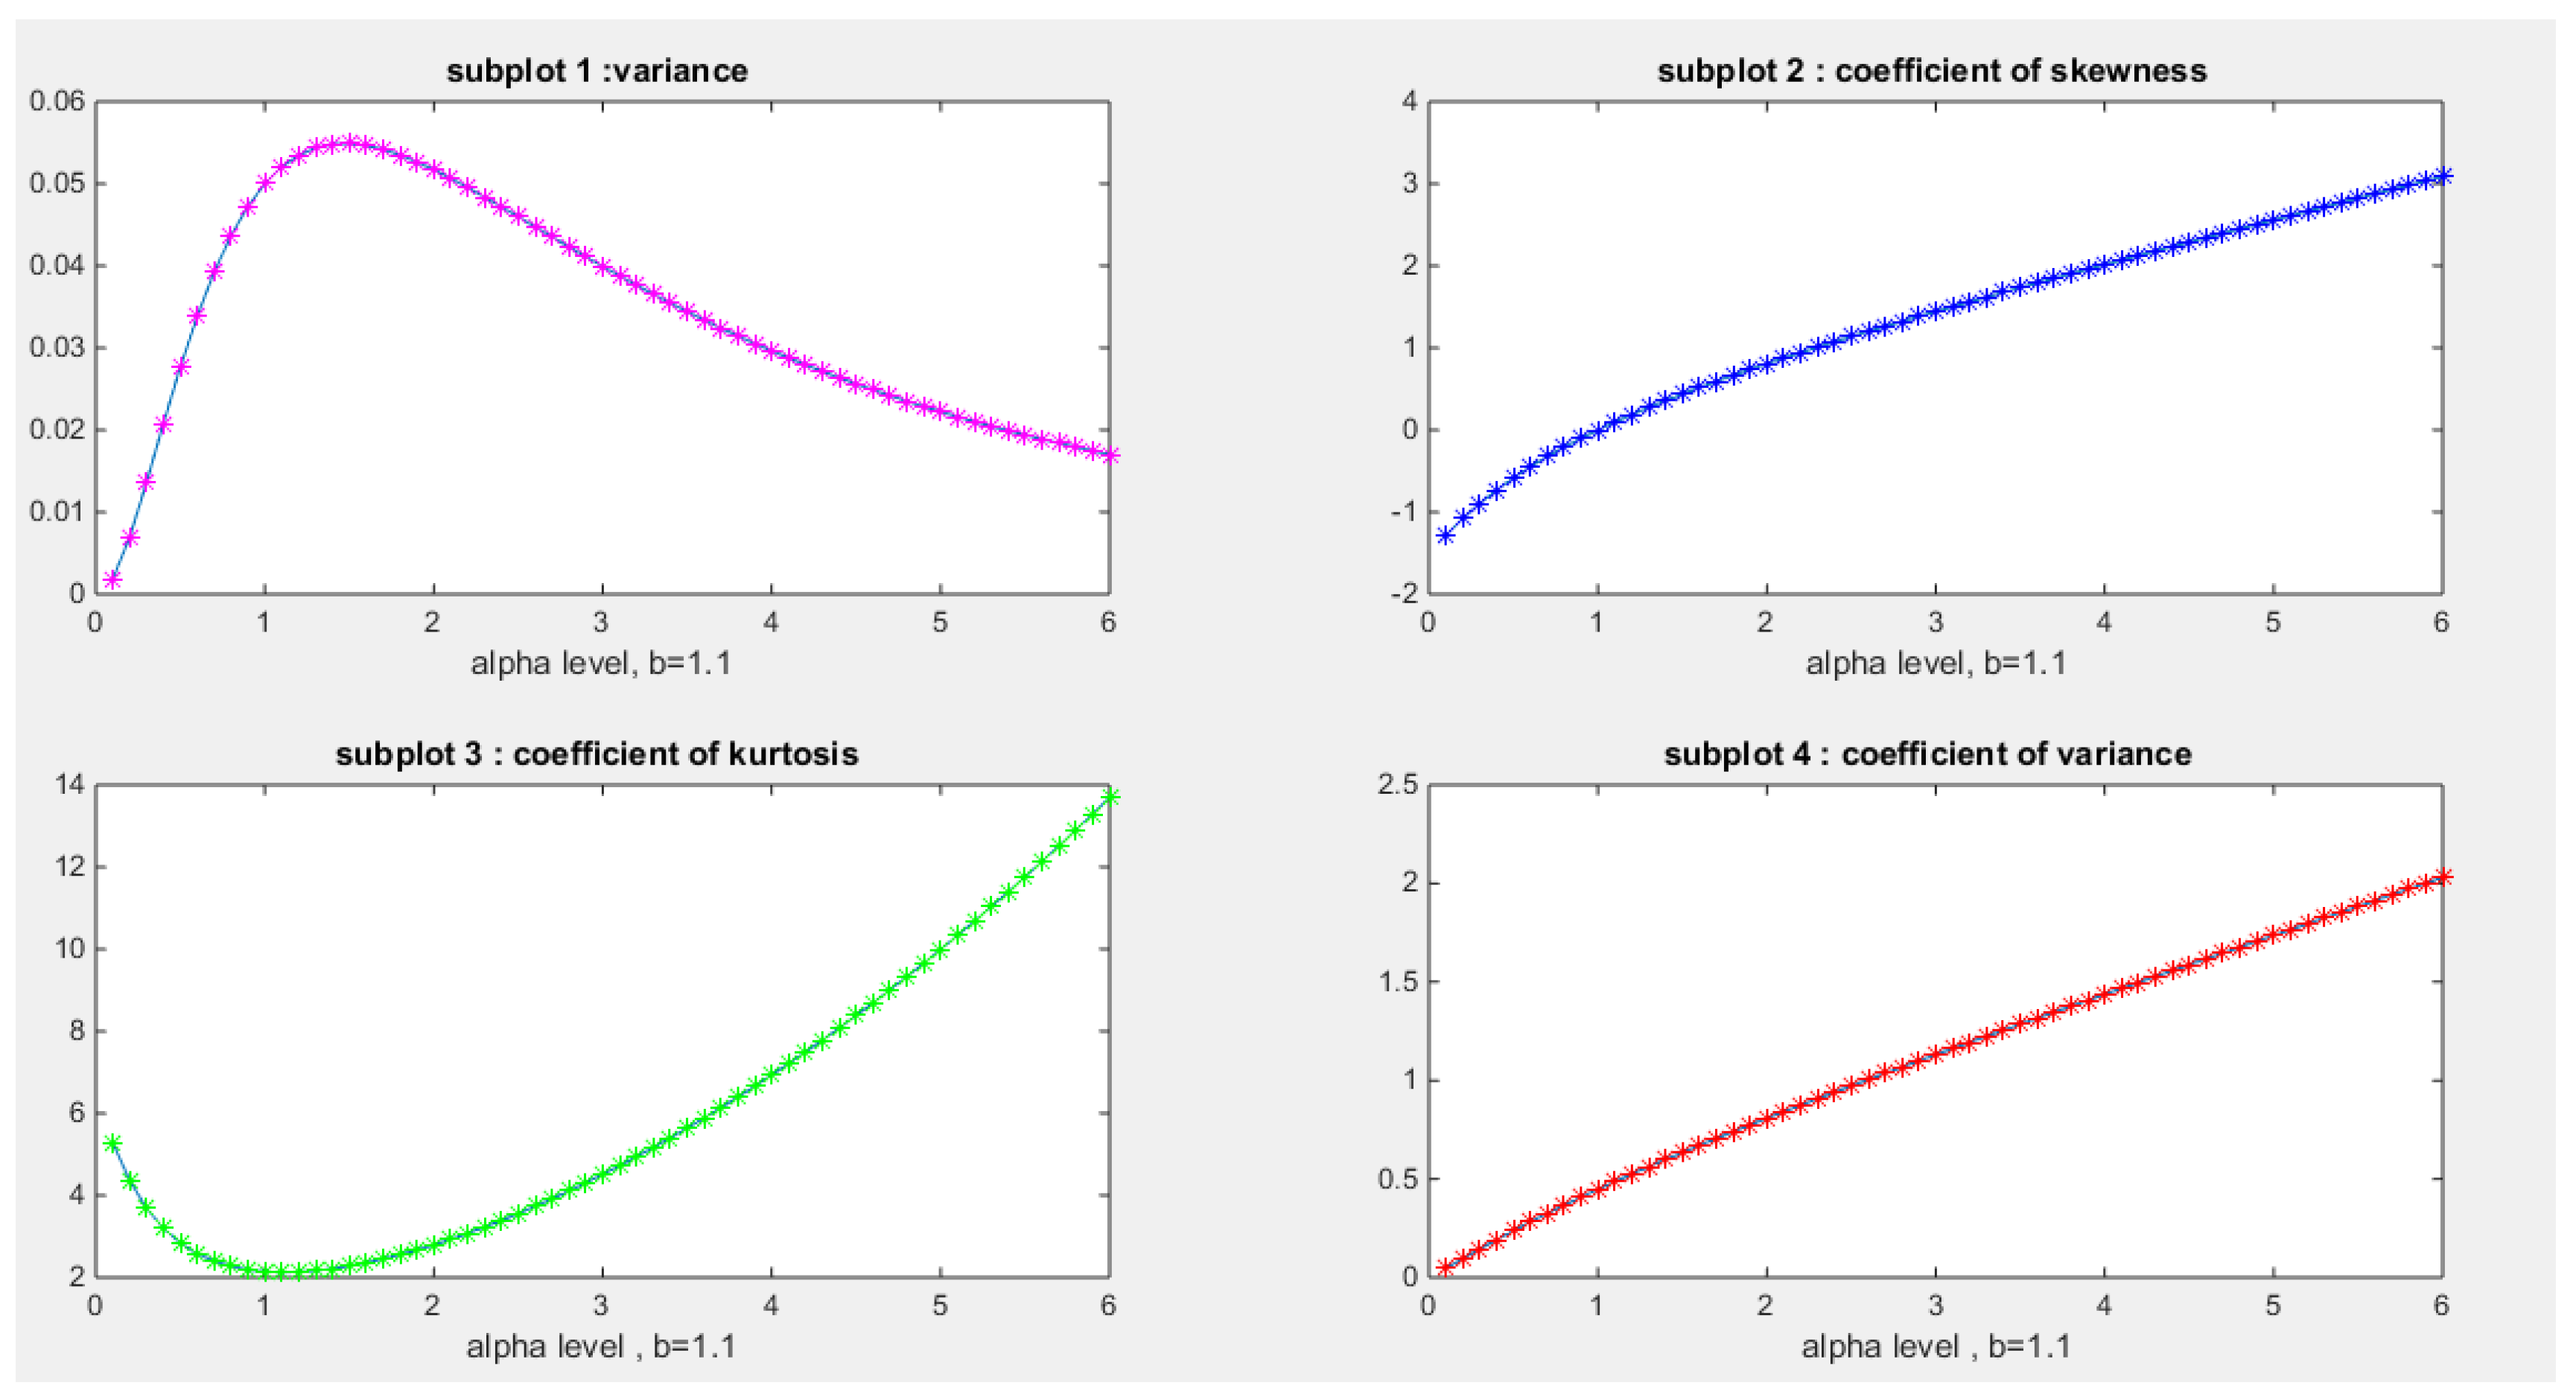
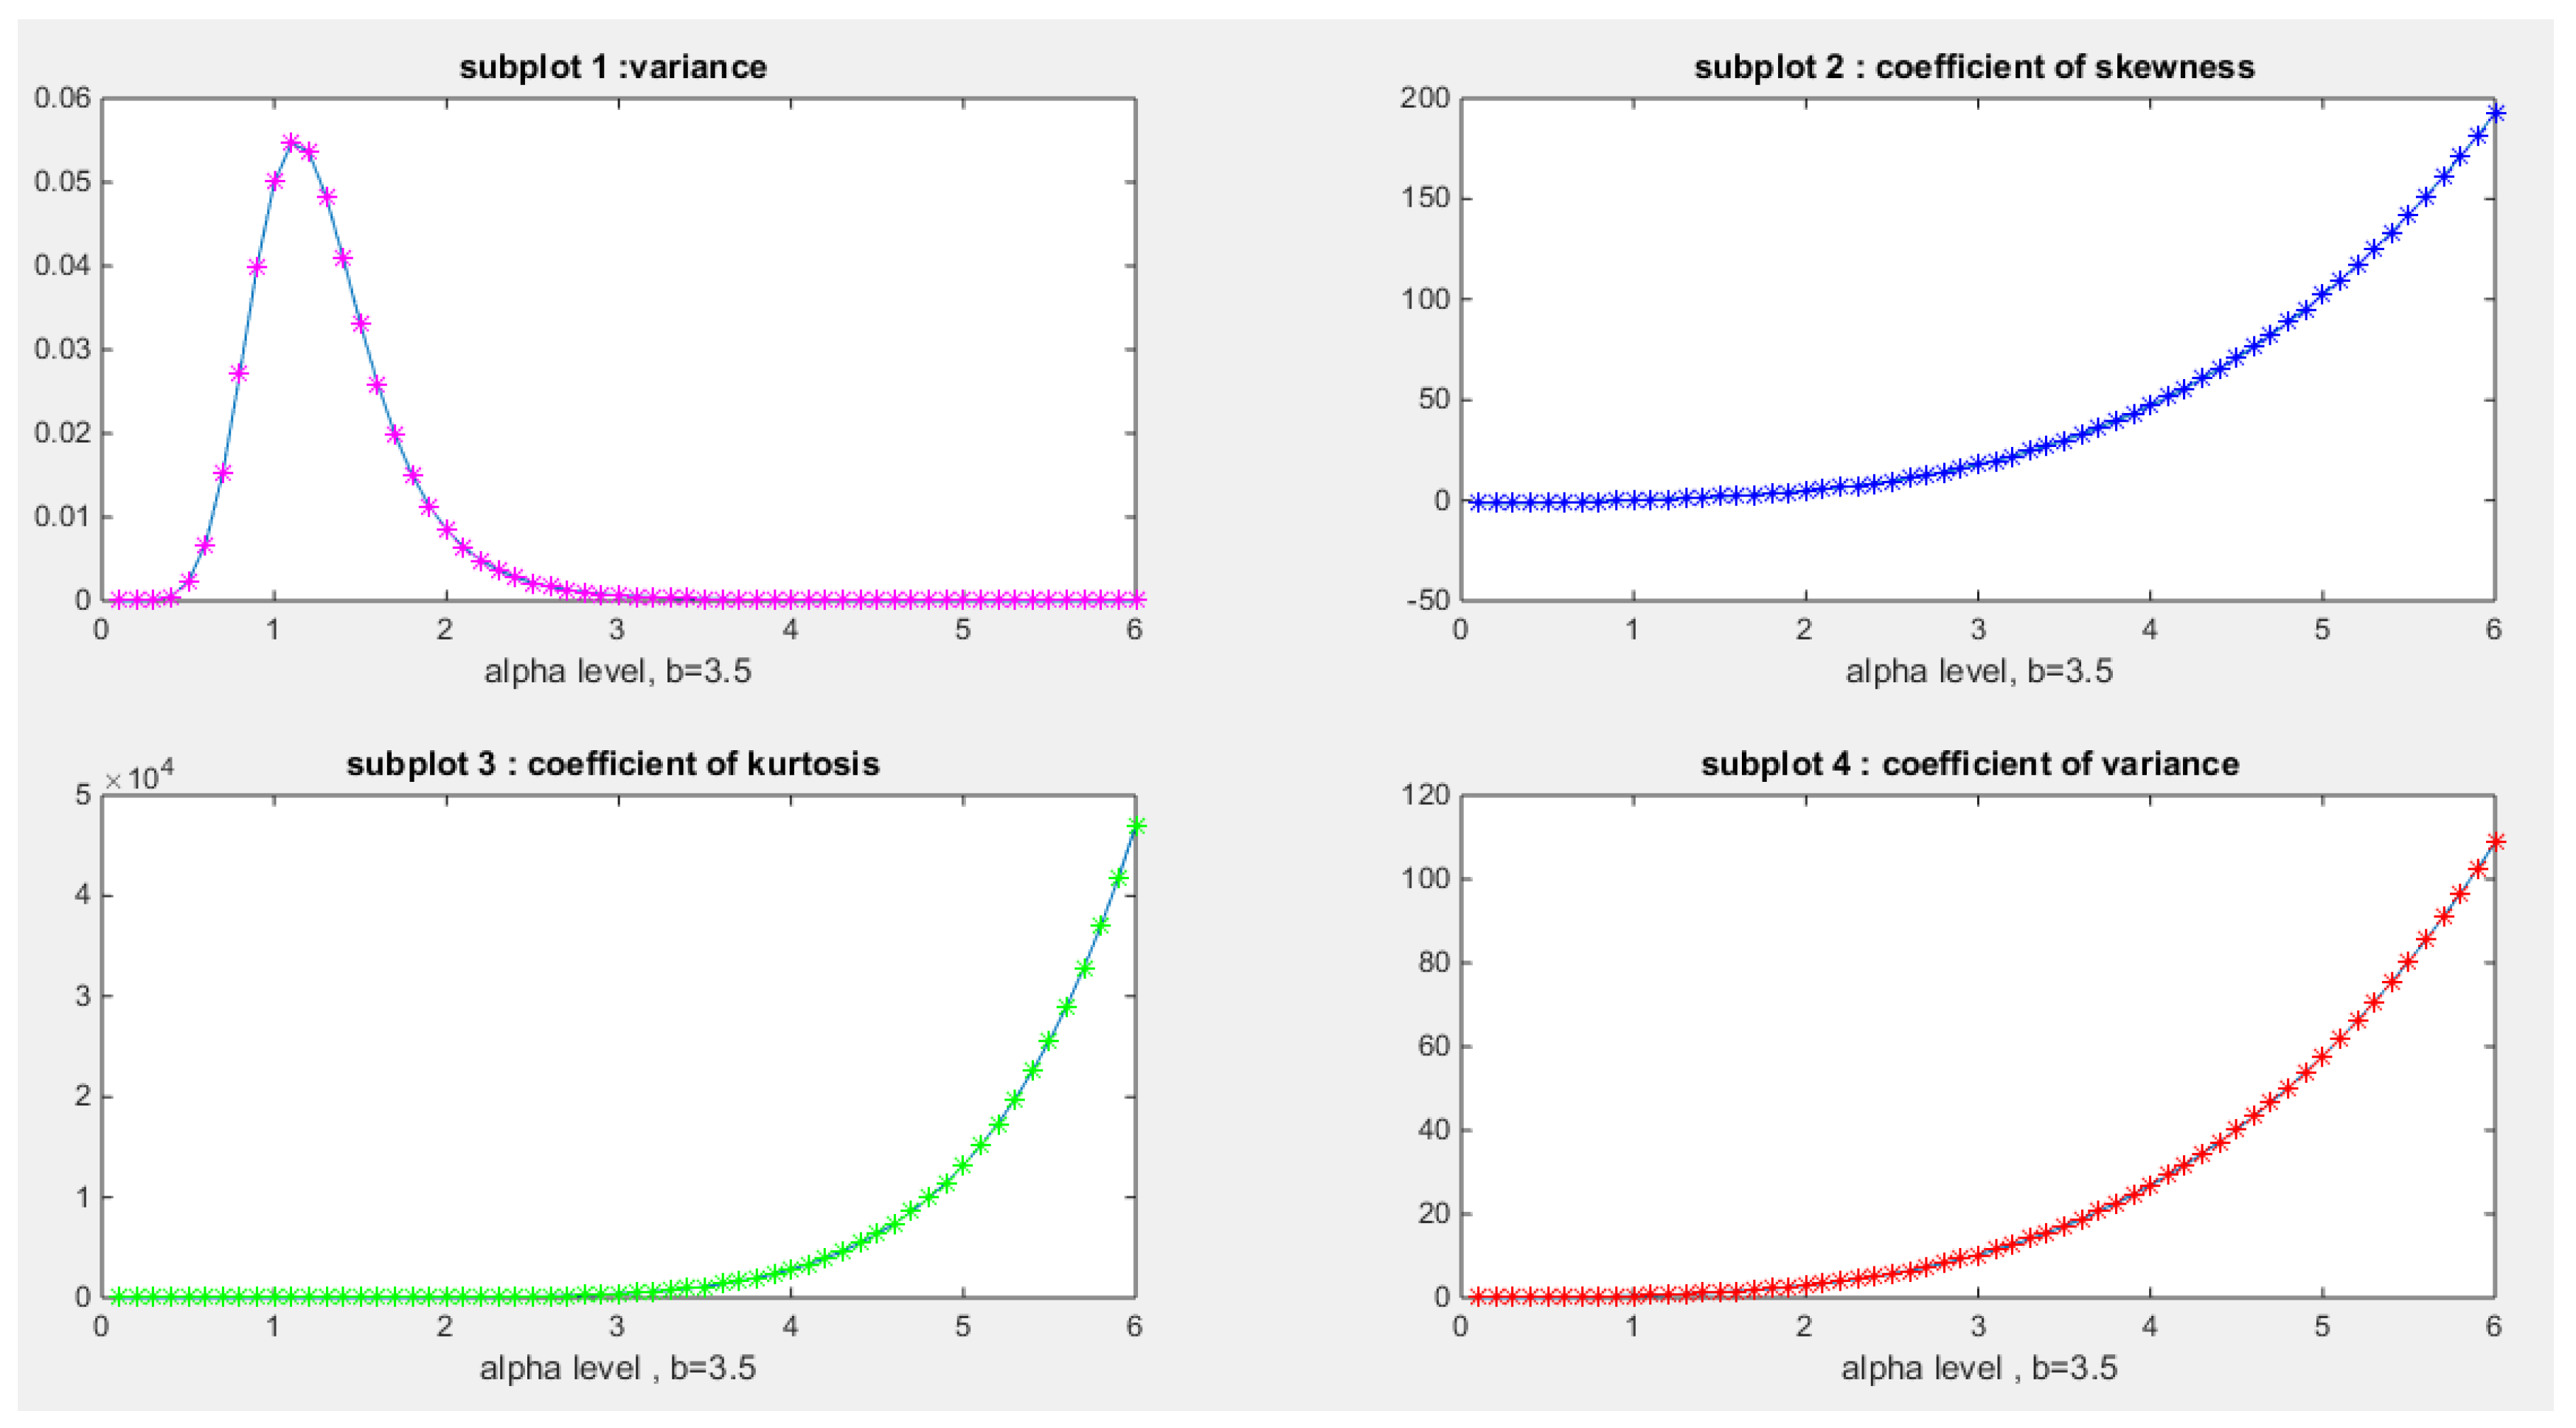
- Coefficient of Skewness:
- 8-
- Coefficient of Kurtosis:
- 9-
- Coefficient of Variation :

- 10-
- rth incomplete Moments:
Conclusion
Future Work
Author Contributions
Funding
Institutional Review Board Statement
Informed Consent Statement
Data Availability Statement
Acknowledgement
Conflicts of Interest
References
- Consul, P. C., & Jain, G. C. (1971). On the log-gamma distribution and its properties. Statistische Hefte, 12(2), 100–106. [CrossRef]
- Cordeiro, G. M., Ortega, E. M. M., & Nadarajah, S. (2010). The Kumaraswamy Weibull distribution with application to failure data. Journal of the Franklin Institute, 347(8), 1399–1429. [CrossRef]
- Eugene, N., Lee, C., & Famoye, F. (2002). BETA-NORMAL DISTRIBUTION AND ITS APPLICATIONS. Communications in Statistics—Theory and Methods, 31(4), 497–512. [CrossRef]
- Grassia, A. (1977). ON A FAMILY OF DISTRIBUTIONS WITH ARGUMENT BETWEEN 0 AND 1 OBTAINED BY TRANSFORMATION OF THE GAMMA AND DERIVED COMPOUND DISTRIBUTIONS. Australian Journal of Statistics, 19(2), 108–114. [CrossRef]
- Gül, H. H. (2023). Unit-Weibull Distribution: Different Method of Estimations. Karadeniz Fen Bilimleri Dergisi, 13(2), 547–560. [CrossRef]
- Gündüz, S., & Korkmaz, M. Ç. (2020). A New Unit Distribution Based On The Unbounded Johnson Distribution Rule: The Unit Johnson SU Distribution. Pakistan Journal of Statistics and Operation Research, 471–490. [CrossRef]
- Haq, M. A. U., Hashmi, S., Aidi, K., Ramos, P. L., & Louzada, F. (2023). Unit Modified Burr-III Distribution: Estimation, Characterizations and Validation Test. Annals of Data Science, 10(2), 415–440. [CrossRef]
- Johnson, N. L. (1949). Systems of Frequency Curves Generated by Methods of Translation. Biometrika, 36(1/2), 149–176. [CrossRef]
- Khan, M. S., & King, R. (2013). Transmuted Modified Weibull Distribution: A Generalization of the Modified Weibull Probability Distribution. European Journal of Pure and Applied Mathematics, 6(1), 66–88. https://www.ejpam.com/index.php/ejpam/article/view/1606.
- Khan, M. S., King, R., & Hudson, I. L. (2017). Transmuted Weibull distribution: Properties and estimation. Communications in Statistics—Theory and Methods, 46(11), 5394–5418. [CrossRef]
- Korkmaz, M. Ç., & Chesneau, C. (2021). On the unit Burr-XII distribution with the quantile regression modeling and applications. Computational and Applied Mathematics, 40(1), 29. [CrossRef]
- Kumaraswamy, P. (1980). A generalized probability density function for double-bounded random processes. Journal of Hydrology, 46(1–2), 79–88. [CrossRef]
- Lee, C., Famoye, F., & Olumolade, O. (2007). Beta-Weibull Distribution: Some Properties and Applications to Censored Data. Journal of Modern Applied Statistical Methods, 6(1), 173–186. [CrossRef]
- Marshall, A. W., & Olkin, I. (1997). A New Method for Adding a Parameter to a Family of Distributions with Application to the Exponential and Weibull Families. Biometrika, 84(3), 641–652. https://www.jstor.org/stable/2337585.
- Maya, R., Jodrá, P., Irshad, M. R., & Krishna, A. (2024). The unit Muth distribution: Statistical properties and applications. Ricerche Di Matematica, 73(4), 1843–1866. [CrossRef]
- Mazucheli et al. (2018a). THE UNIT-WEIBULL DISTRIBUTION AND ASSOCIATED INFERENCE. Journal of Applied Probability and Statisitcs, 13(2), 1–22.
- Mazucheli, J., Maringa, A. F., & Dey, S. (2019). Unit-Gompertz Distribution with Applications. Statistica, Vol 79, 25-43 Pages. [CrossRef]
- Mazucheli, J., Menezes, A. F. B., & Chakraborty, S. (2019). On the one parameter unit-Lindley distribution and its associated regression model for proportion data. Journal of Applied Statistics, 46(4), 700–714. [CrossRef]
- Mazucheli, J., Menezes, A. F. B., & Dey, S. (2018b). Improved maximum-likelihood estimators for the parameters of the unit-gamma distribution. Communications in Statistics—Theory and Methods, 47(15), 3767–3778. [CrossRef]
- Mazucheli, J., Menezes, A. F. B., Fernandes, L. B., De Oliveira, R. P., & Ghitany, M. E. (2020). The unit-Weibull distribution as an alternative to the Kumaraswamy distribution for the modeling of quantiles conditional on covariates. Journal of Applied Statistics, 47(6), 954–974. [CrossRef]
- Modi, K., & Gill, V. (2020). Unit Burr-III distribution with application. Journal of Statistics and Management Systems, 23(3), 579–592. [CrossRef]
- Mudholkar, G. S., & Srivastava, D. K. (1993). Exponentiated Weibull family for analyzing bathtub failure-rate data. IEEE Transactions on Reliability, 42(2), 299–302. IEEE Transactions on Reliability. [CrossRef]
- Silva, G. O., Ortega, E. M. M., & Cordeiro, G. M. (2010). The beta modified Weibull distribution. Lifetime Data Analysis, 16(3), 409–430. [CrossRef]
- Singla, N., Jain, K., & Kumar Sharma, S. (2012). The Beta Generalized Weibull distribution: Properties and applications. Reliability Engineering & System Safety, 102, 5–15. [CrossRef]
- Tadikamalla, P. R. (1981). On a family of distributions obtained by the transformation of the gamma distribution. Journal of Statistical Computation and Simulation, 13(3–4), 209–214. [CrossRef]
- Tadikamalla, P. R., & Johnson, N. L. (1982). Systems of frequency curves generated by transformations of logistic variables. Biometrika, 69(2), 461–465. [CrossRef]
- Topp, C. W., & Leone, F. C. (1955). A Family of J-Shaped Frequency Functions. Journal of the American Statistical Association, 50(269), 209–219. [CrossRef]
- Weibull, W. (1951). A Statistical Distribution Function of Wide Applicability. Journal of Applied Mechanics, 18(3), 293–297. [CrossRef]
- Xie, M., Tang, Y., & Goh, T. N. (2002). A modified Weibull extension with bathtub-shaped failure rate function. Reliability Engineering & System Safety, 76(3), 279–285. [CrossRef]
- Zhang, T., & Xie, M. (2011). On the upper truncated Weibull distribution and its reliability implications. Reliability Engineering & System Safety, 96(1), 194–200. [CrossRef]
Disclaimer/Publisher’s Note: The statements, opinions and data contained in all publications are solely those of the individual author(s) and contributor(s) and not of MDPI and/or the editor(s). MDPI and/or the editor(s) disclaim responsibility for any injury to people or property resulting from any ideas, methods, instructions or products referred to in the content. |
© 2024 by the authors. Licensee MDPI, Basel, Switzerland. This article is an open access article distributed under the terms and conditions of the Creative Commons Attribution (CC BY) license (http://creativecommons.org/licenses/by/4.0/).


