1. Introduction
The kinetics of lactate release from muscle into the bloodstream and its subsequent removal following sprint training are critical determinants of athletic performance and recovery [
1]. A biexponential four-parameter model based on blood lactate concentrations before and up to 30 minutes after exercise effectively describes these kinetics [
2]. This approach indicates the rates of lactate release from extravascular compartments into the blood and its subsequent removal from circulation, making it useful for comparing the physiological responses of highly fit athletes post-sprint training [
3]. Blood lactate concentration measurement is a widely accepted method for assessing anaerobic glycolysis involvement in energy production and indirectly evaluating exercise intensity [
4]. It is well-established that blood lactate concentration results from both lactate production and removal [
5]. During steady-state sub-maximal exercise where lactate production (influx) equals lactate removal (outflux), lactate concentration remains constant and oxygen consumption reflects whole-body energy expenditure regardless of lactate turnover or absolute concentration [
6,
7]. At exercise intensities above steady-state, an increase in lactate concentration may be due to either increased lactate production or decreased removal [
8].
Following exercise, a reduction in intensity or the use of active recovery methods facilitates lactate oxidation, predominantly in the liver, where it is converted to glucose via the Cori cycle [
9,
10]. Blood lactate concentration measurements are used in training to monitor exercise intensity, lactate threshold, and recovery status post-exertion, providing insight into the metabolic demands of various activities [
11,
12]. For example, during a 400-meter sprint, anaerobic contributions in men average 63%, a critical factor for high performance. During a 100-meter sprint, which lasts around 10 seconds, oxygen consumption is minimal, with energy predominantly derived from 50% phosphocreatine and 50% glycolysis. The lactate concentration of top elite sprint athletes is approximately 13.2 mmol/L [
13,
14]. Gupta et al. (2021) demonstrated a significant correlation between 400-meter runner performance and peak blood lactate levels, recommending the optimal measurement time for peak lactate to be within 3 to 5 minutes post-exercise [
15]. This timeframe captures the highest lactate response following intense exertion. Zajac (2024) suggests that to gain valuable insights into the temporal changes in blood lactate concentration post-exertion, researchers should increase the measurement frequency (e.g., every 1–2 minutes) and extend the post-exertion monitoring period beyond 60 minutes. Despite extensive research, there is no consensus on the optimal interval for blood sample collection following all-out athletic performances to accurately capture peak lactate levels. Determining the optimal withdrawal time can reduce the inconvenience of multiple samplings [
16]. The study of lactate responses across various track events holds significant importance, albeit in distinct manners. Shorter events such as the 200-meter and 400-meter runs prominently highlight the reliance on the glycolytic pathway for successful performance completion [
17]. Therefore, the purpose of this study was to analyze the temporal changes in blood lactate concentration and determine the optimal time to measure peak blood lactate following an all-out test among highly trained sprint athletes in the 100-meter event.
2. Materials and Methods
Ten highly trained 100-meter sprinter athletes were recruited for this study. Detailed information regarding their ages, anthropometric characteristics, and peak oxygen uptake (VO2peak) prior to testing was recorded (see
Table 1). All participants adhered to a consistent regimen of physical activity and were free from pharmacological interventions or specific dietary protocols. Informed consent was obtained from all participants or their legal guardians, following comprehensive explanations of the study’s objectives and associated risks. This study was conducted by the Declaration of Helsinki and received pre-approval from the local ethical committee of Istanbul Gedik University (Approval ID: E-56365223-050.02.04-2023.137548.20).
Anthropometric Measurements
Body height and body mass were measured using a stadiometer (Seca 213, Seca GmbH & Co. KG, Hamburg, Germany) with an accuracy of 1 mm and 0.1 kg, respectively. Body composition was assessed using the InBody MC780 Bioimpedance Analysis Scale (Tanita, Tokyo, Japan) to determine fat mass and lean body mass based on the electrical bio-impedance method [
18,
19].
Graded Exercise Test
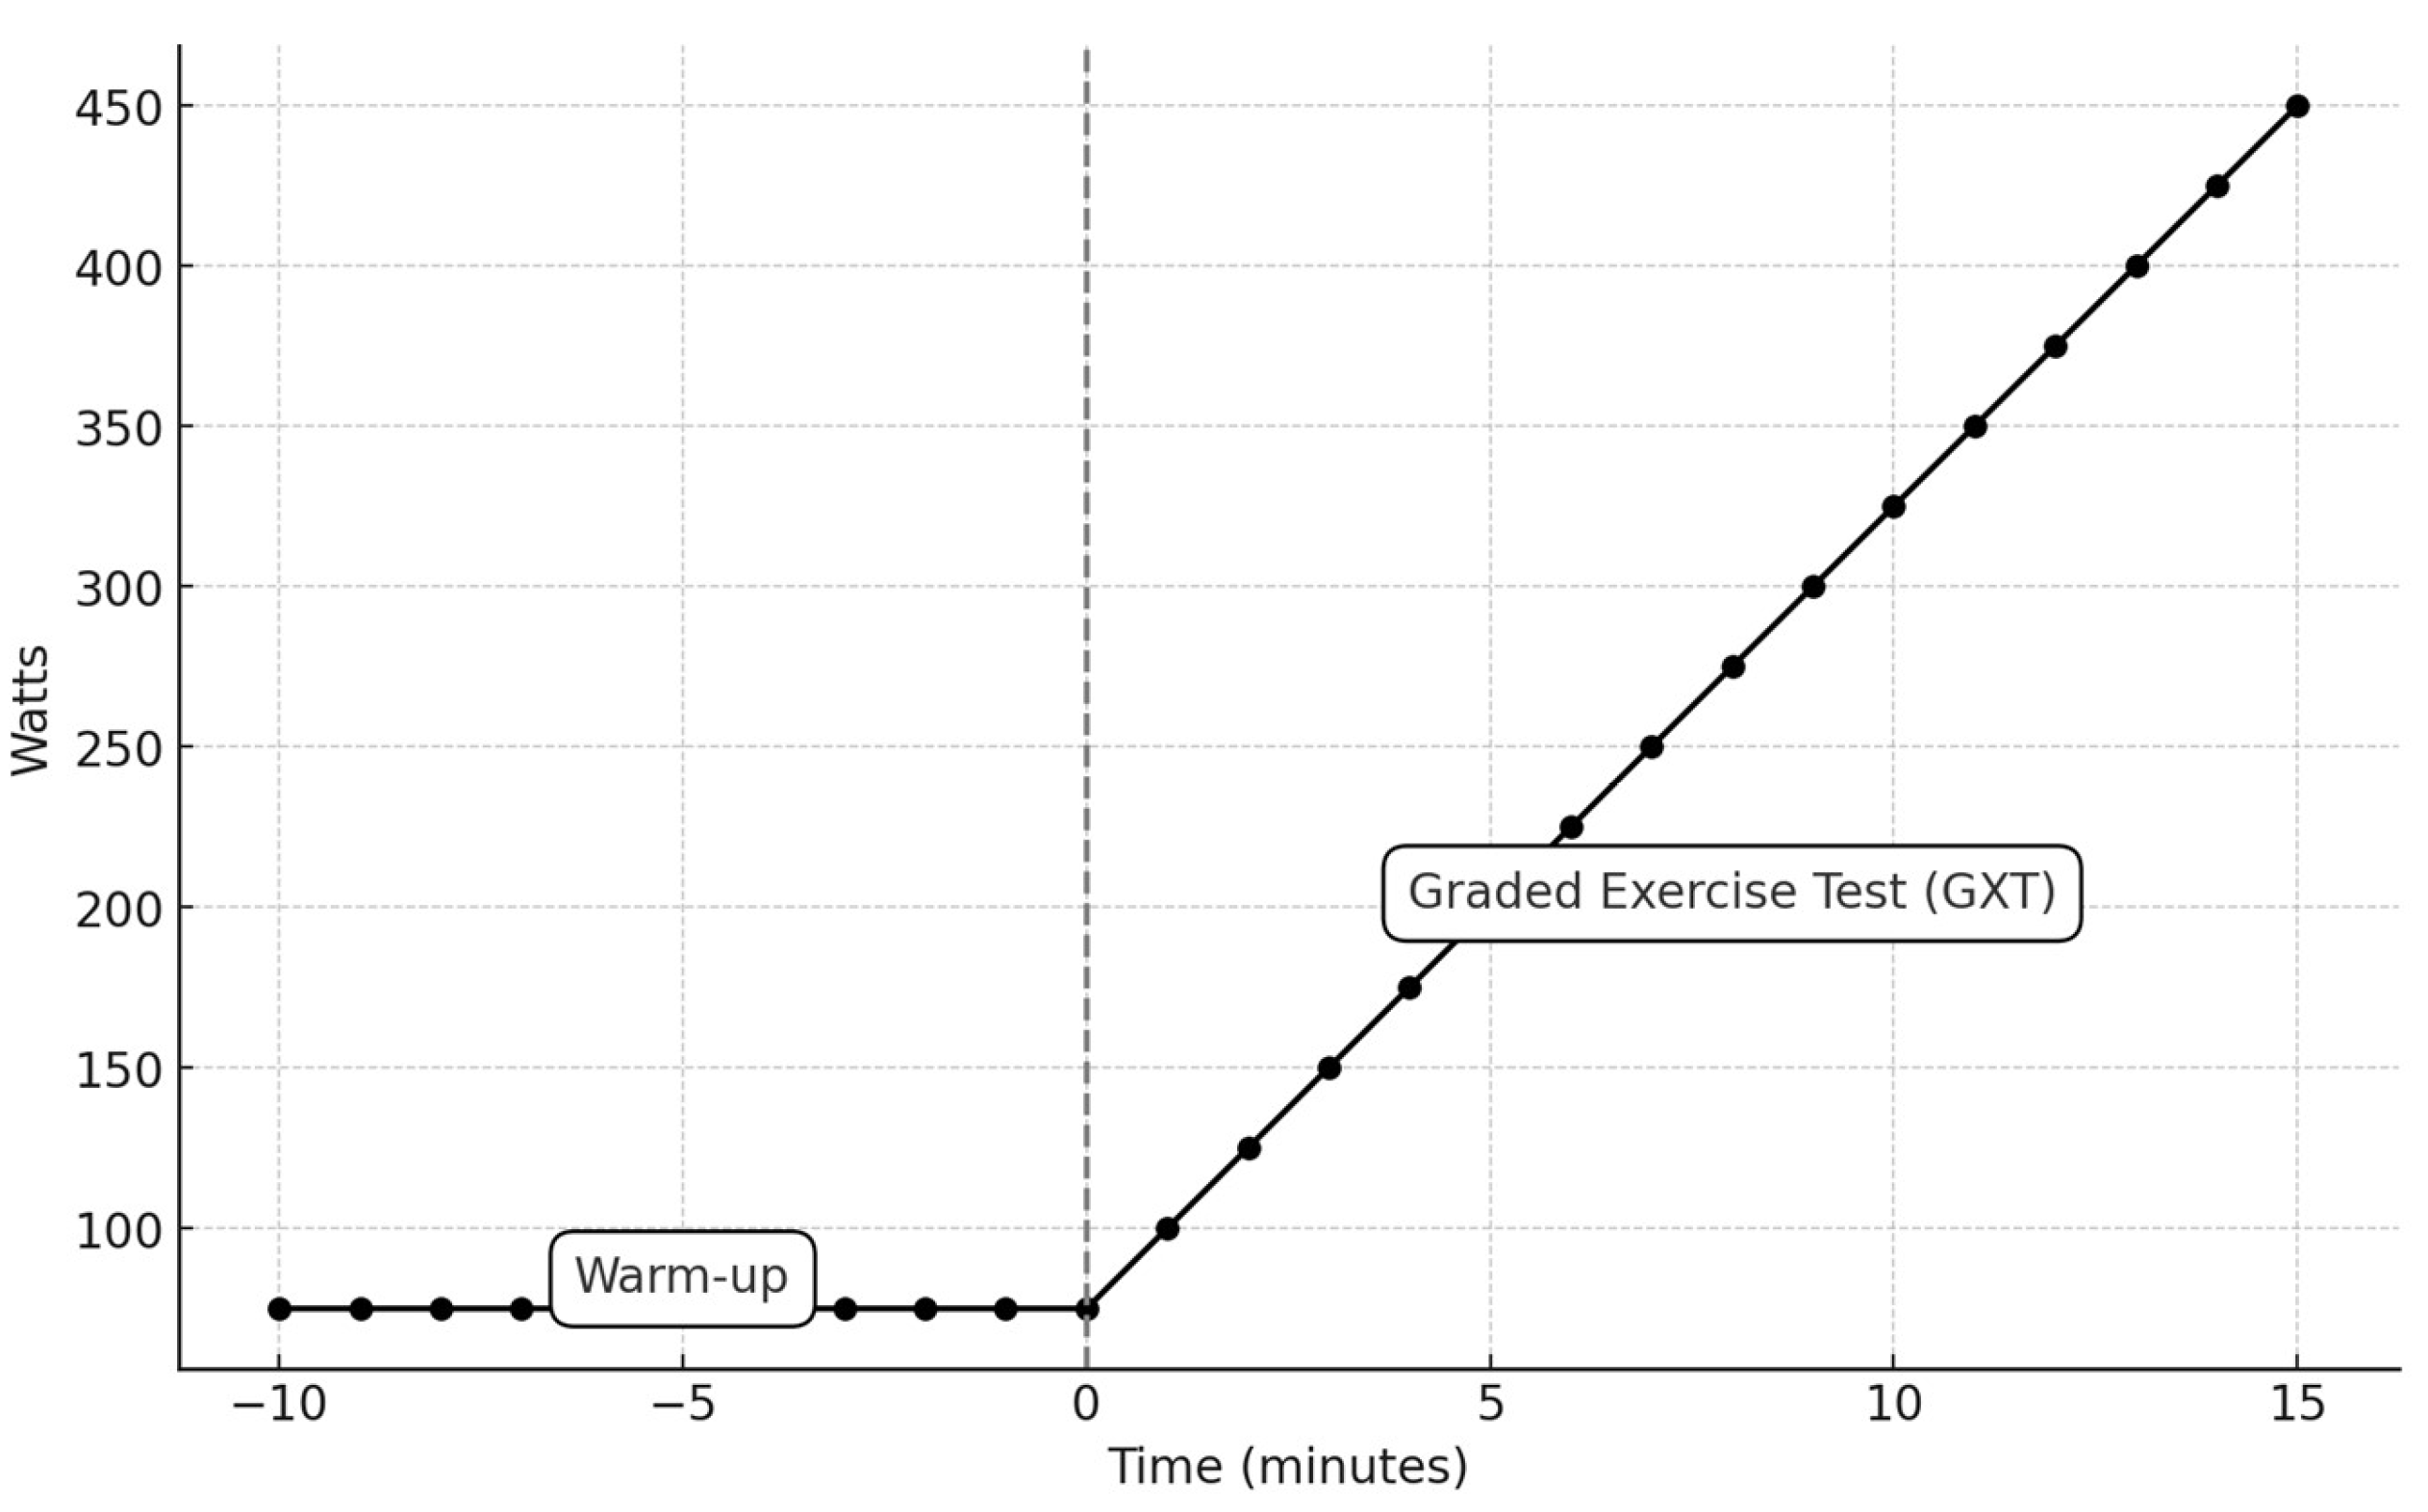
Each participant underwent a graded exercise test on an electrodynamically braked cycle ergometer (Monark 939 E, Sweden). The test began with a standardized warm-up consisting of 10 minutes of cycling at 75 Watts and a cadence of 60–90 rpm [
20]. Subsequently, an incremental load test was performed, starting at 100 W and increasing by 25 W every minute until volitional fatigue was reached (
Figure 1). This test determined peak power (P_peak), peak oxygen uptake (VO2peak), and peak blood lactate concentration (BLC_peak). Heart rate (HR) throughout the protocol was monitored using a Polar heart rate monitor (Polar Electro Inc., Lake Success, NY, USA). Criteria for VO2max determination included an increase in VO2 of less than 150 mL/min with an increase in power, a rating of perceived exertion (RPE) greater than 18 on Borg’s Scale, and a heart rate (HR) exceeding 90% of the age-predicted maximal HR.
30-Second All-out Sprints of Cycling (Wingate Anaerobic Test)
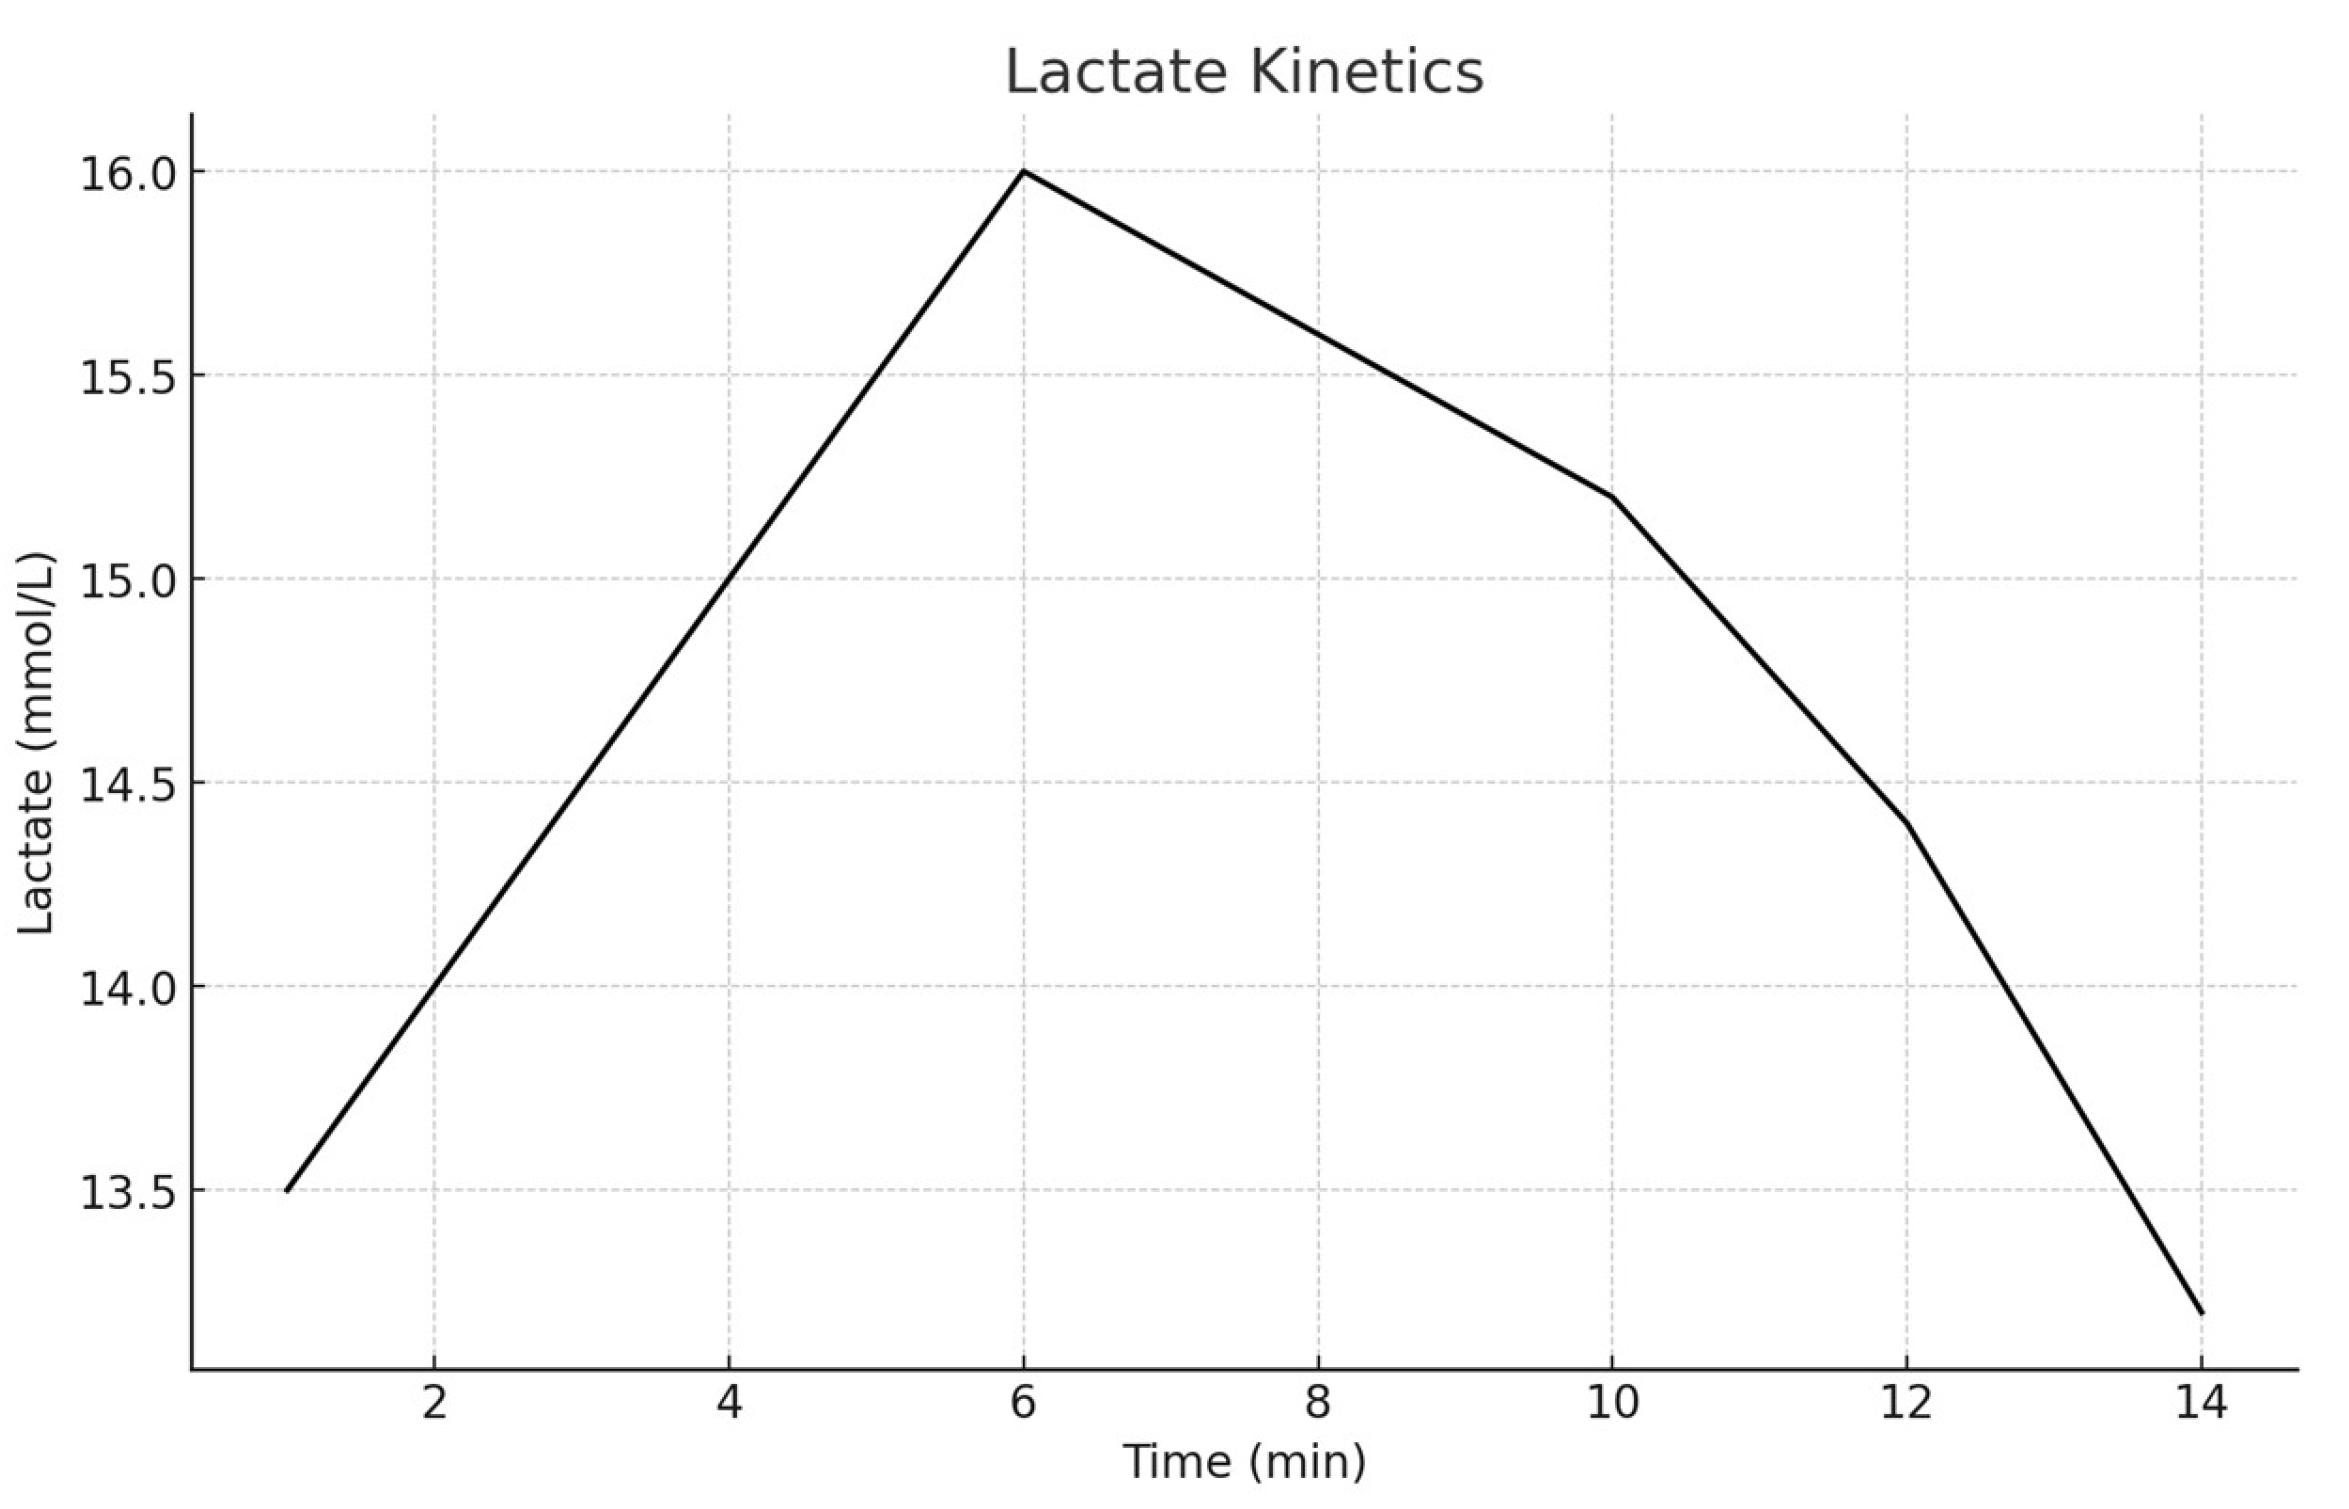
Participants performed a single 30-second Wingate Anaerobic Test on a mechanically braked cycle ergometer (894 E, Monark, Sweden). The standardized warm-up included 5 minutes of cycling at 0.5 W/kg, with two 3-second sprints performed at the end of the third and fourth minutes. Following a 10-minute rest, participants pedaled as fast as possible against a resistance equivalent to 7.5% of their body weight for 30 seconds. Capillary blood samples were collected immediately before and after the test, as well as every two minutes up to the 14th minute (
Figure 2), to measure blood lactate concentration using a Lactate Scout 4 analyzer (EKF, Germany).
Gas Analysis and Aerobic Threshold Determination
VO2 and pulmonary ventilation (VE) were assessed using a semi-portable gas analysis system (Fitmate Pro Cosmed, Rome, Italy). Before each test, the Fitmate Pro underwent an automatic gas calibration cycle, and the turbine flow meter was calibrated using a 3 L syringe. VO2peak was determined as the highest recorded VO2 value during the test. Individual aerobic gas exchange threshold (AerTge) was identified offline by plotting VE/VO2 against VO2 and determining the point where the curve reached its lowest value, indicating the individual aerobic threshold. The O2 (mL/kg/min) associated with each stage of the GXT was identified as the highest 30-s average O2 at each respective stage. Peak oxygen uptake (O2peak, mL/kg/min) was determined as the highest 30-s average O2 during the GXT.
Laboratory Conditions and Pre-Testing Precautions
All testing was conducted in the Sports Performance Laboratory of the Department of Sports Science, Faculty of Sports Coaching, at Istanbul Gedik University, under controlled conditions (ambient temperature: 23 ± 1 °C; relative humidity: 44% ± 3%). Testing was scheduled between 1700 and 1900 hours to minimize the influence of circadian rhythms. Participants refrained from consuming anything except water and from eating for at least 2 hours before testing, and they abstained from strenuous activities, caffeine, alcohol, or tobacco for 24 hours before testing.
Data Analysis
All data were examined to ensure they met the requirements of normality and homogeneity of variance using the Kolmogorov-Smirnov and Shapiro-Wilk tests. Descriptive results are reported as mean values and standard deviations (Mean ± SD). To compare the parameters statistically, used ANOVA (Analysis of Variance) a pairwise comparison using t-tests. Wingate performance metrics were determined as follows: Peak Power (PP) and Minimum Power (MP) were defined as the highest and lowest mechanical power outputs, respectively, calculated based on the average power over a 5-second period. The Mean Power (AP) was the average power output sustained throughout the six 5-second intervals. Power Drop (PD) was calculated as the difference between PP and MP, while the Fatigue Index represented the PD as a percentage of PP. All performance metrics were normalized to absolute and relative. The level of significance was set a priori to = 0.05 and all statistical analyses were performed with the SPSS Statistics for Windows (version 25; SPSS Inc., Chicago, Ill., USA).
Mathematical Analyses
The analysis method for blood lactate concentration using a bi-exponential model involves aggregating data from elite sprinters during recovery. This method employs the equation: [LA] (t) = LA0 + A1 (1−e−γ1t) + A2 (1−e−γ2t) where [LA] (t) represents lactate concentration at time t, LA0 is the initial concentration, A1 and A2 are amplitudes, and γ1 and γ2 are rate constants. Parameters are estimated using nonlinear least-squares regression, and model fit quality is assessed via the coefficient of determination (R²) [
21].
VO2 Kinetics During Recovery
The kinetics of oxygen uptake (VO2) during the recovery phase after a 30-second Wingate test were modeled using a single exponential equation [
22]. This approach provides a detailed understanding of the physiological processes involved in the recovery period following high-intensity exercise.
Single Exponential Model
The oxygen uptake kinetics were described using the following equation:
Where:
V˙O2 (t) represents the oxygen uptake at time t.
V˙O2, the base is the baseline oxygen uptake before exercise.
A1 is the amplitude of the fast phase of oxygen uptake.
t is the time elapsed during the recovery phase.
TD is the time delay before the onset of the VO2 response.
τ1 is the time constant of the fast phase, indicating the rate at which VO2 increases during recovery.
Parameters and Calculations
To quantify the oxygen debt incurred during the recovery period, the following calculations were performed:
Fast Oxygen Debt: The rapid phase of oxygen uptake, which primarily reflects the replenishment of phosphocreatine stores and the initial re-oxygenation of myoglobin, was calculated as Fast Oxygen Debt = A1⋅τ1
Slow Oxygen Debt: In scenarios where a bi-exponential model was used, the slow phase, representing ongoing oxidative metabolism and clearance of metabolic by-products, was calculated as Slow Oxygen Debt = A2⋅τ2 Here, A2 and τ2 denote the amplitude and time constant of the slow phase, respectively.The Materials and Methods should be described with sufficient details to allow others to replicate and build on the published results. Please note that the publication of your manuscript implicates that you must make all materials, data, computer code, and protocols associated with the publication available to readers. Please disclose at the submission stage any restrictions on the availability of materials or information. New methods and protocols should be described in detail while well-established methods can be briefly described and appropriately cited.
Research manuscripts reporting large datasets that are deposited in a publicly available database should specify where the data have been deposited and provide the relevant accession numbers. If the accession numbers have not yet been obtained at the time of submission, please state that they will be provided during review. They must be provided prior to publication.
Interventionary studies involving animals or humans, and other studies that require ethical approval, must list the authority that provided approval and the corresponding ethical approval code.
3. Results
Participants’ recent 100-meter running performances, GXT results, and blood lactate kinetic parameters are detailed in
Table 1. During the GXT, participants completed an average of 9 ± 1 stages. The post-exercise peak blood lactate concentration averaged 14.9 ± 3.5 mmol/L, illustrating the high intensity of the exertion and the anaerobic capacity of the participants.
Table 1.
The characteristics of participants.
Table 1.
The characteristics of participants.
| Variables |
Mean ± SD |
| Age |
15.6 ± 0.96 |
| Weight (kg) |
70.3 ± 6.6 |
| Height (cm) |
178.2 ± 6.6 |
| Body fat (%) |
11.1 ± 0.6 |
| Body fat (kg) |
10.2 ± 1.9 |
| Muscle mass (kg) |
54 ± 3.8 |
| BMI |
24.2 ± 2.6 |
| Vo2max (ml.kg.min) |
45.4 ± 4.1 |
| Peak Power (w/kg) |
14.2 ± 1 |
| Mean Power (w/kg) |
9.9 ± 0.2 |
| Power Drop (%) |
56.1 ± 6 |
| Time to Peak (ms) |
2.1 ± 0.6 |
| Lactate before (mmol/L) |
1.6 ± 0.5 |
| Lactate after (mmol/L) |
14.9 ± 3.5 |
Wingate 30-Second Test Results Summary
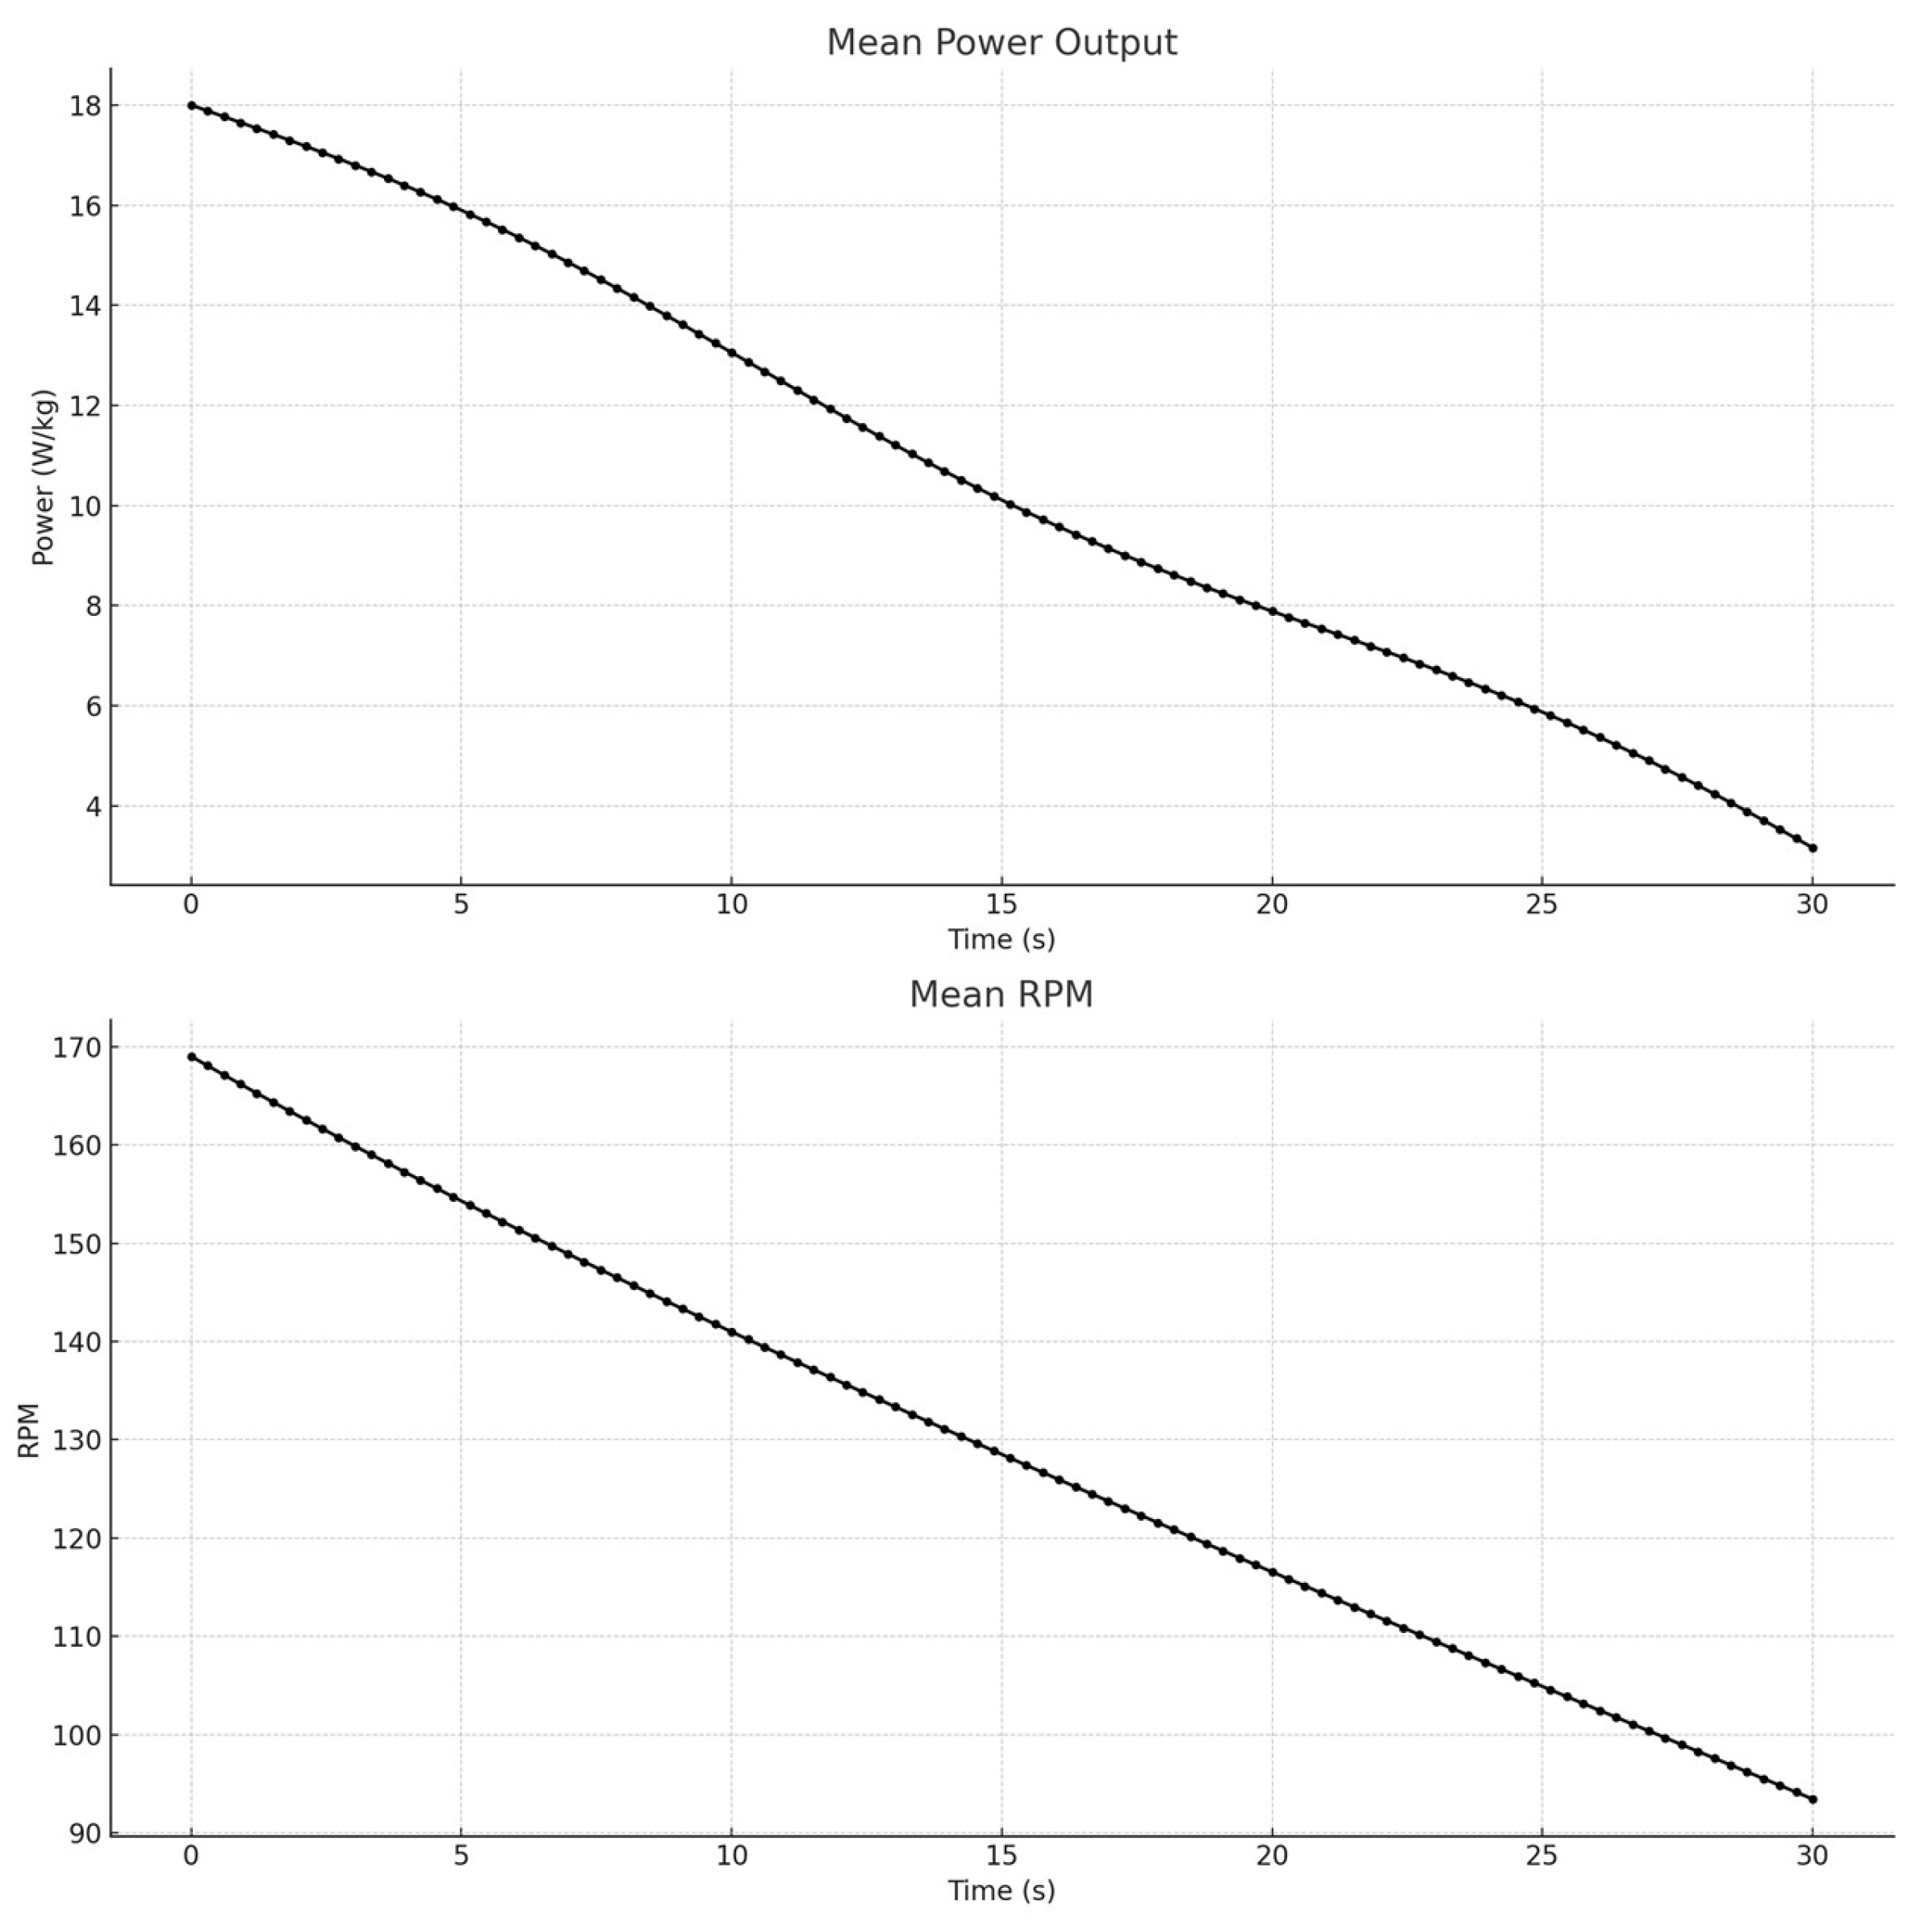
The peak power output recorded during the test was 14.2 ± 1 W/kg and 14.2 ± 1 W/kg. This value represents the highest power output achieved by the participants within the first few seconds of the test, indicating their maximum anaerobic power (
Figure 3). The average power output over the entire 30-second test period was 9.9 ± 0.2 W/kg and 9.9 ± 0.2 W/kg. This value provides an overall measure of the participants’ sustained anaerobic capacity throughout the test duration. The power drop, calculated as the percentage decrease in power from the peak to the lowest point at the end of the test, was 56.1 ± 6% and 56.1 ± 6%. This significant decline highlights the rapid onset of fatigue and the depletion of anaerobic energy stores as the test progressed. The time taken to reach peak power was 2.1±0.6 seconds2.1±0.6seconds. This measure indicates how quickly the participants could generate maximum power from the start of the test, reflecting their explosive strength and anaerobic performance.
The graph shows a rapid increase in power at the beginning, peaking at around 14.2 W/kg14.2W/kg and then declining steadily to an average of 9.9 W/kg9.9W/kg. The RPM graph follows a similar pattern, with a quick rise to peak RPM followed by a steady decline, indicating the participants’ diminishing ability to maintain high-intensity cycling.
Figure 4 indicates that the initial mean lactate concentration after the 30 Wingate test was 12.15 mmol/L. The amplitude A
1 of 12.26 suggests a significant initial increase in lactate concentration due to the release from muscles. The rate constant γ
1 of 0.20 indicates the speed of this initial phase. The negative amplitude A
2 of -6800.37 and the very small rate constant γ
2 of 0.000125 describe a slower, prolonged clearance phase of lactate from the bloodstream.
- LA
_0: 12.15 (initial lactate concentration)
- LA
A_1: 12.26 (amplitude of the first phase)
- LA
γ_1: 0.20 (rate constant for the first phase)
- LA
A_2: -6800.37 (amplitude of the second phase)
- LA
γ_2: 0.000125 (rate constant for the second phase)
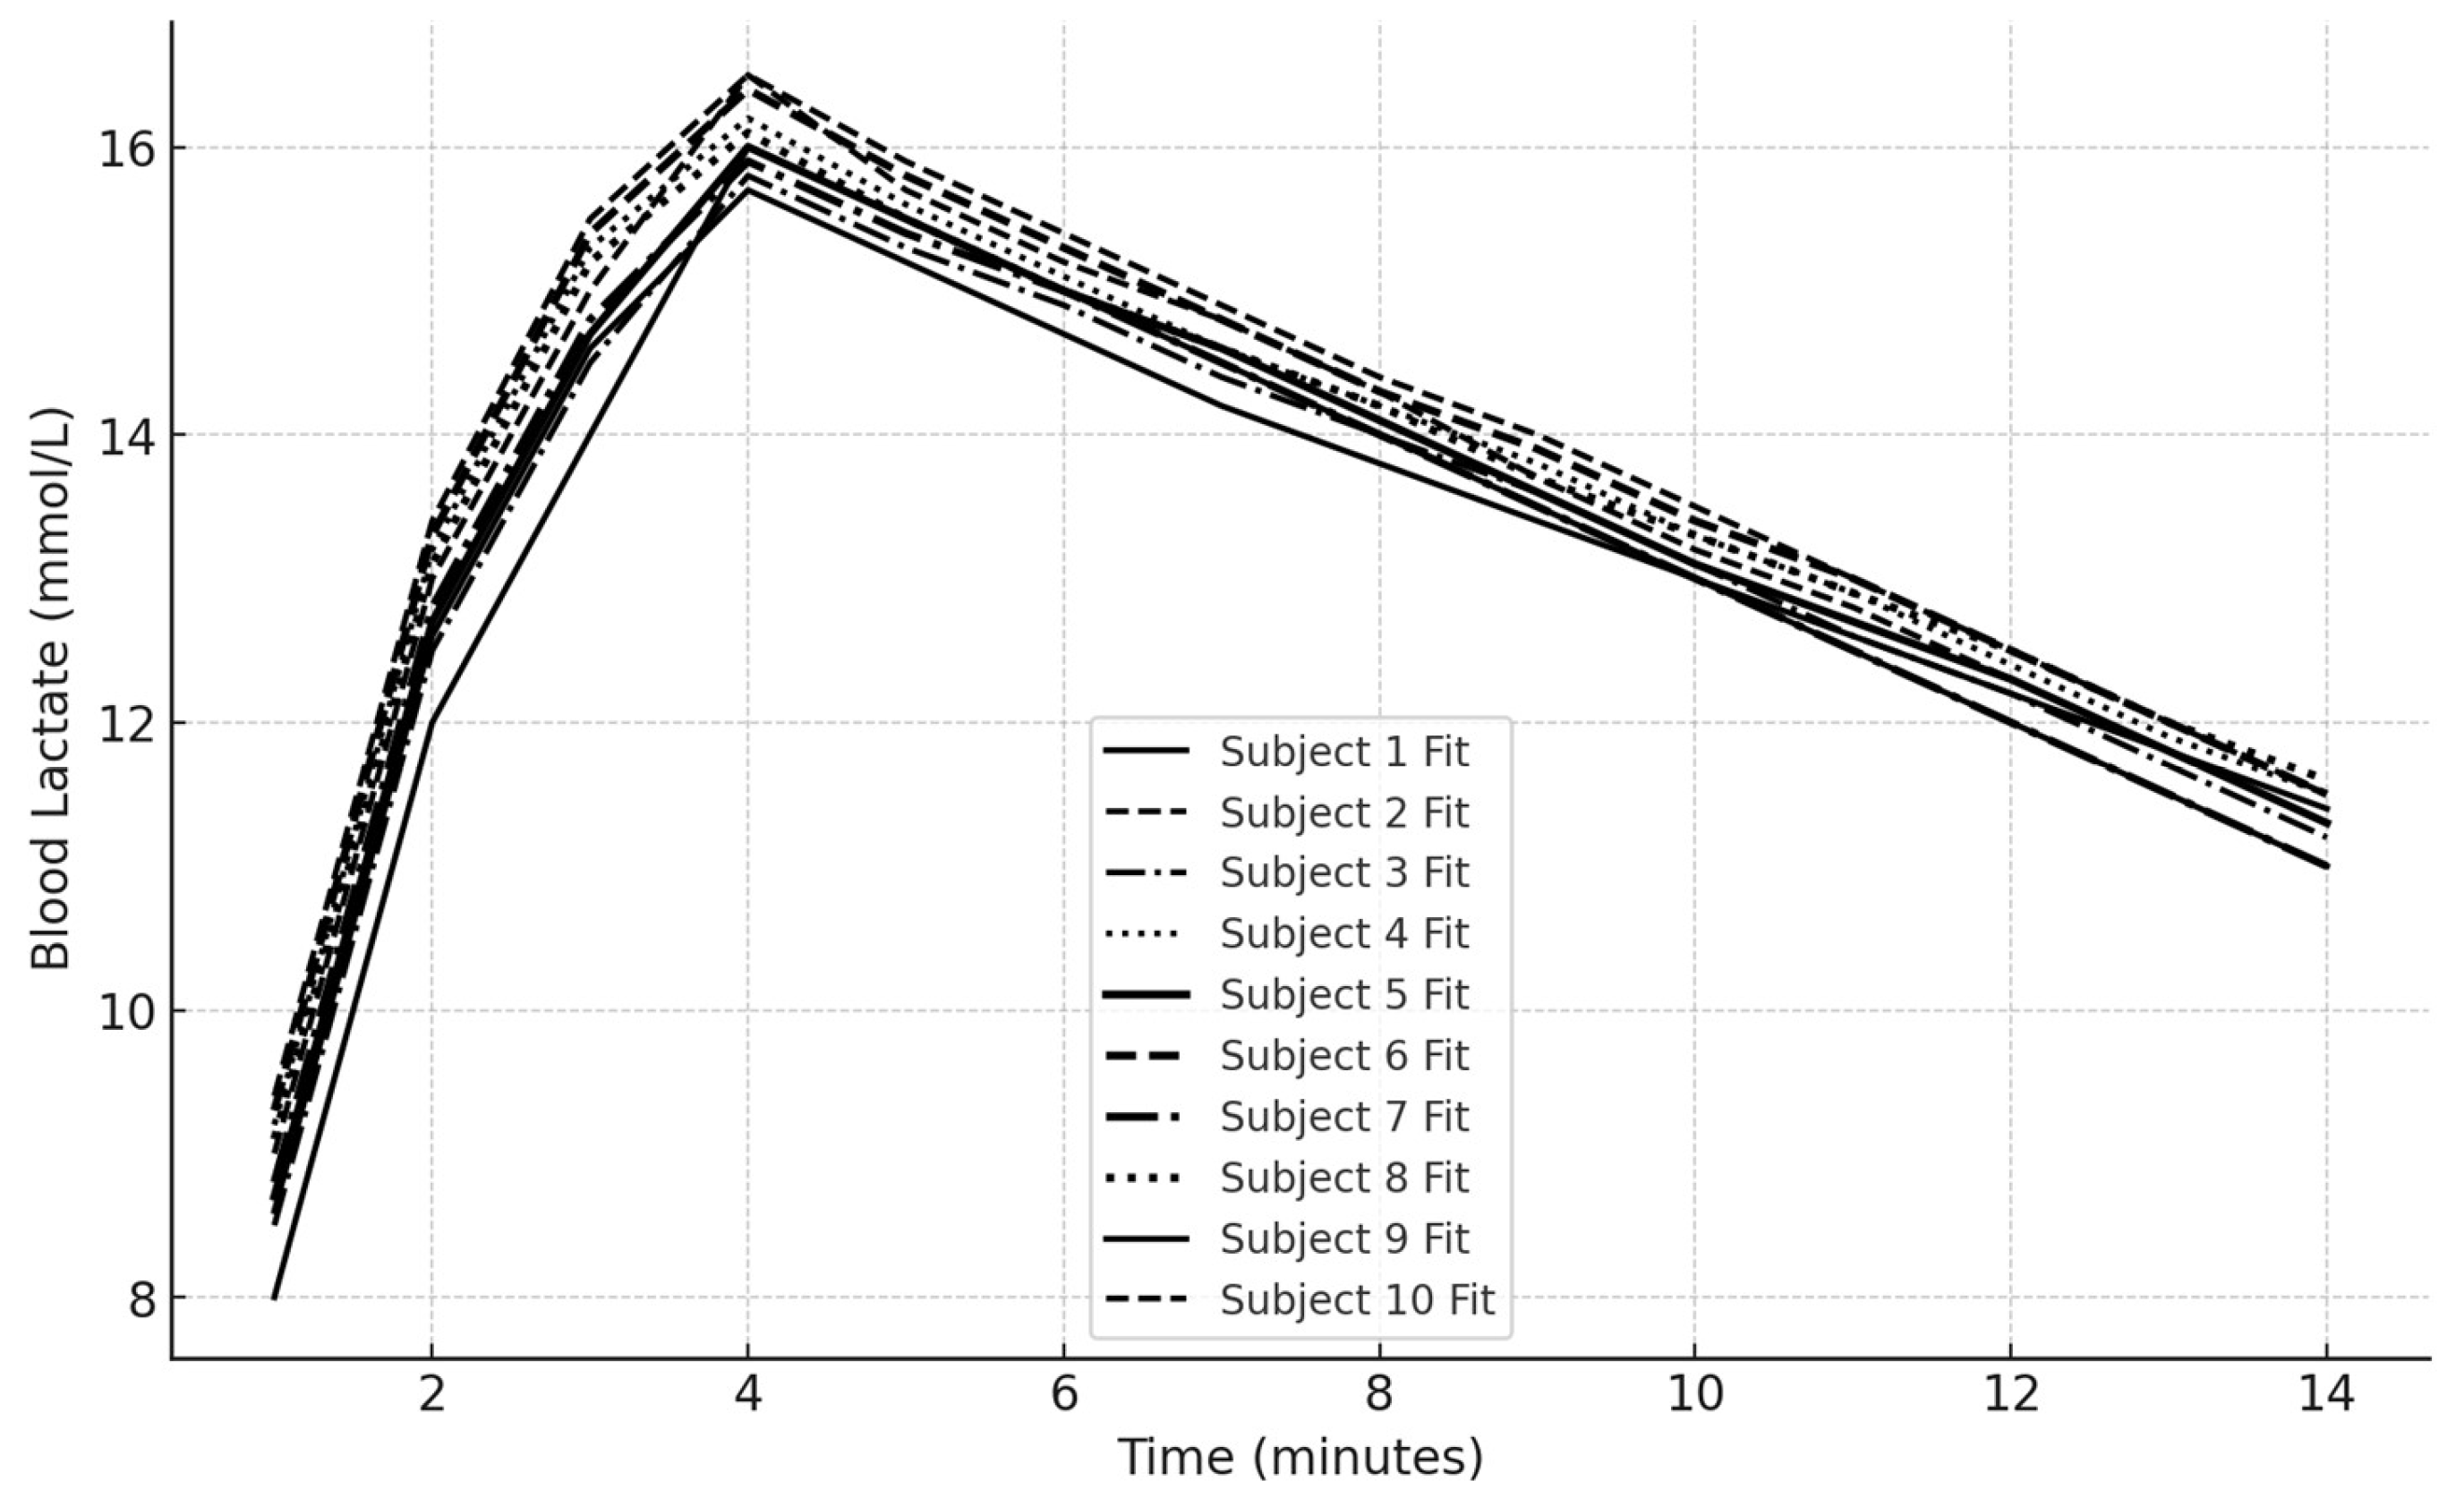
Biexponential Fit of Lactate Recovery for All Subjects
The graph above shows the biexponential fits for each subject’s lactate recovery data, with different shapes representing different subjects (Subject 1 to Subject 10). The scatter points indicate the actual data, while the lines represent the fitted biexponential models (
Figure 5).
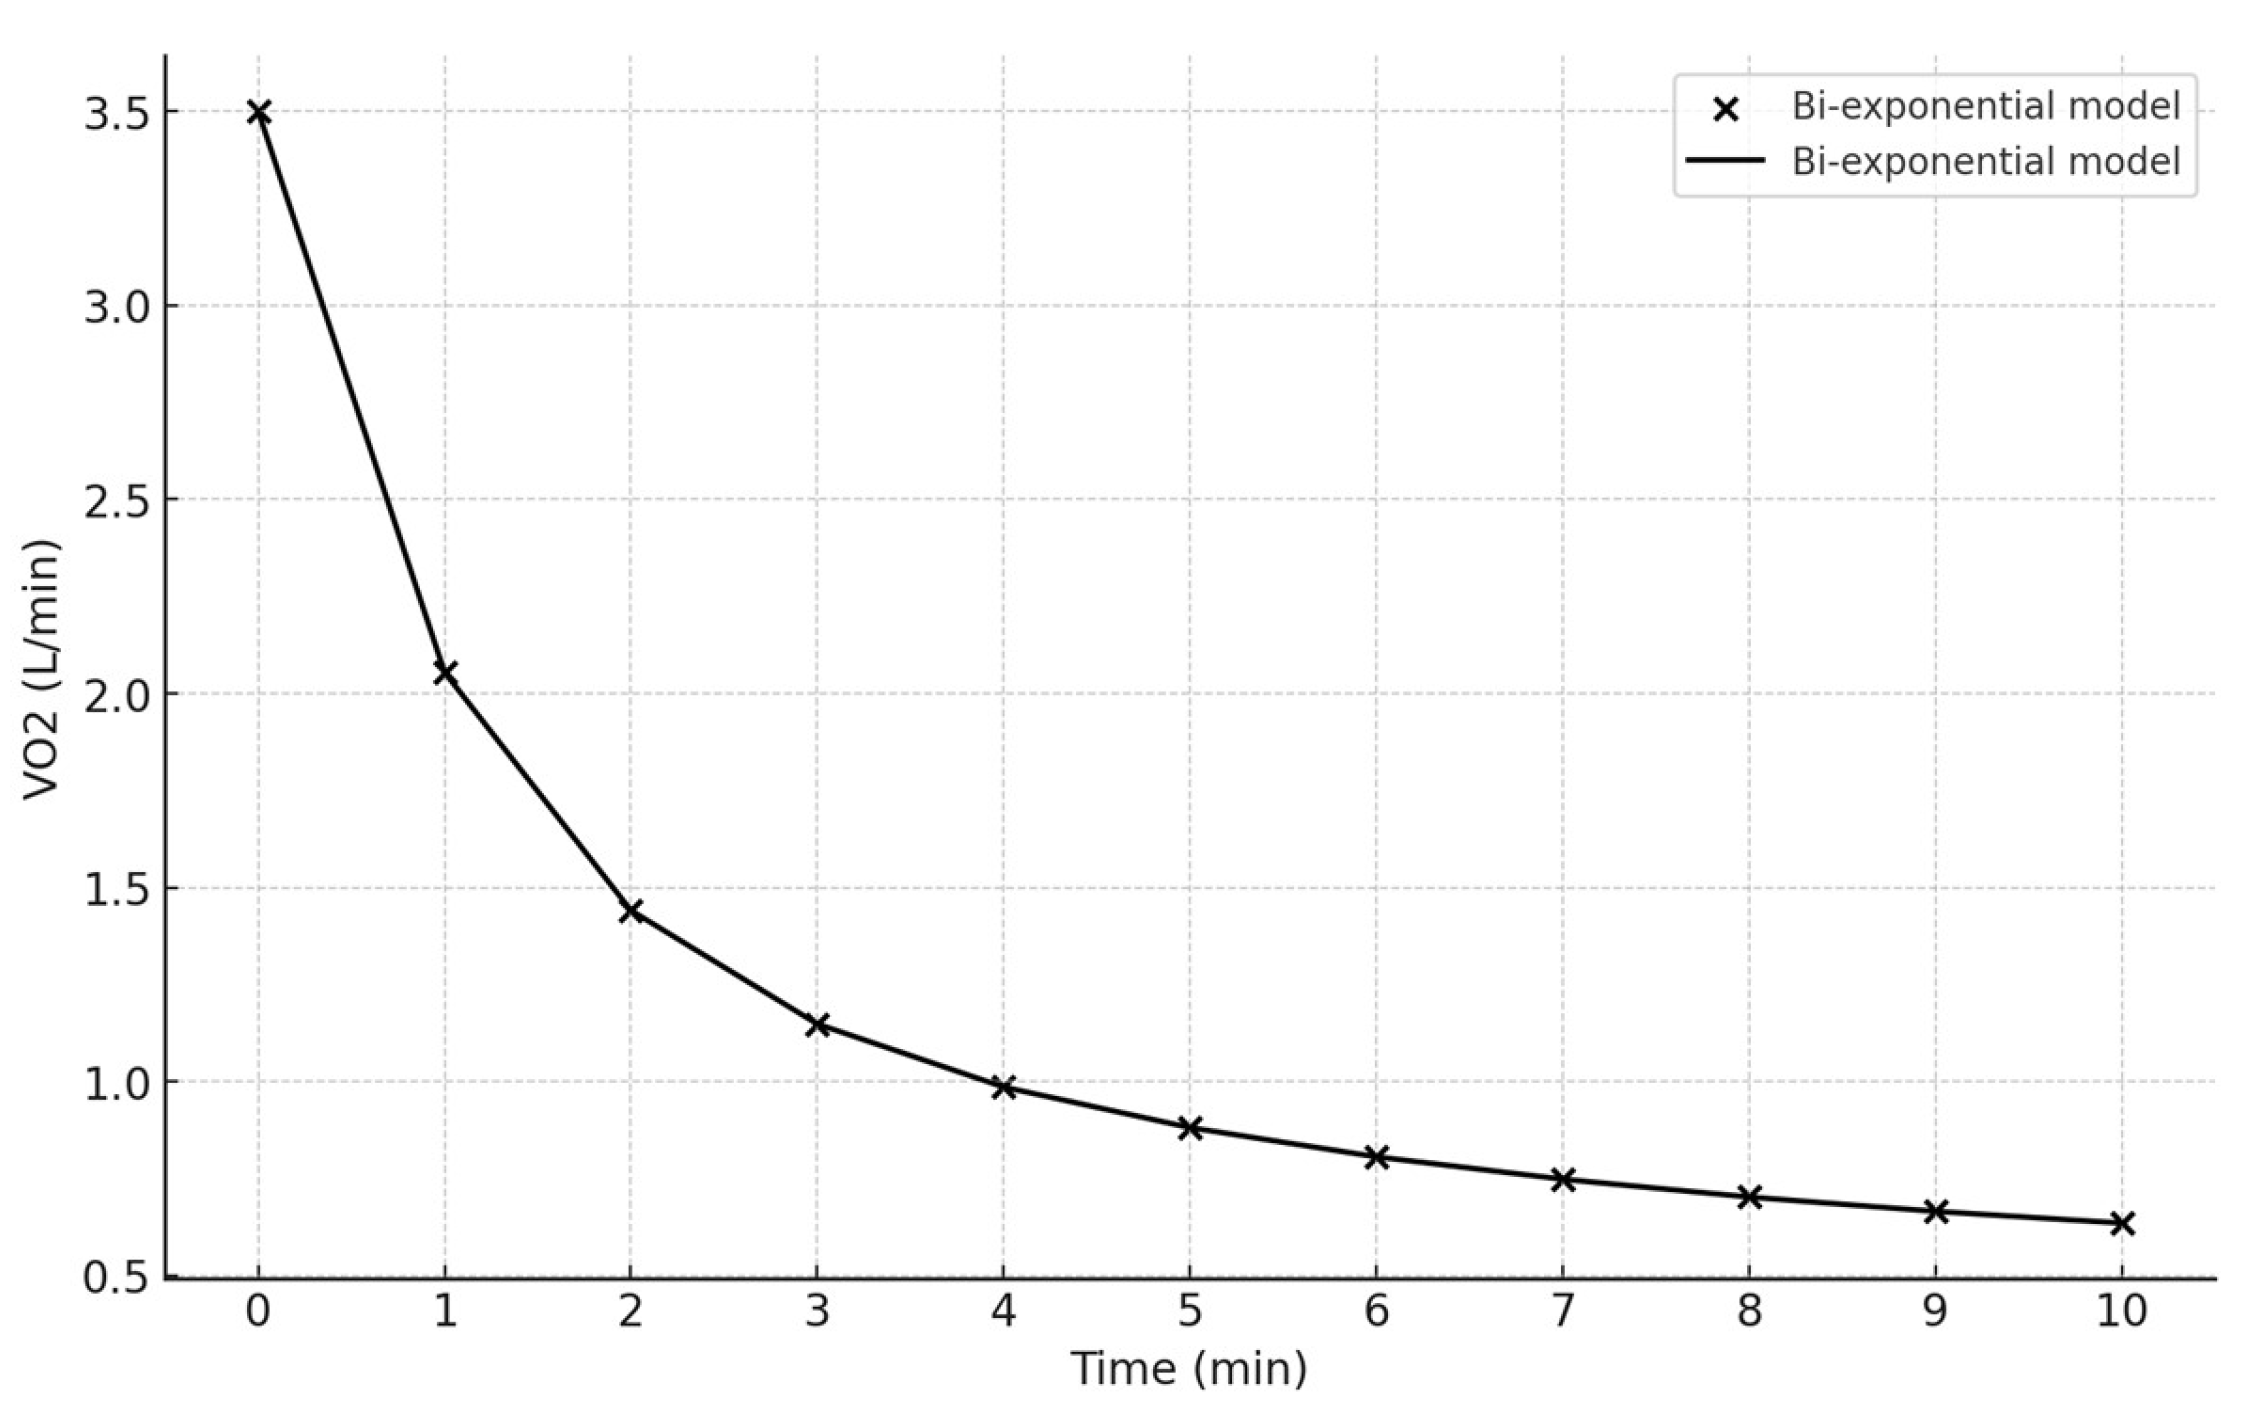
Bi-Exponential Fit of VO2
The graph illustrates the kinetics of VO2 (oxygen consumption) over 10 minutes following the 30s Wingate test (
Figure 5). The initial steep decline represents the fast phase of recovery, followed by a more gradual decline, representing the slow phase. The data points closely follow the model, indicating a good fit. The data is modeled using a bi-exponential function, which is a common method for describing the recovery kinetics of physiological variables.
Amplitude of Fast Phase (A1): 2.0 L/min
Amplitude of Slow Phase (A2): 1.0 L/min
Time Constant of Fast Phase (τ1): 60.0 seconds
Time Constant of Slow Phase (τ2): 300.0 seconds
Baseline VO2 (y0): 0.5 L/min
4. Discussion
The current study aimed to elucidate the temporal dynamics of blood lactate concentration and oxygen consumption following supra-maximal efforts in elite sprinters. Our findings contribute to the growing body of knowledge on the physiological responses and recovery kinetics in this specialized athletic population, offering substantial implications for training and performance optimization. Our results indicated that peak blood lactate concentration was achieved approximately 3 minutes post-exercise, consistent with previous research, such as Gupta et al. (2021), who reported similar peak lactate levels following intense 400-meter sprints [
23]. This peak reflects the predominant anaerobic glycolytic contribution during all-out efforts, necessary for sustaining high power outputs over short durations [
24]. The observed peak lactate concentration (14.9 ± 3.5 mmol/L) aligns with values documented in other studies of elite sprinters, such as Zajac (2024), who reported peak values of 13.2 mmol/L [
16]. The bi-exponential decay pattern observed in lactate concentration during the recovery phase, is characterized by an initial rapid decline followed by a slower phase [
25]. The initial rapid phase likely corresponds to the clearance of lactate via oxidation and gluconeogenesis, facilitated by active muscles and other tissues [
26]. The slower secondary phase likely represents the utilization of lactate by less active muscles and the liver [
27]. This decay pattern underscores the complexity of lactate clearance and highlights the importance of monitoring recovery over an extended period [
4]. The optimal timing for blood sample collection to capture peak lactate levels is critical for accurate assessment [
26]. While our study supports a 3-minute post-exercise window, extending the sampling period up to 20 minutes, as recommended by Zajac (2024), provides a more comprehensive understanding of lactate kinetics and recovery profiles. This extended monitoring can aid in designing more effective training and recovery protocols, tailored to the individual metabolic responses of athletes, thereby enhancing performance and minimizing the risk of overtraining [
16].
The VO2 kinetics observed in our study demonstrated a rapid initial increase during the graded exercise test, reaching a peak followed by a bi-exponential decline during the recovery phase. The fast phase of oxygen recovery, characterized by a time constant (τ1) of approximately 60 seconds, represents the rapid replenishment of phosphocreatine stores and the initial re-oxygenation of myoglobin [
28,
29]. This phase is crucial for immediate recovery and preparation for subsequent high-intensity exercise bouts. The slower phase, with a time constant (τ2) of about 300 seconds, reflects ongoing oxidative metabolism and the clearance of metabolic by-products such as lactate and hydrogen ions. The amplitude of the fast phase (A1 = 2.0 L/min) and the slow phase (A2 = 1.0 L/min) observed in our study are consistent with values reported in previous research on elite athletes, indicating a well-developed capacity for both rapid and prolonged recovery [
6]. Our findings align with those of Dupont et al. (2004), who also observed significant fast and slow components in VO2 recovery kinetics in trained athletes. The high VO2peak values (45.4 ± 4.1 ml/kg/min) recorded in our participants highlight the exceptional aerobic capacity of elite sprinters, which complements their anaerobic power. This dual capacity is essential for sustaining high-intensity efforts and optimizing performance in sprint events. Our findings are in line with those of Dupont et al. (2004), who also observed significant fast and slow components in the VO2 recovery kinetics in trained athletes [
30]. The close alignment of our data with established models of lactate and VO2 kinetics underscores the robustness of our experimental design and the relevance of our findings to the broader field of exercise physiology [
30]. Furthermore, the high VO2peak values (45.4 ± 4.1 ml/kg/min) recorded in our participants highlight the exceptional aerobic capacity of elite sprinters, which complements their anaerobic power. This dual capacity is essential for sustaining high-intensity efforts and optimizing performance in sprint events.
Our data also demonstrate that elite sprinters possess a unique ability to rapidly clear lactate and other metabolic by-products, likely a result of their high-intensity training regimens [
31]. This ability to efficiently recover between bouts of intense exercise is a critical factor in their performance and success. Our findings extend the work of Bogdanis et al. (1996), who reported similar rapid lactate clearance in elite athletes, suggesting that training interventions aimed at enhancing lactate clearance could be beneficial for improving performance [
32].
The detailed understanding of lactate and VO2 kinetics provided by our study can inform the development of tailored training programs that optimize both anaerobic and aerobic conditioning. Coaches and athletes can use these insights to fine-tune training loads, recovery strategies, and nutritional interventions to enhance performance and reduce the risk of overtraining. For instance, incorporating interval training sessions that mimic the demands of competition can help improve both the anaerobic and aerobic capacities of sprinters. Additionally, active recovery strategies, such as low-intensity cycling or swimming, can facilitate lactate clearance and enhance recovery. Nutritional interventions, such as carbohydrate and protein supplementation, can also support recovery by replenishing glycogen stores and promoting muscle repair.
Future research should continue to explore the dynamics of lactate and VO2 kinetics across different athletic populations and training modalities. Investigating the impact of various training interventions, such as high-intensity interval training (HIIT) and resistance training, on these physiological responses could provide valuable insights for optimizing training and recovery protocols. Moreover, longitudinal studies examining the long-term adaptations to training in elite sprinters could help elucidate the mechanisms underlying their exceptional performance and recovery capabilities. Such research could also identify potential biomarkers for monitoring training status and preventing overtraining.
5. Conclusions
In summary, our study offers valuable contributions to understanding metabolic responses and recovery dynamics in elite sprinters. The findings underscore the importance of precise timing in lactate sampling and highlight the complex interplay between anaerobic and aerobic systems during and after high-intensity exercise. Future research should further explore these dynamics across different athletic populations and training modalities to refine training and recovery strategies in competitive sports. By advancing our understanding of these physiological responses, we can develop more effective training programs that enhance performance, reduce the risk of injury, and promote long-term athletic development.
Institutional Review Board Statement
This study was conducted by the Declaration of Helsinki and received pre-approval from the local ethical committee of Istanbul Gedik University (Approval ID: E-56365223-050.02.04-2023.137548.20).
Informed Consent Statement
Informed consent was obtained from all participants or their legal guardians, following comprehensive explanations of the study’s objectives and associated risks.
Data Availability Statement
We encourage all authors of articles published in MDPI journals to share their research data. In this section, please provide details regarding where data supporting reported results can be found, including links to publicly archived datasets analyzed or generated during the study. Where no new data were created, or where data is unavailable due to privacy or ethical restrictions, a statement is still required. Suggested Data Availability Statements are available in section “MDPI Research Data Policies” at
https://www.mdpi.com/ethics.
Conflicts of Interest
The authors declare no conflicts of interest.
References
- Devlin, J.; et al. Blood lactate clearance after maximal exercise depends on active recovery intensity. Journal of Sports Medicine and Physical Fitness 2014, 54, 271–278. [Google Scholar] [PubMed]
- Beneke, R.; et al. Modeling the blood lactate kinetics at maximal short-term exercise conditions in children, adolescents, and adults. Journal of applied physiology 2005, 99, 499–504. [Google Scholar] [CrossRef] [PubMed]
- Emhoff, C.-A.W.; Messonnier, L.A. Concepts of lactate metabolic clearance rate and lactate clamp for metabolic inquiry: a mini-review. Nutrients 2023, 15, 3213. [Google Scholar] [CrossRef] [PubMed]
- Brooks, G.A.; et al. Lactate as a myokine and exerkine: drivers and signals of physiology and metabolism. Journal of Applied Physiology 2023, 134, 529–548. [Google Scholar] [CrossRef]
- Vincent, J.-L. Serial blood lactate levels reflect both lactate production and clearance. Critical care medicine 2015, 43, e209. [Google Scholar] [CrossRef]
- Jones, A.M.; Carter, H. The effect of endurance training on parameters of aerobic fitness. Sports medicine 2000, 29, 373–386. [Google Scholar] [CrossRef]
- Jones, A.M.; Poole, D.C. Oxygen uptake kinetics in sport, exercise and medicine. 2013: Routledge.
- Murias, J.M.; Kowalchuk, J.M.; Paterson, D.H. Speeding of VO2 kinetics with endurance training in old and young men is associated with improved matching of local O2 delivery to muscle O2 utilization. Journal of applied physiology 2010, 108, 913–922. [Google Scholar] [CrossRef]
- Jones, A.M. A five year physiological case study of an Olympic runner. British journal of sports medicine 1998, 32, 39–43. [Google Scholar] [CrossRef]
- Burnley, M.; et al. Effects of prior heavy exercise on phase II pulmonary oxygen uptake kinetics during heavy exercise. Journal of Applied Physiology 2000, 89, 1387–1396. [Google Scholar] [CrossRef]
- Keir, D.A.; et al. Using ramp-incremental V˙ O2 responses for constant-intensity exercise selection. Applied Physiology, Nutrition, and Metabolism 2018, 43, 882–892. [Google Scholar] [CrossRef]
- Keir, D.A.; et al. Identification of non-invasive exercise thresholds: methods, strategies, and an online app. Sports Medicine 2022, 52, 237–255. [Google Scholar] [CrossRef] [PubMed]
- Hill, D.W. Energy system contributions in middle-distance running events. Journal of sports sciences 1999, 17, 477–483. [Google Scholar] [CrossRef] [PubMed]
- Moore, K. Bowerman and the men of Oregon: The story of Oregon’s legendary coach and Nike’s co-founder. 2006: Rodale.
- Hanon, C.; et al. Oxygen uptake and blood metabolic responses to a 400-m run. European journal of applied physiology 2010, 109, 233–240. [Google Scholar] [CrossRef]
- Zając, B. Analysis of Course of Changes in Blood Lactate Concentration in Response to Graded Exercise Test and Modified Wingate Test in Adolescent Road Cyclists. Journal of Clinical Medicine 2024, 13, 535. [Google Scholar] [CrossRef]
- Shahidi, S.H. Alt Maksimum ve Maksimum Egzersiz Testlerinde Oksijen ve Laktat Kinetiği. Spor Bilimleri Alanında Akademik Araştırma ve Değerlendirmeler-II, 2024: p. 63.
- Shahidi, S.H. Body Composition and Anthropometric Measurements, in Özgür Publications. 2023.
- Shahidi, S.H.; Yalçın, M.; Holway, F.E. Anthropometric and Somatotype Characteristics of Top Elite Turkish National Jumpers. International Journal of Kinanthropometry 2023, 3, 45–55. [Google Scholar] [CrossRef]
- Shahidi, S.H.; Coşkun, G.; Holway, F.E. Investigation of Oxygen Uptake Kinetics and Anthropometric Profiles in Elite Kickboxing Athletes. International Journal of Kinanthropometry 2023, 3, 1–8. [Google Scholar] [CrossRef]
- O’Brien, T.E.; Silcox, J.W. Nonlinear Regression Modelling: A Primer with Applications and Caveats. Bulletin of Mathematical Biology 2024, 86, 40. [Google Scholar] [CrossRef]
- Caritá, R.A.C.; Greco, C.C.; Denadai, B.S. The positive effects of priming exercise on oxygen uptake kinetics and high-intensity exercise performance are not magnified by a fast-start pacing strategy in trained cyclists. PLoS One 2014, 9, e95202. [Google Scholar] [CrossRef]
- Gupta, S.; Stanula, A.; Goswami, A. Peak blood lactate concentration and its arrival time following different track running events in under-20 male track athletes. International Journal of Sports Physiology and Performance 2021, 16, 1625–1633. [Google Scholar] [CrossRef]
- Skalenius, M.; et al. Performance and cardiac evaluation before and after a 3-week training camp for 400-meter sprinters–An observational, non-randomized study. Plos one 2019, 14, e0217856. [Google Scholar] [CrossRef]
- Brooks, G.A. Intra-and extra-cellular lactate shuttles. Medicine and science in sports and exercise 2000, 32, 790–799. [Google Scholar] [CrossRef]
- Brooks, G.A. The lactate shuttle during exercise and recovery. Medicine and science in sports and exercise 1986, 18, 360–368. [Google Scholar] [CrossRef] [PubMed]
- Chatel, B.; et al. Lactate recovery kinetics in response to high-intensity exercises. European Journal of Applied Physiology 2016, 116, 1455–1465. [Google Scholar] [CrossRef] [PubMed]
- Poole, D.C.; Wilkerson, D.P.; Jones, A.M. Validity of criteria for establishing maximal O2 uptake during ramp exercise tests. European journal of applied physiology 2008, 102, 403–410. [Google Scholar] [CrossRef] [PubMed]
- Poole, D.C.; Jones, A.M. Measurement of the maximum oxygen uptake Vo2max: Vo2peak is no longer acceptable. Journal of applied physiology 2017, 122, 997–1002. [Google Scholar] [CrossRef] [PubMed]
- Dupont, G.; Berthoin, S. Time spent at a high percentage of max for short intermittent runs: active versus passive recovery. Canadian journal of applied physiology 2004, 29, S3–S16. [Google Scholar] [CrossRef]
- Ben Abderrahman, A.; et al. Effects of recovery mode (active vs. passive) on performance during a short high-intensity interval training program: a longitudinal study. European journal of applied physiology 2013, 113, 1373–1383. [Google Scholar] [CrossRef]
- Bogdanis, G.C.; et al. Recovery of power output and muscle metabolites following 30 s of maximal sprint cycling in man. The Journal of physiology 1995, 482, 467–480. [Google Scholar] [CrossRef]
|
Disclaimer/Publisher’s Note: The statements, opinions and data contained in all publications are solely those of the individual author(s) and contributor(s) and not of MDPI and/or the editor(s). MDPI and/or the editor(s) disclaim responsibility for any injury to people or property resulting from any ideas, methods, instructions or products referred to in the content. |
© 2024 by the authors. Licensee MDPI, Basel, Switzerland. This article is an open access article distributed under the terms and conditions of the Creative Commons Attribution (CC BY) license (http://creativecommons.org/licenses/by/4.0/).
