Preprint
Article

Modeling and Predicting Self-Organization in Dynamic Systems Out of Thermodynamic Equilibrium; Part 1

Altmetrics

Downloads

124

Views

97

Comments

0

A peer-reviewed article of this preprint also exists.

This version is not peer-reviewed

Submitted:

30 November 2024

Posted:

02 December 2024

Read the latest preprint version here

Alerts
Abstract
Self-organization in complex systems is a process associated with reduced internal entropy and the emergence of structures that may enable the system to function more effectively in its environment and in a more competitive way with other states of the system or with other systems. This phenomenon typically occurs in the presence of energy gradients, facilitating energy transfer and entropy production. As a dynamic process, self-organization is best studied using dynamic measures and principles. The principles of minimizing unit action, entropy, and information while maximizing their total values are proposed as some of the dynamic variational principles guiding self-organization. Based on these principles, average action efficiency (AAE) is introduced as a potential quantitative measure of self-organization, reflecting the system’s efficiency as the ratio of events to total action per unit of time. Positive feedback loops link AAE to other system characteristics, potentially explaining power-law relationships and exponential growth patterns observed in complex systems. To explore this framework, we apply it to agent-based simulations of ants navigating between two locations on a 2D grid. The principles align with observed self-organization dynamics, and the results appear to support the model. By analyzing action efficiency, this study seeks to address fundamental questions about the nature of self-organization and system organization, such as "Why and how complex systems self-organize? What is organization and how organized is a system?". These findings suggest that the proposed models offer a useful perspective for understanding and potentially improving the design of complex systems.
Keywords: 
Subject: Physical Sciences  -   Theoretical Physics

1. Introduction

1.1. Background and Motivation

Self-organization in dissipative structures is an important concept for understanding the existence of, and the changes in many systems that lead to higher levels of structure and complexity in development and evolution [1,2]. It is a scientific as well as a philosophical question, as our understanding deepens and our realization of the importance of the process grows. Self-organization often leads to more efficient use of resources and optimized performance, which is one measure of the degree of complexity. By degree of complexity here we mean a more organized, robust, resilient, competitive, efficient in using resources and alive system. Competition for resources is often a significant evolutionary pressure in systems of different natures, suggesting that more efficient systems may have a higher likelihood of survival across various levels of Cosmic Evolution.
Our goal is ultimately to contribute to the explanation of self-organization mechanisms observable in various systems, with implications for understanding Cosmic Evolution [3,4,5,6,7,8,9,10]. Self-organization exhibits patterns that suggest a degree of universality across different substrates, including physical, chemical, biological, and social systems, potentially explaining their structures [11,12,13,14]. Developing a quantitative method to measure organization across systems can enhance our understanding of their functioning and guide the design of more efficient systems [15,16,17,18,19].
Previous attempts to quantify organization are extremely valuable and fruitful and have used measures, such as information [20,21,22,23,24,25,26] and entropy [27,28,29,30,31,32]. Our approach offers a dynamic perspective on this process. This study utilizes an expanded version of Hamilton’s action principle to propose a dynamic action principle, suggesting that in the system studied, the average unit action for one trajectory decreases while the total action for the whole system increases during self-organization.
Despite their recognized significance, the mechanisms driving self-organization remain partially understood, largely due to the complexities and non-linearities inherent in such systems. Metrics such as entropy and information provide extremely valuable insights and are connected to other characteristics to complex systems in this work. The motivation for this study stems from the desire to connect those measures and further increase their value by using a novel measure of organization based on dynamical variational principles. More specifically we use Hamilton’s principle of stationary action, which is the basis of all laws of physics. In the limiting case, when the second variation of the action is positive, this makes it a true principle of least action. The principle of least action posits that the path taken by a physical system between two states is the one for which the action is minimized. Extending this principle to complex systems, we propose Average Action Efficiency as a potential dynamic measure of organization. It quantifies the level of organization and serves as a predictive tool for determining the most organized state of a system. It also correlates with other measures of complex systems, helping justify and validate its use. Average Action Efficiency (AAE) is a measure of how efficiently a system performs its processes, defined as the ratio of the total number of events to the total action per unit of time, representing the degree of organization and optimization in the system.
Understanding the mechanisms of self-organization can have profound implications across various scientific disciplines. Exploring these natural optimization processes may inspire the development of more efficient algorithms and strategies in engineering and technology. It can enhance our understanding of biological and ecological processes. It can allow us to design more efficient economic and social systems. Studying self-organization also can have profound scientific and philosophical implications. Investigating the mechanisms of self-organization may provide new perspectives on causality and control, particularly the role of local interactions and feedback loops in global pattern formation. In our model, each characteristic of a complex system is simultaneously a cause and an effect of all others. By proposing this quantitative measure of organization, we aim to contribute to the understanding of self-organization and explore its potential as a tool for optimizing complex systems across different fields.

1.2. Novelty and Scientific Contributions

In this paper, we will explore the following topics. Here are the highlights of them.

1.2.1. Dynamical Variational Principles

Extension of Hamilton’s Least Action Principle to Non-Equilibrium Systems: This work explores a possible extension of Hamilton’s principle to stochastic and non-equilibrium systems. We propose a framework that aims to connect classical mechanical principles to entropy and information-based variational principles, potentially providing insights into the analysis of self-organization in complex systems. We introduce a conceptual framework for dual dynamical principles, suggesting the simultaneous increase of total action, information, and entropy alongside the decrease of their unit counterparts, which reflect the system’s evolution and self-organization. These principles manifest in power-law relationships and reveal a unit-total (or local-global) duality across scales. Agent-based simulations suggest the validity of these dual variational principles, supporting a multiscale approach to modeling hierarchical and networked systems by linking micro-level interactions with macro-level organizational structures. This framework provides a preliminary interpretation of self-organization dynamics, which may benefit from further empirical exploration and theoretical refinement.

1.2.2. Positive Feedback Model of Self-Organization

Positive Feedback Model with Power-Law and Exponential Growth Predictions: This work investigates whether feedback mechanisms between system characteristics may predict power-law relationships among variables. We introduce and test a model of positive feedback loops within self-organizing systems, predicting power-law relationships and exponential growth. This model aims to extend empirical observations by attempting to derive power-law relations mathematically, offering a potential framework for understanding system dynamics. While initial findings are promising, further empirical validation and refinement of the model are needed to establish its predictive power. Future work will be needed to validate its predictive capacity and generalizability.
Prediction of Power-Law and Exponential Growth Patterns in Complex System Characteristics: By showing that the feedback mechanisms between the characteristics can predict power-law relationships among system variables, the paper goes beyond qualitative descriptions. Traditional models often observe power-law scaling relationships, but the causes for them are not entirely explained. Here, the work mathematically derives these relationships, offering a framework that could extend to empirical verification across disciplines.

1.2.3. Average Action Efficiency (AAE)

Introduction of Average Action Efficiency (AAE) as a Dynamic Measure: Average Action Efficiency (AAE) is proposed as a potential dynamic measure of organization in complex systems. It seeks to quantify process efficiency by examining the relationship between outcomes (such as task completion or structure formation) and resource use (like energy or time). AAE provides a real-time, metric for quantifying organization, based on the motion of the agents, complementing and expanding traditional measures. Application of this measure can be explored across disciplines, including physics, chemistry, biology, and engineering. It is validated through this simulation and comparison with data from other published work. AAE offers the potential for real-time system diagnosis and control, with possible applications in robotics, environmental management, and adaptive systems. Further validation is required to establish its effectiveness across diverse systems

1.2.4. Agent-Based Modeling (ABM)

Dynamic ABM: Our ABM incorporates dynamic effects, such as pheromone feedback, which provide a preliminary basis for exploring complex behaviors. This model demonstrates the applicability of the variational principles and dualism in stochastic and dissipative settings, enhancing the framework’s utility for future research and experimental studies. While these simulations align with theoretical expectations, additional testing is needed to robustly validate the framework.

1.2.5. Intervention and Control in Complex Systems

Real-Time Metric for Adaptive Control: By proposing AAE as a real-time measurable metric, this work explores the possibility of guiding systems toward optimized states. This diagnostic potential is relevant in fields like engineering and sustainability. Future research is needed to determine the reliability and practical utility of this metric in real-world applications.

1.2.6. Average Action-Efficiency as a Predictor of System Robustness:

Average Action Efficiency (AAE) is proposed as a possible measure of organization and a potential predictor of system robustness. We hypothesize that higher AAE may correlate with increased robustness and resilience to perturbations, offering a possible link between action efficiency and system stability. For example, in our simulation, higher AAE configurations, correspond to higher pheromone concentrations, which means more information for the ants to follow to return quickly on the shortest path if perturbed. This has scientific relevance for fields like ecology, network theory, and engineering, where robustness is key to system survival and functionality in changing environments. However, this relationship remains to be rigorously tested and validated. Further investigation is necessary to fully validate its utility and applicability across various systems.
Theoretical Framework Linking AAE to System Efficiency and Stability: The paper’s theory posits that AAE reflects the level of organization within a system, where higher AAE corresponds to more efficient, streamlined configurations that minimize wasted energy or time. This theoretical underpinning aligns well with the concept of robustness, as more organized and efficient systems are generally better equipped to withstand disturbances due to their optimized internal structure.
Positive Feedback Loops Reinforcing Stability: The positive feedback model presented in the paper suggests that as AAE increases, there is reinforcement of organized structures within the system. This self-reinforcing organization implies that systems with high AAE are not only efficient but also maintain structural coherence, which can enhance their ability to absorb and recover from perturbations. This resilience is commonly associated with robust systems in fields such as ecology and network theory.
Simulation Results Demonstrating Stability at High AAE: The agent-based simulations provide empirical support by showing that systems reach stable, organized states with increased AAE, despite initial stochastic movements and random perturbations. For example, in the ant simulation, paths converge to efficient routes over time, demonstrating the system’s ability to stabilize around high-efficiency configurations. This illustrates that systems with higher AAE can naturally resist or recover from randomness, showing robustness.

1.2.7. Philosophical Contribution

Fundamental Understanding of Self-Organization and Causality: This work aims to contribute to the theoretical understanding of self-organization by exploring the potential dual roles of system characteristics as both causes and effects. These ideas are intended as a foundation for further research on causality in complex systems, which will require additional validation and development.
Contribution to the Philosophy of Self-Organization and Evolution: Beyond technical applications, this work deepens the philosophical understanding of self-organization by proposing framing it as a universal process governed by variational principles that transcend specific system boundaries. The dynamic minimization of unit action combined with total action growth introduces a novel concept of evolution that is proposed to apply to open, thermodynamic, far from equilibrium complex systems. This conceptualization could inspire further philosophical inquiry into the nature of causality, emergence, and evolution in complex systems.

1.2.8. Novel Conceptualization of Evolution as a Path to Increased Action Efficiency:

This paper proposes an evolutionary perspective in which self-organization may drive systems toward states of increased action efficiency. This approach departs from more static views of evolution in complex systems, framing evolution not merely as survival optimization but as an open-ended journey toward dynamically minimized unit actions within the context of system growth. We propose that increasing action efficiency may play a role in driving evolution in complex systems, offering a quantitative basis for directional evolution as systems optimize organization over time. This evolution of internal structure, in general, is coupled with the environment, a question that we will explore in further research. This idea offers a possible quantitative perspective on directional evolution, which invites further exploration and refinement.

1.3. Overview of the Theoretical Framework

We use the extension of Hamilton’s Principle of Stationary Action to a Principle of Dynamic Action, according to which action in self-organizing systems is changing in two ways: decreasing the average action for one event and increasing the total amount of action in the system during the process of self-organization, growth, evolution, and development. This view can lead to a deeper understanding of the fundamental principles of nature’s self-organization, evolution, and development in the universe, ourselves, and our society.

1.4. Hamilton’S Principle and Action Efficiency

Action is the integral of the difference between the kinetic and potential energy of an object during motion, over time. Hamilton’s principle of stationary action states that for the laws of motion to be obeyed, action has to be stationary (most often minimized, i.e. the least action principle (LAP)), which is the most fundamental principle in nature, from which all other physics laws are derived [33,34]. Everything derived from it is guaranteed to be self-consistent [35]. Beyond classical and quantum mechanics, relativity, and electrodynamics, it has applications in statistical mechanics, thermodynamics, biology, economics, optimization, control theory, engineering, and information theory [36,37,38]. We propose its application, extension, and connection to other characteristics of complex systems as part of the complex systems theory.
Enders notably says: "One extremal principle is undisputed “the least-action principle (for conservative systems), which can be used to derive most physical theories, ...Recently, the stochastic least-action principle was also established for dissipative systems. Information theory and the stochastic least-action principle are important cornerstones of modern stochastic thermodynamics." [39] and "Our analytical derivations show that MaxEPP is a consequence of the least-action principle applied to dissipative systems (stochastic least-action principle)" [39].
Similar dynamic variational principles have also been proposed in considering the dynamics of systems away from thermodynamic equilibrium. Martyushev has published reviews on the Maximum Entropy Production Principle (MEPP) saying: "A nonequilibrium system develops so as to maximize its entropy production under present constraints. " [40]. "Sawada emphasized that the maximal entropy production state is most stable to perturbations among all possible (metastable) states." [41], which we will connect with dynamical action principles in the second part of this work.
The derivation of the MEPP from LAP was first done by Dewar in 2003[42] [43], basing his work on Jayne’s theory from 1957 [44,45], and extending it to non-equilibrium systems.
The papers by Umberto Lucia "Entropy Generation: Minimum Inside and Maximum Outside" (2014) [46] and "The Second Law Today: Using Maximum-Minimum Entropy Generation" [47] examine the thermodynamic behavior of open systems in terms of entropy generation and the principle of least action. Lucia explores the concept that within open systems, entropy generation tends to a minimum inside the system and reaches a maximum outside it, which relates to our observations of dualities of the same characteristic.
François Gay-Balmaz and Hiroshi Yoshimura derive a form of dissipative Least Action Principle (LAP) for systems out of equilibrium. Specifically, they extend the classical variational approaches used in reversible mechanics to dissipative systems. Their work involves the use of Lagrangian and Hamiltonian mechanics in combination with thermodynamic forces and fluxes, and they introduce modifications to the standard variational calculus to account for irreversible processes [48,49,50]
Arto Annila derives the Maximum Entropy Production Principle (MEPP) from the Least Action Principle (LAP) and demonstrates how the principle of least action underlies natural selection processes, showing that systems evolve to consume free energy in the least amount of time, thereby maximizing entropy production. He links LAP to the second law of thermodynamics and, consequently, MEPP [51]. Evolutionary processes in both living and non-living systems can be explained by the principle of least action, which inherently leads to maximum entropy production [52]. Both papers provide a detailed account of how MEPP can be understood as an outcome of the Least Action Principle, grounding it in thermodynamic and physical principles.
The potential of the stochastic Least Action Principle has been shown in [53] and a connection has been made to entropy.
The concept of least action has been generalized by applying it to both heat absorption and heat release processes [54]. This minimization of action corresponds to the maximum efficiency of the system, reinforcing the connection between the least action principle and thermodynamic efficiency. By applying the principle of least action to thermodynamic processes, the authors link this principle to the optimization of efficiency.
The increase in entropy production was related to the system’s drive towards a more ordered, synchronized state, and this process is consistent with MEPP, which suggests that systems far from equilibrium will evolve in ways that maximize entropy production. Thus, a basis is provided for the increase in entropy using LAP [55]. The least action principle has been used to derive maximum entropy change for non-equilibrium systems [56].
Variational methods have been emphasized in the context of non-equilibrium thermodynamics for fluid systems, especially in relation to MEPP emphasizing thermodynamic variational principles in nonlinear systems [57]. MEPP and the Least Action Principle (LAP) are connected through the Riemannian geometric framework, which provides a generalized least action bound applicable to probabilistic systems, including both equilibrium and non-equilibrium systems [58].
The Herglotz principle introduces dissipation directly into the variational framework by modifying the classical action functional with a dissipation term. This is significant because it provides a way to account for energy loss and the irreversible nature of processes in non-equilibrium systems. The Herglotz principle provides a powerful tool for non-equilibrium thermodynamics by allowing for the incorporation of dissipative processes into a variational framework. This enables the modeling of systems far from equilibrium, where energy dissipation and entropy production play key roles. By extending classical mechanics to include irreversibility, the Herglotz principle offers a way to describe the evolution of systems in non-equilibrium thermodynamics, potentially linking it to other key concepts like the Onsager relations and the MEPP [59,60,61].
In Beretta’s fourth law of thermodynamics, the steepest entropy ascent could be seen as analogous to the least action path in the context of non-equilibrium thermodynamics, where the system follows the most "efficient" path toward equilibrium by maximizing entropy production. Both principles are forms of optimization, where one minimizes physical action and the other maximizes entropy, providing deep structural insights into the behavior of systems across physics [62].
The validity of using variational principles is supported also by the work of Ilya Prigogine who describes the connection between self-organization and entropy production. It is valid near-equilibrium for steady steady-state systems [1,2,63].
On the other hand, the Lyapunov method which focuses on stability analysis by constructing a function that demonstrates how the system’s state evolves over time relative to an equilibrium point, can be used to asses the robustness of the structure formation, which we will explore in future work [64].
In most cases in classical mechanics, Hamilton’s stationary action is minimized, in some cases, it is a saddle point, and it is never maximized. The minimization of average unit action is proposed as a driving principle and the arrow of evolutionary time, and the stationary saddle points are temporary minima that transition to lower action states with evolution. Thus, globally, on long-time scales, average action is minimized and continuously decreasing, when there are no external limitations, or until a limit is reached. This turns it into a dynamic action principle for open-ended processes of self-organization, evolution, and development.
Our thesis is that we can complement other measures of organization and self-organization by applying a new measure based on Hamilton’s principle and its extension to dissipative and stochastic systems, namely the Average Action Efficiency (AAE) for all events in a complex system. This measure can be related to previously used measures, such as entropy and information, as in our model for the mechanism of self-organization, progressive development, and evolution. We demonstrate this with power-law relationships in the results. We propose that this measure can be applied to various real systems, and we show data from other works about this relationship.
This paper presents a derivation of a quantitative measure of Average Action Efficiency, illustrated with simple examples, and a model in which all characteristics of a complex system reinforce each other, leading to exponential growth and power law relations between each pair of characteristics. The principle of least action is proposed as the driver of self-organization, as agents of the system follow natural laws in their motion, resulting in the most action-efficient paths. This is analogous to a particle rolling downhill for isolated objects, taking the shortest path, but in complex systems, we need to consider the average of the motions of all objects as a result of their interactions. Then the most average action-efficient state of a system will be a consequence of the same drive towards the shortest possible trajectories in a system, given the constraints and interactions. The trajectories of agents in complex systems are almost never straight lines, and their curvature represents the structure and organization of a system, which constantly changes in search of shorter trajectories. This could explain why complex systems form structures and order, and continue self-organizing and adapting in their evolution and development.
Our measure of AAE assumes dynamical flow networks away from thermodynamic equilibrium that transport matter and energy along their flow channels and applies to such systems. The significance of our results is that they can contribute to developing a framework that may empower natural and social sciences to quantify organization and structure in an absolute, numerical, and unambiguous way. Providing a mechanism through which the least action principle and the derived measure of average action efficiency as the level of organization interact in a positive feedback loop with other characteristics of complex systems can help in the quest to explain the existence of observed events in Cosmic Evolution [3,4]. The tendency to minimize average unit action for one crossing between nodes in a complex flow network comes from the principle of least action and is proposed as the arrow of time, one of the main driving principles towards, and explanation of progressive development and evolution that leads to the enormous variety of systems and structures that we observe in nature and society. While promising, its applicability and relevance to a broader range of systems warrant much additional exploration and empirical testing.

1.5. Mechanism of Self-Organization

The research in this study aims to contribute to finding the driving principle and mechanism of self-organization and evolution in open, complex, non-equilibrium thermodynamic systems. Here we report the results of agent-based modeling simulations and compare them with analogous data for real systems from the literature. We propose that the state with the least average unit action is the attractor for processes of self-organization and development in the universe across many systems, but, a lot more work is needed to establish whether it is valid in all cases. We measure this state through Average Action Efficiency (AAE).
We present a model for quantitatively calculating the amount of organization in a simulated complex system and its correlation with all other characteristics through power law relationships. We also show one possible mechanism for the progressive self-organization of this system, which is the positive feedback loop between all characteristics of the system that leads to an exponential growth of all of them until an external limit is reached. Always, the internal organization of all complex systems in nature reflects their external environment where the flows of energy and matter come from, which remains to be explored. This model also predicts power law relationships between most characteristics of complex systems. Numerous measured complexity-size scaling relationships align with the predictions of this model [65,66,67].
Our work aims to contribute to addressing the problem of measuring quantitatively the amount of organization in complex systems by proposing and testing a quantitative measure of organization, namely AAE, based on the movement of agents and their dynamics. This measure is functional and dynamic, not relative and static. We show that the amount of organization can be described as proprtional to the number of events in a system and inversely proportional to the average total physical amount of action in a system. We derive the expression for organization, apply it to a simple example, and validate it with results from agent-based modeling (ABM) simulations which allow us to verify experimental data, and to vary conditions to address specific questions [68,69]. We discuss extensions of the model for a large number of agents and state the limitations and applicability of this model in our list of assumptions.
Measuring the level of organization in a system is crucial because it provides a long-sought criterion for evaluating and studying the mechanisms of self-organization in natural and technological systems. All those are dynamic processes, which necessitate searching for a new, dynamic measure. By measuring the amount of organization, we can analyze and design complex systems to improve our lives, in ecology, engineering, economics, and other disciplines. The level of organization corresponds to the system’s robustness, which is vital for survival in case of accidents or events endangering any system’s existence [70]. Philosophically and mathematically, each characteristic of the system is a cause and effect of all the others, similar to auto-catalytic cycles [71], which is well-studied in cybernetics [72].
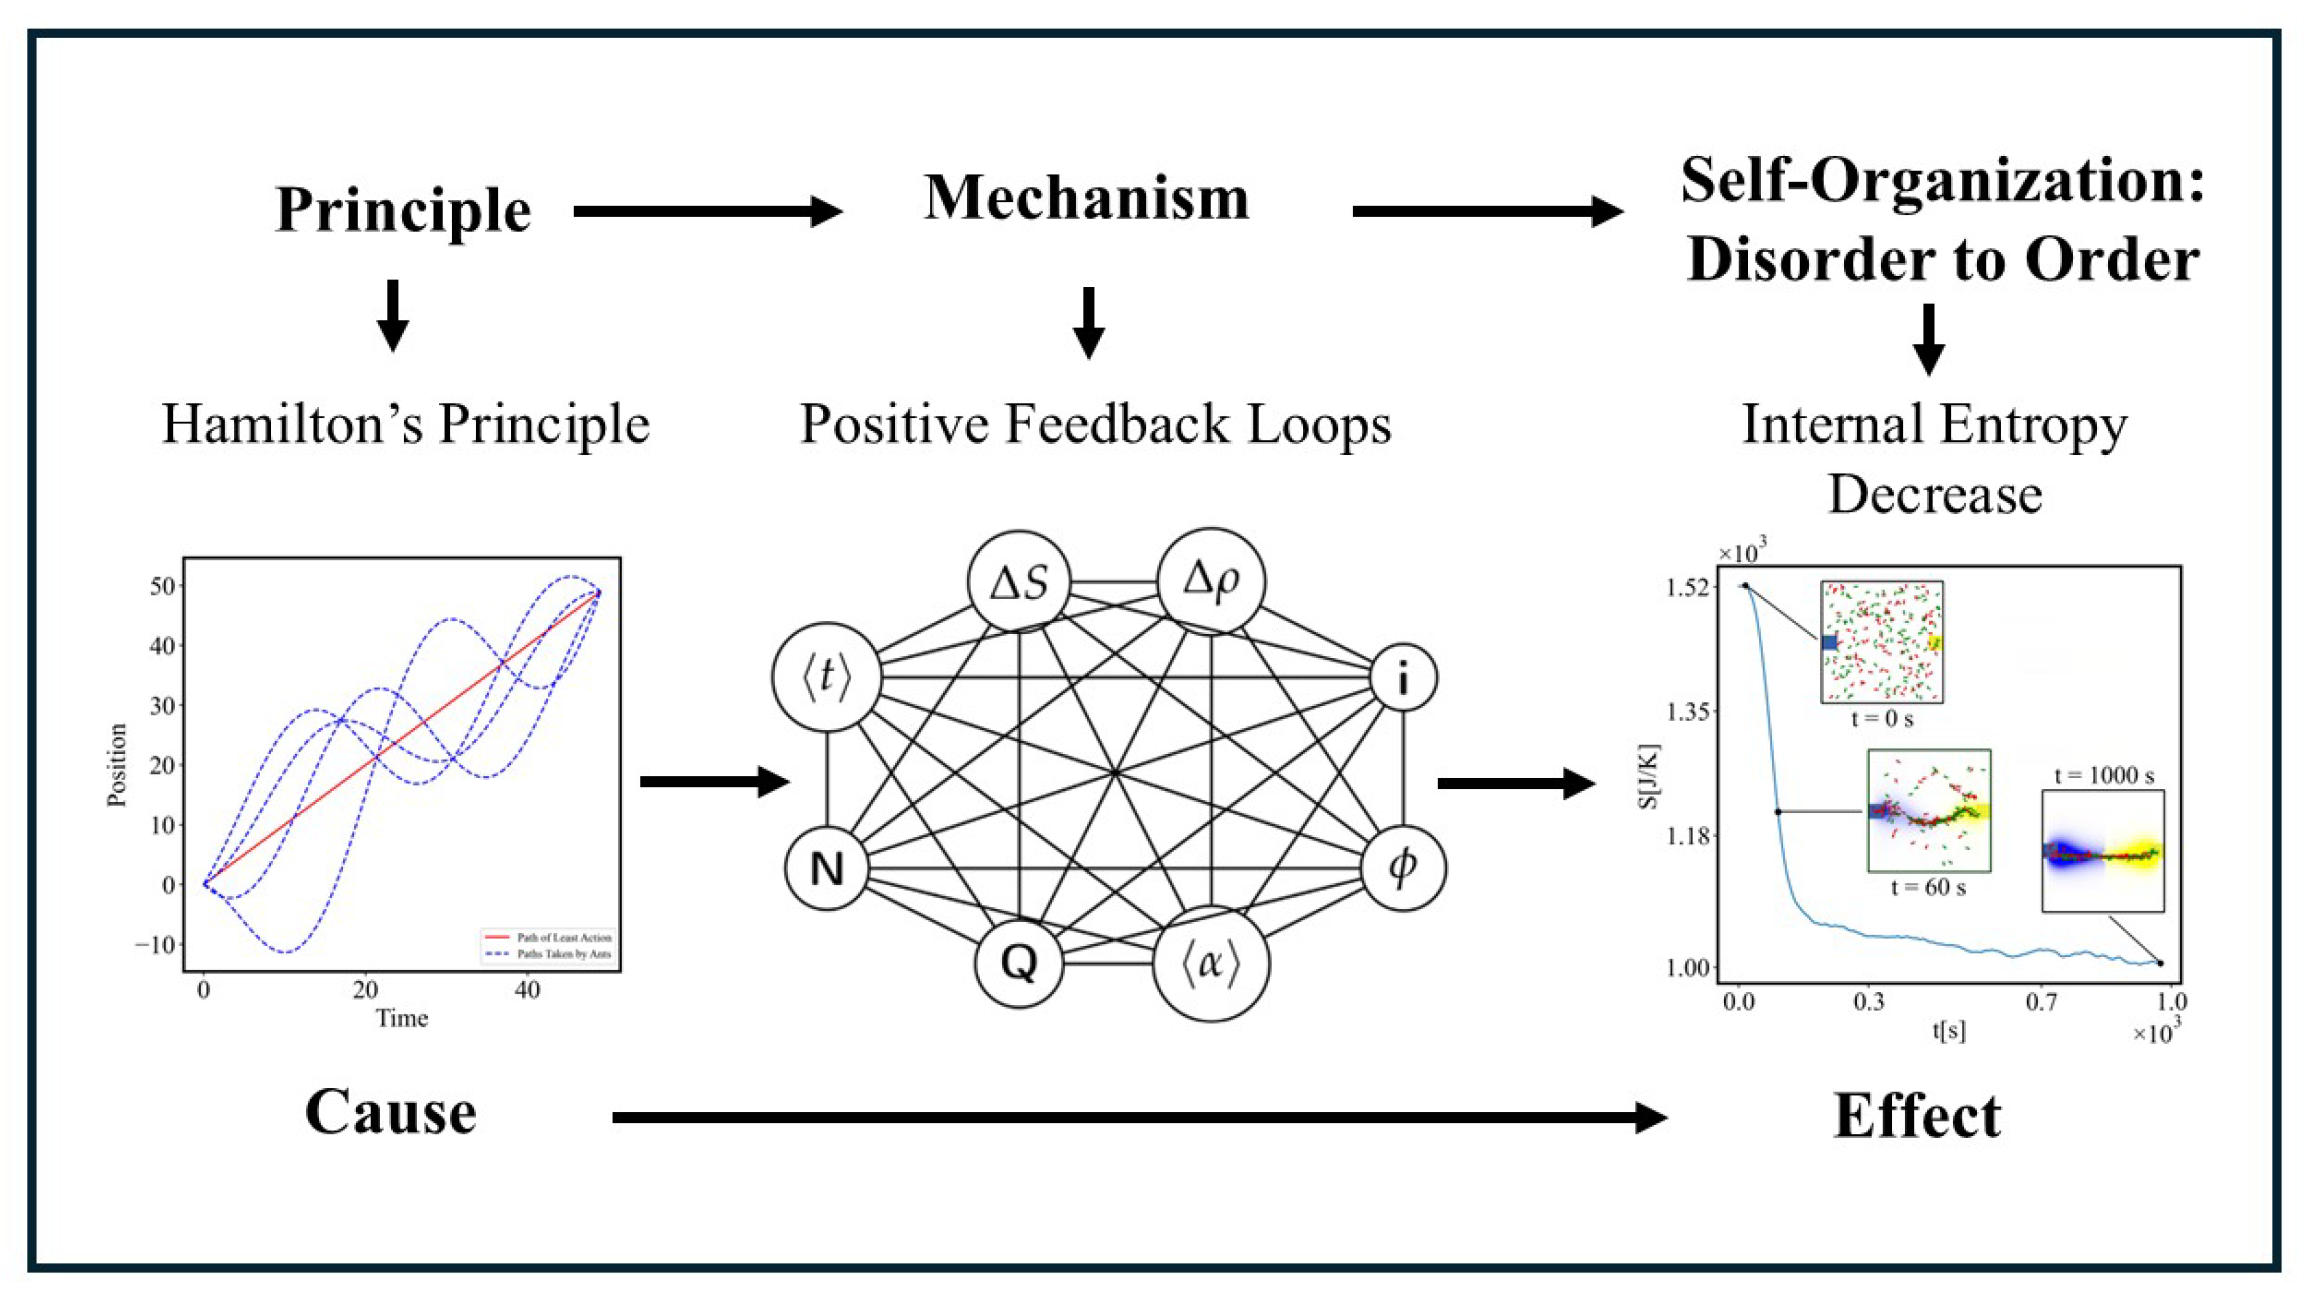
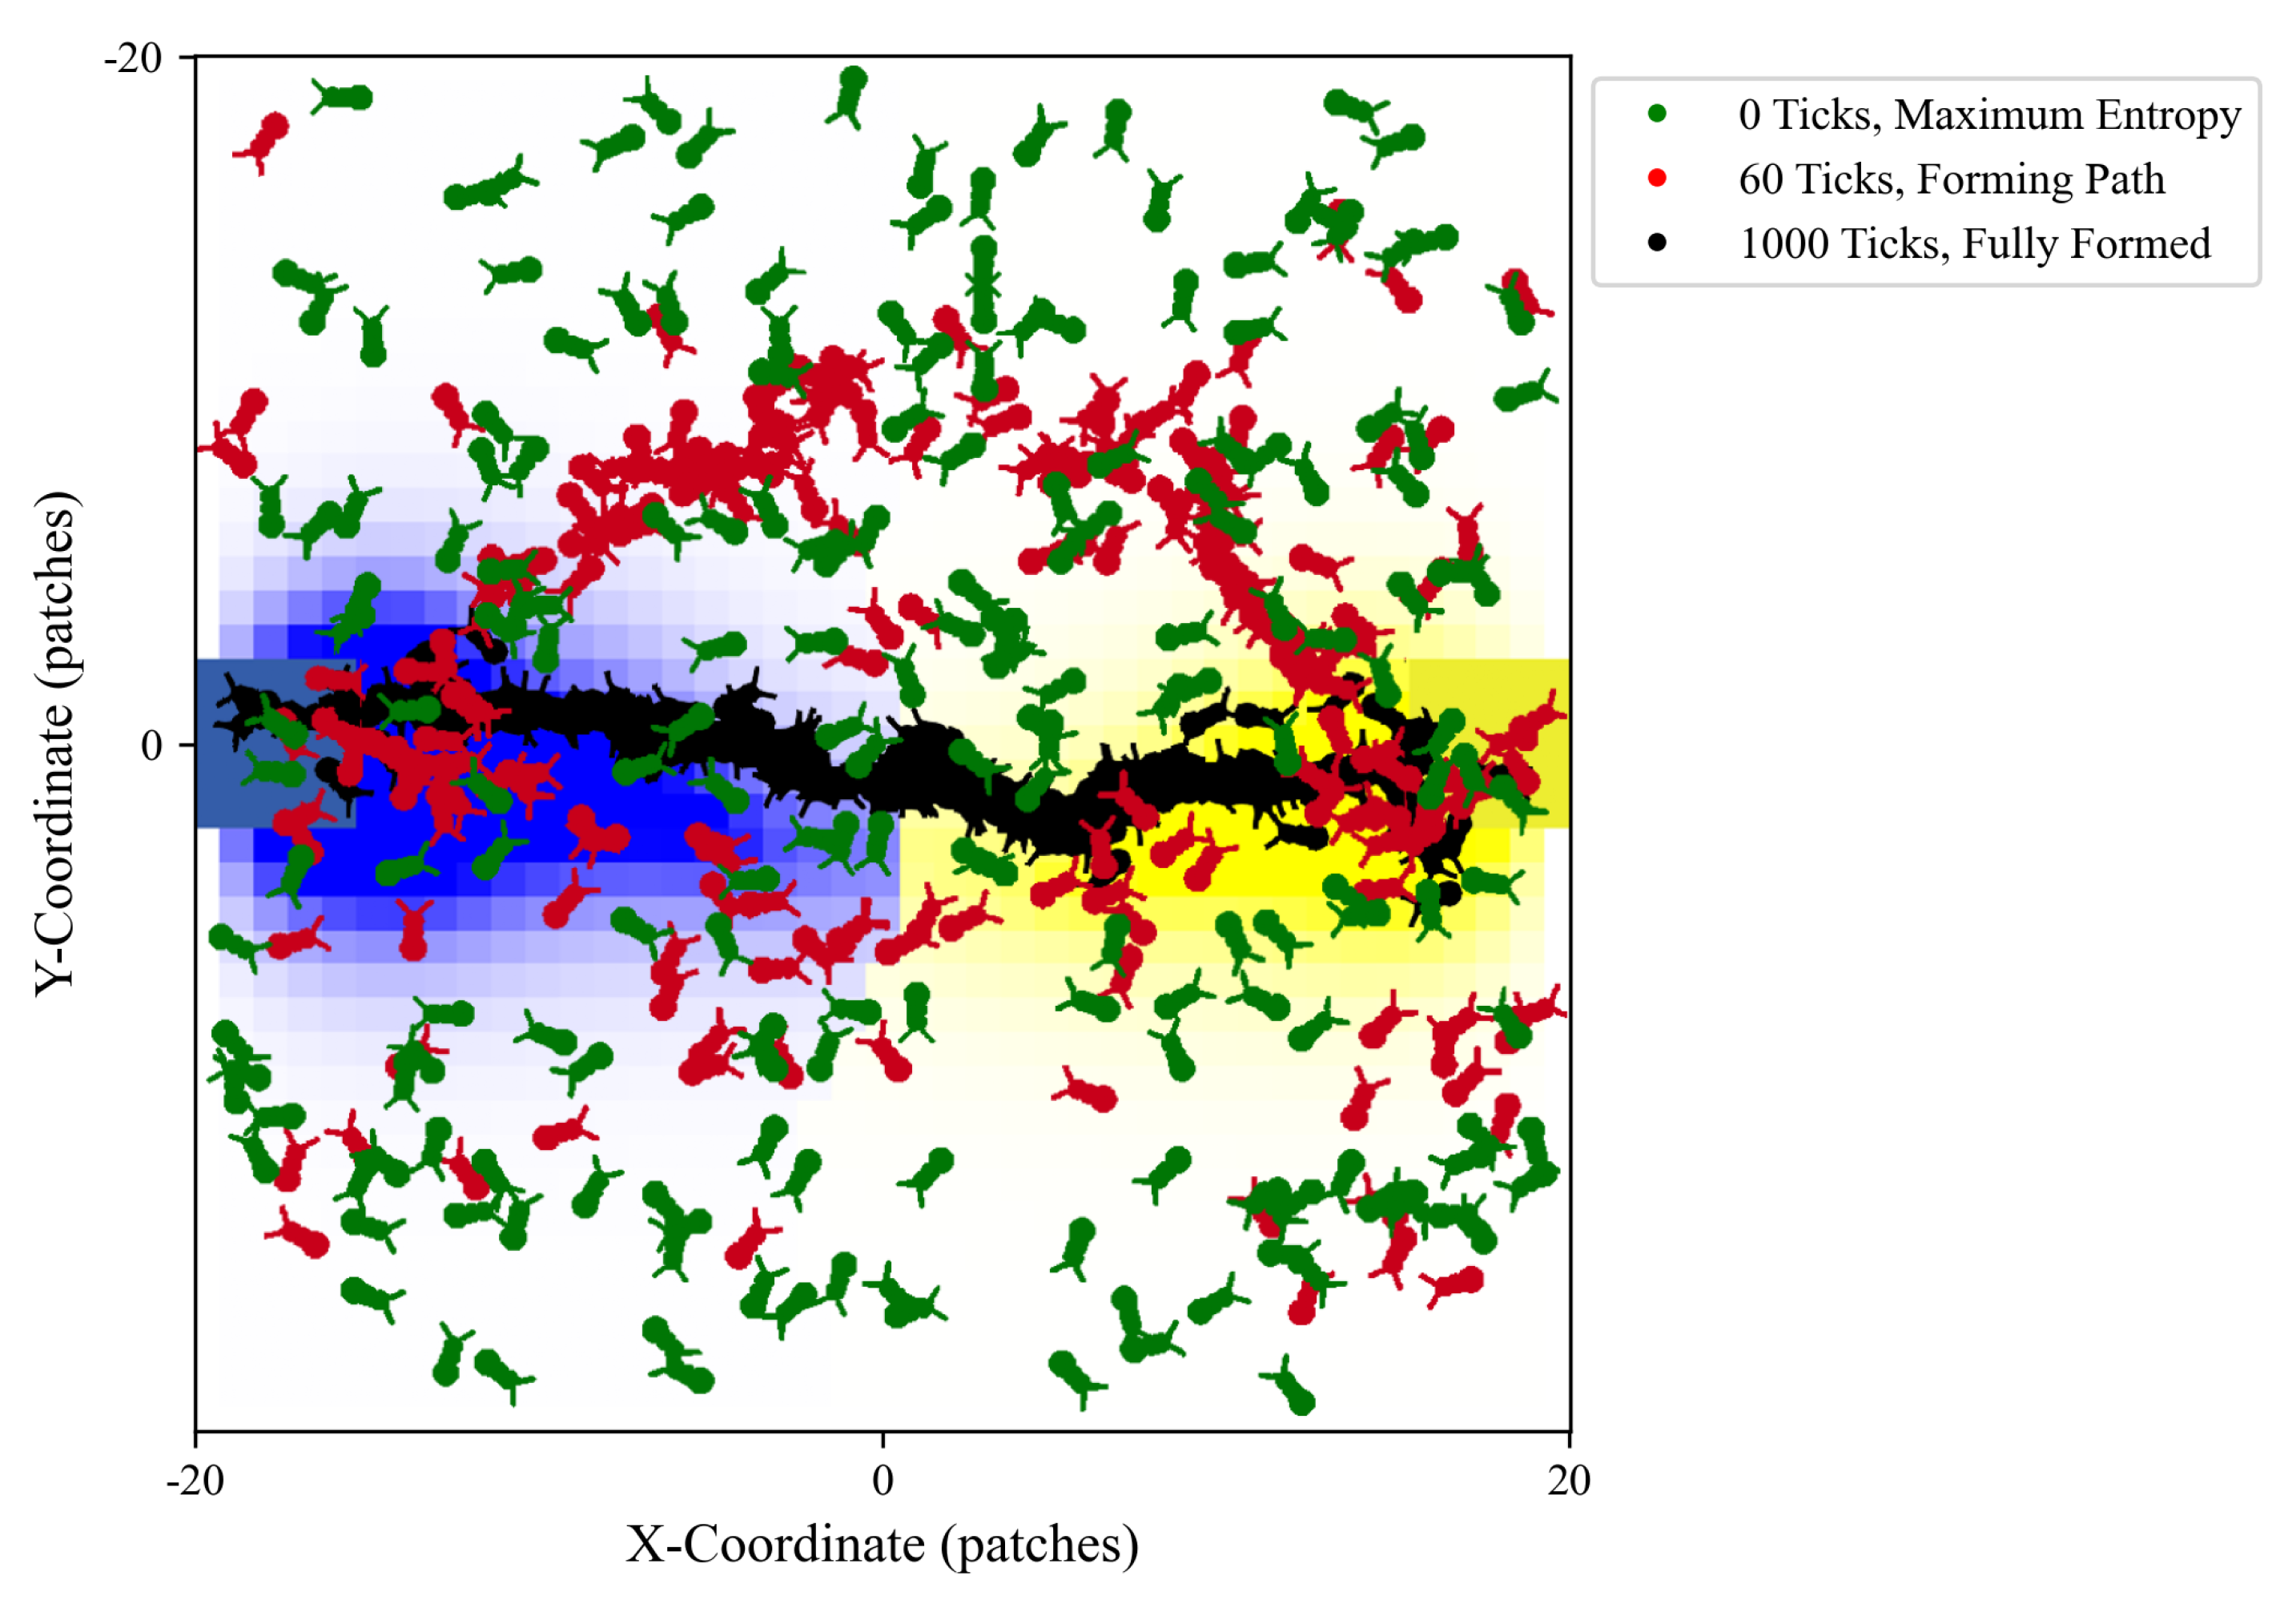
In Figure 1 we see some correspondence between the illustration of the principle of least action, where, among all possible paths, only the shortest trajectory obeys the laws of motion, and in the behavior of the ants, where they explore multiple possible paths, which are different at each rerun of the simulation, and finally in all simulations the ants converge on the same shortest path. All intermediate possible paths are probabilistic, but, the final shortest path is reproducible between all reruns of the same simulation.

1.6. Negative Feedback

Negative feedback is evident in the fact that large deviations from the power law proportionality between the characteristics are not observed or predicted. This proportionality between all characteristics at any stage of the process of self-organization is the balanced state of functioning which is usually known as a Homeostatic, or dynamical equilibrium state of the system. Complex systems function as wholes only at values of all characteristics close to this Homeostatic state, defined by the power law relationships. If some external influence causes large deviations even on one of the characteristics from this homeostatic value, the system functioning is compromised [72].

1.7. Unit-Total Dualism

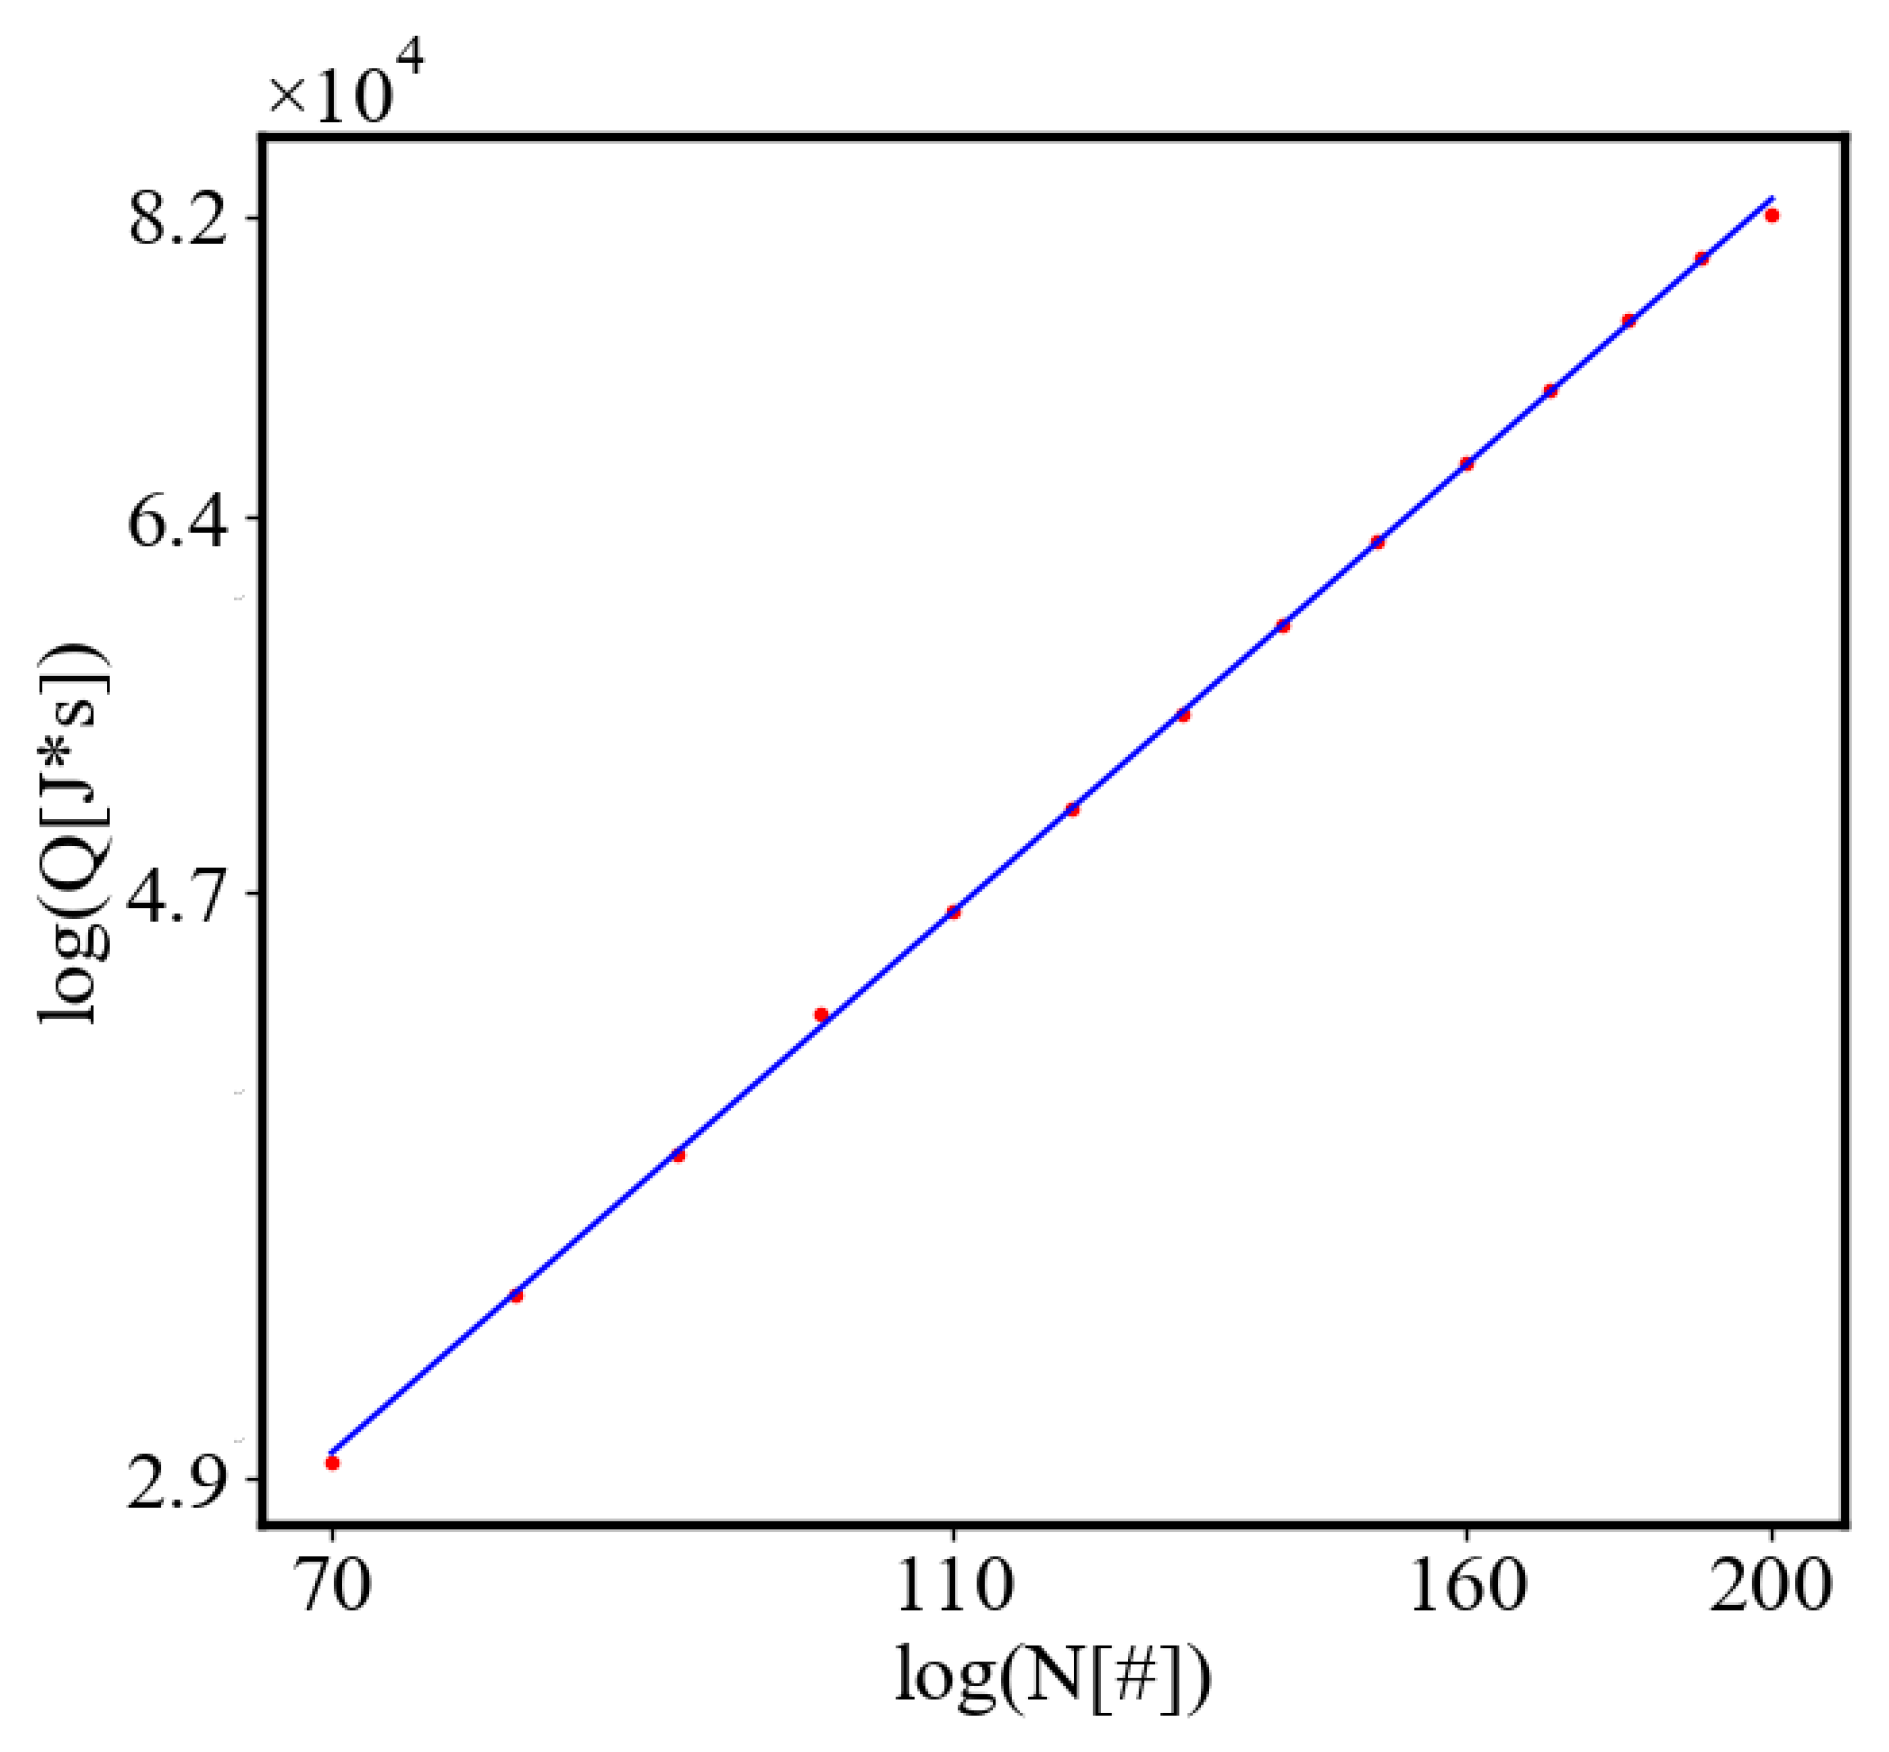
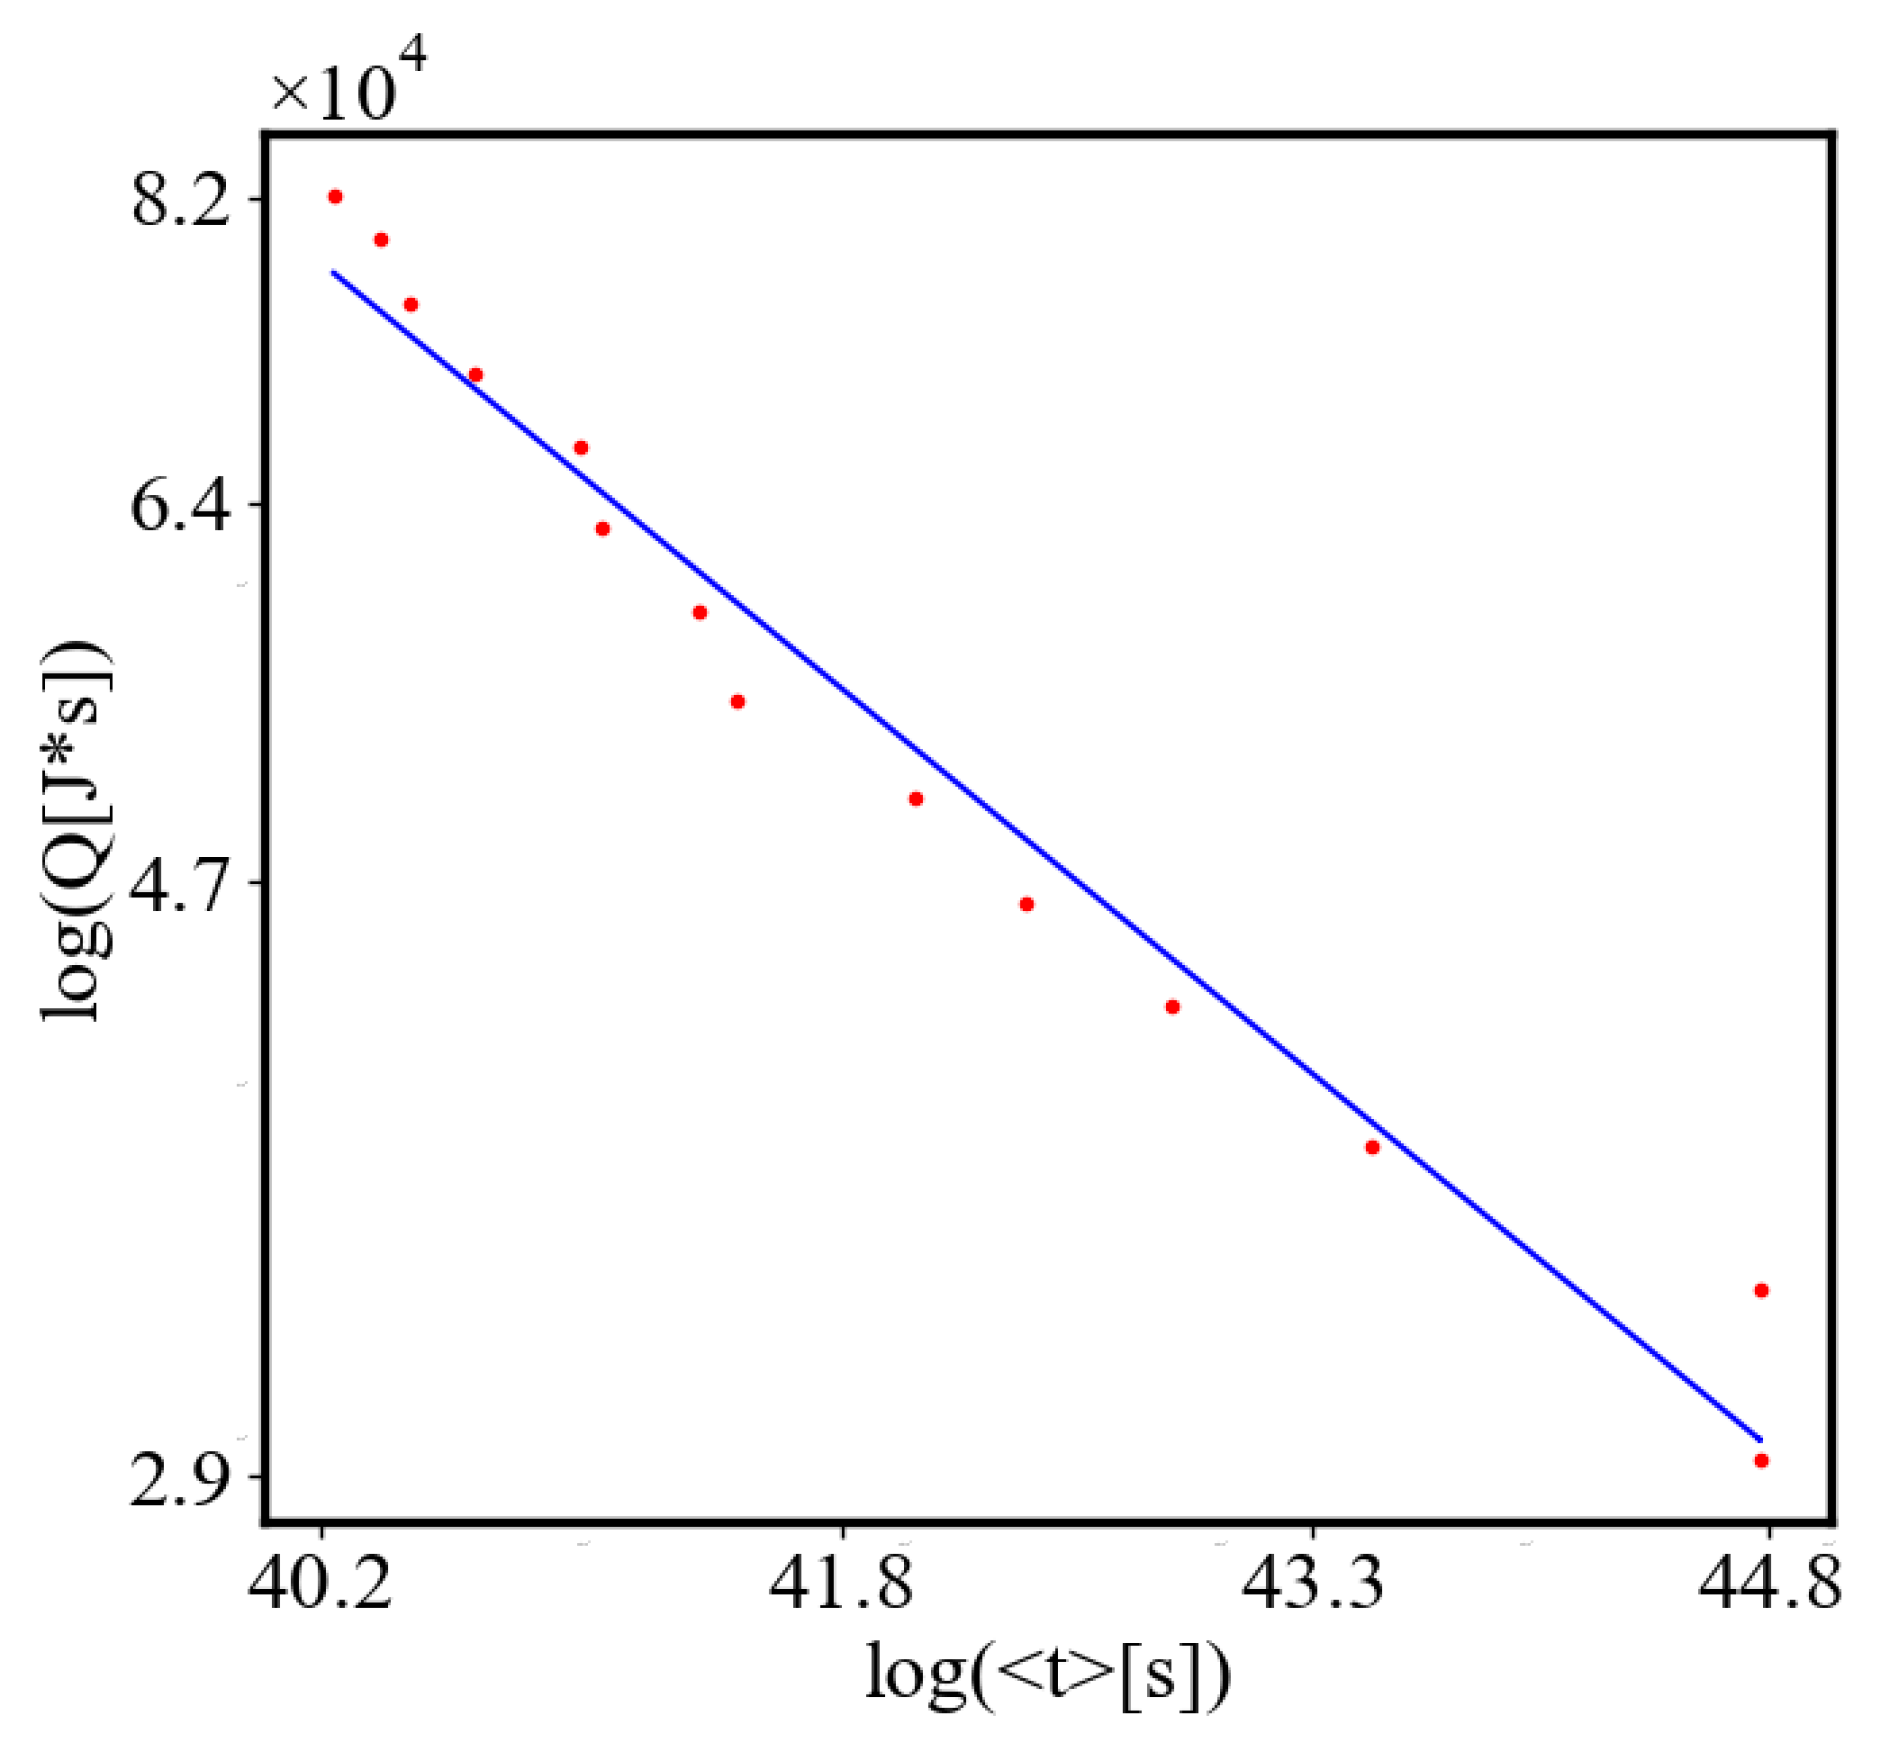
We find a unit-total dualism: unit quantities of the characteristics are minimized while total quantities are maximized with systems’ growth. For example, the average unit action for one event, which is one edge crossing in networks, is derived from the average path length and path time, and it is minimized as calculated by the average action efficiency α . At the same time, the total amount of action Q in the whole system increases, as the system grows, which can be seen in the results from our simulation. This is an expression of the principles of decreasing average unit action and increasing total action. Similarly, unit entropy per one trajectory decreases in self-organization, as the total entropy of the system increases with its growth, expansion, and increasing number of agents. Those can be termed the principles of decreasing unit entropy and of increasing total entropy. The information for describing one event in the system, with increased efficiency and shorter paths is decreasing, while the total information in the system as it grows is increasing. They are also related by a power law relationship, which means, that one can be correlated to the other, and for one of them to change, the other must also change proportionally.

1.8. Unit Total Dualism Examples

Analogous qualities are evidenced in data for real systems and appear in some cases so often that they have special names. For example, the Jevons paradox (Jevons effect) was published in 1866 by the English economist William S. Jevons [73] . In one example, as the fuel efficiency of cars increased, the total miles traveled also increased to increase the total fuel expenditure. This is also named a "rebound effect" from increased energy efficiency [74]. The naming of this effect as a "paradox" shows that it is unexpected, not well studied, and sometimes considered as undesirable. In our model, it is derived mathematically as a result of the positive feedback loops of the characteristics of complex systems, which is the mechanism of its self-organization, and supported by the simulation results. It is not only unavoidable, but also necessary for the functioning, self-organization, evolution, and development of those systems.
In economics, it is evident that with increased efficiency, the costs decrease which increases the demand, which is named the "law of demand" [75]. This is another example of a size-complexity rule, whereas the efficiency increases, which in our work is a measure of complexity, the demand increases, which means that the size of the system also increases. In the 1980s the Jevons paradox was expanded to a Khazzoom–Brookes postulate, formulated by Harry Saunders in 1992 [76], which says that it is supported by the "growth theory" which is the prevailing economic theory for long-run economic growth and technological progress. Similar relations have been observed in other areas, such as in the Downs–Thomson paradox [77], where increasing road efficiency increases the number of cars driving on the road. These are just a few examples that point out that this unit-total dualism has been observed for a long time in many complex systems and it was thought to be paradoxical.

1.9. Action Principles in this Simulation, Potential Well

In each run of this specific simulation, the average unit action has the same stationary point, which is a true minimum of the average unit action, and the shortest path between the fixed nodes is a straight line. This is the theoretical minimum and remains the same across simulations. The closest analogy is with a particle in free fall, where it minimizes action and falls in a straight line, which is a geodesic. The difference in the simulation is that the ants have a wiggle angle and, at each step, deposit pheromone that evaporates and diffuses, therefore the difference with gravity is that the effective attractive potential is not uniform. Due to this the potential landscape changes dynamically. The shape of the walls of the potential well and its minimum change slightly with fluctuations around the average at each step. It also changes when the number of ants is varied between runs, with the minimum decreasing.
The potential well is steeper higher on its walls, and the system cannot be trapped there in local minima of the fluctuations. This is seen in the simulation as initially, the agents form longer paths that disintegrate into shorter ones. In this region away from the minimum, the action is truly always decreasing, with some stochastic fluctuations. Near the bottom of the well, the slope of its wall is smaller, and local minima of the fluctuations cannot be overcome easily by the agents. Then the system temporarily gets trapped in one of those local minima and the average unit action is a dynamical saddle point.
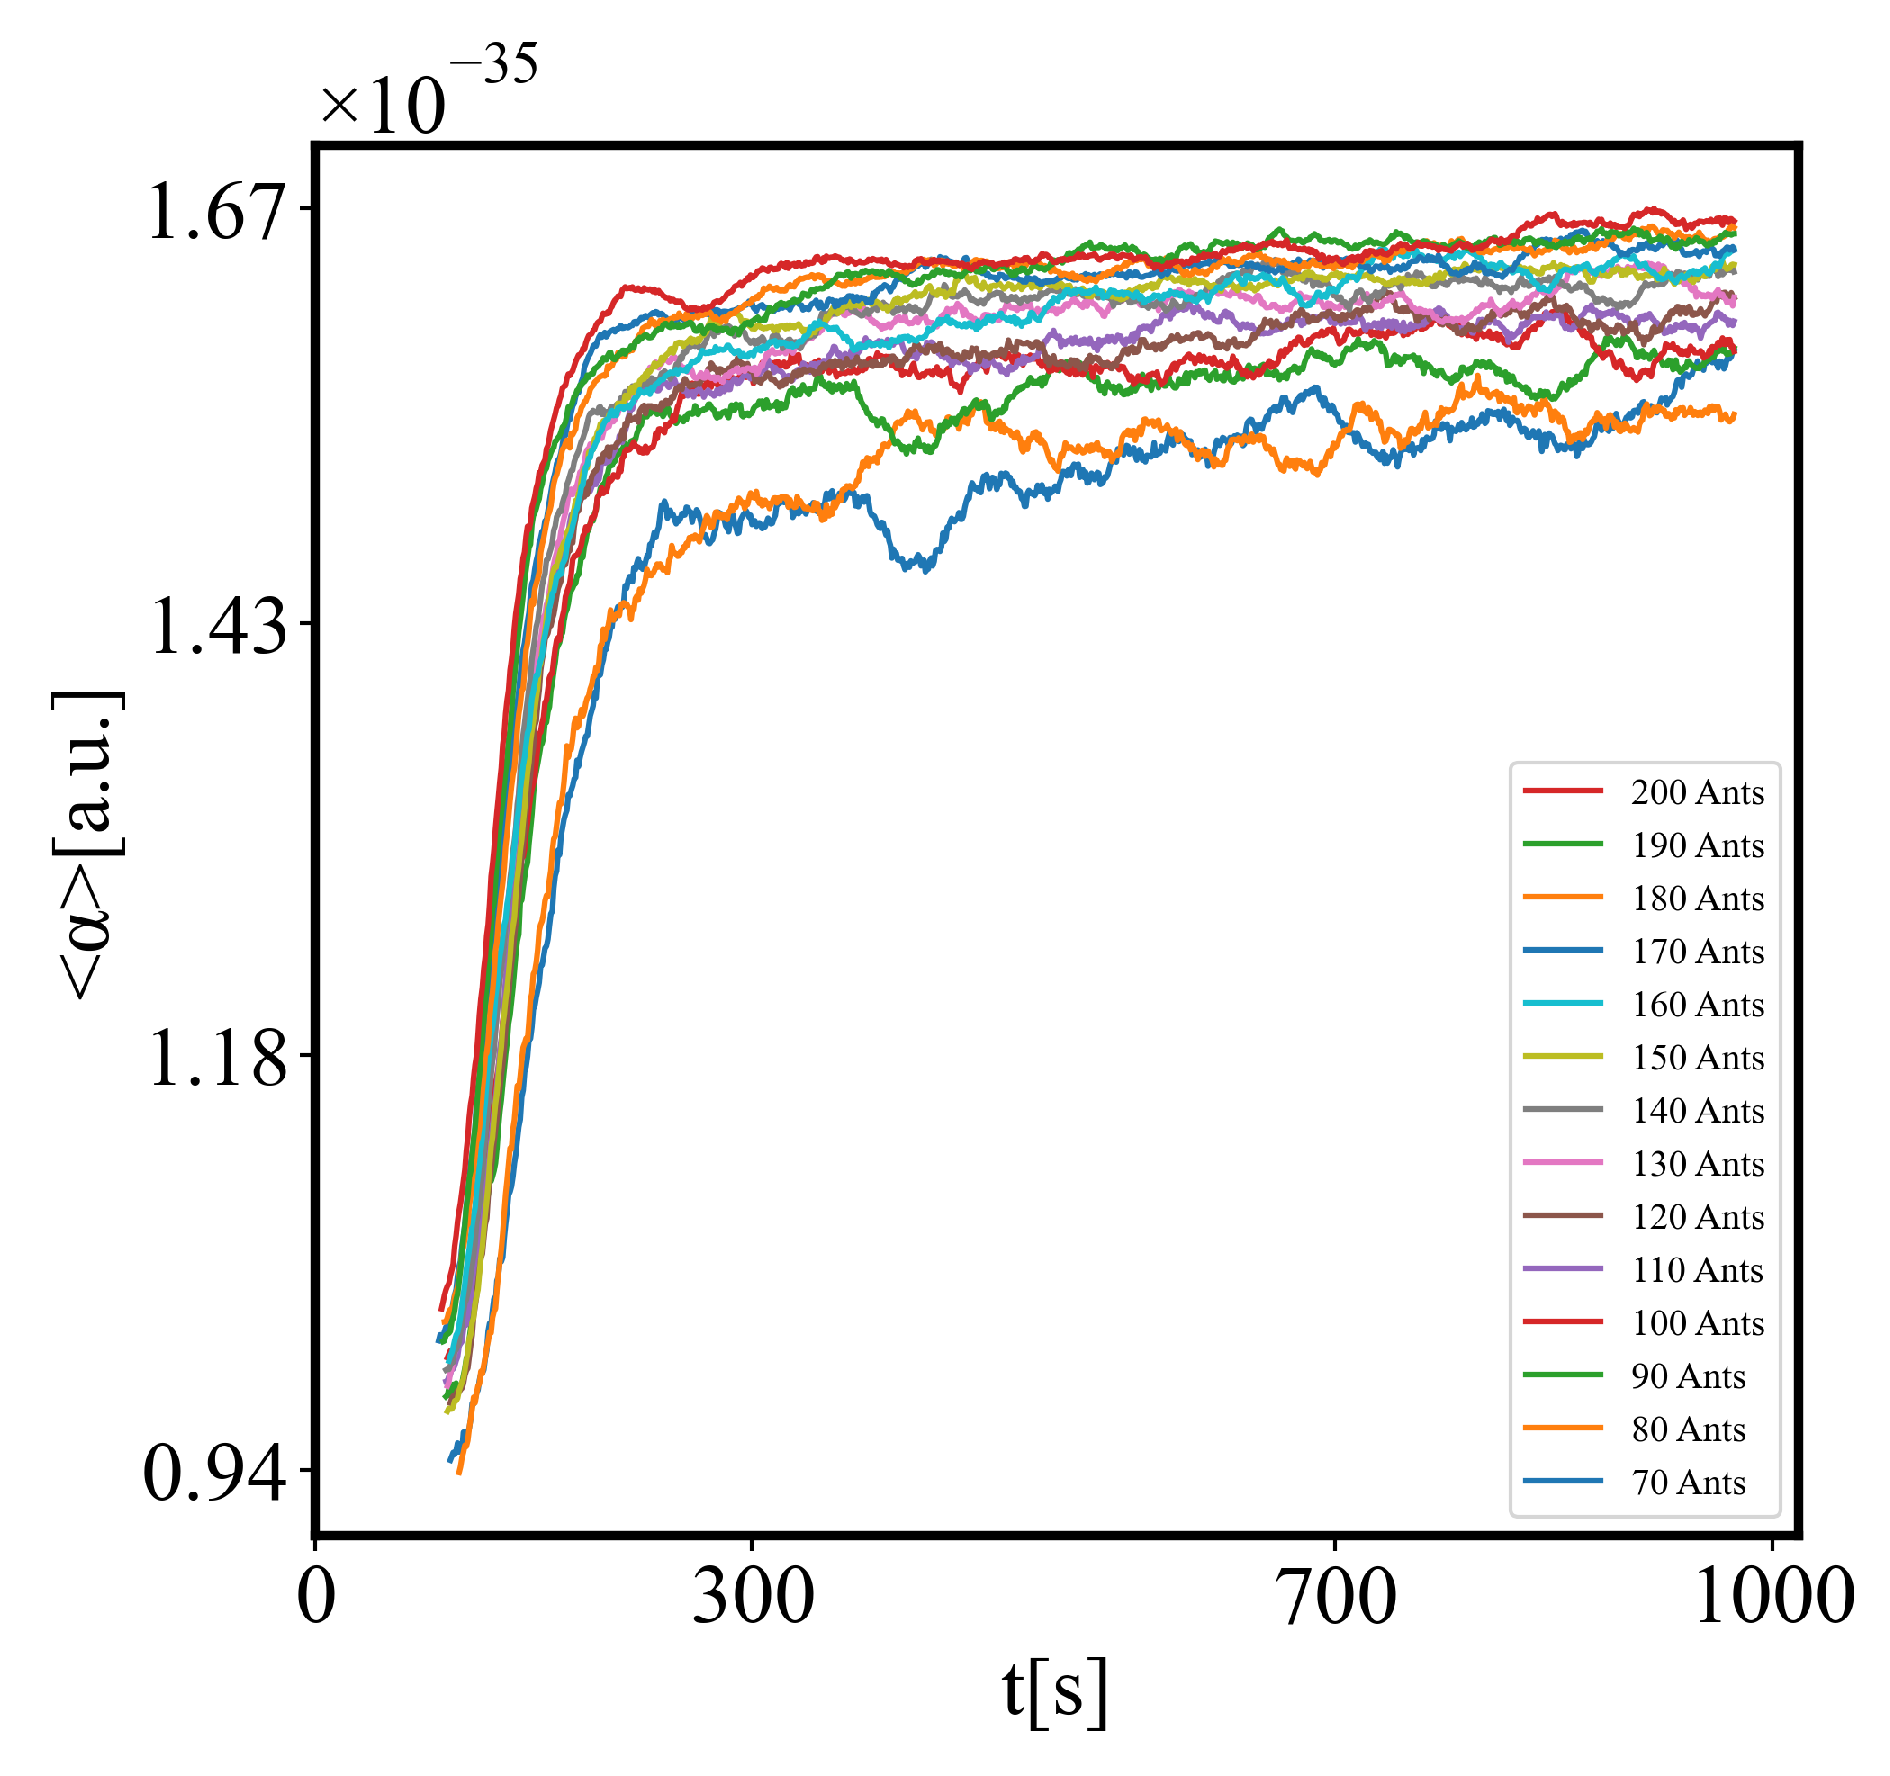
The simulation shows that with fewer ants, the system is more likely to get trapped in a local minimum, resulting in a path with greater curvature and higher final average action (lower average action efficiency) compared to the theoretical minimum. With an increasing number of ants, they can explore more neighboring states, find lower local minima, and find lower average action states. Therefore, increasing the number of ants allows the system to explore more effectively neighboring paths and find shorter ones. This is evident as the average action efficiency improves when there are more ants, which can escape higher local minima and find lower action values (see Figure 12). As the number of ants (agents) increases, they asymptotically find lower local minima or lower average action states, improving average action efficiency, though never reaching the theoretical minimum.
In future simulations, if the distance between nodes is allowed to shrink and external obstacles are reduced, the shape of the entire potential well changes dynamically. In general, the shape of the potential well landscape can be arbitrarily complicated. When the distances between the nodes decrease, the minimum becomes lower, the steepness of its walls increases and the system more easily escapes local minima. However, it still does not reach the theoretical minimum, due to its fluctuations near the minimum of the well. In open systems, the minimum may be dynamic and changing at each iteration as the shape of the entire landscape. The average action decreases, and average action efficiency increases with the lowering of this minimum, demonstrating continuous open-ended self-organization and development. This illustrates the dynamical action principle.

1.10. Research Questions and Hypotheses

This study aims to answer the following research questions:
  • How can a dynamical variational action principle explain the continuous self-organization, evolution, and development of complex systems?
  • Can Average Action Efficiency (AAE) be a measure of the level of organization of complex systems?
  • Can the proposed positive feedback model accurately predict the self-organization processes in systems?
  • What are the relationships between various system characteristics, such as AAE, total action, order parameters, entropy, flow rate, and others , and how do the simulation results compare with real-world data?
Our hypotheses are:
  • A dynamical variational action principle may explain the continuous self-organization, evolution and development of complex systems.
  • AAE may a valid and reliable measure of organization that can be applied to complex systems.
  • The model may accurately predict the most organized state based on AAE.
  • The model may predict the power-law relationships between system characteristics that can be quantified, and they can compare to the results of some real-world systems.

1.11. Summary of the Specific Objectives of the Paper

1. Define and apply the dynamical action principle, which extends the classical stationary action principle to dynamic, self-organizing systems, in open-ended evolution, showing that unit action decreases while total action increases during self-organization.
2. Test the Predictive Power of the Model: Build and test a model that quantitatively and numerically measures the amount of organization in a system, and predicts the most organized state as the one with the least average unit action and highest average action efficiency. Define the cases in which action is minimized, and based on that predict the most organized state of the system. The theoretical most organized state is where the edges in a network are geodesics. Due to the stochastic nature of complex systems, those states are approached asymptotically, but in their vicinity, the action can be temporarily stationary due to local minima. In general, the entire landscape is predicted to be dynamic for real-world open self-organizing systems.
3. Validate a New Measure of Organization: Based on 1 and 2, develop and apply the concept of average action efficiency, rooted in the principle of least action, as a quantitative measure of organization in complex systems.
4. Propose a Mechanism of Progressive Development and Evolution: Apply a model of positive feedback between system characteristics to predict exponential growth and power-law relationships, providing a mechanism for continuous self-organization. Test it by fitting its solutions to the simulation data, and compare them to real-world data from the literature.
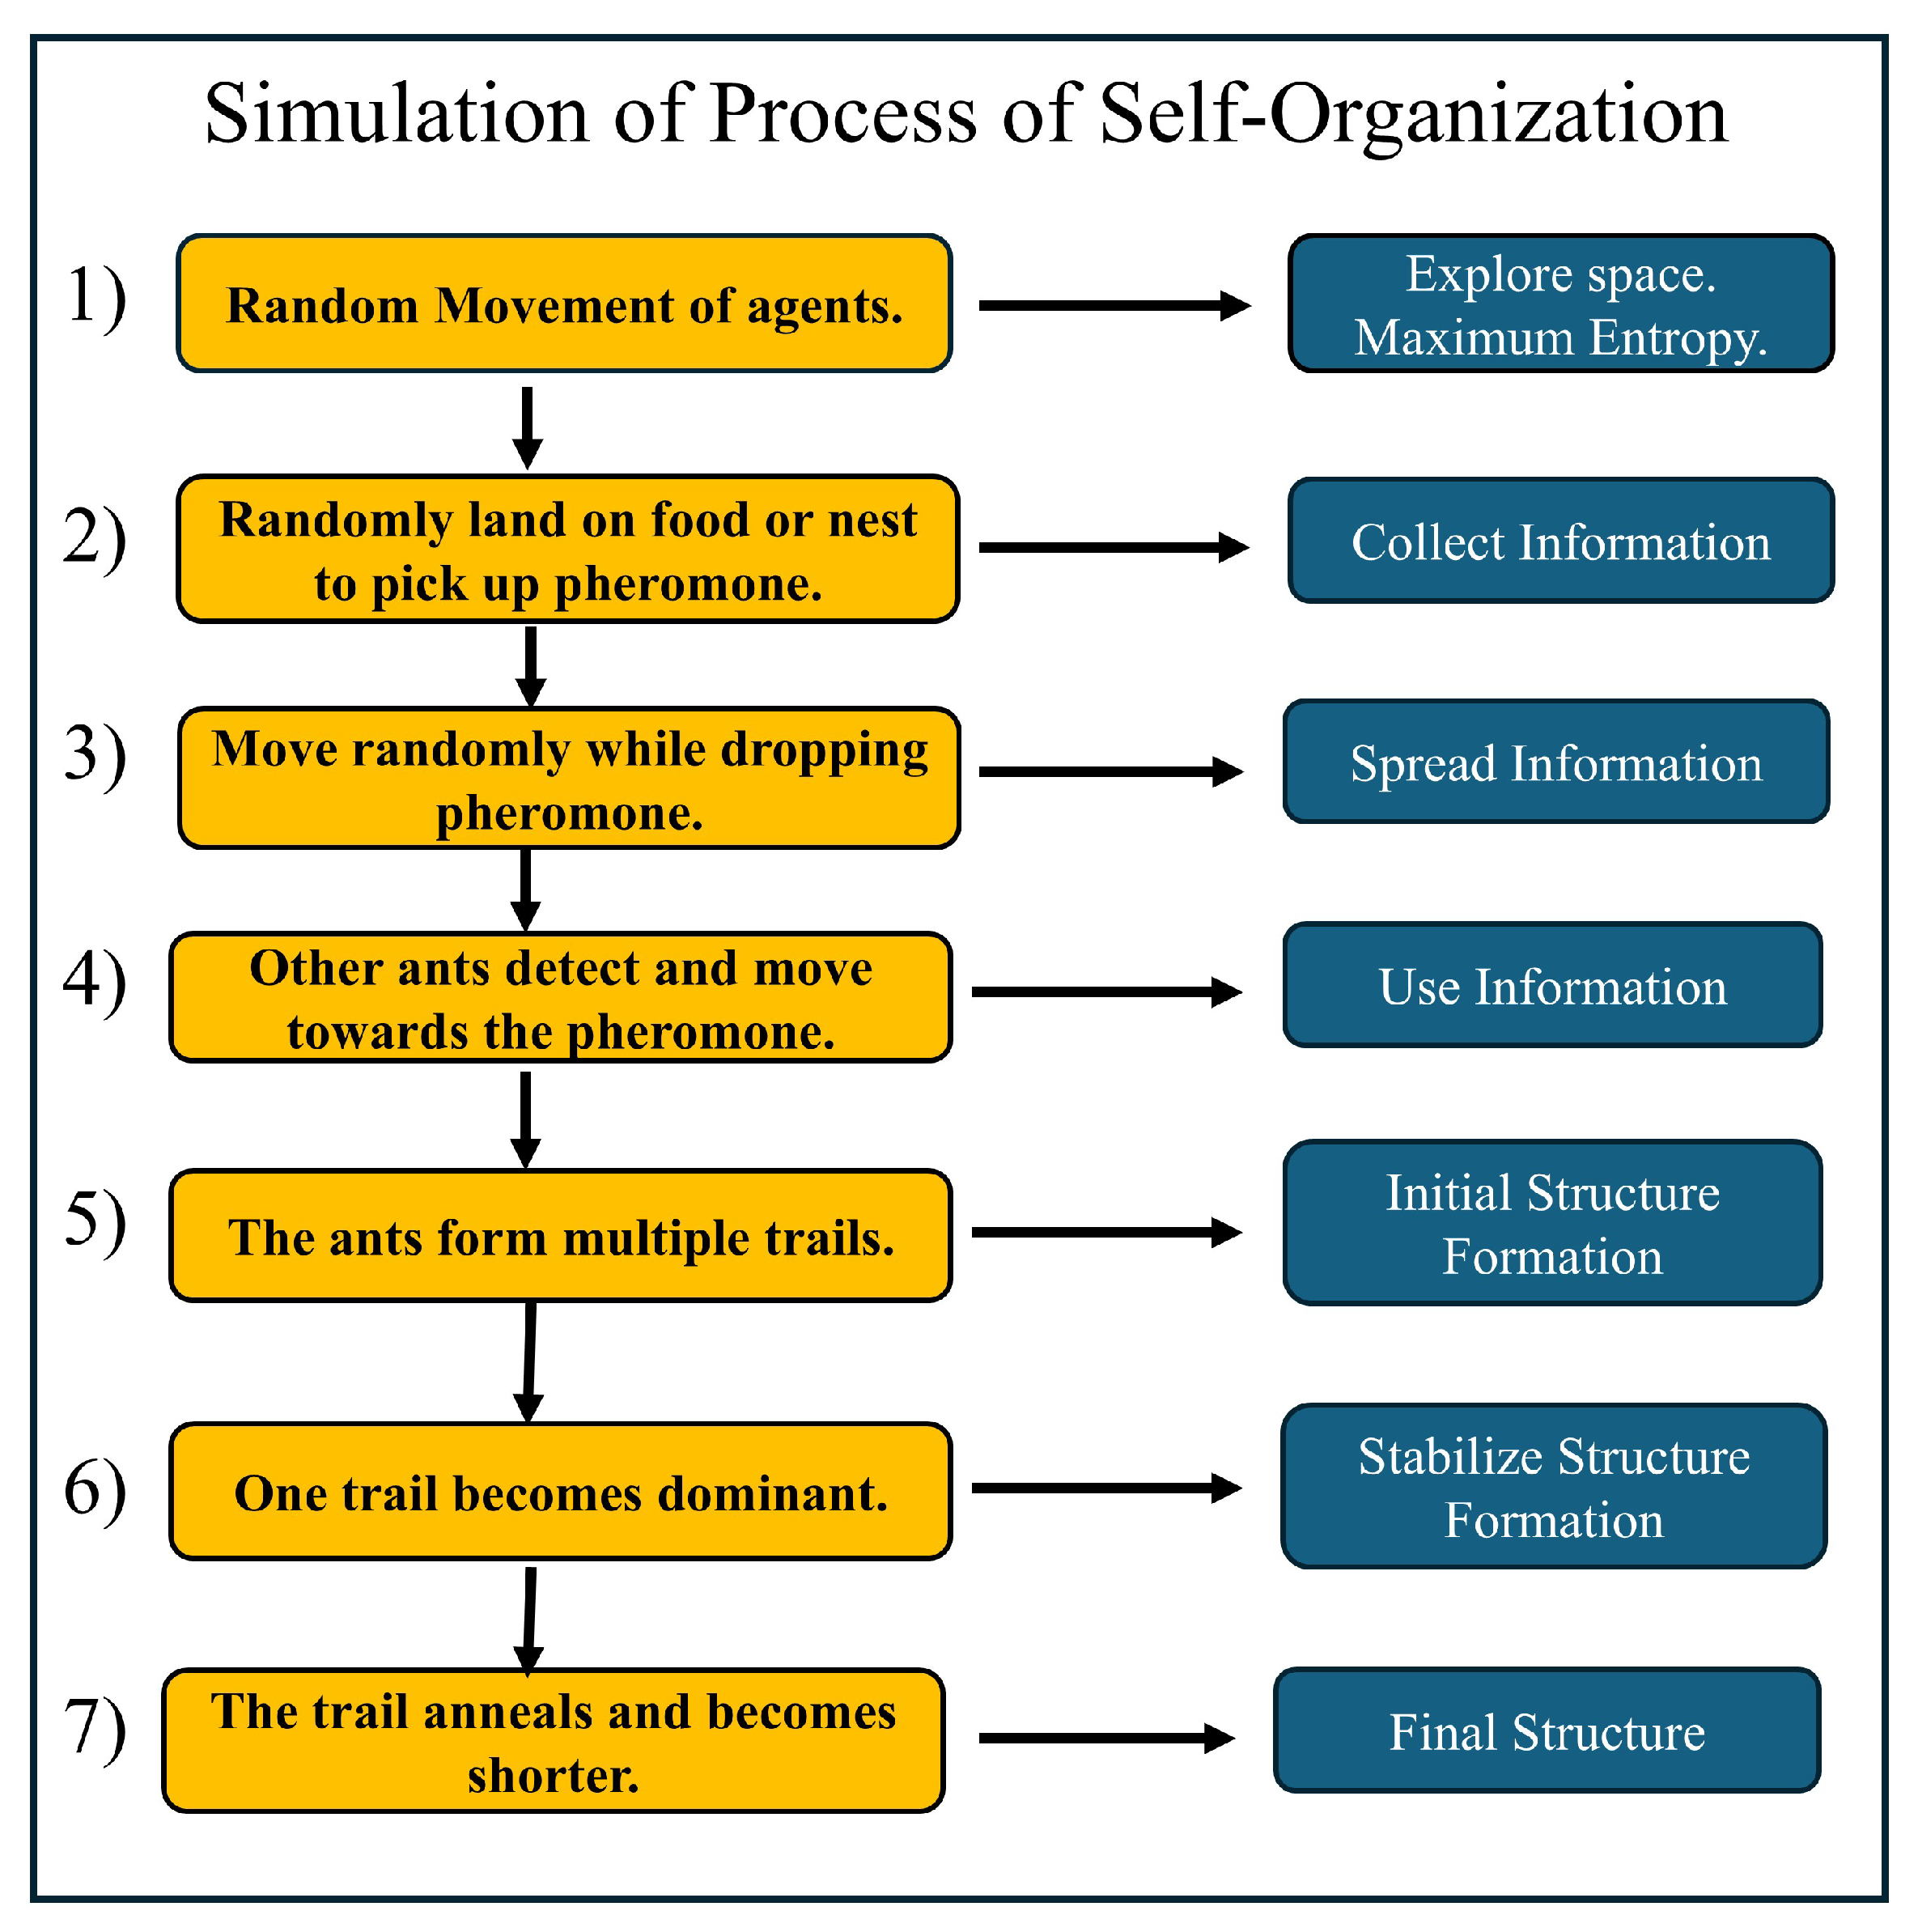
5. Simulate Self-Organization Using Agent-Based Modeling: Use agent-based modeling (ABM) to simulate the behavior of an ant colony navigating between a food source and its nest to explore how self-organization emerges in a complex system.
6. Define unit-total (local-global) dualism: Investigate and define the concept of unit-total dualism, where unit quantities are minimized while total quantities are maximized as the system grows, and explain its implications as variational principles for complex systems.
7. Contribute to the Fundamental and Philosophical Understanding of Self-Organization and Causality: Aim to enhance the theoretical understanding of self-organization in complex systems, offering a framework for future research and practical applications.
This research aims to provide a methods for understanding and quantifying self-organization in complex systems based on a dynamical principle of decreasing unit action for one edge in a complex system represented as a network. By introducing Average Action Efficiency (AAE) and developing a predictive model based on the principle of least action, it aims to connect to existing theories and offer new insights into the dynamics of complex systems. The following sections will delve deeper into the theoretical foundations, model development, methodologies, results, and implications of our study.

2. Building the Model:

2.1. Hamilton’s Principle of Stationary Action for a System

In this work, we utilize Hamilton’s Principle of Stationary Action, a variational method, to study self-organization in complex systems. Stationary action is found when the first derivative is zero. When the second variation is positive, the action is a minimum. Only in this case, do we have the true least action principle. We will discuss in what situations this is the case. Hamilton’s Principle of Stationary Action suggests that the evolution of a system between two states may occur along a path where the action functional becomes stationary. By identifying and extremizing this functional, we can gain a deeper understanding of the dynamics and driving forces behind self-organization and describe it from first principles. This interpretation provides a foundation for exploring the dynamics of complex systems, subject to further theoretical and practical validation.
This is a first-order approximation, simplified model, as an example, and the lagrangian for the agent-based simulation is described in the following sections.
The classical Hamilton’s principle is:
δ I ( q , p , t ) = δ t 1 t 2 L ( q ( t ) , q ˙ ( t ) , t ) d t = 0
where δ is an infinitesimally small variation in the action integral I, L is the Lagrangian, q ( t ) are the generalized coordinates, q ˙ ( t ) are the time derivatives of the generalized coordinates, p is the momentum, and t is the time. t 1 and t 2 are the initial and final times of the motion.
For brevity, further in the text, we will use when appropriate L = L ( q ( t ) , q ˙ ( t ) , t ) , and I = I ( q , p , t ) .
This is the principle from which all physics and all observed equations of motion are derived. The above equation is for one object. For a complex system, there are many interacting agents. That means that we can propose that the sum of all actions of all agents is taken into account. This sum is minimized in its most action-efficient state, which we define as being the most organized. In previous papers [15,17,18,19] we have stated that for an organized system we can find the natural state of that system as the one in which the variation of the sum of actions of all of the agents is zero:
δ i = 1 n I i = δ i = 1 n t 1 t 2 L i d t = 0
where I i is the action of the i-th agent, L i is the Lagrangian of the i-th agent, and n represents the number of agents in the system, t 1 and t 2 are the initial and final times of the motions.
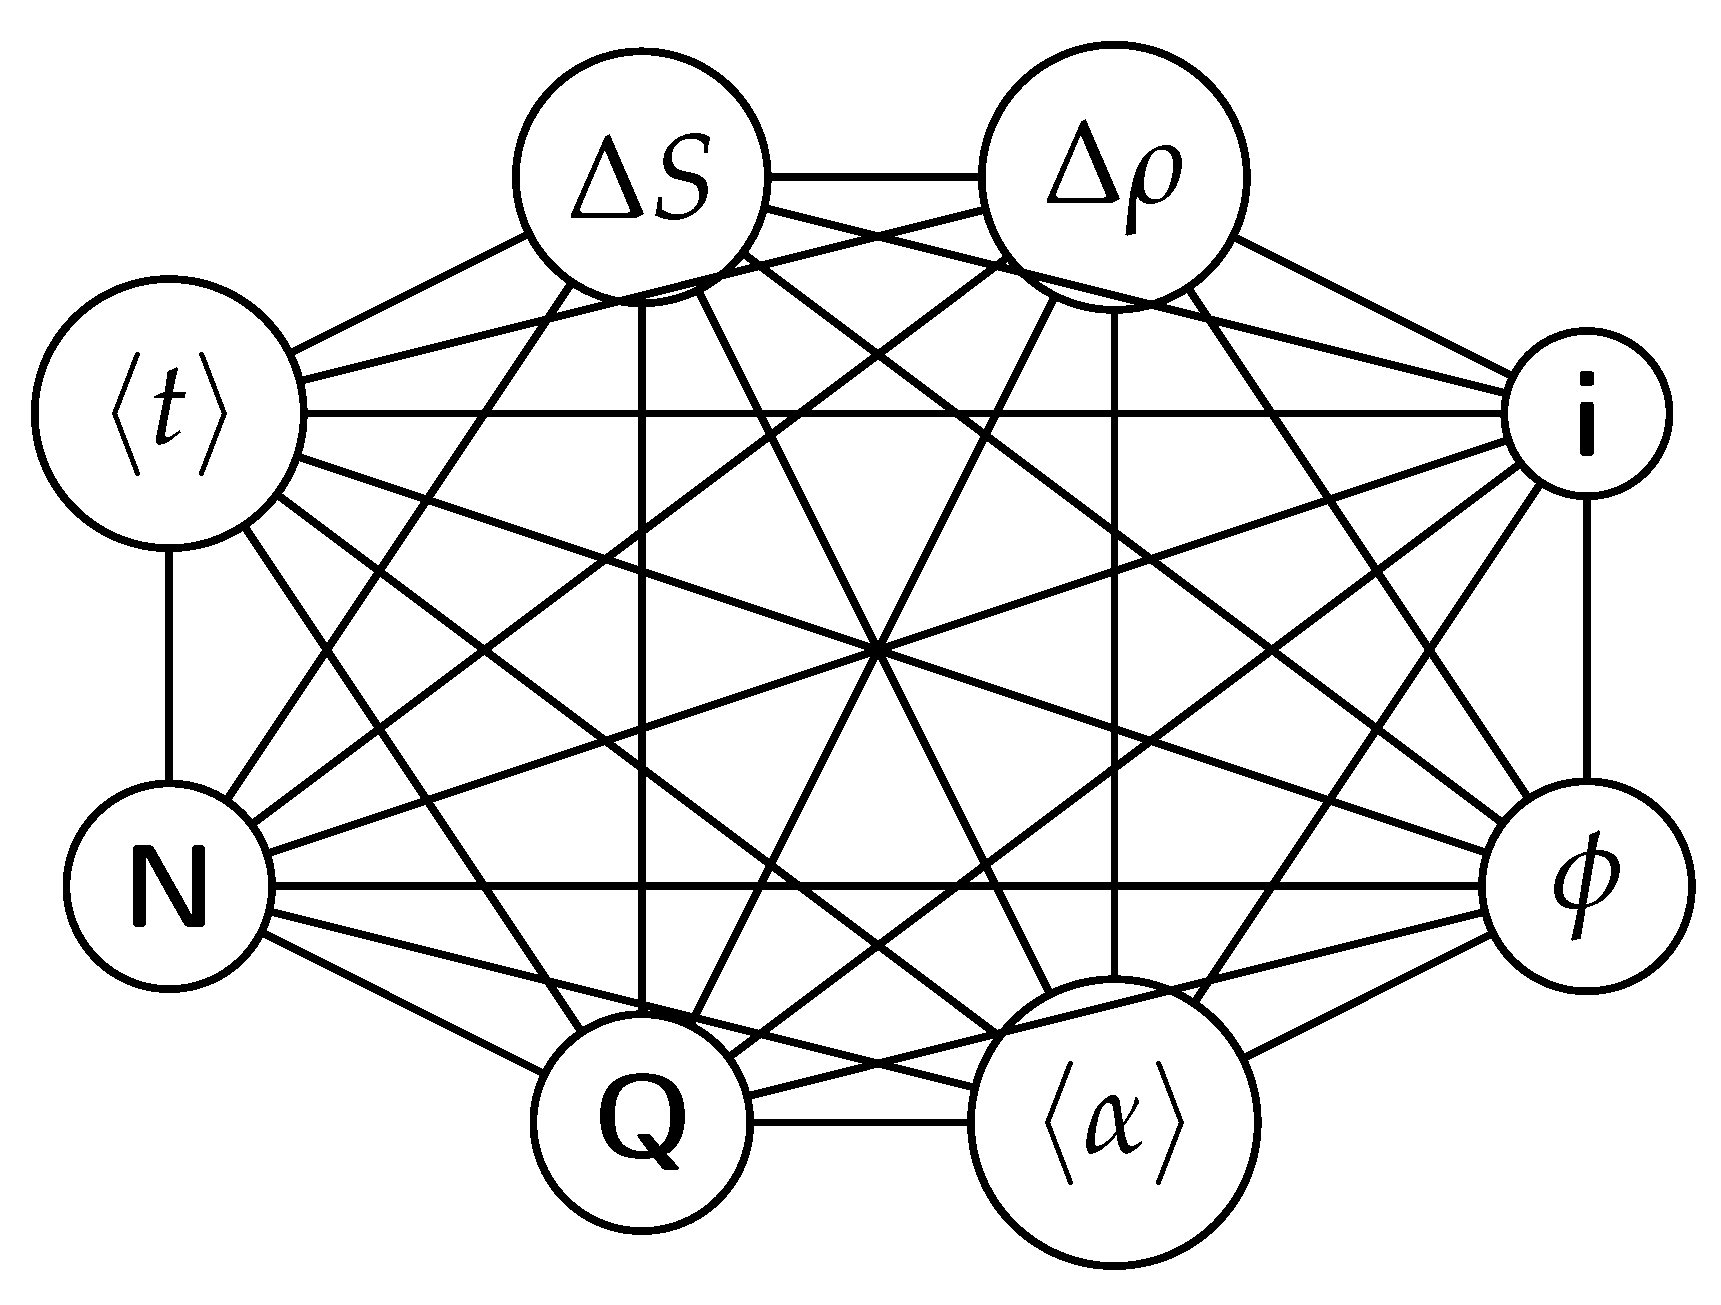
A network representation of a complex system. When we represent the system as a network, we can define one edge crossing as a unit of motion, or one event in the system, for which the unit average action efficiency is defined. In this case, the sum of the actions of all agents for all of the crossings of edges per agent per unit time, which is the total number of crossings (the flow of events, ϕ ), is the total amount of action in the network, Q. In the most organized state of the system, the variation of the total action, Q, is zero, which means that it is extremised as well and for the complex system in our example this extremum is a maximum.

2.2. An Example of True Action Minimization: Conditions

This is just an example to understand the conceptual idea of the model. Later we will specify it for our simulation with the actual interactions between the agents.
  • The agents are free particles, not subject to any forces, so the potential energy is a constant and can be set to be zero because the origin for the potential energy can be chosen arbitrarily, therefore V = 0 . Then, the Lagrangian L of the element is equal only to the kinetic energy T = m v 2 2 of that element:
    L = T V = T = m v 2 2
    where m is the mass of the element, and v is its speed.
  • We are assuming that there is no energy dissipation in this system, so the Lagrangian of the element is a constant:
    L = T = m v 2 2 = constant
  • The mass m and the speed v of the element are assumed to be constants.
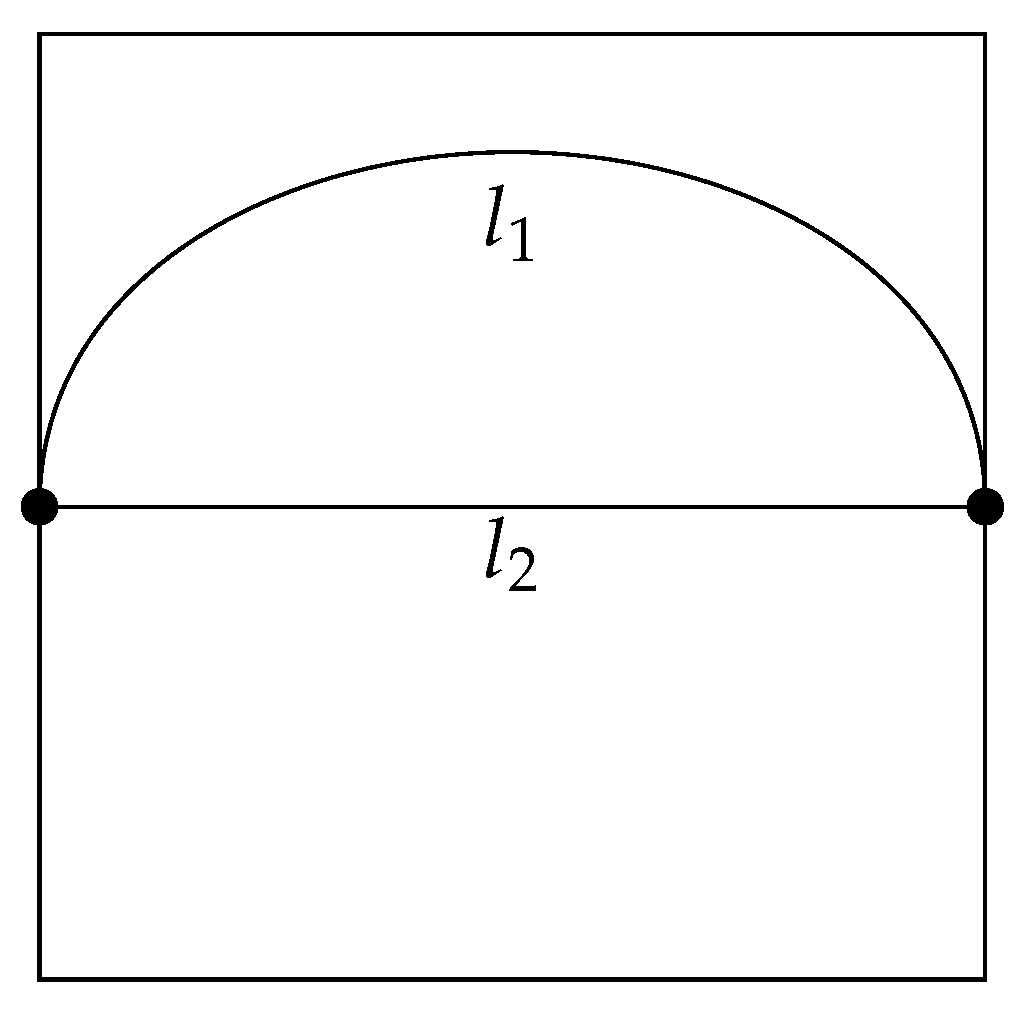
  • The start point and the end point of the trajectory of the element are fixed at opposite sides of a square (see Figure A1). This produces the consequence that the action integral cannot become zero, because the endpoints cannot get infinitely close together:
    I = t 1 t 2 L d t = t 1 t 2 ( T V ) d t = t 1 t 2 T d t 0
  • The action integral cannot become infinity, i.e., the trajectory cannot become infinitely long:
    I = t 1 t 2 L d t = t 1 t 2 ( T V ) d t = t 1 t 2 T d t
  • In each configuration of the system, the actual trajectory of the element is determined as the one with the Least Action from Hamilton’s Principle:
    δ I = δ t 1 t 2 L d t = δ t 1 t 2 ( T V ) d t = δ t 1 t 2 T d t = 0
  • The medium inside the system is isotropic (it has all its properties identical in all directions). The consequence of this assumption is that the constant velocity of the element allows us to substitute the interval of time with the length of the trajectory of the element.
  • The second variation of the action is positive, because V = 0 , and T > 0 , therefore the action is a true minimum.

2.3. Building the Model

In our model, the organization is proportional to the inverse of the average of the sum of actions of all elements (8). This is the average action efficiency and we can label it with a symbol α . Here average action efficiency measures the amount of organization of the system. In a complex network, many different arrangements can correspond to the same action efficiency and therefore have the same level of organization. The average action efficiency is proposed as a representation of the system’s macrostate, where multiple microstates could correspond to the same efficiency level as measured by α . This is analogous to temperature in statistical mechanics representing a macrostate corresponding to many microstates of the molecular arrangements in the gas. This conceptual link is a subject of ongoing refinement and testing.
AAE is proposed as a measure to evaluate the efficiency of a system’s processes, offering a potential indicator of its degree of organization. It quantifies the ratio between the outcomes produced (like forming an organized structure or completing tasks) and the resources used (like energy or time). It is a cost function, in a process of optimization, where the cost is physical action. A higher AAE means the system is more efficient, achieving more with fewer expenses. It is also a measure of how close the system is to the theoretically lowest action per event, prescribed by the physical laws. All events tend to occur with the lowest possible action in the given set of constraints for the system, but, not lower. Its broader applicability and robustness as a metric require additional investigation.
We incorporate Planck’s constant h into the numerator, which provides a conceptual basis for interpreting average action efficiency as inversely proportional to the average number of action quanta for one crossing between nodes in the system, in a given interval of time. This also provides an absolute reference point h for the measure of organization. The units in this case are the total number of events in the system per unit of time, divided by the number of quanta of action. This formulation is a starting point for further refinement and exploration.
In general,
α = h n m i , j = 1 n m I i , j
where n is the number of agents, and m is the average number of nodes each agent crosses per unit time. If we multiply the number of agents by the number of crossings for each agent, we can define it as the flow of events in the system per unit of time, ϕ = n m
Then:
α = h ϕ i , j = 1 n m I i , j
In the denominator, the sum of all actions of all agents and all crossings is defined as the total action per unit of time in the system. When it is divided by Planck’s constant it takes the meaning of the number of quanta of action, Q.
Q = i , j = 1 n m I i , j h
For simplicity and clarity, we set h=1. This simplification is applied for illustrative purposes and may require reevaluation in more complex applications.
Then the equation for average action efficiency can be rewritten simply as the total number of events in the system per unit time, divided by the total number of quanta of action:
α = ϕ Q
In our simulation, the average path length is equal to the average time because the speed of the agents in the simulation is set to one patch per second.
t = l
When the Lagrangian does not depend on time, because the speed is constant and there is no friction, as in this simulation, the kinetic energy is a constant (assumption #2), so the action integral takes the form:
I = t 1 t 2 L d t = t 1 t 2 T d t = T ( t 2 t 1 ) = T Δ t = L Δ t
Where Δ t ise agent takes.
This is for an individual trajectory. Summing over the interval of time that the motion of th all trajectories, we get the total number of events, the flow, times the average time of one crossing for all agents. The sum of all times for all events is the number of events times the average time. Then for identical agents, the denominator of the equation for average action efficiency Eq. 9 becomes:
i = 1 n m I i , j = n m L t = ϕ L t
Therefore:
α = h ϕ ϕ L t
and:
α = h L t
We are free to set the mass to two and the velocity is one patch per second. Therefore, we can have the kinetic energy to be equal to one.
Since Planck’s constant is a fundamental unit of action, even though action can vary continuously, this equation represents how far is the organization of the system from this highly action-efficient state, when there will be only one Planck unit of action per event. The action itself can be even smaller than h [78]. This provides a path to further continuous improvement in the levels of organization of systems below one quantum of action.
An example for one agent:
To illustrate the simplest possible case, for clarity, we apply this model to the example of a closed system in two dimensions with only one agent. We define the boundaries of the fixed system to form a square.
The endpoints here represent two nodes in a complex network. Thus the model is limited only to the path between the two nodes. The expansion of this model will be to include many nodes in the network and to average over all of them. Another extension is to include many elements, different kinds of elements, obstacles, friction, etc.
Figure 2 shows the boundary conditions for the system used in this example. In this figure, we present the boundaries of the system and define the initial and final points of the motion of an agent as two of the nodes in a complex network. It shows the comparison between two different states of organization of the system. It is a schematic representation of the two states of the system, and the path of the agent in each case. Here l 1 and l 2 are the lengths of the trajectory of the agent in each case. (a) a trajectory of an agent in a certain state of the system, given by the configuration of the internal constraints, l 1 . (b) a different configuration allowing the trajectory of the element to decrease by 50 % , l 2 - the shortest possible path.
For this case, we set n = 1 , m = 1 , which is one crossing of one agent between two nodes in the network. An approximation for an isotropic medium (Assumption #7) allows us to express the time using the speed of the element when it is constant (Assumption #3). In this case, then we can solve v = l Δ t which is the definition of average velocity for the interval of time as Δ t = l v , where l is the length of the trajectory of the element in each case between the endpoints.
The speed of the element v is fixed to be another constant, so the action integral takes the form:
I = L Δ t = L l v
When we substitute this equation in the equation for action efficiency when n=1 and m=1, we obtain:
α = h I = h v L l
For the simulation in this example, l is the distance that the ants travel between food and nest. Because h, v, and l are all constants, we can simplify this as we set
C = h v L
And rewrite:
α = h v L l = C l
We can set this constant to C = 1 , when necessary.

2.4. Analysis of System States

Now we turn to the two states of the system with different actions of the elements, as shown in Figure 2. The organization of those two states is respectively:
α 1 = C l 1 in state 1 , and α 2 = C l 2 in state 2 of the system .
In Figure 2, the length of the trajectory in the second case (b) is less, l 2 < l 1 , which indicates that state 2 has better organization. The difference between the organizations in the two states of the same system is generally expressed as:
α 2 α 1 = C l 2 C l 1 = C 1 l 2 1 l 1 = C l 1 l 2 l 1 l 2
This can be rewritten as:
Δ α = C Δ l i = 1 2 l i
Where Δ α = α 2 α 1 , Δ l = l 1 l 2 , and i = 1 2 l i = l 1 l 2 .
This is for one agent in the system. If we describe the multi-agent system, then, we use average path-length.

2.5. Average Action Efficiency (AAE)

In the previous example, we can say that the shorter trajectory represents a more action-efficient state, in terms of how much total action is necessary for the event in the system, which here is for the agent to cross between the nodes. If we expand to many agents between the same two nodes, all with slightly different trajectories, we can define that the average of the action necessary for each agent to cross between the nodes is used to calculate the average action efficiency. Average action efficiency is how efficiently a system utilizes energy and time to perform the events in the system. More organized systems are more action-efficient because they can perform the events in the system with fewer resources, in this example, energy and time.
We can start from the presumption that the average action efficiency in the most organized state is always greater than or equal to its value in any other configuration, arrangement, or structure of the system. By varying the configurations of the structure until the average action efficiency is maximized, we can identify the most organized state of the system. This state corresponds to the minimum average action per event in the system, adhering to the principle of least action. We refer to this as the ground or most stable state of the system, as it requires the least amount of action per event. All other states are less stable because they require more energy and time to perform the same functions.
If we define average action efficiency as the ratio of useful output, here it is the crossing between the nodes, and, in other systems, it can be any other measure, to the total input or the energy and time expended, a system that achieves higher action efficiency is more organized. This is because it indicates a more coordinated, effective interaction among the system’s components, minimizing wasted energy or resources for its functions.
During the process of self-organization, a system transitions from a less organized to a more organized state. If we monitor the action efficiency over time, an increase in efficiency could indicate that the system is becoming more organized, as its components interact in a more coordinated way and with fewer wasted resources. This way we can measure the level of organization and the rate of increase of action efficiency which is the level and the rate of self-organization, evolution, and development in a complex system.
To use action efficiency as a quantitative measure, we need to define and calculate it precisely for the system in question. For example, in a biological system, efficiency might be measured in terms of energy conversion efficiency in cells. In an economic system, it can be the ratio of production of an item to the total time, energy, and other resources expended. In a social system, it could be the ratio of successful outcomes to the total efforts or resources expended.
The predictive power of the Principle of Least Action for Self-Organization:
For the simplest example here of only two nodes, calculating theoretically the least action state as the straight line between the nodes we arrive at the same state as the final organized state in the simulation in this paper. This is the same result from minimizing action and from any experimental result. It results in the geodesic of the natural motion of objects. When there are obstacles to the motion of agents, the geodesic is a curve described by the metric tensor. To achieve this prediction for multiagent systems we minimize the average action between the endpoints. Therefore the most organized state in the current simulation is predicted theoretically from the principle of least action. Therefore, the Principle of Least Action provides a predictive power for calculating the most organized state of a system, and verifying it with simulations or experiments. In engineered or social systems, it can be used to predict the most organized state and then construct it.

2.6. Multi-Agent

Now we turn to the two states of the system with different average actions of the elements in Figure 2. The organization of those two states is respectively:
α 1 = C l 1 in state 1 , and α 2 = C l 2 in state 2 of the system .
The average length of the trajectories in the second case is less, l 2 < l 1 , which indicates that state 2 has better organization. The difference between the organizations in the two states of the same system is generally expressed as:
α 2 α 1 = C l 2 C l 1 = C 1 l 2 1 l 1 = C l 1 l 2 l 1 l 2
This can be rewritten as:
Δ α = C Δ l i = 1 2 l i
Where Δ α = α 2 α 1 , Δ l = l 1 l 2 , and i = 1 2 l i = l 1 l 2 .
This is when we use the average lengths of the trajectories and when the velocity is constant and the time and length are the same. In general, when the velocity varies we need to use time.

2.7. Using Time

In this case, the two states of the system are with different average actions of the elements. The organization of those two states is respectively:
α 1 = C t 1 in state 1 , and α 2 = C t 2 in state 2 of the system .
In Figure 2, the length of the trajectory in the second case (b) is less, the average time for the trajectories is t 2 < t 1 , which indicates that state 2 has better organization. The difference between the organizations in the two states of the same system is generally expressed as:
α 2 α 1 = C t 2 C t 1 = C 1 t 2 1 t 1 = C l 1 t 2 t 1 t 2
This can be rewritten as:
Δ α = C Δ t i = 1 2 t i
Where Δ α = α 2 α 1 , Δ t = t 1 t 2 , and i = 1 2 t i = t 1 t 2 .
Which, recovering C, is:
Δ α = h v L Δ t i = 1 2 t i

2.8. An Example

For the simplest example of one agent and one crossing between two nodes, if l 1 = 2 l 2 , or the first trajectory is twice as long as the second, this expression produces the result:
α 1 = C 2 l 2 = α 2 2 or α 2 = 2 α 1 ,
indicating that state 2 is twice as well organized as state 1. Alternatively, substituting in eq. 29 we have:
α 2 α 1 = C 2 1 2 = C 2 ,
or there is a 50% difference between the two organizations, which is the same as saying that the second state is quantitatively twice as well organized as the first one. This example illustrates the purpose of the model for direct comparison between the amounts of organization in two different states of a system. When the changes in the average action efficiency are followed in time, we can measure the rates of self-organization, which we will explore in future work.
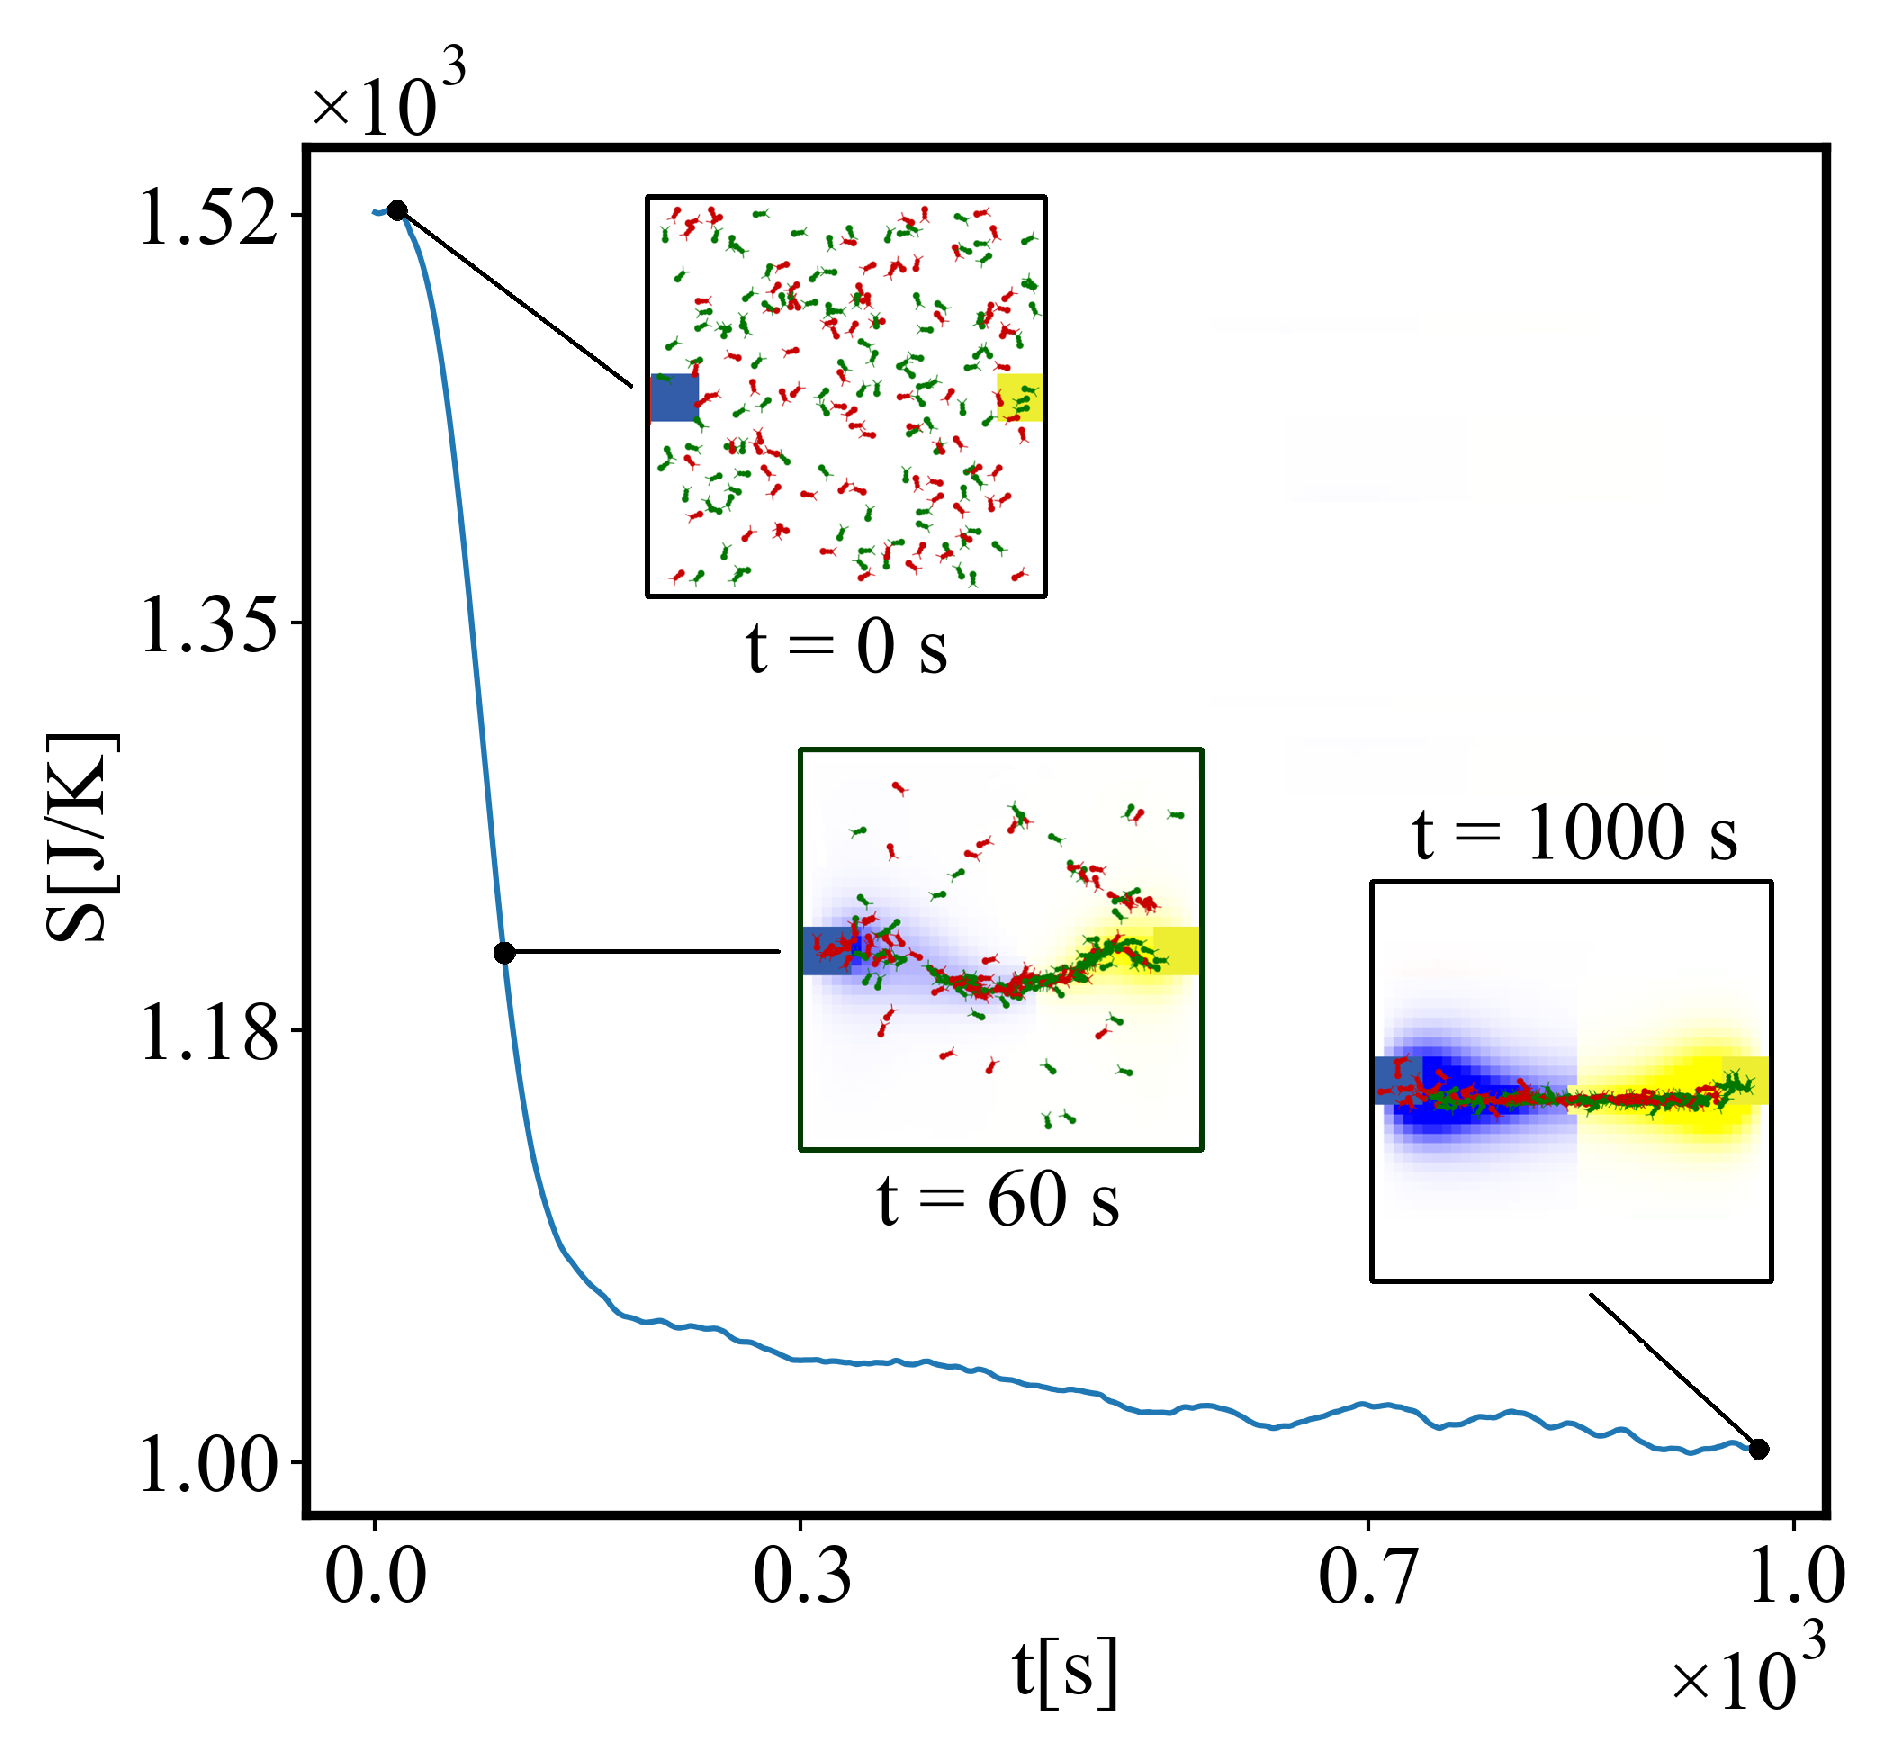
In our simulations, the higher the density and the lower the entropy of the agents, the shorter the paths and the time for crossing them, and the more the action efficiency.

2.9. Unit-Total (Local-Global) Dualism

In addition to the classical stationary action principle for fixed, non-growing, non-self-organizing systems:
δ I = 0
we find a dynamical action principle:
δ I 0
This principle exhibits a unit-total (local-global, min-max) dualism:
1. Average unit action for one edge decreases:
δ i , j = 1 n , m I i , j n m < 0
This is a principle for decreasing unit action for a complex system during self-organization, as it becomes more action-efficient until a limit is reached.
2. Total action of the system increases:
δ i , j = 1 n , m I i , j > 0
This is a principle for increasing total action for a complex system during self-organization, as the system grows until a limit is reached.
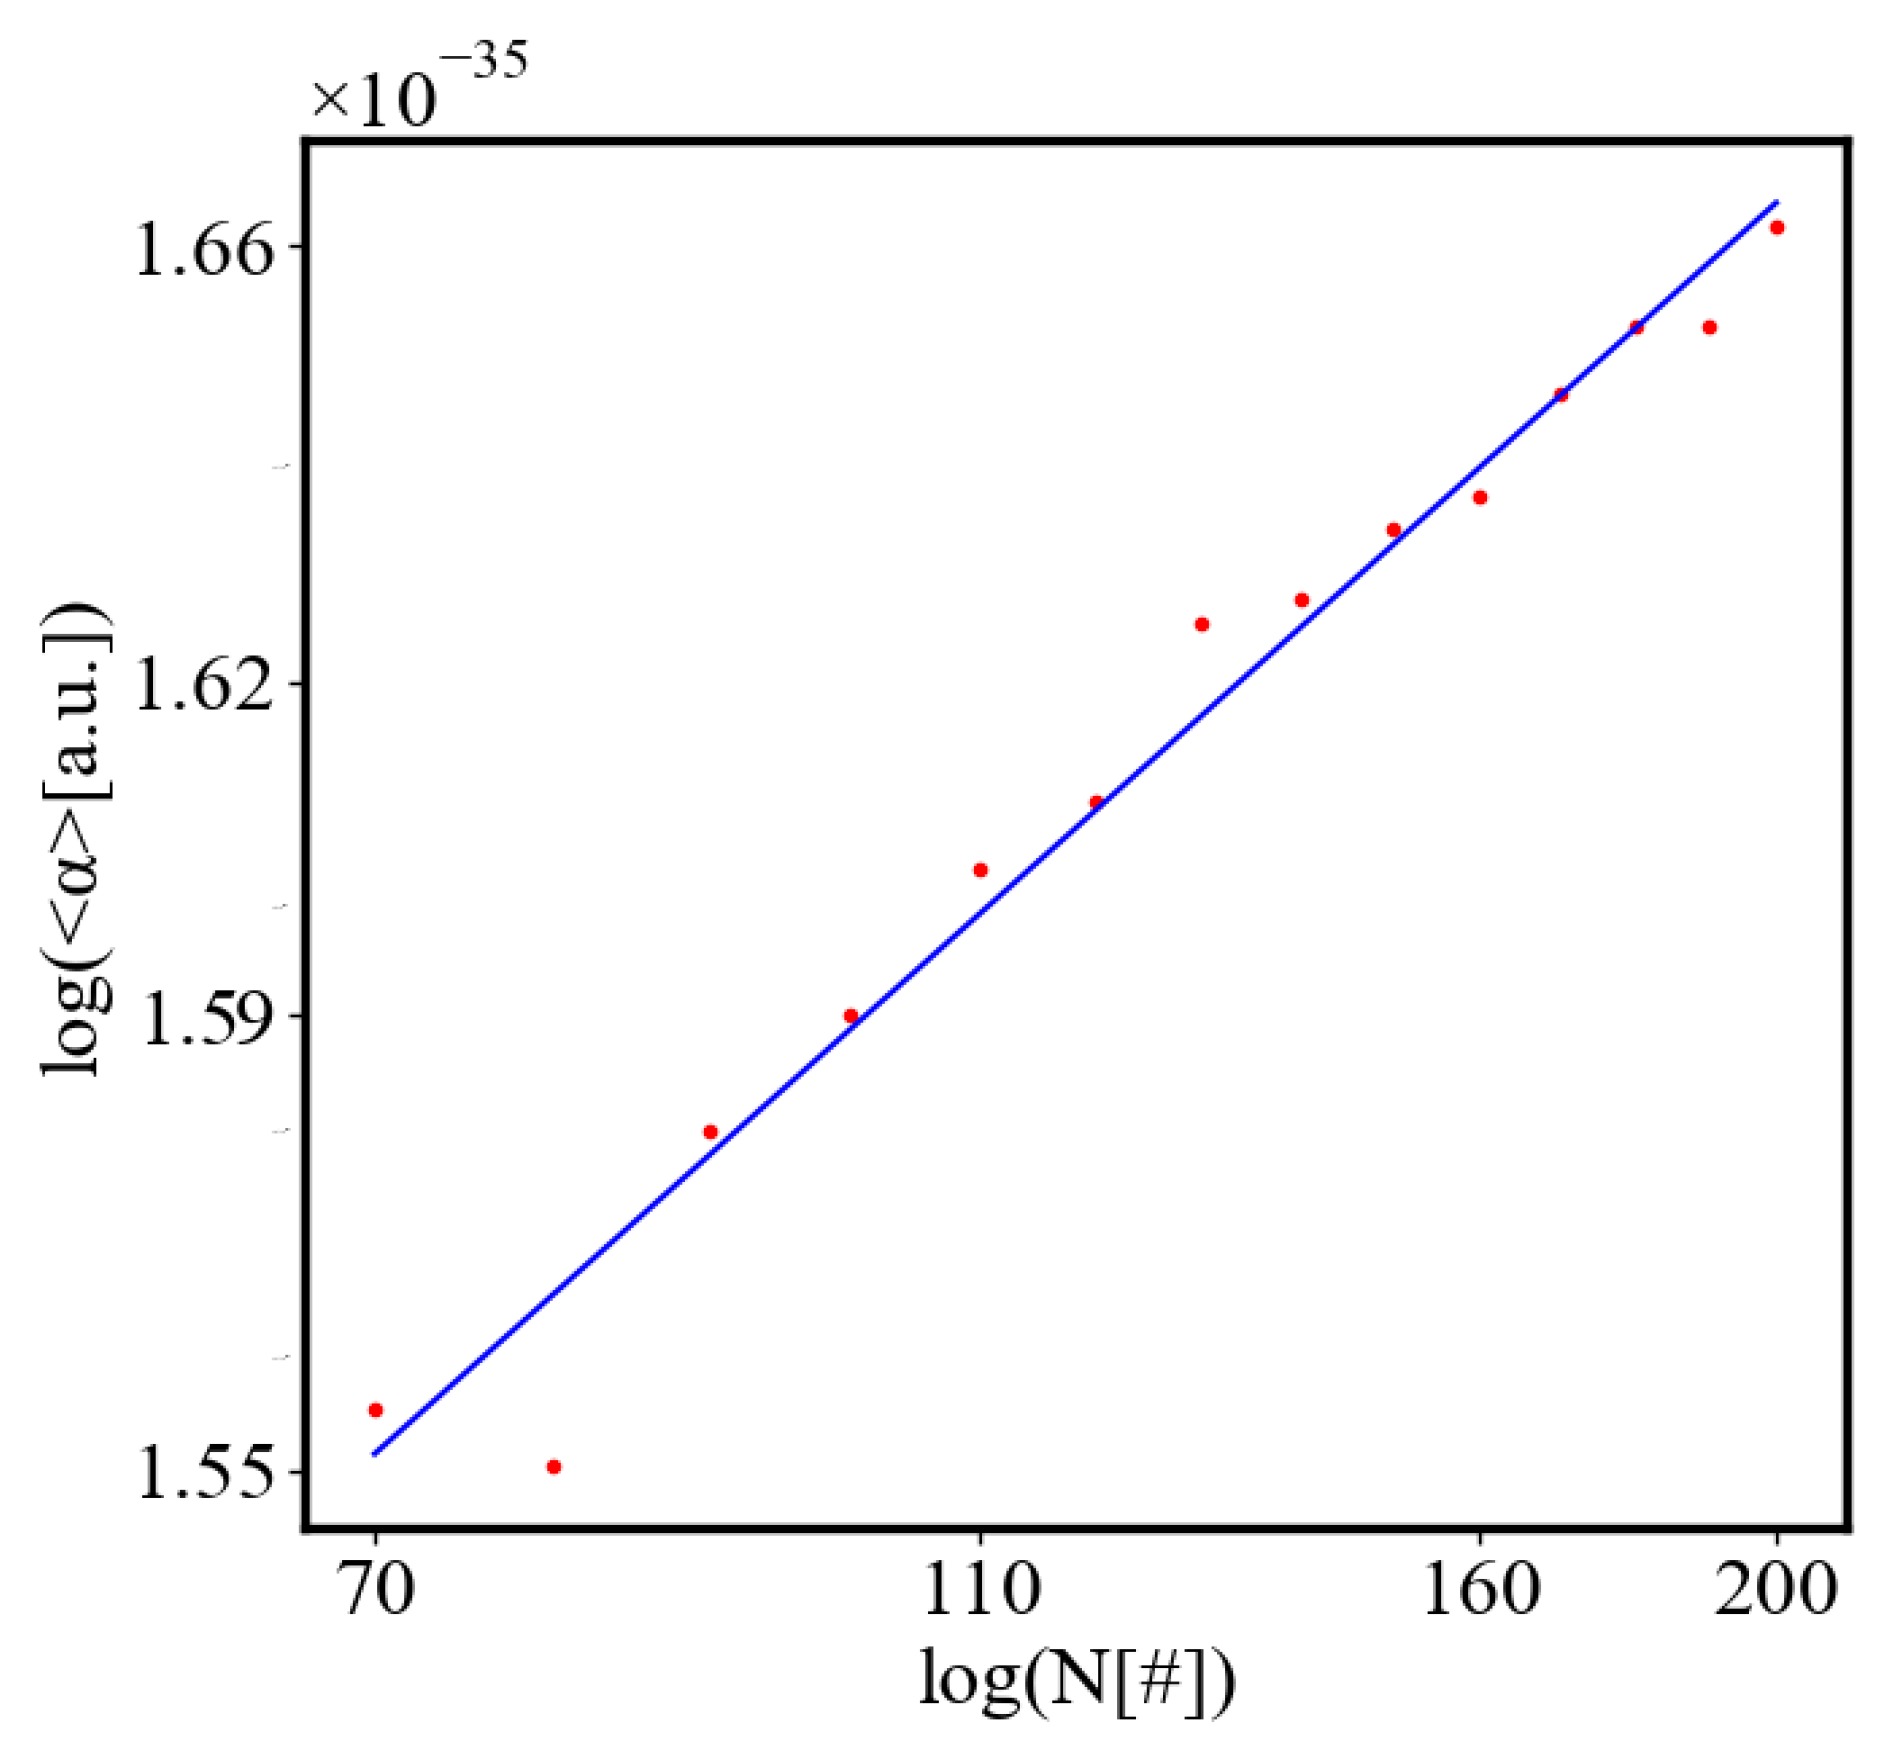
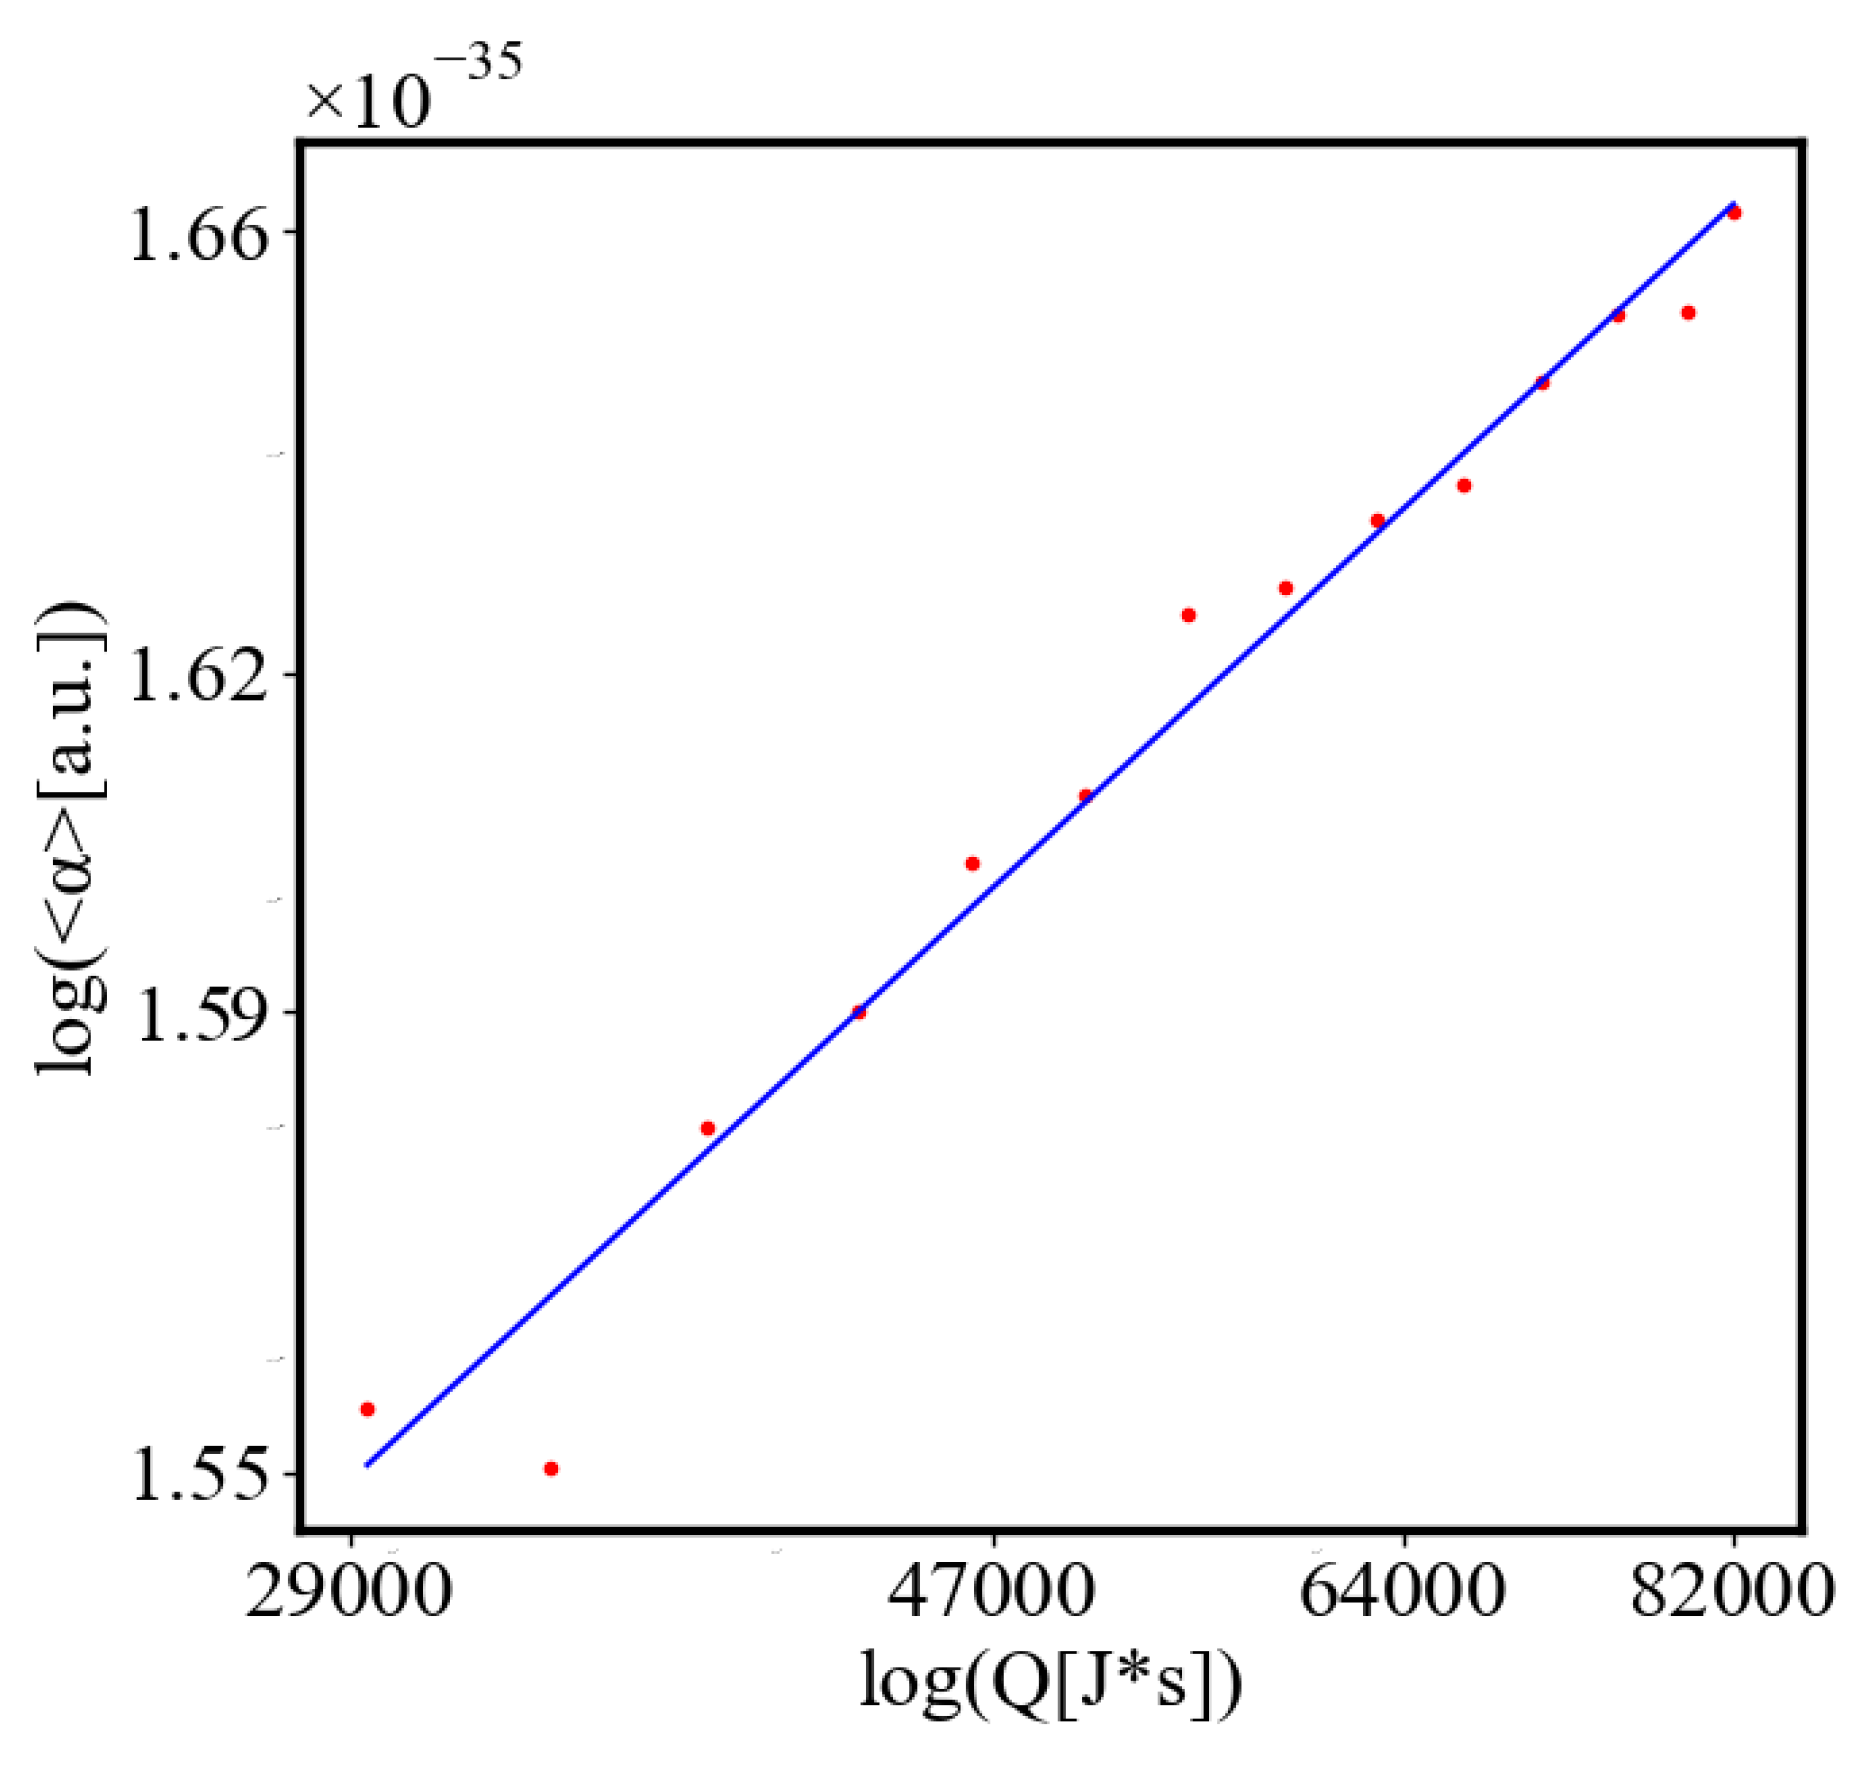
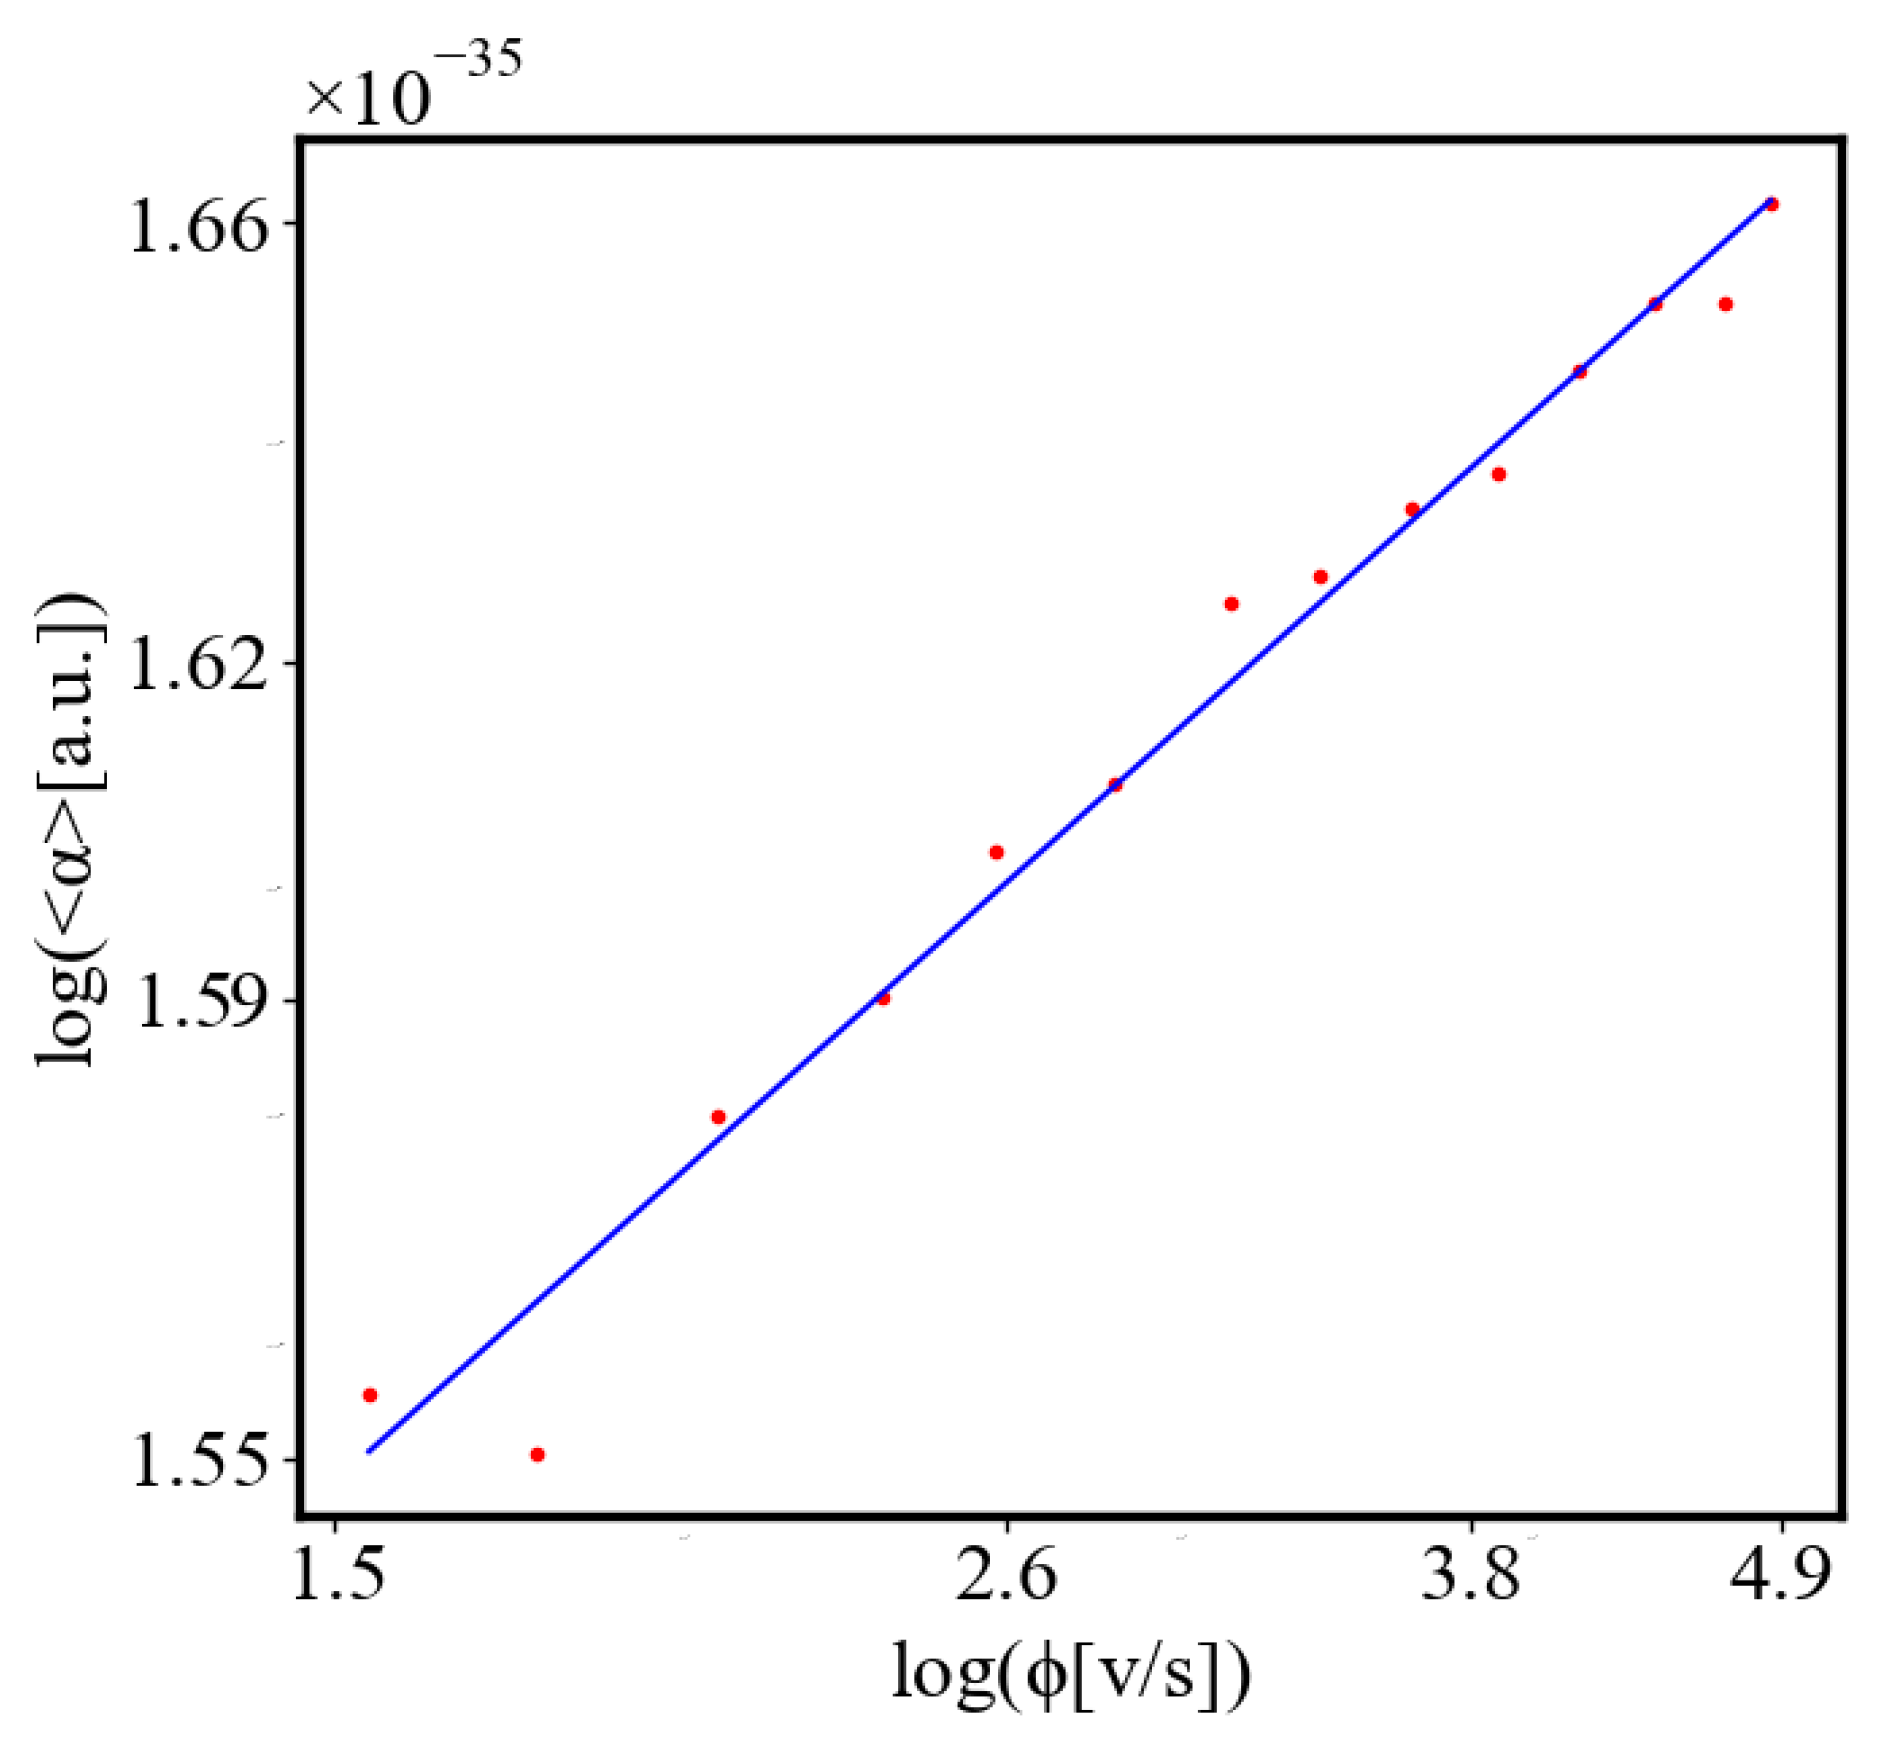
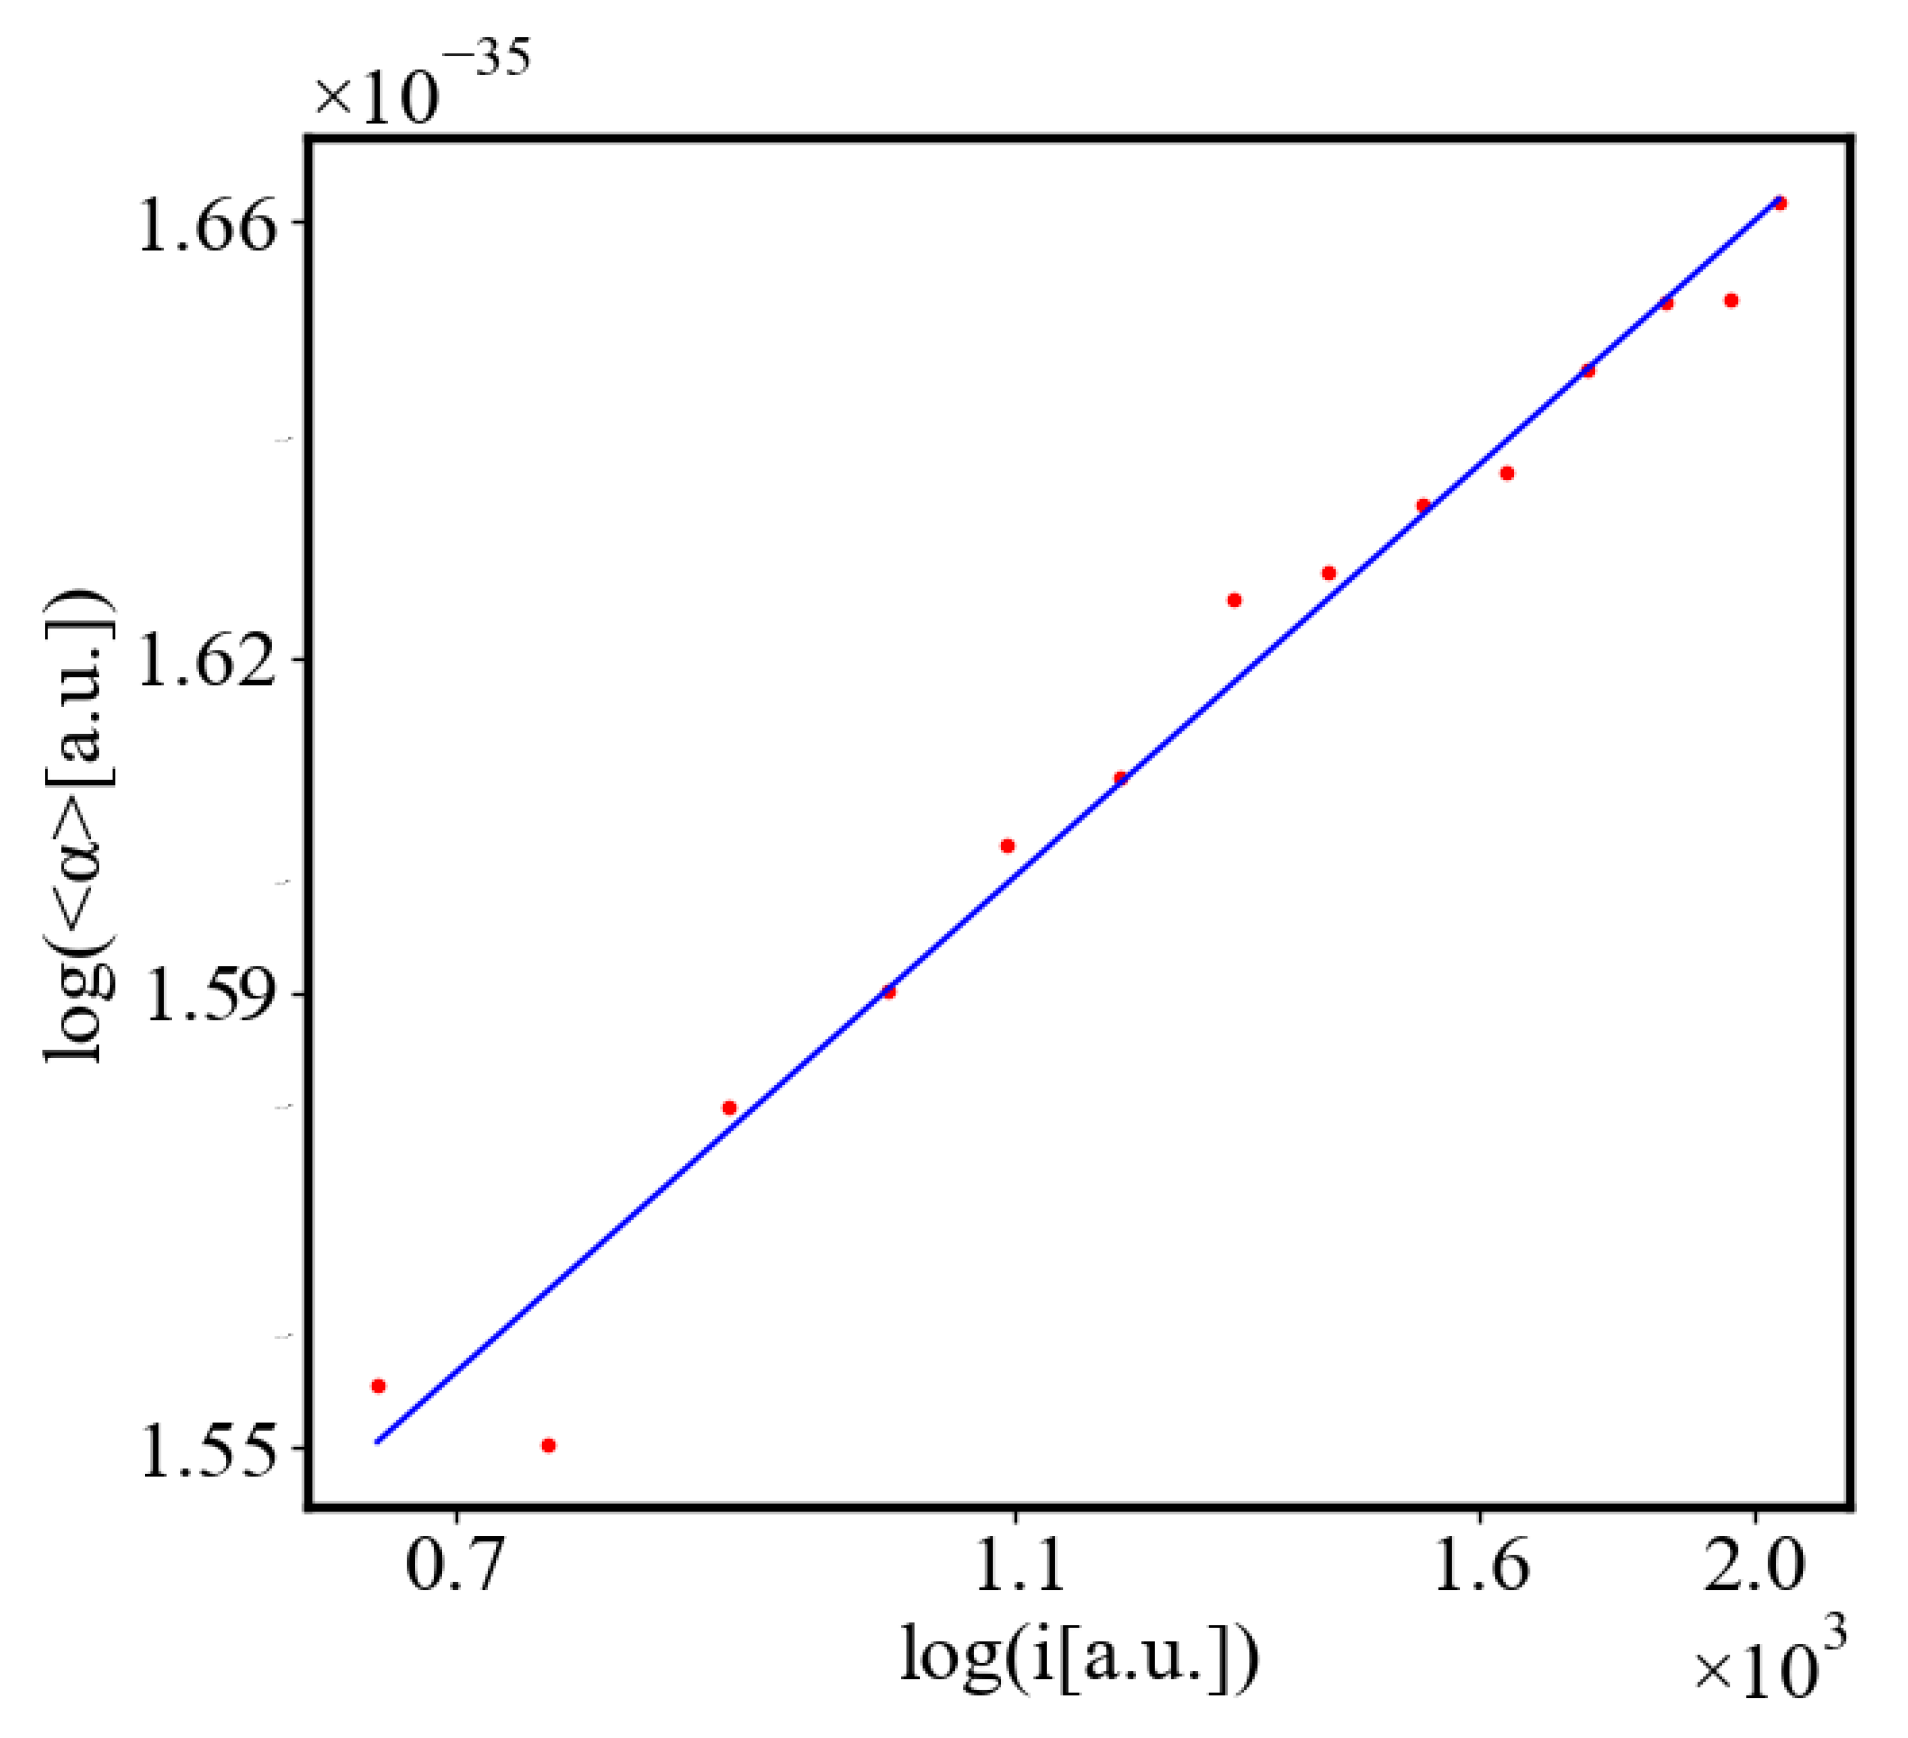
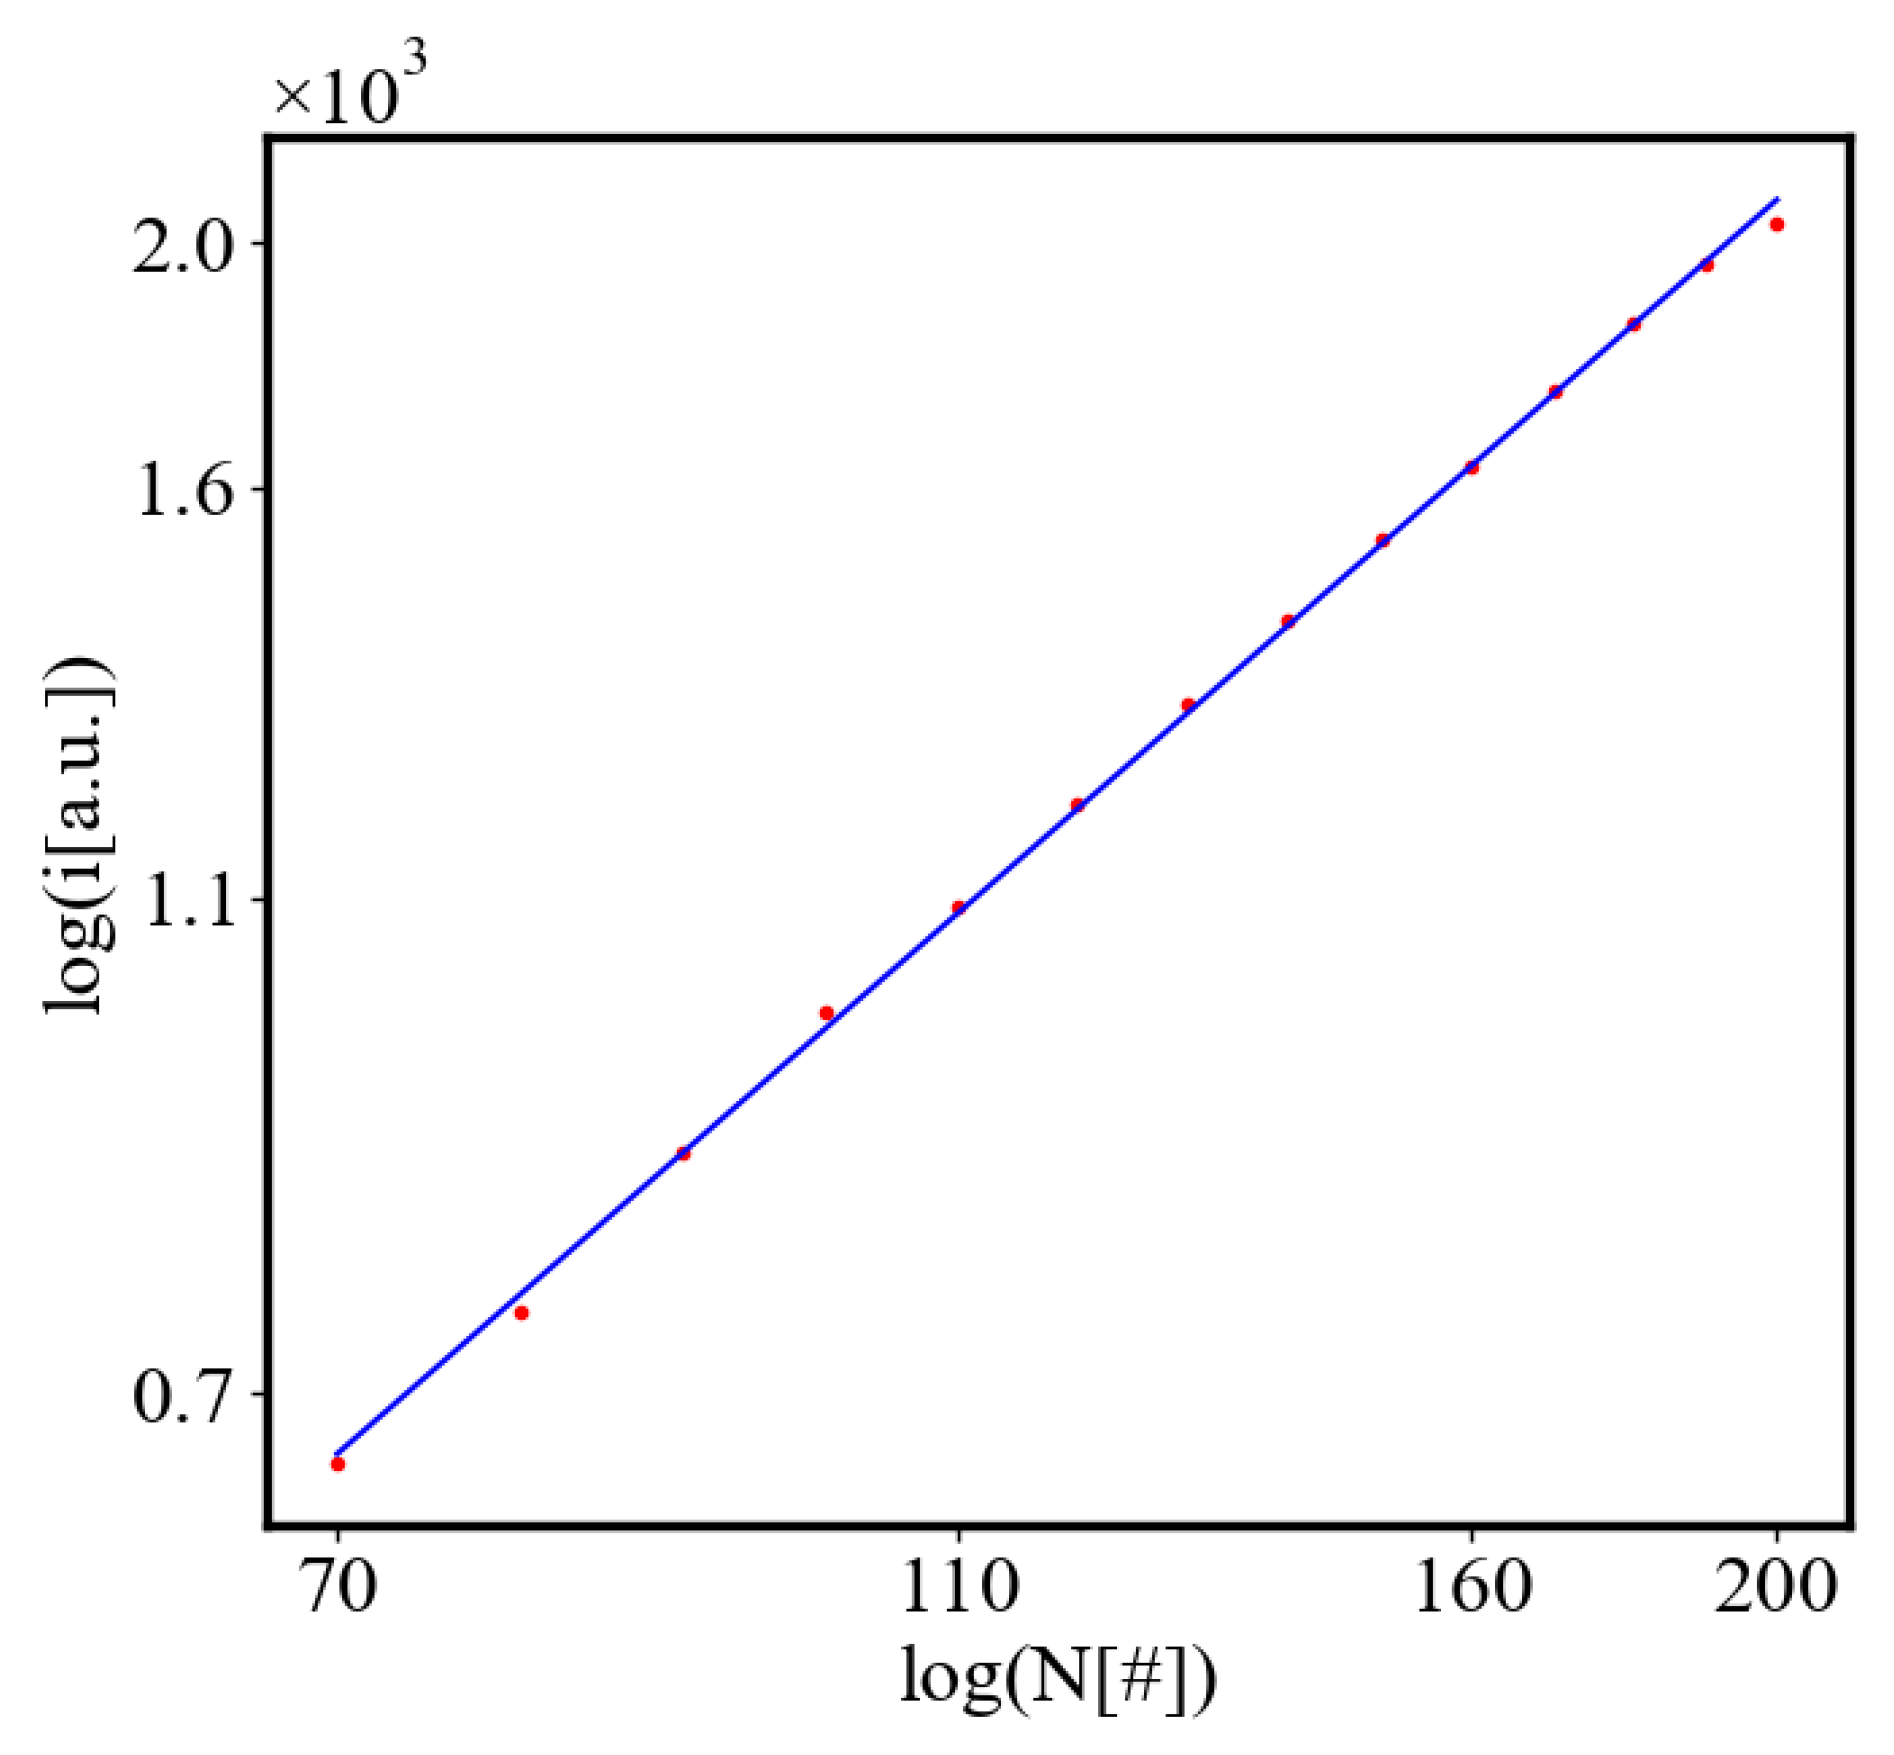
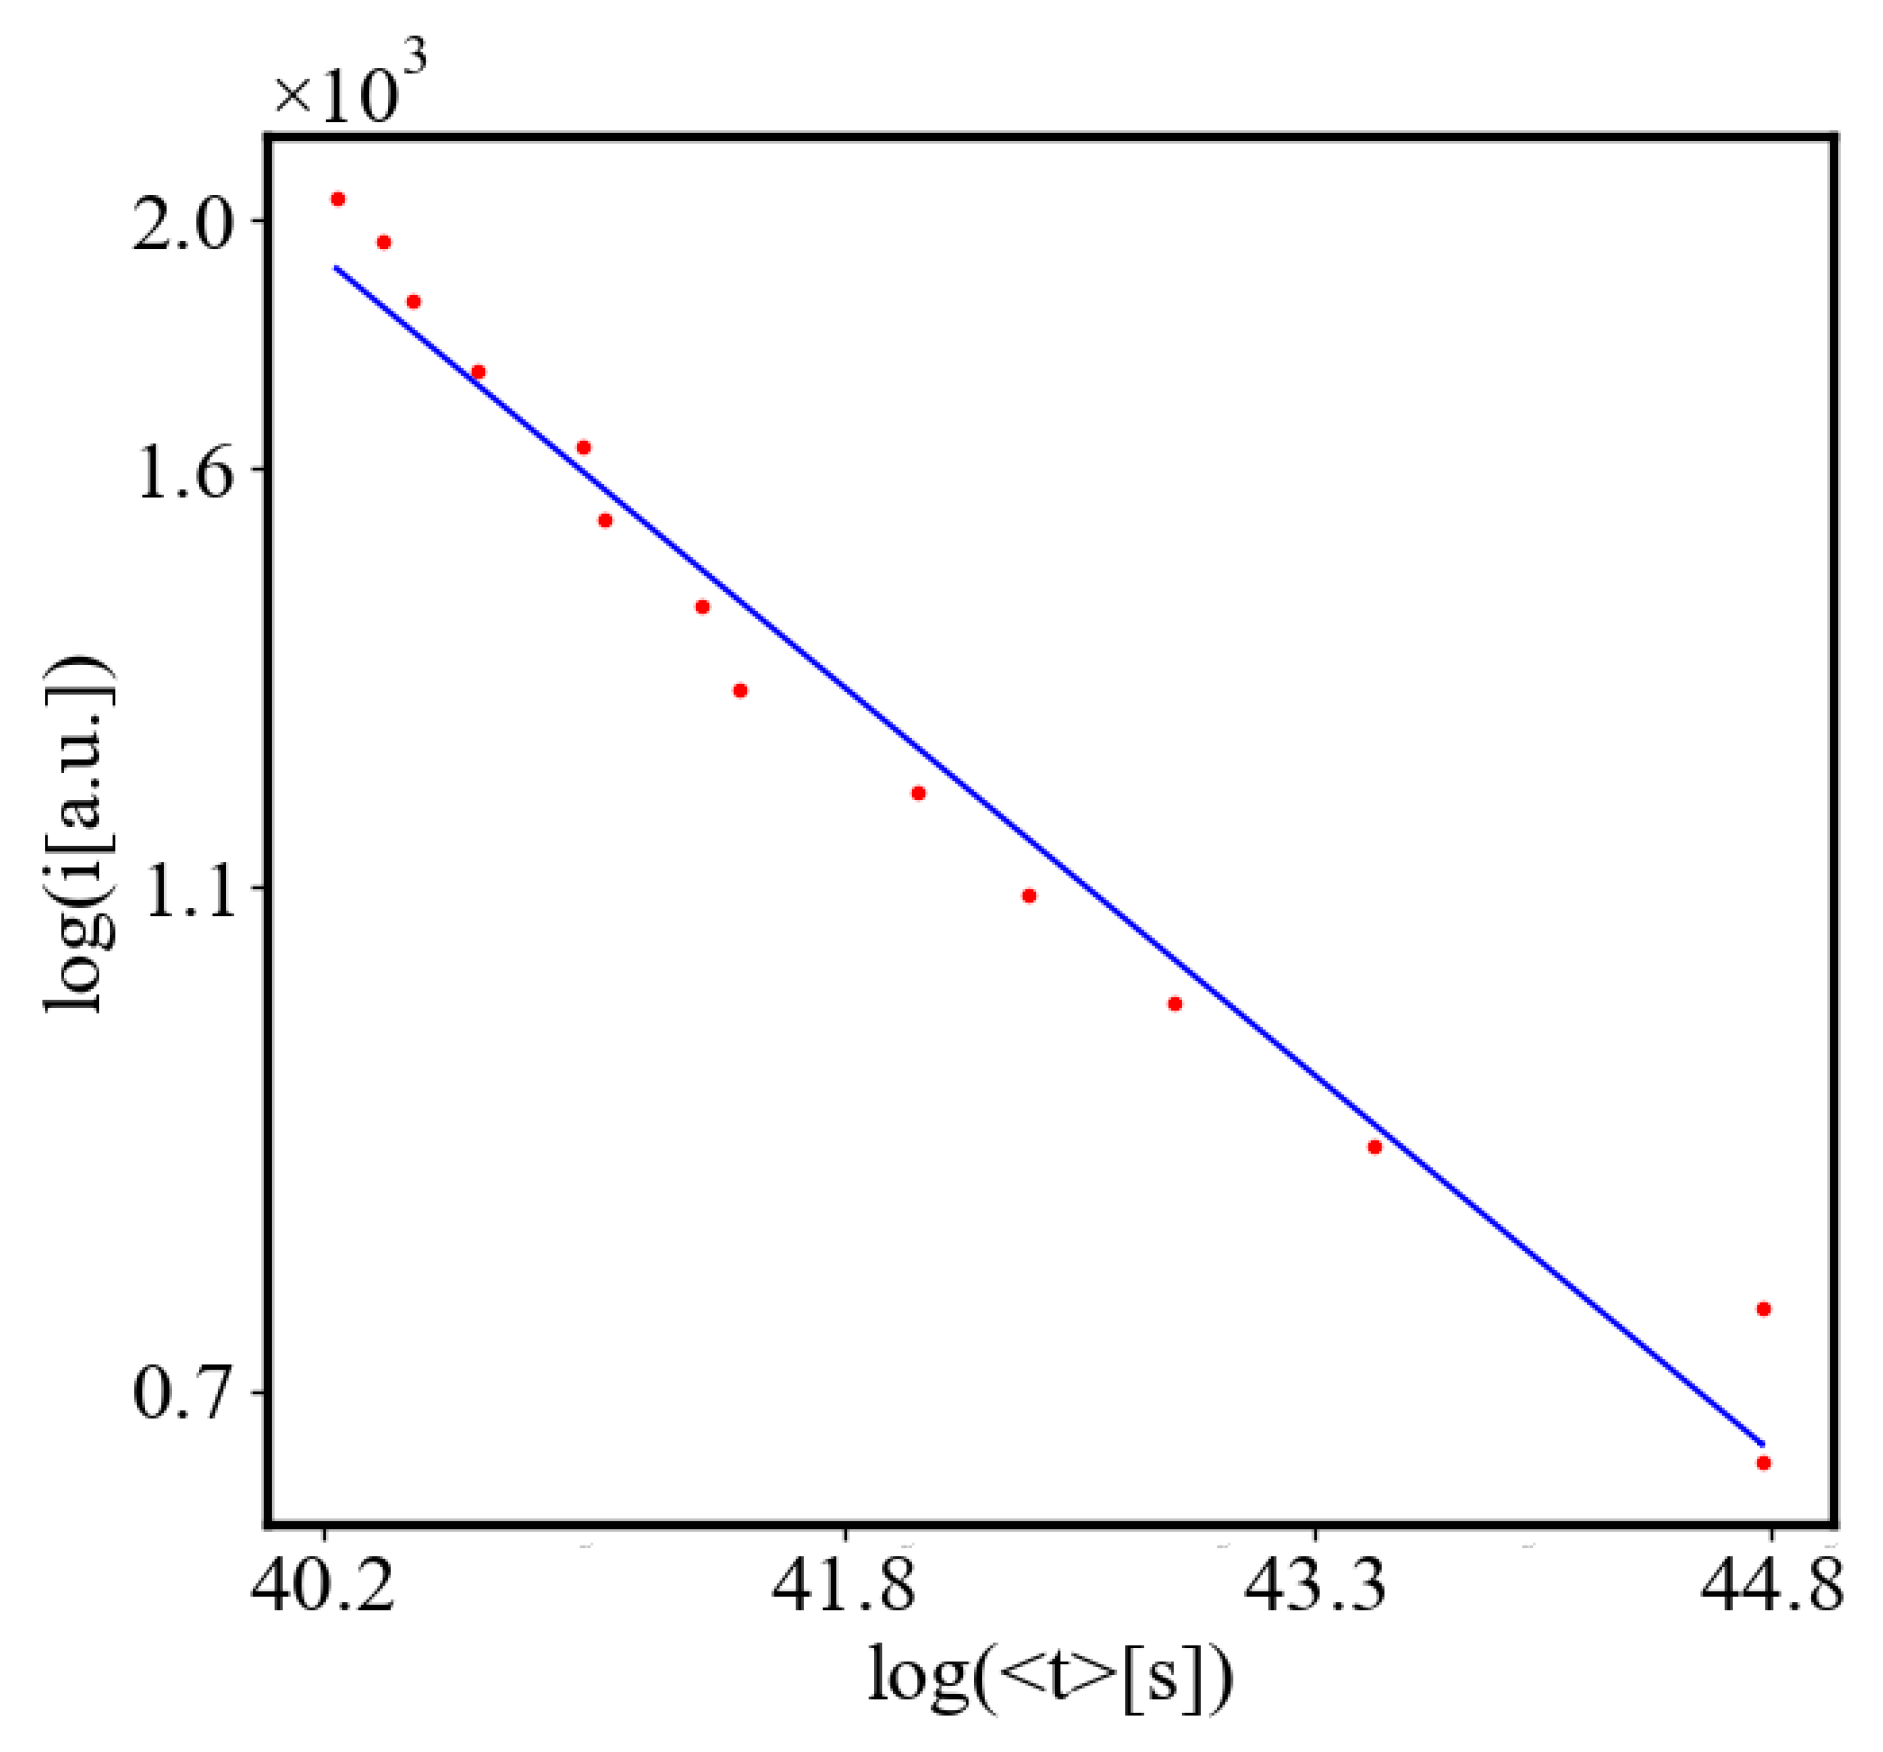
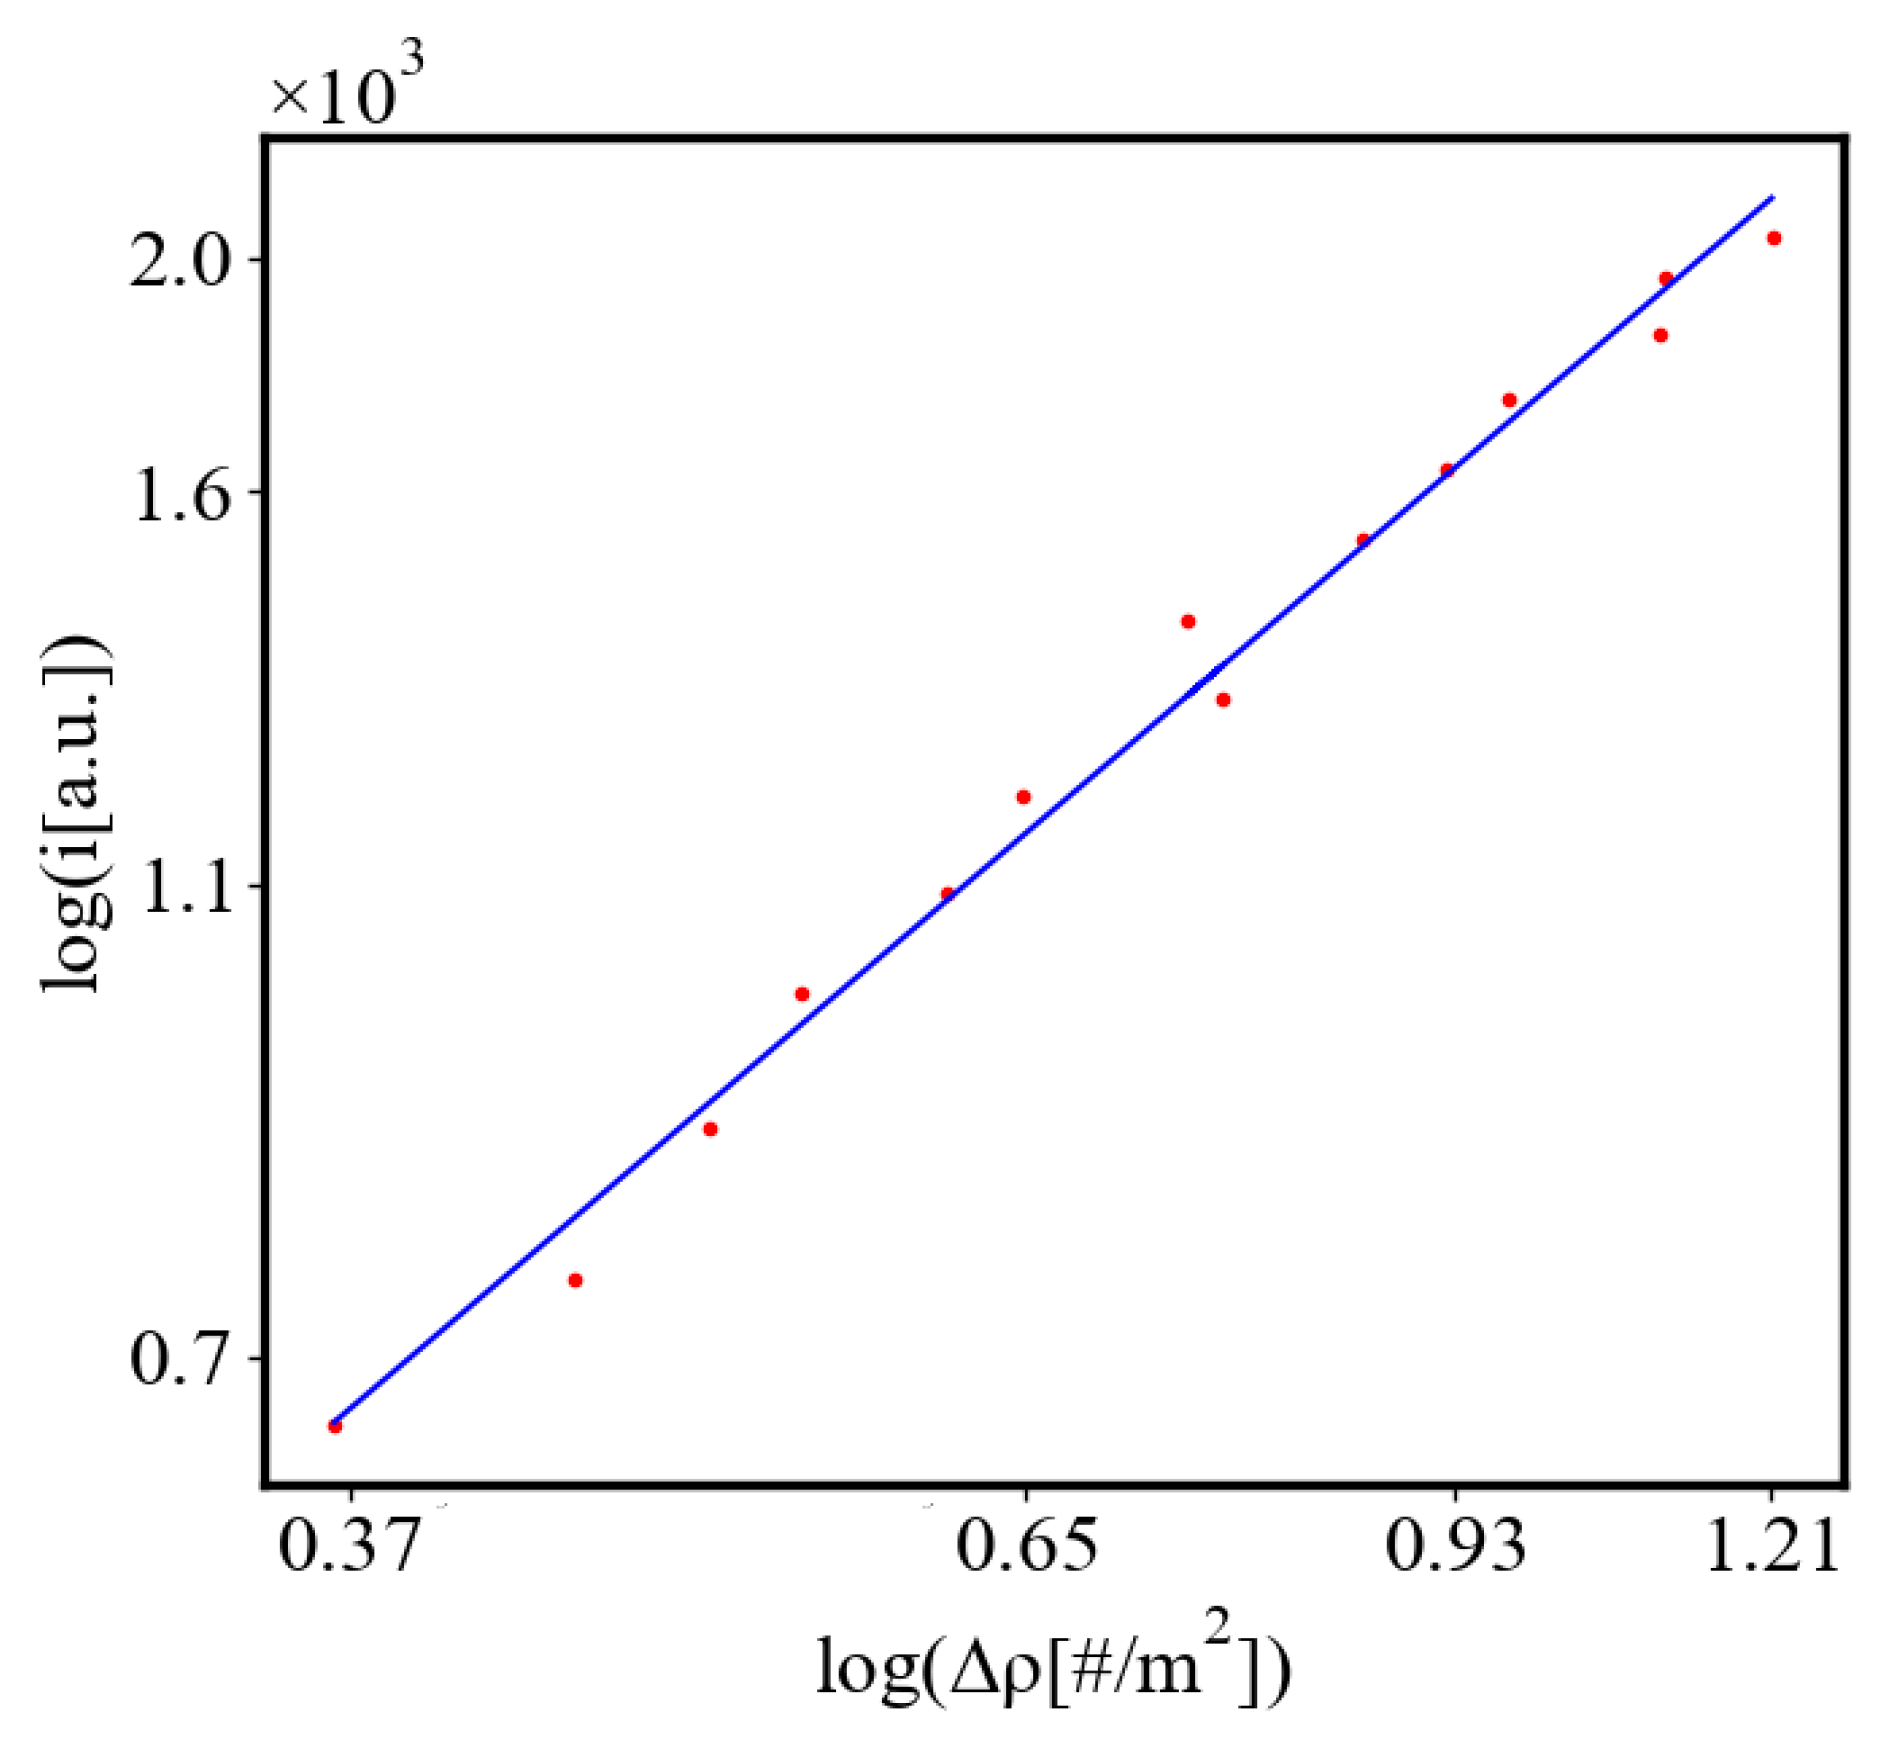
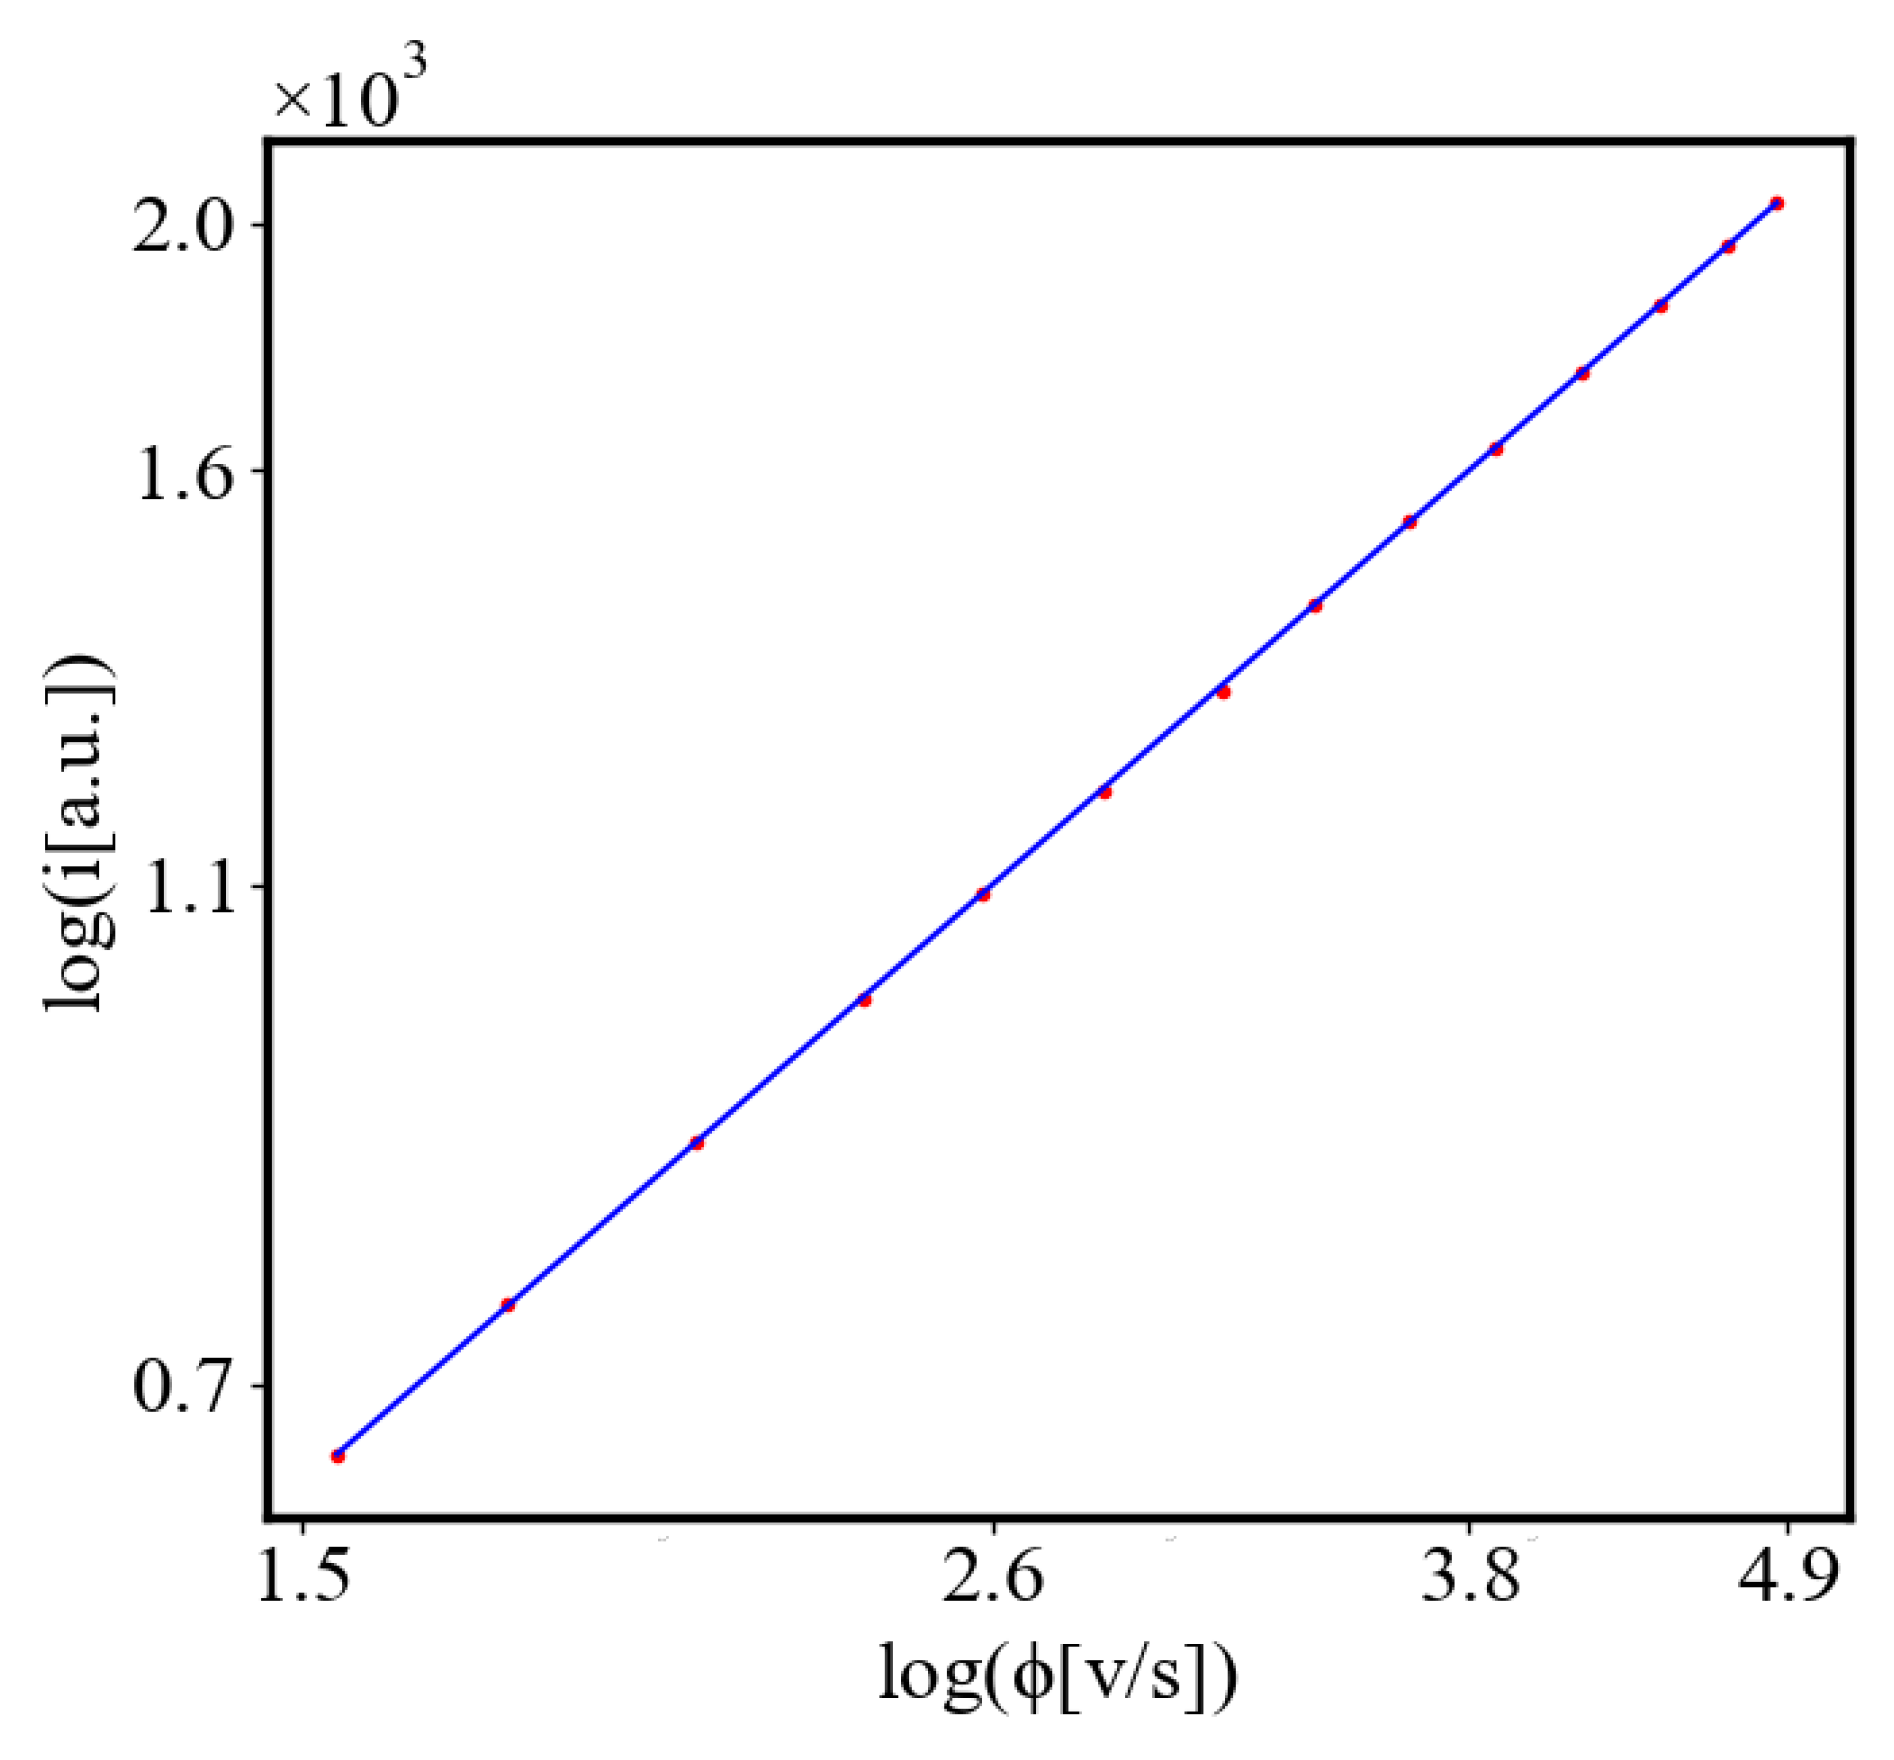
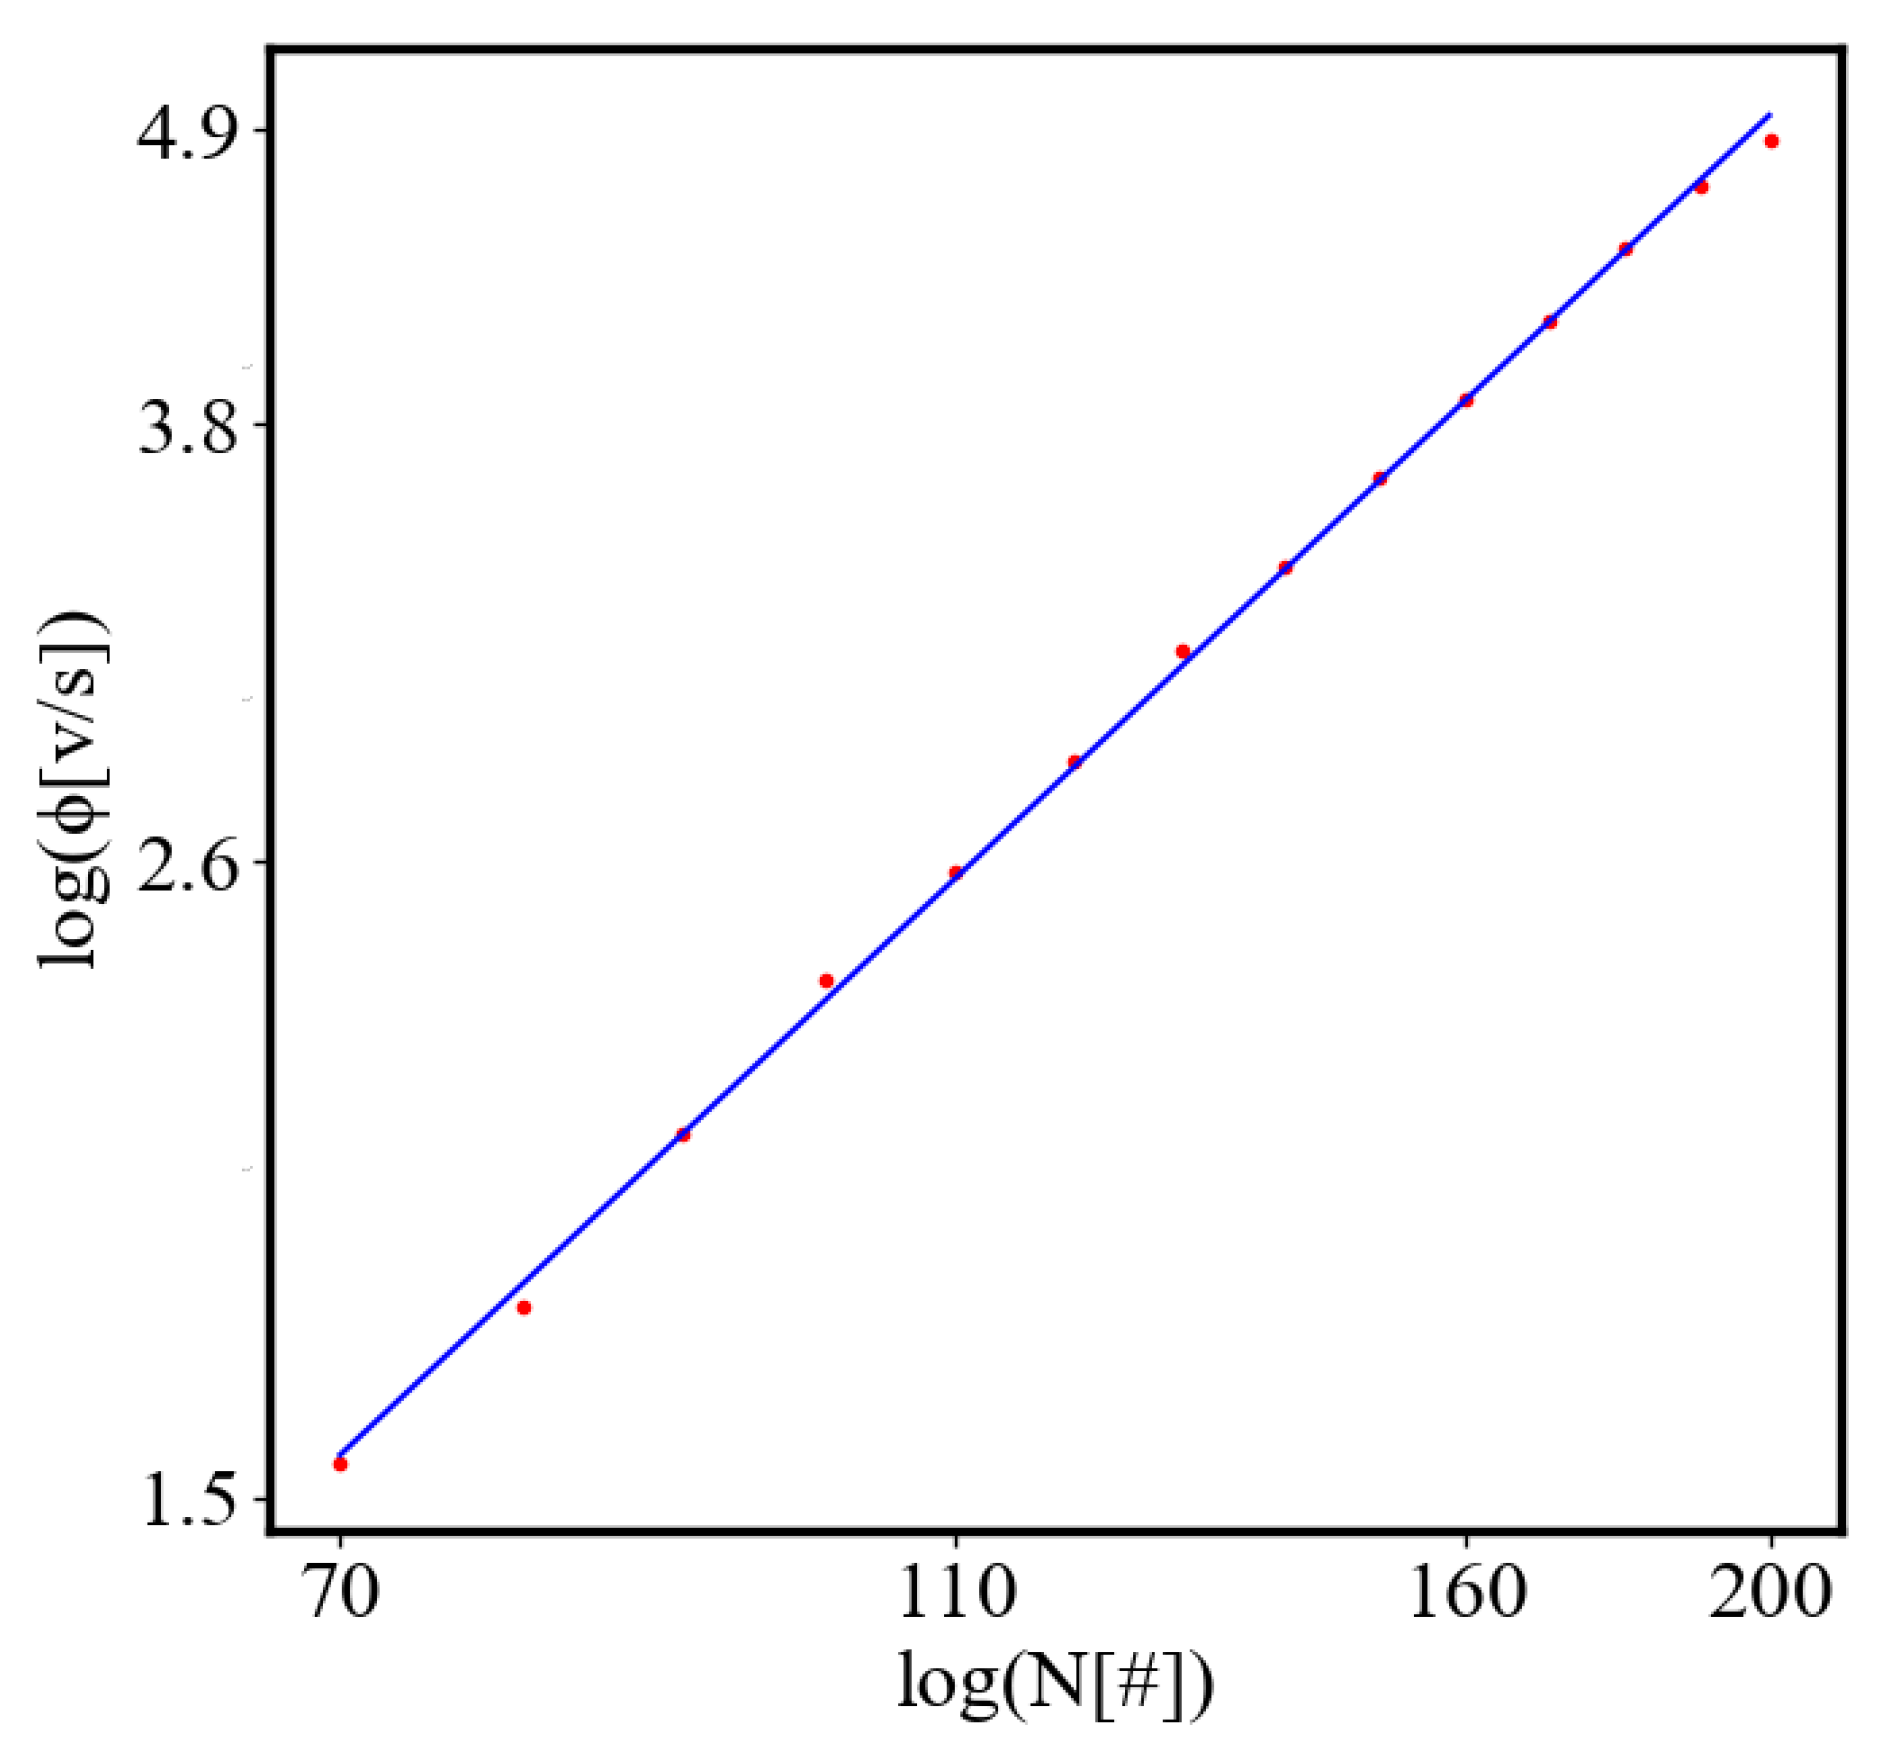
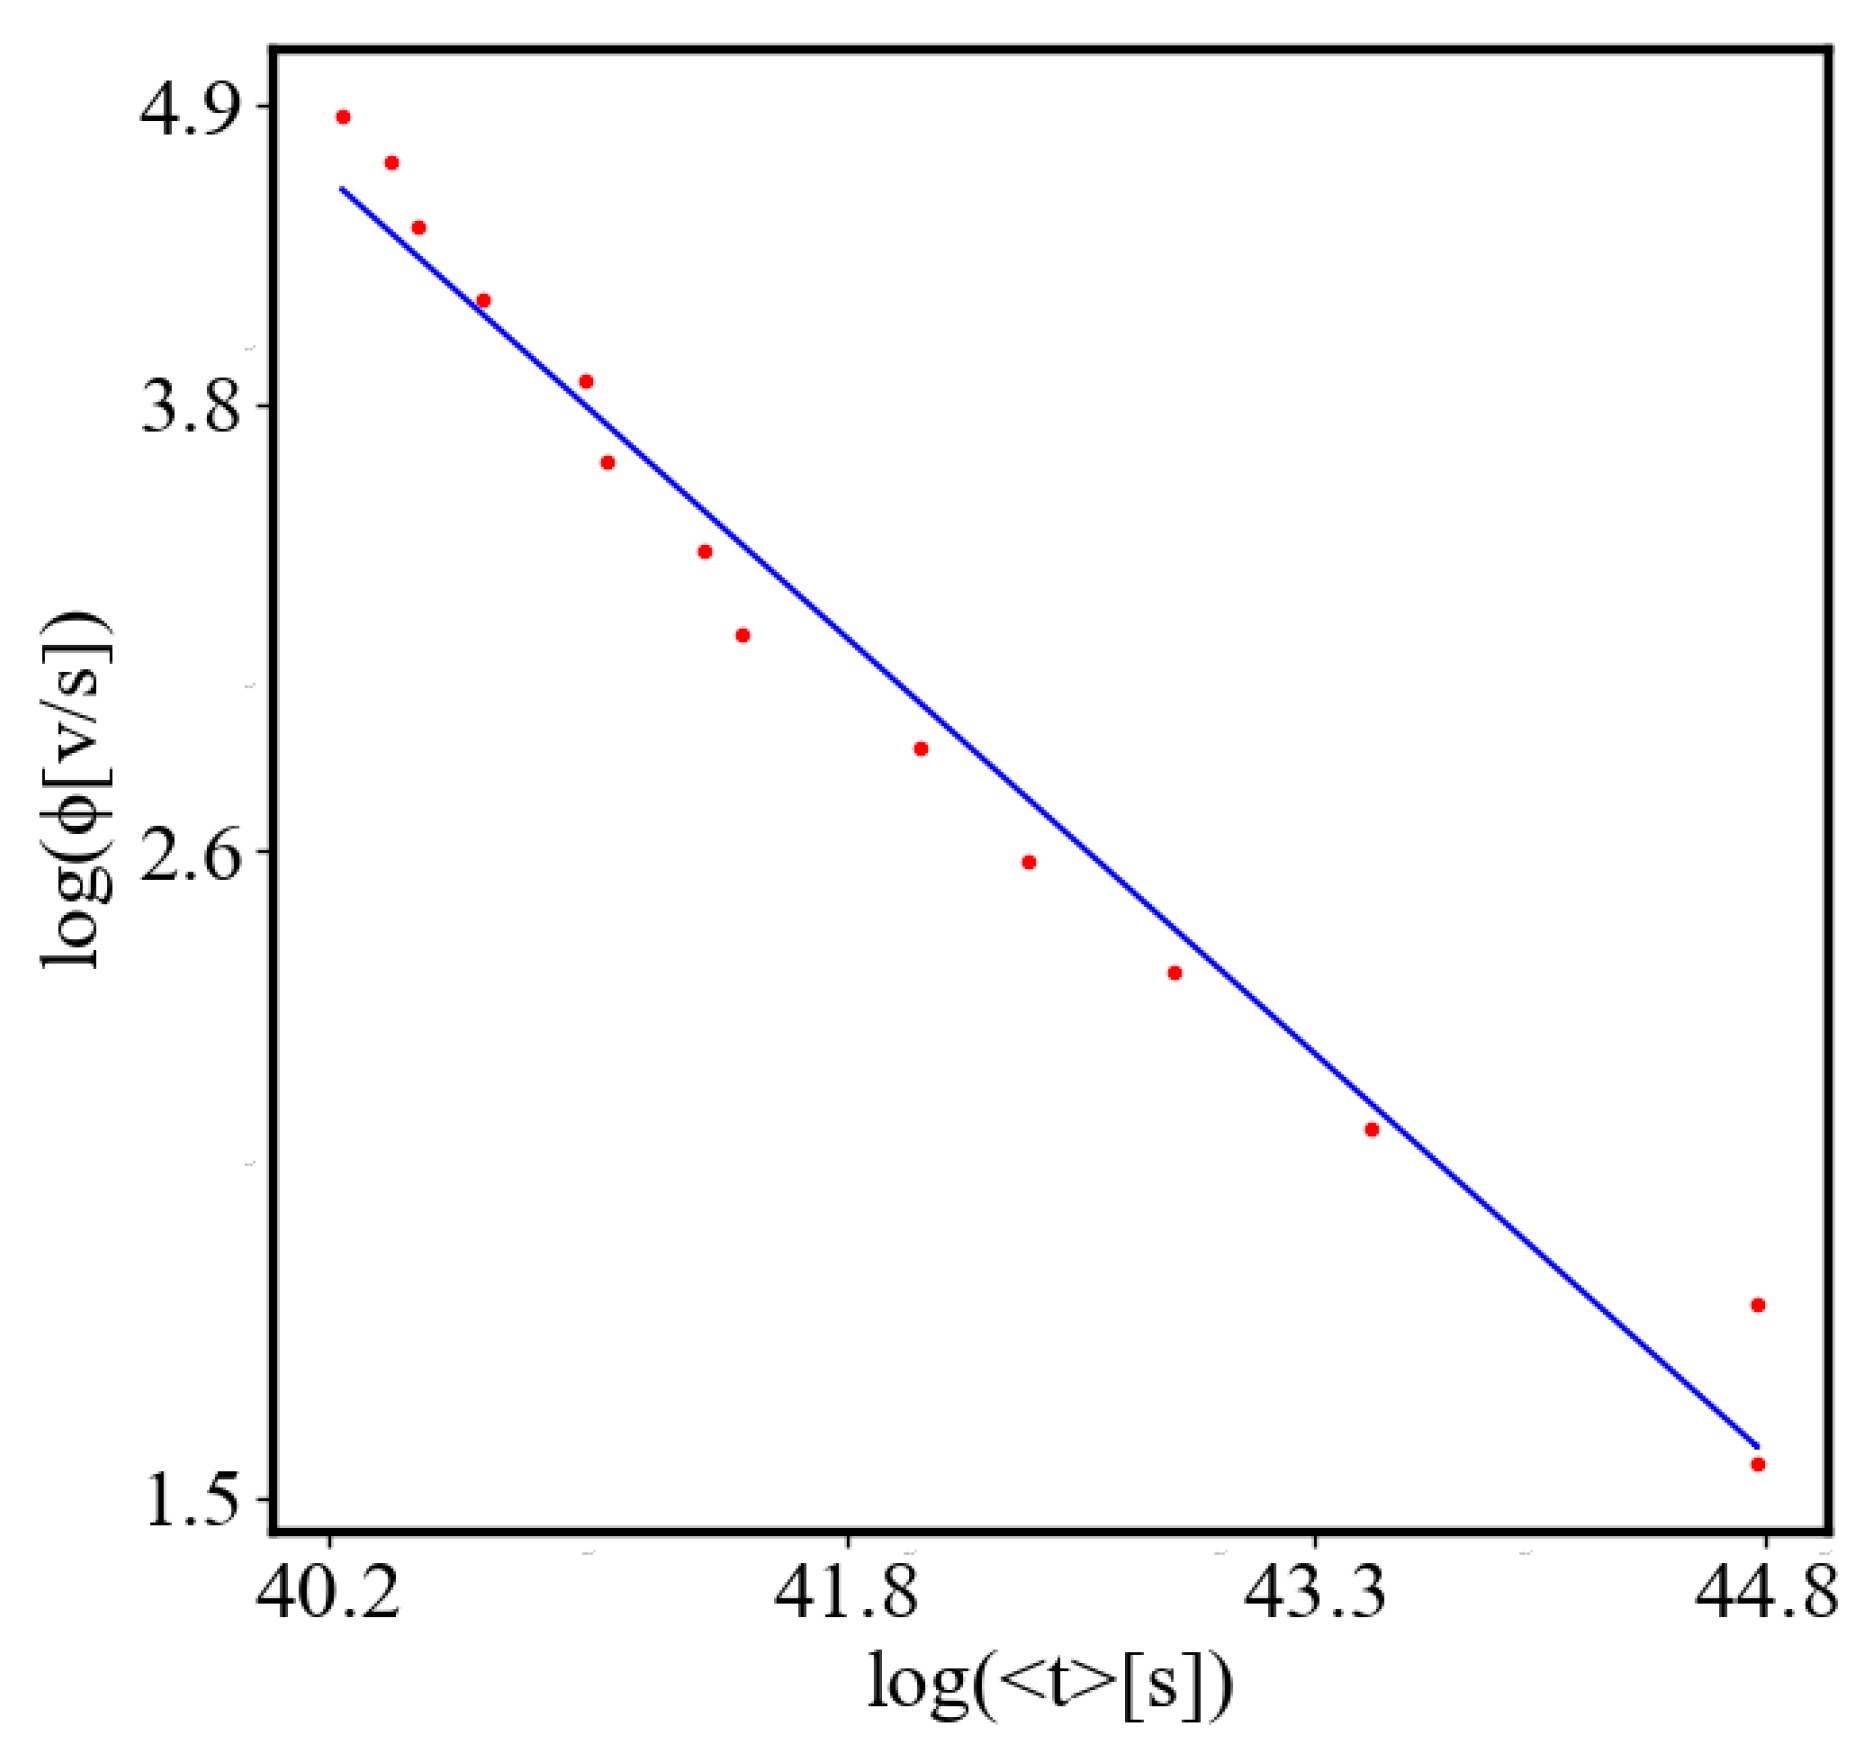
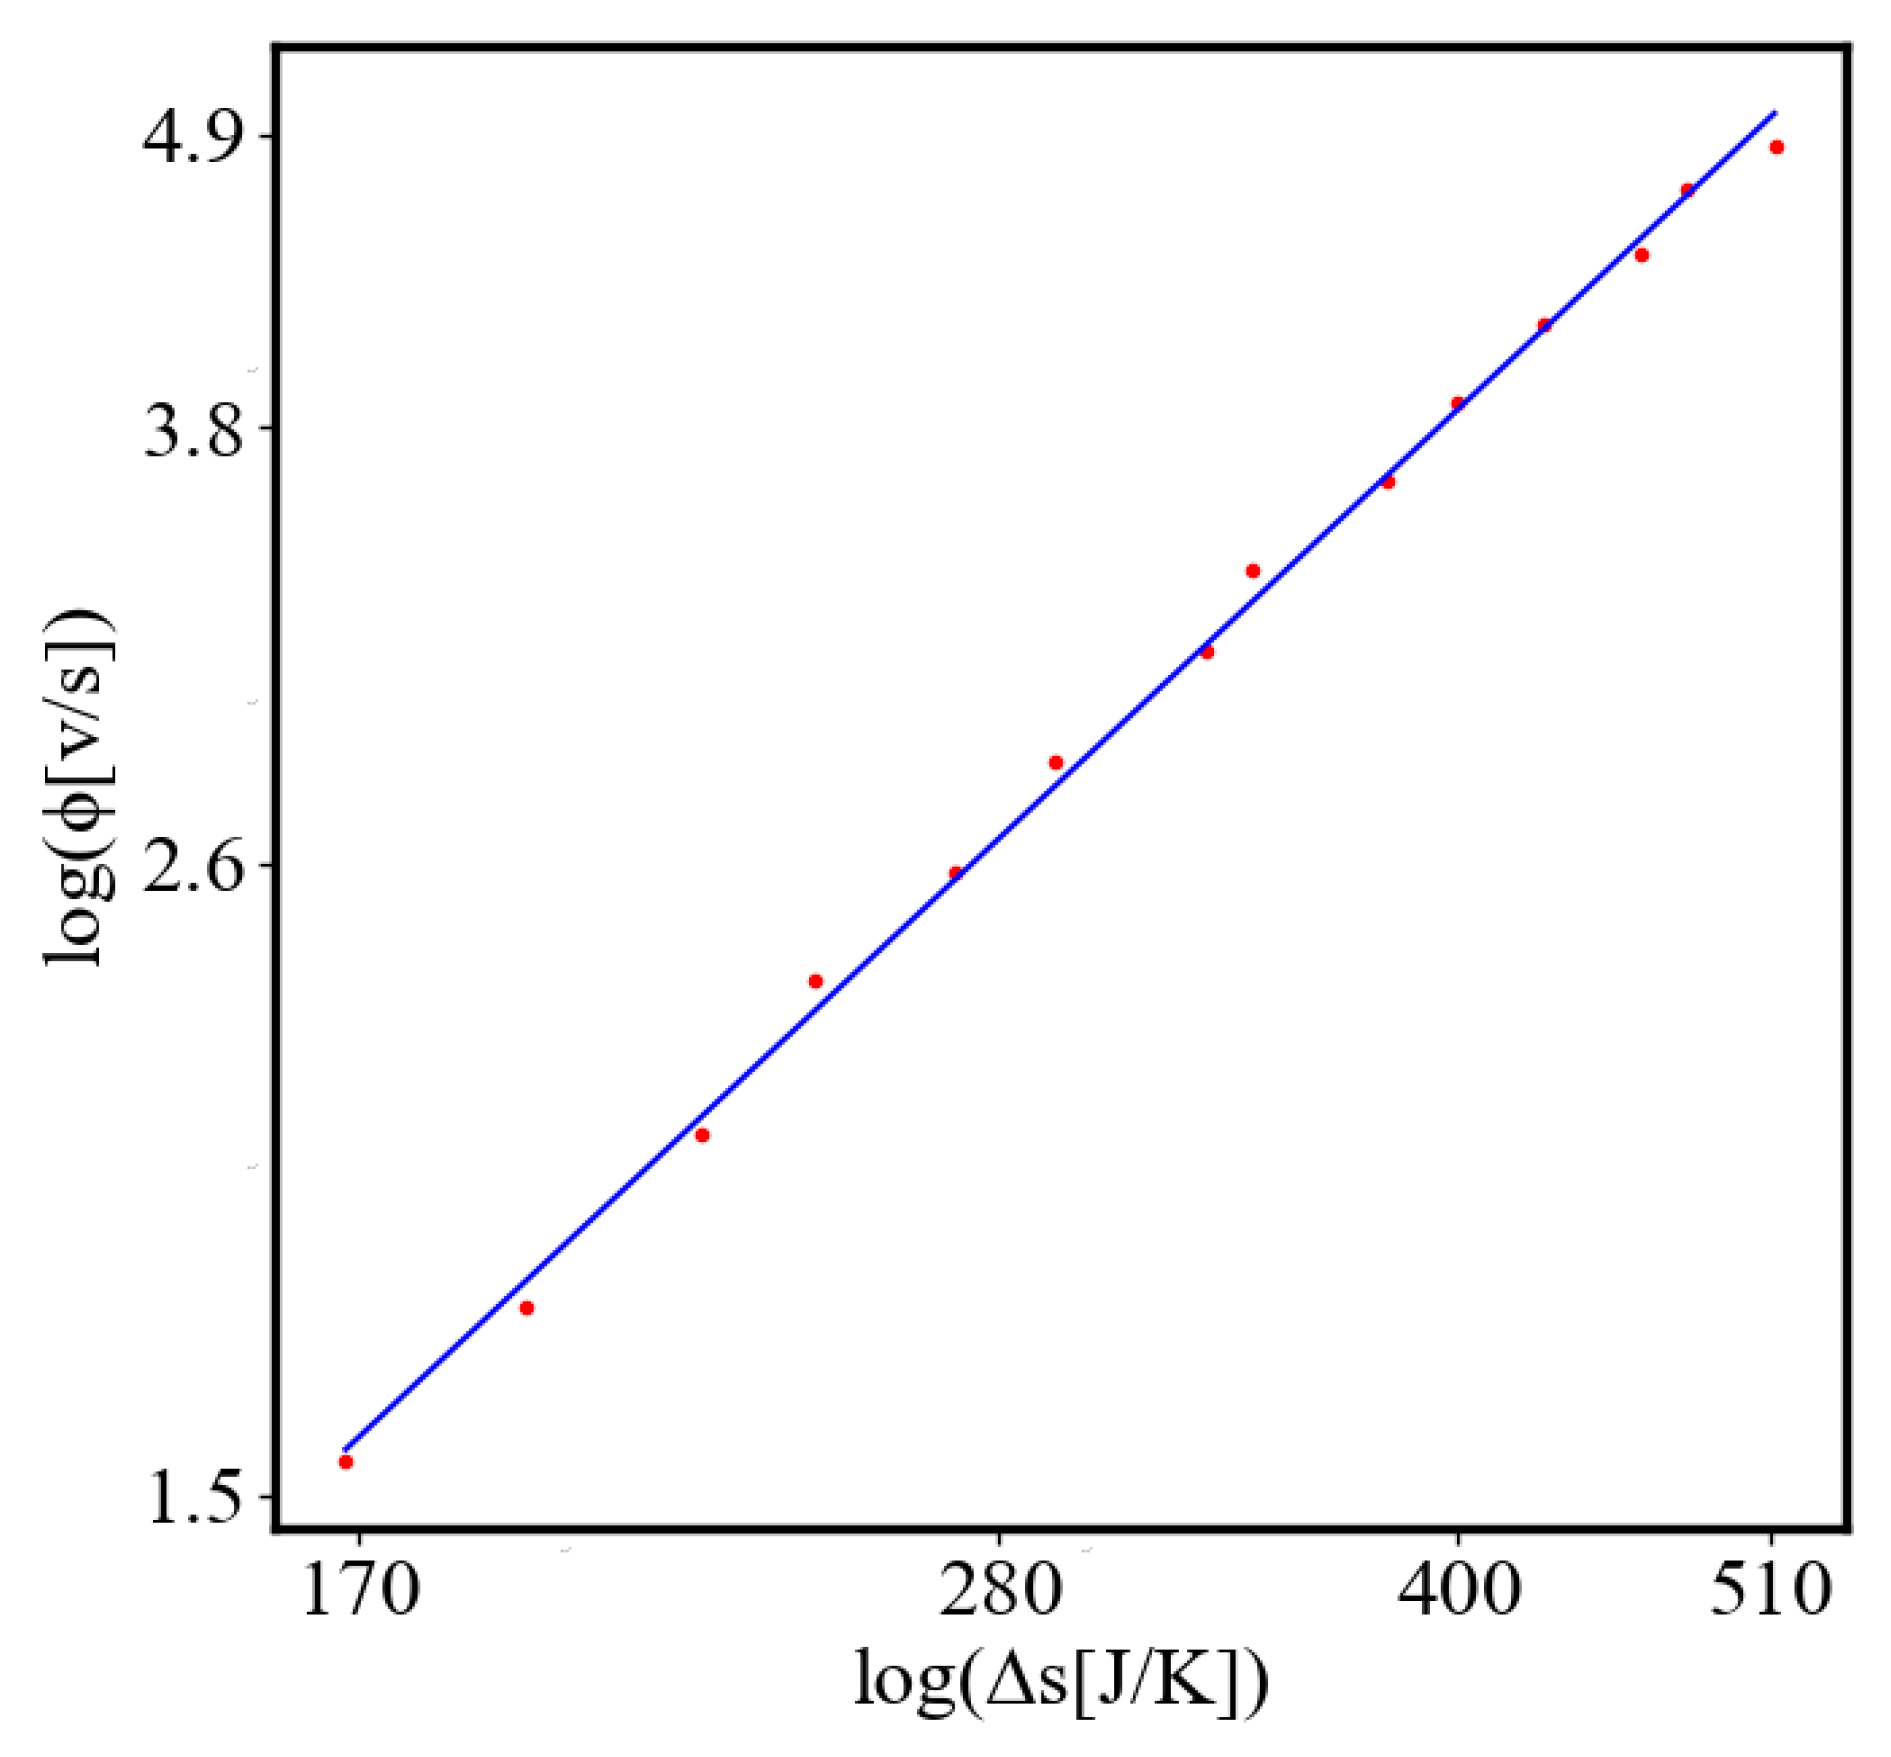
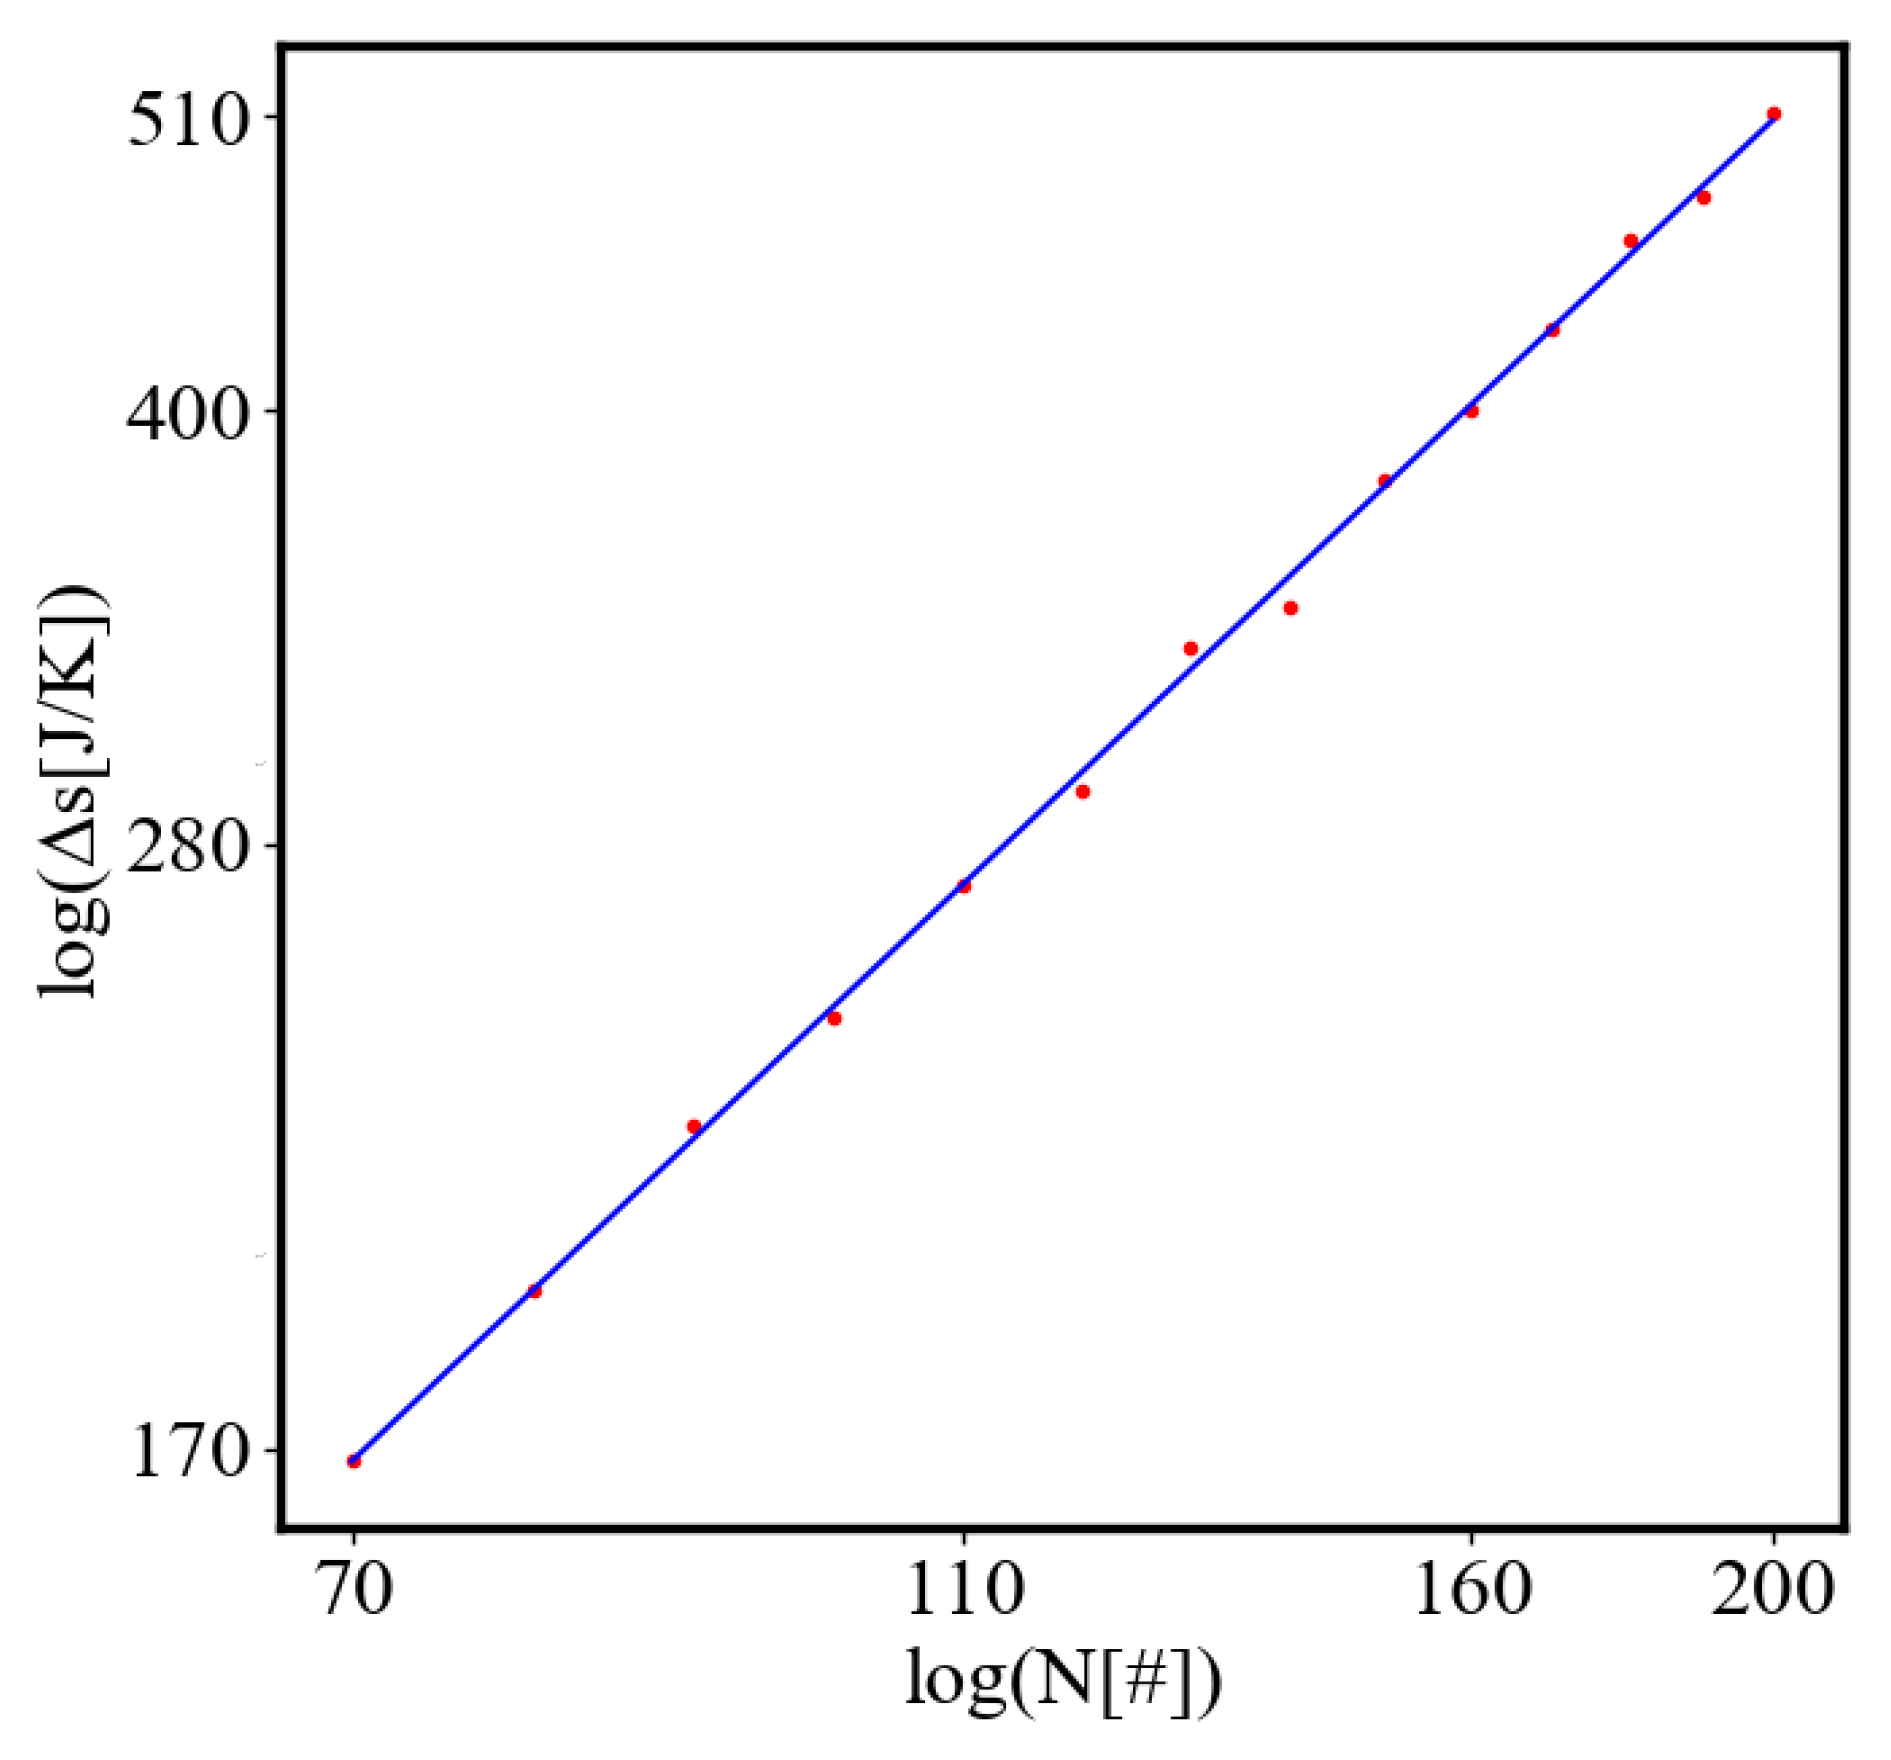
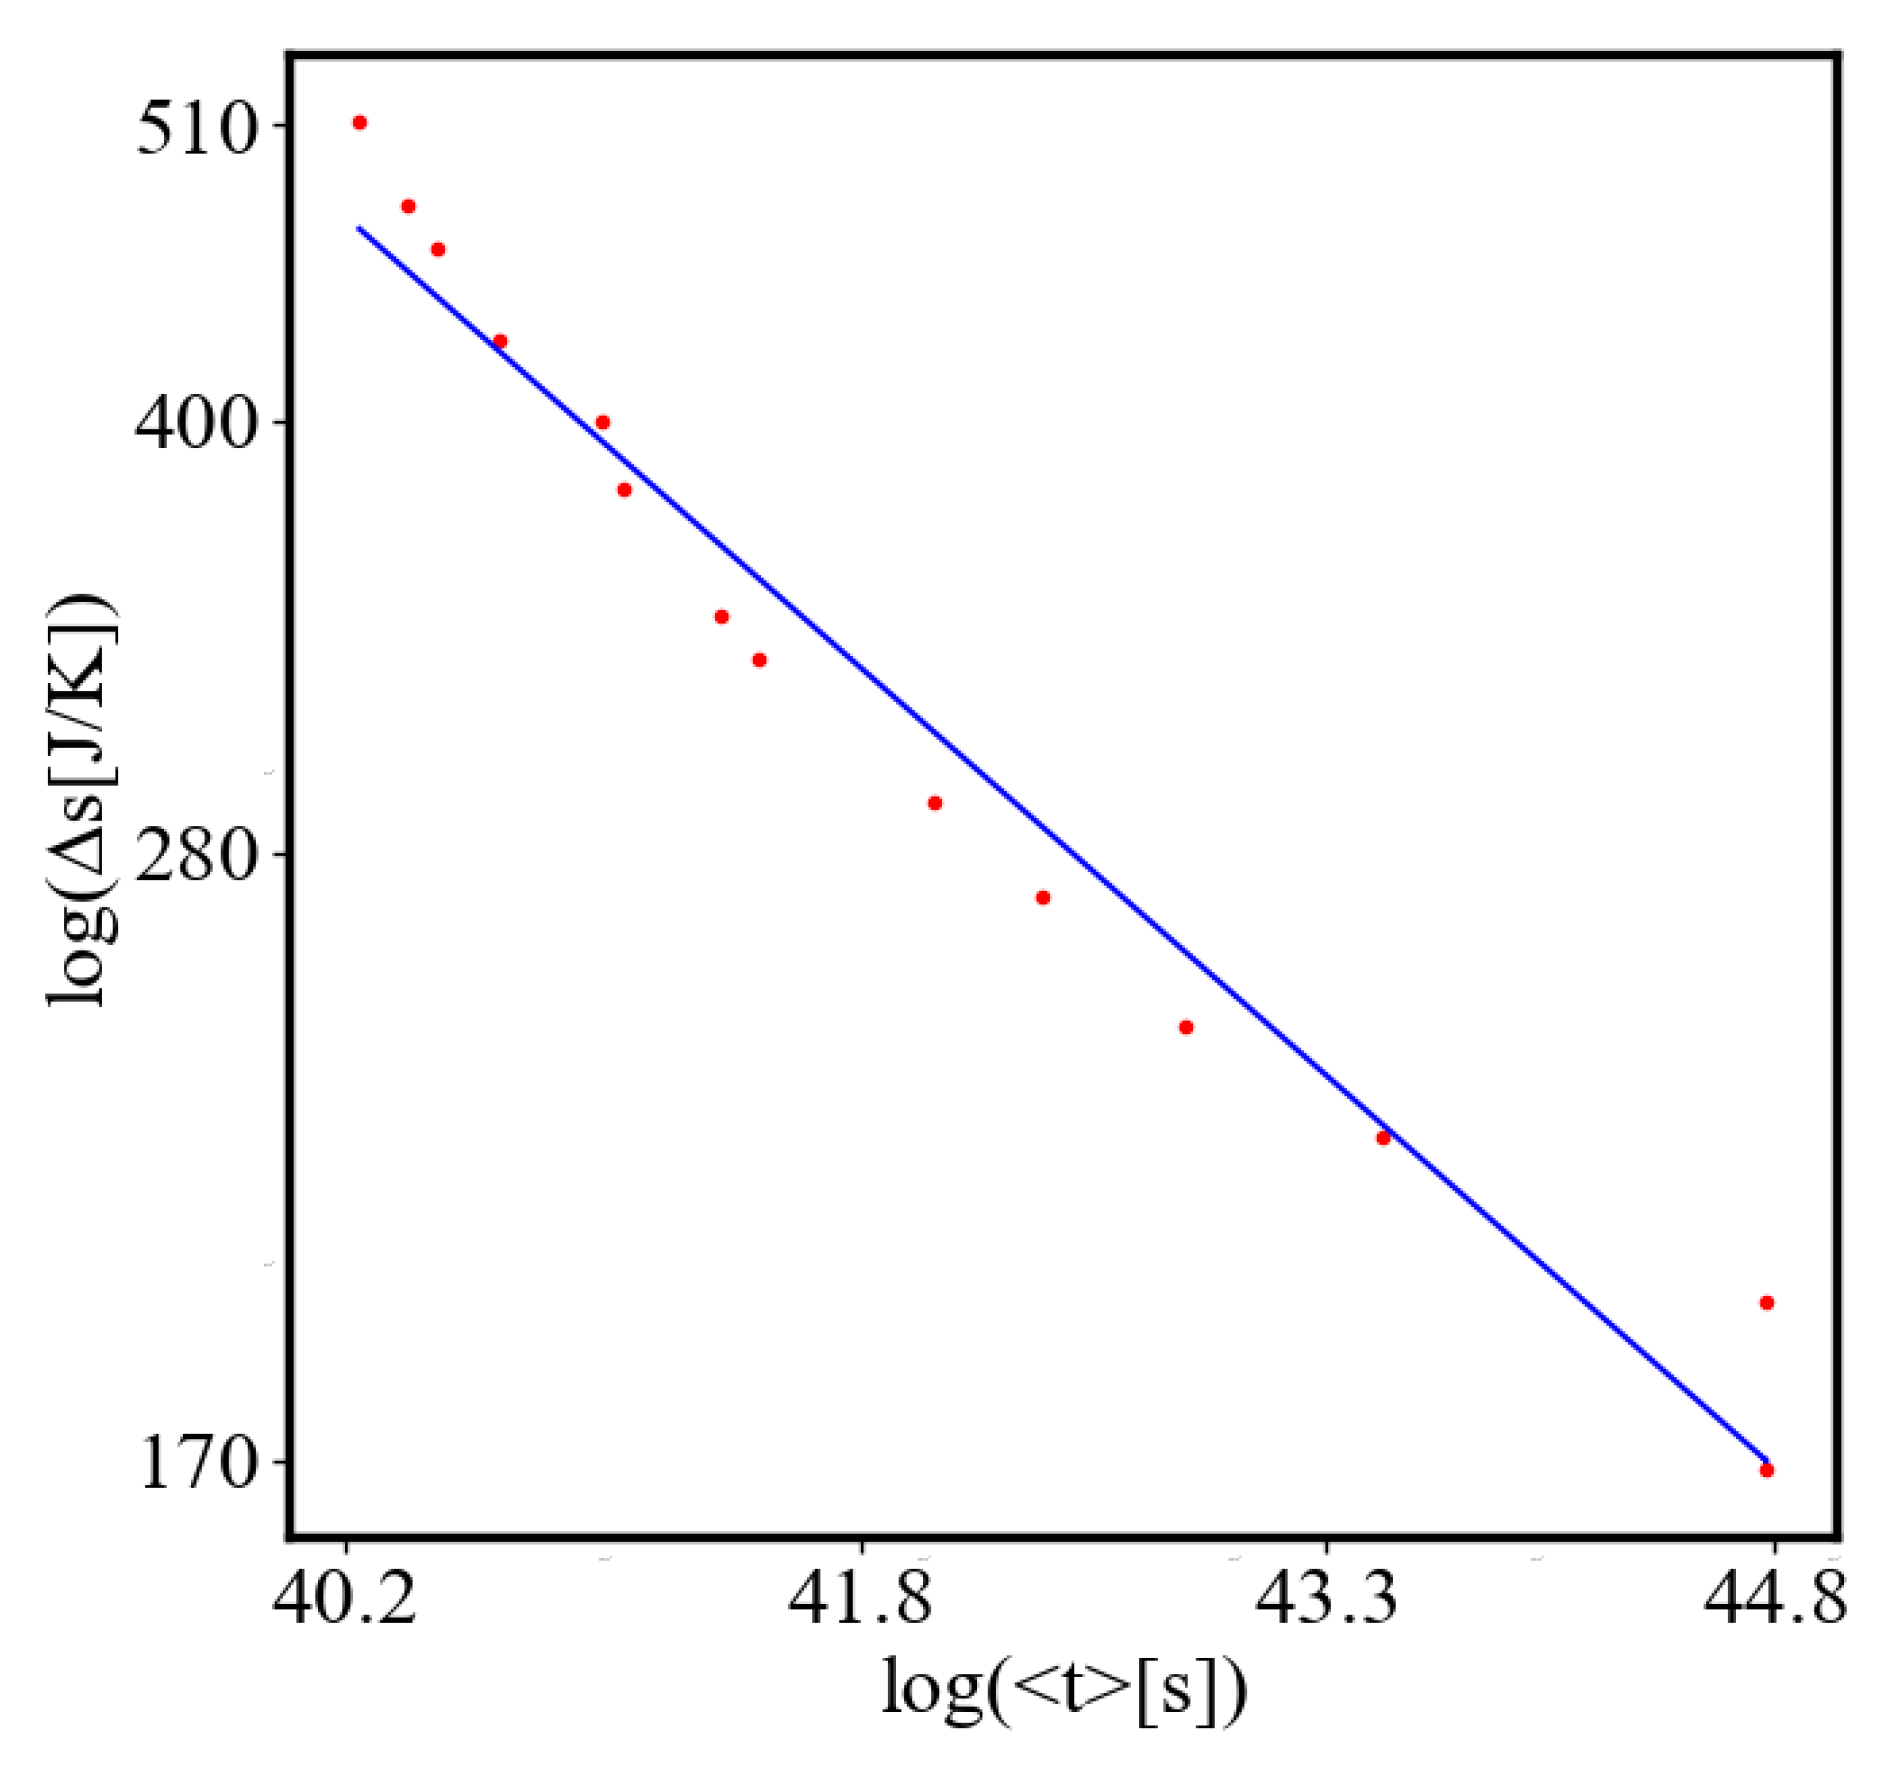
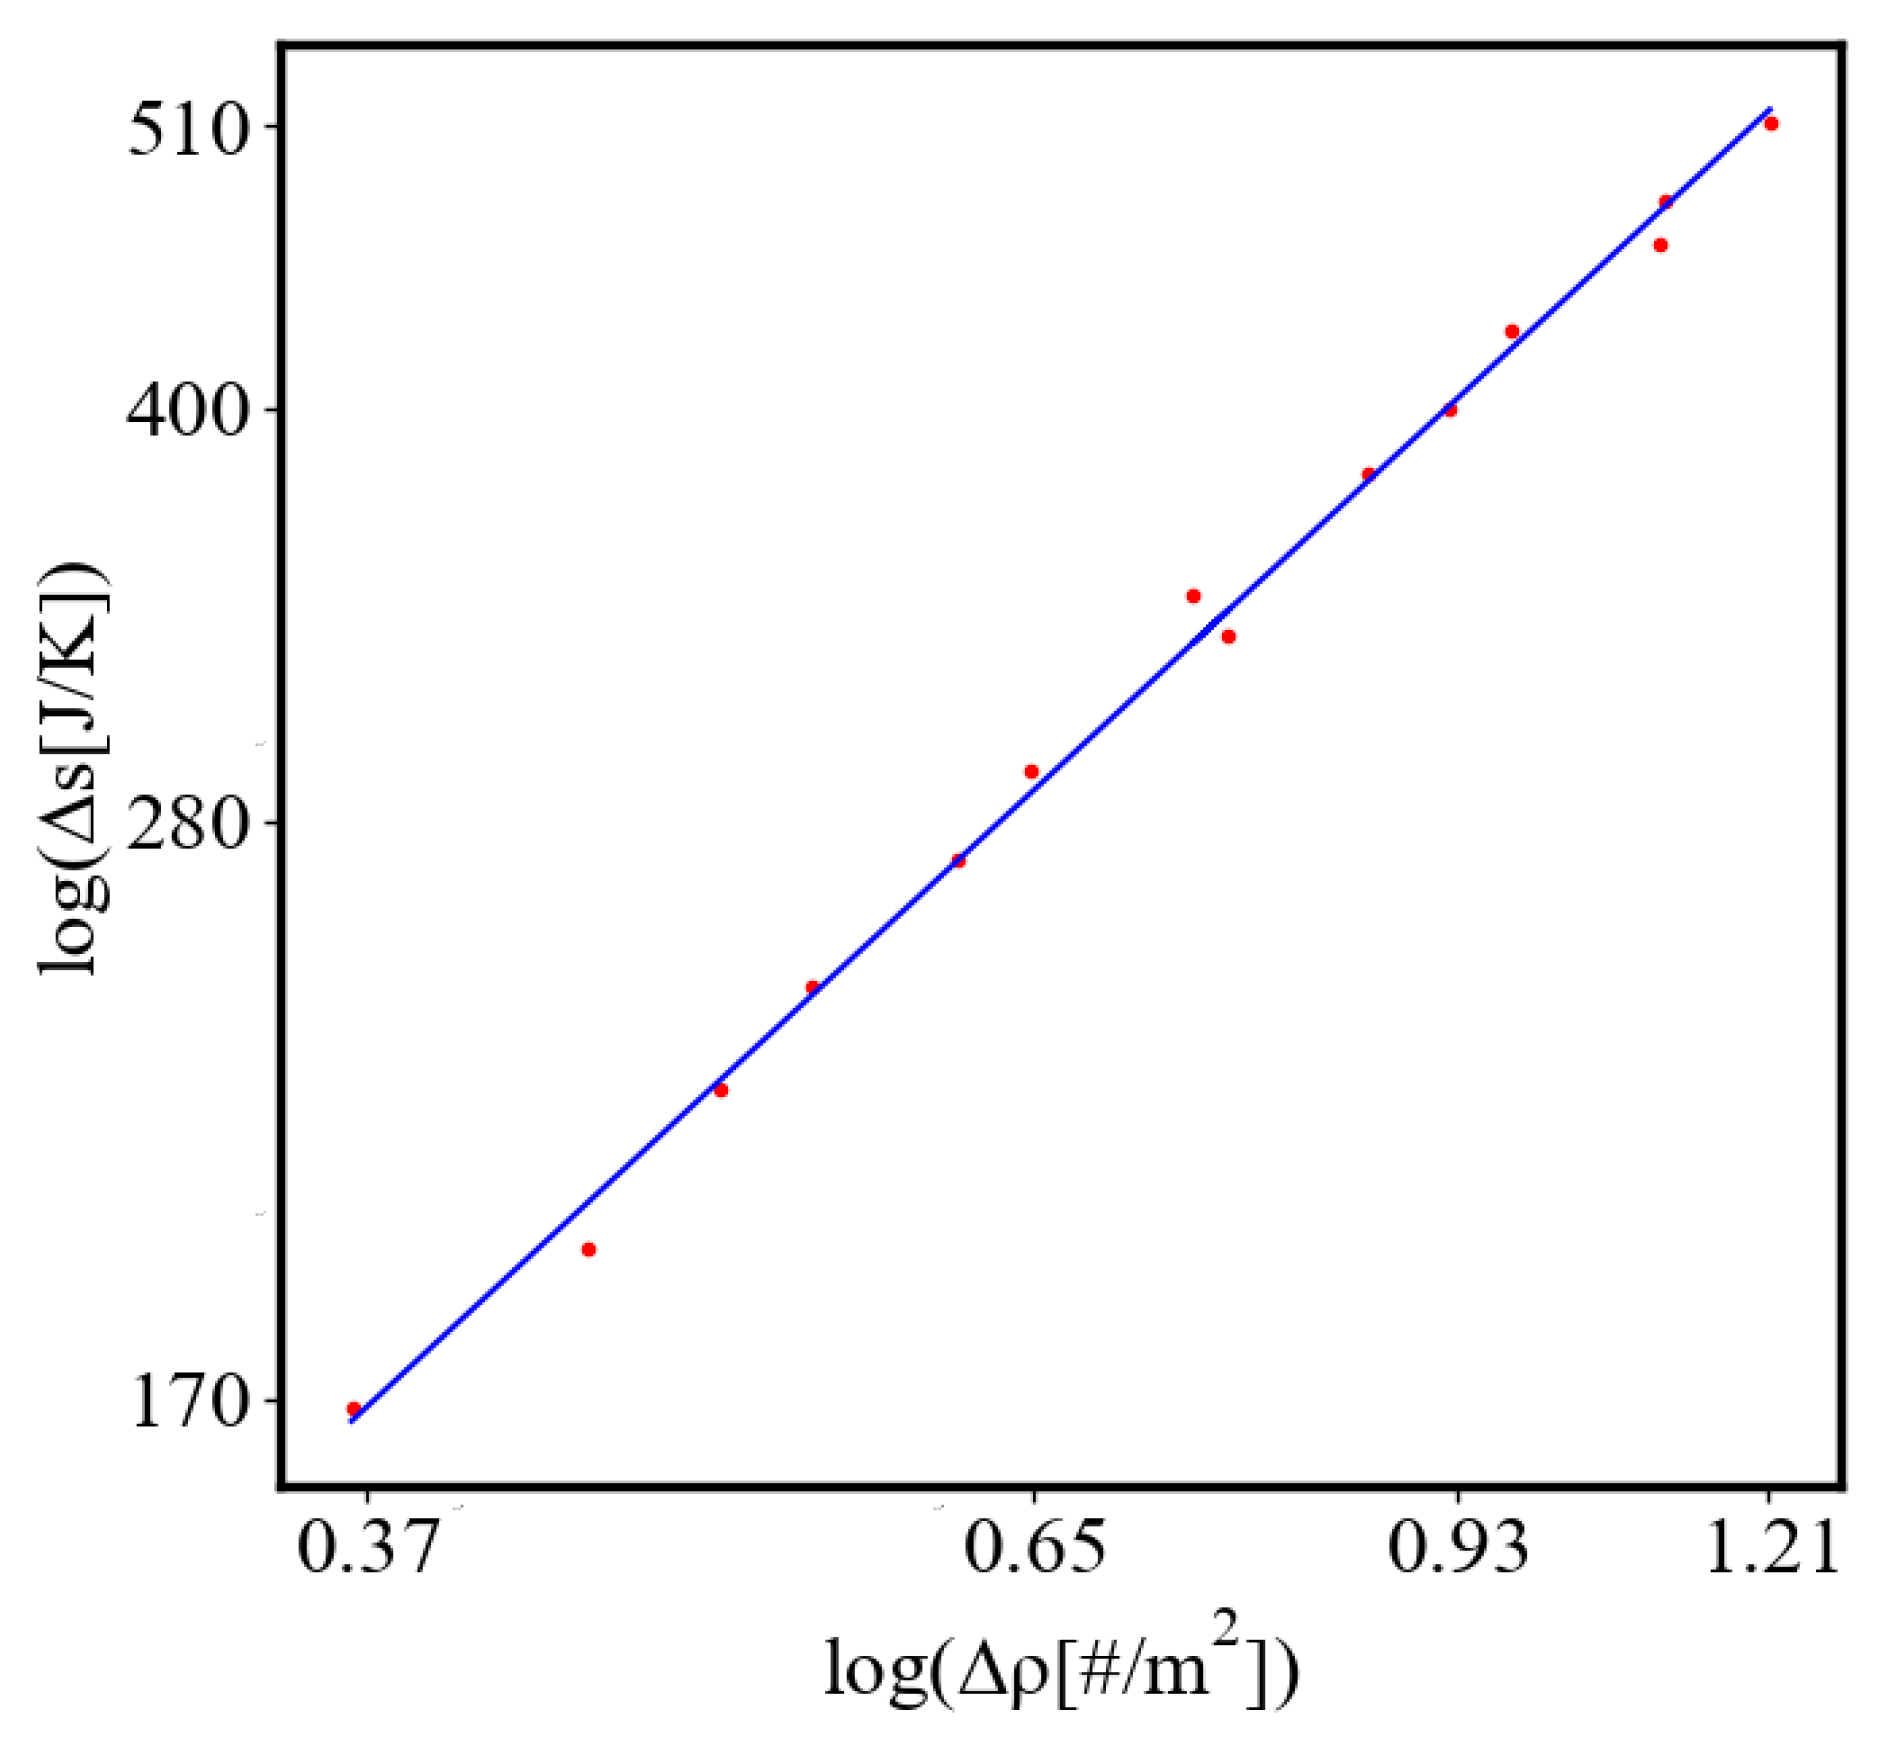
In our data, we see that average unit action, in terms of action efficiency decreases while total action increases Figure 13. Both are related strictly with a power law relationship, predicted by the model of positive feedback between the characteristics of the system.
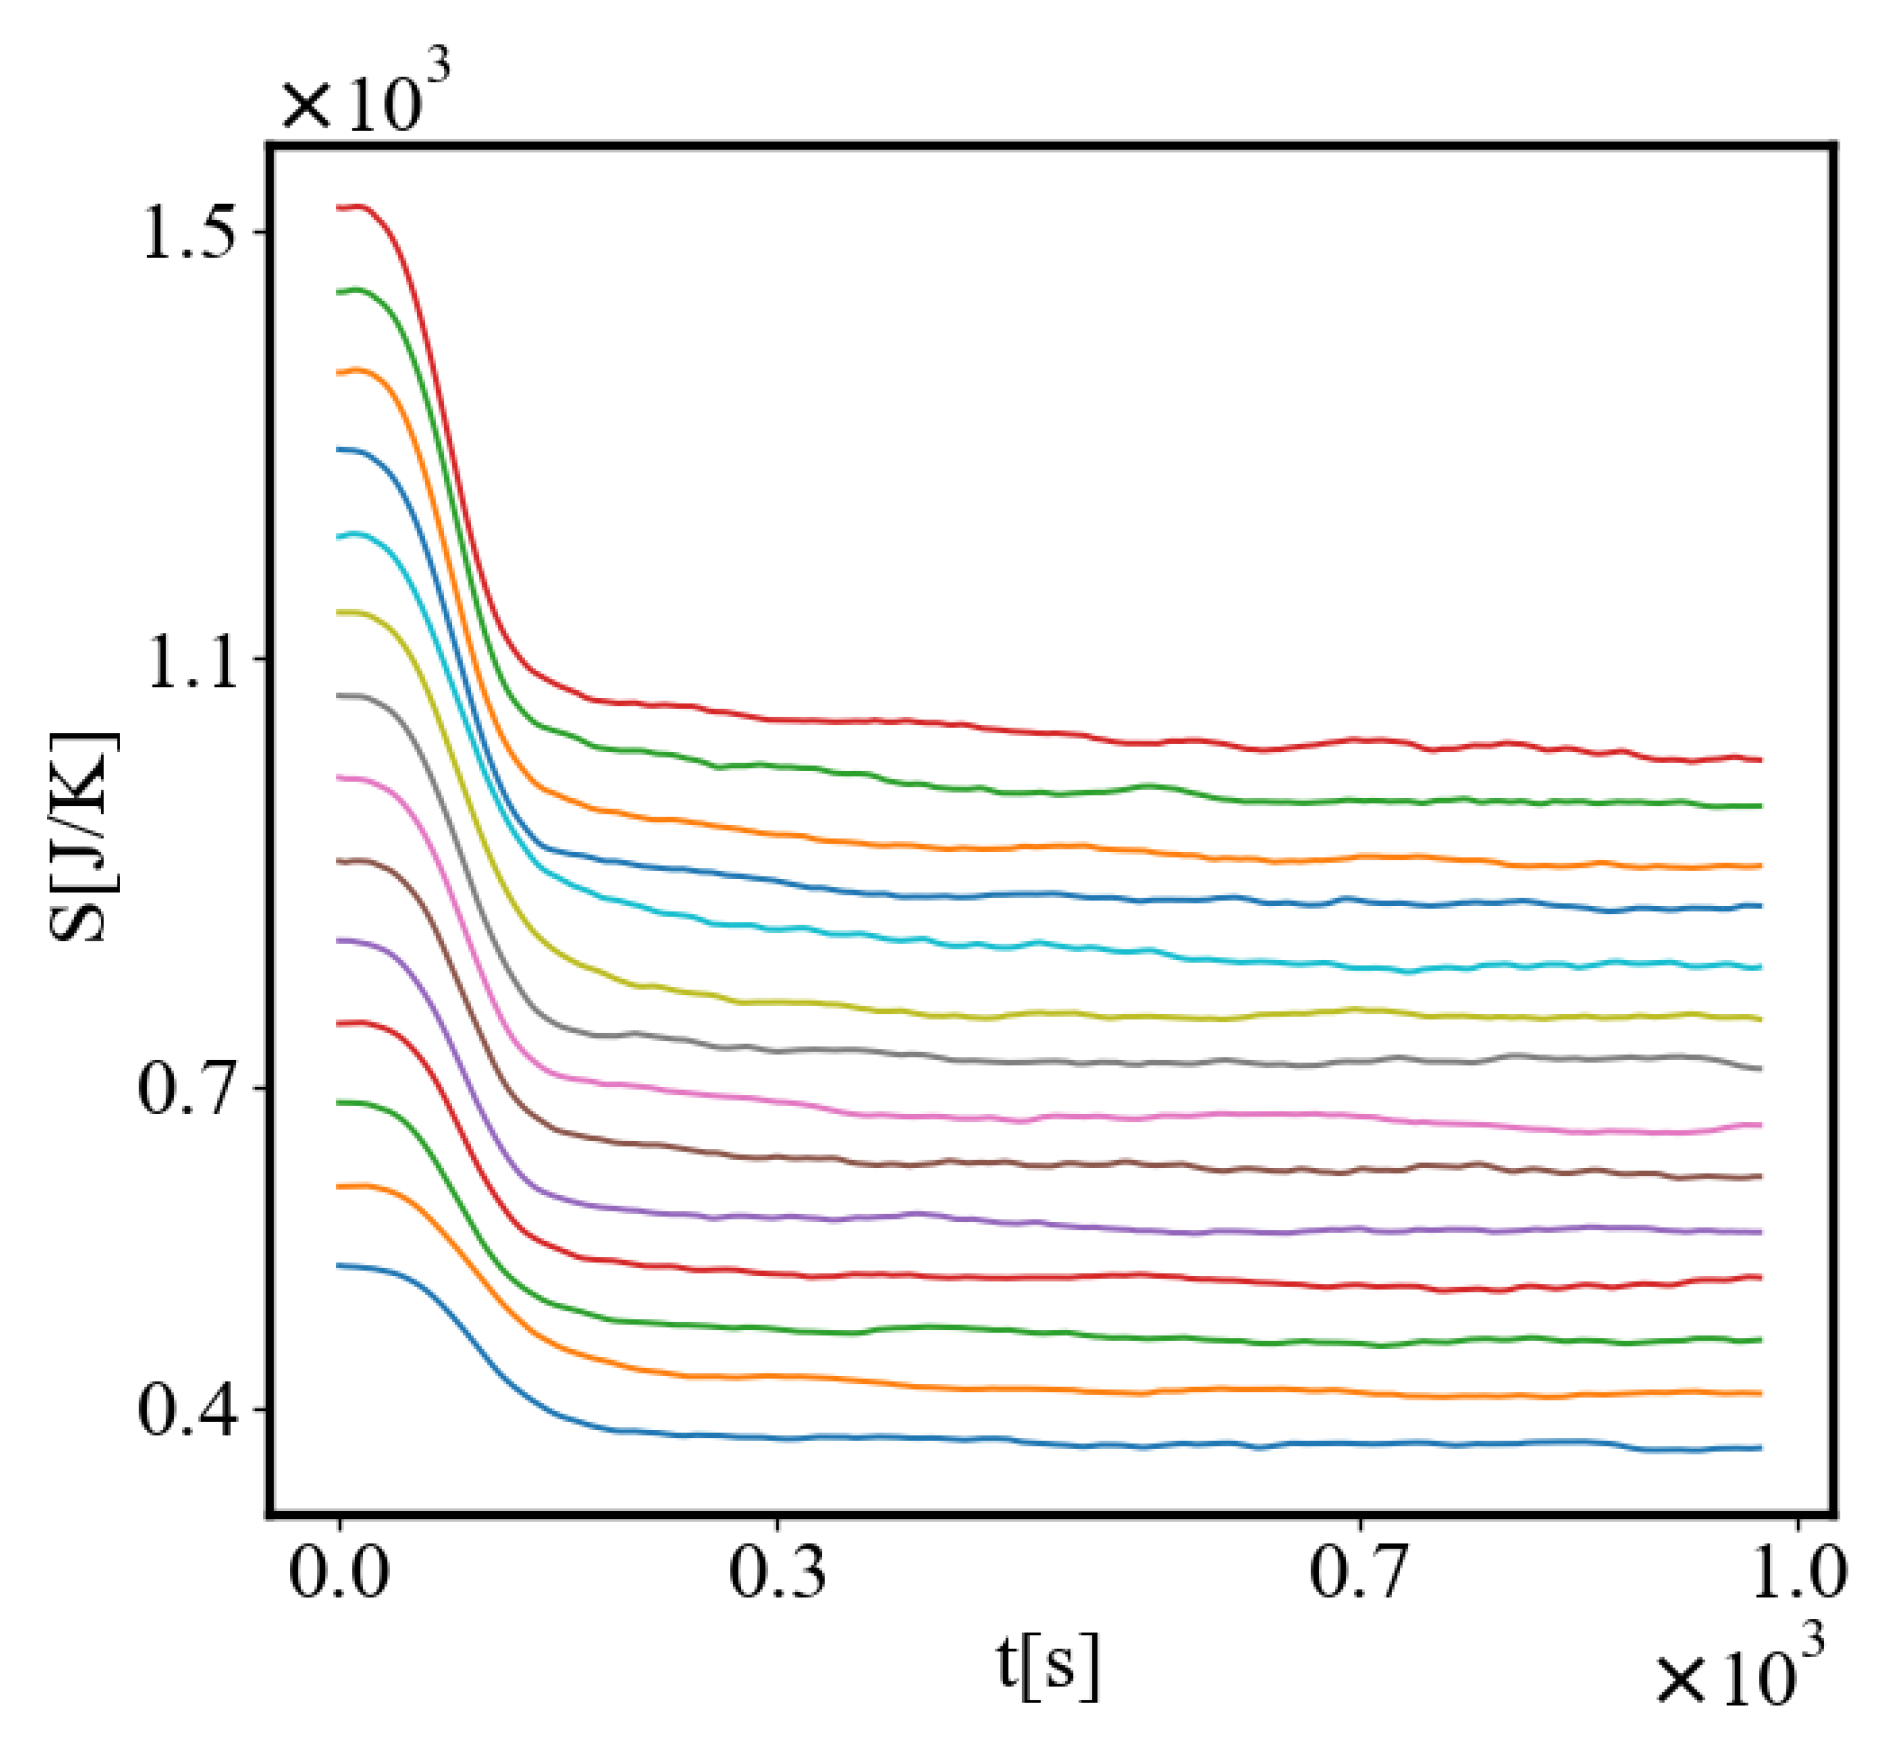
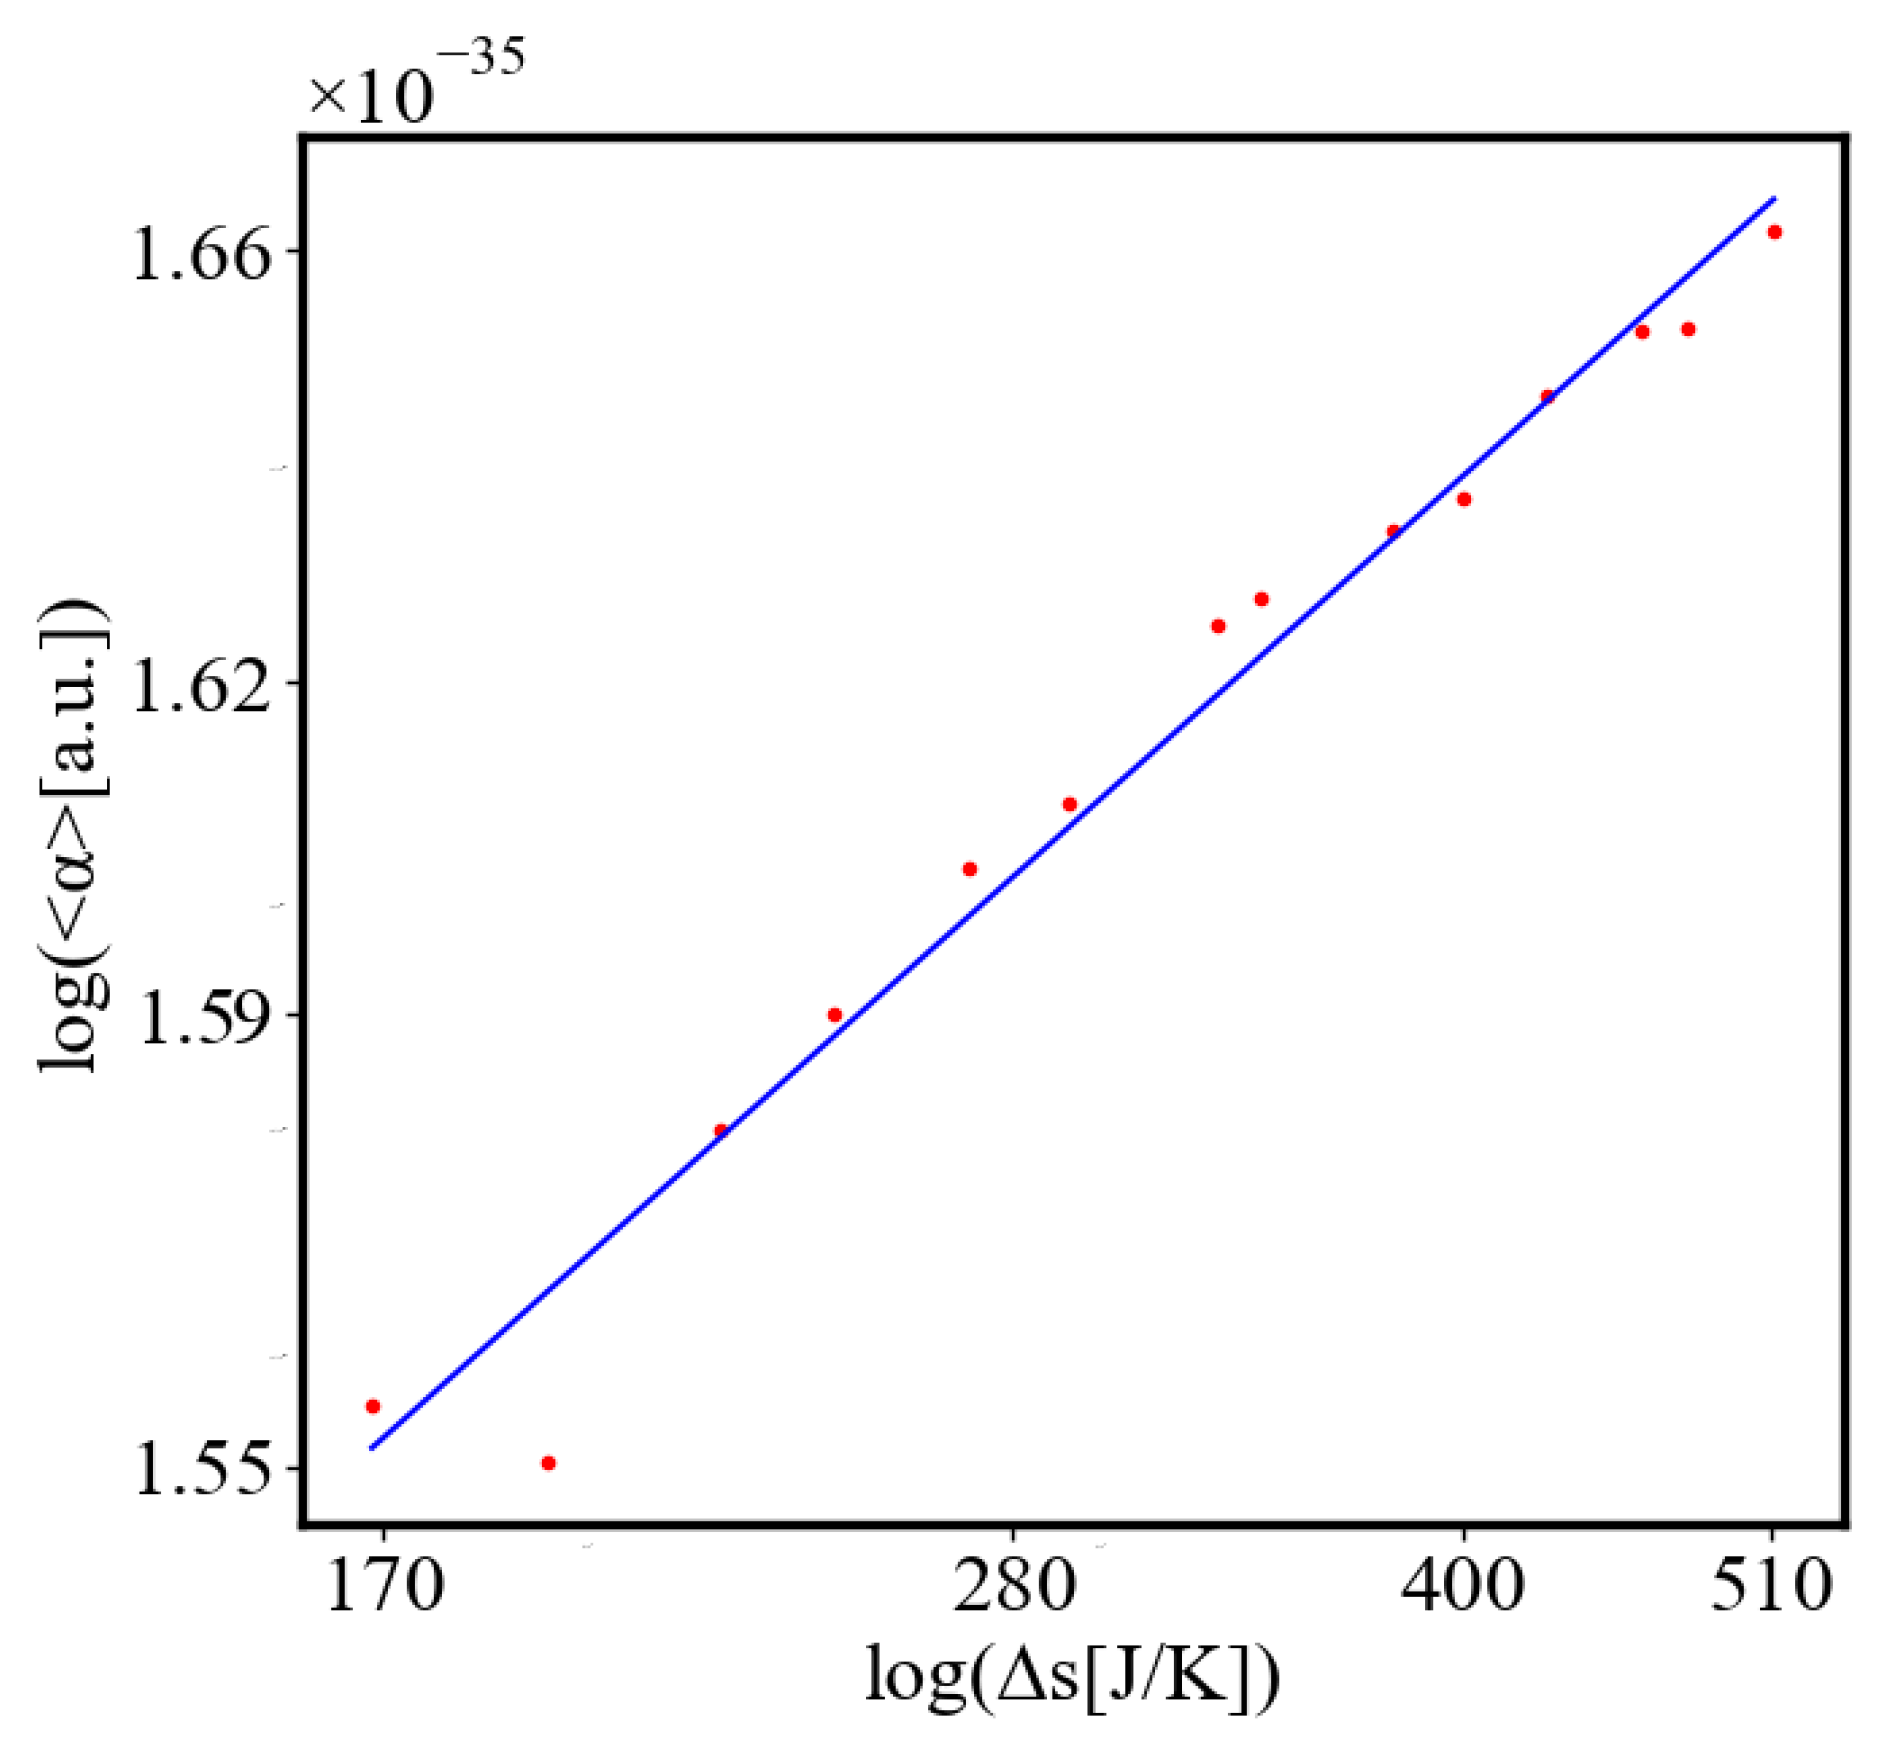
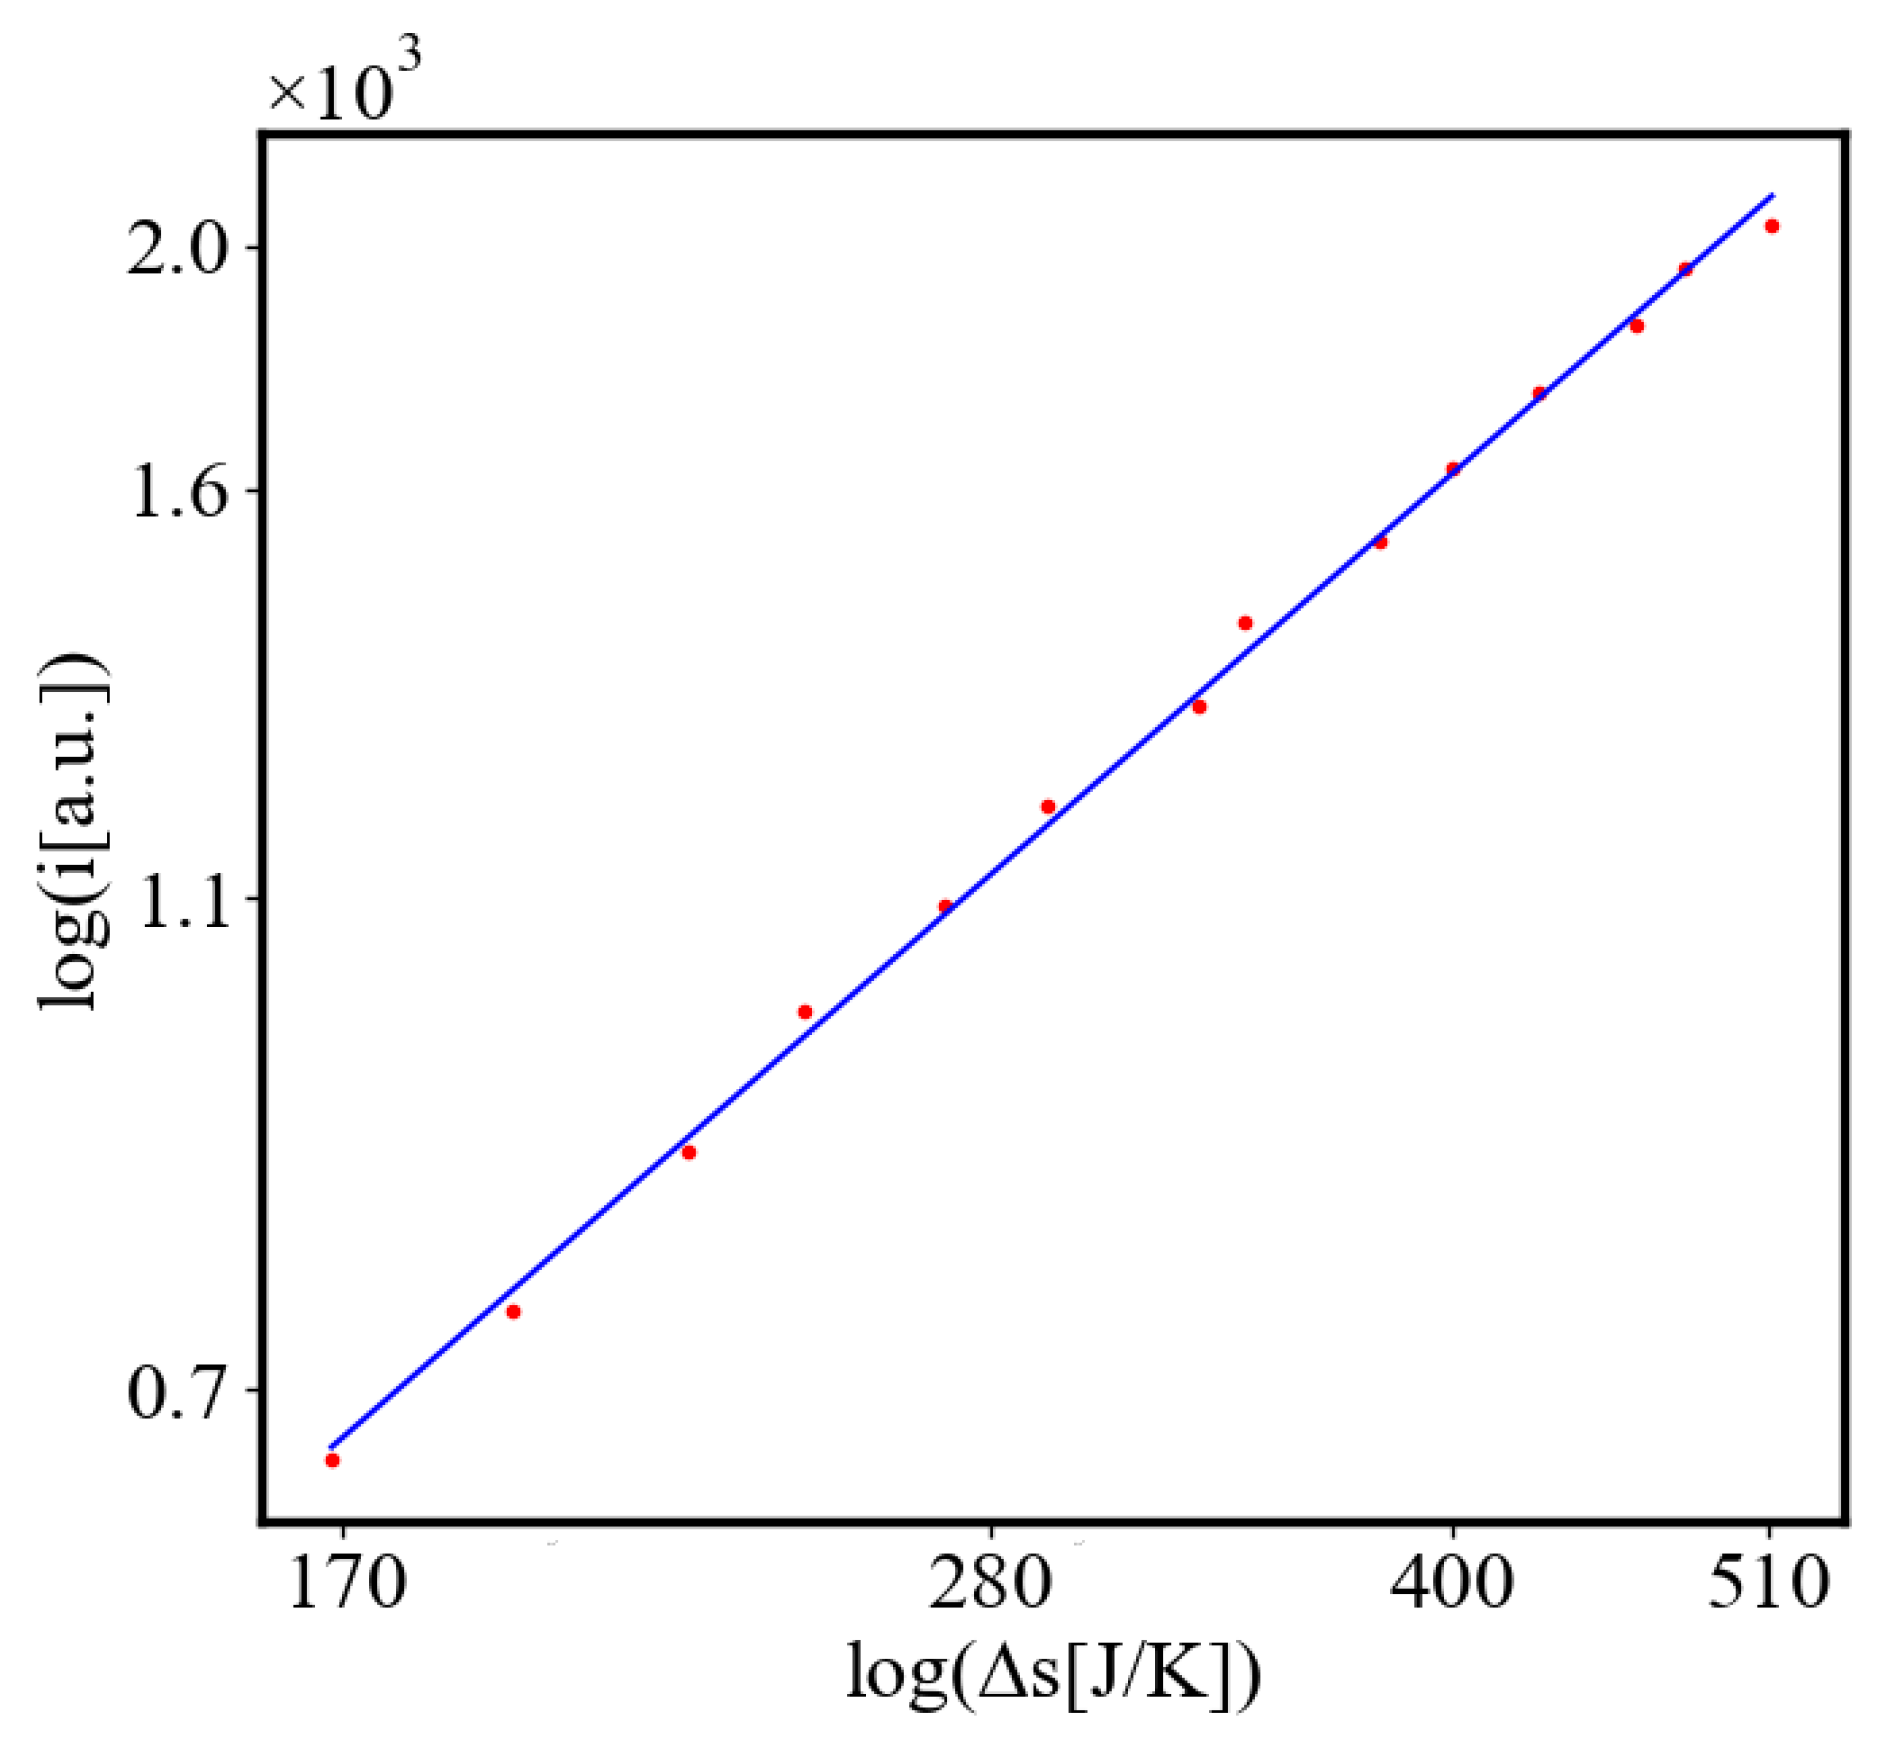
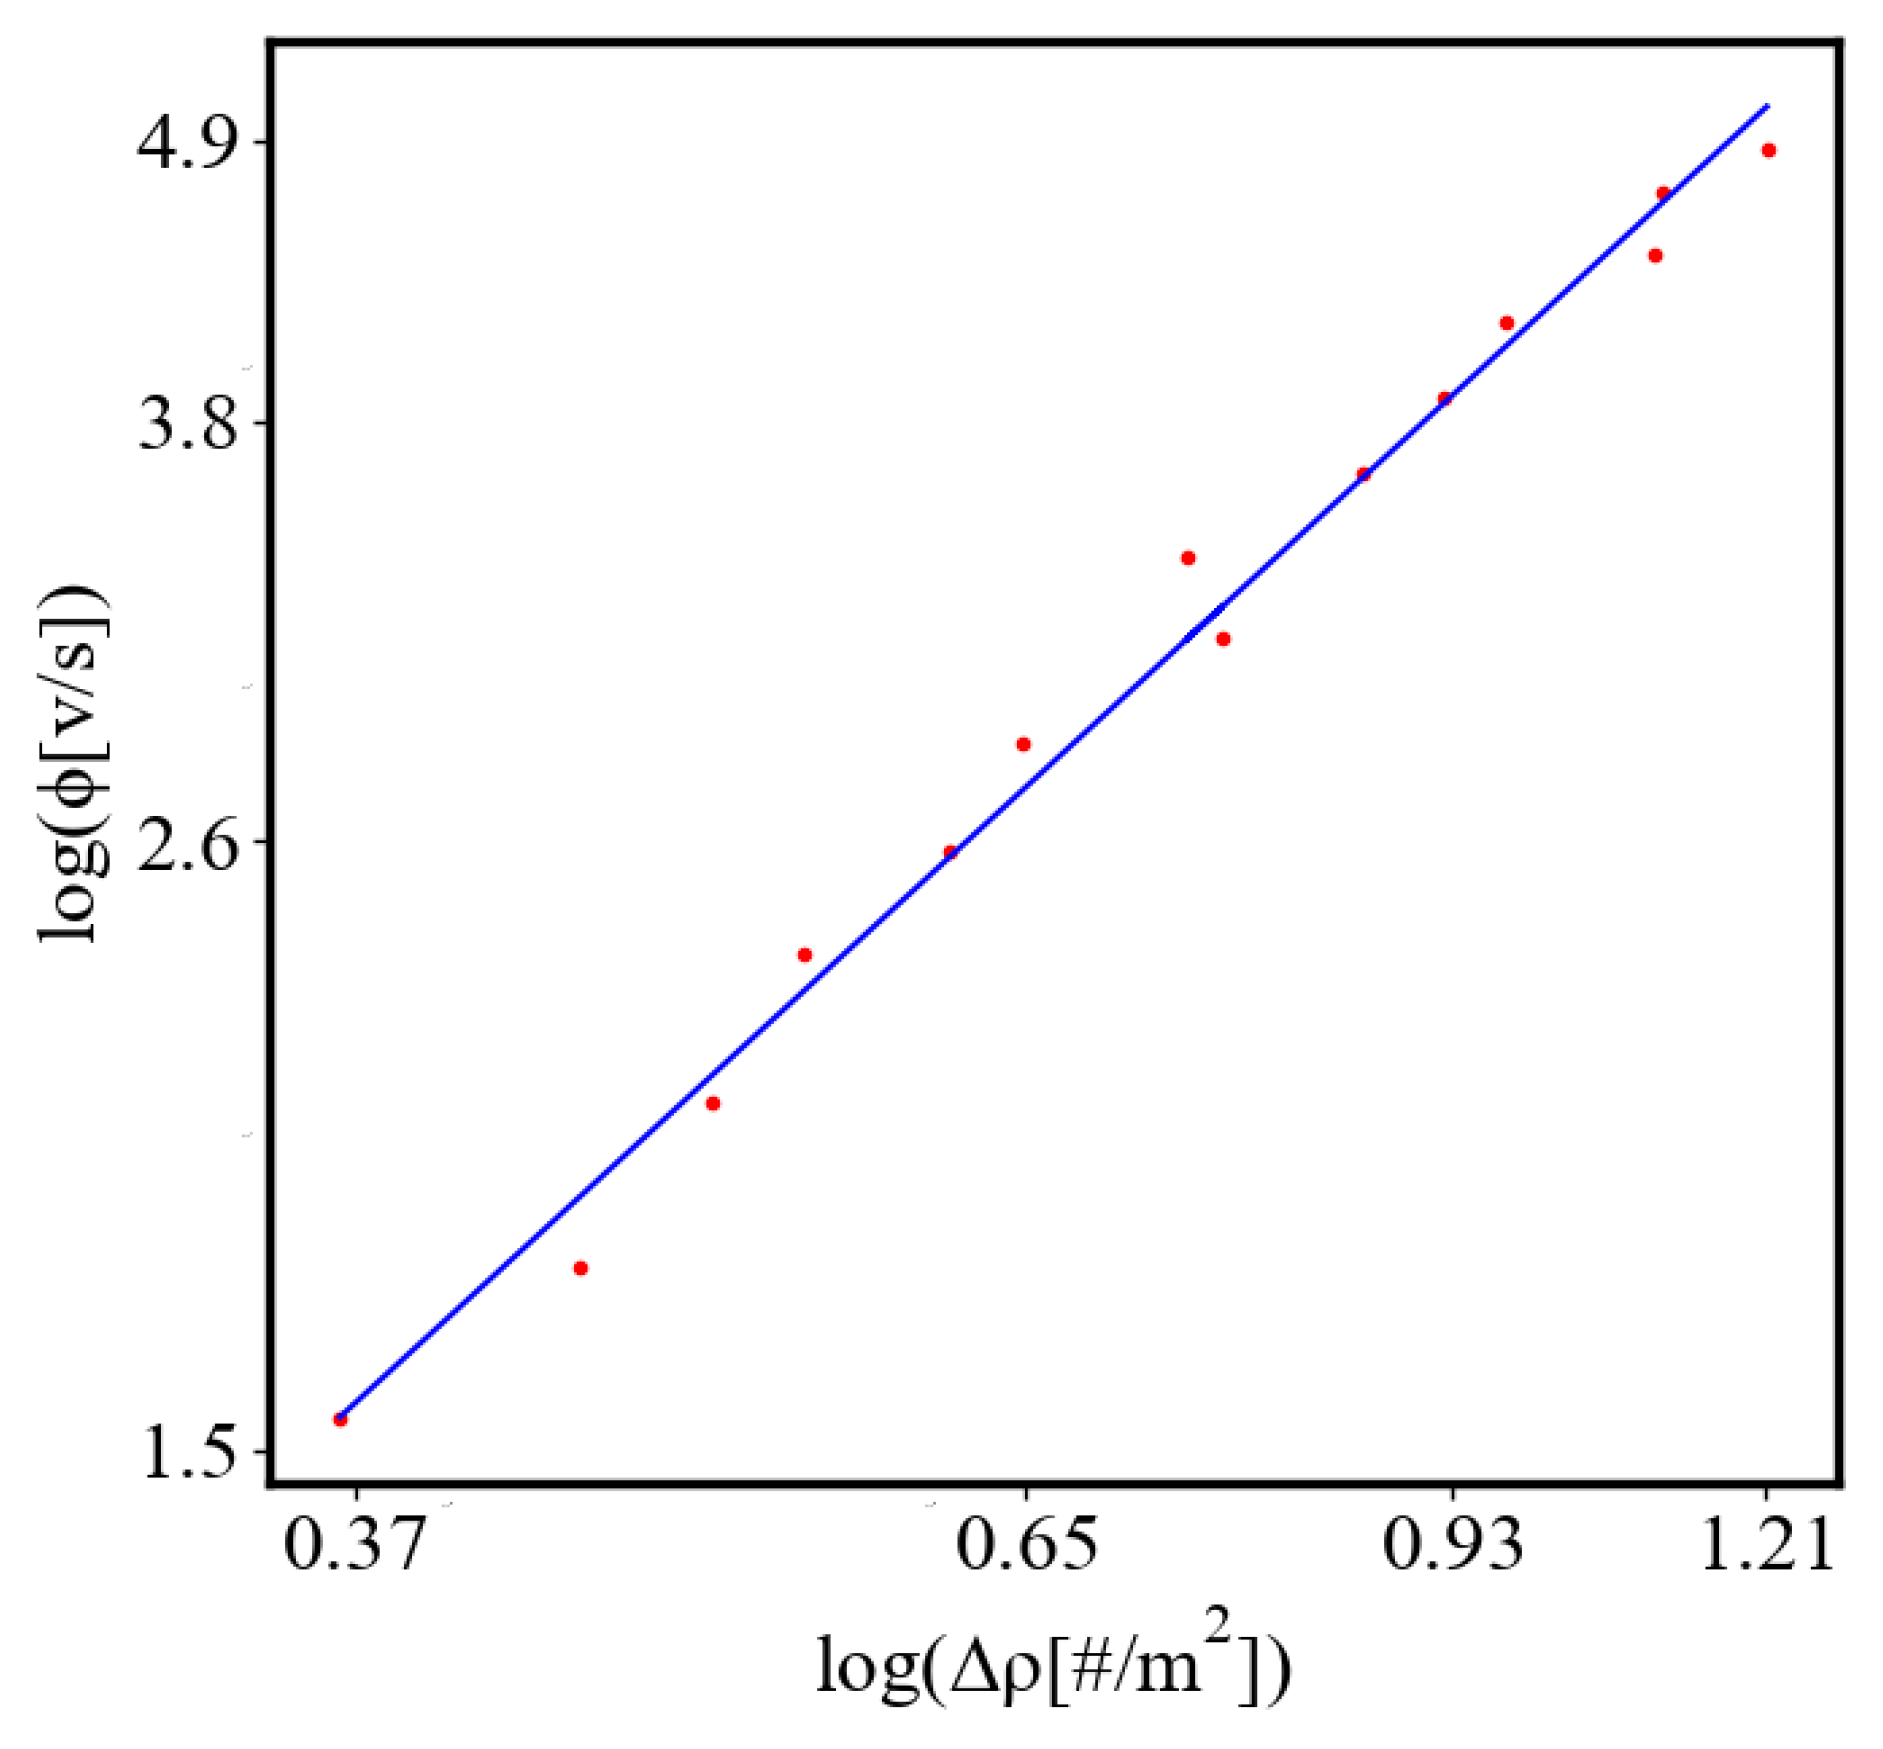
Analogously, unit internal Boltzmann entropy for one path is decreasing while total internal Boltzmann entropy is increasing for a complex system during self-organization and growth Figure 14. These two characteristics are also related strictly to a power law relationship, predicted by the model of positive feedback between the characteristics of the system.
For the Gauss’ principle of least constraint [79] this will translate as the unit constraint (obstacles) for one edge decreases, the total constraints in the network of the whole complex system during self-organization increases as it grows and expands.
For Hertz’s principle of least curvature [34], this will translate as the unit curvature for one edge decreases, the total curvature in the network of the whole complex system during self-organization increases as it grows and expands and adds more nodes.
In future work we are planning to test whether the unit internal entropy production for one trajectory decreases as self-organization progresses, friction, obstacles, distance, and curvature of path decrease, relating it to Prigogine’s principle of minimum internal entropy production [1,2,63], at the same time the total external entropy production is maximized, corresponding to the maximum entropy production principle (MEPP) [41], with a power law relationship.
Some examples of unit-total (local-global) dualism in other systems are: In economies of scale as the size of the system grows, the total production cost increases as the unit cost per one item decreases. In the same example, the total profits increase, but the unit profit per item decreases. Also, as the cost per one computation decreases, the cost for all computations grows. As the cost per one bit of data transmission decreases the cost for all transmissions increases as the system increases. In biology, as the unit time for one reaction in a metabolic autocatalytic cycle decreases in evolution, due to increased enzymatic activity, the total number of reactions in the cycle increases. In ecology, as one species becomes more efficient in finding food, its time and energy expenditure for foraging a unit of food decreases, the numbers of that species increase, and the total amount of food that they collect increases. We can keep naming other unit-total (local-global) dualisms in systems of a very different nature, to test the universality of this principle.

3. Simulations Model

In our simulation, the ants are interacting through pheromones. We can formulate an effective Lagrangian to describe their dynamics. The Lagrangian L depends on the kinetic energy T and the potential energy V. We can start building it slowly by adding necessary terms to the Lagrangian. Given that ants are influenced by pheromone concentrations, the potential energy component should reflect this interaction.
Components of the Lagrangian:
  • Kinetic Energy (T): In our simulation, the ants have a constant mass m, and their kinetic energy is given by:
T = 1 2 m v 2
where v is the velocity of the ant.
  • Effective Potential Energy (V): The potential energy due to pheromone concentration C ( r , t ) at position r and time t can be modeled as:
V = V eff = k C ( r , t )
where k is a constant that scales the influence of the pheromone concentration.
Effective Lagrangian (L): The Lagrangian L is given by the difference between the kinetic and potential energies:
L = T V
For an ant moving in a pheromone field, the effective Lagrangian becomes:
L = 1 2 m v 2 + k C ( r , t )
Formulating the Equations of Motion:
Using the Lagrangian, we can derive the equations of motion via the Euler-Lagrange equation:
d d t L x ˙ i L x i = 0
where x i represents the spatial coordinates (e.g., x , y ) and x ˙ i represents the corresponding velocities.
Example Calculation for a Single Coordinate:
1. Kinetic Energy Term:
L x ˙ = m x ˙
d d t L x ˙ = m x ¨
2. Potential Energy Term:
L x = k C x
The equation of motion for the x-coordinate is then:
m x ¨ = k C x
Full Equations of Motion:
For both x and y coordinates, the equations of motion are:
m x ¨ = k C x
m y ¨ = k C y
The ants are moving following the gradient of the concentration.
Testing for stationary Points of Action:
  • Minimum: If the second variation of the action is positive, the path corresponds to a minimum of the action.
  • Saddle Point: If the second variation of the action can be both positive and negative depending on the direction of the variation, the path corresponds to a saddle point.
  • Maximum: If the second variation of the action is negative, the path corresponds to a maximum of the action.
Determining the Nature of the Stationary Point:
To determine whether the action is a minimum, maximum, or saddle point, we examine the second variation of the action, δ 2 I . This involves considering the second derivative (or functional derivative in the case of continuous systems) of the action with respect to variations in the path.
Given the Lagrangian for ants interacting through pheromones
The action is:
I = t 1 t 2 1 2 m r ˙ 2 + k C ( r , t ) d t
First Variation:
The first variation δ I leads to the Euler-Lagrange equations, which give the equations of motion:
m r ¨ = k C ( r , t )
Second Variation:
The second variation δ 2 I determines the nature of the stationary point. In general, for a Lagrangian L = T V :
δ 2 I = t 1 t 2 δ 2 T δ 2 V d t
Analyzing the Effective Lagrangian:
  • Kinetic Energy Term T = 1 2 m r ˙ 2 : The second variation of the kinetic energy is typically positive, as it involves terms like m ( δ r ˙ ) 2 .
  • Potential Energy Term V eff = k C ( r , t ) : The second variation of the effective potential energy depends on the nature of C ( r , t ) . If C is a smooth, well-behaved function, the second variation can be analyzed by examining 2 C .
Nature of the Stationary Point:
  • Kinetic Energy Contribution: Positive definite, contributing to a positive second variation.
  • Effective Potential Energy Contribution: Depends on the curvature of C ( r , t ) . If C ( r , t ) has regions where its second derivative is positive, the effective potential energy contributes positively, and vice versa.
Therefore, given the typical form of the Lagrangian and assuming C ( r , t ) is well-behaved (smooth and not overly irregular), the action I is most likely a saddle point. This is because:
  • The kinetic energy term tends to make the action a minimum.
  • The potential energy term, depending on the pheromone concentration field, can contribute both positively and negatively.
Thus, variations in the path can lead to directions where the action decreases (due to the kinetic energy term) and directions where it increases (due to the potential energy term), characteristic of a saddle point.
Incorporating factors such as the wiggle angle of ants and the evaporation of pheromones introduces additional dynamics to the system, which can affect whether the action remains stationary, a saddle point, a minimum, or a maximum. Here’s how these changes influence the nature of the action:

3.0.1. Effects of Wiggle Angle and Pheromone Evaporation on the Action

1. Wiggle Angle: Impact: The wiggle angle introduces stochastic variability into the ants’ paths. This randomness can lead to fluctuations in the paths that ants take, affecting the stability and stationarity of the action. Mathematical Consideration: The additional term representing the wiggle angle’s variance in the Lagrangian adds a stochastic component, P ( θ , t ) :
L = 1 2 m v 2 + k C ( r , t ) + P ( θ , t )
Where P ( θ , t ) = σ 2 ( θ ) · η ( t ) . The variance in the wiggle angle θ is σ 2 ( θ ) , and η ( t ) is a random function of time that introduces variability into the system.
This term will then influence the dynamics by adding random fluctuations at each time step, making the effect of noise vary over time rather than being a constant shift.
Consequence: The action is less likely to be strictly stationary due to the inherent variability introduced by the wiggle angle. This can lead to more dynamic behavior in the system.
2. Pheromone Evaporation: Impact: Pheromone evaporation reduces the concentration of pheromones over time, making previously attractive paths less so as time progresses. Mathematical Consideration: Including the evaporation term in the Lagrangian:
L = 1 2 m v 2 + k C ( r , t ) e λ t
Consequence: The time-dependent decay of pheromones means that the action integral changes dynamically. Paths that were optimal at one point may no longer be optimal later, leading to continuous adaptation.

3.1. Considering the Nature of the Action

Given these modifications, the nature of the action can be characterized as follows:
1. Stationary Action:
  • Before Changes: In a simpler model without wiggle angles and evaporation, the action might be stationary at certain paths.
  • After Changes: With wiggle angle variability and pheromone evaporation, the action is less likely to be stationary. Instead, the system continuously adapts, and the action varies over time.
2. Saddle Point, Minimum, or Maximum:
  • Saddle Point: The action is likely to be at a saddle point due to the dynamic balancing of factors. The system may have directions in which the action decreases (due to pheromone decay) and directions in which it increases (due to path variability).
  • Minimum: If the system stabilizes around a certain path that balances the stochastic wiggle and the decaying pheromones effectively, the action might approach a local minimum. However, this is less likely in a highly dynamic system.
  • Maximum: It is unusual for the action in such optimization problems to represent a maximum because that would imply an unstable and inefficient path being preferred, which is contrary to observed behavior.

3.1.1. Practical Implications

1. Continuous Adaptation: The system will require continuous adaptation to maintain optimal paths. Ants need to frequently update their path choices based on the real-time state of the pheromone landscape.
2. Complex Optimization: Optimization algorithms must account for the random variations in movement, the rules for deposition and diffusion, and the temporal decay of pheromones. This means more sophisticated models and algorithms are necessary to predict and find optimal paths.
Therefore, incorporating the wiggle angle and pheromone evaporation into the model makes the action more dynamic and less likely to be strictly stationary. Instead, the action is more likely to exhibit behavior characteristic of a saddle point, with continuous adaptation required to navigate the dynamic environment. This complexity necessitates advanced modeling and optimization techniques to accurately capture and predict the behavior of the system, which will be explored in future work.

3.2. Dynamic Action

For dynamical non-stationary action principles, we can extend the classical action principle to include time-dependent elements. The Lagrangian is changing during the motion of an agent between the nodes as the terms in it are changing.
1. Time-Dependent Lagrangian that explicitly depends on time or other dynamic variables:
L = L ( q , q ˙ , t , λ ( t ) )
where ( q ) represents the generalized coordinates, ( q ˙ ) their time derivatives, ( t ) time, and ( λ ( t ) ) a set of dynamically evolving parameters.
2. Dynamic Optimization - the system continuously adapts its trajectory q(t) to minimize or optimize the action that evolves over time:
I = t 1 t 2 L ( q , q ˙ , t , λ ( t ) ) d t
The parameters λ ( t ) are updated based on feedback from the system’s performance. The goal is to find the path q ( t ) that makes the action stationary. However, since λ ( t ) is time-dependent, the optimization becomes dynamic.

3.2.1. Euler-Lagrange Equation

To find the stationary path, we derive the Euler-Lagrange equation from the time-dependent Lagrangian. For a Lagrangian L ( q , q ˙ , t , λ ( t ) ) , the Euler-Lagrange equation is:
d d t L q ˙ L q = 0
However, due to the dynamic nature of λ ( t ) , additional terms may need to be considered.

3.2.2. Updating Parameters λ ( t )

The parameters λ ( t ) evolve based on feedback from the system’s performance. This feedback mechanism can be modeled by incorporating a differential equation for λ ( t ) :
d λ ( t ) d t = f ( λ ( t ) , q ( t ) , q ˙ ( t ) , t )
Here, f represents a function that updates λ ( t ) based on the current state q ( t ) , the velocity q ˙ ( t ) , and possibly the time t. The specific form of f depends on the nature of the feedback and the system being modeled.

3.2.3. Practical Implementation

In our example of ants with a wiggle angle and pheromone evaporation. The effective Lagrangian will look like this with all of the terms defined earlier:
L = 1 2 m v 2 + k C ( r , t ) e λ ( t ) t + P ( θ , t )
The action I would be:
I = t 1 t 2 1 2 m v 2 + k C ( r , t ) e λ ( t ) t + P ( θ , t ) d t
Dynamical System Adaptation:
The system adapts by updating λ ( t ) based on the current state of pheromones and the ants’ paths.
Clarification: It is important to emphasize that in our formalism, the potential energy V is negative of the pheromone concentration. This means that as ants move up pheromone gradients—toward higher concentrations—they are moving toward lower potential energy. This movement is analogous to gravitational free fall, where objects move downward toward regions of lower gravitational potential energy. In both cases, while moving toward lower potential energy influences the ants’ motion, the reduction of the action along the trajectory depends on the balance between the kinetic and potential energy contributions. The principle of least action involves finding the path that minimizes the total action, accounting for both energies over the entire trajectory.
Including the discussed above effects on the concentration:
V = V eff ( r , t ) = k C ( r , t ) e λ ( t ) t
then:
I = t 1 t 2 1 2 m v 2 V eff ( r , t ) + P ( θ , t ) d t
This equation explicitly shows the form of the action necessary for the Hamilton’s principle. This formulation allows us to utilize the principle of least action, which states that the actual path taken by the system between two configurations is the one that makes the action stationary (typically minimizing it). In our model, this means that ants move along trajectories that minimize the action, influenced by both their kinetic energy and the potential energy derived from the pheromone concentration and the wiggle angle random term.

3.2.4. Solving the Equations

  • Numerical Methods: Usually, these systems are too complex for analytical solutions, so numerical methods (e.g., finite difference methods, Runge-Kutta methods) are used to solve the differential equations governing q ( t ) and λ ( t ) .
  • Optimization Algorithms: Algorithms like gradient descent, genetic algorithms, or simulated annealing can be used to find optimal paths and parameter updates.
By extending the classical action principle to include time-dependent and evolving elements, we can model and solve more complex, dynamic systems. This framework is particularly useful in real-world scenarios where conditions change over time, and systems must adapt continuously to maintain optimal performance. Extending this approach can make it applicable in physical, chemical, and biological systems, and in fields such as robotics, economics, and ecological modeling, providing a powerful tool for understanding and optimizing dynamic, non-stationary systems.
The Lagrangian changes at each time step of the simulation, therefore we cannot talk about static action, but a dynamic action. This is dynamic optimization and reinforcement learning.
The average action is quasi-stationary, as is fluctuates around a fixed value, but, internally, each trajectory which it is composed of is fluctuating stochastically given the dynamic Lagrangian of each ant. It still fluctuates around the shortest theoretical path, so the average action is minimized far from the stationary path, even though close to the minimum it can be stuck in a neighboring stationary action path temporarily. In all these situations, as described above, the average action efficiency is our measure for organization.

3.3. Specific Details in Our Simulation

For our simulation the details of the concentration changes at each patch C ( r , t ) at each update are the sum of three contributions and can be included as:
1. C i , j ( t ) is the preexisting amount of pheromone at each patch at time t.
2. Pheromone Diffusion: The changes of the pheromone at each patch at time t, are described by the rules of the simulation: 70% of the pheromone is split between all 8 neighboring patches on each tick, regardless of how much pheromone is in that patch, which means that 30% of the original amount is left in the central patch. On the next tick, 70% of those remaining 30% will diffuse again. At the same time, using the same rule, pheromone is distributed from all 8 neighboring ants to the central one. Note: this rule for diffusion does not follow the diffusion equations in physics, where there is always flow from high concentration to low.
C i , j ( t + 1 ) = 0.3 C i , j ( t ) + 0.7 8 k , l = 1 1 C i + k , j + l ( t )
where | k | + | l | 0
The first term in the equation shows how much of the concentration of the pheromone from the previous time step is left in the next, and the second term shows the incoming pheromone from all neighboring patches, as 70% 1/8 of each concentration is distributed to the central one.
3. The amount of pheromone an ant deposits after n steps can be expressed as:
P ( n ) = 1 10 P ( 0 ) ( 0.9 ) n
Where P ( 0 ) = 30
The stochastic term, P ( θ , t ) depends on the ( σ 2 ( θ ) ), which is the variance of a uniform distribution and for the parameters in this simulation, is [80]
σ 2 ( θ ) = 50 2 12

3.4. Gradient Based Approach

We can use either the concentration’s value or the concentration gradient in the potential energy term. Using the gradient is a more exact approach but even more computationally intensive.
In further extension of the model, we can incorporate a gradient-based potential energy term. In this case, the concentration-dependent term is: k C ( r , t ) instead of k C ( r , t ) and the Lagrangian becomes:
L = 1 2 m v 2 + k C ( r , t ) e λ ( t ) t + P ( θ , t )
Note: In this simulation, we are considering only internal potential in the system. In future work, we will investigate how different environments will affect the Lagrangian. Therefore, we do not claim a general validity of the method at this point. This is the first step in developing this formalism. While the analogy provides valuable insights, real systems often require more complex models.

3.5. Summary

1. We obtained the Lagrangian with the exact parameters for the specific current simulation that produced the data. Up to our current knowledge, we don’t know of other studies that have published the Lagrangian approach to agent-based simulations of ants.
2. The Lagrangian is impossible to solve analytically, to our current knowledge, due to the stochastic term. Also, the equation for the concentration of pheromones is at a given patch, but the equation for the amount deposited by the ants depends on how many steps, n, they have taken since they visited the food or nest. Each ant has a different path, so n in the equation will be different for each ant and it will be depositing a different amount of pheromones. This in general cannot be done analytically, it is dependent on the stochastic paths of each ant, therefore one way to solve it is numerically through the simulation. Also, in the equation, the concentration is for each patch i,j. We solve it numerically through the simulation.
3. The average path length obtained from the simulation serves as a numerical solution to the Action because it results from the model that incorporates all the dynamics described by the Lagrangian. This path length reflects the optimization and behaviors modeled by the Lagrangian terms, including kinetic energy, potential energy influenced by pheromone concentrations, and stochastic movement. The simulation uses the reciprocal of the average path length as the average action efficiency. This takes into account the overall effects on the Lagrangian in this simulation. This approach can be extended further with more terms in the Lagrangian corresponding to more realistic situations, such as dissipation and influence of additional effects and interactions between the agents. The agents can be allowed to accelerate proportional to the concentration gradients, which can be a case in modeling of other systems.
4. The average action could be stationary close to the theoretically shortest path, i.e. near the minimum of the average action, but further away from it it is always minimized, experimentally and from theoretical considerations. In the simulation, it is measured that longer paths always decay to shorter paths. There can only be some deviations very close to the shortest path due to memory effects and stochastic reasons which will decay with longer annealing and changing parameters such as exploration by increasing the wiggle angle, changing the pheromone deposition, diffusion and evaporation rates, changing the speed and mass of the ants, and other factors. When the average action efficiency is growing it means that the average unit action is decreasing. When the action is stationary, as it is at the end of the simulations, as seen in the time graphs, the average action efficiency is also stationary - it does not grow anymore in the time and for the parameters of the current simulation. This is because the size of the world and the number of ants are fixed in each run of the simulation. In systems that can continue to grow, the limits will be much further away. A similar process is happening in real complex systems such as organisms, ecosystems, cities, and economies. Due to the stochastic variations, we can consider only average quantities.

4. Mechanism

4.1. Exponential Growth and Size-Complexity Rule

Average action efficiency is the proposed measure for level of organization and complexity. To test it we turn to observational data. The size-complexity rule states that the complexity increases as a power law of the size of a complex system [65]. This rule has been observed in systems of a very different nature, with some explanation for the proposed origin [67,81]. In the next section on the model of the mechanism of self-organization, we derive those exponential and power law dependencies. In this paper, we show how our data aligns with the size-complexity rule.

4.2. a Model for the Mechanism of Self-Organization

We apply the model first presented in a book from 1993 [9] and in our paper from 2015 [17] and used in the following papers [18,19] to the ABM simulation here, and specify only some of the quantities in this model for brevity, clarity, and simplicity. Then, we show the exponential and power law solutions for this specific system. The quantities that we show in the results, but, that are not included in the model, participate in the same way in the positive feedback loops, and have the same power law solutions, as seen in the data. This positive feedback loop model may be universal for an arbitrary number of characteristics of self-organizing systems and could be modified to include any of them.
Below is a visual representation of the positive feedback interactions between the characteristics of a complex system, which in our 2015 paper [17] has been proposed as the mechanism of self-organization, progressive development, and evolution, applied to the current simulation. Here i is the information in the system, calculated by the total amount of ant pheromones, t is the average time for all of the ants in the simulation crossing between the two nodes, N is the total number of ants, Q is the total action of all ants in the system, Δ S is the internal entropy difference between the initial and final state of the system in the process of self-organization of finding the shortest path, α is the average action efficiency, ϕ is the number of events in the system per unit time, which in the simulation is the number of paths or crossings between the two nodes, ρ , the density of the ants, is the order parameter and Δ ρ is the increase of the order parameter, which is the difference in the density of agents between the final and initial state of the simulation. The links connecting all those quantities represent positive feedback connections between them.
The positive feedback loops in Figure 3 are modeled with a set of ordinary differential equations. The solutions of this model are exponential for each characteristic and have a power law dependence between each two. The detailed solutions of this model are shown.
We acknowledge the mathematical point that, in general, solutions to systems of linear differential equations are not always exponential. This depends on the eigenvalues of the governing matrix, which must be positive real numbers for exponential growth to occur. Additionally, the matrix must be diagonalizable to support such solutions.

4.2.1. Systems with Constant Coefficients:

  • For linear systems with constant coefficients, the solutions often involve exponential functions. This is because the system can be expressed in terms of matrix exponentials, leveraging the properties of constant coefficient matrices.
  • Even in these cases, if the coefficient matrix is defective (non-diagonalizable), the solutions may include polynomial terms multiplied by exponentials.

4.2.2. Systems with Variable Coefficients:

  • When the coefficients are functions of the independent variable (e.g., time), the solutions may involve integrals, special functions (like Bessel or Airy functions), or other non-exponential forms.
  • The lack of constant coefficients means that the superposition principle doesn’t yield purely exponential solutions, and the system may not have solutions expressible in closed-form exponential terms.

4.2.3. Higher-Order Systems and Resonance:

  • In some systems, especially those modeling physical phenomena like oscillations or circuits, the solutions might involve trigonometric functions, which are related to exponentials via Euler’s formula but are not themselves exponential functions in the real domain.
  • Resonant systems can exhibit behavior where solutions grow without bound in a non-exponential manner.
While exponential functions are a key part of the toolkit for solving linear differential equations, especially with constant coefficients, they don’t encompass all possible solutions. The nature of the coefficients and the structure of the system play crucial roles in determining the form of the solution.
In our specific system, the dynamics predict exponential growth. We do not consider friction, negative feedback, or any dissipative processes that would introduce complex or negative eigenvalues. Instead, the system is driven by positive feedback loops, which lead to positive real eigenvalues. These conditions ensure that the matrix is diagonalizable and that the system exhibits exponential growth, as expected under these assumptions.
Our model operates under the assumption of constant positive feedback, which justifies the exponential growth observed in our simulations. This is a valid simplification for our study, focusing on systems with reinforcing interactions rather than dissipative forces. In future work, we will expand it to include dissipative forces.

4.3. Model Solutions

This is the mathematical representation and solutions of the mechanism represented as a positive feedback loop between the eight characteristics of the system.
In general, in a linear system with eight quantities, the shortest way to represent the interactions is by linear differential equations, using a matrix to describe the interactions between different quantities. We are writing this system generally in order to specify and discuss different aspects of it. Let’s define our system as follows:
d d t x 1 x 2 x 3 x 4 x 5 x 6 x 7 x 8 = a 11 a 12 a 13 a 14 a 15 a 16 a 17 a 18 a 21 a 22 a 23 a 24 a 25 a 26 a 27 a 28 a 31 a 32 a 33 a 34 a 35 a 36 a 37 a 38 a 41 a 42 a 43 a 44 a 45 a 46 a 47 a 48 a 51 a 52 a 53 a 54 a 55 a 56 a 57 a 58 a 61 a 62 a 63 a 64 a 65 a 66 a 67 a 68 a 71 a 72 a 73 a 74 a 75 a 76 a 77 a 78 a 81 a 82 a 83 a 84 a 85 a 86 a 87 a 88 x 1 x 2 x 3 x 4 x 5 x 6 x 7 x 8
Here, d d t denotes the derivative with respect to time, x 1 , x 2 , , x 8 are the quantities of interest, and a i j are constants that represent the interaction strengths between the quantities. The solutions for this system are exponential growth for each of the quantities, and power-law relationships can be derived from their exponential growth. Let’s consider eight quantities x 1 ( t ) , x 2 ( t ) , . . . , x 8 ( t ) each growing exponentially:
  • 1. x 1 ( t ) = x 10 e a 1 t
  • 2. x 2 ( t ) = x 20 e a 2 t
  • 3. x 3 ( t ) = x 30 e a 3 t
  • 4. x 4 ( t ) = x 40 e a 4 t
  • 5. x 5 ( t ) = x 50 e a 5 t
  • 6. x 6 ( t ) = x 60 e a 6 t
  • 7. x 7 ( t ) = x 70 e a 7 t
  • 8. x 8 ( t ) = x 80 e a 8 t
Each x i 0 is the initial value, and each a i is the growth rate for quantity x i ( t ) . To find a power law relationship between any two quantities, say x i ( t ) and x j ( t ) :
1. Solve for t in terms of x i ( t ) and x j ( t ) :
t = 1 a i ln x i ( t ) x i 0
t = 1 a j ln x j ( t ) x j 0
2. Set these two expressions equal to each other and solve for one variable in terms of the other:
1 a i ln x i ( t ) x i 0 = 1 a j ln x j ( t ) x j 0
ln x i ( t ) x i 0 = a i a j ln x j ( t ) x j 0
x i ( t ) x i 0 = x j ( t ) x j 0 a i a j
x i ( t ) = x i 0 x j ( t ) x j 0 a i a j x j 0 a i a j
This gives us a relationship between any two of the quantities x i ( t ) and x j ( t ) . Now, replacing the variables, the system of linear differential equations represented in matrix form becomes:
d d t i t N Q Δ S α φ ρ = A i t N Q Δ S α φ ρ
Here, A is the matrix of coefficients that define the interactions between the different quantities. For example, a list of some of the power-law-like relationships involving α ( t ) and Q with respect to the other variables based on their exponential growth relationships. Here we show only the relationships for average action efficiency and for total action, for brevity, as the rest are analogous:
Relationships Involving α ( t ) :
  • 1. α ( t ) = α 0 i ( t ) i 0 a 6 a 1 i 0 a 6 a 1
  • 2. α ( t ) = α 0 t ( t ) t 0 a 6 a 2 t 0 a 6 a 2
  • 3. α ( t ) = α 0 N ( t ) N 0 a 6 a 3 N 0 a 6 a 3
  • 4. α ( t ) = α 0 Q ( t ) Q 0 a 6 a 4 Q 0 a 6 a 4
  • 5. α ( t ) = α 0 Δ S ( t ) Δ S 0 a 6 a 5 Δ S 0 a 6 a 5
  • 6. α ( t ) = α 0 φ ( t ) φ 0 a 6 a 7 φ 0 a 6 a 7
  • 7. α ( t ) = α 0 ρ ( t ) ρ 0 a 6 a 8 ρ 0 a 6 a 8
Relationships Involving Q ( t ) :
  • 1. Q ( t ) = Q 0 i ( t ) i 0 a 4 a 1 i 0 a 4 a 1
  • 2. Q ( t ) = Q 0 t ( t ) t 0 a 4 a 2 t 0 a 4 a 2
  • 3. Q ( t ) = Q 0 N ( t ) N 0 a 4 a 3 N 0 a 4 a 3
  • 4. Q ( t ) = Q 0 Δ S ( t ) Δ S 0 a 4 a 5 Δ S 0 a 4 a 5
  • 5. Q ( t ) = Q 0 α ( t ) α 0 a 4 a 6 α 0 a 4 a 6
  • 6. Q ( t ) = Q 0 φ ( t ) φ 0 a 4 a 7 φ 0 a 4 a 7
  • 7. Q ( t ) = Q 0 ρ ( t ) ρ 0 a 4 a 8 ρ 0 a 4 a 8
These equations describe how α and Q scale with respect to each other and the other variables in the system, assuming all variables grow exponentially over time.
In our data, we see small deviations from the strict power law fits. A power-law can include a deviation term, which may show uncertainty in the values (measurement or sampling errors) or deviation from the power-law function (for example, for stochastic reasons):
y = k x n + ϵ
where:
  • y and x are the variables.
  • k is a constant.
  • n is the exponent.
  • ϵ is a term that accounts for deviations.

5. Simulation Methods

5.1. Agent-Based Simulations Approach

Our study examines the properties of self-organization by simulating an ant colony navigating between a food source and its nest. The ants start with a random distribution, and then their trajectories become more correlated as they form a path. The ants pick up pheromone from the food and nest and lay it on each patch when they move. The food and the nest function as two nodes that attract the ants which follow the steepest gradient of the opposite pheromone. The pheromone is equivalent to information, as forming a path requires enough of it to ensure that the ants are able to follow the quickest path to their destinations rather than moving randomly. The ants can represent any agent in complex systems, from atoms and molecules to organisms, people, cars, dollars, or bits of information. Utilizing NetLogo for agent-based modeling and Python for data visualization and analysis, we measure self-organization via the calculated entropy decrease in the system, density order parameter, and average path length, which are contingent on the ants’ distribution and possible microstates in the simulated environment. We further explore the effects of having different numbers of ants in the system simulating the growth of the system. In this study we look only at the final values of the characteristics at the end of the simulation when the self-organization is complete, or the difference between their values in the final and initial state. Then, we can demonstrate the relationship between each two characteristics as the population increases. Our model predicts that, according to one of the mechanisms of self-organization, evolution, and development of complex systems, all of the characteristics of a complex system reinforce each other, grow exponentially in time, and are proportional to each other by a power-law relationship [17]. The principle of least action is proposed as a driver for this process. The tendency to minimize action for crossing between the nodes in a complex network is a reason for self-organization and the average action efficiency is a measure of how organized the system is.
This simulation can utilize variables that affect the world, making it easier or harder to form the path. In the collected data, only the number of ants was changed. Increasing the number of ants makes it more probable to find the path, as there is not only a higher chance of them reaching the food and nest and adding information to the world, but also a steeper gradient of pheromone. This both increases the rate of path formation and decreases the length of the path. The ants follow the direction of the steepest gradient around them, but, their speed does not depend on how steep the gradient is.
The simulation methods, such as for diffusion, are chosen by established in the literature criteria for computational speed and for realistic outcome. The values for the parameters are chosen by modifications in the program to optimize the path formation.

5.2. Illustration of the simulation

In this section, we provide several ways of visualizing the structure formation and the stages in the simulation used in this study.

5.2.1. Flow diagram

In Figure 4 below, we show visually the different stages in the simulation and the effects on the agents and the overall structure. Initially, the agents start with a random distribution with maximum internal entropy, and through local interactions they converge to the shortest path, which is the most average action efficient state.
Description of the Simulation Flow Diagram:
The flow diagram in Figure 4 outlines the key stages and transitions in the simulation of self-organization based on agent-based modeling. Each stage is associated with specific actions of agents (modeled as ants) and the corresponding effects on structure formation within the system:
1. Random Movement of Agents (Exploring Space, Maximum Entropy): At the initial stage, agents move randomly within the simulation environment, maximizing spatial entropy and exploring the system’s possible states.
2. Agents Encounter Food or Nest and Pick Up Pheromone (Collecting Information): When agents interact with specific locations (food or nest), they collect pheromones, introducing an information component into their movement.
3. Agents Move Randomly While Dropping Pheromone (Spreading Information): As agents travel, they deposit pheromones along their path, encoding information about visited locations and potential trails.
4. Other Agents Detect and Move Toward Pheromones (Using Information): The deposited pheromones serve as cues for other agents, promoting directed movement toward higher concentrations of pheromones.
5. Formation of Multiple Trails (Initial Structure Formation): The system begins to exhibit structural organization as agents’ movements reinforce certain trails through positive feedback, creating multiple paths.
6. Dominance of One Trail (Stabilizing Structure Formation): Over time, a single trail becomes dominant due to its efficiency and pheromone reinforcement, stabilizing the system’s emerging structure.
7. Trail Shortens and Anneals (Final Structure): The dominant trail undergoes further optimization, shortening and annealing to form the most efficient path between key nodes (food and nest).
Effects on Structure Formation: Each stage in the process represents a transition from high entropy and randomness to low entropy and increased order. The system evolves dynamically through feedback mechanisms, with agents collectively selecting and optimizing paths based on local interactions and environmental information. This reflects the principles of dynamic self-organization, as the simulation captures how micro-level stochastic behaviors contribute to emergent macro-level patterns.
The simulation evaluates the process quantitatively using Average Action Efficiency (AAE) and the rest of the metrics used in this model and presented in the results section. Higher AAE corresponds to more organized and efficient system states, reinforcing the feedback loop between agent behavior and structure formation.

5.2.2. Stages of Self-Organization in the Simulation

In this section, first, we visualize the path formation in a composite image of three snapshots from the simulation Figure 5. Initially, all of the ants are randomly distributed, then they start exploring several paths, and finally, they converge on the shortest path.
Description of Figure 5: Path Formation in the Simulation Figure 5 visually represents the dynamic process of self-organization in the agent-based simulation. The green ants represent the initial stage (first tick), where agents are randomly distributed, and the system is at maximum entropy. The red ants indicate the transition phase, where agents explore and identify multiple potential paths between the nest (green square) and the food source (yellow square). The black ants illustrate the final stage, where agents converge on the most efficient single path, demonstrating the system’s organization and reduced entropy.
The colored gradients provide additional context: the yellow gradient represents the concentration of food pheromones, while the blue gradient represents the concentration of nest pheromones. These pheromone distributions guide the agents’ movements and reinforce the feedback mechanisms that enable the emergence of the final dominant path. This figure effectively captures the system’s progression from randomness to structured efficiency, showcasing the principles of self-organization.

5.2.3. Time Evolution of Self-Organization

Figure 6 below illustrates the changes in internal entropy during self-organization and the corresponding visualizations with snapshots from the simulation. It starts with a maximum entropy state with the most randomness of the agents, goes through a process of exploring possible paths which corresponds to decreasing internal entropy, and ends with the final path and lowest internal entropy for this simulation.
Figure 6, Entropy vs Time and Path Formation Snapshots, illustrates the dynamic relationship between entropy and time, showcasing the process of self-organization in the simulation. The main blue curve represents the system’s internal entropy, which starts at its maximum state and decreases progressively to a minimum as the system transitions from disorder to order. This reflects a phase transition from maximum randomness to a structured, organized state. The colored gradients in the snapshots indicate pheromone concentrations, guiding the ants’ behavior and reinforcing path formation. The graph and snapshots together provide a visualization of the correlation between decreasing entropy and the stages of self-organization, helping illustrate the simulation’s functioning and outcomes.
Three simulation snapshots accompany the graph:
  • Upper Insert (First Tick): Shows the initial state, where the ants (green and red) are randomly distributed, representing maximum entropy and a lack of order. The nest is indicated by a blue square, and the food by a yellow square.
  • Middle Insert (Tick 60): Depicts the transition phase, where ants begin exploring multiple possible paths between the nest and food, leading to a reduction in entropy as structure starts forming.
  • Lower Insert (Final Tick): Displays the final state, where the ants converge on the most efficient single path, minimizing entropy and achieving a highly organized system.

5.3. Program Summary

The simulation is run using an agent-based software called NetLogo. In the simulation, a population of ants forms a path between two endpoints, called the food and nest. The world is a 41x41 patch grid with 5x5 food and nest centered vertically on opposite sides and aligned with the edge. To help with path formation, there is a pheromone laid by the ants on a grid whenever the food or nest is reached. This pheromone exhibits the behavior of evaporating and diffusing across the world. The settings for ants and pheromones can be configured to make path formation easier or harder.
Each tick of the simulation functions as time, which represents a second in our simulation, according to the following rules. First, the ants check if there is any pheromone in its neighboring patches that are in a view cone with an angle of 135 degrees, oriented towards its direction of movement. From the position in which the ant is in the current patch, it faces the center of the neighboring patch with the largest value of the pheromone in its viewing angle. It is important to note that the minimum amount of pheromone an ant can detect is 1 / M , where M is the maximum amount of pheromone an ant can have, which in this simulation is 30. If there is not enough pheromone found in view, then the ant checks all neighboring patches with the same limitation for minimum pheromone. If any pheromone is found, it faces toward the patch with the highest amount. The ant then wiggles a random amount within an integer interval of -25 to 25 degrees, regardless of whether it faced any pheromone, and moves forward at a constant speed of 1 patch per tick. If the ant collides with the edge of the world, it turns 180 degrees and takes another step. In this simulation, the ants do not collide with obstacles or with each other. After it finishes moving, the ant checks if there is any food or nest in its current patch. The program performs two different checks depending on whether the ant has food. If the ant has food, the program checks for collision with the nest patches, and removes the food from the ant if there is collision with the nest. If the ant does not have food, the program checks for collision with the food patches, and gives the ant food if there is a collision with the food. The end effect is that when an ant reaches the food, it picks up the food pheromone, and when it reaches the nest, it picks up the nest pheromone.
In both cases, the ant’s pheromone is set to 30, and the path-length data is updated. After the checks for collision with the food or nest, it drops 1/10 of its current amount of pheromone at the given tick at the patch where it is located. When all the ants have been updated, the patch pheromone is updated. There is a diffusion rate of 0.7, which means that 70% of the pheromone at each patch is distributed equally to neighboring patches. There is also an evaporation rate of 0.06, which means that the pheromone at each patch is decreased by 6 percent. There are more behaviors than these available in the simulation.

5.4. Analysis Summary

The program stores information about the status of the simulation on each tick of the simulation. Upon completion of one simulation, the data is exported directly from the program for analysis by Python. Some of the data, such as Average Action Efficiency, is not directly exported from the program but must be generated by Python from other datasets. The data are fit with a power law function in Python. To generate the graphs, the matplotlib Python library is used. The data seen in the graphs is the average of 20 simulations and has a moving average with a window of 50. Furthermore, any graph that requires the final value in the dataset obtains the value by averaging the last 200 points of the dataset without the moving average.

5.5. Average Path Length

The average path length, <l>, estimates the average length of the paths between food and nest created by the ants. On each tick, the path-length variable for each ant is increased by the amount by which it moved, which is 1 patch per tick for this simulation. When an ant reaches an endpoint, the path-length variable is stored in a list and reset to zero. This list is for all of the paths completed on that tick, and at the end of the tick, the list is averaged and added to the average path length dataset. If no paths were created, 0 is added to the average path length to serve as a placeholder; this can easily be removed in the analysis step because it is known that the path length cannot reach a length of 0. It is also important to note that, due to the method used to calculate this dataset, there will be a clear peak if a stable path is formed. This is because the path length of all the ants must begin at zero, the dataset is not representative before the peak, because the shorter paths from the start of the simulation are averaged. The peak itself shows a shifting trend with self-organization when parameters are changed. The average path length data in this simulation is identical to the average path time and can be used interchangeably whenever time is needed instead of distance. If the speed was varying, then the distance and the time would be different.

5.6. Flow Rate

The flow rate, ϕ , is the number of paths completed at each tick, or crossing between the nodes in this simple network, which is the number of events in the system, defined that way. It is the measure of how many ants reached the endpoints on each tick. This can simply be measured by counting how many ants reach the food or nest, and adding this value to the dataset. In this measure, there are a lot of fluctuations, so a moving average is necessary to make the graph readable.

5.7. Final Pheromone

The final pheromone is the total amount of pheromone at the end of the simulation, which is information for the ants. The total amount of pheromone is calculated on each tick by summing all the pheromone values from the nest and the food for each patch which vary during the simulation. By final pheromone, we mean the average of the pheromone for the last 200 ticks at the end of the simulation,

5.8. Total Action

Action is calculated as the energy used times the time for each trajectory. Since kinetic energy is constant during the motion, it can be set to 1, so the individual action becomes equal to the time for one edge crossing, which is equal to the length of the trajectory. To get the total action for all agents, it is multiplied times the number of all events, or all crossings. The effective potential and the random wiggle angle are reflected in the length of the trajectory and, therefore in the average path time. The calculation for total action is based on flow rate and average path time. It is calculated after the simulation in Python using the equation Q = ϕ < t > .

5.9. Average Action Efficiency

The definition for average action efficiency < α > is the average amount of action per one event in the system or for one edge crossing. This is calculated by dividing the number of events by the total action in the system. The calculation for action efficiency is based on the data for average path time. It is calculated by the equation < α >=1/<t>. This is based on the formula < α >= ϕ /Q. Note that the calculation for average action efficiency is first performed on the individual datasets, then the modified datasets are averaged, rather than averaging the datasets, then applying the equation.

5.10. Density

The density of the ants can be used as an order parameter. The density is changing as a result of reducing randomness in the motion. The program starts at maximum randomness, or internal entropy and while the path is forming, the local density of the ants is increasing. In our simulations, the total number of ants is fixed, and no ants enter or leave the system during each run. However, the density of ants within the simulation space changes over time as they redistribute themselves. Ants are initially distributed uniformly, but as they follow pheromone trails, they tend to concentrate in specific regions, particularly along frequently used paths. This leads to local increases in density along these paths and corresponding decreases in less-used areas, reflecting the emergence of self-organized patterns. Between the runs, when the total number of ants in the simulation is changed the the density is scaled proportionally to reflect this change in the total number of ants.
To calculate the density of the ants, we need to calculate the average of how many ants are in each patch. To achieve this, we approximate a box around the ants in the system to represent the area that they occupy. First, the center of the box is calculated by the equation C x , y = p x , y for all ants, where p x , y is the position of each at each tick. Then, the length and width of the box are calculated by S x , y = 4 ( p x , y C x , y ) 2 . Finally, the area can be calculated with the formula A = S x S y . By using this method of averaging the dimensions of the box instead of simply taking the furthest ant, it is ensured that a group of ants has priority over a few outliers. In Python, after the simulation is finished, the density of ants per patch can be calculated for each population, N, by ρ = N / A . It is the total number of ants divided by the area of the box in which the ants are concentrated. At the beginning of the simulation, the box takes the whole world, and as the ants form the path, it gradually decreases in size, corresponding to an increased density.

5.11. Entropy

The system starts with maximum internal entropy, which decreases as paths are formed over time. First, using the same method as described in Section 6.9, a box is calculated around the ants within the system to represent the area that they occupy.
We consider the agents in our simulation to be distinguishable because we have two different types of ants and each ant in the simulation is labeled and identifiable. The Boltzmann entropy is S = k B l n ( W ) .
Where the number of states W is the area A that they occupy to the power of the number of ants N.
W = A N
Plugging this into the Boltzmann formula, we get:
S = k B ln A N
Setting
k B = 1
We obtained the expression which we used in our calculations:
S = N ln A
The box is the average size of the area A in which the ants move. As the box decreases, the number of possible microstates in which they can be decreases.

5.12. Unit Entropy

Unit entropy measures the amount of entropy per path in the simulation. This is calculated in Python by dividing the internal entropy by the flow rate. It measures unit entropy at the end of the simulation, so the final 200 points of the internal entropy data are averaged, as are the final 200 points of the flow rate data. The averaged final entropy is then divided by the averaged flow rate: s f / ϕ .

5.13. Simulation Parameters

Parameter Values and Settings
Tables 1 to 4 below show the simulation parameters. Table 1 shows the properties that affect the behavior of ants, such as speed of motion, wiggle angle, pheromone detection, and size of the ants. Table 2 shows the settings that affect the properties of the pheromone, such as diffusion rate, evaporation rate and the initial amount of pheromone that the ants pick up when they visit the food or the nest. Table 3 shows settings that affect the world size and initial conditions of the ants. Table 4 shows the size and the positioning of the food and nest.
In Table 4, the settings are that the food/nest are boxes centered vertically on the screen. They do not move during the simulation. Horizontally, the back edges are aligned with the edge of the screen. They have a size of 5x5. To create this, set the following properties listed in the Table 4, then press the "box-food-nest button".
Analysis Parameters All datasets are averages of 20 runs for each population. There is also a moving average of 50 applied after standard averaging.

5.14. Simulation Tests

We ran several tests to show that the simulation and analysis were working correctly.

5.14.1. World Size

Checking how many patches the world contains for the current setting. Running a command in NetLogo that counts how many patches are in a world with a size of 40 prints a value of 1681, and 1681 = 41 . This means that when the world ranges from -20 to +20, the center patch is included, making a total of 41 patches in each direction.

5.14.2. Estimated Path Area

We run a test to check how well the estimation of how much area the ants occupy. We observed the algorithm working in the vertical direction, when the ants were randomly dispersed and when they were on the horizontal path. When the ants were dispersed, the estimated width was 46.8, which is slightly above the real-world size of 41. When the ants formed a path, the estimated width was 5.6, which is close to the observed, with only a few outliers. So, the function that estimates path width might be a few patches off, but this is due to stochastic behavior when averaging the positions. If, however, we did not use averaging, then the outlier ants would have an undesirable impact on the estimated width, and make the measurement fluctuate much more. The methods for checking the width and length of the path are identical, and these are both used in calculating the area occupied by the ants, which is an important step in calculating entropy and density.

6. Results

We present the data for the results of this work in Figure 7 to Figure 45 for self-organization as measured by different metrics as an output of the agent-based modeling simulations. For clarity we should emphasize that the nature of those relationships are predicted by the model in Section 4.2, but, the data are produced by the simulation. The model predictions are tested by fitting the data of the simulation.
First, we present time data for raw output, Figure 7, Figure 8, Figure 9, Figure 10 and Figure 11, from which points were obtained for the power law scaling graphs. We show the evolution of some of the quantities from the beginning to the end of the simulation. The phase transition from disorder initially to order can be seen. The last 200 points averaged which have been used for the power law figures can be observed. The number of ants in the runs varies from 70 to 200. The time in the simulation runs from 0 to 1000 ticks. The derived data from the time graphs are presented in Figure 12 to Figure 45 , which are fit with power law functions to compare with the predictions of the model, and the fit parameters are represented in Table 5. For comparison, at the end, we show the data from two other publications, Figure 46 and Figure 47, where we find an agreement between metrics from this simulation and the data for real systems. In future studies, we will compare the results of the next versions of the simulation with other real-world data.

6.1. Time Graphs

The raw data are presented as output measures vs time for four quantities, Figure 7, Figure 8, Figure 9, Figure 10 and Figure 11. All variables measure the degree of order in the system. The time data show the phase transition from a disorganized to an organized state as an increase in AAE, Figure 7, of the order parameter, Figure 8, as a decrease in internal entropy, Figure 9, the amount of information, Figure 10 and the number of events per unit time, Figure 11. Those data are exponential in the region before the inflection point of the curves, where growth is unconstrained.
The AAE, Figure 7, changes similarly to density which serves as an order parameter, Figure 8, inversely to entropy, Figure 9, and similar to information, Figure 10, and flow, Figure 11. The system starts with a close to zero AAE and order parameter which increase to some maximum value and then saturate as the system is fixed in size. In the case of entropy, the system starts at maximum internal entropy and it drops to a minimum value as the system reaches the saturation point.
Pheromone is the amount of information in the system which is proportional to the degree of order, Figure 10, and flow rate is also proportional to all of the other measures, indicating the number of events as defined in the system, Figure 11. Both of these start at an initial minimum value and undergo a phase transition to the organized state, after which they saturate, due to the fixed size of the system. Those are measures directly connected to action efficiency and are some of the most important performance metrics for self-organizing systems.
Figure 7. Increase in Average Action Efficiency with Ant Population. The graph shows the progression of Average Action Efficiency (AAE) over time for different ant populations, ranging from 70 to 200 ants in increments of 10 (bottom curve to top). Initially, AAE increases steeply during the phase transition as ants explore and reinforce shorter paths. As the simulation approaches its limits, the increase slows, but AAE continues to rise gradually up to 1000 ticks due to the strengthening and annealing of the shortest path. Below time 100, the data for the average path time are not reliable, and those points are missing due to the specifics of the simulation.
Preprints 141408 g007
Figure 7 provides insight into how the Average Action Efficiency (AAE) evolves during the simulation as the number of ants is incrementally increased from 70 to 200. The steep initial rise in AAE reflects the phase transition where ants begin to organize by reinforcing shorter paths. As the system nears its operational limits, the rate of increase diminishes, signifying stabilization in the path optimization process. Despite this, AAE continues to improve gradually up to 1000 ticks, indicating the ongoing refinement and annealing of the shortest path as the simulation progresses. This figure emphasizes the influence of agent population on the dynamics of self-organization and efficiency optimization.

6.1.1. a Note on the Rate of Self-Organization as a Function of the Size of the System
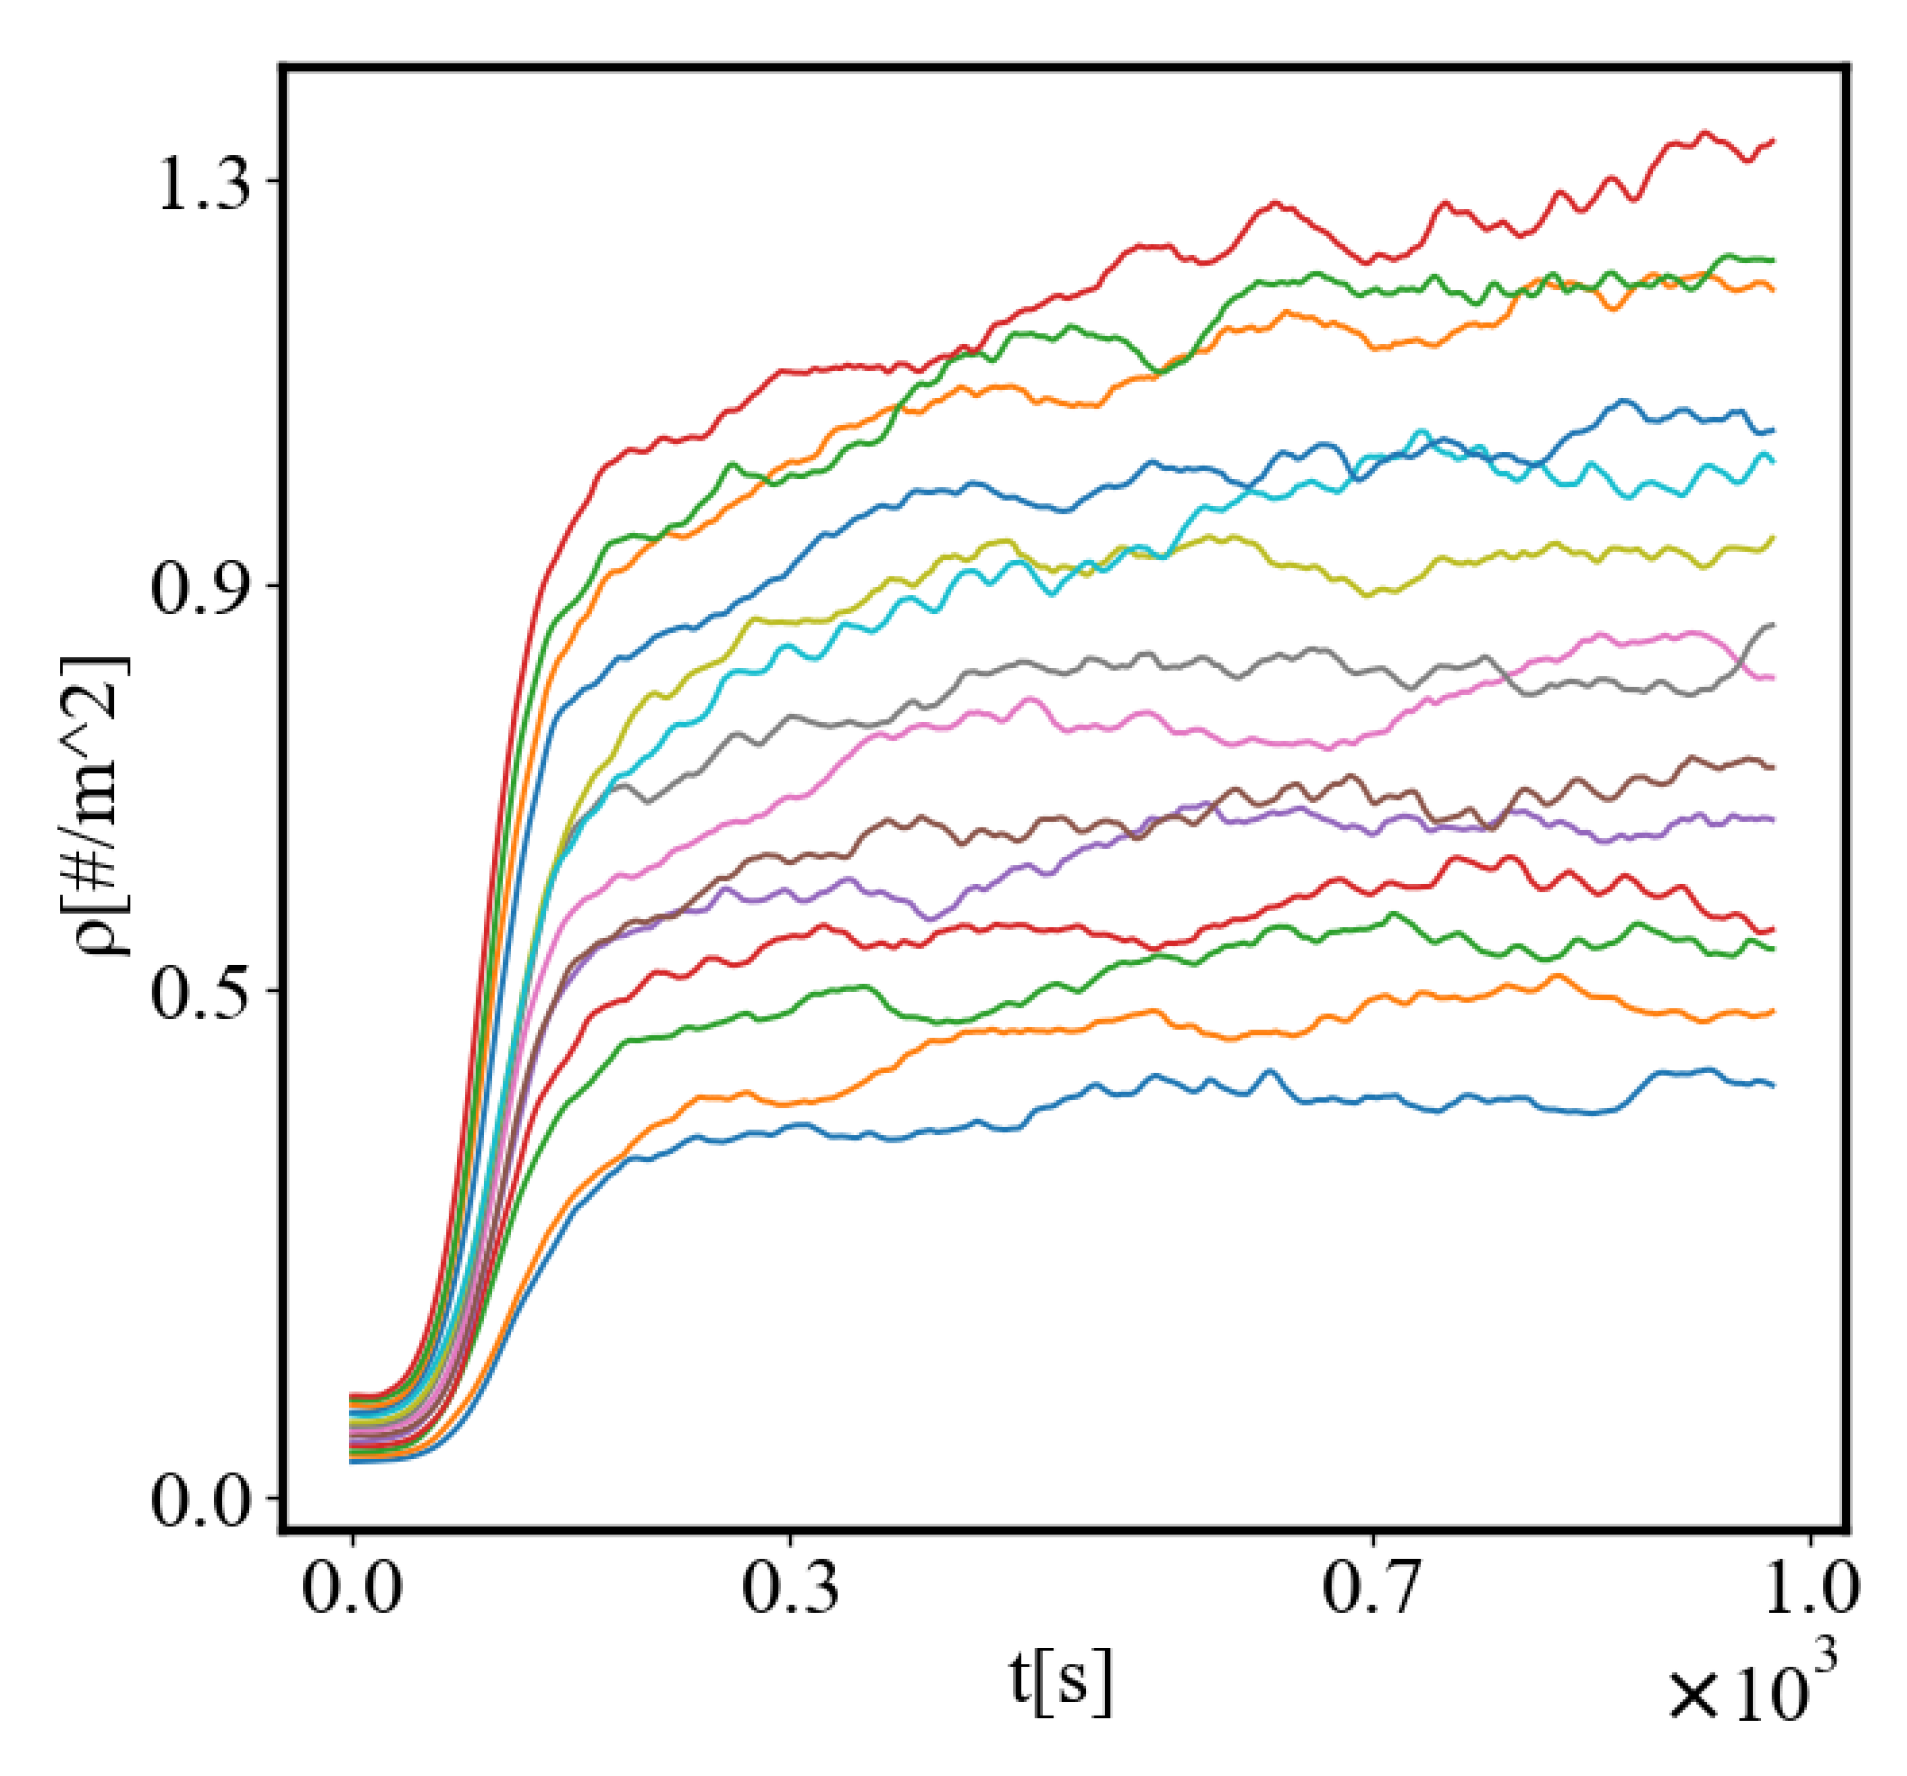
Another observation in this figure is related to the rate of self-organization as a function of the size of the system. AAE for larger populations of ants undergoes a phase transition from a disorganized to an organized state systematically earlier in time, which can also be seen in the rest of the metrics presented in this section of the paper. This indicates that the rate of self-organization as a characteristic of complex systems, also depends on the size of the system, which we will explore in the next parts of this paper. We consider this an important aspect of this study because the message is that for a system to self-organize faster and to achieve higher levels of organization, it has to be larger. The second part of this statement is the essence of the size-complexity rule and the scaling relationships in complex systems, observed for many years by other authors [65,66,67].
Figure 8. The density of ants versus the time as the number of ants increases from the bottom curve to the top. As the simulation progresses, the ants become more dense.
Preprints 141408 g008
The data in Figure 8 show the whole run as the density increases with time as self-organization occurs. The more ants, the larger the final density and the earlier the transition to it. The increase of density depends on two factors: 1. The shorter average path length at the end, and 2. The increased number of ants.
Figure 9. The internal entropy in the simulation versus the time as the number of ants increases from bottom to top. Entropy decreases from the initial random state as the path forms.
Preprints 141408 g009
Figure 9 shows the initial entropy when the ants are randomly dispersed which scales with the number of ants because the number of microstates corresponding to the same macrostate grows. When the ants form the path, the amount of decrease of entropy is larger for the larger number of ants, even though the absolute value of entropy at the end of the simulation also scales with the number of ants, since the number of microstates when the ants form the final path also scales with the number of ants. Entropy at the initial and final state of the simulation is seen to grow with the increase in the number of agents. In this dataset we also observe an earlier transition to order with increased population of ants.
Figure 10. The total amount of pheromone versus the time passed as the number of ants increases from bottom to top. As the simulation progresses, there is more pheromone for the ants to follow.
Preprints 141408 g010
The pheromone is a measure of the information in the system. Its change during the simulation is shown on Figure 10. It scales with the number of ants. Each simulation starts with zero pheromones as the ants are dispersed randomly and do not carry any pheromones, but as they start forming the path they lay pheromones from the food and nest respectively and the more ants are in the simulation, the more pheromones they carry. Larger systems contain more information as each agent is a carrier of information. The transition happens faster when more ants are present in the system.
Figure 11. The flow rate versus the time passed as the number of ants increases from bottom to top. As the simulation progresses, the ants visit the endpoints more often.
Preprints 141408 g011
Figure 11 shows the flow rate vs. time during the simulation. The number of events, which is the number of visits to the food and nest, is inversely proportional to the average path length, and respectively average path time, scales with the number of ants as expected. Initially, the number of crossings is zero but it quickly increases and is greater for the larger systems. After the ants form the shortest path, it saturates and stays close to constant for all simulations. The transition to order happens earlier in time for simulations with a larger population.
Other metrics from the simulation can also be used as a measure of the rate and degree of self-organization. We will explore those in the follow-up papers.

6.2. Power Law Graphs

All figures representing the relationship between the characteristics of this system at the most organized state at the end of the simulation demonstrate power law relationships between all of the quantities as theoretically predicted by the model, as seen in Figure 12 to Figure 45. They are all on a log-log scale. This serves as a simulation confirmation of the model, and on the other hand as a theoretical explanation for the simulation. The power law data correspond to scaling relations measured in many systems of different natures [65,66,67].
For clarity, the "#" symbol represents the number of ants in the simulation. For these data, the number of ants does not change within the simulation; rather, each point represents a simulation with a different number of ants .

6.2.1. Size-Complexity rule

Figure 12 shows the size-complexity rule: as the size increases, the action efficiency as a measure of the degree of organization and complexity increases. This is supported by many experimental and observational data on scaling relations by Geoffrey West, Bonner, Carneiro, and many others [19,65,66,67]. The data coincide with the Kleiber’s law [81], and other similar laws, such as the area speciation rule in ecology and others.
Figure 12. The average action efficiency at the end of the simulation versus the number of ants, on a log-log scale. As more ants are added, they are able to form more action-efficient structures by finding shorter paths.
Preprints 141408 g012

6.2.2. Unit-Total Dualism

The following graphs serve as empirical support for the unit-total dualism described in this paper. Figure 13 shows the unit-total dualism between the average action efficiency and total action.
Figure 13. The average action efficiency at the end of the simulation versus the total action as the number of ants increases on a log-log scale. As there is more total action within the system, the ants become more action-efficient.
Preprints 141408 g013
The total action is a measure of all energy and time spent in the simulation by the agents in the system, as it can be seen in Figure 13. As the number of agents increases, the total action increases. This suggests a duality of decreasing unit action and increasing total action as a system self-organizes progressively . It also points to a dynamical action principle, as the unit action per one event decreases with the growth of the system, as seen in the increase of the average action efficiency, while the total action increases. This is an expression of the dualism for the decreasing unit action principle and the increasing total action principle, for dynamical action as systems self-organize, grow, evolve, and develop.
Figure 14 is an expression of the unit-total duality of entropy when the unit entropy per one event in the system tends to decrease its total internal entropy of the system increases.
Figure 14. Unit entropy at the end of the simulation versus internal entropy on a log-log scale. As the total entropy for the simulation increases, the entropy per agent decreases.
Preprints 141408 g014

6.2.3. the Rest of the Characteristics
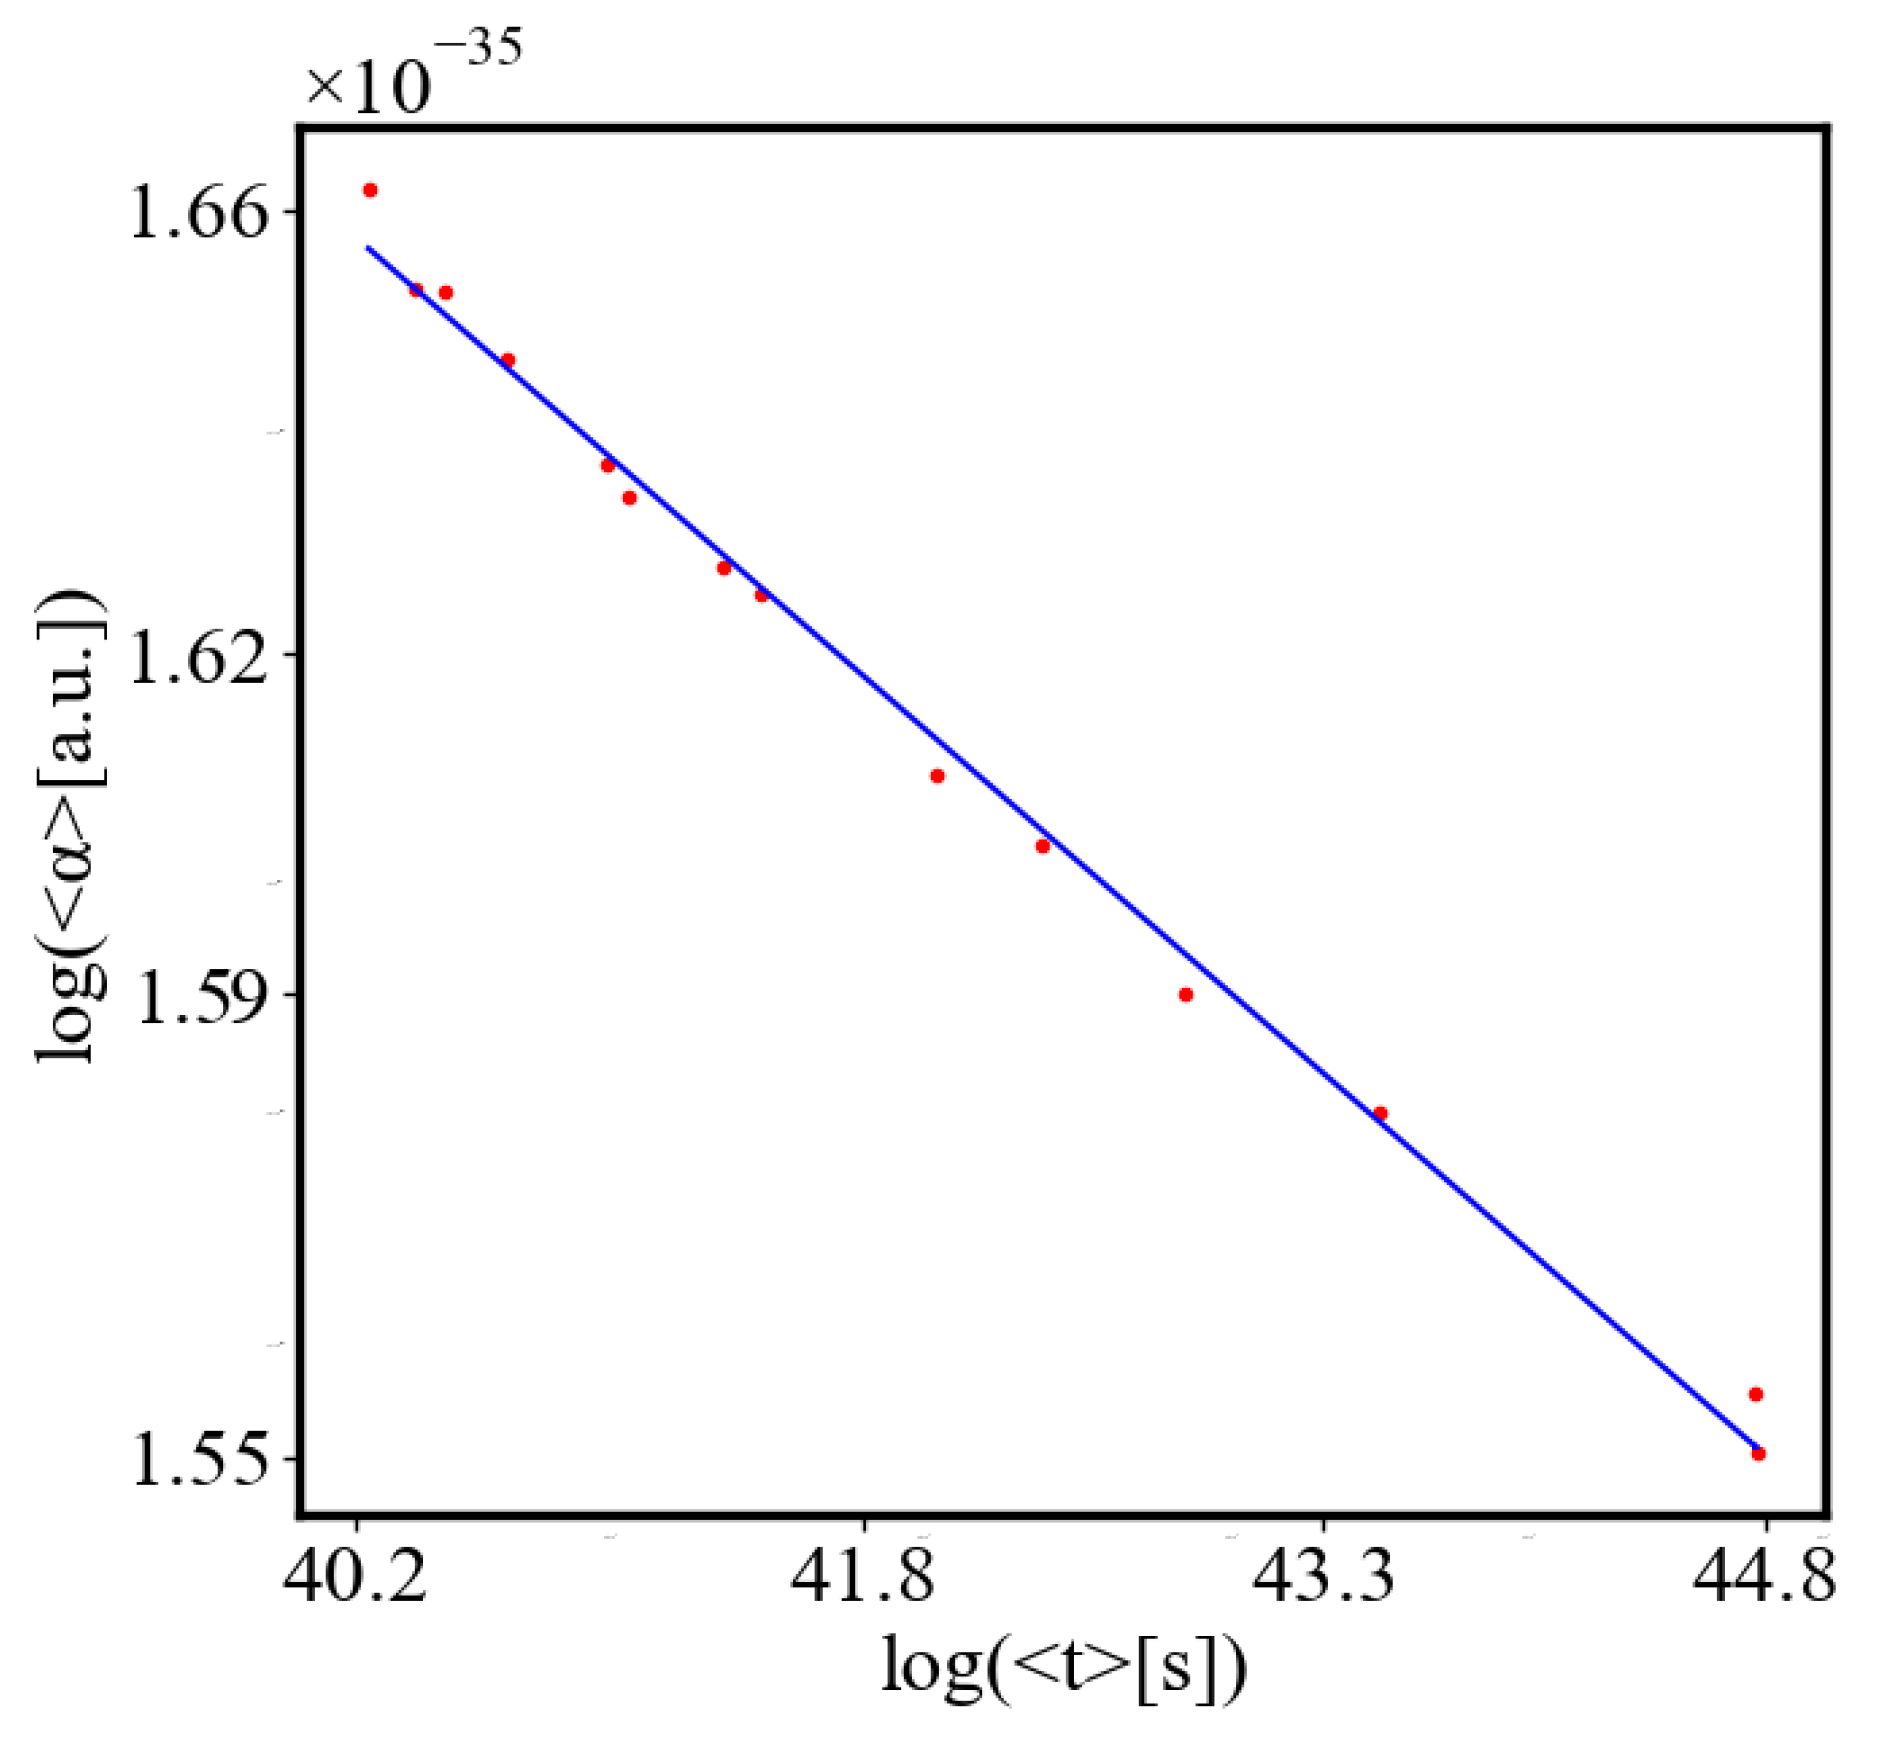
Next, we show the rest of the power law fits between all of the quantities in the model, in Figure 15 to Figure 45. All of them are on a log-log scale, where a straight line is a power law curve on a linear-linear scale. These graphs match the predictions of the model and confirm the power-law relationships between all of the characteristics of a complex system derived there.
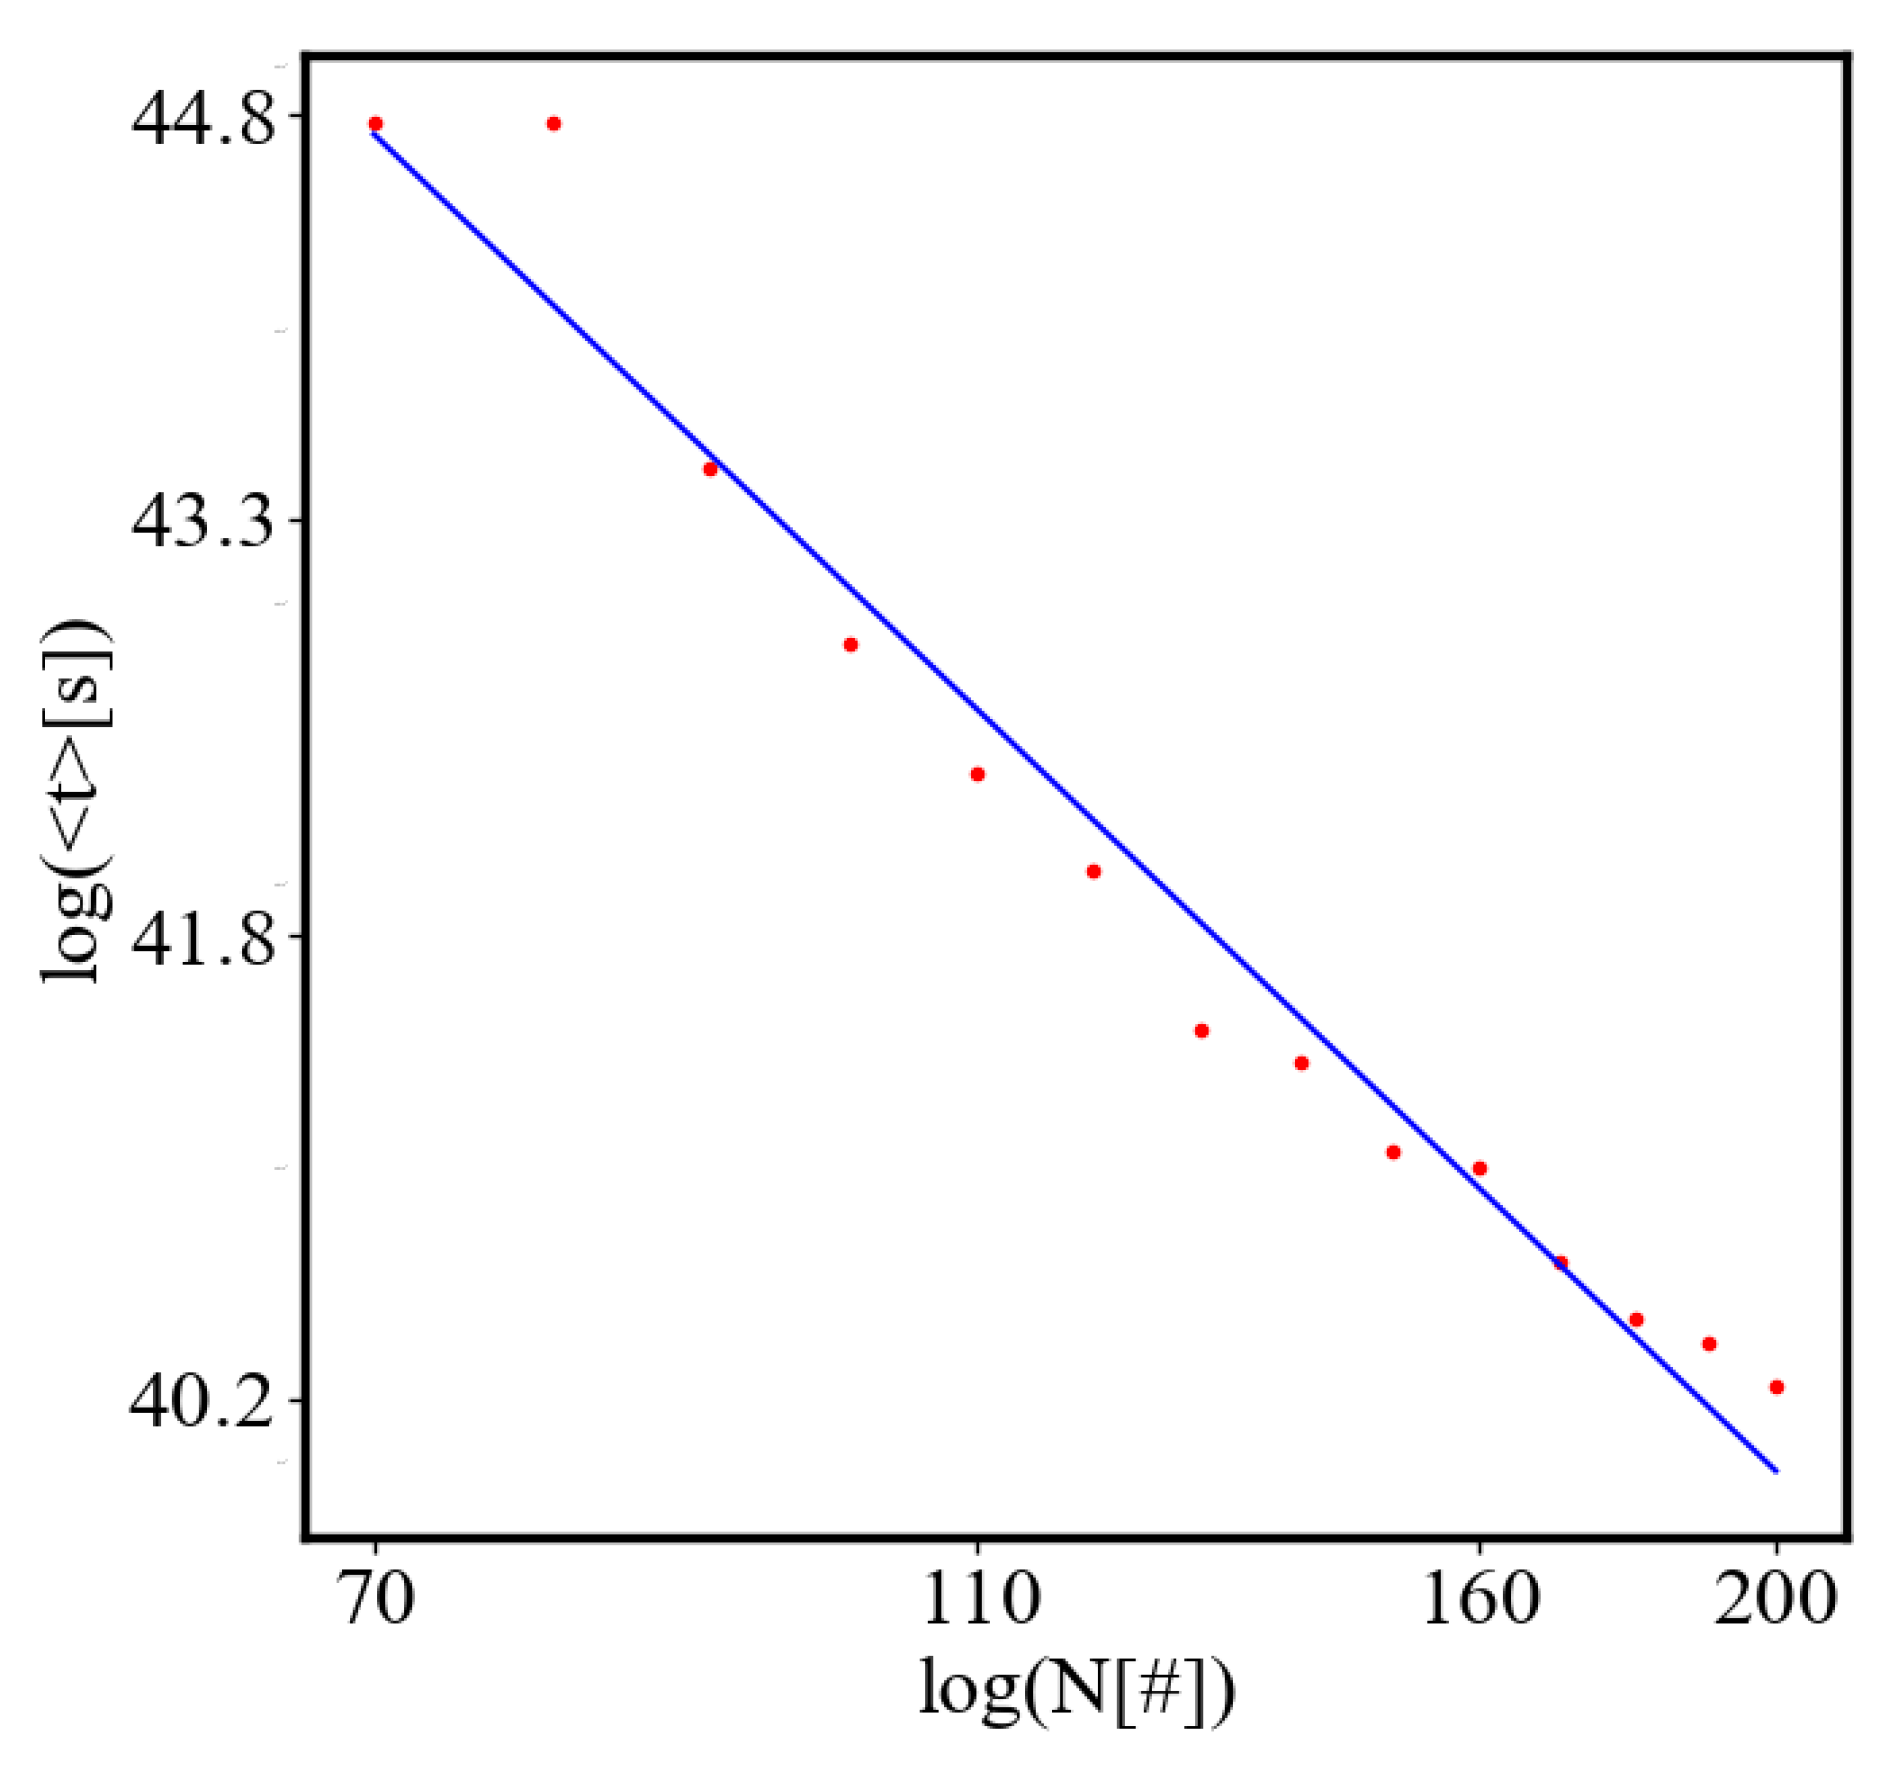
Figure 15. The average action efficiency at the end of the simulation versus the average time required to traverse the path as the number of ants increases on a log-log scale. Average action efficiency increases as the average time to reach the destination shortens, i.e. the path length becomes shorter.
Preprints 141408 g015
Figure 15 shows the average action efficiency at the end of the simulation versus the time required to traverse the path as the size of the system, in terms of a number of agents, increases. In complex systems, as the agents find shorter paths, this state is more stable in dynamic equilibrium and is preserved. It has a higher probability of persisting. It is memorized by the system. If there is friction in the system, this trend will become even stronger, as the energy spent to traverse the shorter path will also decrease. To the macro-state of AAE at each point, there is a growing number of micro-states, corresponding to the variations of the paths of individual agents.
Figure 16 shows the average action efficiency at the end of the simulation versus the density increase of the agents as the size of the system increases in terms of the number of agents. Density increases the probability of shorter paths, i.e. less time to reach the destination, i.e. larger action efficiency. In natural systems as density increases, action efficiency increases, i.e. level of organization increases. Another term for density is concentration. When hydrogen gas clouds in the universe under the influence of gravity concentrate into stars, nucleosynthesis starts and the evolution of cosmic elements begins. In chemistry increased concentration of reactants speeds up chemical reactions, i.e. they become more action efficient. When single-cell organisms concentrate in colonies and later in multicellular organisms their level of organization increases. When human populations concentrate in cities, the organization increases, and civilization advances [67].
Figure 16. The average action efficiency at the end of the simulation versus the density increase is measured as the difference between the final density minus the initial density as the number of ants increases, on a log-log scale. As the ants get denser, they become more action-efficient.
Preprints 141408 g016
As internal statistical Boltzmann entropy decreases by a greater amount during self-organization, as seen in Figure 17, the system becomes more action-efficient. Decreased randomness is correlated with a well-formed path as a flow channel, which corresponds to the structure (organization) of the system. Here, the increase of entropy difference obeys the predictions of the model being in a strict power law dependence on the other characteristics of the self-organizing complex system.
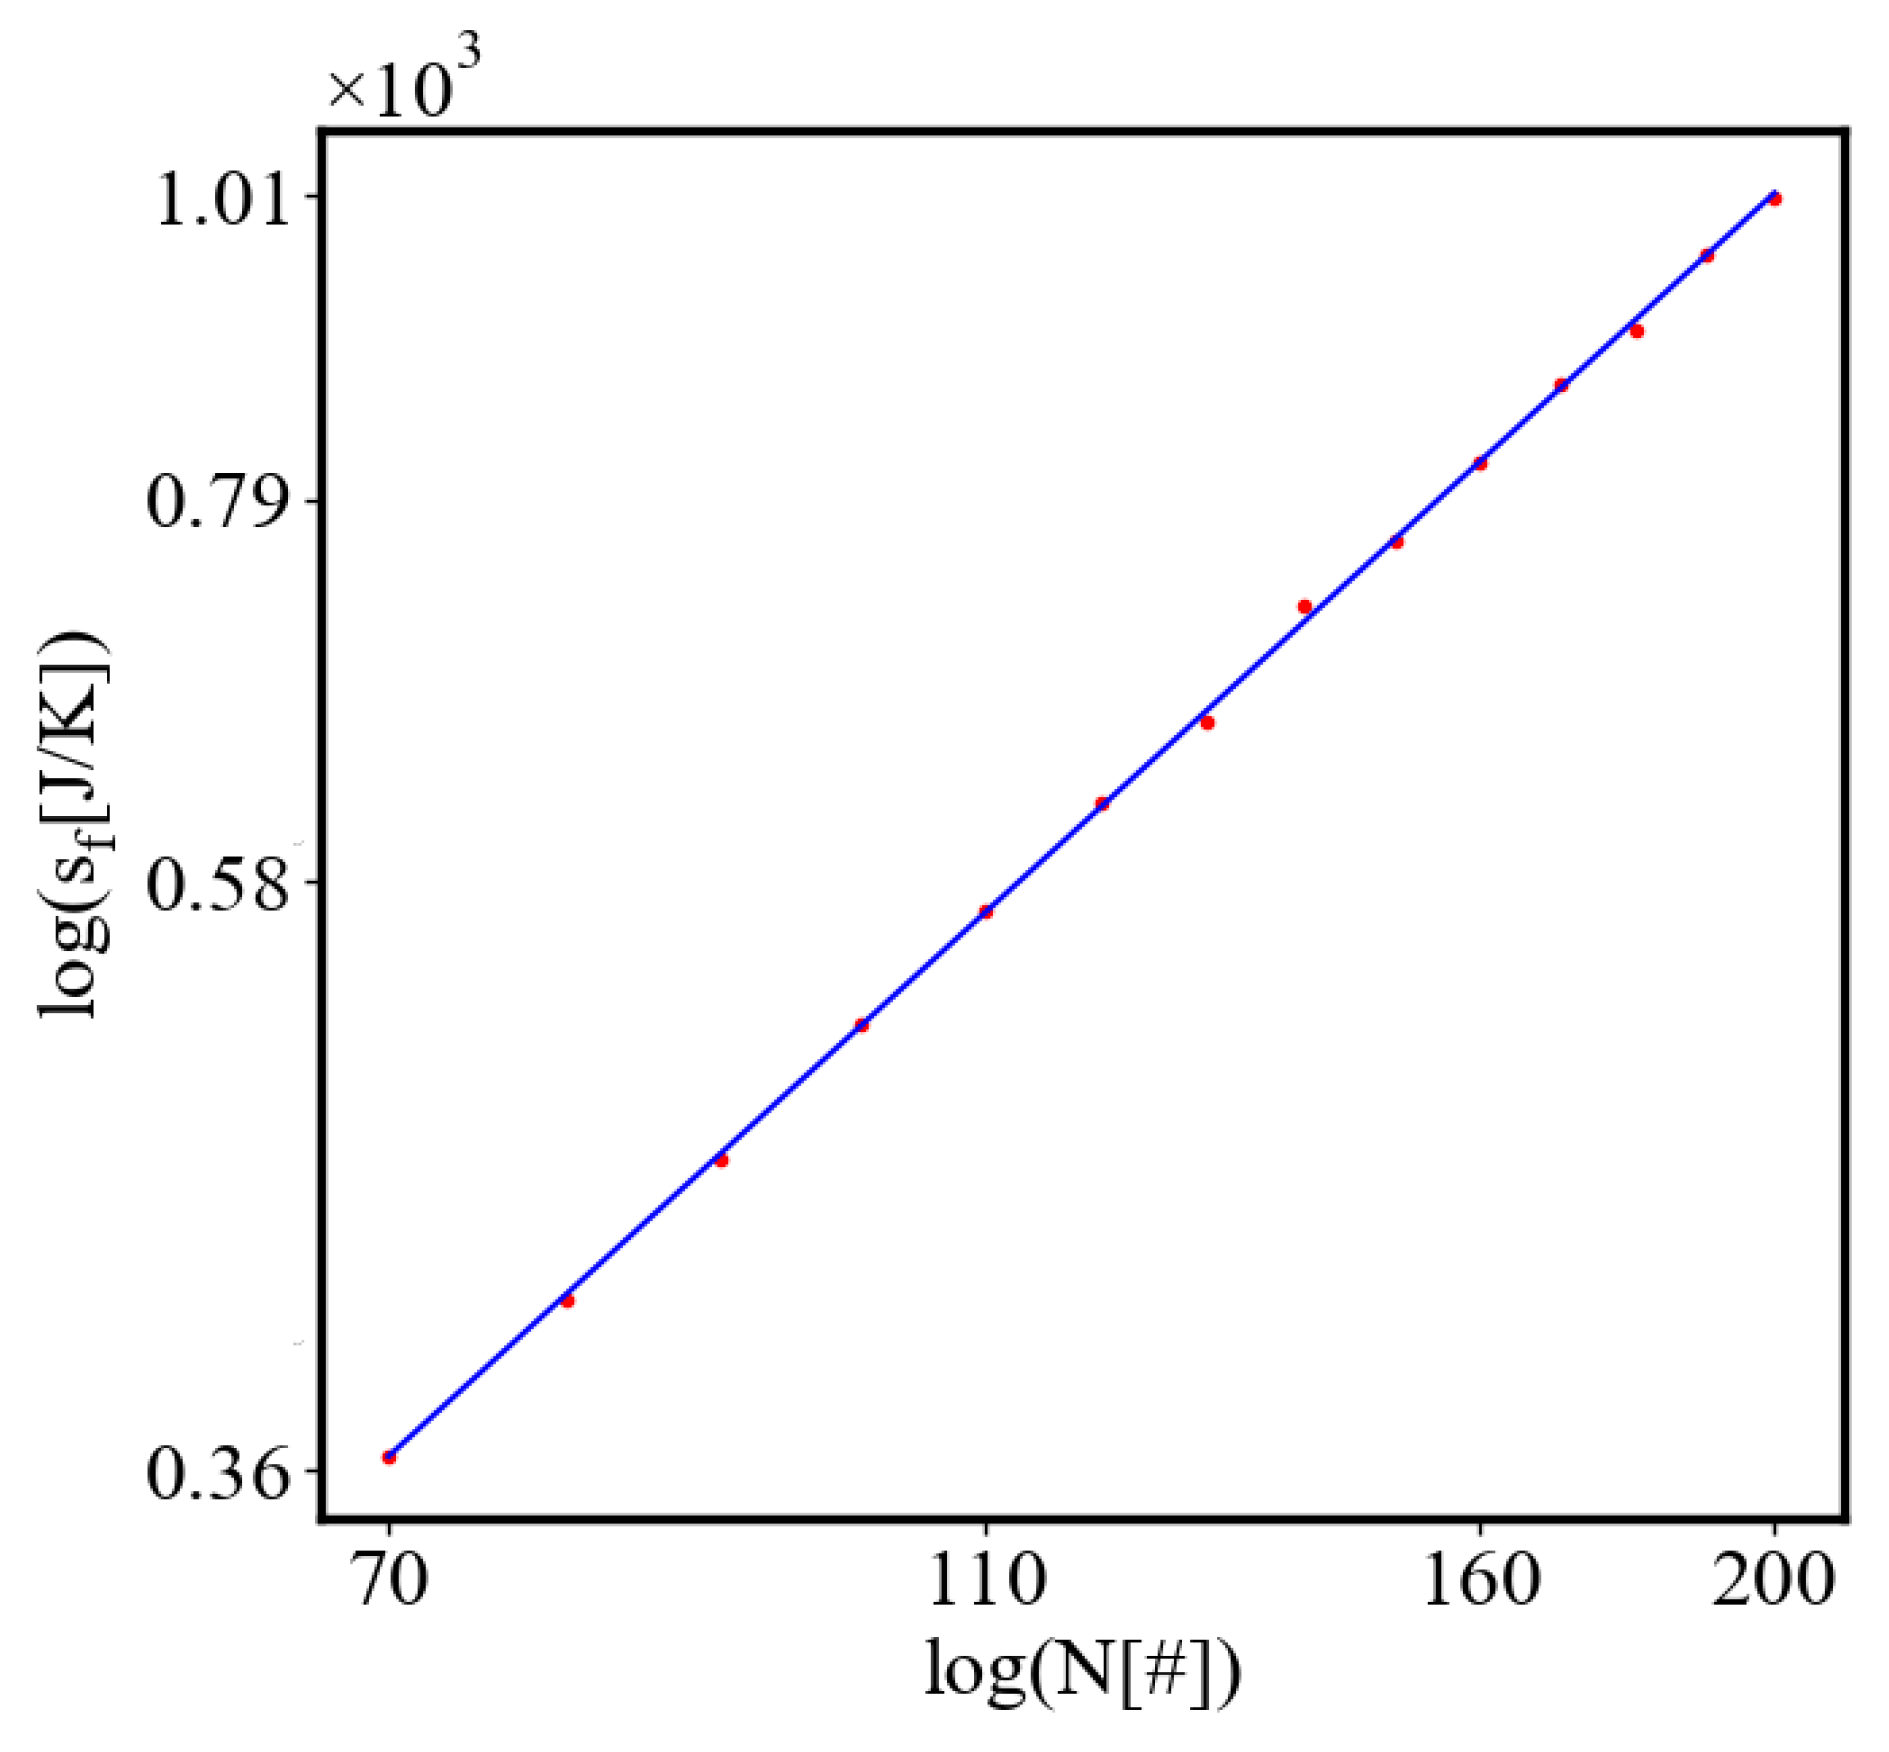
Figure 17. The average action efficiency at the end of the simulation versus the absolute amount of entropy decrease, as the number of ants increases, on a log-log scale. As the ants get less random, they become more action-efficient.
Preprints 141408 g017
Figure 18 shows the average action efficiency at the end of the simulation versus the flow rate as the size of the system in terms of the number of agents increases. The flow rate measures the number of events in a system. For real systems, those can be nuclear or chemical reactions, computations, or any other events. In this simulation, it is the number of visits at the endpoints, or the number of crossings. As the speed of the ants is a constant in this simulation, the number of visits or the flow of events is inversely proportional to the time for crossing, i.e. the path length, therefore action efficiency increases with the number of visits.
Figure 18. The average action efficiency at the end of the simulation versus the flow rate as the number of ants increases, on a log-log scale. As the ants visit the endpoints more often, they become more efficient.
Preprints 141408 g018
Figure 19 shows the average action efficiency at the end of the simulation versus the amount of pheromone, or information, as the size of the system in terms of the number of agents increases. The pheromone is what instructs the ants how to move. They follow its gradient towards the food or the nest. As the ants form the path, they concentrate more pheromone on the trail, and they lay it faster so it has less time to evaporate. Both depend on each other in a positive feedback loop. This leads to increased action efficiency, with a power-law dependence as predicted by the model. In other complex systems, the analog of the pheromone can be temperature and catalysts in chemical reactions. In an ecosystem, as animals traverse a path, the path itself carries information, and clearing the path reduces obstacles and, therefore the time and energy to reach the destination, i.e. action.
Figure 19. The average action efficiency at the end of the simulation versus the amount of pheromone, or information, as the number of ants increases on a log-log scale. As there is more information for the ants to follow, they become more efficient.
Preprints 141408 g019
Figure 20 shows the total action at the end of the simulation versus the size of the system in terms of the number of agents. The total action is the sum of the actions of each agent. As the number of agents grows the total action grows. This graph demonstrates the principle of increasing total action in self-organization, growth, evolution, and development of systems.
Figure 20. The total action at the end of the simulation versus the number of ants on a log-log scale. As there are more agents in the system, the total amount of action increases proportionally.
Preprints 141408 g020
Figure 21 shows the total action at the end of the simulation versus the time required to traverse the path as the size of the system, in terms of the number of agents increases. With more ants, the path forms better and gets shorter, which increases the number of visits. The shorter time is connected to more visits and increased size of the system, which is why the total action increases. This graph also demonstrates the principle of increasing total action in self-organization, growth, evolution, and development of systems.
Figure 21. The total action at the end of the simulation versus the time required to traverse the path as the number of ants increases on a log-log scale.
Preprints 141408 g021
Figure 22 shows the total action at the end of the simulation versus the increase in the density of agents as the size of the system in terms of the number of agents increases. The larger the system is, it contains more agents, which corresponds to greater density, more trajectories, and more total action. This graph demonstrates as well the principle of increasing total action in self-organization, growth, evolution, and development of systems.
Figure 22. The total action at the end of the simulation versus the increase of density as the number of ants increases on a log-log scale. As the ants become more dense, there is more action in the system.
Preprints 141408 g022
Figure 23 shows the total action at the end of the simulation versus the absolute decrease of entropy as the size of the system in terms of the number of agents increases. As the total entropy difference increases, which means that the decrease of the internal entropy is greater for a larger number of ants, the total action increases, because there are more agents in the system and they visit the nodes more often. Greater organization of the system is correlated with more total action demonstrating again the principle of increasing total action in self-organization, growth, evolution, and development of systems.
Figure 23. The total action at the end of the simulation versus the absolute increase of entropy difference as the number of ants increases, on a log-log scale. As the entropy difference increases, there is more action within the system.
Preprints 141408 g023
Figure 24 shows the total action at the end of the simulation versus the flow rate, which is the number of events per unit time, as the size of the system in terms of the number of agents increases. As the flow of events increases, which is the number of crossings of ants between the food and nest, the total action increases, because there are more agents in the system and they visit the nodes more often by forming a shorter path. This also demonstrates the principle of increasing total action in self-organization, growth, evolution, and development of systems.
Figure 24. The total action at the end of the simulation versus the flow rate as the number of ants increases, on a log-log scale. As the ants visit the endpoints more often, there is more total action within the system.
Preprints 141408 g024
Figure 25 shows the total action at the end of the simulation versus the amount of pheromone as a measure for information, as the size of the system in terms of the number of agents increases. As the total number of agents in the system increases, they leave more pheromones, which causes forming a shorter path, increases the number of visits, and the total action increases. Again, this graph demonstrates the principle of increasing total action in self-organization, growth, evolution, and development of systems.
Figure 25. The total action at the end of the simulation versus the amount of pheromone as the number of ants increases on a log-log scale. As there is more information for the ants to follow, there is more action within the system.
Preprints 141408 g025
Figure 26 shows the total pheromone as a measure of the amount of information at the end of the simulation versus the size of the system in terms of number of agents. As the total number of ants in the system increases, they leave more pheromones and form a shorter path, which counters the evaporation of the pheromones. This increases the amount of information in the system, which helps with its rate and degree of self-organization.
Figure 26. The total pheromone at the end of the simulation versus the number of ants, on a log-log scale. As more ants are added to the simulation, there is more information for the ants to follow.
Preprints 141408 g026
Figure 27 shows the total pheromone at the end of the simulation versus the average path time required to traverse the path as the size of the system in terms of the number of agents increases. As the total number of ants in the system increases, they form a shorter path as the degree of self-organization is higher, and as they visit the food and nest more often and there are greater number of ants they leave more pheromones. The increased amount of information in turn helps form an even shorter path which reduces the pheromone evaporation increasing the pheromones event more. This is a visualization of the result of this positive feedback loop.
Figure 27. The total pheromone at the end of the simulation versus the time required to traverse the path as the number of ants increases on a log-log scale. As it takes less time for the ants to travel between the nodes, there is more information for the ants to follow and as there is more pheromone to follow, the trajectory becomes shorter - a positive feedback loop.
Preprints 141408 g027
Figure 28 shows the total pheromone as a measure of information at the end of the simulation versus the density increase as the size of the system in terms of the number of agents increases. As the total number of ants in the system increases, they form a shorter path as the degree of self-organization is higher, and as there are more ants, their density increases, and as they visit the food and nest more often and there is a greater number of ants and lower evaporation, they leave more information.
Figure 28. The total pheromone at the end of the simulation versus the density increase as the number of ants increases on a log-log scale. As the ants become more dense, there is more information for them to follow.
Preprints 141408 g028
Figure 29 shows the total pheromone as a measure of the amount of information at the end of the simulation versus the absolute decrease of entropy as the size of the system in terms of the number of agents increases. As the total number of ants in the system increases, they form a shorter path as the degree of self-organization is higher. As there are more ants, the entropy difference increases. The entropy during each simulation decreases, and as they visit the food and nest more often and there is a greater number of ants and less evaporation they accumulate more pheromones.
Figure 29. The total pheromone at the end of the simulation versus the absolute increase of entropy difference as the number of ants increases on a log-log scale. As the entropy difference increases, there is more information for the ants to follow and greater self-organization.
Preprints 141408 g029
Figure 30 shows the total pheromone as a measure of the amount of information in the systems at the end of the simulation versus the flow rate, which is the number of events (crossings of the edge) per unit of time, as the size of the system in terms of the number of agents increases. As the total number of ants in the system increases, they form a shorter path as the degree of self-organization is higher. They visit the food and nest more often, and as there are more ants, the number of visits increases proportionally, the evaporation decreases, and they accumulate more pheromones.
Figure 30. The total pheromone at the end of the simulation versus the flow rate as the number of ants increases on a log-log scale.
Preprints 141408 g030
Figure 31 shows the flow rate in terms of the number of events at the end of the simulation versus the size of the system in terms of the number of agents. As the total number of ants in the system increases, they form a shorter path as the degree of self-organization is higher, visit the food and nest more often, and the number of visits increases proportionally.
Figure 31. The flow rate at the end of the simulation versus the number of ants, on a log-log scale. As more ants are added to the simulation and they are forming shorter paths in self-organization, the ants are visiting the endpoints more often.
Preprints 141408 g031
Figure 32 shows the flow rate in terms of the number of events per unit of time at the end of the simulation versus the time required to traverse between the nodes as the size of the system in terms of the number of agents increases. As the total number of ants in the system increases, they form a shorter path as the degree of self-organization is higher, visit the food and nest more often, and as there are more ants, the number of visits increases proportionally.
Figure 32. The flow rate at the end of the simulation versus the time required to traverse between the nodes as the number of ants increases, on a log-log scale. As the path becomes shorter, the ants are visiting the endpoints more often.
Preprints 141408 g032
Figure 33 shows the flow rate in terms of the number of events (edge crossings) per unit of time at the end of the simulation versus the time required to traverse between the nodes as the size of the system in terms of the number of agents increases. As the total number of ants in the system increases, they form a shorter path as the degree of self-organization is higher, this leads to an increase in density, and as there are more ants, the number of visits increases proportionally.
Figure 33. The flow rate at the end of the simulation versus the increase of density as the number of ants increases on a log-log scale. As the ants get more dense, they are visiting the endpoints more often.
Preprints 141408 g033
Figure 34 shows the flow rate in terms of the number of events (edge crossings) per unit of time at the end of the simulation versus the absolute decrease of entropy as the size of the system in terms of the number of agents increases. As the total number of ants in the system increases, they form a shorter path as the degree of self-organization is higher, the absolute decrease of entropy is larger, and as there are more ants, the number of visits increases proportionally.
Figure 34. The flow rate at the end of the simulation versus the absolute decrease of entropy as the number of ants increases, on a log-log scale. As the entropy decreases more, the ants are visiting the endpoints more often.
Preprints 141408 g034
Figure 35 shows the absolute amount of entropy decrease versus the size of the system in terms of the number of agents as it increases. As the total number of ants in the system increases, they form a shorter path as the degree of self-organization is higher, they start with a larger initial entropy and the difference between the initial and final entropy grows. More ants correspond to greater internal entropy decrease, which is one measure of self-organization. It is one of the scaling laws in the size-complexity rule.
Figure 35. The absolute amount of entropy decrease versus the number of ants, on a log-log scale. As more ants are added to the simulation, there is a larger decrease in entropy reflecting a greater degree of self-organization.
Preprints 141408 g035
Figure 36 shows the absolute amount of entropy decrease versus the average time required to traverse the path at the end of the simulation as the size of the system in terms of number of agents as they increase. As the total number of ants in the system increases, they form a shorter path, and the entropy decrease is greater, as the degree of self-organization is higher. When the path is shorter, this corresponds to shorter times to cross between the two nodes, the internal entropy decreases more.
Figure 36. The absolute amount of entropy decrease versus the time required to traverse the path at the end of the simulation as the number of ants increases, on a log-log scale. As it takes more time to move between the nodes with fewer ants, there is more of a decrease in entropy, and vice versa.
Preprints 141408 g036
Figure 37 shows the absolute amount of entropy decrease versus the amount of density increase at the end of the simulation as the size of the system in terms of the number of agents increases. As the total number of ants in the system increases, they form a shorter path as the degree of self-organization is higher, and as there are more ants their density increases, and the internal entropy difference increases proportionally.
Figure 37. The absolute amount of entropy decrease versus the amount of density increase as the number of ants increases on a log-log scale. As the ants become more dense, there is a larger decrease in entropy.
Preprints 141408 g037
Figure 38 shows the amount of density increase versus the size as it increases in terms of the number of agents. As the total number of ants in the system increases, they form a shorter path as the degree of self-organization is higher, and as there are more ants, the density increases proportionally.
Figure 38. The amount of density increase versus the number of ants, on a log-log scale. As more ants are added to the simulation, and they form shorter paths, density increases proportionally.
Preprints 141408 g038
Figure 39 shows the amount of density increase versus the average time required to traverse the path as the size increases in terms of number of agents. As the total number of ants in the system increases, they form a shorter path as the degree of self-organization is higher, visit the food and nest more often, the time to cross between the nodes decreases, and the density increases proportionally.
Figure 39. The amount of density increase versus the time required to traverse the path as the number of ants increases on a log-log scale. When there are more ants it takes less time to traverse the path, and there is more of an increase in density.
Preprints 141408 g039
Figure 40 shows the average time required to traverse the path versus the increasing size of the system in terms of the number of agents. As the total number of ants in the system increases, they form a shorter path as the degree of self-organization is higher, visit the food and nest more often, and the time for the visits decreases proportionally, increasing action efficiency.
Figure 40. The time required to traverse the path versus the number of ants, on a log-log scale. As more ants are added to the simulation, it takes less time to move between the nodes because they form a shorter path at the end of the simulation.
Preprints 141408 g040
Figure 41 shows the final entropy at the end of the simulation versus the size of the system in terms number of agents. The final entropy in the system increases when there are more agents, and therefore more possible microstates of the system.
Figure 41. The final entropy at the end of the simulation versus population on a log-log scale. As the population increases, there is more entropy in the final most organized state.
Preprints 141408 g041
Figure 42 shows the initial entropy at the beginning of the simulation versus the size of the system in terms number of agents. The initial entropy reflects the larger number of agents in a fixed initial size of the system and scales with the size of the system as expected. The initial entropy in the system increases when there are more agents in the space of the simulation, and therefore more possible microstates of the system.
Figure 42. Initial entropy on the first tick of the simulation versus the population on a log-log scale. As the population increases, there is more entropy.
Preprints 141408 g042
Figure 43 shows the unit entropy at the end of the simulation versus the size of the system in terms number of agents.
Figure 43. Unit entropy at the end of the simulation versus population on a log-log scale. As there are more agents, there is less entropy per path at the end of the simulation.
Preprints 141408 g043
Figure 44 shows the unit information per one path at the end of the simulation versus the size of the system in terms number of agents. It shows that as the system increases in size, it has more ability to self-organize and to form shorter paths, therefore needing less information for each path, which in this system is one event in the system. More organized systems find shorter paths for their agents and need less information per path.
Figure 44. Unit information at the end of the simulation versus population on a log-log scale. As there are more agents, there is less information per path at the end of the simulation as the path is shorter.
Preprints 141408 g044
Figure 45 shows the unit information per one path at the end of the simulation versus the total information in the system. As the system grows, the total information in the system increases and it has more ability to self-organize and to form shorter paths, therefore needing less information for each path, which in this system is one event in the system. More organized systems find shorter paths for their agents, and need less information per path but increases the total amount of information in the system.
Figure 45. Unit information at the end of the simulation versus the total information in the system on a log-log scale. As there are more agents, there is less information per path at the end of the simulation as the path is shorter, and more total information as the size of the system in terms of the number of agents is larger.
Preprints 141408 g045

6.3. Comparison with Literature Data for Real Systems

Here we present for comparison data for other systems showing scaling behavior analogous to the model in this paper.

6.3.1. Stellar Evolution

Figure 46 reproduces Figure 5 from the paper [19] where the effect of size on the evolution of stars is presented. This relationship further highlights the predictive power of the model for self-organizing systems. Specifically, the Figure 46 below demonstrates how the "Progress of Nucleosynthesis" scales with the "Initial Total Number of Solar Masses," revealing distinct power-law relationships that align with the theoretical framework developed in this study. The figure underscores the robustness of these scaling relationships across different system characteristics.
In Figure 46 we see an example of data analysis for stellar systems, which shows that the level of organization in a system, in terms of the amount of progress of nucleosynthesis, as the fraction of the nucleons of a star converted to heavier than Hydrogen elements, is in a scaling law relationship with its size in terms of total initial number of nucleons, or total initial mass of the star. The powers of the exponents of the power law fits from the bottom to the top line are respectively: 0.86, 1.47, 1.8, and 2.6. They are close to many of the values of the power law relations in Table 5. This means that many of the power law dependencies in the simulation are in the range of data for stars as complex self-organizing systems. The composition of stars at the end of their life is measured directly with observations of the content of heavier elements in the nebulas that they produce after their explosions.
The closest characteristics from this simulation to the data in Figure 46 and the values of their corresponding exponents are: Δ s corresponds to a decrease in internal entropy of the simulation which relates to the progress of nucleosynthesis because it measures the grouping of separate nucleons into heavier elements, which means that as the nucleons are grouping together their degrees of freedom of motion are reduced, which corresponds to decrease of internal entropy of a star. Δ ρ relates to the progress of nucleosynthesis because as the nucleons are grouped in heavier elements, the density of the star in its volume where they are located increases, as nucleons are packed closer together. i relates to the progress of nucleosynthesis because as nucleons are linked together this is analogous to the ants being linked closer together through the pheromones on the final path. ϕ relates to the progress of nucleosynthesis because as stars get larger, the number of events of grouping new nucleons is increasing, as in a shorter lifetime of the heavier stars, there are more events of connecting nucleons, as the fraction of heavier elements in the stars, which is the definition of the progress of nucleosynthesis, increases. Q relates to the progress of nucleosynthesis because it measures the total amount of action in terms of energy and time for the processes occurring in stars, and as stars get heavier, more nuclear reactions occur and a larger fraction of nucleons convert to heavier elements. The X-axis in solar masses is analogous to N in our simulation, which is the size of the system in terms of the number of agents, as for the star, the number of agents is the number of nucleons, which is directly proportional to their mass.
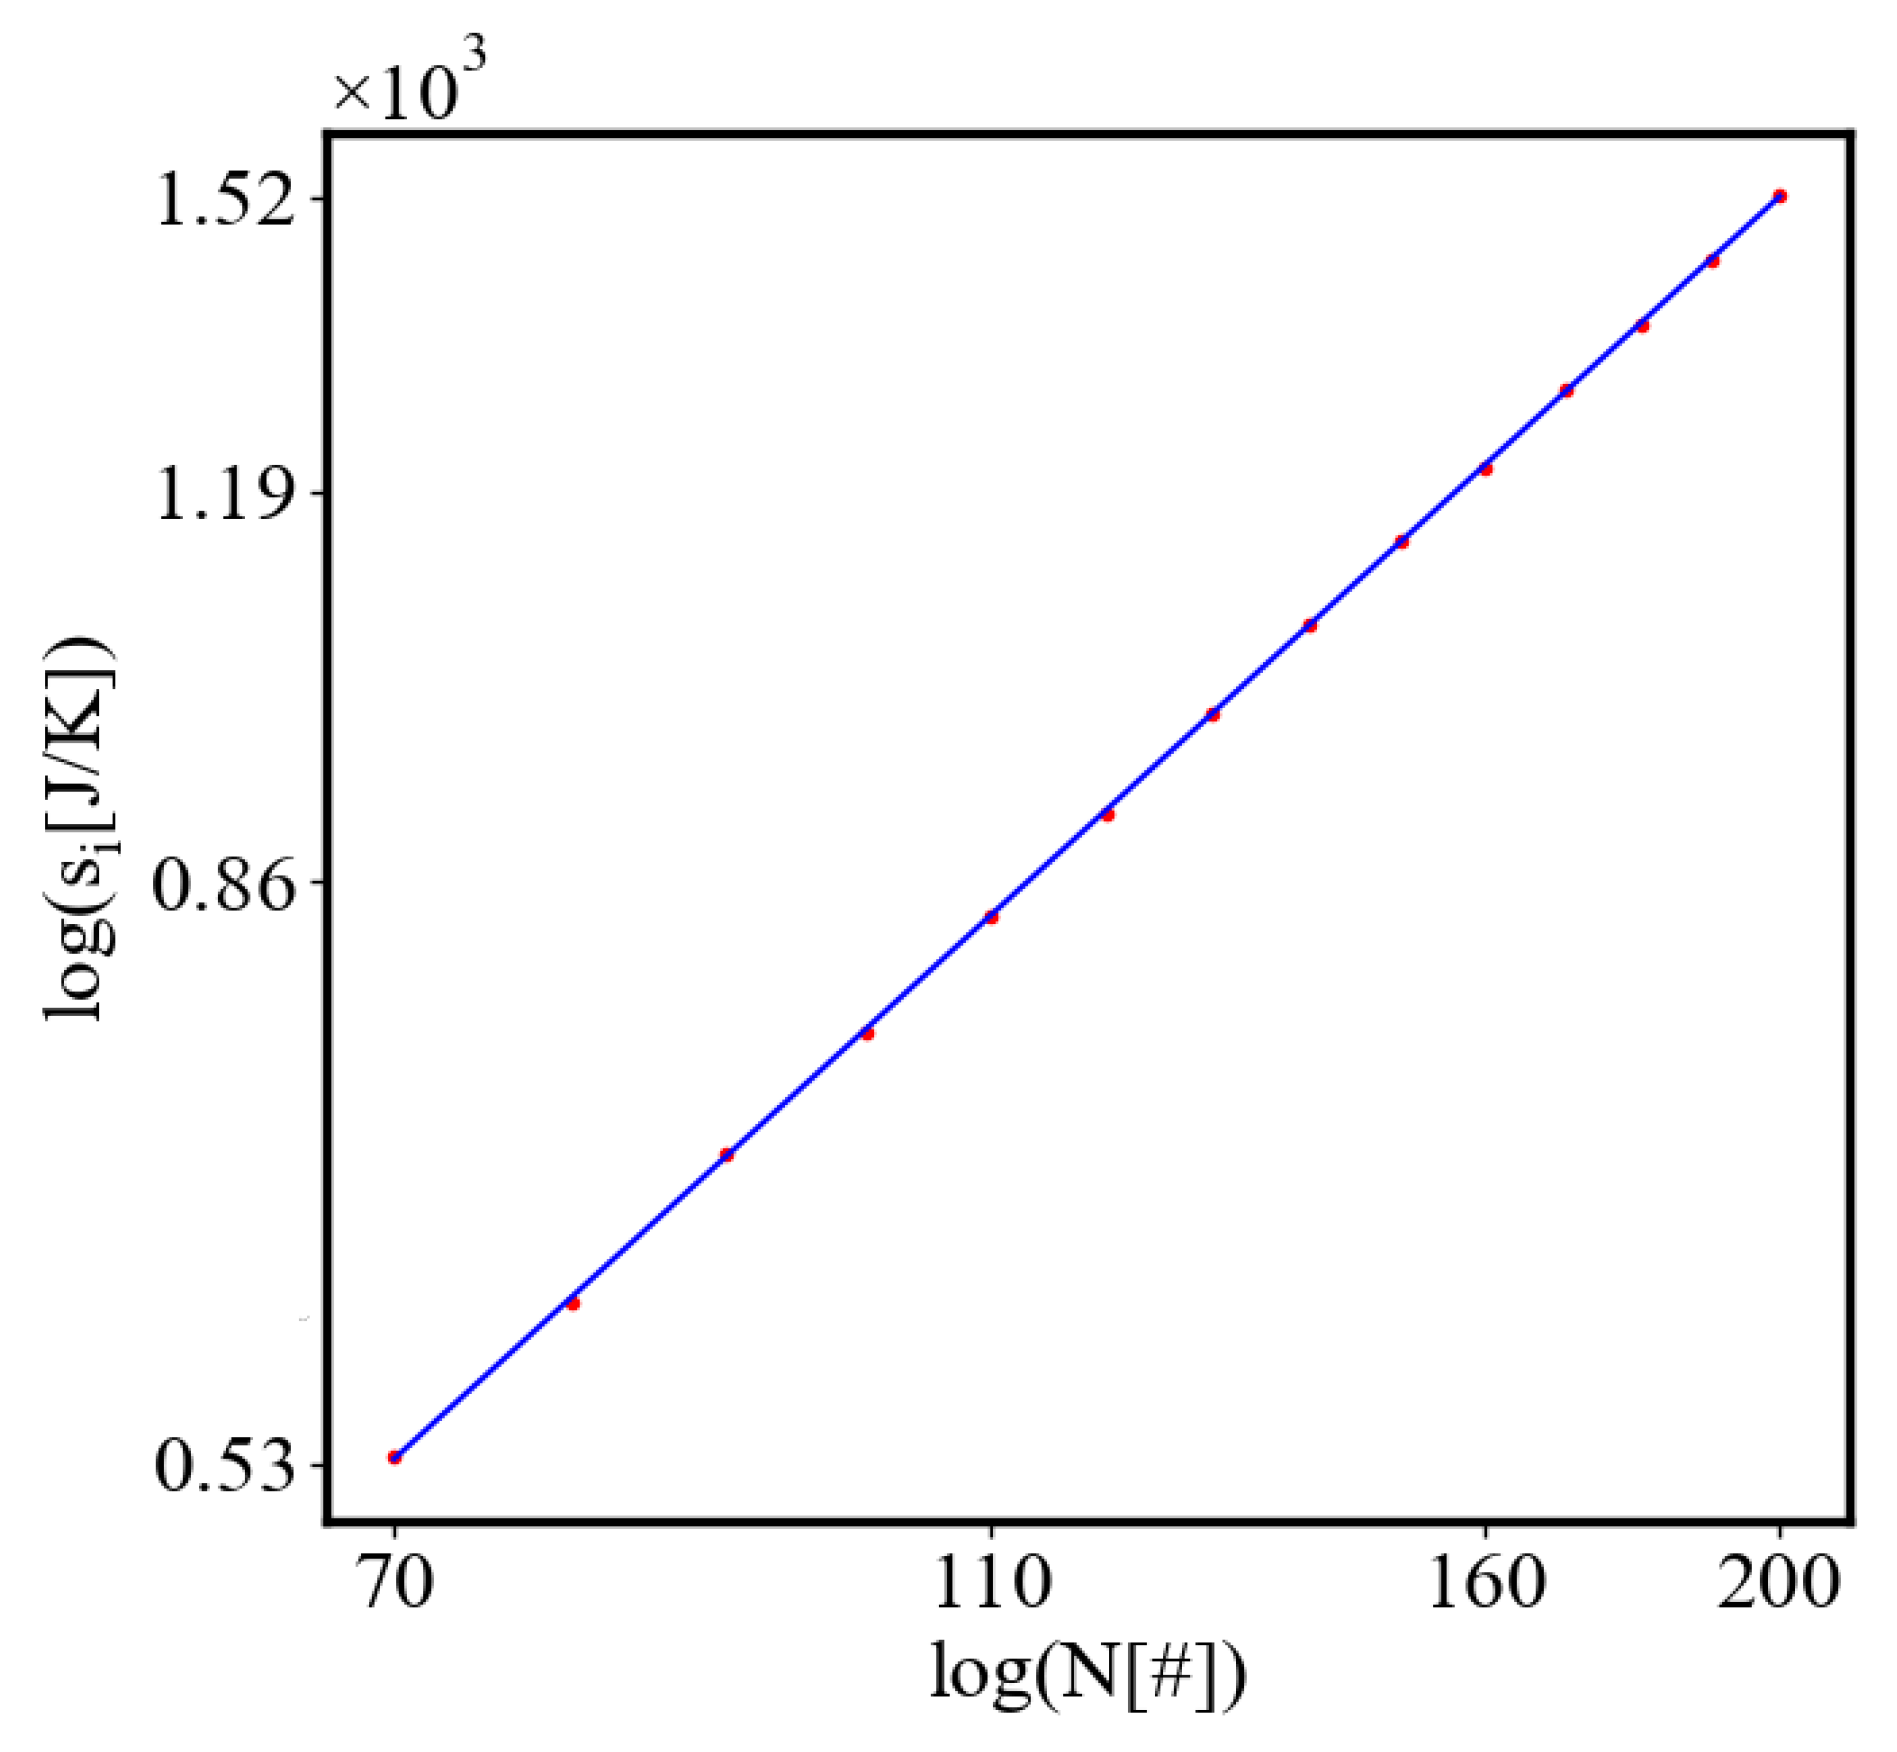
Figure 46. The relationship between the progress of nucleosynthesis and the initial total number of solar masses on a log-log scale, illustrating the power-law scaling inherent in self-organizing systems. It relates to the predictions from the model in this paper and the simulation results. The initial metalicity of stars varies from bottom to top from 0, 0.001, 0.004 and 0.02. Reproduced from [Butler, T.H.; Georgiev, G.Y. Self-Organization in Stellar Evolution: Size-Complexity Rule. In Efficiency in Complex Systems: Self-Organization Towards Increased Efficiency; Springer, 2021; pp. 53–80.] Reproduced with permission from Springer Nature.
Preprints 141408 g046
The corresponding values of the power law fits in Table 5 for those characteristics vs N respectively: For Δ s is 1, for Δ ρ is 1.11, for i is 1.09, for ϕ is 1.104, and for Q is 0.983. We consider this as a good alignment between the results of this simulation and the characteristics of stars in their evolution in terms of the progress of nucleosynthesis. Another factor that makes the comparison valid is that the data for stars are at the end of the stellar life, and in our simulation, the data are at the end of each simulation at different populations, which means that the self-organization process is complete in both cases.
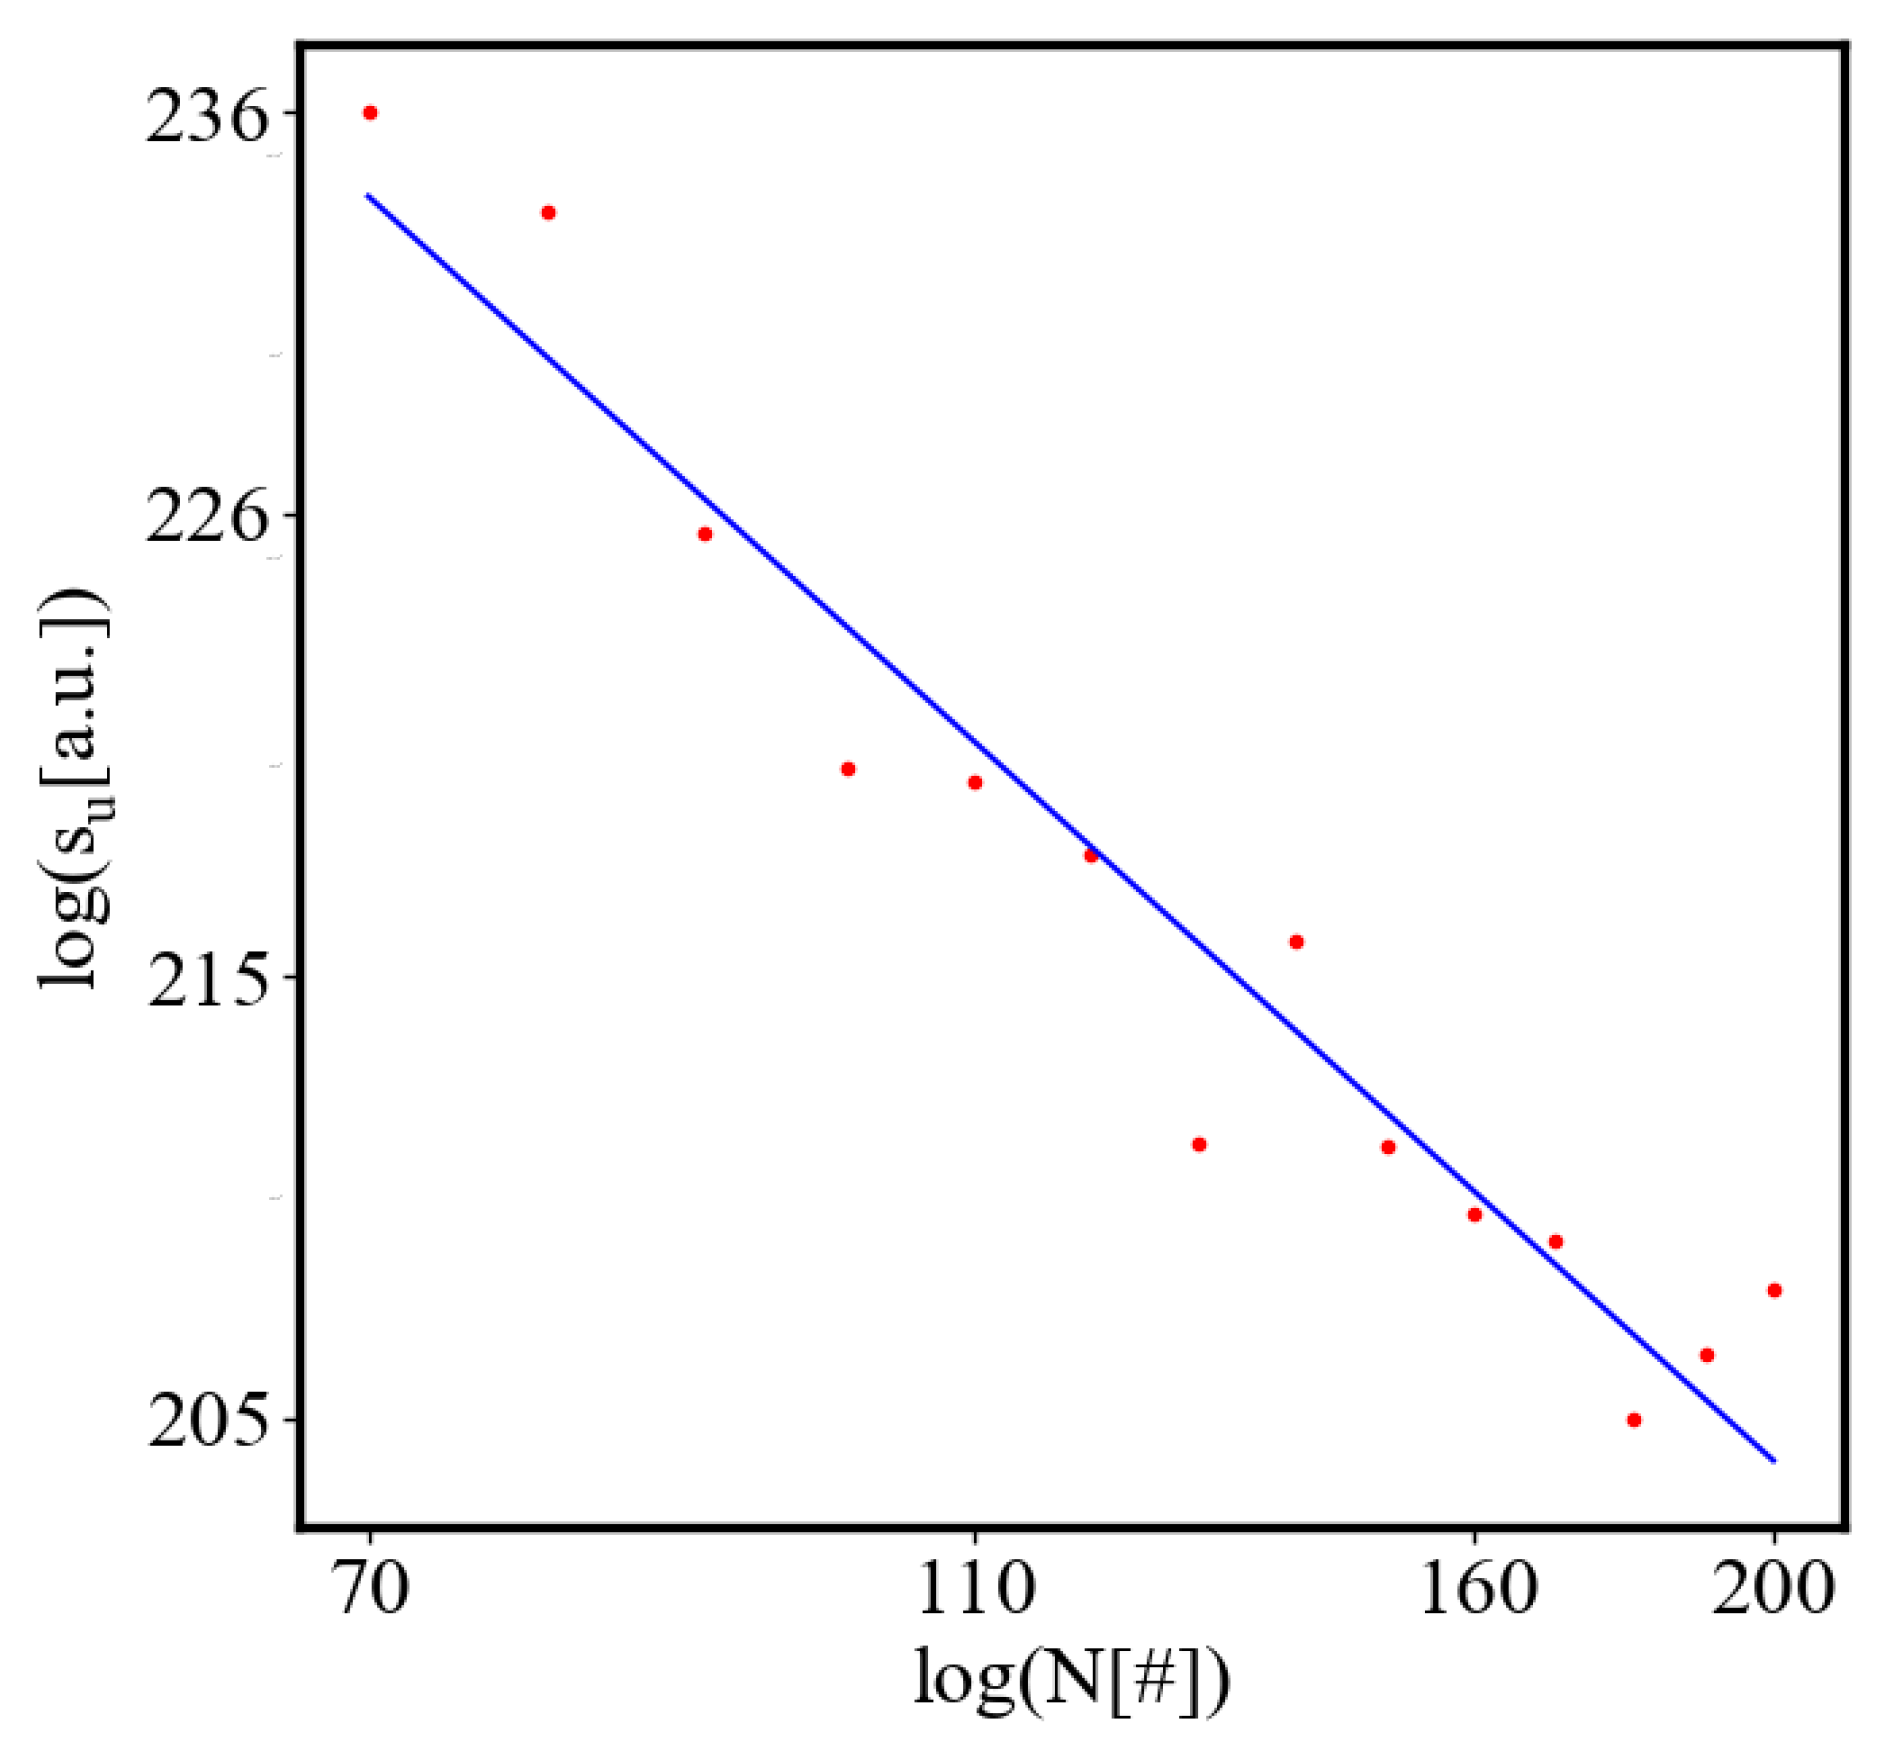
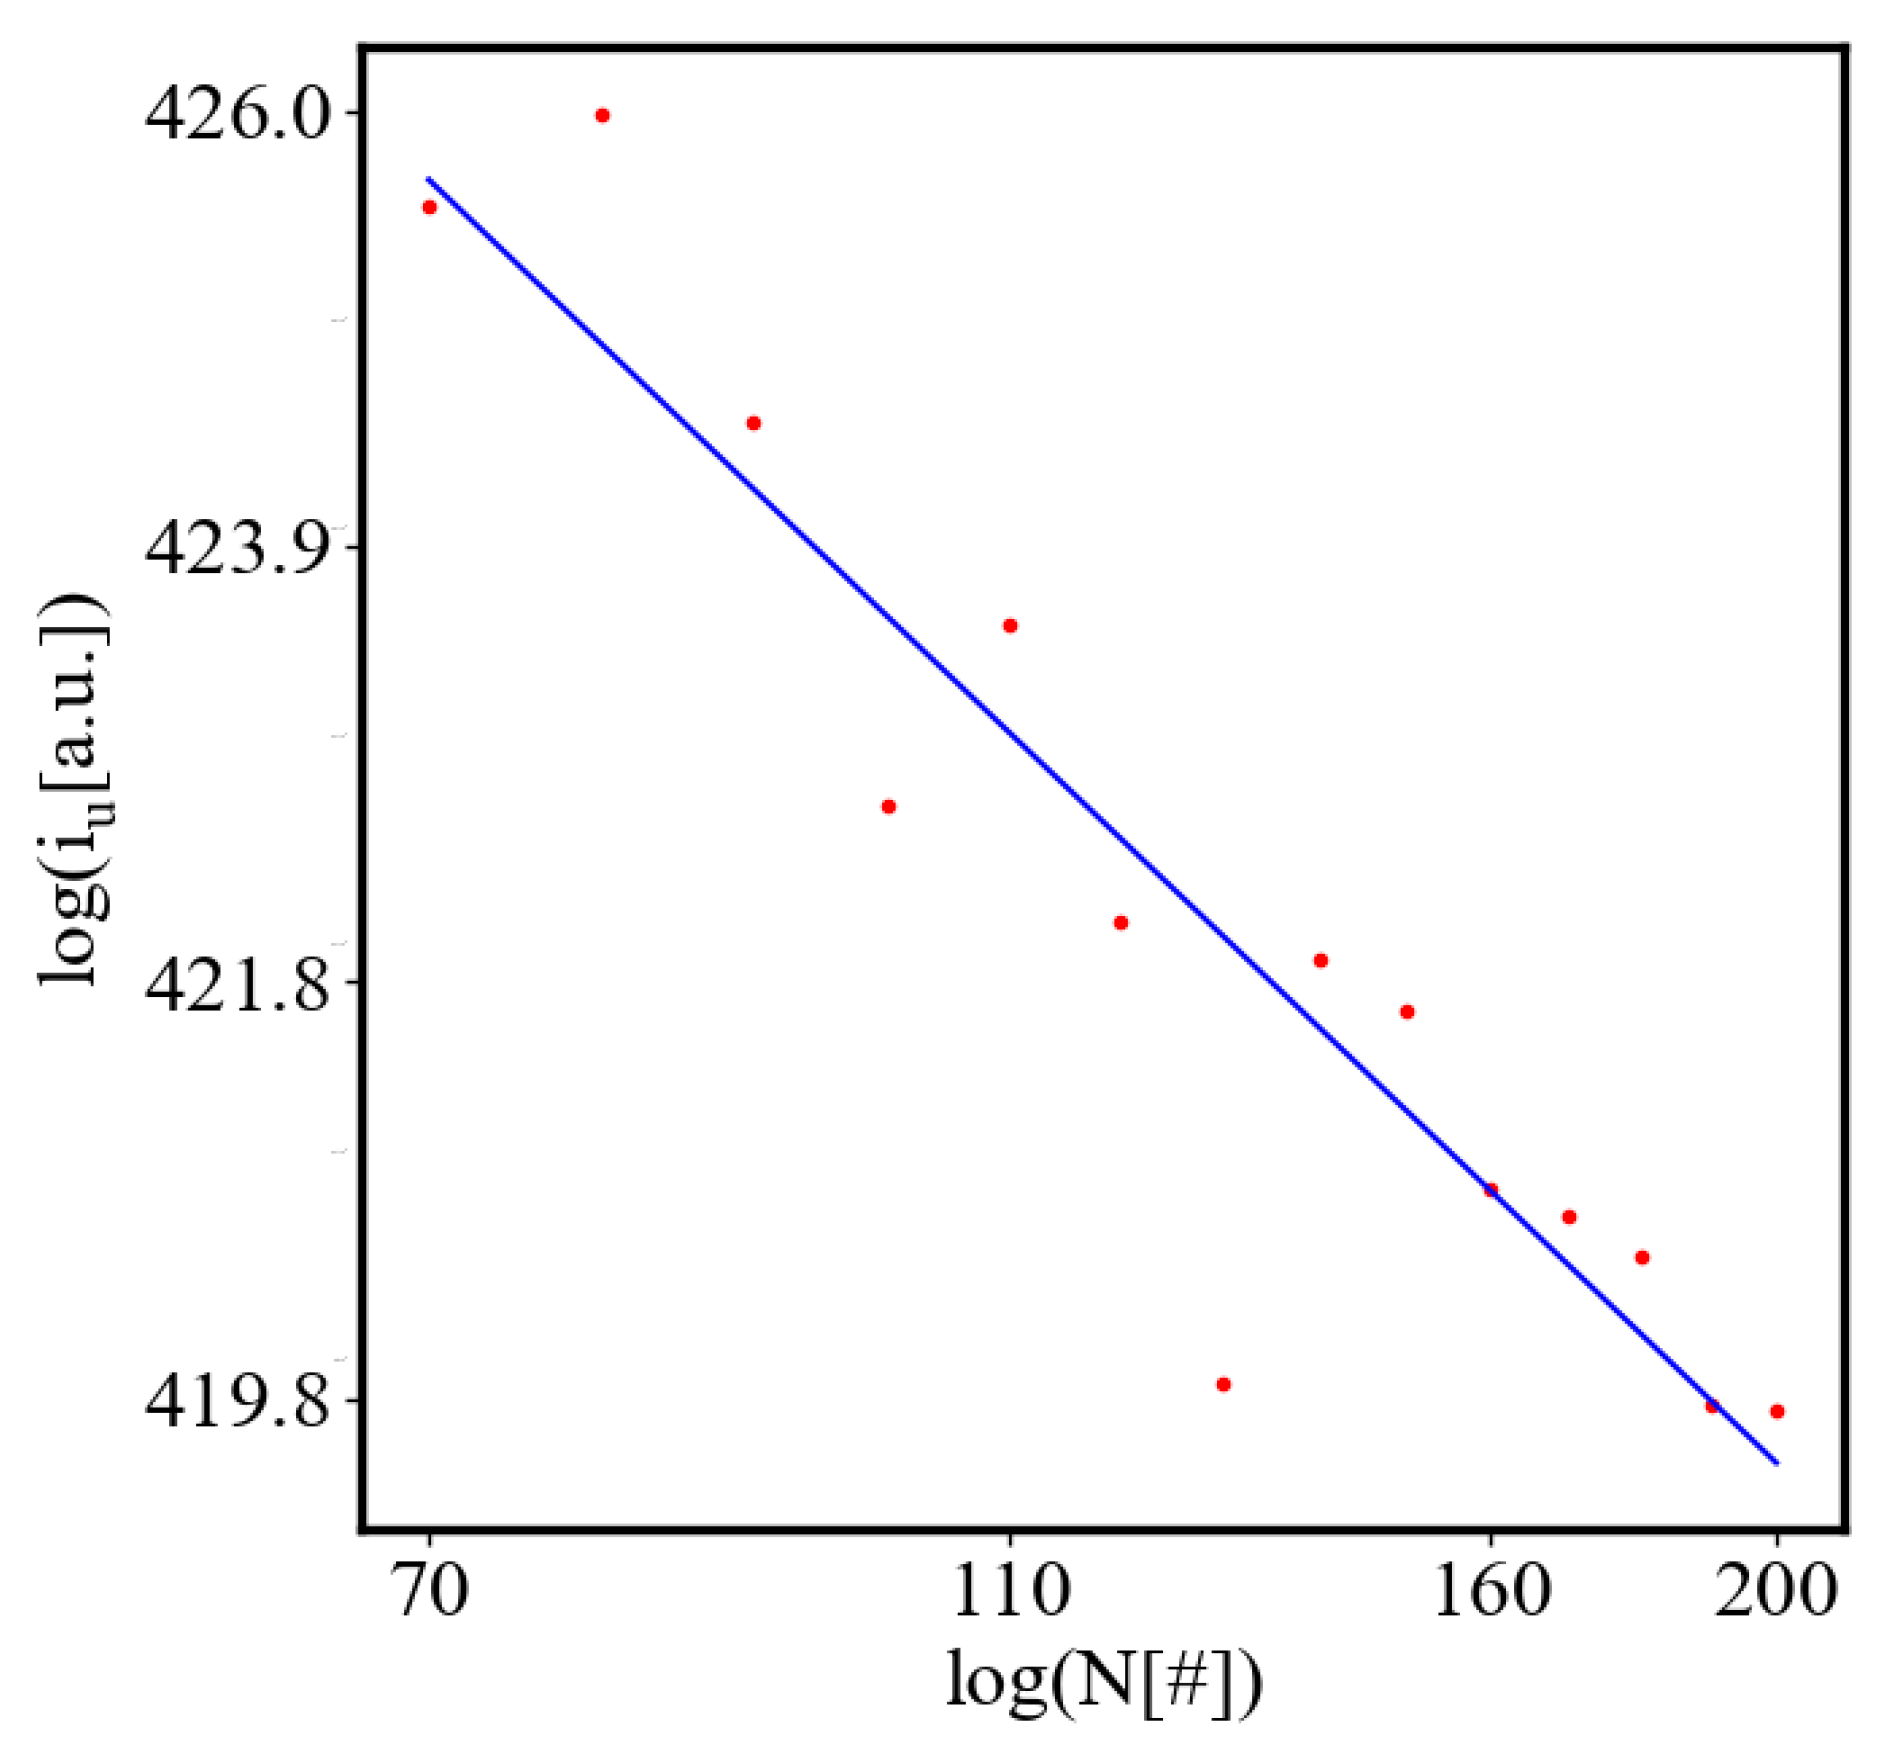
6.3.2. Evolution of Cities

In Figure 47 of the paper [82], Figure 1A, we see an example of data analysis for cities, which shows that the level of organization in a system, in terms of the GDP, is in a scaling law relationship with its size in terms of population. It is with an exponent of 1.126. This means that many of the power law dependencies in the simulation are in the range of data for cities as complex self-organizing systems.
Figure 47. The relationship between GDP and population for cities illustrates the power-law scaling in self-organizing systems. Caption: "A typical superlinear scaling law (solid line): Gross Metropolitan Product of US MSAs in 2006 (red dots) vs. population; the slope of the solid line has exponent, 1.126 (95% CI [1.101,1.149]) ). " Reproduced from [Bettencourt, L. M., Lobo, J., Strumsky, D., West, G. B. (2010). Urban scaling and its deviations: Revealing the structure of wealth, innovation and crime across cities. PloS one, 5(11), e13541. https://doi.org/10.1371/journal.pone.0013541], This figure is reproduced under a Creative Commons Attribution (CC-BY) International License (http://creativecommons.org/licenses/by/4.0/).
Preprints 141408 g047
The closest characteristics from this simulation to the data in Figure 47 and the values of their corresponding exponents are: Δ s corresponds to a decrease in internal entropy of the simulation which relates to the GDP of cities as a measure of their productivity and therefore degree of self-organization. Δ ρ relates to the GDP of cities, as larger cities are more dense. ϕ relates to the GDP of cities, as to increase the GDP more events, i.e. more transactions are necessary. Q relates to GDP, because it is proportional to the total energy spent to produce the Gross Product. The X-axis in Figure 47 is population, analogous to N in our simulation, which is the size of the system in terms of the number of agents.
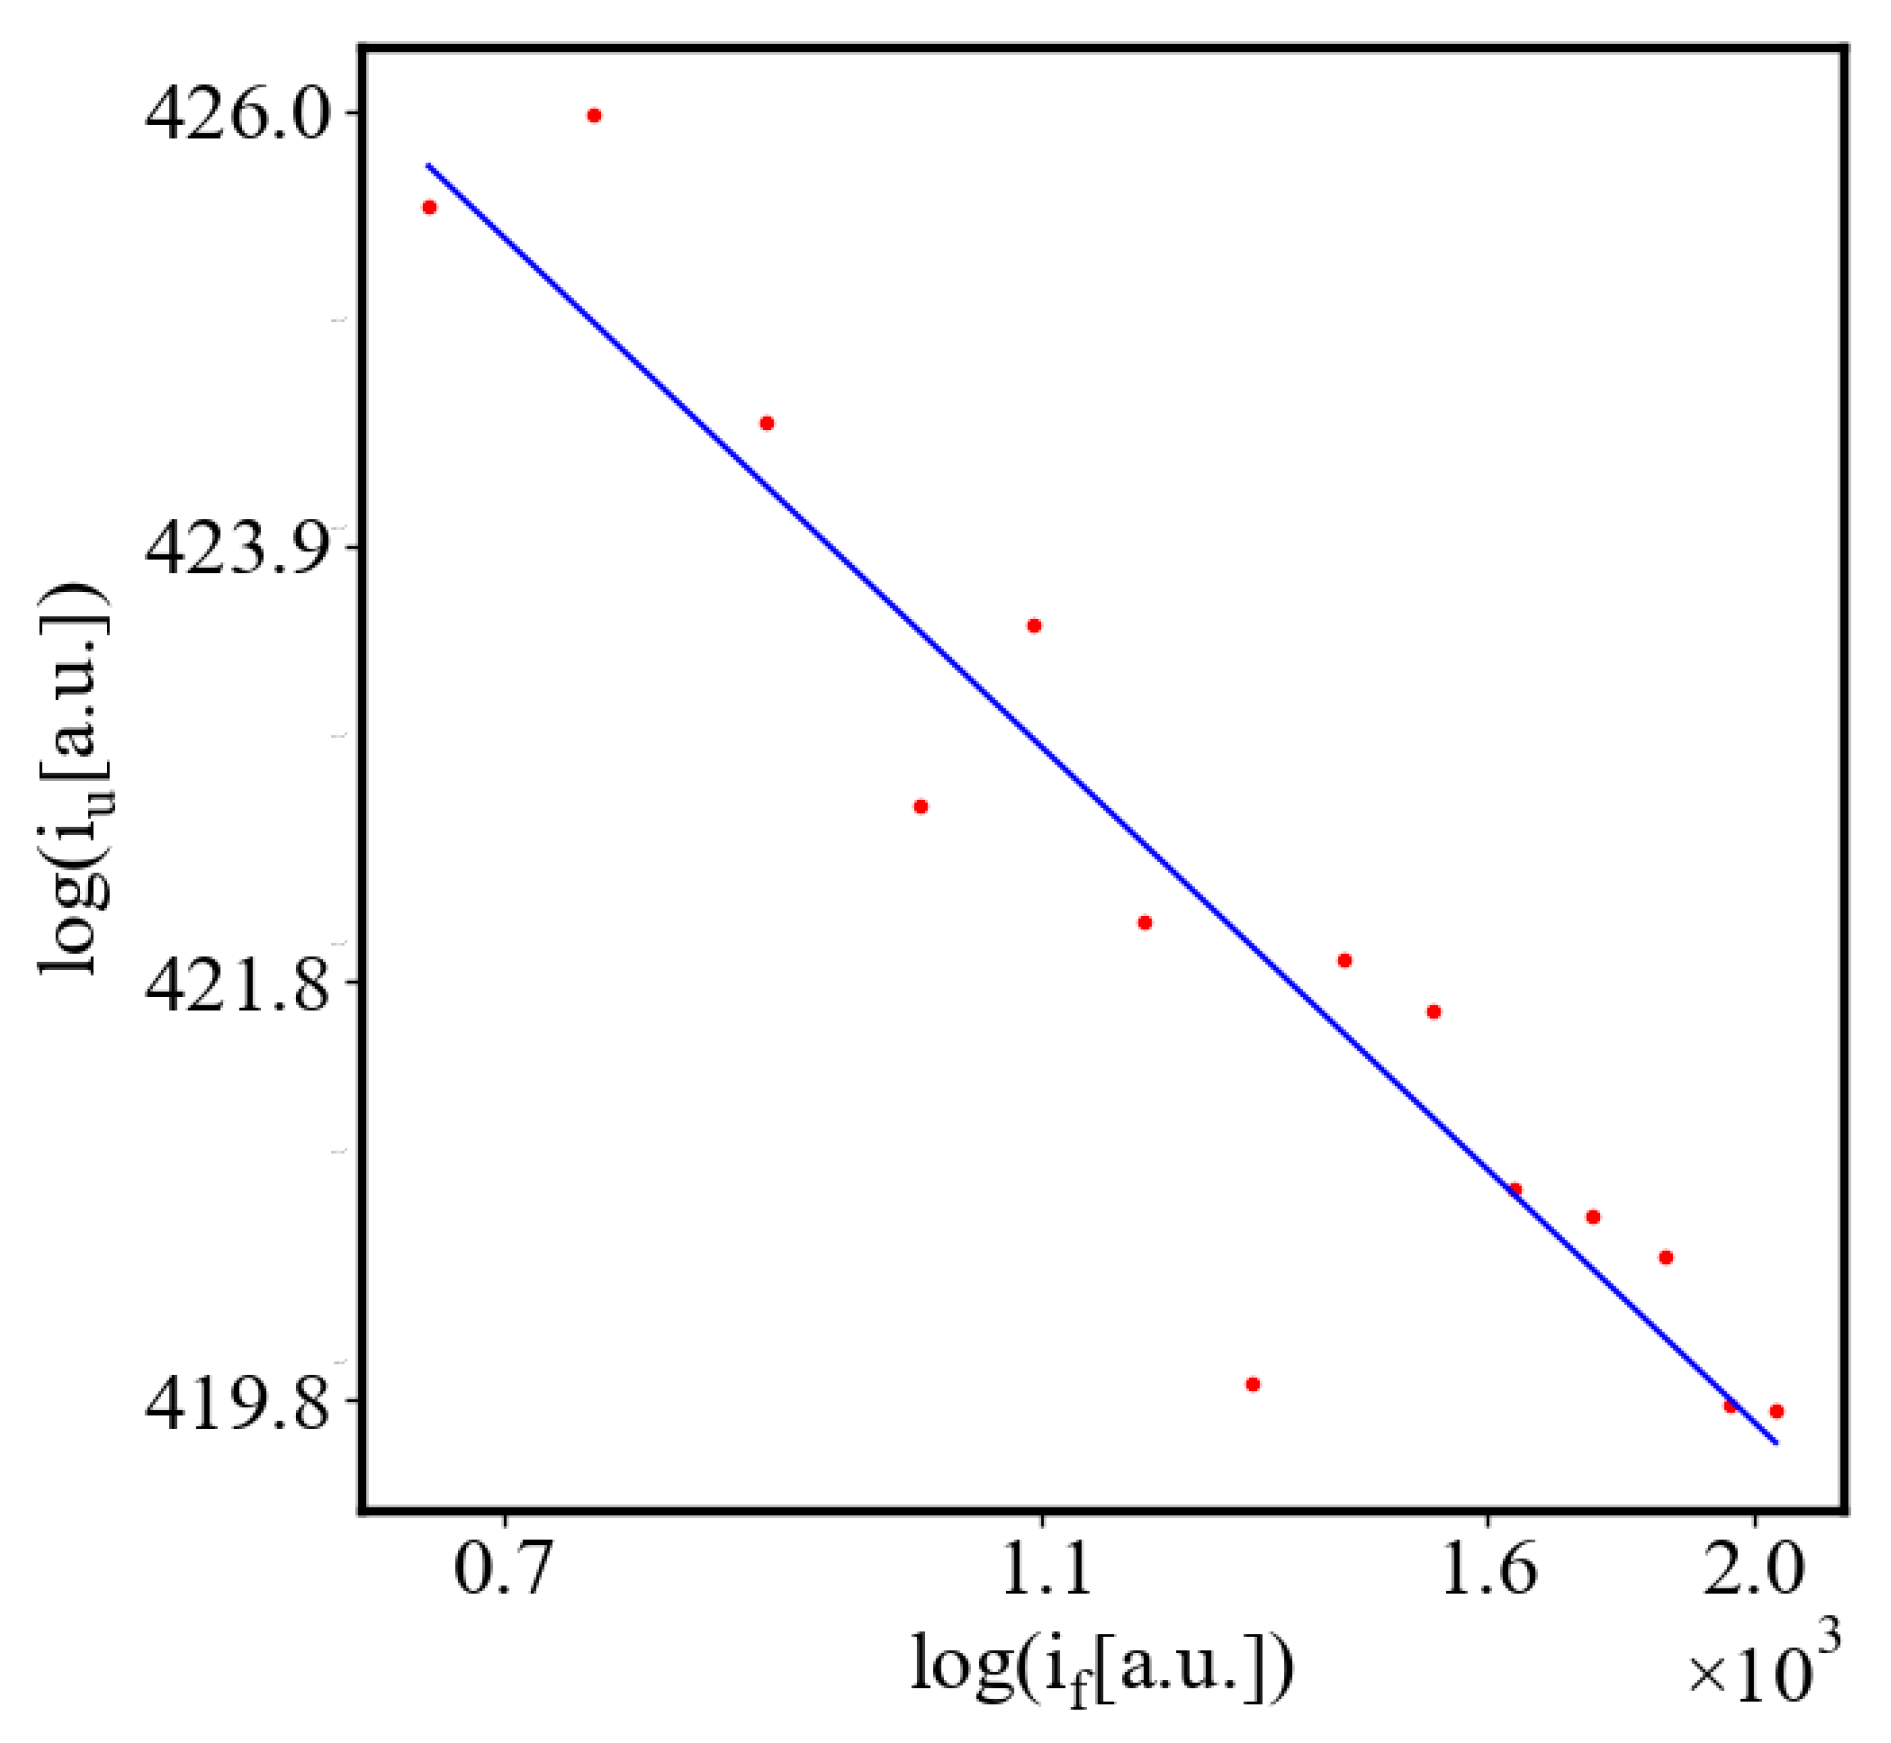
The corresponding values of the power law fits in Table 5 for those characteristics vs N, as mentioned above is respectively: For Δ s is 1, for Δ ρ is 1.11, for i is 1.09, for ϕ is 1.104, and for Q is 0.983. We consider this as a good alignment between the results of this simulation and the characteristics of cities in terms of GDP.

6.3.3. Further Confirmation with Literature Data

The relationships between the results of this simulation and published results, in this section, are in good initial agreement with real-world data. They warrant greater confirmation and investigation in further simulations, as more realistic details, such as dissipation and obstacles are added to bring the simulations closer to the specifics of real-world systems. Further comparisons with results for other systems from published data will serve as additional tests and verifications. It will illuminate the correspondences with real systems and limitations of our model and point to a direction for its future improvement and refinement with the goal of helping to understand the mechanisms of self-organization and structure formation in evolving complex systems.

6.4. A Table Presenting the Fit Values for the Power Law Relationships in the Simulation

In Table 5 we show the values of the fit parameters for the power law relationships:
Table 5. This table contains all the fits for the power-law graphs. The "a" and "b" values in each row follow the equation y = a x b , and the R 2 is shown in the last column.
variables a b R 2
α vs. Q 7.713 · 10 36 6.787 · 10 2 0.977
α vs. i 1.042 · 10 35 6.131 · 10 2 0.981
α vs. ϕ 1.510 · 10 35 6.055 · 10 2 0.982
α vs. Δ s 1.020 · 10 35 6.675 · 10 2 0.978
α vs. Δ ρ 1.647 · 10 35 5.947 · 10 2 0.964
α vs. t 1.622 · 10 34 6.175 · 10 1 0.995
α vs. N 1.168 · 10 35 6.673 · 10 2 0.977
Q vs. i 8.502 · 10 1 9.012 · 10 1 1.000
Q vs. ϕ 2.000 · 10 4 8.897 · 10 1 1.000
Q vs. Δ s 6.202 · 10 1 9.829 · 10 1 0.999
Q vs. Δ ρ 7.133 · 10 4 8.784 · 10 1 0.990
Q vs. t 1.410 · 10 19 8.888 0.972
Q vs. N 4.550 · 10 2 9.830 · 10 1 1.000
i vs. ϕ 4.281 · 10 2 9.873 · 10 1 1.000
i vs. Δ s 7.064 · 10 1 1.090 0.999
i vs. Δ ρ 1.755 · 10 3 9.740 · 10 1 0.988
i vs. t 1.407 · 10 19 9.887 0.976
i vs. N 6.445 1.090 0.999
i u vs. i f 4.626 · 10 2 1.281 · 10 2 0.873
i u vs. N 4.516 · 10 2 1.391 · 10 2 0.864
ϕ vs. Δ s 1.521 · 10 3 1.104 0.999
ϕ vs. Δ ρ 4.175 9.864 · 10 1 0.988
ϕ vs. t 5.438 · 10 16 1.002 · 10 1 0.977
ϕ vs. N 1.427 · 10 2 1.104 0.999
Δ s vs. Δ ρ 1.301 · 10 3 8.939 · 10 1 0.991
Δ s vs. t 4.439 · 10 17 9.035 0.969
Δ s vs. N 7.598 1.000 1.000
s i vs. N 7.598 1.000 1.000
s f vs. N 5.793 9.745 · 10 1 1.000
s u vs. N 4.059 · 10 2 1.298 · 10 1 0.938
s u vs. s f 5.121 · 10 2 1.329 · 10 1 0.935
Δ ρ vs. t 1.103 · 10 16 9.975 0.949
Δ ρ vs. N 3.308 · 10 3 1.110 0.991
t vs. N 7.061 · 10 1 1.075 · 10 1 0.970

7. Discussion

Hamilton’s principle of stationary action has long been a cornerstone in physics, showing that the path taken by any system between two states is one that minimizes action for the most potentials in classical physics. In some cases, it is a saddle point never being a true maximum. Our research aims to extend this principle to the realm of complex systems, proposing that the average action efficiency (AAE) serves as a predictor, measure, and driver of self-organization within these systems. By utilizing agent-based modeling (ABM), particularly through simulations of ant colonies, we demonstrate that systems naturally evolve towards states of higher organization and efficiency, consistent with the minimization of average physical action for one event in a system. In this simulation, as the number of agents in each run is fixed, all characteristics undergo a phase transition from an unorganized initial state to an organized final state. All of the characteristics are correlated with power-law relationships in the final state. We compare these results from the simulation with data for real systems, to show correspondence. This provides a new way of understanding self-organization and its driving mechanisms. Further work is necessary to expand and validate the applicability of this model.
In an example of one agent, a state of the system where it has half of the action compared to another state, the system is calculated to have double the amount of organization. An extension of the model to open systems of N agents provides a method for calculating the level of organization of any system. The significance of this result is that it could provide a quantitative measure for comparing different levels of organization within the same system and for comparing different systems.
The size-complexity rule can be summarized as the following: for a system to improve, it must become larger i.e. for a system to become more organized and action-efficient, it needs to expand. As a system’s action efficiency increases, it can grow, creating a positive feedback loop where growth and action efficiency reinforce each other. The negative feedback loop is that the characteristics of a complex system cannot deviate much from the power law relationship. If we externally limit the growth of the system, we also limit the increase in its action efficiency. Then the action becomes stationary which means that the average action efficiency and the total action in the system stop increasing. Otherwise for unbounded, growing systems, action is dynamic, which means that the action efficiency and total action can continue increasing. This applies to dynamic, open thermodynamic systems that operate away from thermodynamic equilibrium and have flows of energy and matter from and to the environment. The growth of any system is proposed to be driven by its increase in action efficiency. Without reaching a new level of action efficiency, growth may be impossible. We propose that this principle can be one explanation of evolution in organisms and societies. Further research and exploration is necessary to quantify those connections.
Other characteristics such as the total amount of action in the system, the number of events per unit of time, the internal entropy decrease, the density of agents, the amount of information in the system (measured in terms of pheromone levels), and the average time per event are strongly correlated and increase according to a power law function of each other. Changing the population in the simulation influences all these characteristics through their power law relationships. Because these characteristics are interconnected, measuring one can provide the values of the others at any given time in the simulation using the coefficients in the power law fits (Table ??). If we consider the economy as a self-organizing complex system, we can find a logical explanation for the Jevons paradox, which may need to be renamed to Jevons rule, because it is an observation of a regular property of complex systems, and not an unexplained counter-intuitive fact, as it has been considered for a long time.
We propose a unit-total dualism, observing that in some characteristics, such as action and entropy, the action and entropy per event may decrease, while their total values appear to proportionally increase across the whole system. The unit and total quantities are correlated with power law equations in the results of this simulation. In the case of action, this leads to dynamical action principles, where unit action is decreasing in self-organization, while total action is increasing. Those variational principles are observed in self-organizing complex systems, and not in isolated agents.
Emergence is a property of the entire system and not of its parts. The formation of the path in the simulation is an emergent property in this system due to the interactions of the agents and is not specified in the rules of the simulation. This least average unit action state of the system, which is its most organized state is predicted from the principle of least action. This means that we have a way to predict emergent properties in complex systems, using basic physics principles. The emergence of structure from the properties of the agents is a hallmark of self-organizing systems and it appears spontaneously in this example, and in many well studied systems, such as Benard Cells, vortices, and in real ant colonies. It needs to be tested in many other simulations and real systems to establish its validity.
As a system grows, the positive feedback loops between its characteristics are amplified. This growth-driven intensification strengthens the interdependencies among characteristics, inherently enhancing the system’s robustness. For example, larger systems allow for more distributed interactions, leading to increased information flow, improved efficiency, and stabilized organization. These strengthened feedback loops enable the system to maintain its homeostatic balance and recover more effectively from perturbations.
The findings suggest that the Average Action Efficiency (AAE) framework offers a promising way of understanding the robustness and resilience of complex systems, as higher AAE configurations in simulations demonstrated enhanced organization and resistance to perturbations. However, these results are based on specific assumptions and controlled conditions, which may limit their generalizability to all complex systems or environmental contexts. The observed connection between AAE and system stability warrants further investigation across diverse domains, such as biology, ecology, and engineering, to confirm its broader applicability. Future research should focus on exploring the interplay between AAE, external perturbations, and other system characteristics to refine its role as a predictive metric for resilience. While these findings provide a foundation for advancing theoretical and practical insights into self-organization, they also emphasize the importance of cautious interpretation and the need for continued empirical validation.
This model can be improved upon and modified. This is just one approach and a first-order approximation of self-organization to capture its main characteristics. In this sense, it is an idealized case. More detailed and higher-level approaches and methods are possible and they will be developed in future work. There are so many specific cases in nature that the method will need to be adapted to reflect their specific interactions. We want to leave a sense that this is a new open area of exploration, in which much will be discovered and the approaches presented in this paper are just the initial steps in that direction.

8. Conclusions

This study suggests that average action efficiency increases during self-organization and system growth in a model compared with the results of computer simulation and results for real systems from the literature, serving as a potential driver and a measure for understanding the evolution of specific complex systems. This offers new opportunities for understanding and describing the processes leading to increased organization in complex systems. It offers prospects for future research, laying a foundation for more in-depth exploration into the dynamics of self-organization and potentially inspiring the development of new strategies for optimizing system performance and resilience.
Our findings suggest that self-organization is inherently driven by a positive feedback loop, where systems evolve towards states of minimal unit action and maximal organization. Self-organization driven by action principles may offer a possible explanation, aligning with Occam’s razor, pending further comparative analysis. It could be the answer to "Why and how do complex systems self-organize at all?". Action efficiency always acts together with all other characteristics in the model, not in isolation. It drives self-organization through this mechanism of positive and negative feedback loops.
We found that this theory is working well for the current simulation. With additional details and features, it can be tested and applied to more realistic systems. As any model, it needs to be always retested because every theory, every method, and every approach has its limits and needs to be extended, expanded, enriched, and detailed as new levels of knowledge are reached. We expect this from all scientific theories and explanations. This model presents opportunities for testing in various networks, such as metabolic or ecological networks, to explore its broader applicability.
Our simulations suggest that, in the studied systems the level of organization is inversely proportional to the average physical action required for system processes. This measure aligns with the principle of least action, a fundamental concept in physics, and extends its application to complex, non-equilibrium systems. The results from our ant colony simulations consistently show that systems with higher average action efficiency exhibit greater levels of organization, validating our hypothesis in this example.
When the processes of self-organization are open-ended and continuous, the stationary action principles do not apply anymore except in limited cases. We have dynamical action principles where the quantities are changing continuously, either increasing or decreasing. We propose an extension of the principle of least action to complex systems, characterized by a variational principle of decreasing unit action per one event in a self-organizing complex system, and it is connected with a power law relation to another mirror variational principle of increasing total action of the system. Other variational principles are the decreasing unit entropy per one event in the system, and the increasing of the total entropy as the system grows, evolves, develops, and self-organizes. We term those polar sets of variational principles, unit-total duality.
Other dualities to explore are, that the unit path curvature for one edge of the complex networks decreases, according to Hertz’s principle of least curvature, as the total curvature for traversing all paths in the system increases. The unit path constraint for the motion of one edge decreases, according to the Gauss principle of least constraint, as the total constraint for the motion of all agents as the system grows increases. There are possibly many more variational dualities to be uncovered in self-organizing, evolving, and developing complex systems. Those dualities can be used to analyze, understand, and predict the behavior of complex systems. This is one explanation for the size-complexity rule observed in nature and the scaling relationships in biology and society. The unit-total dualism is that as unit quantities decrease, with the system becoming more action-efficient as a result of self-organization, total quantities grow and both are connected with positive feedback and are correlated by a power law relation. As one example we find a logical explanation for the Jevons and other paradoxes, and the subsequent work of economists in this field, which are also unit-total dualities inherent to the functioning of self-organizing and growing complex systems.
While our results are promising, our study has limitations. The simplified ant colony model used in our simulations does not capture the full spectrum of complexities and interactions present in real-world systems and the role of changing environments. Future research should aim to integrate more detailed and realistic models, incorporating environmental variability and agent heterogeneity, to test the universality and applicability of our findings more broadly and for specific systems. This will help to compare with a wider range of data for real systems. Additionally, the interplay between average action efficiency and other organizational measures, such as entropy and order parameters, deserves further investigation. Understanding how these metrics interact could deepen our comprehension of complex system dynamics and provide a more holistic view of system organization.
Our study suggests that system growth inherently strengthens positive feedback loops, providing a natural mechanism for enhancing robustness across all characteristics. As these loops intensify with increasing system size, they create a self-reinforcing structure that stabilizes and fortifies the system against internal and external disturbances. For example, our simulations show that higher pheromone concentrations (representing information density) correspond to shorter paths and higher organization. This density creates a form of robustness, as agents can find efficient paths even when disrupted.
The implications of our findings are significant for both theoretical research and practical applications. In natural sciences, this new measure can be adapted to quantify and compare the organization of different systems, providing insights into their evolutionary processes. In engineering and artificial systems, our model can guide the design of more efficient and resilient systems by emphasizing the importance of action efficiency. For example, in ecological and biological systems, understanding how organisms optimize their behaviors to achieve greater efficiency can inform conservation strategies and ecosystem management. In technology and artificial intelligence, designing algorithms and systems that follow the principle of least action can lead to more efficient processing and better performance.
We hope that our findings contribute to a deeper understanding of the mechanisms underlying self-organization and offer a novel, quantitative approach to measuring organization in complex systems. This research opens up exciting possibilities for further exploration and practical applications, enhancing our ability to design and manage complex systems across various domains. By providing a quantitative measure of organization, we enhance our ability to design and manage complex systems across various domains. Future research can build on our findings to explore the dynamics of self-organization in greater detail, develop new optimization strategies, and create more efficient and resilient systems.

8.0.1. Future Work

In Part 2 of this paper, we measure the entropy production of this system, and include it in the positive feedback model of characteristics, leading to exponential and power law solutions. Then we verify that the entropy production also obeys the power law relationships with all of the other characteristics of the system. For example, in comparing to the internal entropy, we conclude that as the internal entropy is reduced, the external entropy production increases proportionally, which can be connected to the Maximum Entropy Production Principle, where internal entropy minimization leads to the maximization of external entropy production, therefore we can say that self-organization leads to internal entropy decrease and formation of flow channels which maximize external entropy production.
In Part 3 of this paper, we will show data for the results of the simulation that the rate of increase of self-organization as the size of the system increases is also in power law with all other characteristics. We will include the rates of change of all characteristics as a part of the model of positive feedback loops between them.
In Part 4, we plan to explore the impact of negative feedback loops and additional factors like dissipation, obstacles, and changing boundary conditions on the model and test these predictions through simulations.
In Part 5 of this paper, we will show the phase diagram of the onset of order formation in this simulation as a function of the size of the system in terms of the number of ants and the temperature in the system represented by the wiggle angle of the ants.
In Part 6 of this paper, we will show the effects of friction on the motion of the agents, as a source of internal entropy production, and will study the robustness of the system under perturbations, as a function of friction, randomness in the motion of the agents, and size of the system.
In Part 7, we aim to conduct and present 3D simulations exploring growth rates as functions of various system characteristics, where the rates of growth are also a function of the levels of all of the characteristics, derive the solutions, and test them with the results from simulations.

Author Contributions

Conceptualization, G.G.; Theory, G.G.; Model, G.G.; methodology, M.B.; software, M.B.; validation, G.G. and M.B.; formal analysis, M.B.; investigation, G.G.; resources, G.G.; data curation, G.G.; writing original draft preparation, G.G.; writing review and editing, G.G.; visualization, M.B. and G.G.; supervision, G.G.; project administration, G.G.; funding acquisition, G.G. All authors have read and agreed to the published version of the manuscript.

Data Availability Statement

The datasets used and/or analyzed during the current study are available from the corresponding author on reasonable request.

Acknowledgments

The authors thank Assumption University for providing a creative atmosphere and funding and its Honors Program, specifically Prof. Colby Davie, for continuous research support and encouragement. Matthew Brouillet thanks his parents for their encouragement. Georgi Georgev thanks his wife for patience and support for this manuscript.

References

  1. Prigogine, I. Introduction to Thermodynamics of Irreversible Processes, 2nd ed.; Interscience Publishers/John Wiley and Sons: New York, 1961.
  2. Kondepudi, D.; Prigogine, I. Modern thermodynamics: from heat engines to dissipative structures; John Wiley and sons, 2014.
  3. Sagan, C. Cosmos; Random House: New York, 1980.
  4. Chaisson, E.J. Cosmic evolution; Harvard University Press, 2002.
  5. Kurzweil, R. The singularity is near: When humans transcend biology; Penguin, 2005.
  6. Azarian, B. The romance of reality: How the universe organizes itself to create life, consciousness, and cosmic complexity; Benbella books, 2022.
  7. Walker, S.I. Life as No One Knows It: The Physics of Life’s Emergence; Riverhead Books: New York, USA, 2024. Published on August 6, 2024.
  8. Bejan, A. The physics of life: the evolution of everything; St. Martin’s Press, 2016.
  9. Georgiev, G.Y. The development: From the atom to the society; Sofia, 1993. Bulgarian Academy of Sciences, Call Number: III 186743.
  10. Georgiev, G.Y. Personal Journal, 1986. L12, p.23.
  11. De Bari, B.; Dixon, J.; Kondepudi, D.; Vaidya, A. Thermodynamics, organisms and behaviour. Philosophical Transactions of the Royal Society A 2023, 381, 20220278. [Google Scholar] [CrossRef] [PubMed]
  12. England, J.L. Self-organized computation in the far-from-equilibrium cell. Biophysics Reviews 2022, 3. [Google Scholar] [CrossRef] [PubMed]
  13. Walker, S.I.; Davies, P.C. The algorithmic origins of life. Journal of the Royal Society Interface 2013, 10, 20120869. [Google Scholar] [CrossRef] [PubMed]
  14. Walker, S.I. The new physics needed to probe the origins of life. Nature 2019, 569, 36–39. [Google Scholar] [CrossRef]
  15. Georgiev, G.; Georgiev, I. The least action and the metric of an organized system. Open systems & information dynamics 2002, 9, 371. [Google Scholar]
  16. Georgiev, G.Y.; Gombos, E.; Bates, T.; Henry, K.; Casey, A.; Daly, M. Free Energy Rate Density and Self-organization in Complex Systems. In Proceedings of ECCS 2014; Springer, 2016; pp. 321–327.
  17. Georgiev, G.Y.; Henry, K.; Bates, T.; Gombos, E.; Casey, A.; Daly, M.; Vinod, A.; Lee, H. Mechanism of organization increase in complex systems. Complexity 2015, 21, 18–28. [Google Scholar] [CrossRef]
  18. Georgiev, G.Y.; Chatterjee, A.; Iannacchione, G. Exponential Self-Organization and Moore’s Law: Measures and Mechanisms. Complexity 2017, 2017. [Google Scholar] [CrossRef]
  19. Butler, T.H.; Georgiev, G.Y. Self-Organization in Stellar Evolution: Size-Complexity Rule. In Efficiency in Complex Systems: Self-Organization Towards Increased Efficiency; Springer, 2021; pp. 53–80.
  20. Shannon, C.E. A Mathematical Theory of Communication. Bell System Technical Journal 1948, 27, 379–423. [Google Scholar] [CrossRef]
  21. Jaynes, E.T. Information Theory and Statistical Mechanics. Physical Review 1957, 106, 620. [Google Scholar] [CrossRef]
  22. Gell-Mann, M. Complexity Measures - an Article about Simplicity and Complexity. Complexity 1995, 1, 16–19. [Google Scholar]
  23. Yockey, H.P. Information Theory, Evolution, and The Origin of Life; Cambridge University Press, 2005.
  24. Crutchfield, J.P.; Feldman, D.P. Information Measures, Effective Complexity, and Total Information. Physical Review E 2003, 67, 061306. [Google Scholar]
  25. Williams, P.L.; Beer, R.D. Information-Theoretic Measures for Complexity Analysis. Chaos: An Interdisciplinary Journal of Nonlinear Science 2010, 20, 037115. [Google Scholar]
  26. Ay, N.; Olbrich, E.; Bertschinger, N.; Jost, J. Quantifying Complexity Using Information Theory, Machine Learning, and Algorithmic Complexity. Journal of Complexity 2013. [Google Scholar]
  27. Kolmogorov, A.N. Three approaches to the quantitative definition of information. Problems of Information Transmission 1965, 1, 1–7. [Google Scholar] [CrossRef]
  28. Grassberger, P. Toward a quantitative theory of self-generated complexity. International Journal of Theoretical Physics 1986, 25, 907–938. [Google Scholar] [CrossRef]
  29. Pincus, S.M. Approximate entropy as a measure of system complexity. Proceedings of the National Academy of Sciences 1991, 88, 2297–2301. [Google Scholar] [CrossRef]
  30. Costa, M.; Goldberger, A.L.; Peng, C.K. Multiscale entropy analysis of complex physiologic time series. Physical review letters 2002, 89, 068102. [Google Scholar] [CrossRef] [PubMed]
  31. Lizier, J.T.; Prokopenko, M.; Zomaya, A.Y. Local information transfer as a spatiotemporal filter for complex systems. Physical Review E 2008, 77, 026110. [Google Scholar] [CrossRef] [PubMed]
  32. Rosso, O.A.; Larrondo, H.A.; Martin, M.T.; Plastino, A.; Fuentes, M.A. Distinguishing noise from chaos. Physical Review Letters 2007, 99, 154102. [Google Scholar] [CrossRef]
  33. Maupertuis, P.L.M.d. Essay de cosmologie; Netherlands, De l’Imp. d’Elie Luzac, 1751.
  34. Goldstein, H. Classical Mechanics; Addison-Wesley, 1980.
  35. Taylor, J.C. Hidden unity in nature’s laws; Cambridge University Press, 2001.
  36. Lauster, M. On the Principle of Least Action and Its Role in the Alternative Theory of Nonequilibrium Processes. In Variational and Extremum Principles in Macroscopic Systems; Elsevier, 2005; pp. 207–225.
  37. Nath, S. Novel molecular insights into ATP synthesis in oxidative phosphorylation based on the principle of least action. Chemical Physics Letters 2022, 796, 139561. [Google Scholar] [CrossRef]
  38. Bersani, A.M.; Caressa, P. Lagrangian descriptions of dissipative systems: a review. Mathematics and Mechanics of Solids 2021, 26, 785–803. [Google Scholar] [CrossRef]
  39. Endres, R.G. Entropy production selects nonequilibrium states in multistable systems. Scientific reports 2017, 7, 14437. [Google Scholar] [CrossRef]
  40. Martyushev, L.M.; Seleznev, V.D. Maximum entropy production principle in physics, chemistry and biology. Physics reports 2006, 426, 1–45. [Google Scholar] [CrossRef]
  41. Martyushev, L.M. Maximum entropy production principle: History and current status. Physics-Uspekhi 2021, 64, 558. [Google Scholar] [CrossRef]
  42. Dewar, R. Information theory explanation of the fluctuation theorem, maximum entropy production and self-organized criticality in non-equilibrium stationary states. Journal of Physics A: Mathematical and General 2003, 36, 631. [Google Scholar] [CrossRef]
  43. Dewar, R.C. Maximum entropy production and the fluctuation theorem. Journal of Physics A: Mathematical and General 2005, 38, L371. [Google Scholar] [CrossRef]
  44. Jaynes, E.T. Information theory and statistical mechanics. Physical review 1957, 106, 620. [Google Scholar] [CrossRef]
  45. Jaynes, E.T. Information theory and statistical mechanics. II. Physical review 1957, 108, 171. [Google Scholar] [CrossRef]
  46. Lucia, U. Entropy generation: Minimum inside and maximum outside. Physica A: Statistical Mechanics and its Applications 2014, 396, 61–65. [Google Scholar] [CrossRef]
  47. Lucia, U.; Grazzini, G. The second law today: using maximum-minimum entropy generation. Entropy 2015, 17, 7786–7797. [Google Scholar] [CrossRef]
  48. Gay-Balmaz, F.; Yoshimura, H. A Lagrangian variational formulation for nonequilibrium thermodynamics. Part II: continuum systems. Journal of Geometry and Physics 2017, 111, 194–212. [Google Scholar] [CrossRef]
  49. Gay-Balmaz, F.; Yoshimura, H. From Lagrangian mechanics to nonequilibrium thermodynamics: A variational perspective. Entropy 2019, 21, 8. [Google Scholar] [CrossRef]
  50. Gay-Balmaz, F.; Yoshimura, H. Systems, variational principles and interconnections in non-equilibrium thermodynamics. Philosophical Transactions of the Royal Society A 2023, 381, 20220280. [Google Scholar] [CrossRef]
  51. Kaila, V.R.; Annila, A. Natural selection for least action. Proceedings of the Royal Society A: Mathematical, Physical and Engineering Sciences 2008, 464, 3055–3070. [Google Scholar] [CrossRef]
  52. Annila, A.; Salthe, S. Physical foundations of evolutionary theory 2010.
  53. Munkhammar, J. Quantum mechanics from a stochastic least action principle. Foundational Questions Institute Essay 2009. [Google Scholar]
  54. Zhao, T.; Hua, Y.C.; Guo, Z.Y. The principle of least action for reversible thermodynamic processes and cycles. Entropy 2018, 20, 542. [Google Scholar] [CrossRef]
  55. García-Morales, V.; Pellicer, J.; Manzanares, J.A. Thermodynamics based on the principle of least abbreviated action: Entropy production in a network of coupled oscillators. Annals of Physics 2008, 323, 1844–1858. [Google Scholar] [CrossRef]
  56. Wang, Q. Maximum entropy change and least action principle for nonequilibrium systems. Astrophysics and Space Science 2006, 305, 273–281. [Google Scholar] [CrossRef]
  57. Ozawa, H.; Ohmura, A.; Lorenz, R.D.; Pujol, T. The second law of thermodynamics and the global climate system: A review of the maximum entropy production principle. Reviews of Geophysics 2003, 41. [Google Scholar] [CrossRef]
  58. Niven, R.K.; Andresen, B. Jaynes’ maximum entropy principle, Riemannian metrics and generalised least action bound. In Complex Physical, Biophysical and Econophysical Systems; World Scientific, 2010; pp. 283–317.
  59. Herglotz, G.B. Lectures at the University of Göttingen. University of Göttingen: Göttingen, Germany 1930.
  60. Georgieva, B.; Guenther, R.; Bodurov, T. Generalized variational principle of Herglotz for several independent variables. First Noether-type theorem. Journal of Mathematical Physics 2003, 44, 3911–3927. [Google Scholar] [CrossRef]
  61. Tian, X.; Zhang, Y. Noether’s theorem for fractional Herglotz variational principle in phase space. Chaos, Solitons & Fractals 2019, 119, 50–54. [Google Scholar]
  62. Beretta, G.P. The fourth law of thermodynamics: steepest entropy ascent. Philosophical Transactions of the Royal Society A 2020, 378, 20190168. [Google Scholar] [CrossRef] [PubMed]
  63. Prigogine, I. Etude thermodynamique des phénomènes irréversibles. These d’agregation presentee a la taculte des sciences de I’Universite Libre de Bruxelles 1945 1947.
  64. Lyapunov, A.M. The general problem of the stability of motion. International journal of control 1992, 55, 531–534. [Google Scholar] [CrossRef]
  65. Bonner, J.T. Perspective: the size-complexity rule. Evolution 2004, 58, 1883–1890. [Google Scholar] [PubMed]
  66. Carneiro, R.L. On the relationship between size of population and complexity of social organization. Southwestern Journal of Anthropology 1967, 23, 234–243. [Google Scholar] [CrossRef]
  67. West, G.B. Scale: the universal laws of growth, innovation, sustainability, and the pace of life in organisms, cities, economies, and companies; Penguin, 2017.
  68. Gershenson, C.; Trianni, V.; Werfel, J.; Sayama, H. Self-organization and artificial life. Artificial Life 2020, 26, 391–408. [Google Scholar] [CrossRef] [PubMed]
  69. Sayama, H. Introduction to the modeling and analysis of complex systems; Open SUNY Textbooks, 2015.
  70. Carlson, J.M.; Doyle, J. Complexity and robustness. Proceedings of the national academy of sciences 2002, 99, 2538–2545. [Google Scholar] [CrossRef]
  71. Kauffman, S.A. The origins of order: Self-organization and selection in evolution; Oxford University Press, 1993.
  72. Heylighen, F.; Joslyn, C. Cybernetics and second-order cybernetics. Encyclopedia of physical science & technology 2001, 4, 155–170. [Google Scholar]
  73. Jevons, W.S. The coal question; an inquiry concerning the progress of the nation and the probable exhaustion of our coal-mines; Macmillan, 1866.
  74. Berkhout, P.H.; Muskens, J.C.; Velthuijsen, J.W. Defining the rebound effect. Energy policy 2000, 28, 425–432. [Google Scholar] [CrossRef]
  75. Hildenbrand, W. On the" law of demand". Econometrica: Journal of the Econometric Society 1983, pp. 997–1019.
  76. Saunders, H.D. The Khazzoom-Brookes postulate and neoclassical growth. The Energy Journal 1992, 13, 131–148. [Google Scholar] [CrossRef]
  77. Downs, A. Stuck in traffic: Coping with peak-hour traffic congestion; Brookings Institution Press, 2000.
  78. Feynman, R.P. Space-Time Approach to Non-Relativistic Quantum Mechanics. Reviews of Modern Physics 1948, 20, 367–387. [Google Scholar] [CrossRef]
  79. Gauß, C.F. Über ein neues allgemeines Grundgesetz der Mechanik.; Walter de Gruyter, Berlin/New York Berlin, New York, 1829.
  80. LibreTexts. 5.3: The Uniform Distribution, 2023. Accessed: 2024-07-15.
  81. Kleiber, M.; others. Body size and metabolism. Hilgardia 1932, 6, 315–353. [Google Scholar] [CrossRef]
  82. Bettencourt, L.M.; Lobo, J.; Strumsky, D.; West, G.B. Urban scaling and its deviations: Revealing the structure of wealth, innovation and crime across cities. PloS one 2010, 5, e13541. [Google Scholar] [CrossRef] [PubMed]

Short Biography of Author

Preprints 141408 i001 Matthew Brouillet is a student at Washington University as part of the Dual Degree program with Assumption University. His major is Mechanical Engineering, and he has experience with computer programming. He developed the NetLogo programs for these simulations and utilized Python code to analyze the data. He is working with Dr. Georgiev to publish numerous papers in the field of self-organization.
Preprints 141408 i002 Dr. Georgi Y. Georgiev is a Professor of Physics at Assumption University and Worcester Polytechnic Institute. He earned his Ph.D. in Physics from Tufts University, Medford, MA. His research focuses on the physics of complex systems, exploring the role of variational principles in self-organization, the principle of least action, path integrals, and the Maximum Entropy Production Principle. Dr. Georgiev has developed a new model that explains the mechanism, driving force, and attractor of self-organization. He has published extensively in these areas and he has been an organizer of international conferences on complex systems.
Figure 1. Summary of some of the main concepts of the paper. The fundamental principles, through the positive feedback loops with the other characteristics, lead to an outcome of self-organization, shown on a figure with decreasing internal entropy with self-organization, and visually illustrating in the three panels the initial maximum randomness and therefore entropy, the phase transition when the agents explore several paths, and finally when they converge on the shortest path.
Preprints 141408 g001
Figure 2. Comparison between the geodesic l 2 and a longer path l 1 between two nodes in a network.
Preprints 141408 g002
Figure 3. Positive feedback model between the eight quantities in our simulation.
Preprints 141408 g003
Figure 4. Simulation Flow Diagram for Self-Organization Process. The diagram illustrates the sequential stages of the simulation process, depicting how random agent movements and local interactions lead to the emergent self-organization of a dominant path. Key stages include the exploration of space (maximizing entropy), pheromone collection and deposition (information spreading), and the progressive stabilization and optimization of a single trail. The process demonstrates the dynamic transition from randomness to a structured and efficient system configuration.
Preprints 141408 g004
Figure 5. Path Formation in the Simulation. The figure depicts the stages of self-organization in the simulation. Green ants represent the initial state with random distribution and maximum entropy at the first tick. Red ants illustrate the transition phase, where multiple potential paths are explored. Black ants show the final state, where agents converge on the most efficient path, minimizing entropy and maximizing organization. The green square marks the nest, while the yellow square marks the food source. The yellow and blue gradients indicate the concentrations of food and nest pheromones, respectively, which guide agent behavior and reinforce the formation of the final path. The population of ants in this simulation is 200.
Preprints 141408 g005
Figure 6. Path formation vs time. Entropy vs. Time and Stages of Path Formation in the Simulation. The blue curve shows the system’s internal entropy decreasing over time, illustrating the phase transition from maximum entropy (disorder) to minimum entropy (order). Snapshots from the simulation correspond to key stages: (1) at the first tick (upper insert), ants are randomly distributed, representing maximum entropy; (2) at tick 60 (middle insert), ants explore multiple potential paths, indicating a transitional phase; and (3) at the final tick (lower insert), ants converge on the most efficient path, achieving a highly organized state. The nest (blue square) and food (yellow square) are connected by pheromone-guided paths, with green ants carrying nest pheromones and red ants carrying food pheromones. This figure demonstrates the correlation between entropy reduction and path formation, aiding in understanding the simulation’s self-organization process. The population of ants in this simulation is 200.
Preprints 141408 g006
Table 1. Settings of the properties in this simulation that affect the behavior of the ants.
Parameter Value Description
ant-speed 1 patch/tick Constant speed
wiggle range 50 degrees random directional change, from -25 to +25
view-angle 135 degrees Angle of cone where ants can detect pheromone
ant-size 2 patches Radius of ants, affects radius of pheromone viewing cone
Table 2. Settings of the properties in this simulation that affect the behavior of the pheromone.
Parameter Value Description
Diffusion rate 0.7 Rate at which pheromones diffuse
Evaporation rate 0.06 Rate at which pheromones evaporate
Initial pheromone 30 units Initial amount of pheromone deposited
Table 3. Settings of the properties in this simulation that affect various other conditions.
Parameter Value Description
projectile-motion off Ants have constant energy
start-nest-only off Ants start randomly
max-food 0 Food is infinite, food will disappear if this is greater than 0
constant-ants on Number of ants is constant
world-size 40 World ranges from -20 to +20, note that the true world size is 41x41
Table 4. Settings of the properties in this simulation that affect the position and size of the food and the nest.
Parameter Value Description
food-nest-size 5 The length and width of the food and nest boxes
foodx -18 The position of the food in the x-direction
foody 0 The position of the food in the y-direction
nestx +18 The position of the nest in the x-direction
nesty 0 The position of the nest in the y-direction
Disclaimer/Publisher’s Note: The statements, opinions and data contained in all publications are solely those of the individual author(s) and contributor(s) and not of MDPI and/or the editor(s). MDPI and/or the editor(s) disclaim responsibility for any injury to people or property resulting from any ideas, methods, instructions or products referred to in the content.
Copyright: This open access article is published under a Creative Commons CC BY 4.0 license, which permit the free download, distribution, and reuse, provided that the author and preprint are cited in any reuse.
Prerpints.org logo

Preprints.org is a free preprint server supported by MDPI in Basel, Switzerland.

Subscribe

© 2024 MDPI (Basel, Switzerland) unless otherwise stated