1. Introduction
Traditionally, water quality is monitored by taking some samples to the laboratory and carrying out the necessary tests to reach a conclusion. This costs a lot of time and resources. While this conventional method is useful for carrying out a detailed survey for long-term consideration is not suitable for carrying out day-to-day activities to safeguard rivers and taking quick action. Using the advantages of IoT and WSN networks, monitoring the quality status of river water is the main objective of this work. Other objectives are to obtain a system with low energy consumption, no operator costs and a reasonable operating range.
With this developed prototype the following water quality parameters will be monitored:
pH - Indicates the acidity or alkalinity of a solution. It does not represent the measure of the quantity of acids or bases, but the relationship between them. The pH varies between 0 and 14. High or low pH values can be indicative of pollution, with normal values being considered between 6,5 and 8,5.
Conductivity - This is an important parameter due to the ease of detecting contamination levels when measuring water conductivity. High conductivity means that the water contains a high level of contaminants, and the opposite is that drinking water is practically incapable of conducting electrical current. The unit of measurement for electrical conductivity is mS/cm and the normal value is up to 2 mS/cm.
Turbidity - Is a measure of water transparency. Suspended particles such as silt, algae and organic materials can make the water appear cloudy or dirty. These particles scatter and absorb light rays instead of allowing the light to be transmitted through the water, harming aquatic flora and fauna. A high turbidity value indicates cloudier water, and a low value means clear water. Turbidity measurements are represented in Nephelometric Turbidity Units (NTU) and normal values are up to 5 NTU.
Temperature - There is no ideal temperature for river water, but many aquatic organisms are sensitive to high temperatures and the solubility of oxygen is lower in warmer waters, thus limiting the supply of oxygen. The unit for temperature is degrees Celsius ºC.
This article begins by presenting the current state of IoT usage and other related works in section 2.
Section 3 resumes an investigation that was made about some communications technologies used in IoT and explains the LoRa modulation. In section 4 the developed prototype is explained in some detail and section 5 the results achieved are presented.
Section 6 is the conclusion and some remarks about future work.
2. State of the Art and Related Work
IoT describes the network of physical devices, composed of sensors, microcontrollers and other systems, with the purpose of exchanging data with other devices and the Internet. These devices range from common household systems to more complex industrial systems [1].
In recent years, IoT has become one of the most important technologies of the century. Now that we can connect everyday devices (home appliances, cars, sensors, watches, phones, etc.) to the internet, communication between people, processes and “things” is possible. With the use of low-cost processing systems (computers, embedded systems), the “cloud”, data analysis tools and mobile technologies, physical devices can share data with minimal human intervention. In this ultra interconnected world, these systems can record, monitor and adjust each interaction between them. The physical world meets the digital world, and they cooperate [1].
The applications of IoT are vast and varied, and its impact is noted across multiple sectors, including manufacturing, transportation, healthcare, and agriculture.
To provide great support to IoT, WSN plays a very important role, due to the advancement of sensor and microcontroller systems, also ensuring high interoperability between wireless communication protocols [2].
In Portugal, in the residential segment there are already 38% of personal equipment connected to the Internet and 22% of household appliances with Internet connection. In the business segment, 23% of equipment is connected to the Internet, with the main uses being: facility security, energy consumption management, logistics management and production processes [3].
As the number of Internet connected devices continues to grow, IoT is likely to play an increasingly important role in shaping our world. Transforming the way we live, work and interact with each other and machines.
2.1. Related Work
In the article “Water Quality Monitoring System Based on the Internet of Things” [4], the authors develop a very simple system composed of sensors (temperature, turbidity, pH and total dissolved solids), microcontroller with Wi-Fi and a Global System for Mobile Communications (GSM) module. The data is sent to a “cloud” via WIFI connection or in case of need (alarm) an SMS is sent to the user. Note the presence in this system of an Analog to Digital Converter (ADC) to interface between the sensors and the microcontroller (NodeMCU ESP8266), as it does not have analog inputs. Due to the use of WIFI network, this system is very limited in terms of monitoring coverage.
In the system described in the article “IoT Based Water Quality Monitoring System Using Solar Powered and LoRaWAN” [5], a water quality monitoring system is also developed, but the data acquired is sent via LoRa to the LoRaWAN network, and there must be a LoRaWAN Gateway close to the site under study. In this system the microcontroller used is the Arduino Nano, but as it does not have analog inputs for the sensors (Temperature, Turbidity, Conductivity and pH) the authors used a module (CAT S767S) that communicates with the Arduino via Inter-Integrated Circuit (I2C). This module, in addition to having analog inputs, also includes the LoRa module. As the system is mobile (floating), a GPS module was also incorporated to send the location of the measurements.
3. IoT Technologies
In IoT, many devices are wireless, forming part of WSN networks and to support these communications there is the Low Power Wide Area Networks (LPWAN) network. LPWAN networks are low energy consumption technologies that provide long-range communications. For these reasons, they are the focus of this analysis, with special emphasis on LoRa technology.
3.1. LPWAN
Narrow Band-IoT (NB-IoT) is a technology developed by the 3rd Generation Partnership Project (3GPP) and is implemented over existing Long-Term Evolution (LTE) cellular networks [6]. It occupies a 200 kHz block of an LTE carrier and can be implemented on the mobile network in three different modes, see
Figure 1.
In any of the operating modes there is a 10 kHz guard band between the blocks, leaving 180 kHz of usable bandwidth for data.
The great advantage of this technology, as it is integrated into mobile networks, is its great coverage in both external and internal environments. The disadvantage is that there are costs associated with mobile operators.
Sigfox technology, also called “Sigfox 0G Technology”, was the first LPWAN to be developed in 2010 by the French company with the same name but acquired in 2022 by UnaBiz [8].
Communications use Binary Phase Shift Keying (BPSK) modulation, with a bandwidth of just 100 Hz, allowing low energy consumption and high receiver sensitivity at the expense of a maximum throughput of just 100 b/s.
The devices (sensors) communicate with the base stations, using the free Industrial Scientific and Medical (ISM) frequency band, 868 MHz in Europe.
The
Figure 2 shows network architecture.
The Sigfox network has good coverage, especially in Europe, but with operator costs as the main disadvantage.
LoRa is a protocol developed by the French company Cycleo, which was acquired by Semtech in 2012. Like Sigfox, LoRa uses ISM band for communications, but using a proprietary modulation technique derived from existing Chirp Spread Spectrum (CSS) technology [9].
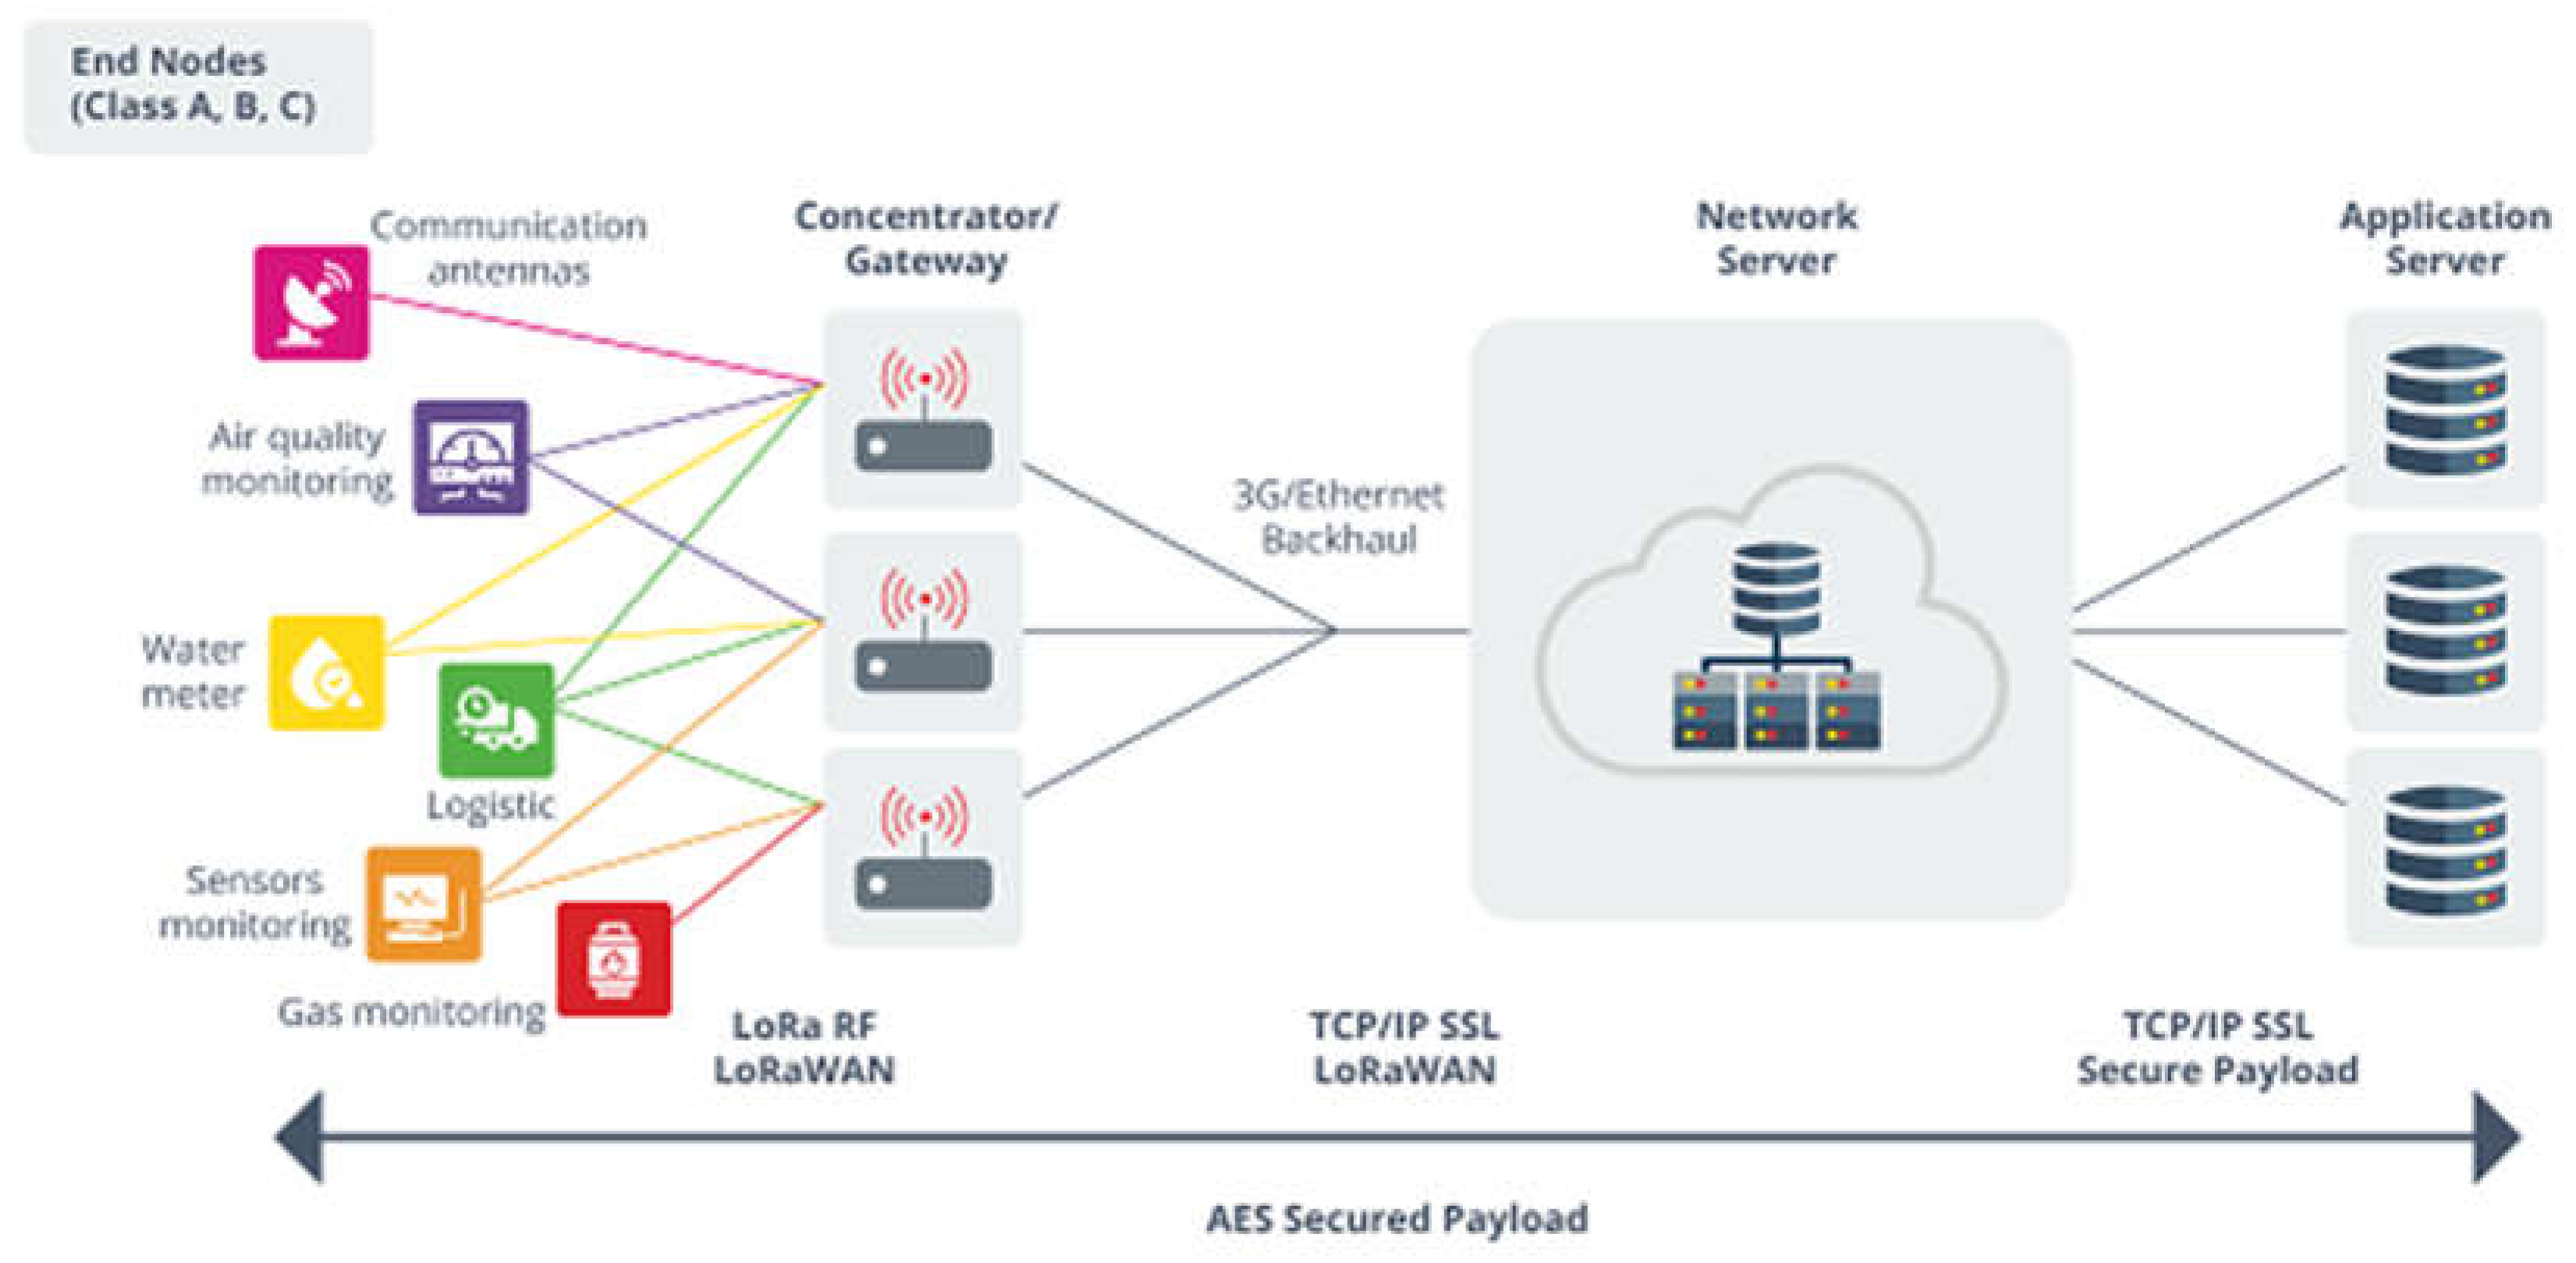
LoRaWAN is an LPWAN standard managed by LoRa Alliance [10], based on LoRa, designed to connect wireless devices to the Internet and meets the main IoT requirements, such as bidirectional communications, security, mobility and location services. There are some LoRaWAN operators, and they have good coverage. The
Figure 3 shows the network architecture.
The specification defines three classes of operation for the devices. Class A supports bidirectional communication, is the most energy efficient and is mandatory in all devices. The downlink is available only after a device TX (uplink). Class B implements bidirectional communication with scheduled downlink slots. To keep the devices in sync the gateway sends information through beacons. Class C has the same uplink schedule as Class A but keeps the receiving window always open providing less latency but more energy consumption.
A summary of the characteristics of the LPWAN networks covered here is presented in
Table 1.
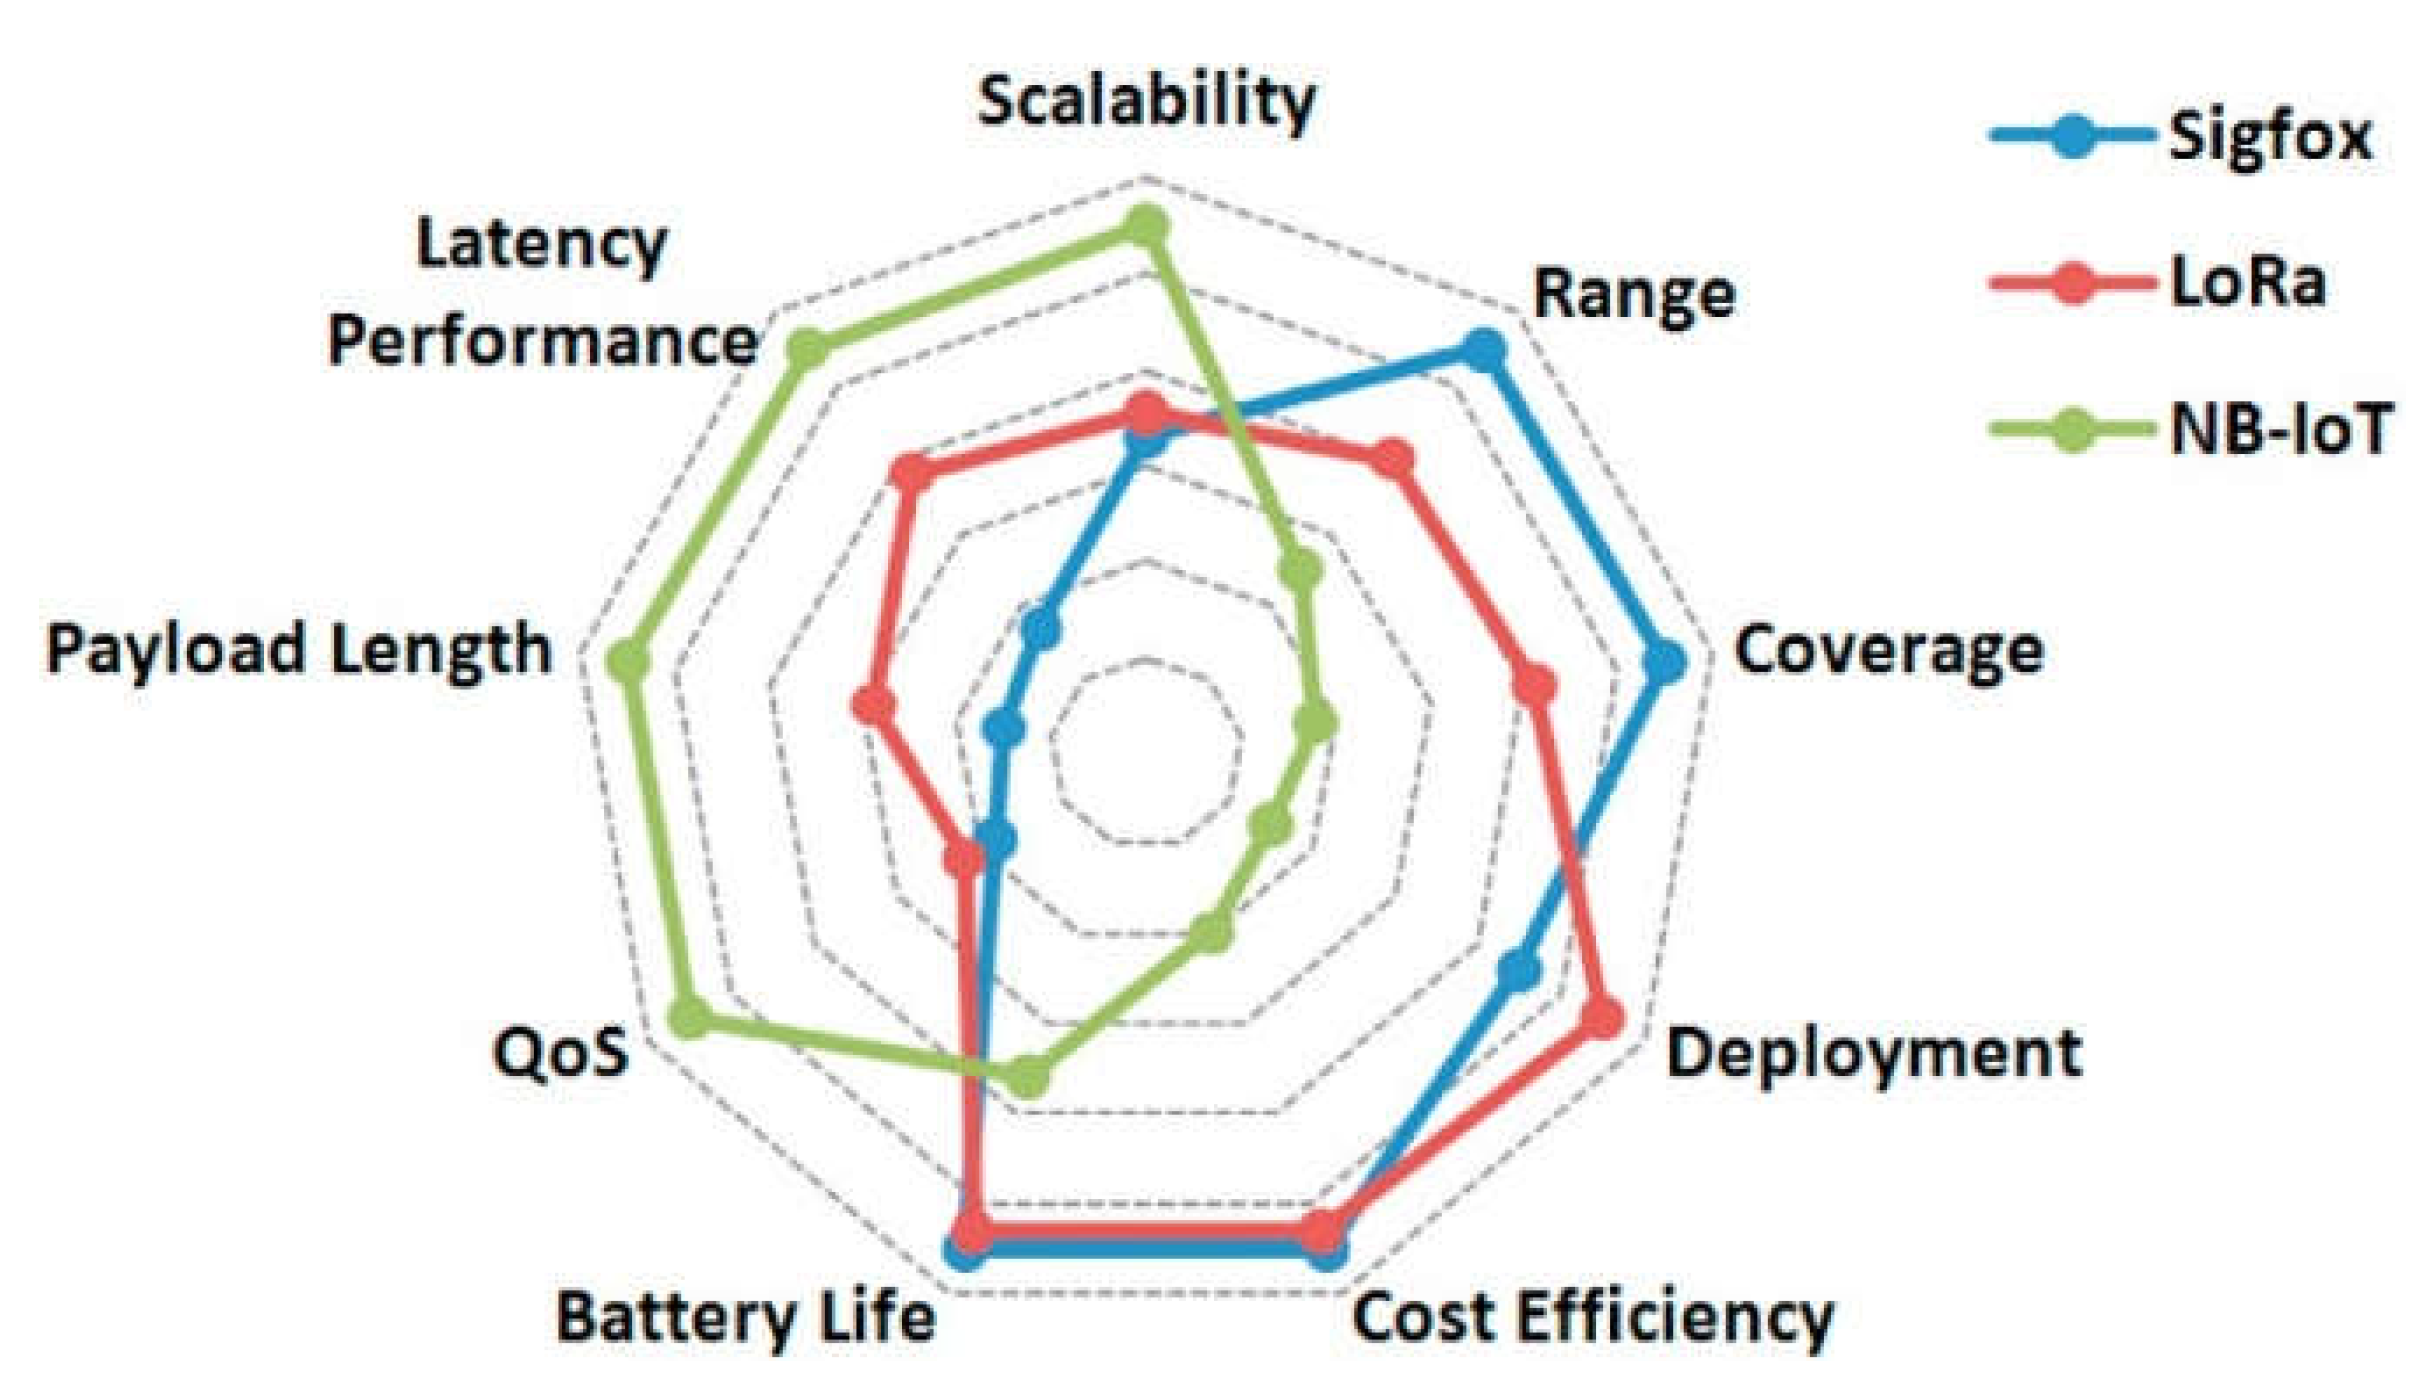
These LPWAN networks present a compromise between some parameters [12], which are shown in
Figure 4.
In summary, each technology has a place in IoT networks, Sigfox and LoRa present the devices with the lowest cost, best range, best coverage and lowest energy consumption. LoRa will be best suited for the development of local and private networks. On the other hand, NB-IoT networks have lower latencies and better quality of service, but at higher costs.
3.2. LoRa Modulation
LoRa uses a proprietary modulation technique derived from existing Chirp Spread Spectrum (CSS) technology [9], which spreads a narrowband signal over a wider bandwidth on the transmitting channel, allowing low power requirements, noise immunity, robustness against channel degradation (multipath, jamming, fading and doppler effect).
In CSS, spectrum spread is obtained by generating a chirp signal (Compressed High Intensity Radar Pulse) that continuously varies in frequency, between the minimum and maximum values of the transmission channel bandwidth (BW). These deviations can increase (up-chirp) or decrease (down-chirp).
Each chirp will transmit a symbol with a certain number of bits, which represents the Spreading Factor (SF). Each chirp is composed of 2
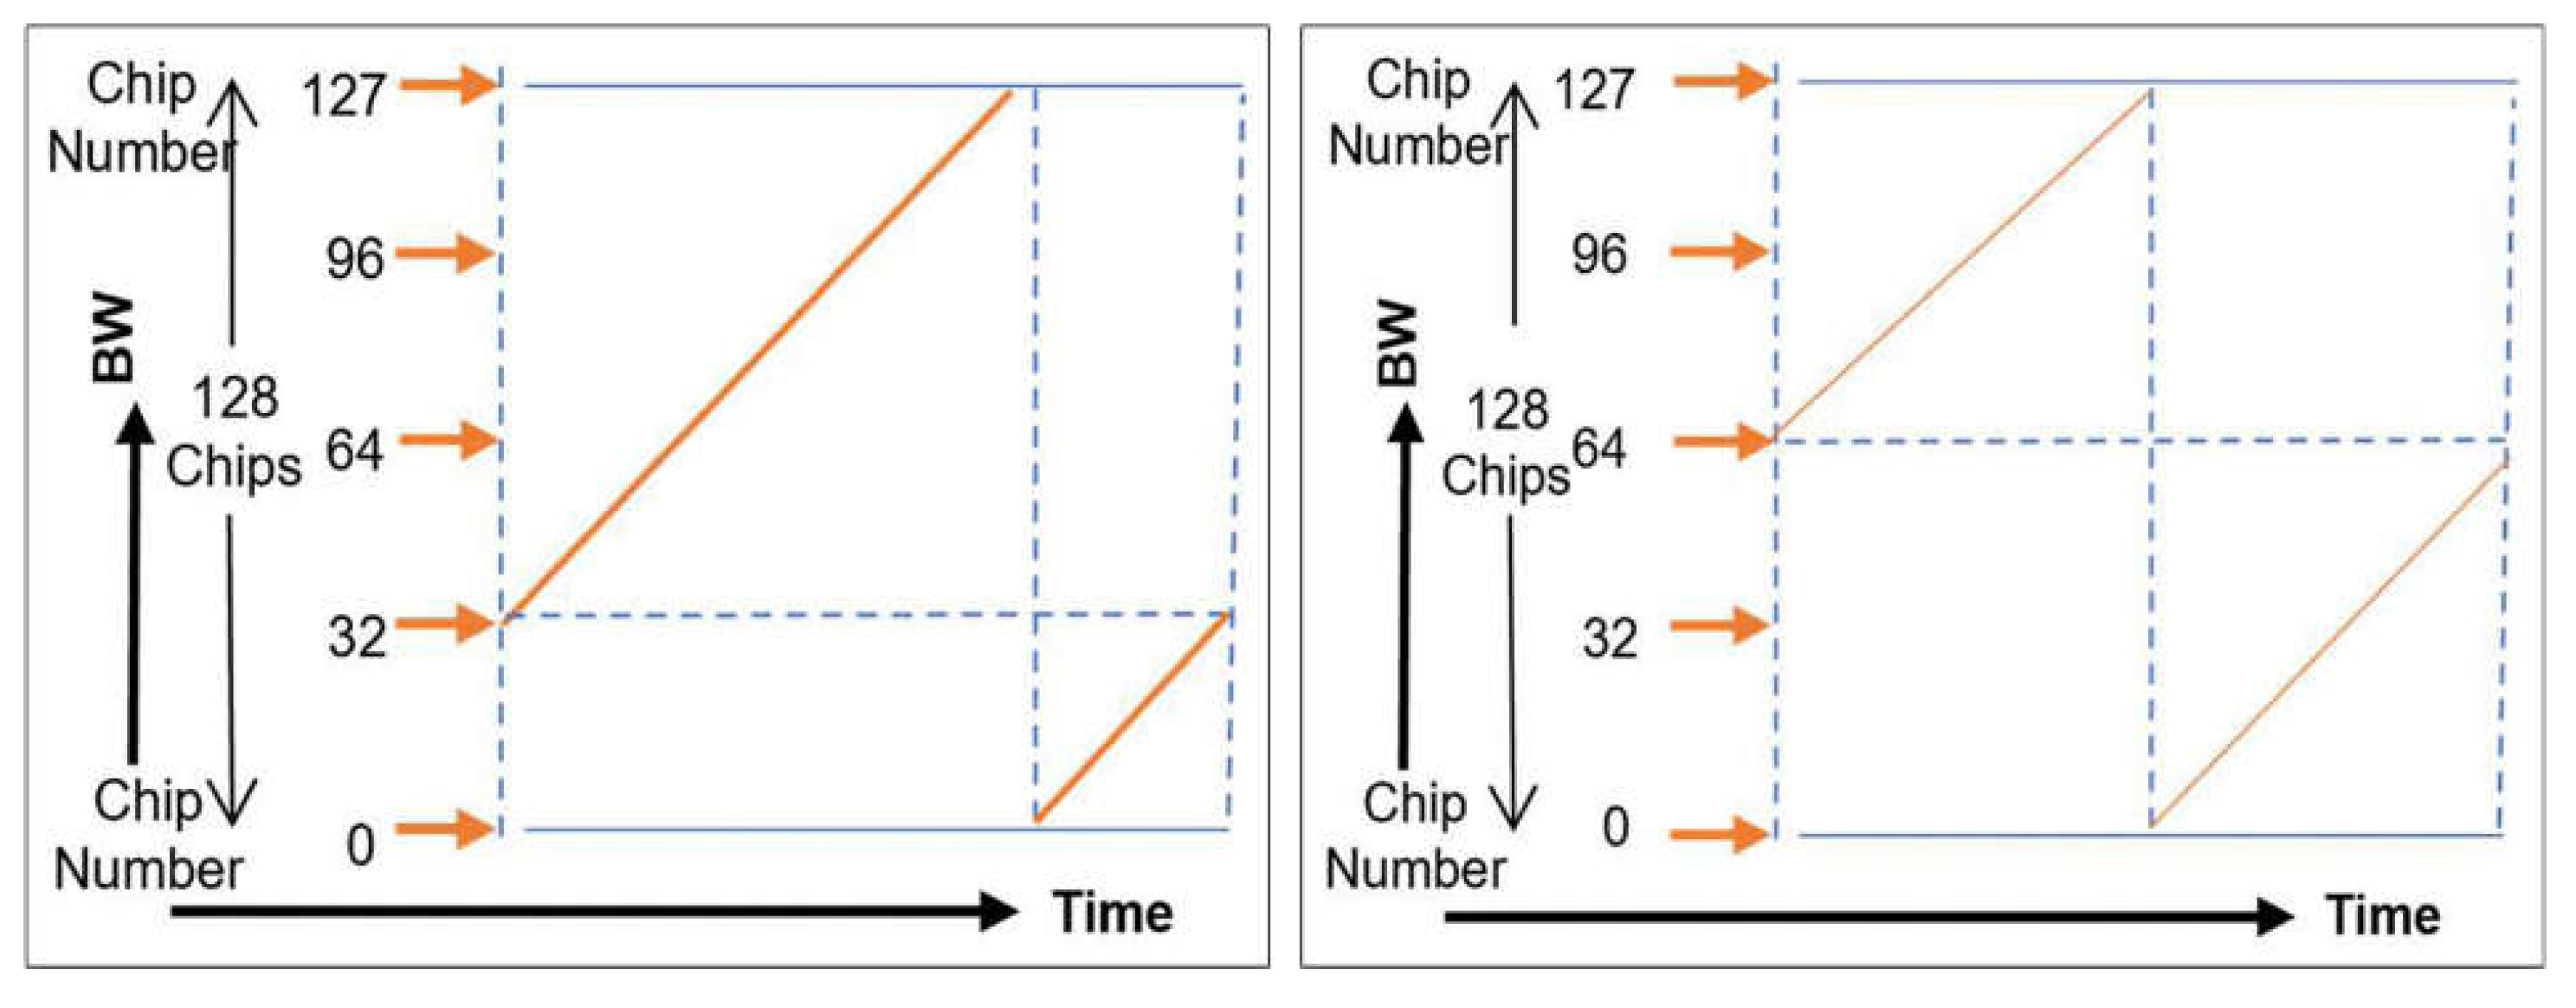
SF chips, which is the number of values possible to encode with the number of bits. In the examples in
Figure 5, two up-chirps are represented, with decimal information symbols of 32 and 64, with an SF = 7, which each corresponds to 128 chips.
The SF can go from 7 to 12, a low SF means that more chirps are being sent per second, thus more information can be coded per second, however the range of the transmission drops. On the other hand, a high SF provides a better range, but the chirps are more spread out in time, lowering the bit rate.
Bandwidths of 125 kHz, 250 kHz and 500 kHz are normally used, the latter being applied only in the downlink. With higher bandwidths, the binary rhythm increases, reducing the symbol period, but on the other hand sacrifices receive sensitivity due to the introduction of more noise.
The symbol period,
Tsym, is defined by (1)
The symbol rate,
Rsym, is defined by (2)
The chip rate,
Rc, is defined by (3)
Which leads to the statement: One chip is sent per second per Hz of bandwidth [14].
And because LoRa modulation also includes an error correction scheme, Forward Error Correction (FEC), which improves transmission robustness by including redundant bits, the final bitrate calculation,
Rb, is by (4)
Where CR is the Code Rate, and represents the number of redundant bits, that can be between 1 and 4.
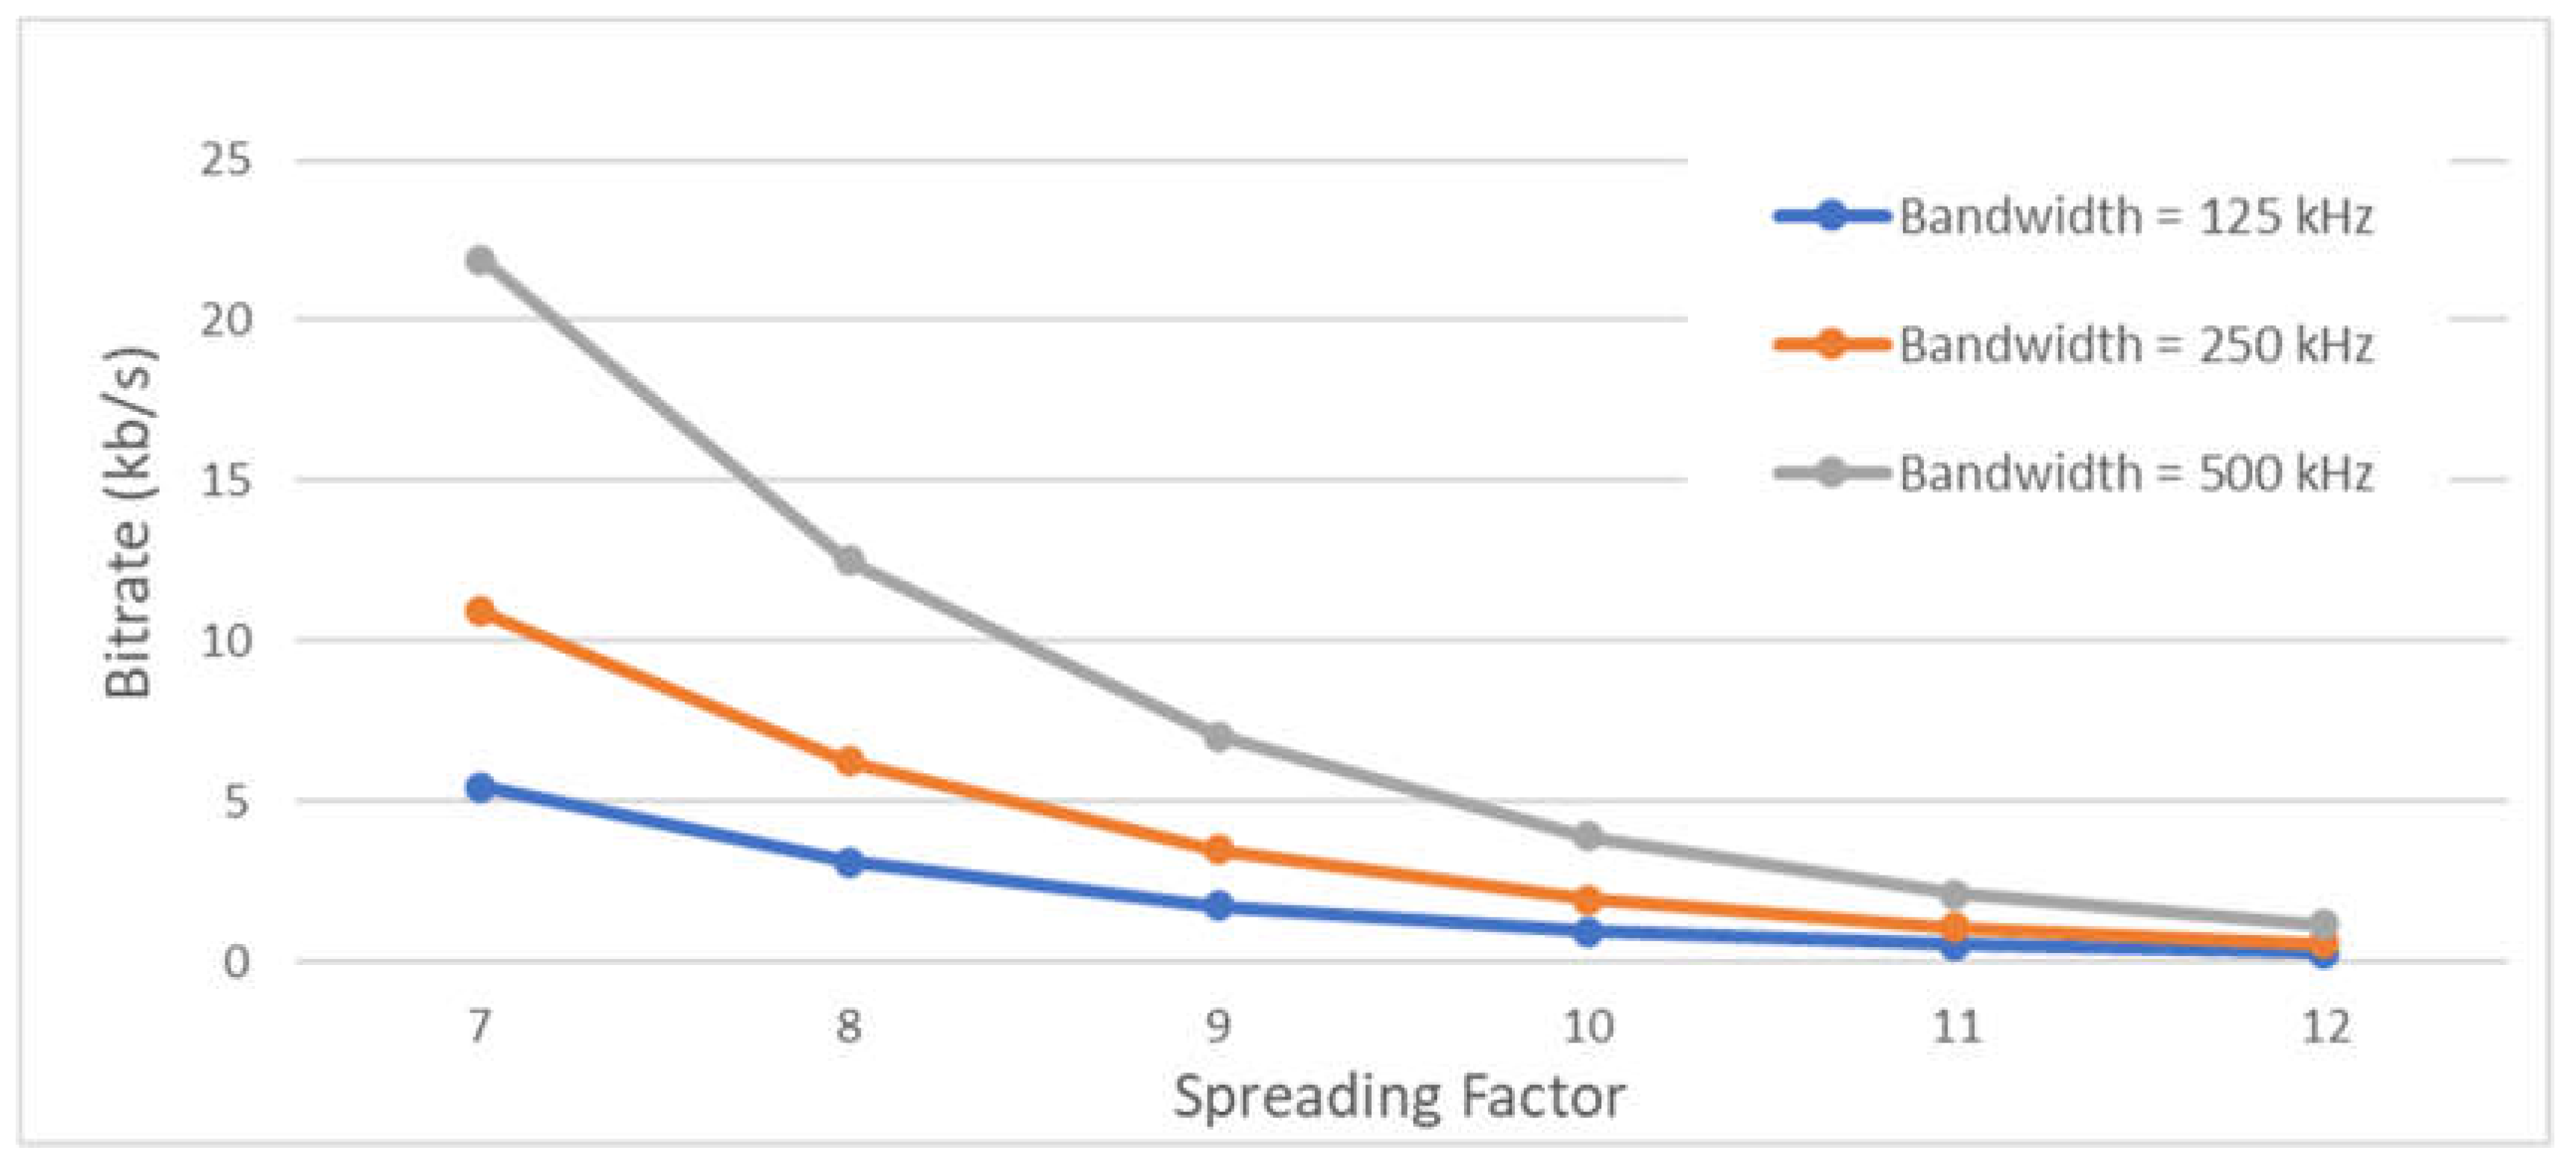
There is an increase in bitrate for lower SF and higher BW, see
Figure 6. And of course, if we increase the number of redundant bits (CR), the bitrate will also increase.
For the transmission of LoRa messages, Semtech defined a structure for the packet [14]. The packet comprises several elements, as shown in Figure 7.
The preamble is used to synchronize the receiver with the received data stream and begins with a sequence of npreamble up-chirps, followed by two up-chirps that contain a synchronization byte (sync word) and ends with two and a fourth down-chirps. The value of the sync word is to differentiate LoRa networks, which in the case of LoRaWAN this value is 0x34 [16]. The npreamble size can vary between 6 and 65535, but by default on Semtech transceivers it is 8.
The receiver undertakes a preamble detection process that periodically restarts. For this reason, the preamble length should be configured to be identical to the transmitter preamble length. Where the preamble length is not known, or can vary, the maximum preamble length should be programmed on the receiver side.
The preamble period,
Tpreamble, can be calculated with (5).
Depending upon the chosen mode of operation two types of header mode are available:
Explicit mode - This is the default mode of operation. Here the header provides information on the payload, namely: payload length in bytes, forward error correction code rate and presence of an optional 16-bits CRC for the payload. The header is transmitted with maximum error correction code (4/8). It also has its own CRC to allow the receiver to discard invalid headers.
Implicit mode - In certain scenarios, where the payload, coding rate and CRC presence are fixed or known in advance, it may be advantageous to reduce transmission time by invoking implicit header mode. In this mode the header is removed from the packet. In this case the payload length, error coding rate and presence of the payload CRC must be manually configured on both sides of the radio link.
The payload contains the data to transmit, which may or may not be followed by the CRC (two Bytes) and can have a size of up to 255 Bytes (including the CRC). Equation (6) calculates the number of symbols,
pSymN, in the payload.
where PL is the number of payload bytes, H = 0 header active, H = 1 header inactive, DE = 1 low data rate optimization is enabled and DE = 0 low data rate optimization is disabled.
And the total duration of the LoRa packet,
Tpacket, is given by the equation (7)
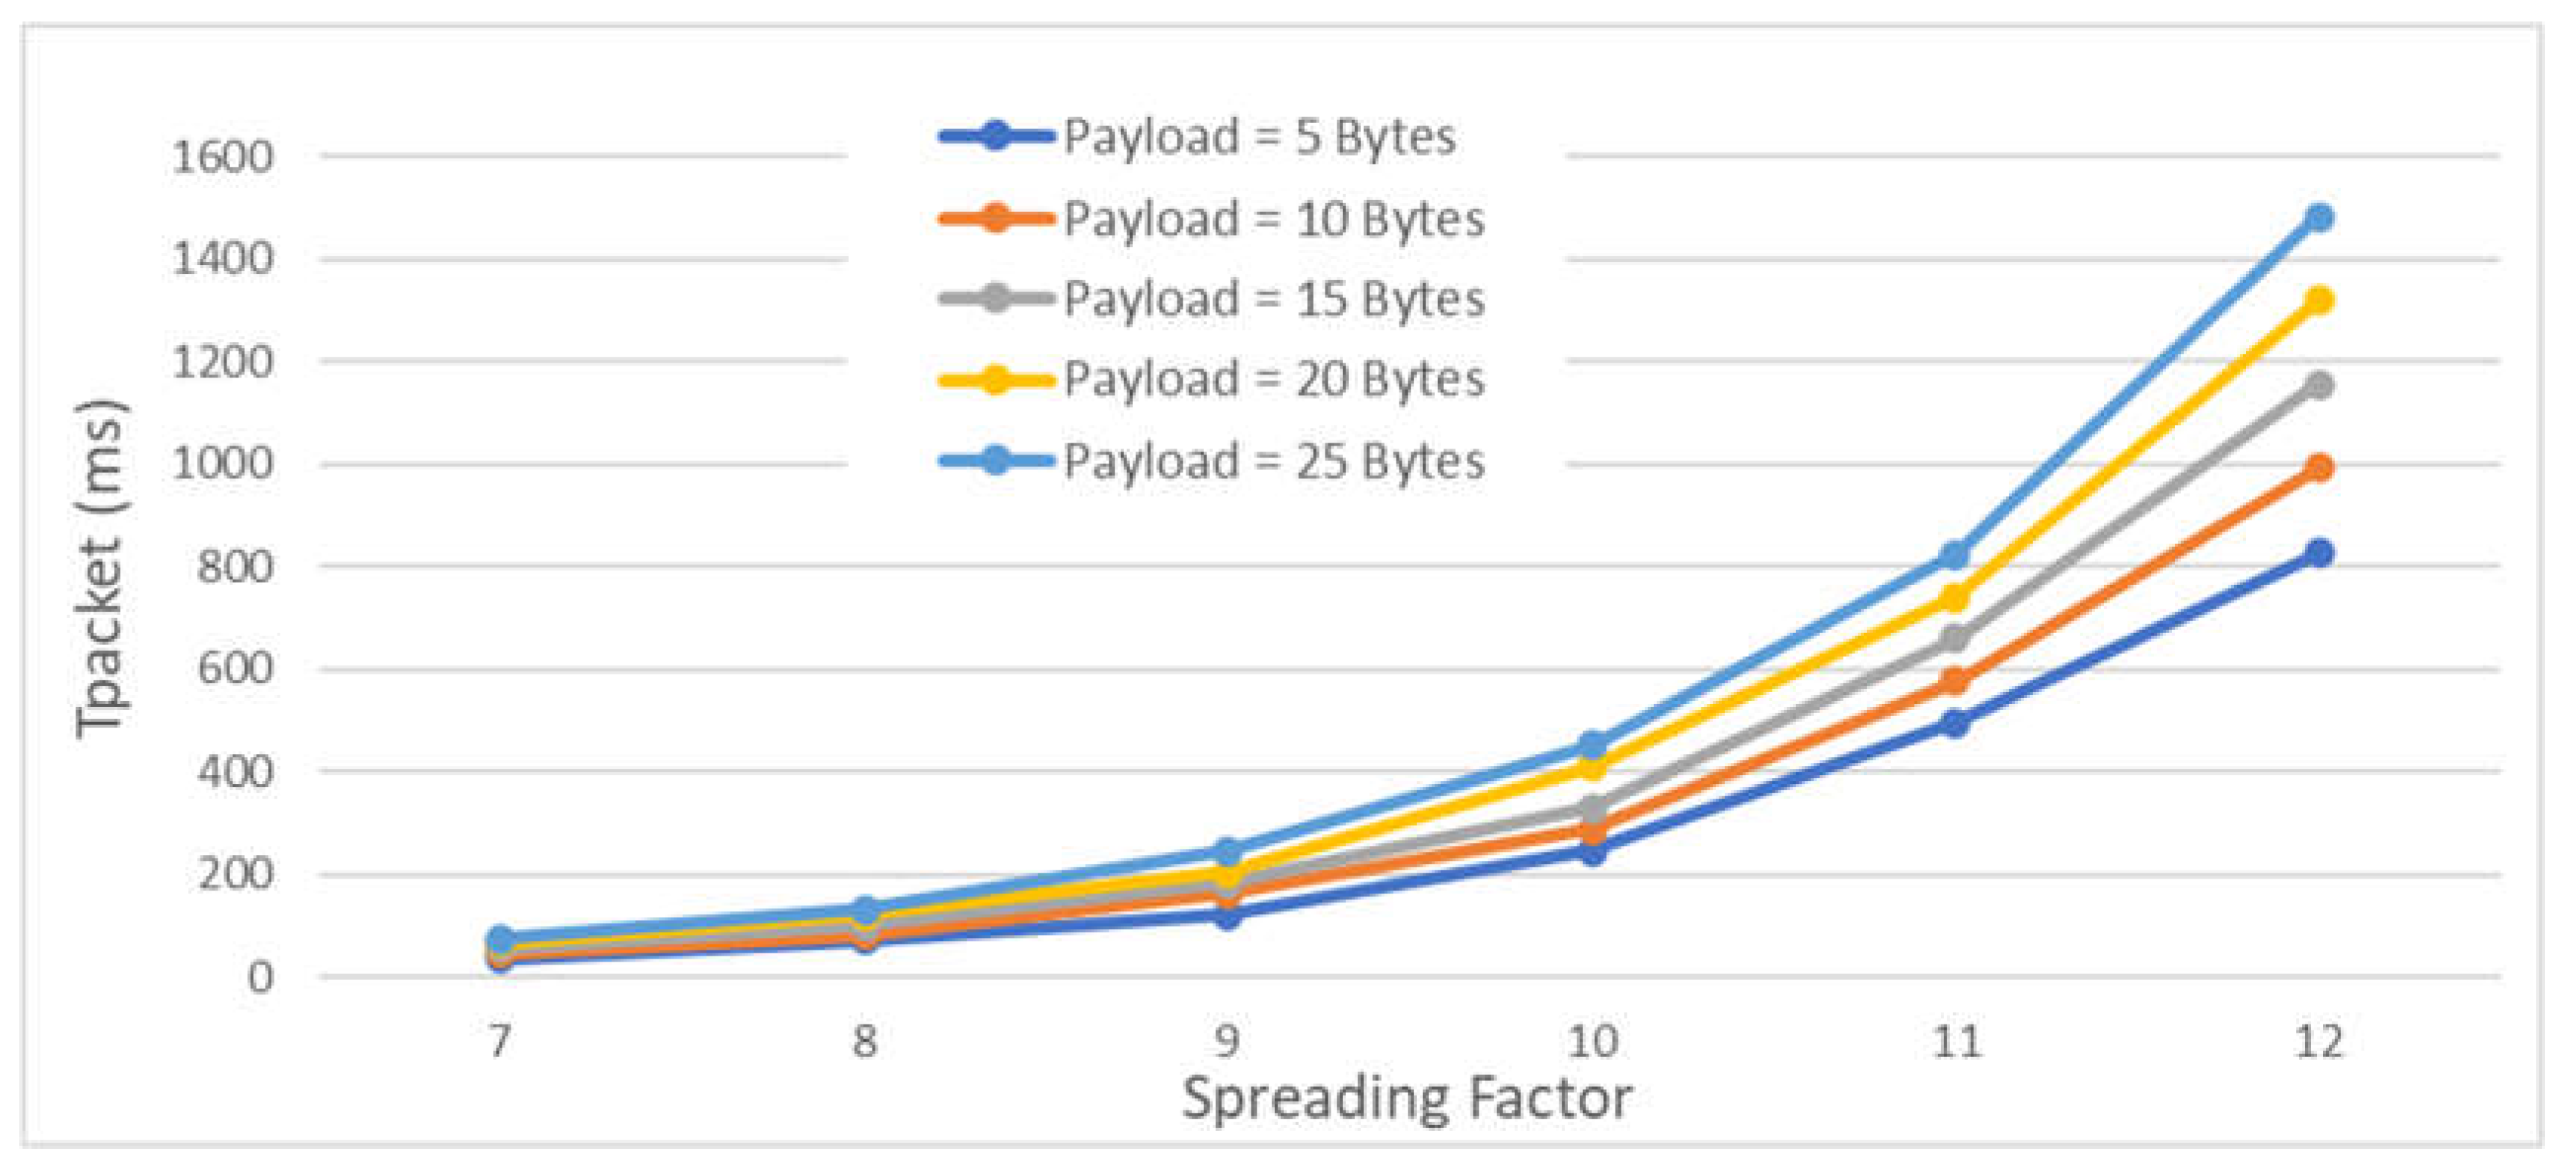
As seen in
Figure 8, the packet duration is directly proportional to the number of payload bytes and to the SF.
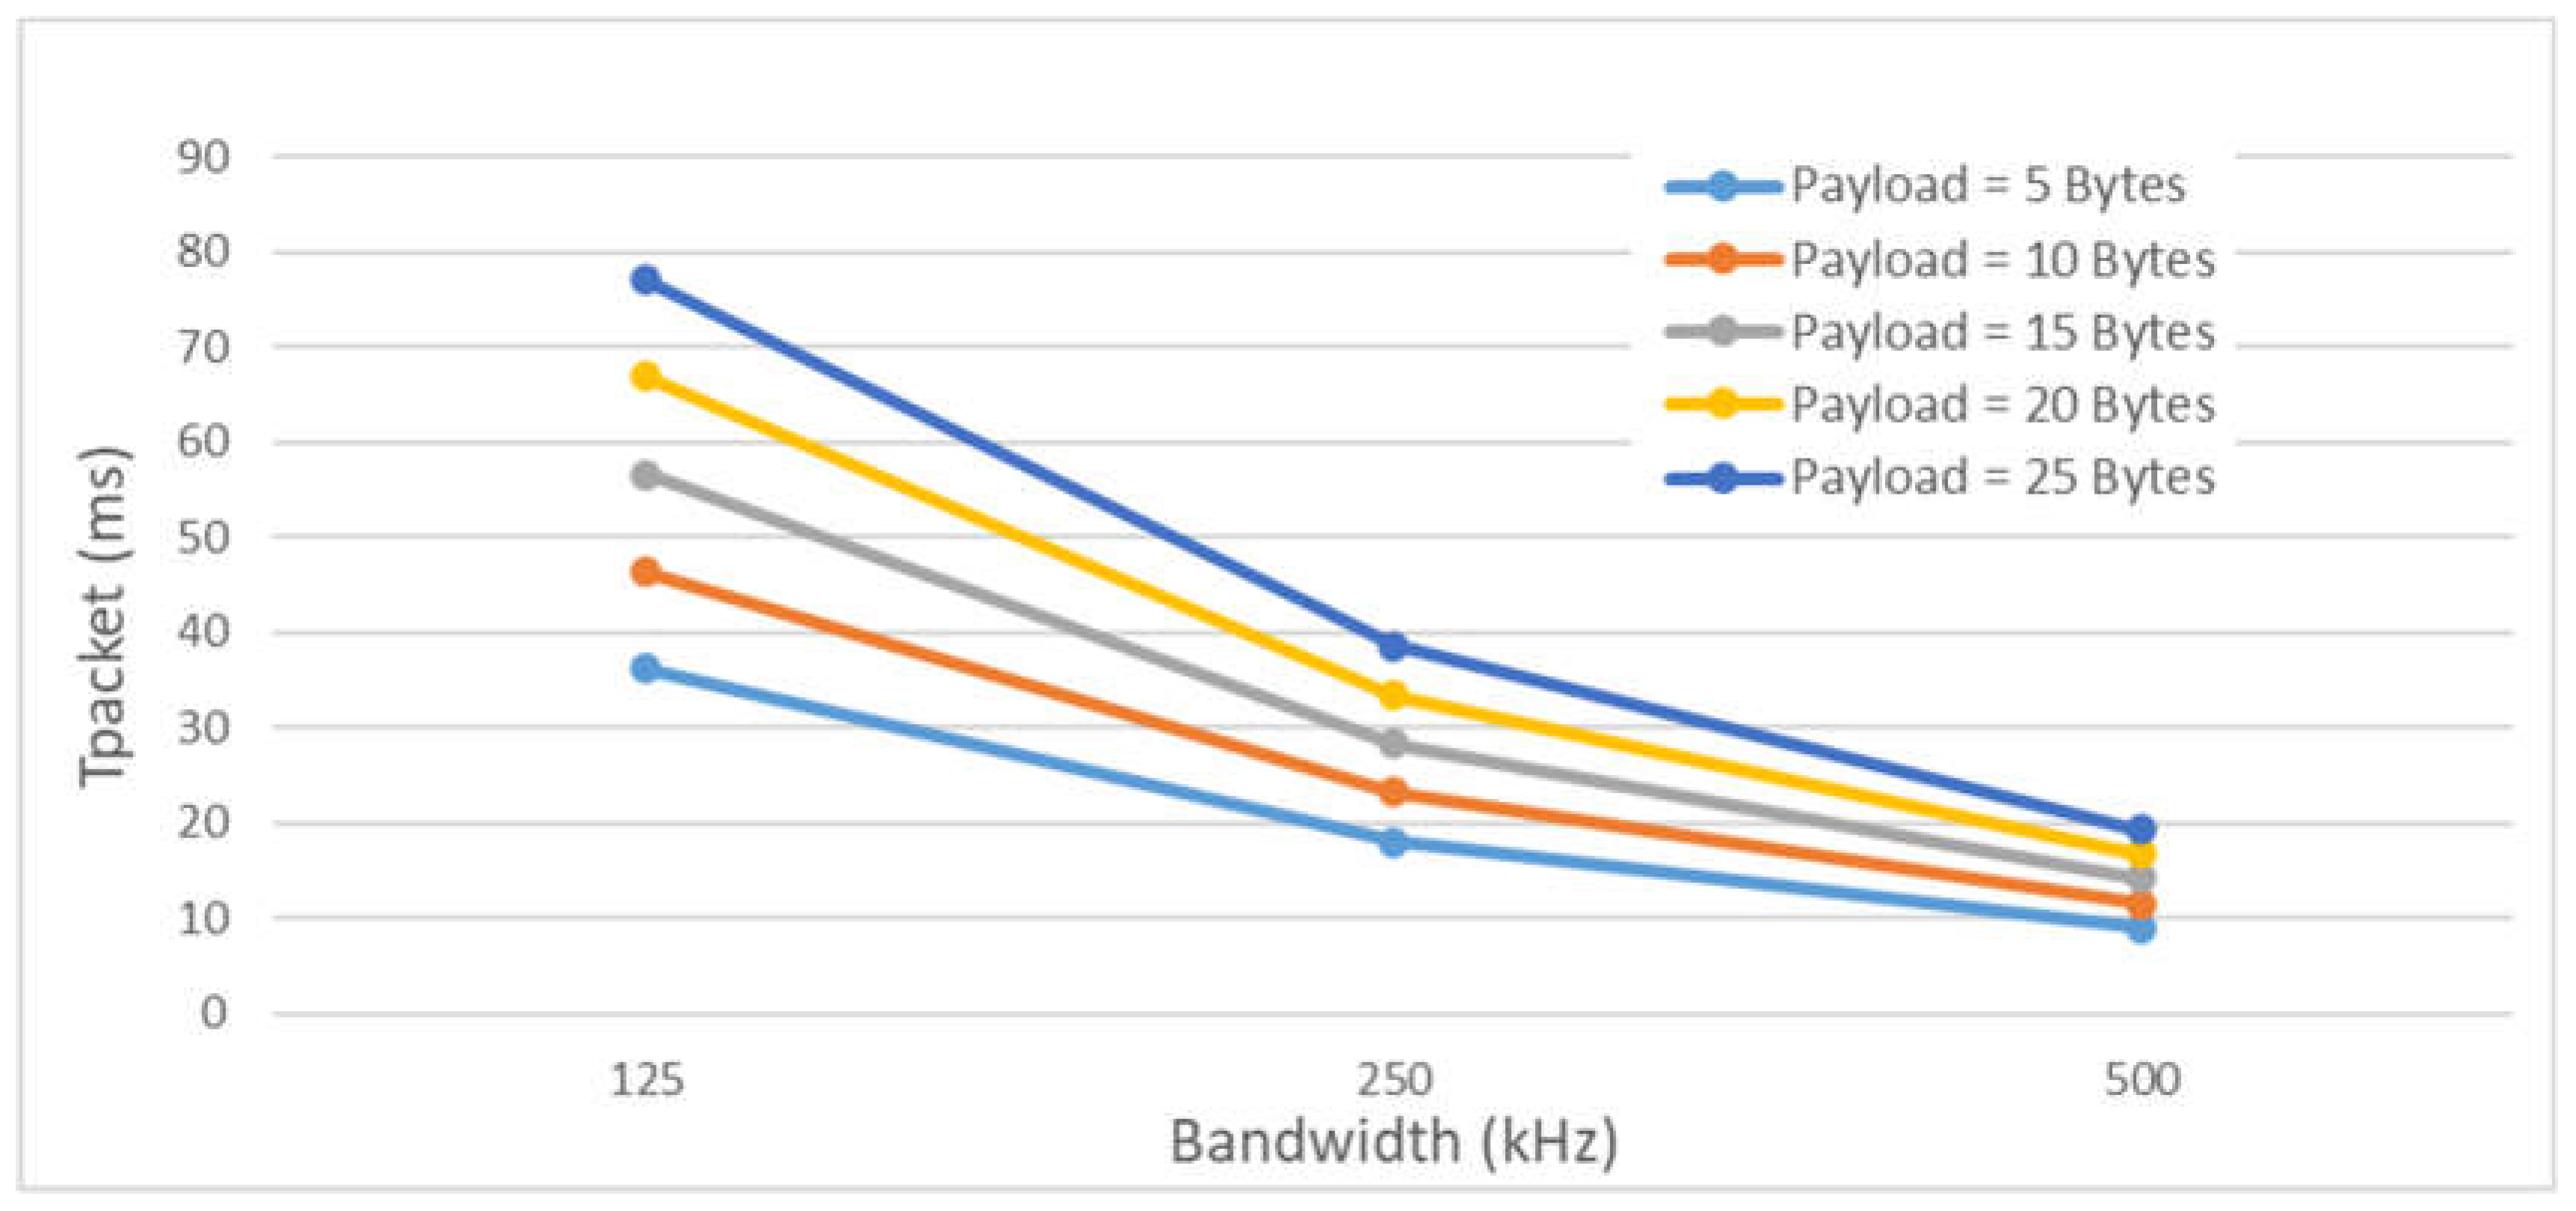
And the packet duration decreases for higher BW, see
Figure 9.
Tpacket also increases slightly to the highest CR values, as more additional redundancy bits are included.
The packet duration,
Tpacket, also means the Time on Air (ToA) and is the time a LoRa device is transmitting. To comply with legal requirements as to the time of occupancy of the channel (duty-cycle), there is a need to use the duration of ToA to calculate the time between successive transmissions,
TTX_off, by equation (8).
4. System Design
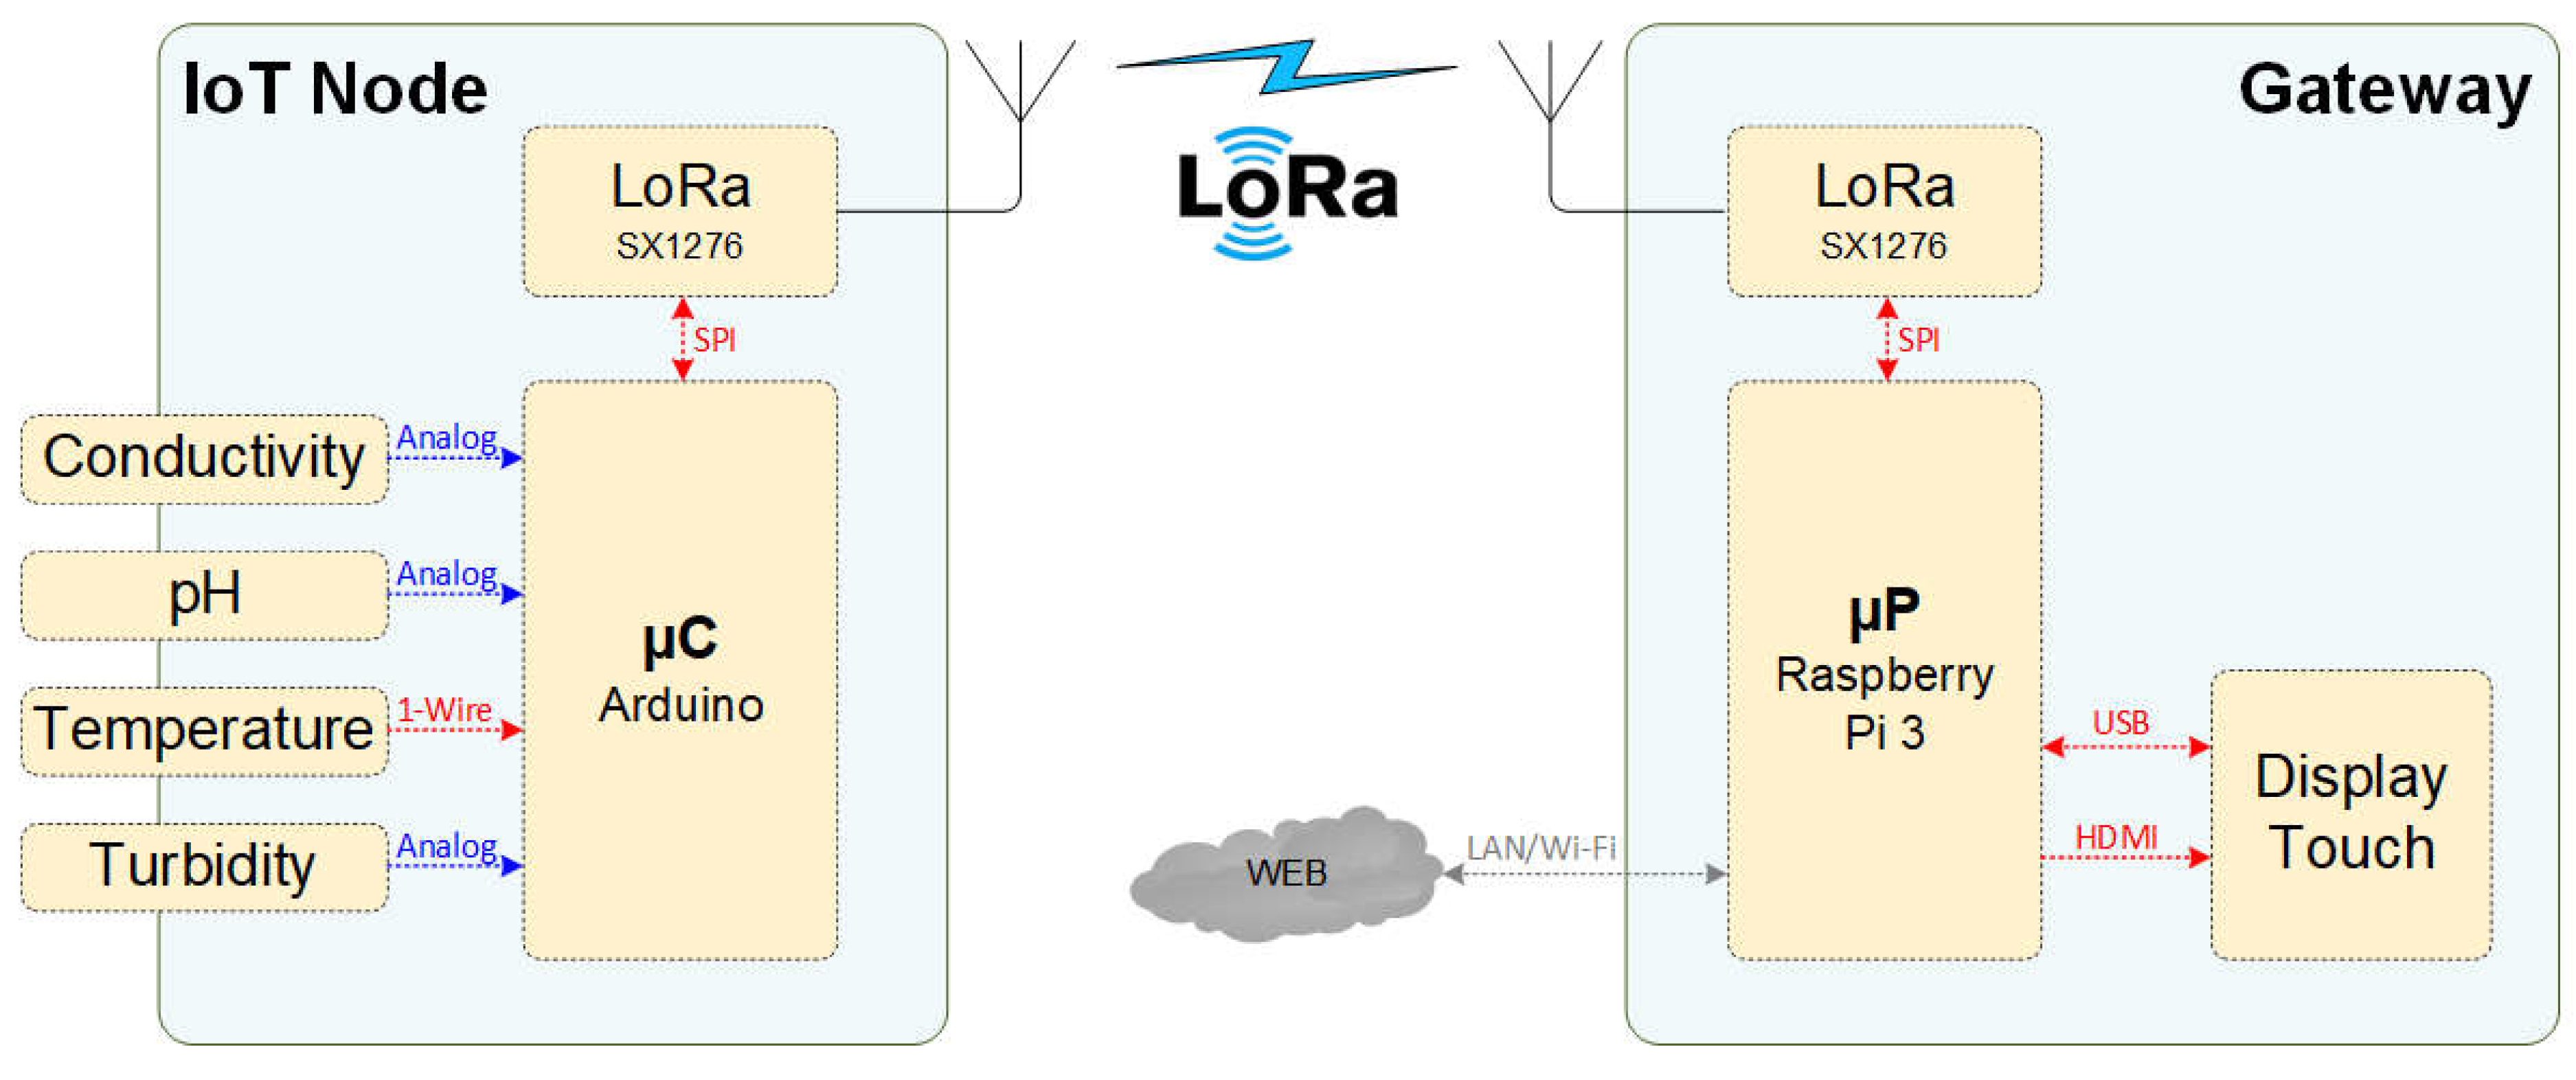
The developed prototype is divided into two isolated subsystems, IoT Node and Gateway, as shown in the block diagram in
Figure 10.
In the IoT Node, which is installed next to the river under study, the water quality parameters (temperature, pH, conductivity and turbidity) are measured using independent and specific sensors, the data acquired are processed on a microcontroller board and then sent using LoRa modulation with a radio module (LoRa SX1276 transceiver).
The microcontroller board, used in IoT Node, is the Arduino Mega 2560 Rev3 [17], which is based on the Atmega2560. This is an eight-bit microcontroller at 16 MHz, with 256 kB Flash program memory, 8 kB Static Random Access Memory (SRAM), and 4 kB Electrically Erasable Programmable Read-Only Memory (EEPROM). This board offers several interfaces: four Universal Asynchronous Receiver / Transmitter (UART), I2C, Serial Peripheral Interface (SPI), 54 digital inputs/outputs and 16 analog inputs.
On these analog inputs it is possible to measure signals that are multiplexed and converted to digital, using the microcontroller's ADC. The ADC has ten-bit resolution and a sampling rate of 15000 samples per second and accepts input values of up to five Volt, the same value as the supply voltage.
In the Gateway, these data are received from the LoRa network with an equal transceiver, processed, stored and displayed in a dashboard developed in Node-RED [18].
In this subsystem is used the single-board computer Raspberry Pi 3 [19], which is equipped with a 64-bit quad-core 1.4 GHz processor and 1 GB of Synchronous Dynamic Randon Access Memory (SDRAM) memory. It has WIFI in 2.4 GHz and 5GHz bands, Bluetooth 4.2, Gigabit Ethernet, four USB 2.0, HDMI ports and is fed to five volts. It has a Micro SD card slot where the operating system is installed. It also has a 40-pin connector where multiple pins of General-Purpose Input/Output (GPIO), a UART serial port, an I2C interface, and an SPI interface are made available.
4.1. Sensors and LoRa module
The temperature sensor used is the DFRobot DFR0198 [20], is a waterproof sensor based on the DS18B20 [21], which communicates with the Arduino board via the 1-Wire [22] protocol in digital pin D3.
Figure 11 shows the parameters of this sensor.
The pH sensor used is the DFRobot SEN0161-V2 [24], which sends a voltage value to the analog input A1 of the Arduino board, and by software, converts to the pH value of the solution under test. This sensor is calibrated by software and uses two standard buffer solutions (pH = 7,0 and pH = 4,0). The parameters of pH sensor are shown in
Figure 12.
The conductivity sensor used is the DFRobot DFR0300 [25], which sends a voltage value to the analog input A2 of the Arduino board, and by software, converts to the conductivity value of the solution under test. This sensor is calibrated by software and uses two standard buffer solutions (EC = 12,88 mS and EC = 1413 µS).
Figure 13 shows the conductivity sensor parameters.
The turbidity sensor used is the Seed Studio 101020752 [26], which sends a voltage value inversely proportional to the turbidity value to an analog input A3 of the Arduino. This voltage is converted to turbidity values (0 to 3000 NTU) by software. The parameters of this sensor are in
Figure 14.
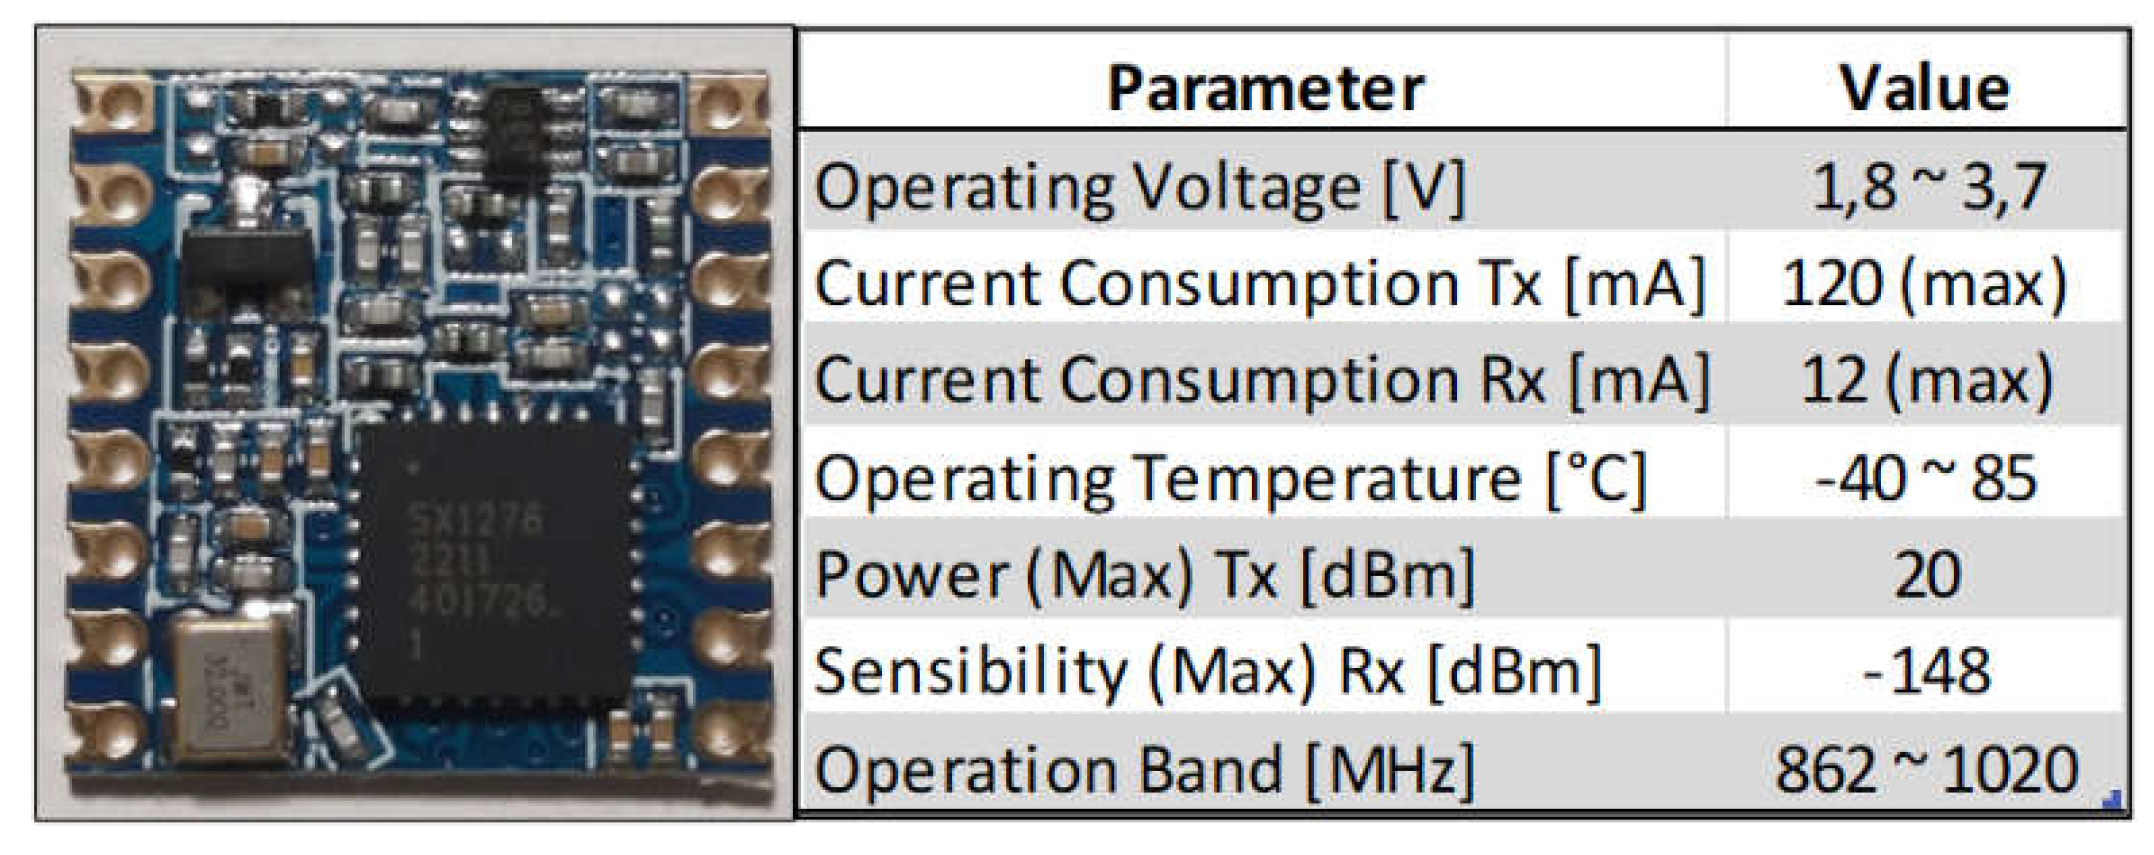
The LoRa module used in both subsystems is based on Semtech chip SX1276 [23], a LoRa half-duplex transceiver that operates in ISM frequency band. The basic characteristics are shown in
Figure 15.
In both subsystems, IoT Node and Gateway, this LoRa module interconnects with the controller board (Arduino and Raspberry Pi) by SPI for communication and other auxiliar pins for control and interrupt handling.
4.2. IoT Node
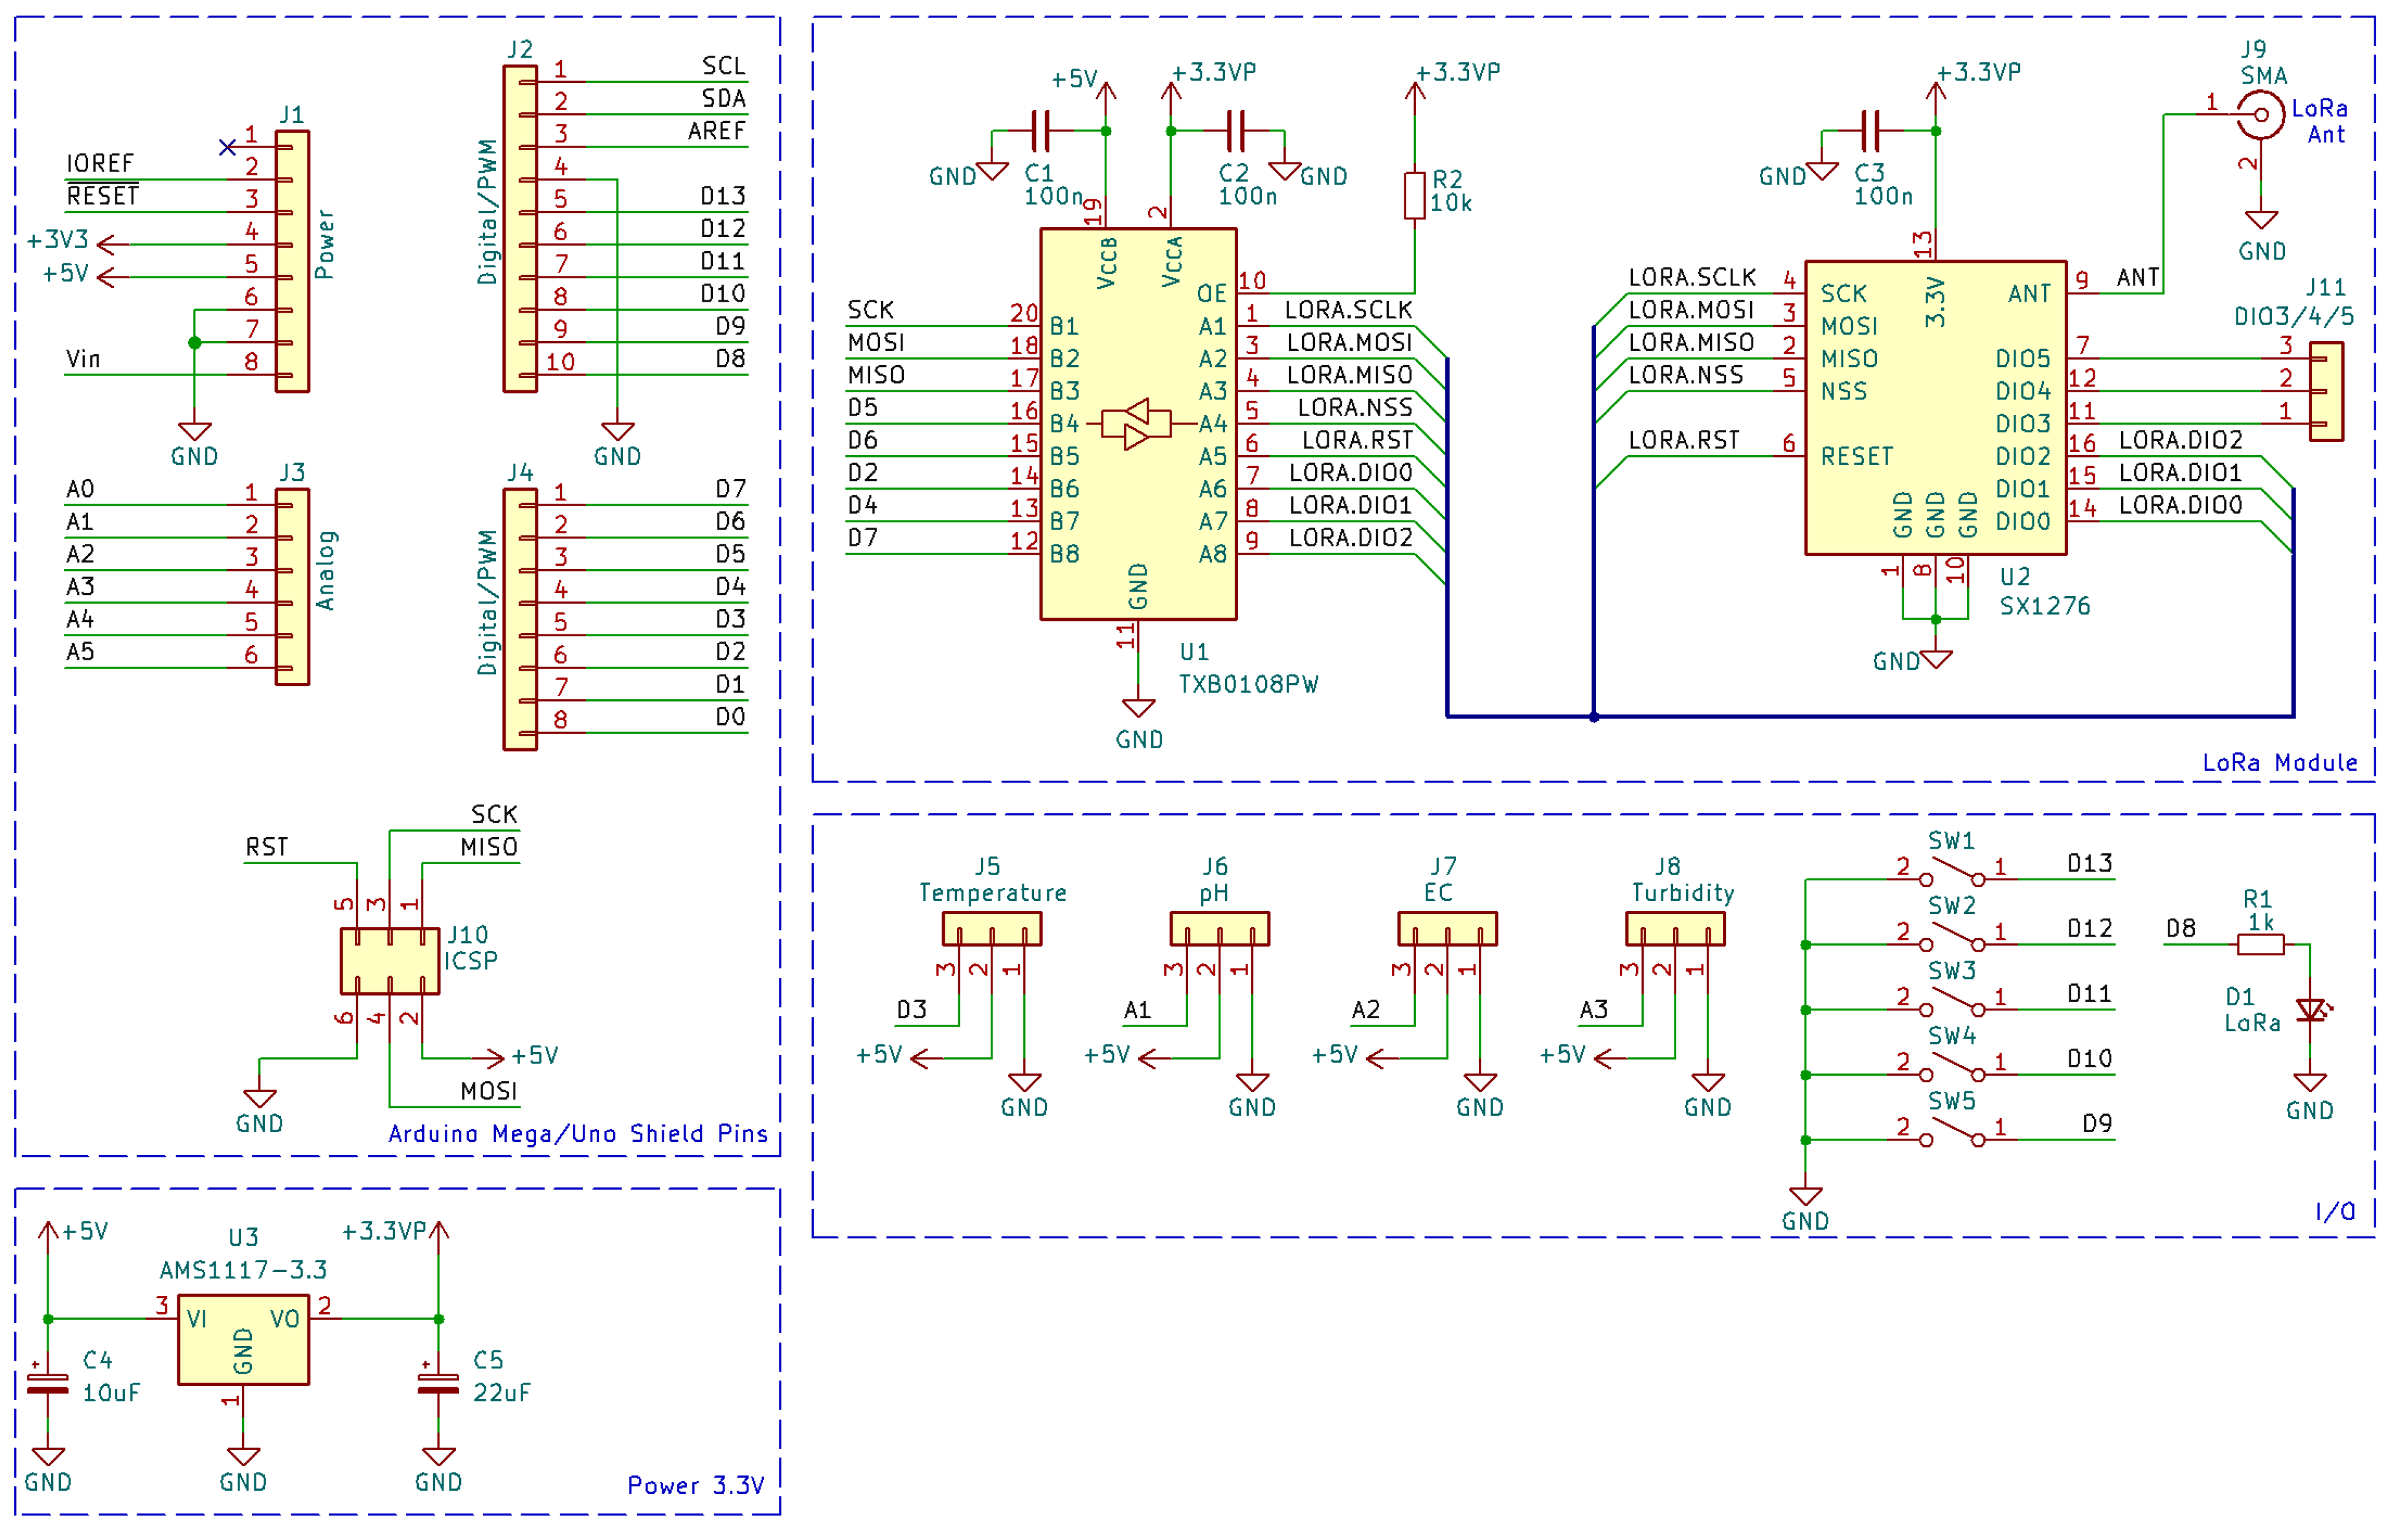
For IoT Node, an Arduino shield, or a Hardware Attached on Top (HAT), is designed, and its electrical schematic is shown in
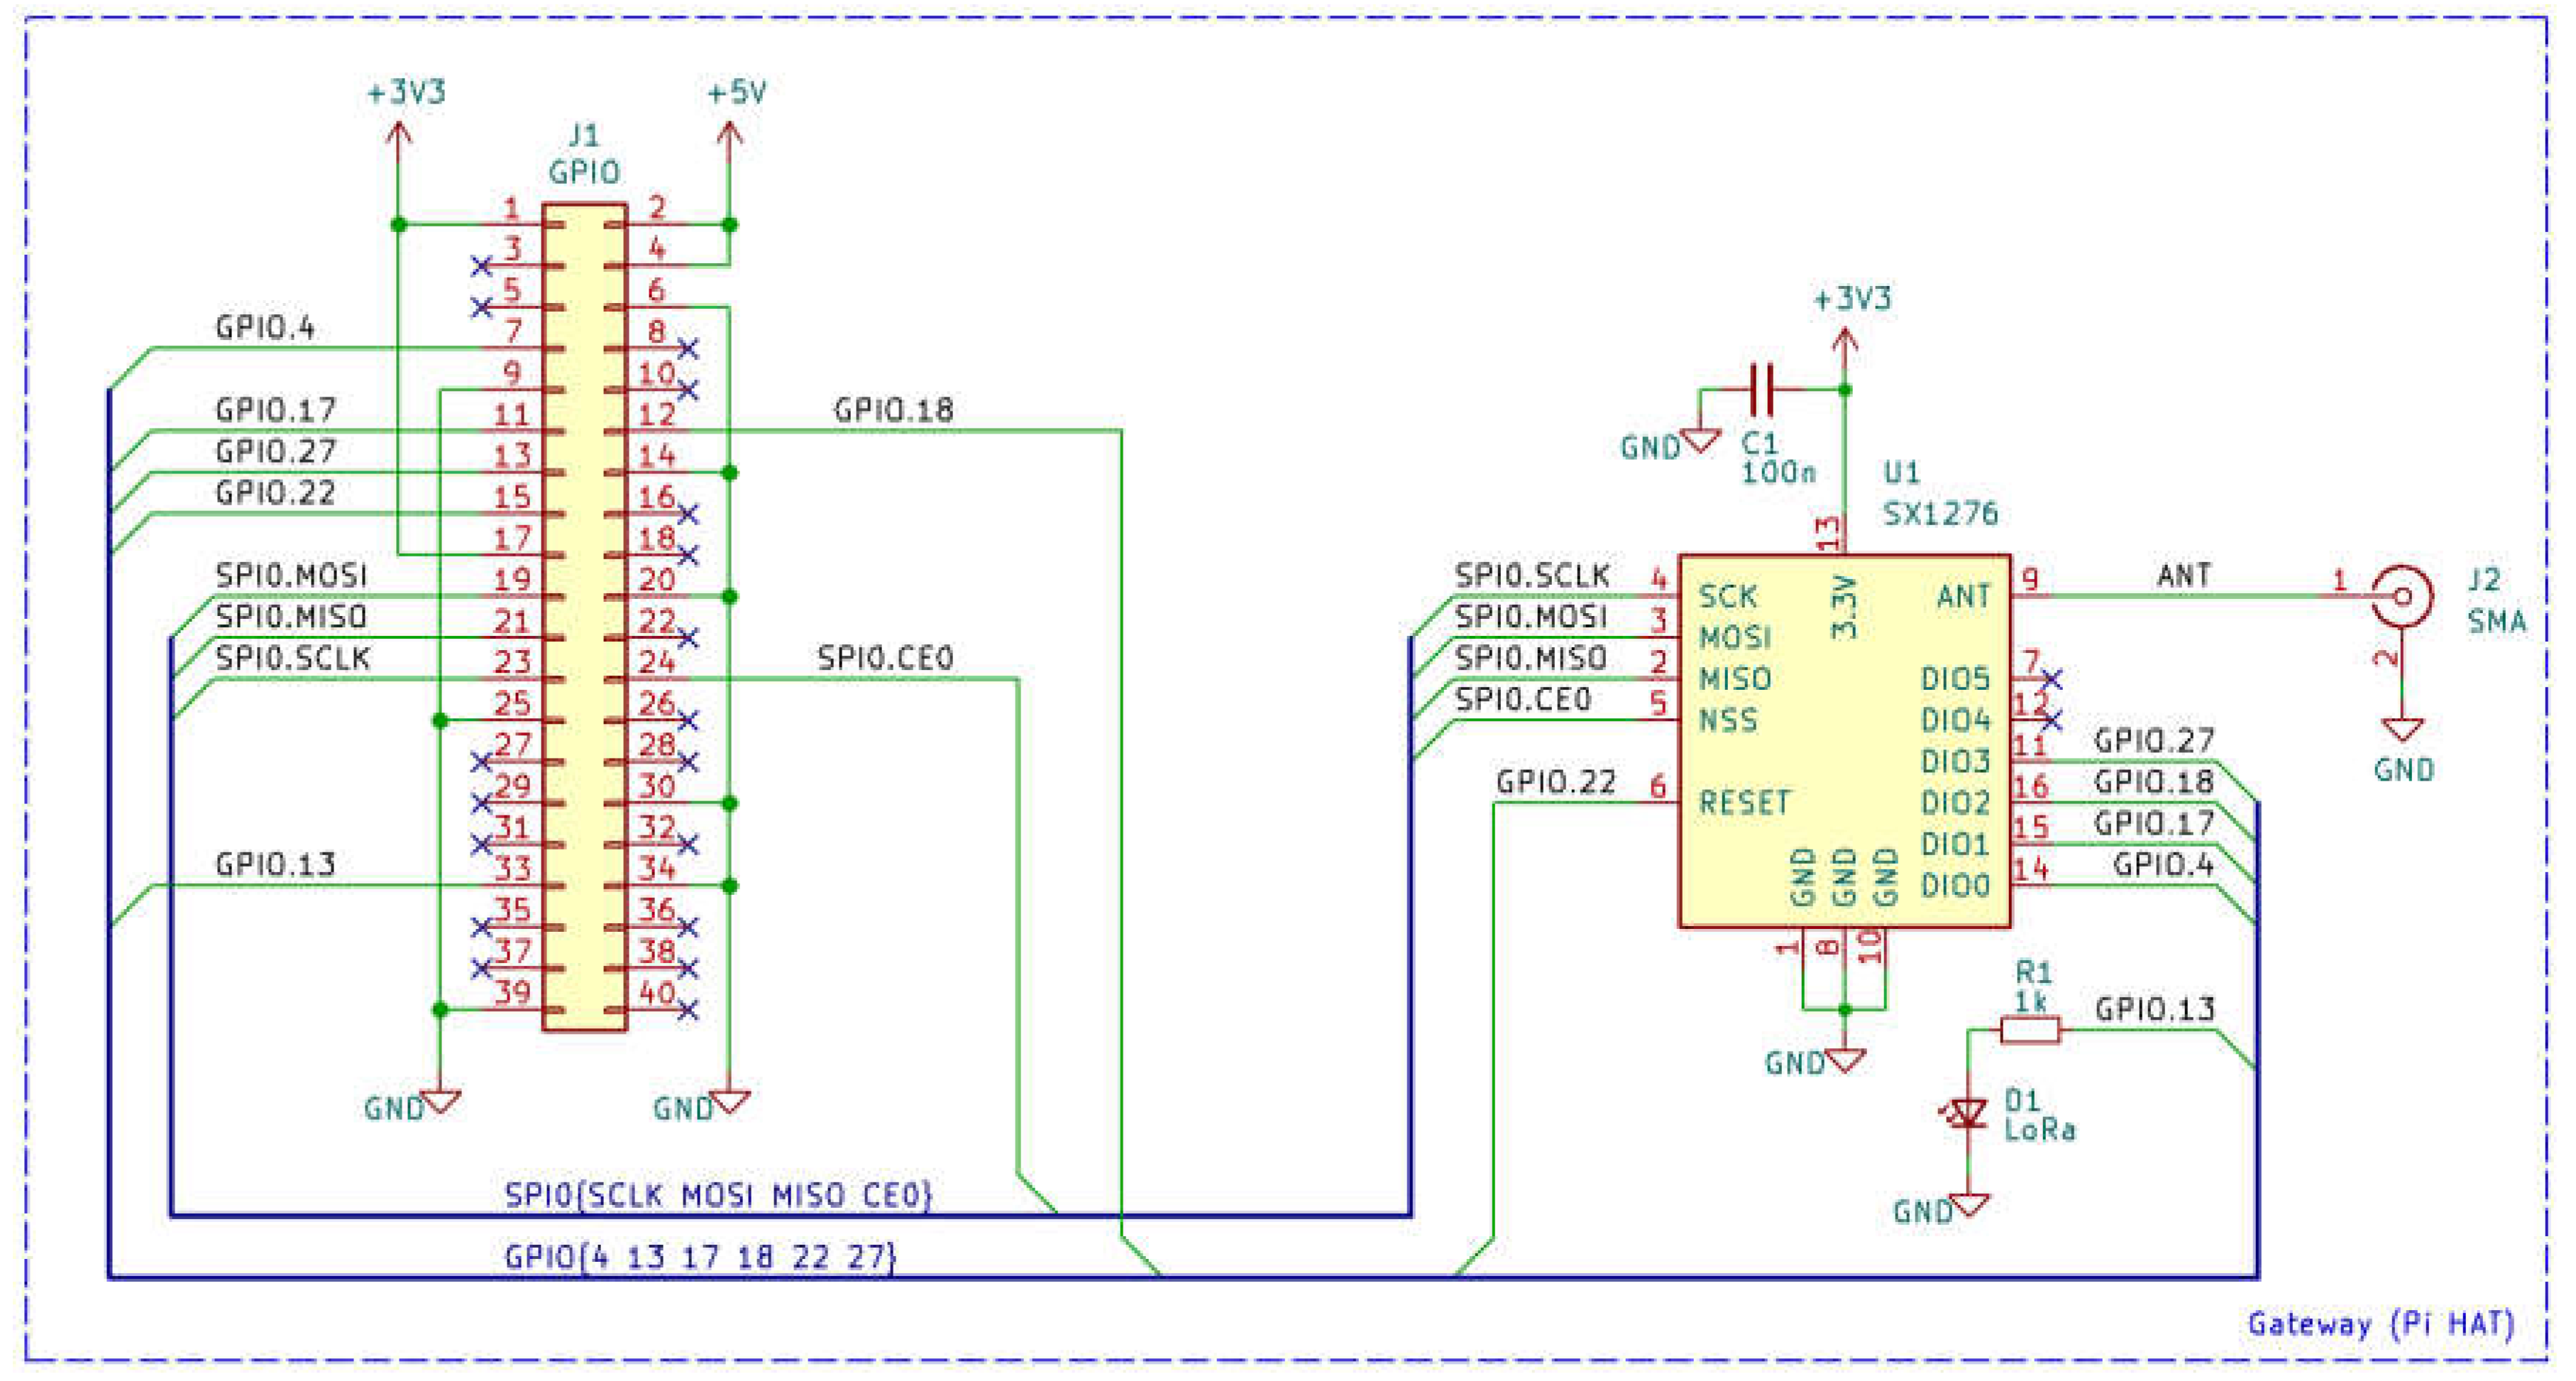
Figure 16. As the Arduino works at 5 V and the LoRa module works at 3.3 V, to ensure a good adaptation of logic levels, a voltage-level shifter (TXB0108 [27]) is inserted between these two devices.
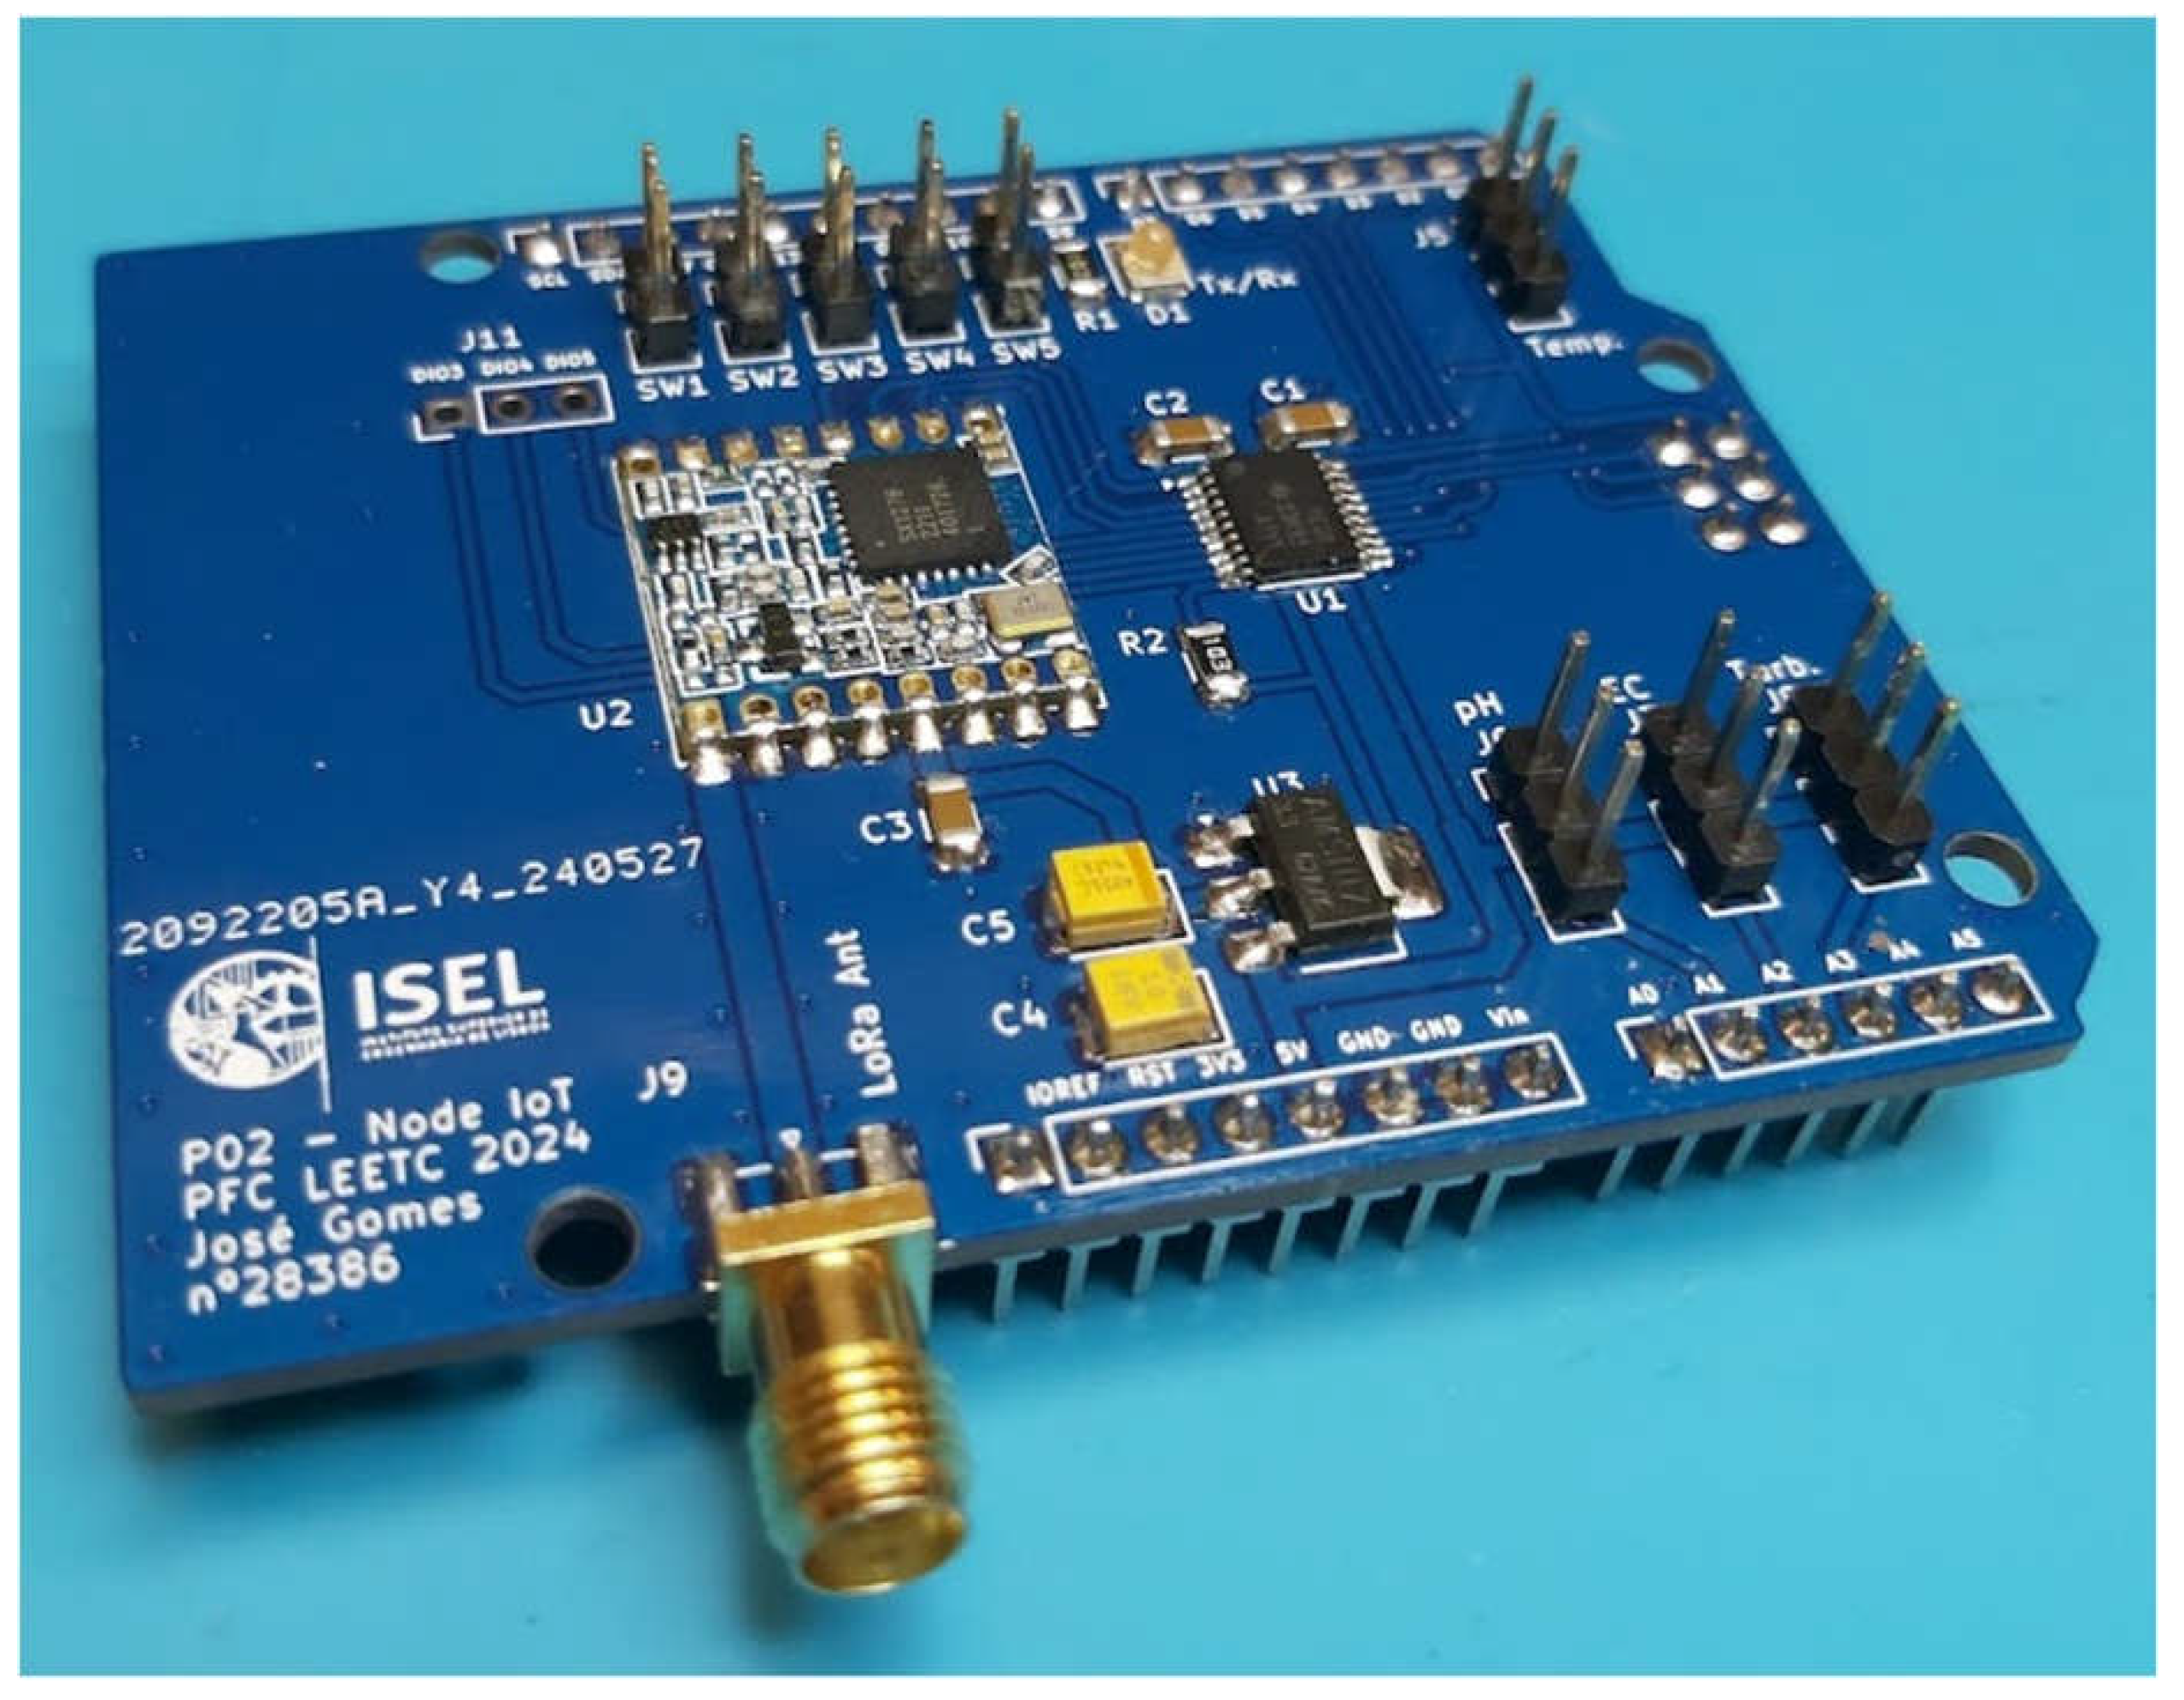
The Printed Circuit Board (PCB) of this Arduino shield is shown in
Figure 17. This board is also compatible with Arduino Uno.
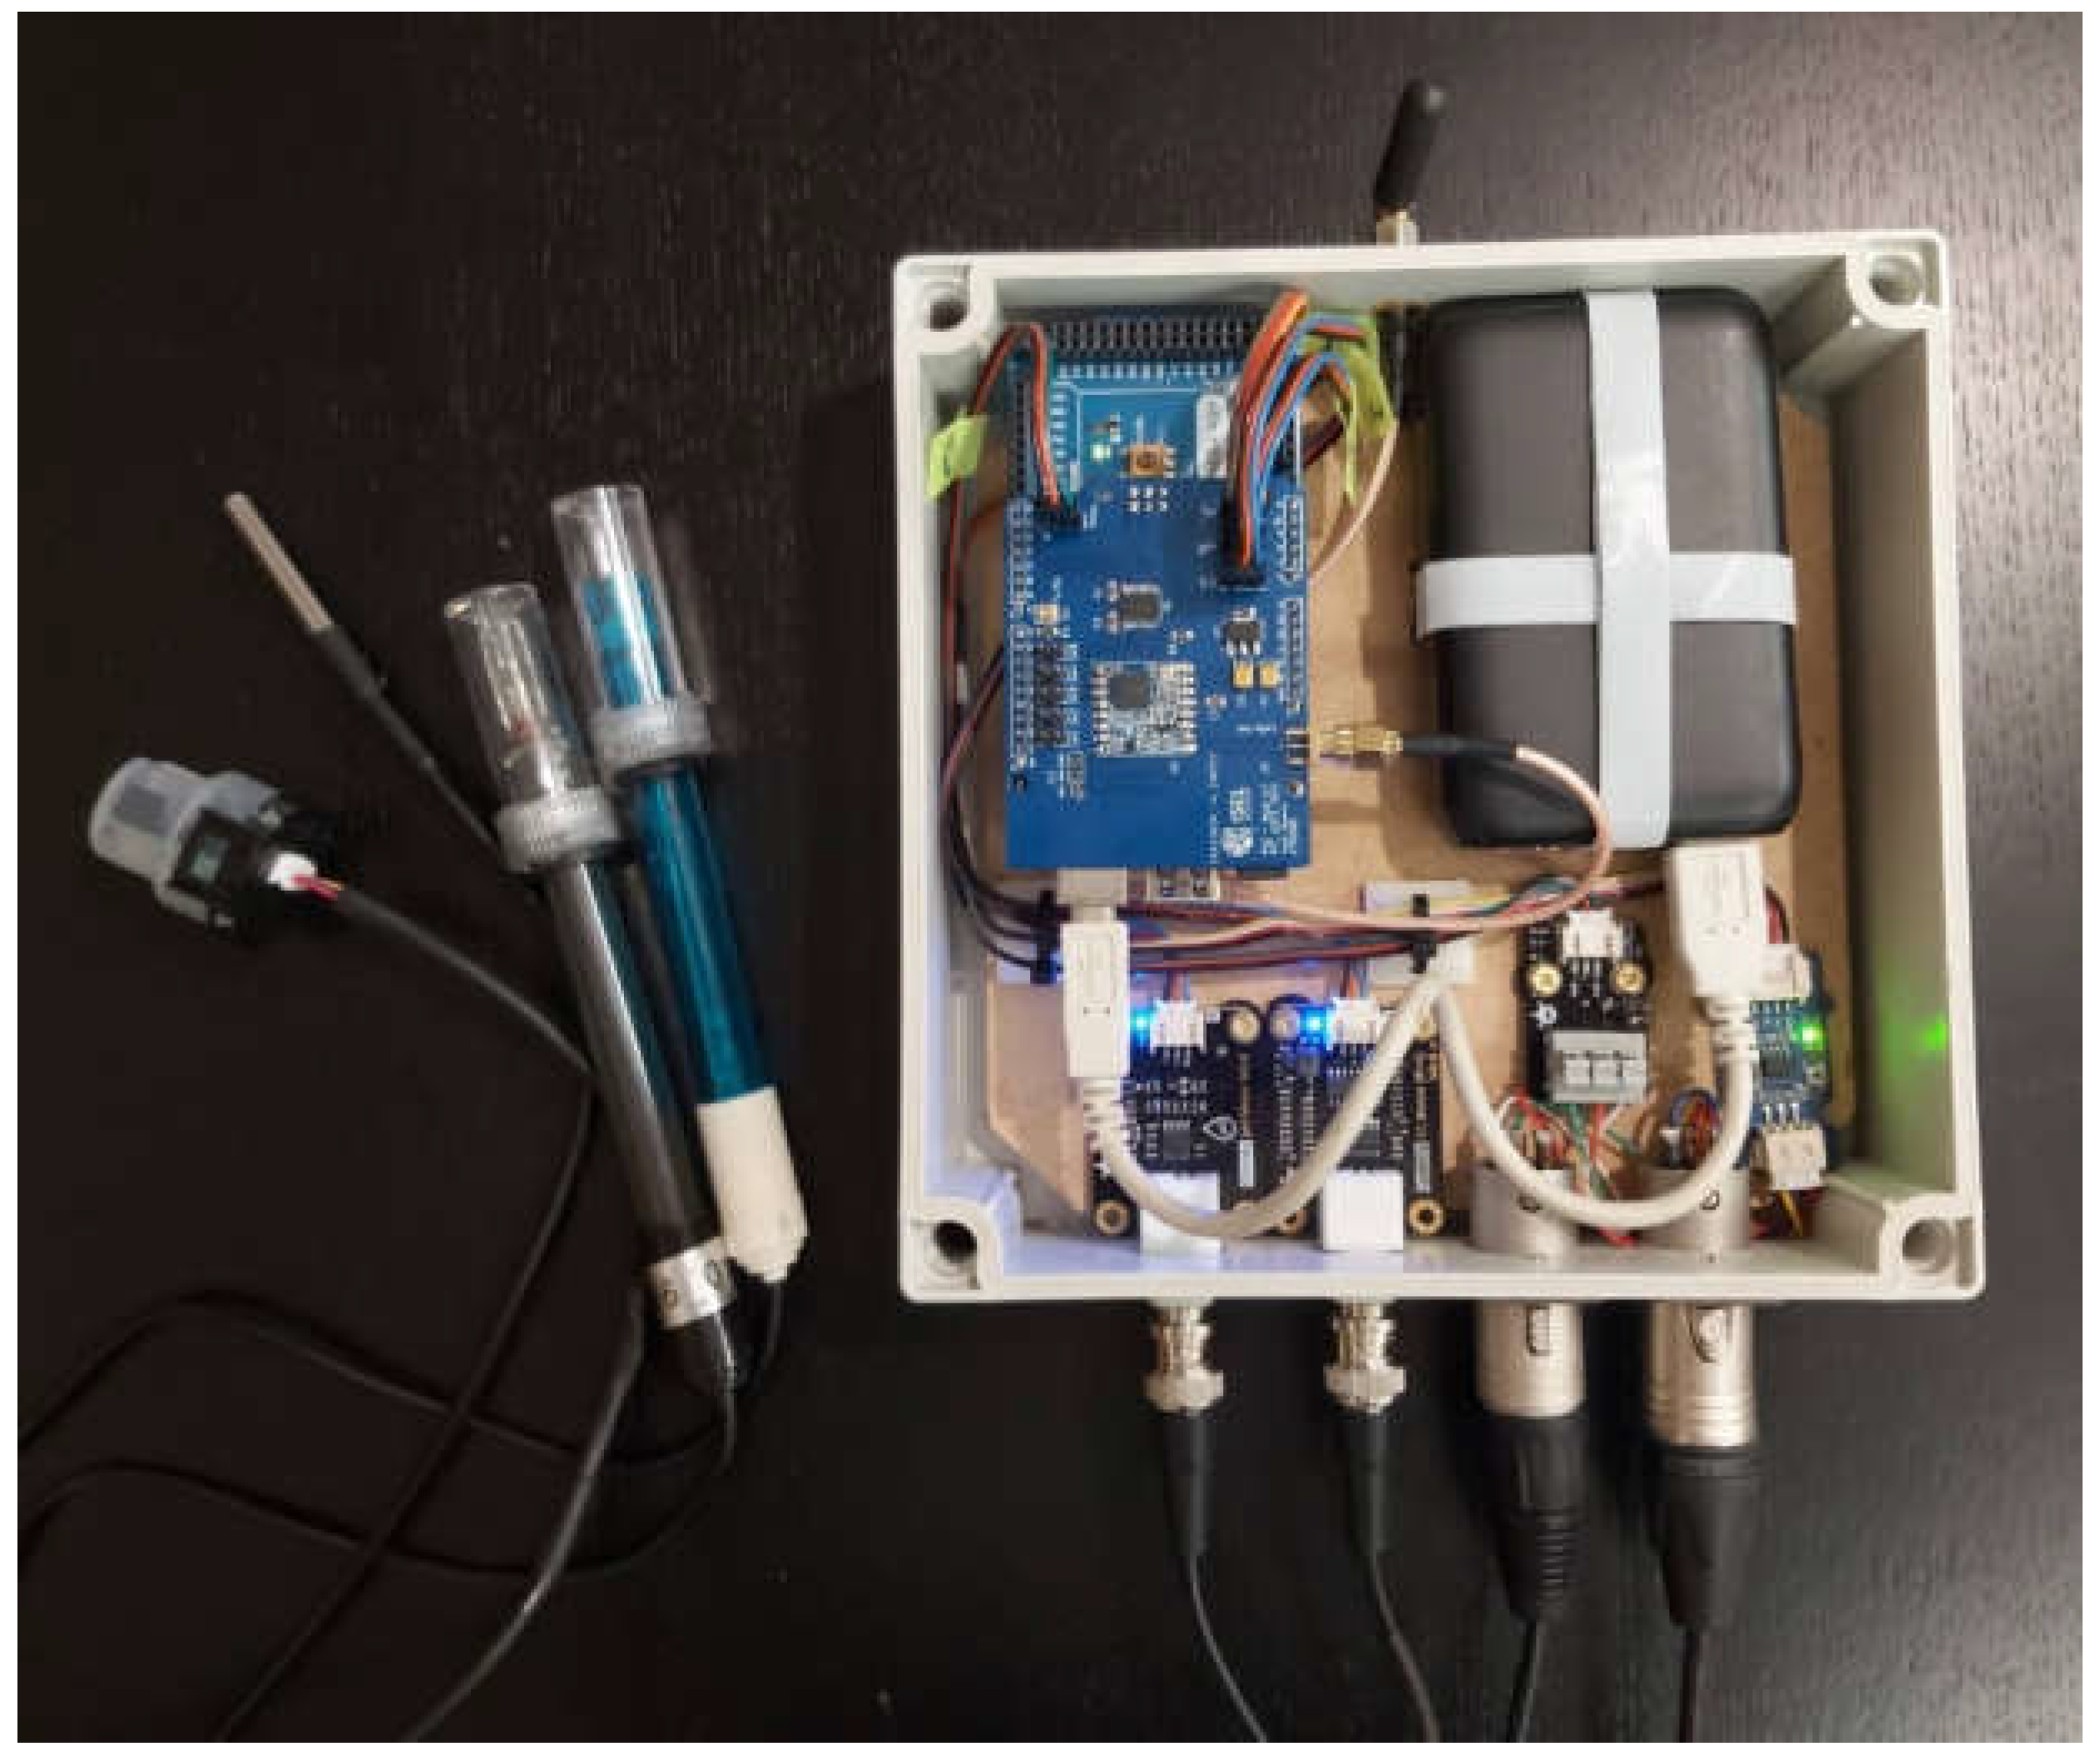
The final prototype of the IoT Node subsystem, with the components assembled in a box and prepared for installation close to a river, is shown in
Figure 18.
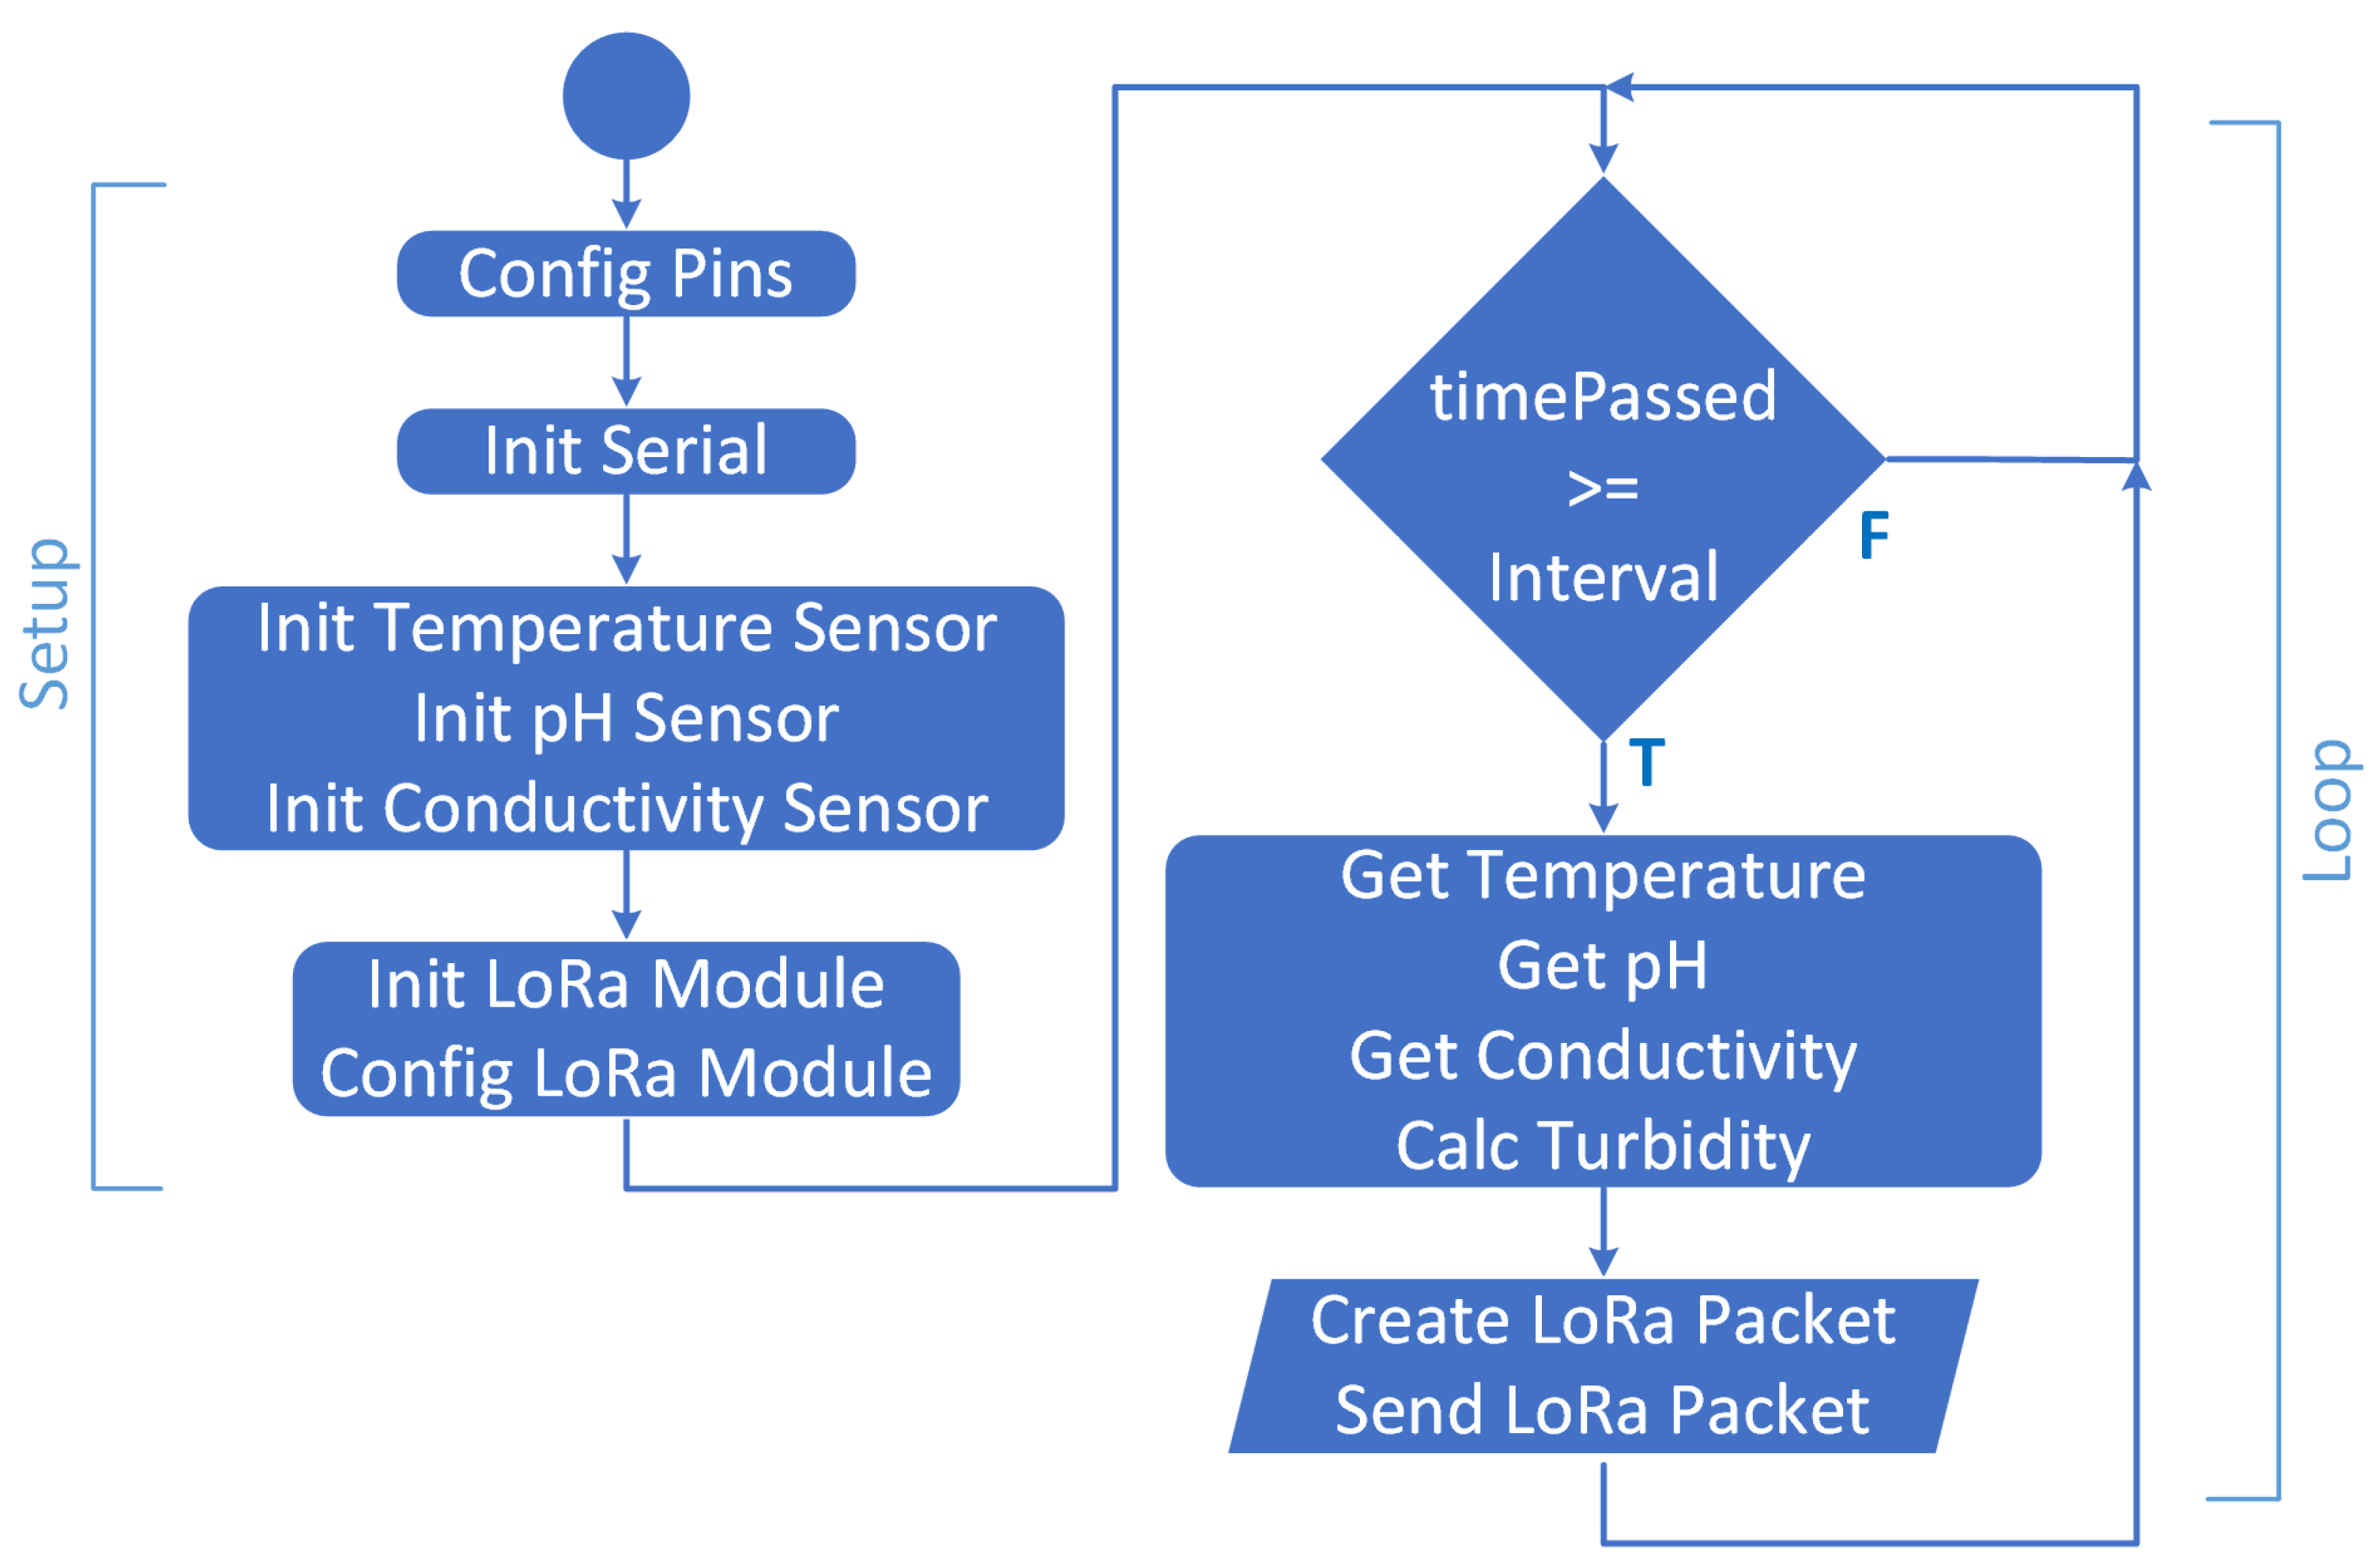
In IoT Node, a program is developed for Arduino board in C/C++, whose main function is to take the sensors readings and create a payload with these values to be sent to the LoRa network.
Figure 19 shows the program flowchart.
4.3. Gateway
For Gateway, an HAT, is designed for the Raspberry Pi 3 board, and its electrical schematic is shown in
Figure 20.
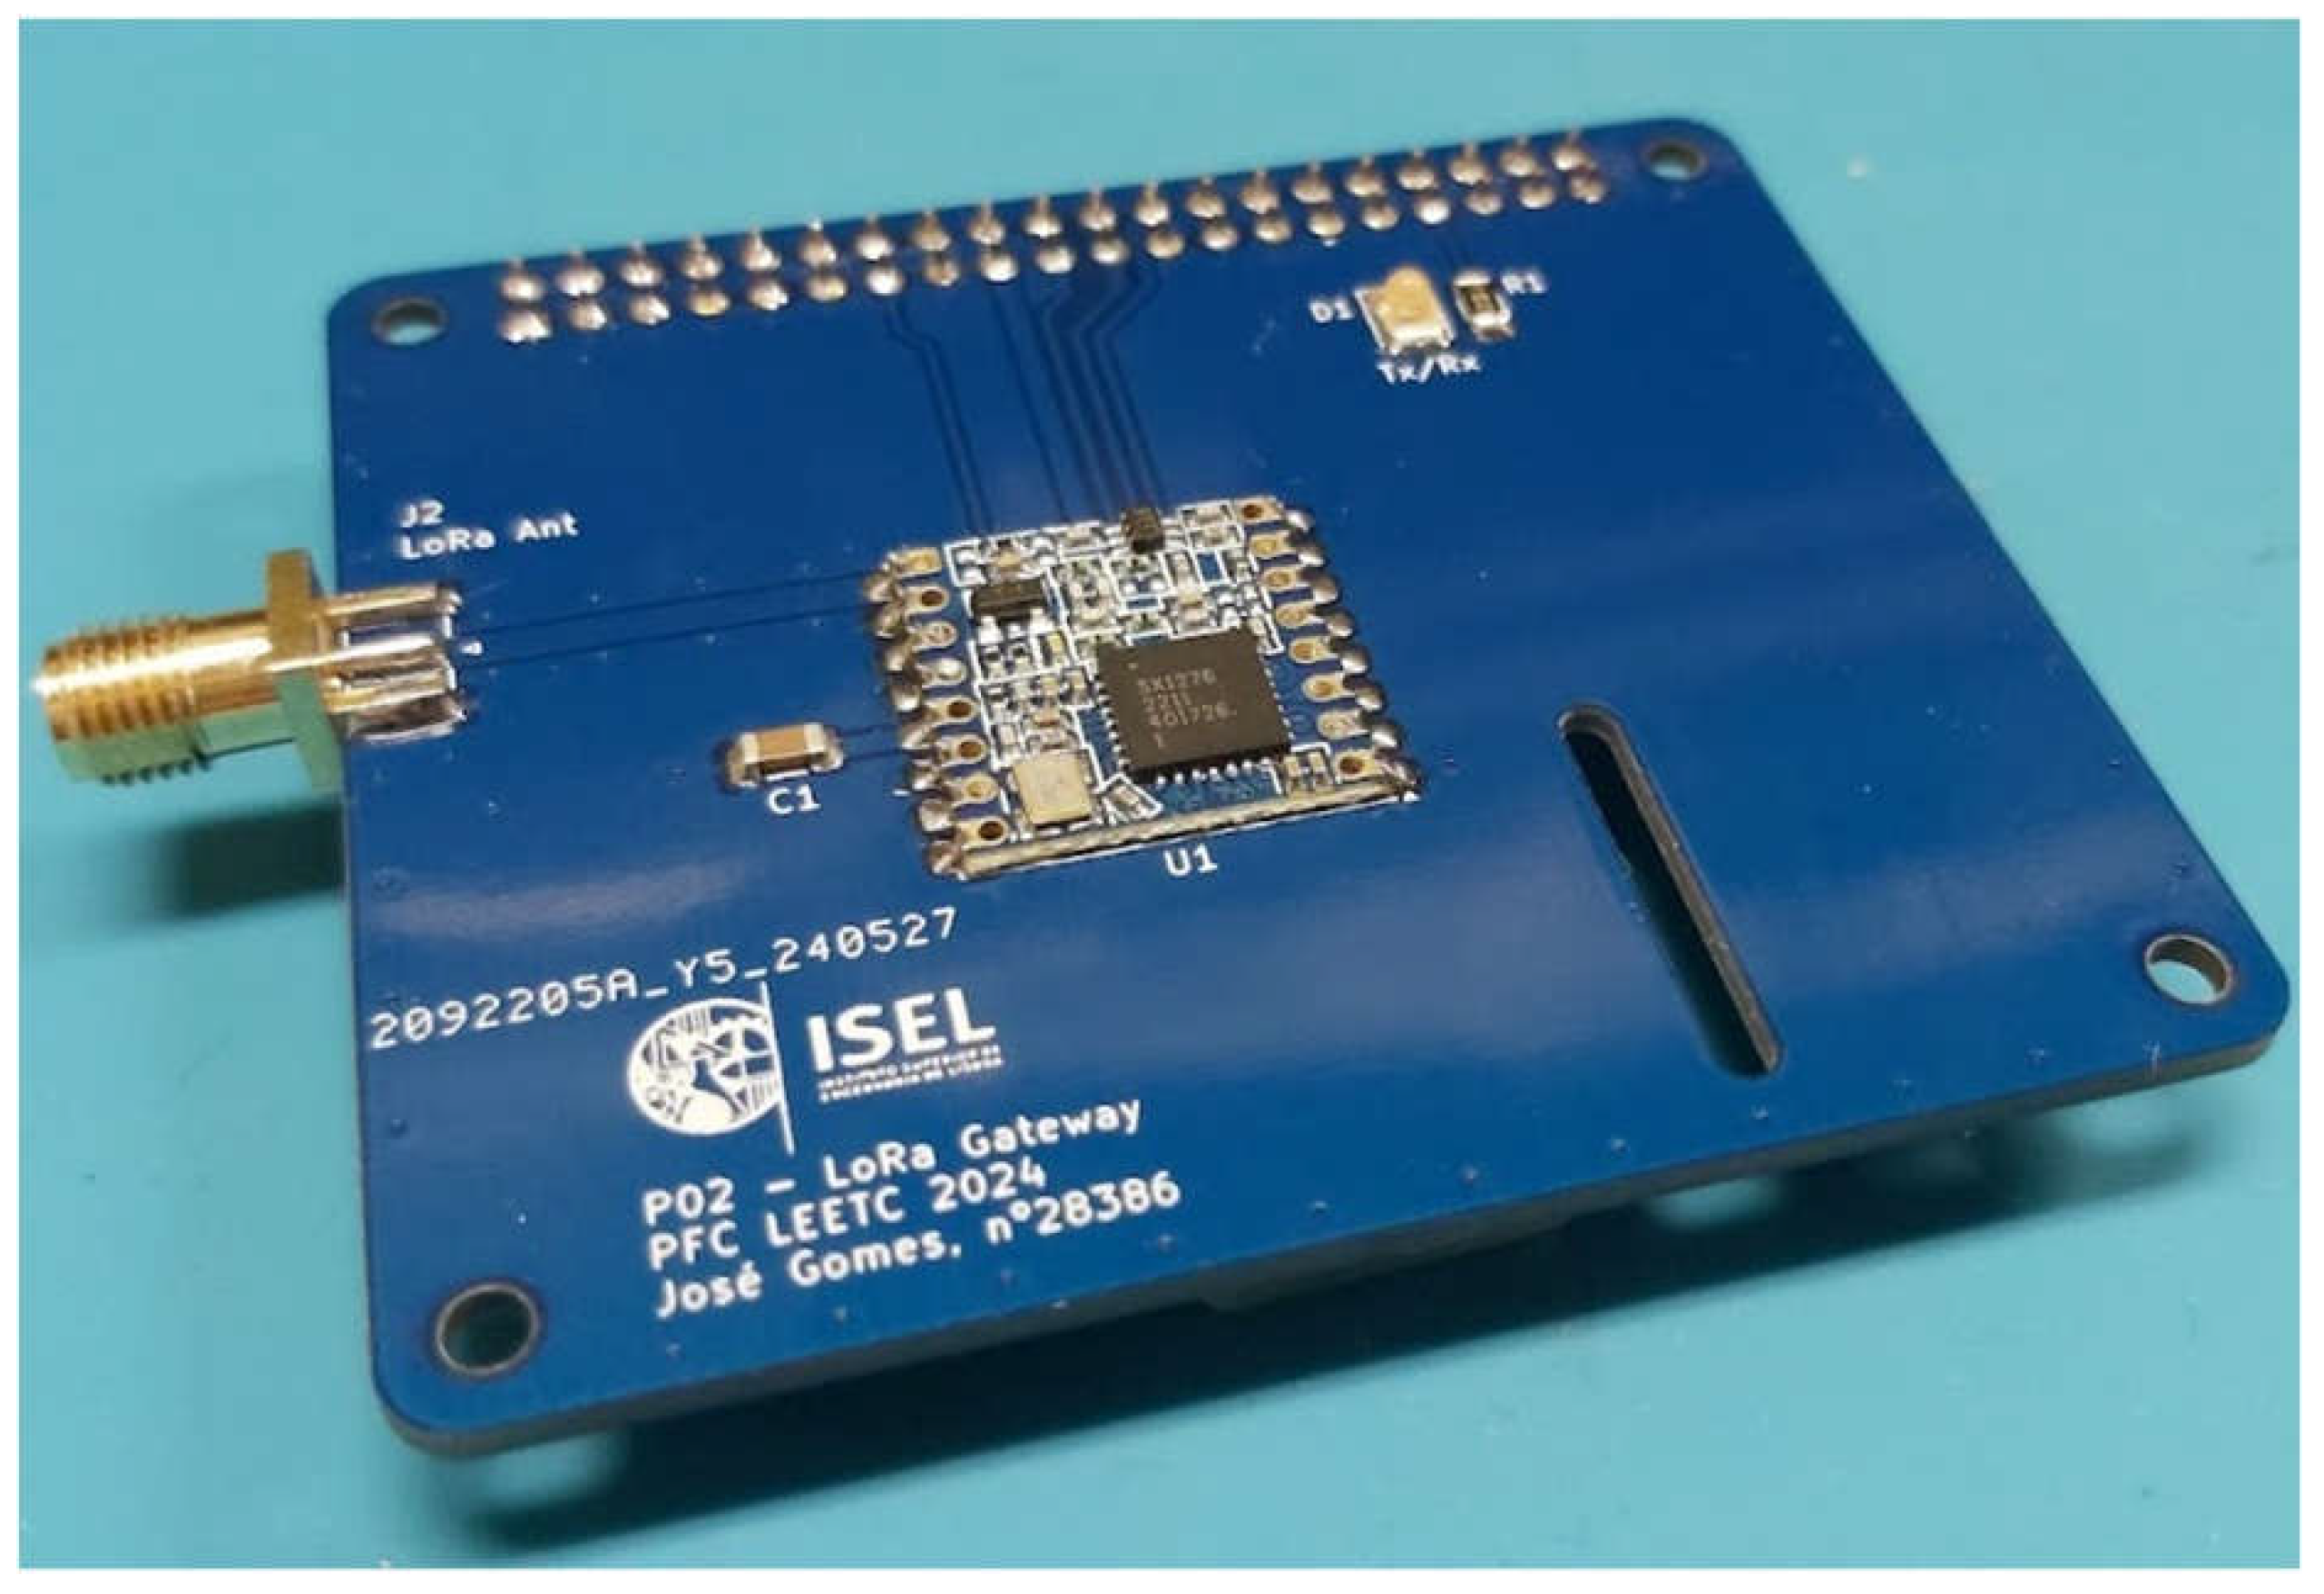
The PCB of Raspberry Pi HAT is shown in
Figure 21.
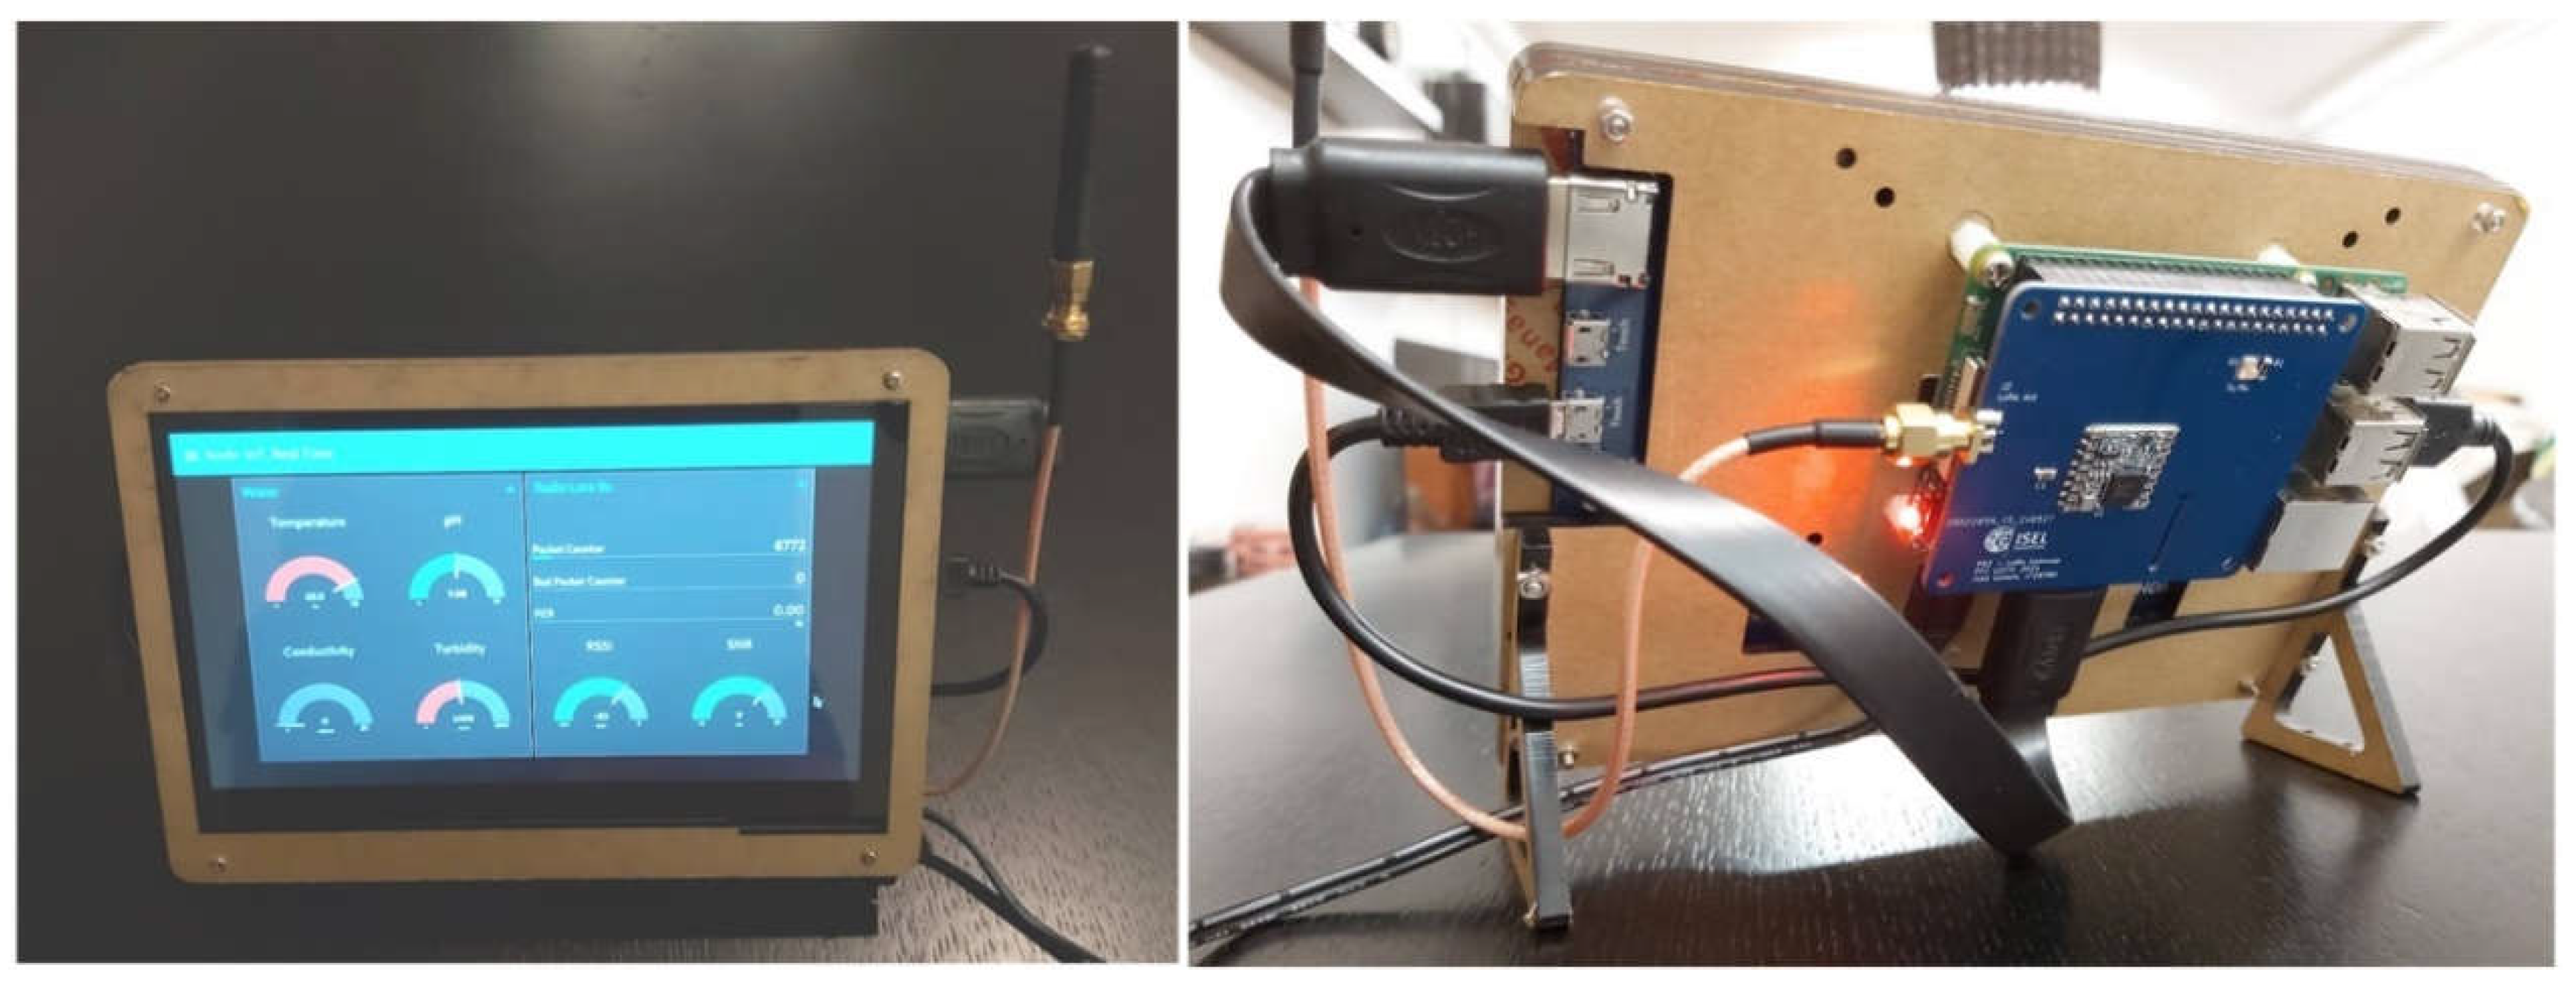
The final prototype of the Gateway subsystem, with the display, the Raspberry Pi and the HAT assembled, is shown in
Figure 22.
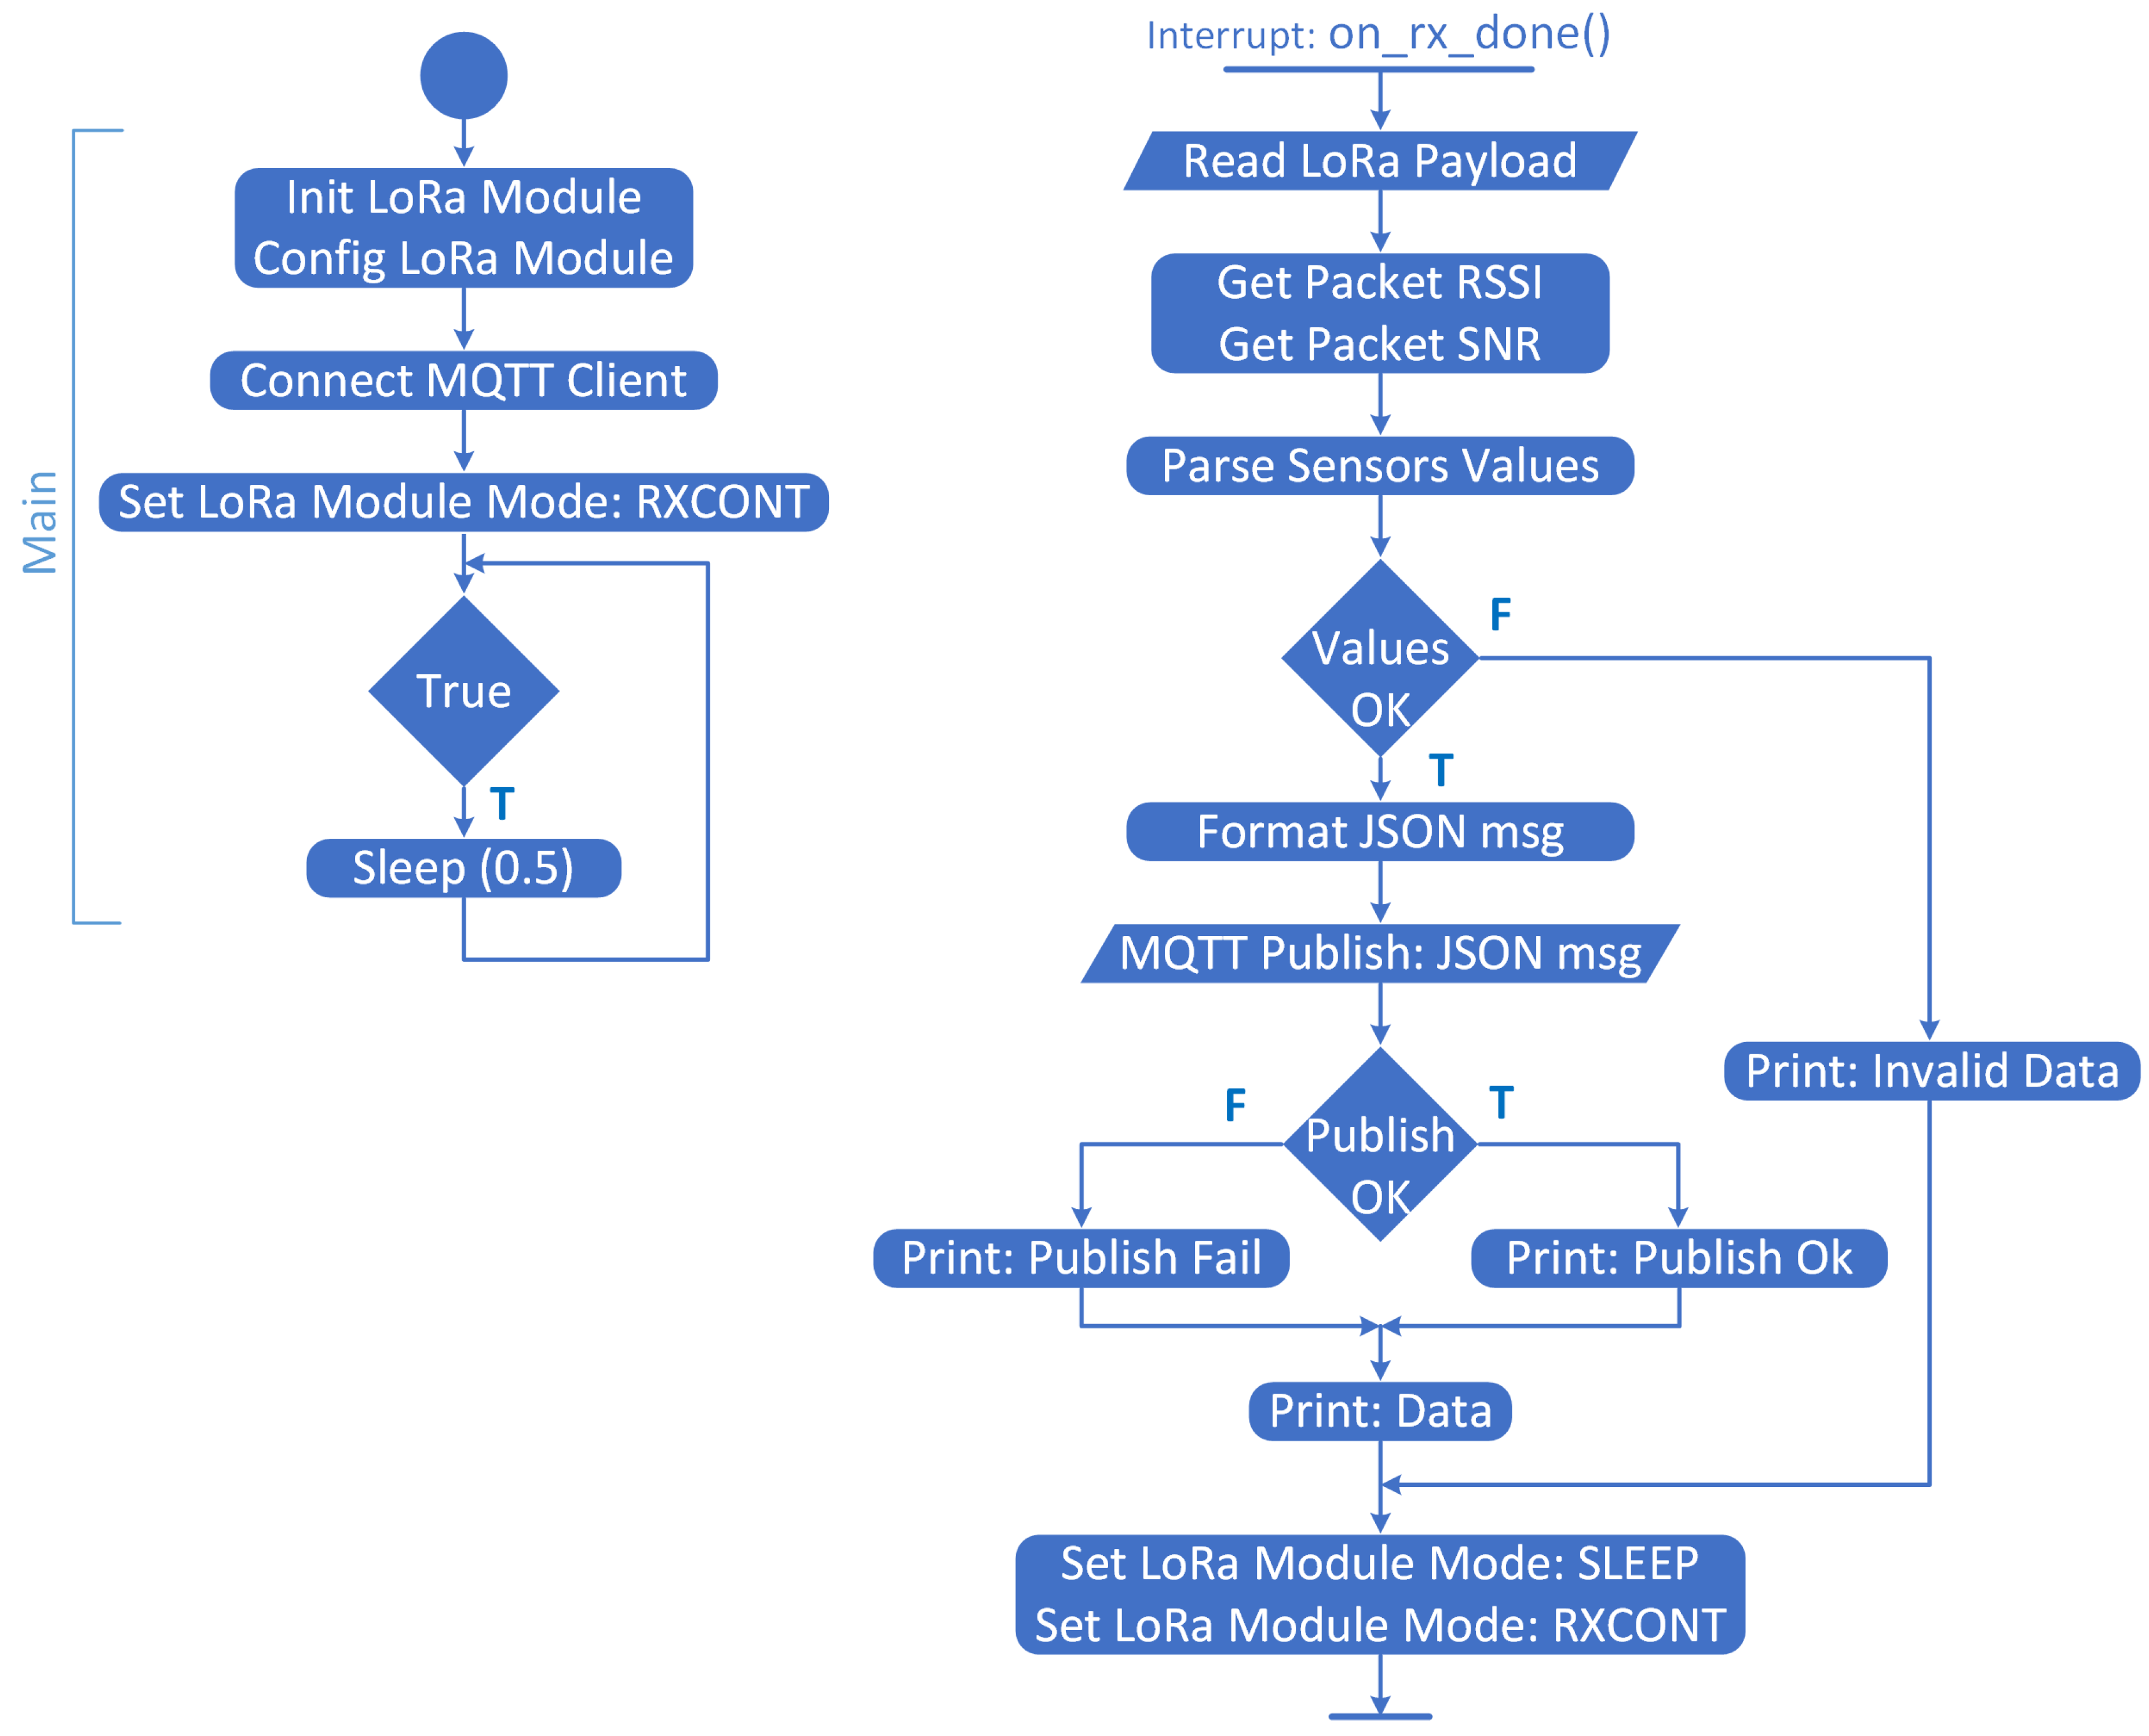
For the Gateway, a program is developed in Python [28] where the data is received with another LoRa transceiver.
Figure 23 shows the program flowchart.
In the Main section of the program, only the LoRa module is initialized and the connection from the MQTT client to the MQTT Broker is carried out.
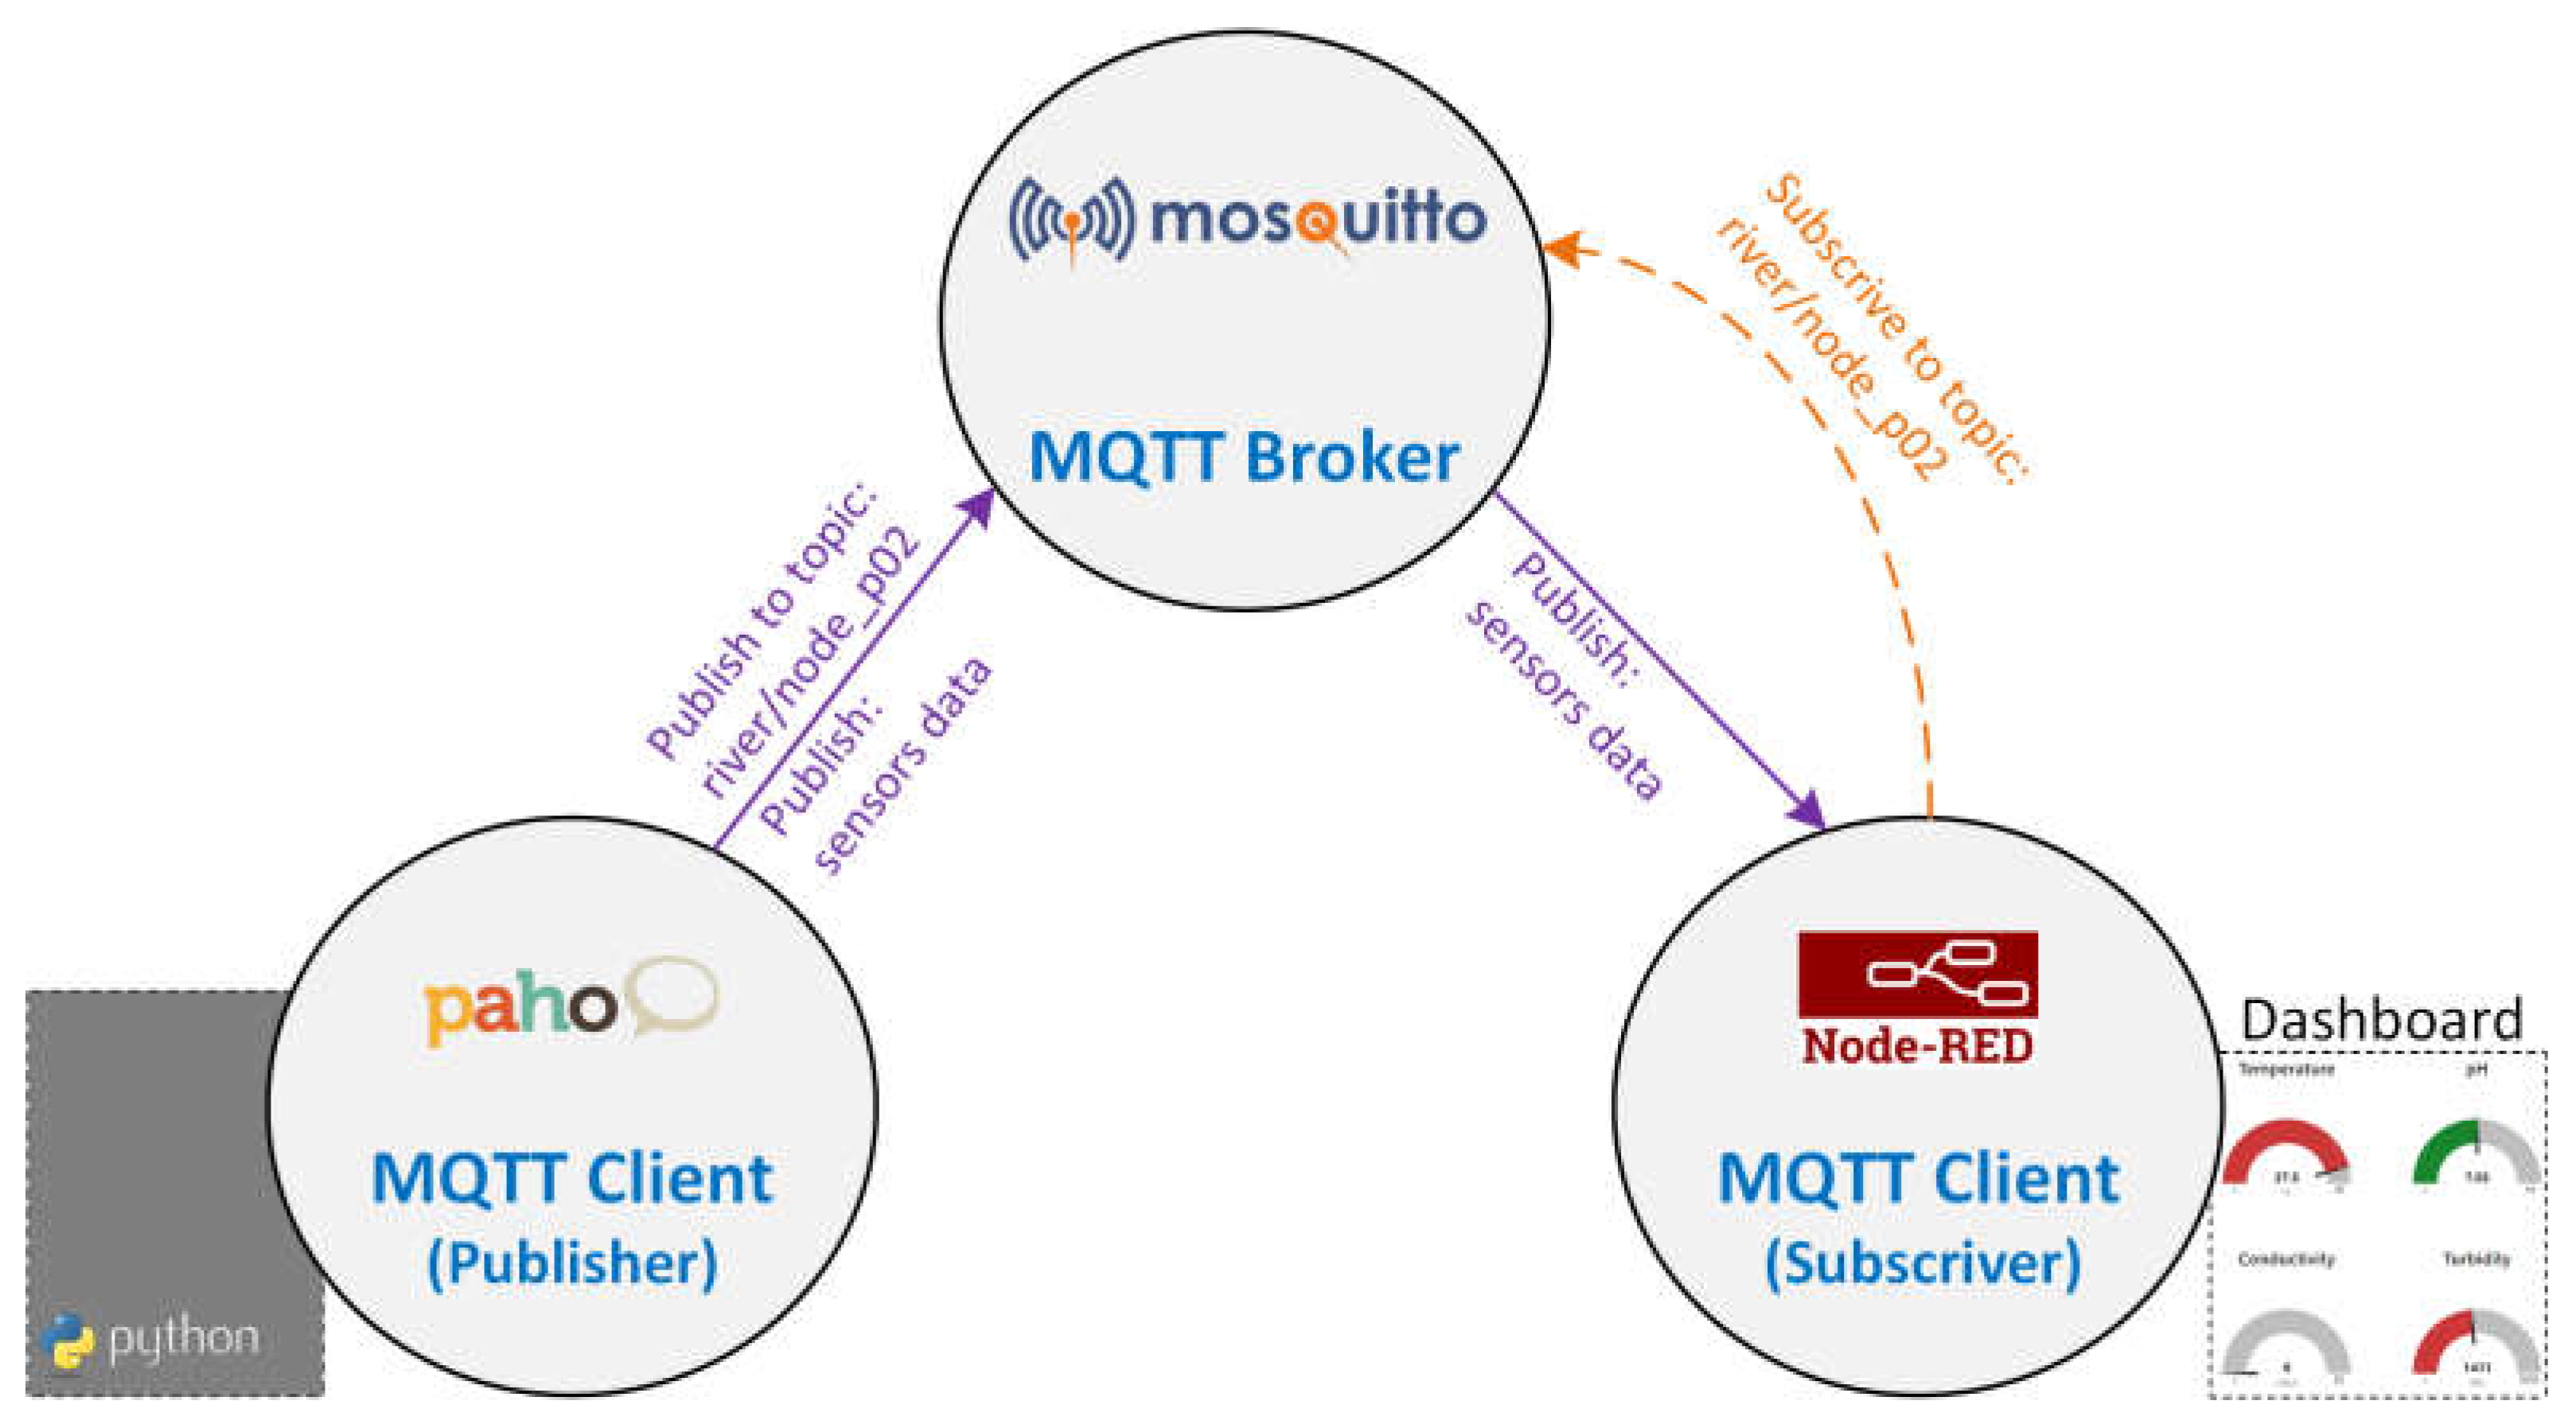
When the LoRa module receives a message it will cause an interruption in the program, through the DIO0 pin, and then in the interrupt handler (on_rx_done()) the data is processed and published in a local MQTT Broker (Mosquito) [29] by a MQTT Client (Paho) [30]. The data is subscribed by another MQTT Client in a local Node-RED [18] and finally is displayed on the dashboard, see
Figure 24.
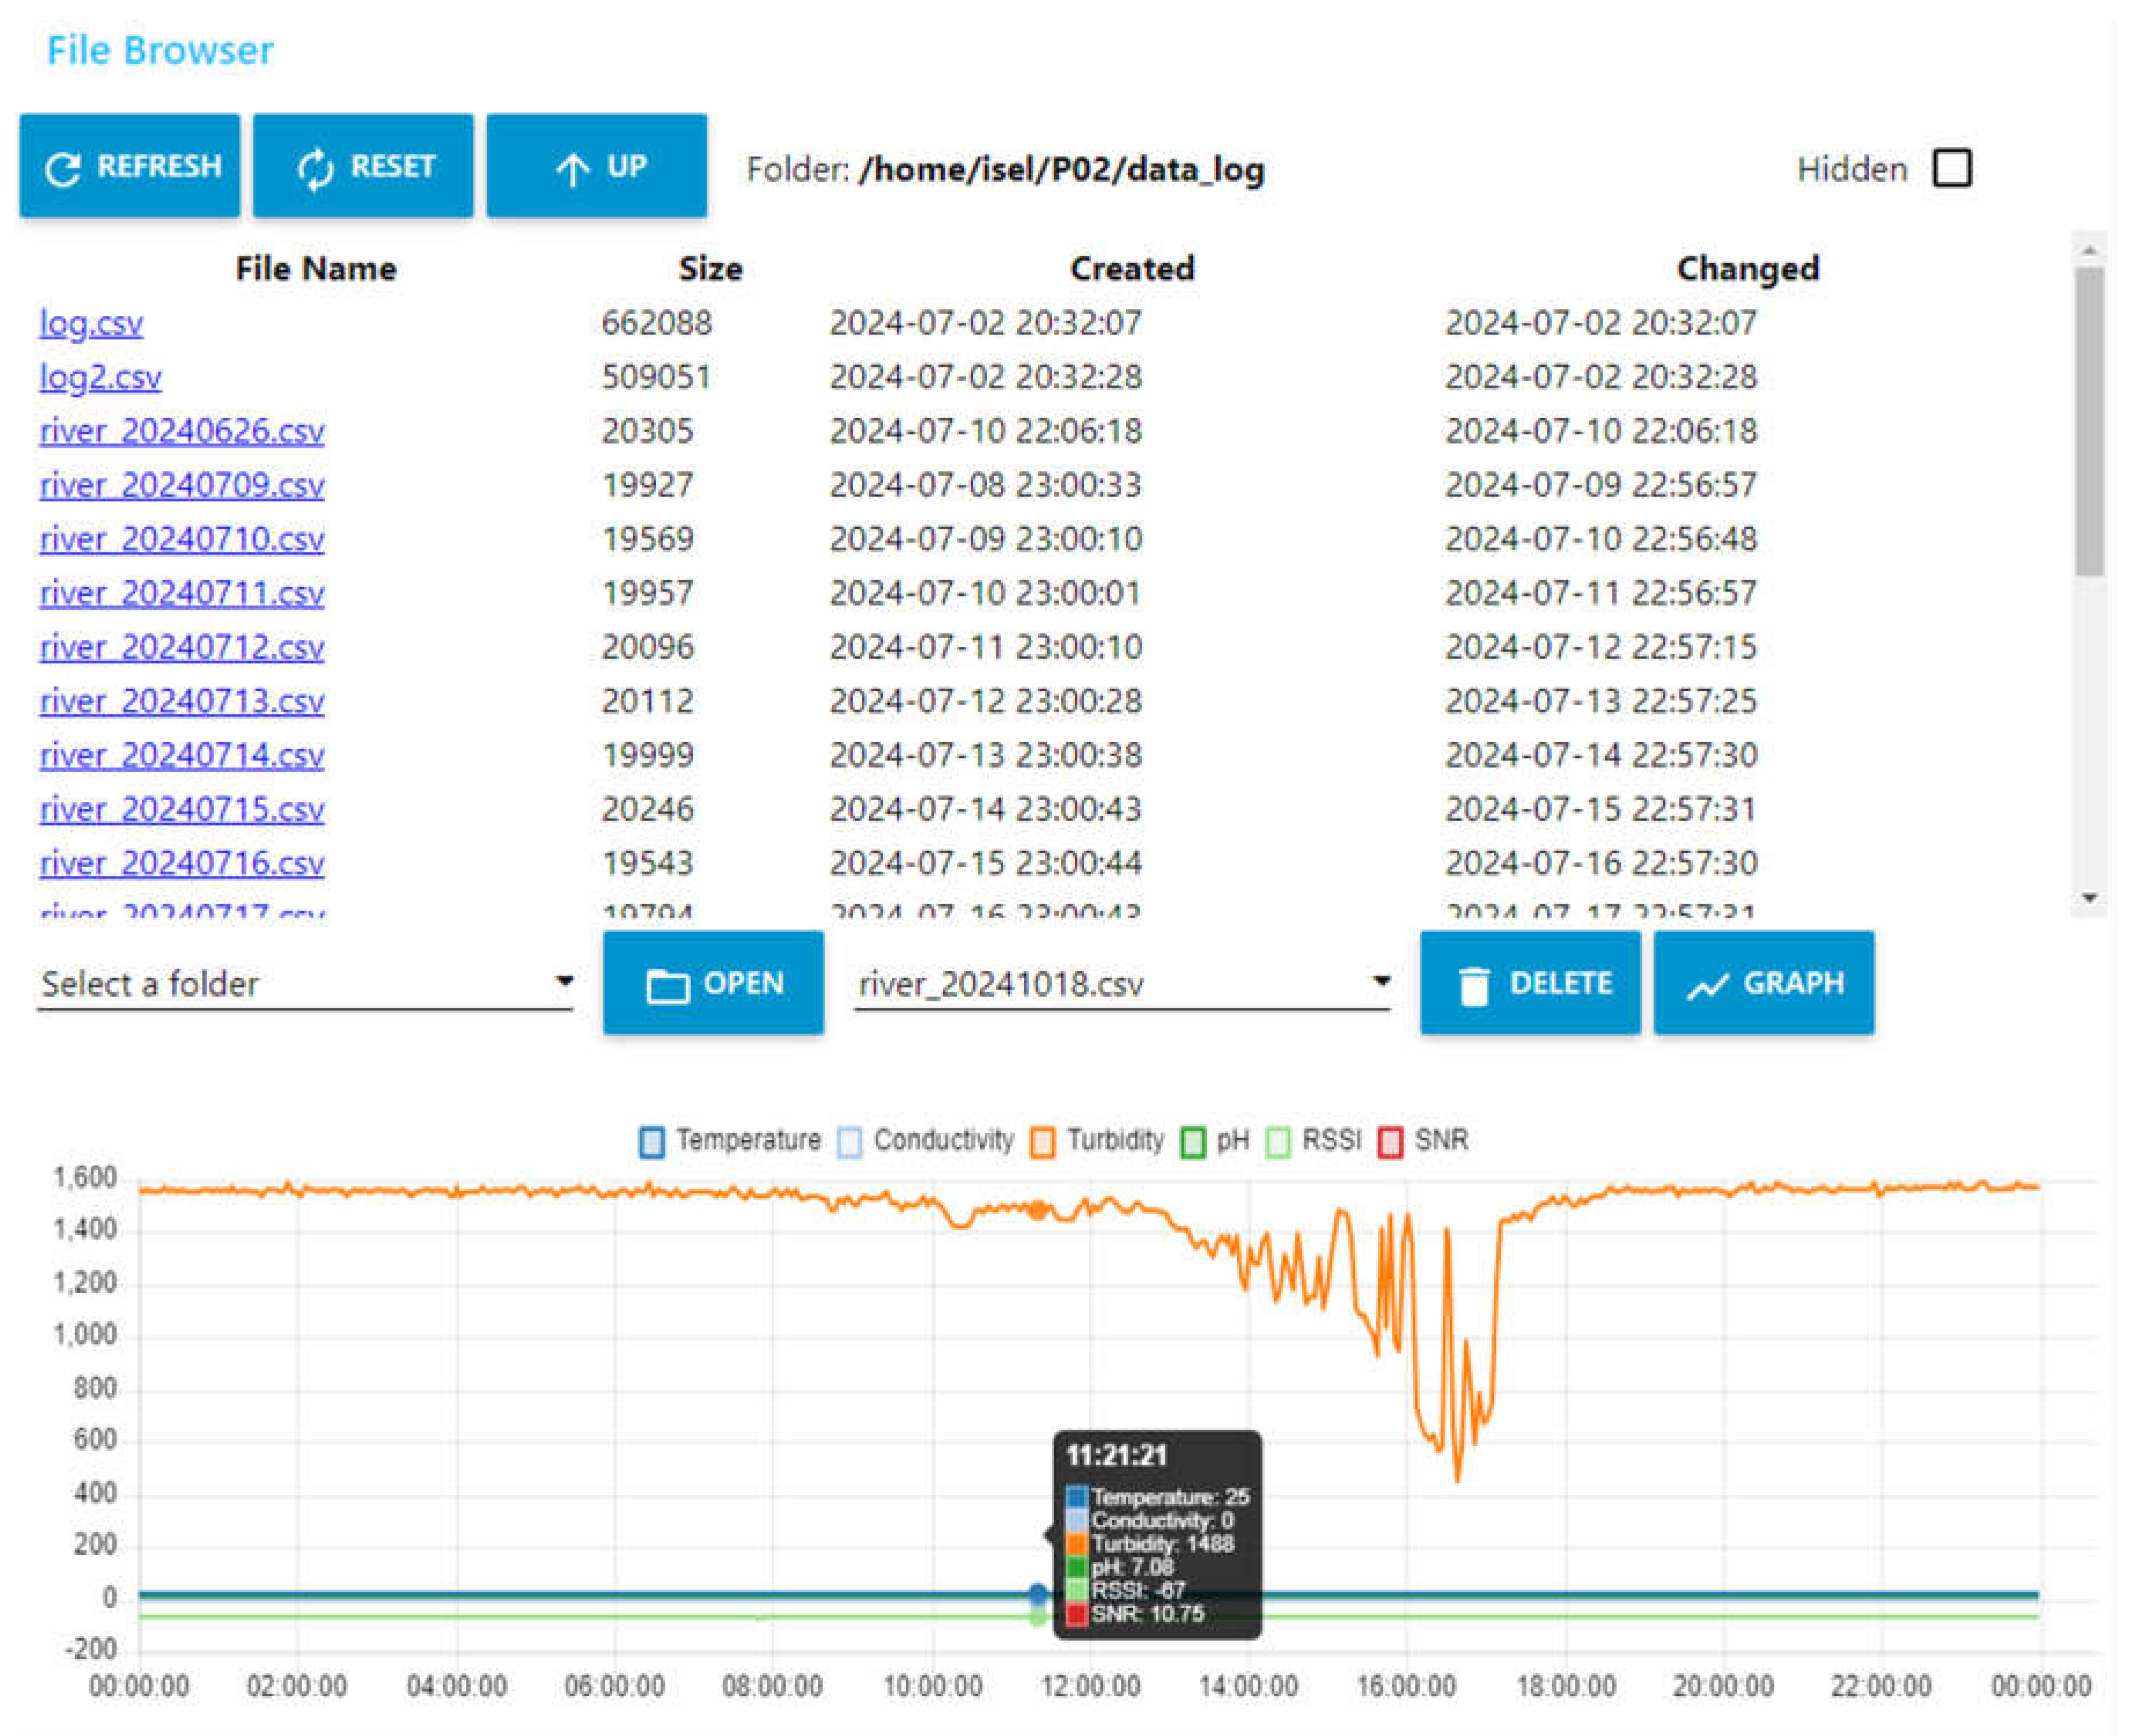
In Node-RED, a flow is developed to allow us to present the data in real time on a dashboard (
Figure 25) and record it in Comma-Separated Values (CSV) format, for historic view and future external processing (
Figure 26).
5. Results
In this section, energy consumption measurements for the IoT Node subsystem, LoRa radio coverage tests and finally a test in a real scenario on the Jamor River are presented.
5.1. Energy Consumption
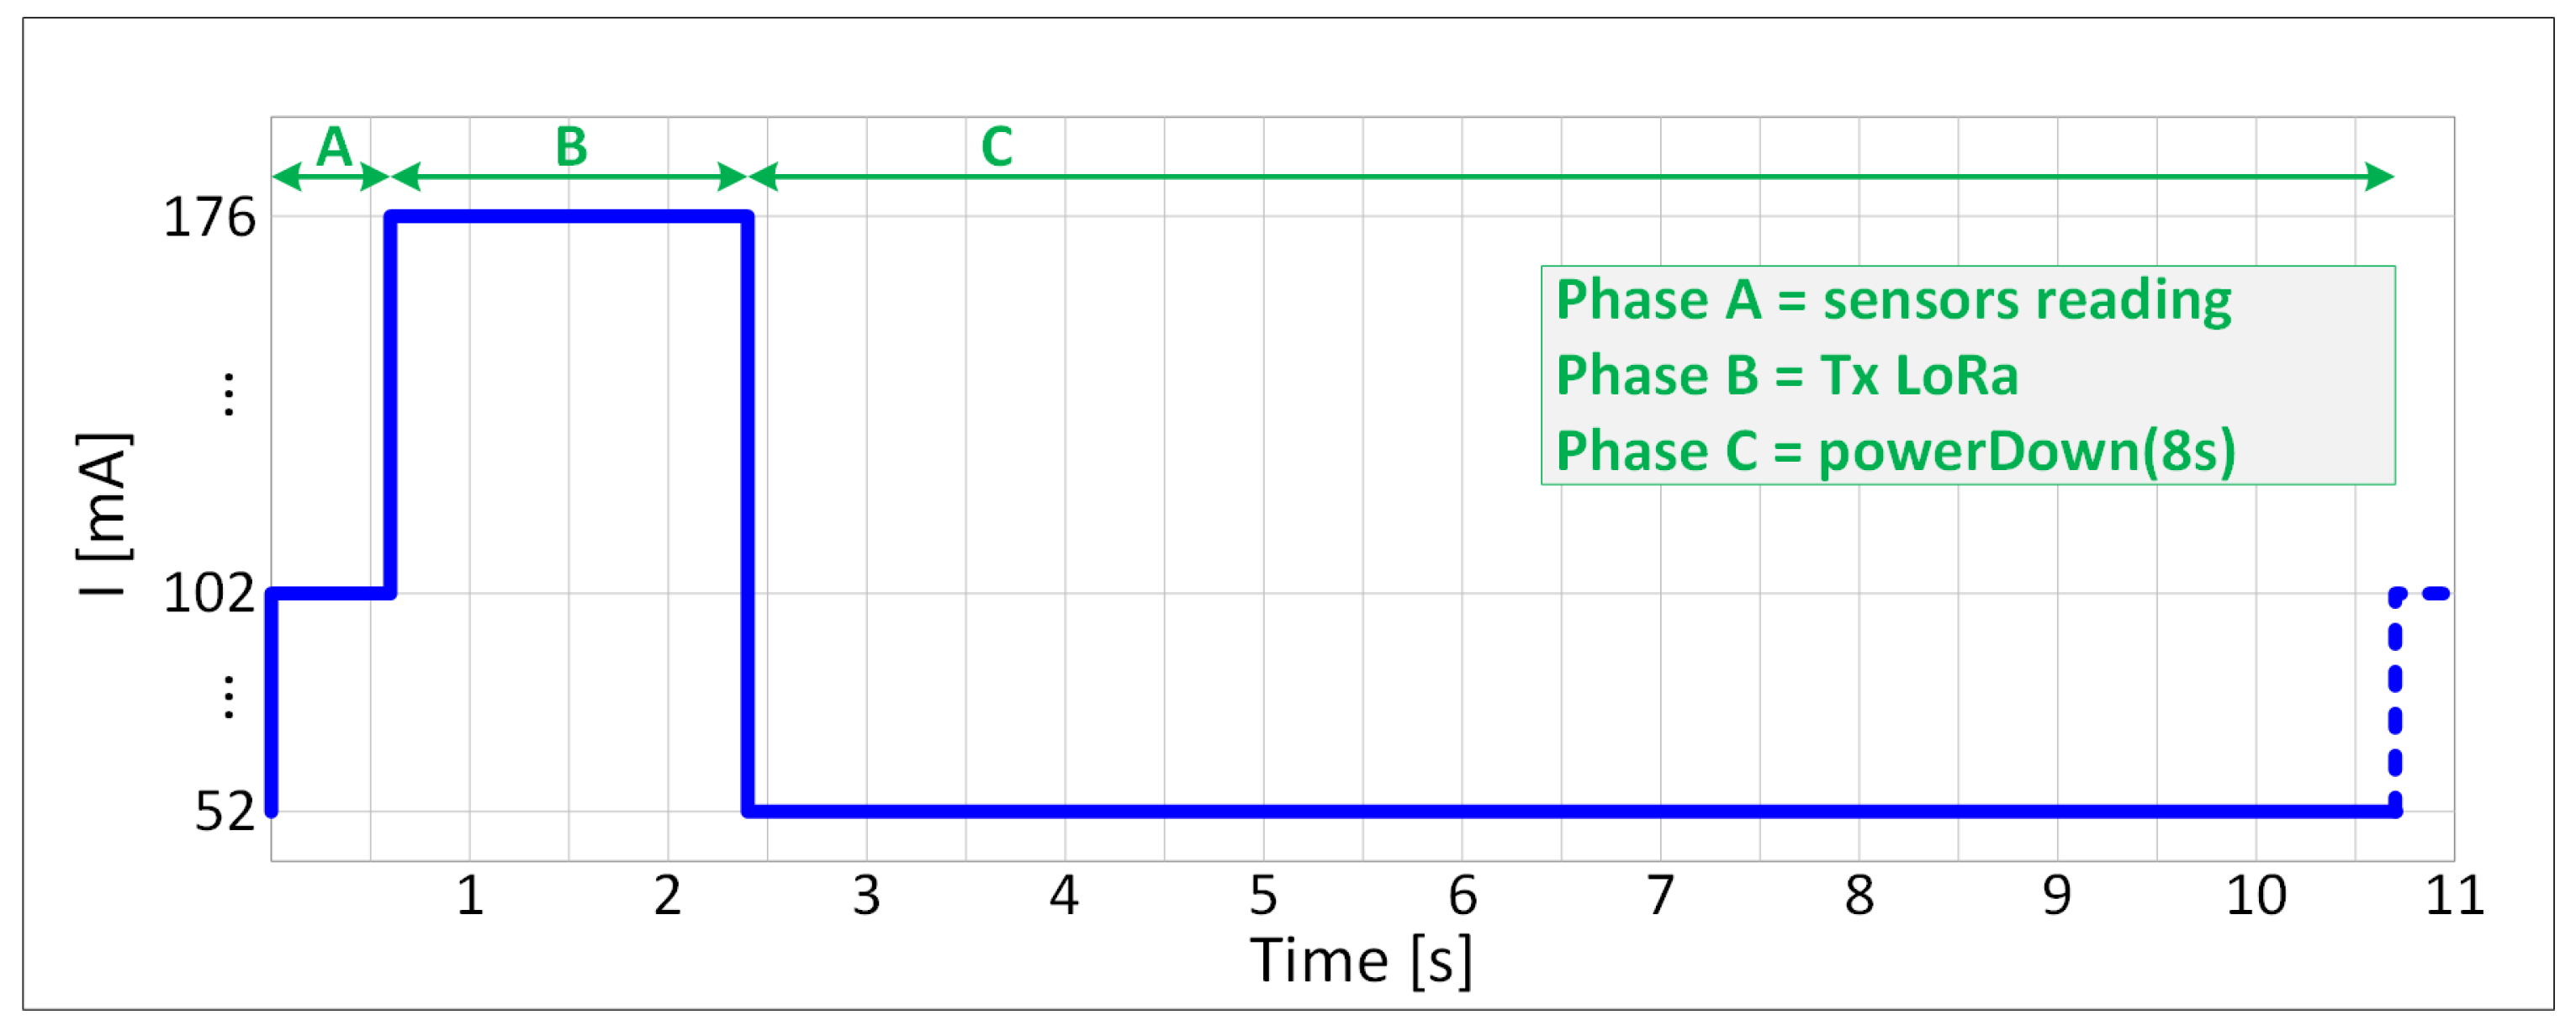
As the IoT Node is to be operated with battery, energy consumption measurements were carried out, with the Arduino in energy saving mode, defining the consumption in each phase (A, B and C) of a work cycle of this subsystem, see
Figure 27.
And leads to the definition of the IoT energy consumption in one hour (9):
where T
A is fixed (0,6 s), T
B is the LoRa T
packet and T
C is the powerDown time configured on the Arduino. It is thus possible to predict the duration of a given battery or calculate its capacity for a required duration of operation.
Phase C consumption could still be minimized by removing the signaling LEDs from this subsystem.
5.2. LoRa Radio Coverage
LoRa radio coverage tests were carried out and a maximum distance of 2,53 km was obtained, in urban and Non-Line of Sight (NLOS) environment. For practical reasons, to facilitate this test, the IoT Node was fixed, and the Gateway was on the move, see
Figure 28.
5.3. Monitoring a River (Real Scenario)
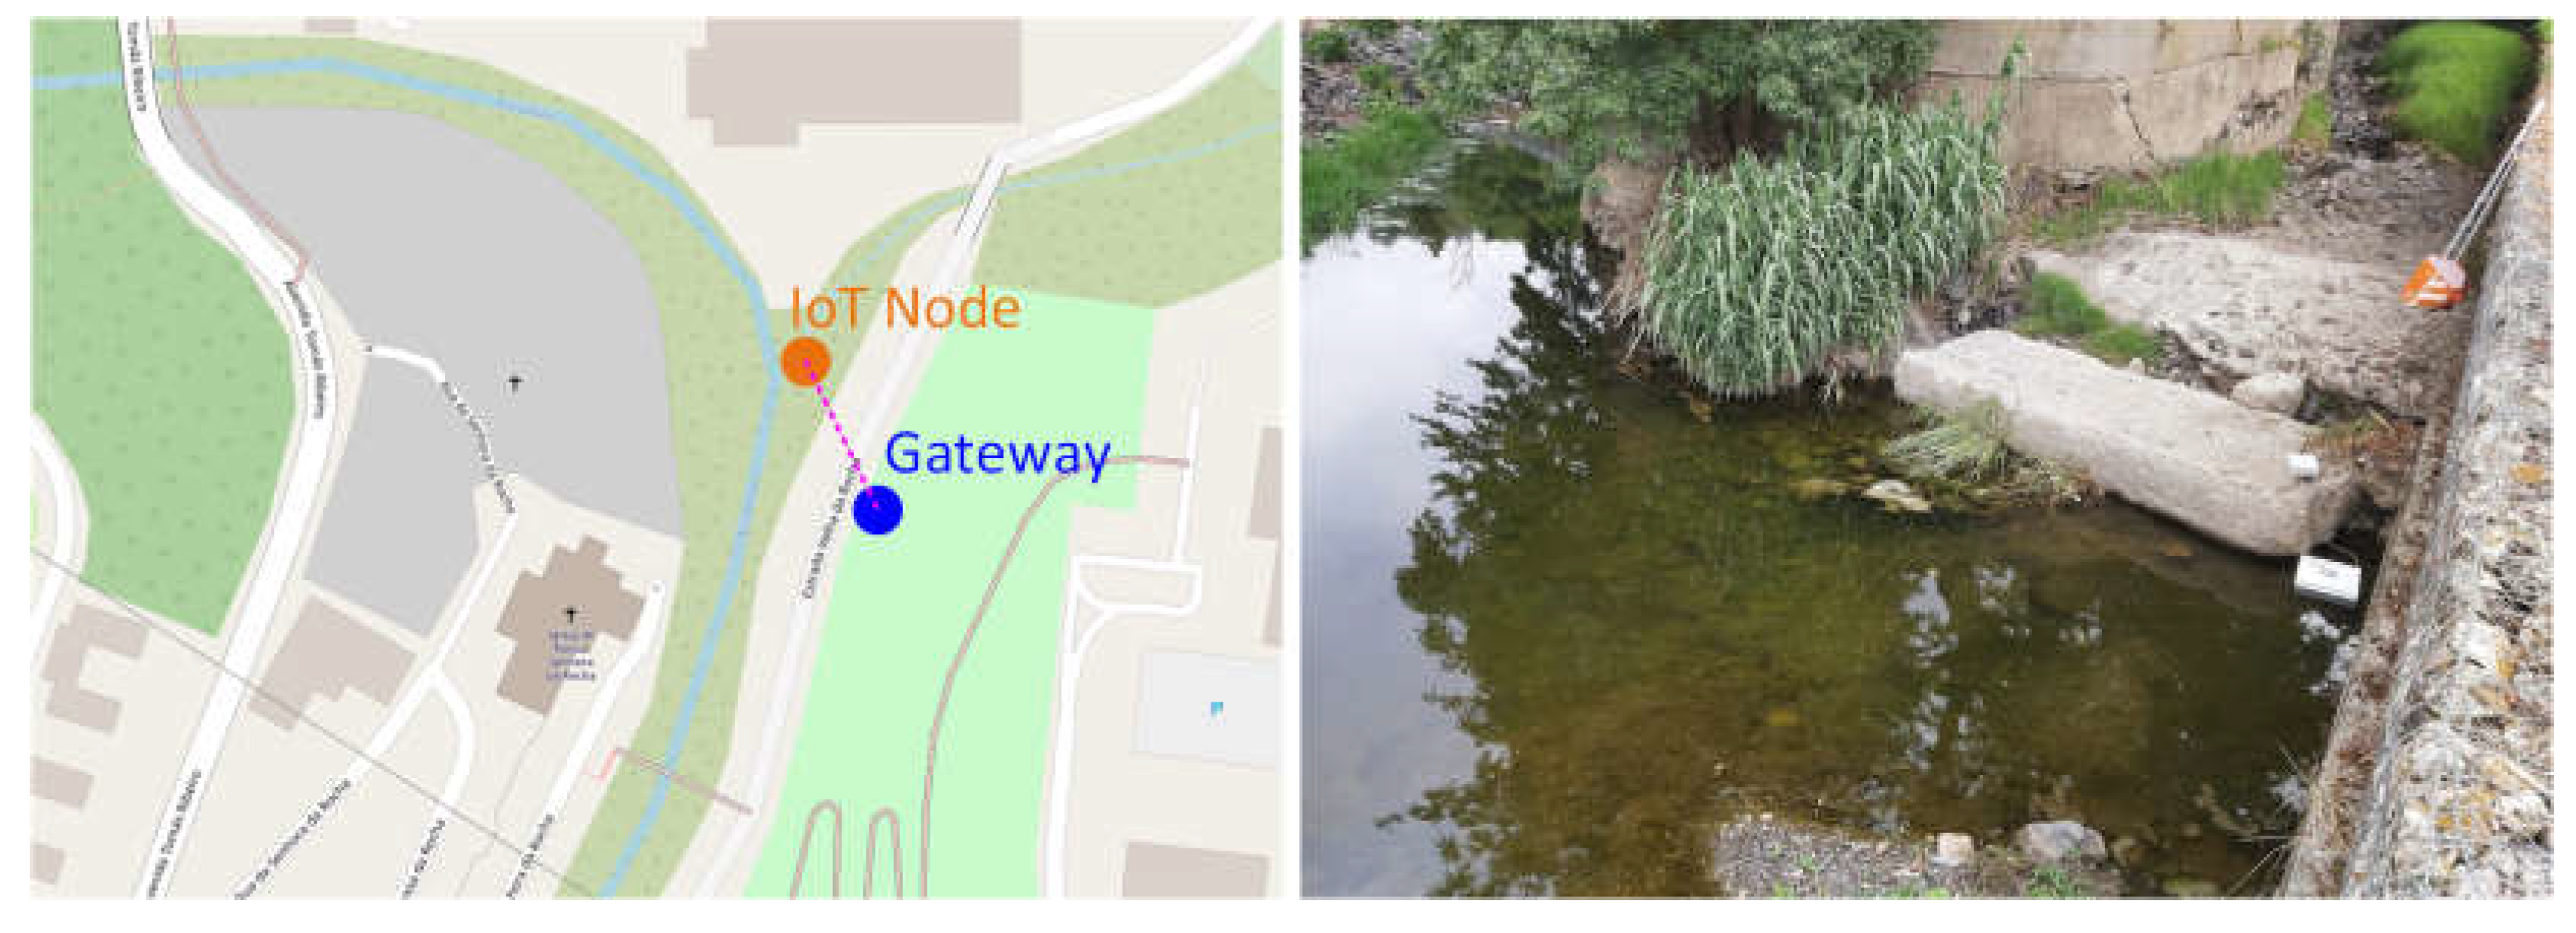
The real scenario testing site for this prototype was on the left bank of the Jamor River, in Carnaxide, Oeiras council, in the coordinates: [38.721951, -9.249049], see
Figure 29.
The IoT Node was installed near the water line, close to the sensors and the Gateway was installed near this location, on the nearby street, inside a car. Due to the topography of the location, there is a height difference between the two locations, which, although only 10 m away, influences the radio signal received in Gateway. The average Received Signal Strength Indication (RSSI) at Gateway reception was -94 dBm, with an Effective Isotropic Radiated Power (EIRP) of approximately 14 dBm at the IoT Node, and with an average Signal to Noise Ratio (SNR) of 7,33 dB.
These tests were on June 26, 2024, and occurred almost for 4 hours in the morning, in the period between 9:25 am and 1:21 pm. The data was sent every 30 seconds, recorded and then exported to Excel for processing and the analysis of results is presented below.
Figure 30 shows a graph with temperature variation, where a slight increase can be seen from 11:49, probably due to the influence of the sun. These values are normal for a location already close to the river mouth, as is this case.
In
Figure 31 the pH variation shows an average value of 7,7, except at the beginning, perhaps due to the sensor adaptation period. The pH is within normal values for water (6,5 – 8,5).
The average conductivity is 0,7 mS/cm and is below the maximum recommended value (2 mS/cm), the small variation is shown in
Figure 32.
The turbidity throughout the measurement time showed always values equal to zero NTU, as the water was transparent, as seen in
Figure 33.
For comparison, other water sources were measured, see
Table 2.
And we can conclude, based on these parameters, that the water quality of the Jamor River is reasonable, but shows a slight presence of contaminants, due to the conductivity value of 0,7 mS/cm and some alkalinity due to the pH of 7,7.
6. Conclusions and Future Work
The developed prototype offers a reliable and affordable option, providing river water parameters in real time, so that, if necessary, action can be taken to regularize the situation.
Other LPWAN networks were studied, but concluding that for use in this prototype, in a point-to-point connection, LoRa is the best option.
Using Node-RED, an application was developed that not only shows all information in real time but also records all data in daily files for future reference. Also using MQTT, this data can be published externally to this system, for example, in cloud applications.
Radio coverage tests were carried out in an NLOS scenario, in a suburban area, and the results obtained further reinforce the use of LoRa technology in IoT.
Emphasis was placed on reducing energy consumption, with a special focus on IoT Node and measurements of its consumption were carried out, to choose the best energy supply solution for this subsystem, with any LoRa modulation configuration, for future end use.
A river was also monitored for a few hours to prove the functionality of the prototype in a real scenario.
The main challenge is in terms of coverage, as riverbeds are normally located in valleys, obstructed and without line of sight to reception (Gateway).
Including this system in the LoRaWAN network would be a future improvement. And another improvement would be to exchange the sensors for ones prepared for continuous use and even add others to measure other parameters, such as dissolved oxygen levels or dissolved organic matter.
Author Contributions
Conceptualization, L.P. and J.G.; methodology, L.P. and J.G.; software, L.P. and J.G.; validation, L.P. and J.G.; formal analysis, L.P. and J.G.; investigation, L.P. and J.G.; resources, L.P. and J.G.; data curation, L.P. and J.G.; writing—original draft preparation, L.P. and J.G.; writing—review and editing, L.P. and J.G.; visualization, L.P. and J.G.; supervision, L.P. and J.G.; All authors have read and agreed to the published version of the manuscript.
Funding
Please add: This research received no external funding
Data Availability Statement
Data is contained within the article.
Conflicts of Interest
The authors declare no conflicts of interest.
References
- ORACLE, "What is IoT?," [Online]. Available: https://www.oracle.com/pt/internet-of-things/what-is-iot/. [Accessed 03 04 2024].
- L. Pires, "Redes de Sensores sem Fios: Aplicações para Supervisão e Monitorização de Infraestruturas," Manutenção, no. 135, pp. 66-68, 2017.
- ANACOM, "Utilização da Inernet das Coisas," Relatório Utilização da Inernet das Coisas, IoT, p. 7, 2023.
- K. A. Alnajjar, M. M. A. Fahmy, Y. M. Ali and S. Ansari, "Water Quality Monitoring System Based on the Internet of Things," IEEE 6th International Conference on Electrical, Electronics and System Engineering (ICEESE), pp. 32-37, 2023.
- V. Savel, P. Rakluea, T. Jangjing, B. Kumkhet, C. Mahatthanajatuphat and W. Thaiwirot, "IoT Based Water Quality Monitoring System Using Solar Powered and LoRaWAN," International Electrical Engineering Congress (iEECON), pp. 1-4, 2022.
- T. Cinterion, "NB-IoT Explained: What Is It, and How Does It Work?," 28 November 2022. [Online]. Available: https://www.telit.com/blog/nb-iot-new-cellular-standard-means-business/. [Accessed 11 04 2024].
- ROHDE & SCHWARZ, "Narrowband Internet of Things," 2016.
- Sigfox, "What is Sigfox 0G Technology," [Online]. Available: https://www.sigfox.com/what-is-sigfox/. [Accessed 11 04 2024].
- "What are LoRa and LoRaWAN?," Semtech, [Online]. Available: https://lora-developers.semtech.com/documentation/tech-papers-and-guides/lora-and-lorawan/. [Accessed 14 04 2024].
- "What is LoRaWAN® Specification," [Online]. Available: https://lora-alliance.org/about-lorawan/. [Accessed 14 04 2024].
- incibe, "The LoRaWAN protocol," 15 06 2023. [Online]. Available: https://www.incibe.es/en/incibe-cert/blog/lorawan-and-its-contribution-iiot. [Accessed 18 05 2024].
- M. Kais, B. Eddy, C. Frederic and M. Fernand, "A comparative study of LPWAN technologies for large-scale IoT," 2018.
- Z. Kamoona and M. Ilyas, "Investigating the Performance of LoRa Communication for Nominal LoRa and Interleaved Chirp Spreading LoRa," International Conference on Artificial Intelligence of Things (ICAIoT), 2022.
- SEMTECH, "LoRa Modulation Basics," AN1200.22, 2015.
- SEMTECH, "Designer’s Guide," AN1200.13, 2013.
- L. Allience, "LoRaWAN™ 1.1 Regional Parameters," p. 8, 2017.
- Arduino, "Arduino Mega ADK Rev3," Arduino, [Online]. Available: https://docs.arduino.cc/retired/boards/arduino-mega-adk-rev3/. [Accessed 12 03 2024].
- Foundation, "Node-RED," OpenJS Foundation, [Online]. Available: https://nodered.org/. [Accessed 12 03 2024].
- "Raspberry Pi 3 Model B+," Raspberry Pi, [Online]. Available: https://www.raspberrypi.com/products/raspberry-pi-3-model-b-plus/. [Accessed 10 June 2024].
- DFRobot, "Waterproof DS18B20 Digital Temperature Sensor for Arduino," DFRobot, [Online]. Available: https://www.dfrobot.com/product-689.html. [Accessed 12 03 2024].
- M. Dallas, "DS18B20," Analog Devices, [Online]. Available: https://www.analog.com/en/products/ds18b20.html. [Accessed 12 03 2024].
- A. D. Maxim, "Overview of 1-Wire Technology and Its Use," [Online]. Available: https://www.analog.com/en/resources/technical-articles/guide-to-1wire-communication.html. [Accessed 12 03 2024].
- Semtech, "SX1276/77/78/79 Datasheet," Semtech, 2020.
- DFRobot, "Gravity: Analog pH Sensor/Meter Kit V2," DFRobot, [Online]. Available: https://www.dfrobot.com/product-1782.html. [Accessed 12 03 2024].
- DFRobot, "Gravity: Analog Electrical Conductivity Sensor," DFRobot, [Online]. Available: https://www.dfrobot.com/product-1123.html. [Accessed 12 03 2024].
- S. Studio, "Grove - Turbidity Sensor (Meter) V1.0," Seed Studio, [Online]. Available: https://www.seeedstudio.com/Grove-Turbidity-Sensor-p-4399.html. [Accessed 12 03 2024].
- "TXB0108 8-Bit Bidirectional Voltage-Level Shifter," Texas Instruments, [Online]. Available: https://www.ti.com/product/TXB0108. [Accessed 10 06 2024].
- P. S. Foundation, "Python," Python Software Foundation, [Online]. Available: https://www.python.org/. [Accessed 12 03 2024].
- O. E. Foundation, "Eclipse Mosquitto - An open source MQTT broker," Eclipse Foundation, [Online]. Available: https://mosquitto.org/. [Accessed 12 03 2024].
- " Eclipse Paho MQTT Python client library," Eclipse, [Online]. Available: https://eclipse.dev/paho/index.php?page=clients/python/index.php. [Accessed 22 03 2024].
Figure 1.
NB-IoT Operations modes (from [7]).
Figure 1.
NB-IoT Operations modes (from [7]).
Figure 2.
Sigfox network architecture (from [8]).
Figure 2.
Sigfox network architecture (from [8]).
Figure 3.
LoRaWAN network architecture (from [11]).
Figure 3.
LoRaWAN network architecture (from [11]).
Figure 4.
LPWAN networks parameters compromise (from [12]).
Figure 4.
LPWAN networks parameters compromise (from [12]).
Figure 5.
Up-chirp signals, with SF = 7 (adapted from [13]).
Figure 5.
Up-chirp signals, with SF = 7 (adapted from [13]).
Figure 6.
Bitrate and SF relationship (CR = 1).
Figure 6.
Bitrate and SF relationship (CR = 1).
Figure 7.
LoRa packet format, (from [15]).
Figure 7.
LoRa packet format, (from [15]).
Figure 8.
Packet duration and SF relationship (CR = 1, BW = 125 kHz).
Figure 8.
Packet duration and SF relationship (CR = 1, BW = 125 kHz).
Figure 9.
Packet duration and BW relationship (CR = 1, SF = 7).
Figure 9.
Packet duration and BW relationship (CR = 1, SF = 7).
Figure 10.
System block diagram.
Figure 10.
System block diagram.
Figure 11.
DFRobot DFR0198 parameters (adapted from [23]).
Figure 11.
DFRobot DFR0198 parameters (adapted from [23]).
Figure 12.
DFRobot SEN0161-V2 parameters (adapted from [24]).
Figure 12.
DFRobot SEN0161-V2 parameters (adapted from [24]).
Figure 13.
DFRobot DFR0300 parameters (adapted from [25]).
Figure 13.
DFRobot DFR0300 parameters (adapted from [25]).
Figure 14.
Seed Studio 101020752 parameters (adapted from [26]).
Figure 14.
Seed Studio 101020752 parameters (adapted from [26]).
Figure 15.
SX1276 module characteristics (adapted from [23]).
Figure 15.
SX1276 module characteristics (adapted from [23]).
Figure 16.
Electrical schematic of IoT Node.
Figure 16.
Electrical schematic of IoT Node.
Figure 18.
IoT Node prototype.
Figure 18.
IoT Node prototype.
Figure 19.
IoT Node program flowchart.
Figure 19.
IoT Node program flowchart.
Figure 20.
Electrical Schematic of Gateway.
Figure 20.
Electrical Schematic of Gateway.
Figure 22.
Gateway prototype.
Figure 22.
Gateway prototype.
Figure 23.
Gateway program flowchart.
Figure 23.
Gateway program flowchart.
Figure 24.
Gateway MQTT architecture.
Figure 24.
Gateway MQTT architecture.
Figure 25.
Dashboard, real time data.
Figure 25.
Dashboard, real time data.
Figure 26.
Dashboard, historical data.
Figure 26.
Dashboard, historical data.
Figure 27.
IoT Node, power measurements.
Figure 27.
IoT Node, power measurements.
Figure 28.
LoRa radio coverage test.
Figure 28.
LoRa radio coverage test.
Figure 29.
River Jamor, test location [openstreetmap].
Figure 29.
River Jamor, test location [openstreetmap].
Table 1.
LPWAN networks parameters (adapted from [12]).
Table 1.
LPWAN networks parameters (adapted from [12]).
| |
Sigfox |
LoRaWAN |
NB-IoT |
| Modulation |
BPSK |
CSS |
QPSK |
| Freq. Band |
ISM |
ISM |
LTE |
| BW |
100 Hz |
125/250 kHz |
180 kHz |
| Bidirectional |
Limited
Half-duplex |
Yes
Half-duplex |
Yes
Half-duplex |
Messages/day
(max) |
140 (UL)
4 (DL) |
Limited
(duty-cycle) |
Unlimited |
Messages size
(max) |
12 Byte (UL)
8 Byte (DL) |
243 Byte |
1600 Byte |
Throughput
(max) |
100 bit/s |
50 kbit/s |
160 kbit/s (UL)
120 kbit/s (DL) |
| Range |
10 km (urban)
40 km (rural) |
5 km (urban)
20 km (rural) |
1 km (urban)
10 km (rural) |
| Interference immunity |
High |
High |
Low |
| Encryption |
No |
Yes (AES 128 bits) |
Yes (LTE) |
| Private networks |
No |
Yes |
No |
| Standard |
Sigfox |
LoRa Alliance |
3GPP |
Table 2.
Comparison with other water sources.
Table 2.
Comparison with other water sources.
| Water |
Temp. |
pH |
Conductivity |
Turbidity |
| River Jamor |
21 |
7,7 |
0,7 |
0 |
| Pub. Water supply (Cascais) |
n.a. |
6,8 |
0,12 |
0 |
| Bottled Luso water |
n.a. |
6 |
0 |
0 |
|
Disclaimer/Publisher’s Note: The statements, opinions and data contained in all publications are solely those of the individual author(s) and contributor(s) and not of MDPI and/or the editor(s). MDPI and/or the editor(s) disclaim responsibility for any injury to people or property resulting from any ideas, methods, instructions or products referred to in the content. |
© 2024 by the authors. Licensee MDPI, Basel, Switzerland. This article is an open access article distributed under the terms and conditions of the Creative Commons Attribution (CC BY) license (http://creativecommons.org/licenses/by/4.0/).


