1. Introduction
Photoacoustic spectroscopy [
1] (PAS) and reversed double-beam photoacoustic spectroscopy [
2] (RDB-PAS) are two powerful techniques used in spectroscopic analysis to investigate the properties of materials. Photoacoustic spectroscopy (PAS) operates by inducing the absorption of modulated light energy by a sample. When the light is absorbed, it generates localized heating within the sample, leading to thermal expansion and the emission of acoustic waves [
3]. The intensity of these acoustic waves is directly proportional to the concentration of the absorbing species within the sample, under the simplest assumption. By measuring the intensity of the generated acoustic waves, PAS provides quantitative information about the concentration of the target species, enabling precise analysis of samples in various applications [
4].
In contrast, RDB-PAS is a variation of newly developed double-beam spectroscopy where the reference beam is intensity-modulated. This technique offers advantages such as improved signal-to-noise ratio and enhanced sensitivity compared to conventional methods. By modulating the reference beam, RDB-PAS discriminates against common sources of noise and is particularly useful for studying weak signals and low concentrations in complex samples.
In materials science, PAS and RDB-PAS are employed for analysing thin films, nanomaterials, polymers, and semiconductors. It is important to emphasize that PAS and RDB-PAS are techniques to measure the photoabsorption induced acoustic waves and not the intensity reduced by photoabsorption of the sample.
Cellulose, a polysaccharide composed of carbon, hydrogen, and oxygen, exhibits distinct light-absorbing properties influenced by its chemical structure, bonding configuration, and crystallinity [
5]. Cellulose is characterized by both crystalline and amorphous domains, each contributing differently to its spectroscopic behaviour [
6]. Cellulose exhibits inherent or induced electron traps or defects, which influence its behaviour under various conditions.
The light-absorbing capacity of cellulose is dependent on its molecular structure and influenced by charge densities [
7,
8], electrostatic interactions and surface interactions, characterized by dispersive and polar forces [
9,
10]. Carbon-carbon single bonds within the cellulose backbone predominantly absorb ultraviolet (UV) radiation with wavelengths shorter than 200 nm. Additionally, carbon-oxygen bonds, such as those found in hydroxyl groups (-OH), contribute to absorption in the UV [
11] and visible regions. Cellulose's crystalline regions, characterized by well-ordered hydrogen bonding networks, exhibit specific absorption bands due to their electronic structure [
12], whereas amorphous regions display broader absorption features.
Oxygen's light absorption in cellulose is influenced by its bonding configuration. Oxygen-oxygen single bonds in cellulose generally do not absorb light in the visible or UV range but may contribute to absorption in the infrared region due to vibrational modes. Oxygen-containing functional groups, such as hydroxyl (OH) groups, contribute to absorption in the UV and visible regions [
13].
Hydrogen's light absorption properties in cellulose are primarily determined by its chemical environment [
14]. Hydrogen atoms within cellulose, particularly those involved in hydrogen bonding interactions, can contribute to absorption in the UV and visible regions.
Cellulose, being fundamentally an insulator, requires high-energy photons for electronic transitions to occur. In our earlier study [
15], electromagnetic excitation processes revealed electronic vibration bands (phonons) and excitons, suggesting photonic or vibrational behaviors more complex than simple dielectric behavior. These phenomena could be related to localized electronic states, defects, or interactions with molecular vibrations, but they do not imply the presence of free electron movement within the cellulose molecule.
Understanding the light-absorbing properties of cellulose in various chemical contexts is essential for interpreting photoacoustic spectroscopic data and designing materials with tailored optical characteristics, hence the aim of this study is to open new insight into different cellulose fibres surface interaction with electromagnetic radiations. Moreover, conducting photoacoustic spectroscopy investigations on cellulose fibers may provide valuable insights into the molecular structure and treatment dynamics of this abundant biopolymer, bridging a gap in our current understanding and offering applications across fields such as materials science, biotechnology, and environmental science.
2. Materials and Methods
2.1. Materials
Whatman filter paper (WFP) was sourced, crafted from cotton linters, through GE Healthcare. Additionally, softwood (SW; pine) and hardwood pulp (HW; birch) were included in the test.
2.2. Methods
2.2.1. Chemical Treatment
The WFP samples underwent a chemical hydrolysis treatment using HCl. This procedure involved the use of HCl vapor within a sealed desiccator that housed a petri dish filled with HCl solution. To replace the internal air of the desiccator completely with an HCl atmosphere, the valve of the desiccator was left open for 48 hours. After this period, filter paper was placed inside the desiccator for hydrolysis durations of 2, 4, 6, and 8 hours. Post-hydrolysis, the filter paper was thoroughly washed in water for 24 hours to eliminate any residual HCl. The filter paper was subsequently dried at 60°C in a drying oven.
2.2.2. Mechanical Treatment
The SW and HW samples underwent mechanical processing using an Ab Lorentzen & Wettre laboratory valley beater, with the duration of beating varied among the samples. The number at the end of each sample specifies the duration of the beating in minutes.
2.2.3. Photoacoustic Spectroscopy
PAS (Photoacoustic Spectroscopy) is effective in analyzing the structural and chemical modifications in cellulose fibers by detecting the absorption of light and the resulting thermal waves, providing insights into the molecular composition and changes within the material.
A custom-built photoacoustic (PA) cell was utilized, featuring an aluminum body with an internal volume of approximately 0.5 cm³, a micro-electromechanical system (MEMS) microphone module (SparkFun MEMS Microphone Breakout, INMP401 (ADMP401)), and a quartz-glass window that allowed transparency across the 250-1000 nm measurement range. The cell was temperature-stabilized at 298.0 K using a block heating-cooling bath to minimize temperature fluctuations during measurements. A cellulose pulp sample was placed inside the cell, and PA spectra were recorded at room temperature under a nitrogen atmosphere. Monochromatic light (~0.2 mW/cm²) was provided by a monochromator (Bunkokeiki). The PAS signal detected by the MEMS microphone module within the cell was amplified and analyzed using a digital lock-in amplifier (NF LI5640). To account for variations in light intensity across different wavelengths, the PAS signal was normalized using carbon black (graphite) powder as a reference.
2.2.4. Reversed Double-Beam Photoacoustic Spectroscopy Measurement
RDB-PAS (Reversed Double-Beam Photoacoustic Spectroscopy) enhances the sensitivity and specificity of structural and chemical analysis by using a reversed double-beam setup, allowing for the differentiation of subtle changes in the absorption characteristics of treated cellulose fibers. The RDB-PAS measurement technique was adapted from a previous methodology with certain specific alterations [
15]. In these measurements, the focus was on the detection of acoustic waves generated by the absorption of photons. We employed a custom-built photoacoustic (PA) cell (used in PA measurement), which was outfitted with a MEMS microphone module and a quartz-glass window allowing transparency from 250 to 1000 nm, to reduce external environmental impacts. The RDB-PAS analyses utilized monochromatic light scanning from 600 to 250 nm and a modulated near-infrared (940 nm) LED at 35 Hz. The RDB-PAS signals, indicative of the total density of trapped electrons, were captured directly without any signal normalization. The ambient conditions for these measurements consisted of static, methanol-saturated nitrogen. Before the RDB-PAS measurements commenced, the cell was flushed with nitrogen gas infused with methanol vapor for 10 minutes at a flow rate of 30 ml/min.
The experimental setup for RDB-PAS involved the alternating use of modulated and continuous light beams. This arrangement allowed the continuous light to excite electrons into electron traps (ETs), while the modulated light simultaneously monitored the photoabsorption by these electron-filled traps, thus documenting the spectrum of photoinduced trap-filling. The cell was preconditioned with methanol-saturated nitrogen gas, which served to irreversibly immobilize positive holes, thereby preventing the annihilation of electrons once trapped, through their reactions with these positive holes.
2.2.5. Signal Processing
The photoacoustic spectra were deconvoluted by using PeakLab software and the discrete wavelet transformation were performed using IgorPro software (WaveMetrics).
2.2.6. Coifman Wavelets Analysis
Coifman wavelet analysis (named after Ronald R. Coifman) provide a multiresolution analysis to decompose photoacoustic signal into different frequency components at various resolutions [
16]. Coiflet wavelets were generated algorithmically due to its complex nature and selected 2 vanishing moments to detect polynomial trends in the photoacoustic signal. It means that the wavelet is orthogonal to constant (degree 0, wavelet has mean of zero) and linear (degree 1, wavelet is orthogonal to linear trends in the photoacoustic signal) functions, ignoring these trends and enhance higher order features [
17]. Discrete wavelet transformation (DWT) helped identifying and separating specific surface chemistry features from the photoacoustic signals of cellulose fibres with varying spatial frequencies. Coifman DWT effectively denoised the photoacoustic signal, while preserved the structural features of cellulose for accurate interpretation and analysis. The localization of absorbers or sources of the photoacoustic signal within cellulose fibres is essential to understand the structural properties.
3. Results
3.1. Chemical Treatment
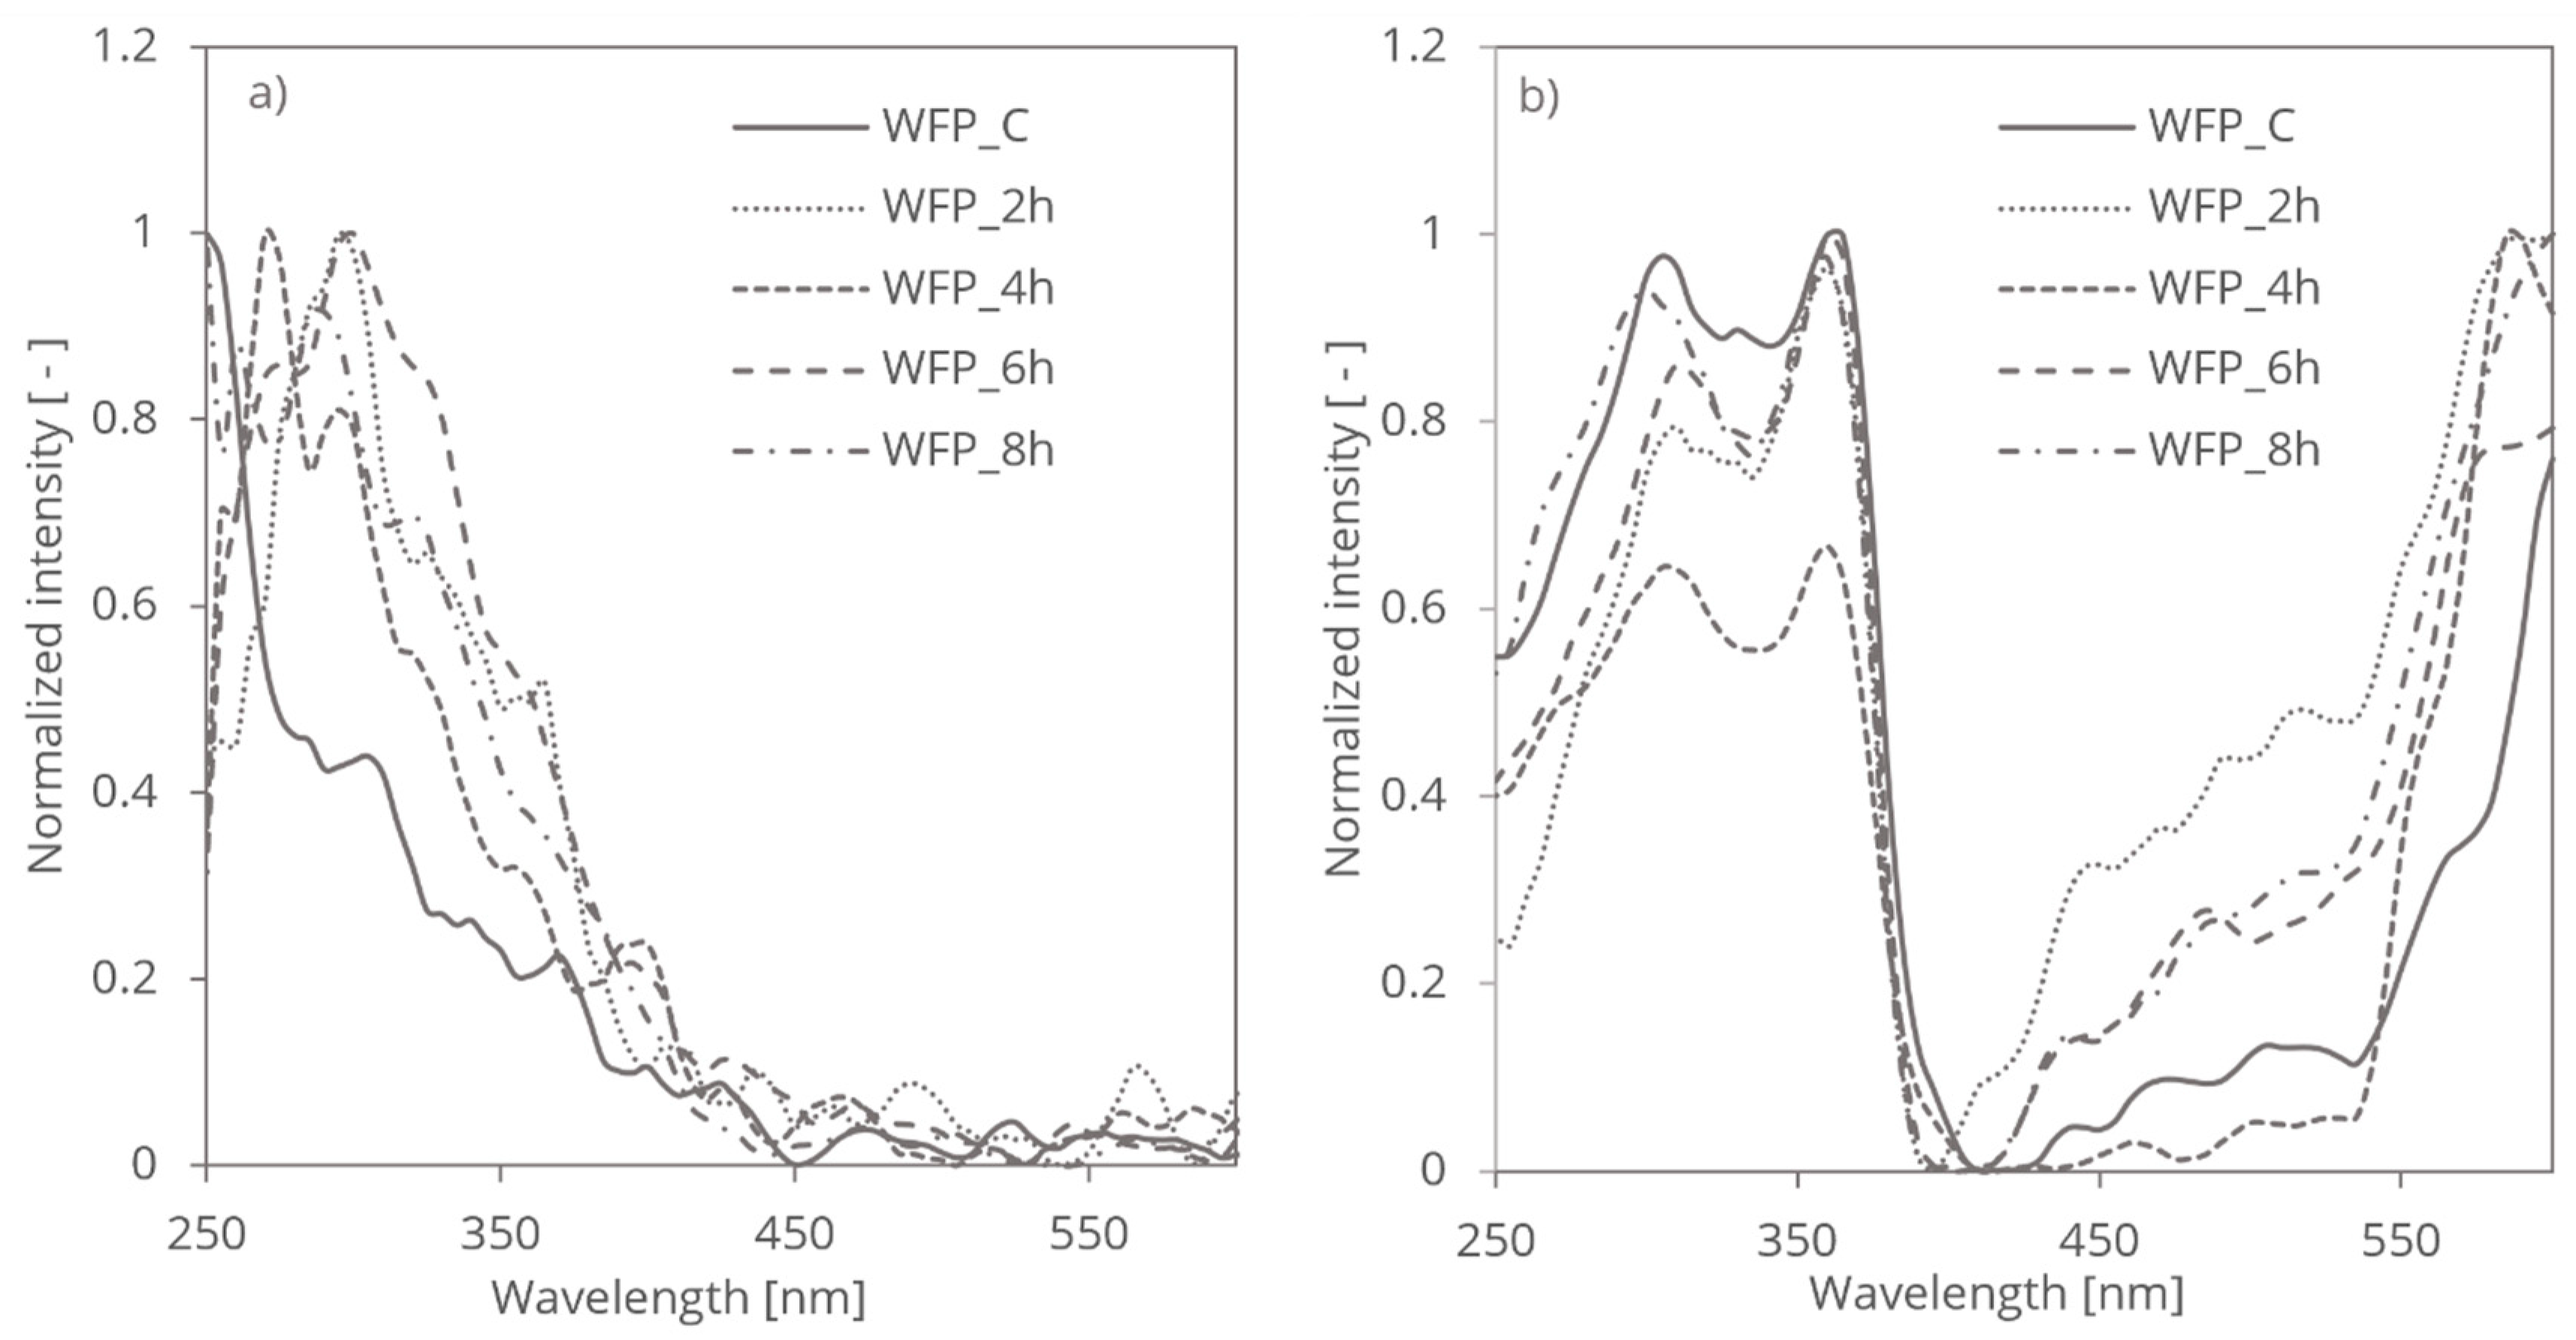
The treatment of WFP cellulose with HCl vapor introduces chemical modifications that were significantly influence its light-absorbing properties and altered its spectroscopic behaviour and optical characteristics (
Figure 1).
This chemical modification is consistent with findings from studies on various types of treated cellulose fibres such as textile [
18], or dialdehyde cellulose nanofibrils (DACNFs) derived from cotton and wood fibres, where periodate oxidation was shown to disrupt crystalline regions and alter optical properties [
19]. Similarly, UV-visible diffuse reflectance spectroscopy has been employed to analyze lignocellulosic materials, revealing how chemical treatments, like HCl vapor, can modify UV absorption bands, particularly in regions associated with residual lignin and other impurities [
20].
HCl vapor treatment chemically modifies cellulose by selectively hydrolysing glycosidic linkages, cleaving cellulose chains in the disordered regions, and introducing functional groups such as hydroxyl (OH) and carboxyl (COOH) groups onto the cellulose backbone. Such functionalization is known to enhance or diminish the light-absorbing properties depending on the specific treatment and the type of cellulose involved, as seen in mechanically treated and UV-treated regenerated cellulose fibers, where changes in surface energy and fiber-matrix adhesion significantly impact optical behaviour [
21].
Figure 1 illustrates the distinct results obtained from photoacoustic spectroscopy (PAS) and reversed double-beam photoacoustic spectroscopy (RDB-PAS) for the same cellulose samples. The significant differences in the spectra arise from the unique aspects each technique measures.
Photoacoustic spectroscopy (PAS) primarily detects the absorption-induced acoustic signals, which reflect changes in the sample’s electronic and vibrational transitions. In the case of cellulose fibers, PAS spectra are sensitive to variations in the disordered regions and overall molecular interactions, capturing shifts and broadening of absorption bands that correlate with structural changes such as reductions in disordered regions, increases in crystallinity, and modifications in molecular weight and degree of polymerization.
A similar pattern in PAS spectra can be found in the literature for microcrystalline cellulose, hemicelluloses and lignin [
22].
The spectral shifts are similar to those observed in UV spectroscopy studies of cellulose, where chemical treatments lead to broadened absorption bands in the UV range, particularly between 250-400 nm, corresponding to changes in molecular structure [
23,
24].
Conversely, reversed double-beam photoacoustic spectroscopy (RDB-PAS) employs a different approach by utilizing two beams of light to enhance sensitivity and minimize noise. This technique measures the relative changes in signal intensity, providing insights into the material’s structural modifications, such as changes in the crystallinity and the impact of the treatment on the cellulose fibers. Studies on mechanically treated cellulose also demonstrate how techniques like RDB-PAS can be used to assess changes in surface area and light scattering properties, especially in fibers with increased surface roughness due to mechanical grinding [
21]. The RDB-PAS spectra, therefore, focus on detecting intensity variations rather than peak shifts or broadening, which explains the discrepancies observed between
Figure 1a,b.
The divergence in spectra between PAS and RDB-PAS highlights the complementary nature of these techniques. PAS offers detailed information on electronic and vibrational changes, while RDB-PAS emphasizes relative intensity changes, allowing for a comprehensive understanding of the cellulose fiber modifications.
This complementary analysis is also reflected in studies that compare PAS and RDB-PAS for cellulose materials subjected to different treatments, underscoring how both techniques provide critical insights into the effects of chemical and mechanical modifications on optical properties [
25].
The introduction of functional groups did not introduce any surface charges and disruptions in cellulose structure caused by HCl vapor treatment, however, significantly impact its light-absorbing properties. In
Figure 1a, the normalized photoacoustic spectroscopy (PAS) spectra exhibit shifts in the main peaks towards higher UV wavelengths over different treatment times. Specifically, the spectra corresponding to 2, 4, 6, and 8 hours of HCl vapor treatment show varying degrees of peak shifts and broadening. These changes reflect similar phenomena observed in studies where chemical treatments induced crystallization and reduced disordered regions, thereby affecting the UV absorption spectra [
26]. Initially, as the treatment progresses from 2 to 4 hours, there is an observable shift and broadening of the absorption bands, indicating changes in the electronic and vibrational transitions within the disordered regions of cellulose. This trend becomes more pronounced at 6 hours, where the crystallization process becomes more significant, leading to further shifts and broadenings. By 8 hours, the spectra stabilize, showing less pronounced changes in peak positions but continuing to reflect the evolved structural state of the cellulose.
In contrast, the RDB-PAS measurements shown in
Figure 1b) maintain the peak positions consistent with those observed in PAS, but with variations primarily in intensity. The highest normalized intensity difference is observed in the sample treated for 4 hours, which indicates significant changes in the material's structure at this stage. While HCl vapor treatment drives crystallization, it does not alter the overall crystal structure of cellulose. Instead, it halts the hydrolysis of glycosidic linkages in crystalline regions. This is consistent with findings that show how the mechanical and chemical treatments can stabilize or enhance the crystallinity in cellulose fibers, resulting in consistent spectral peaks despite variations in intensity [
20].
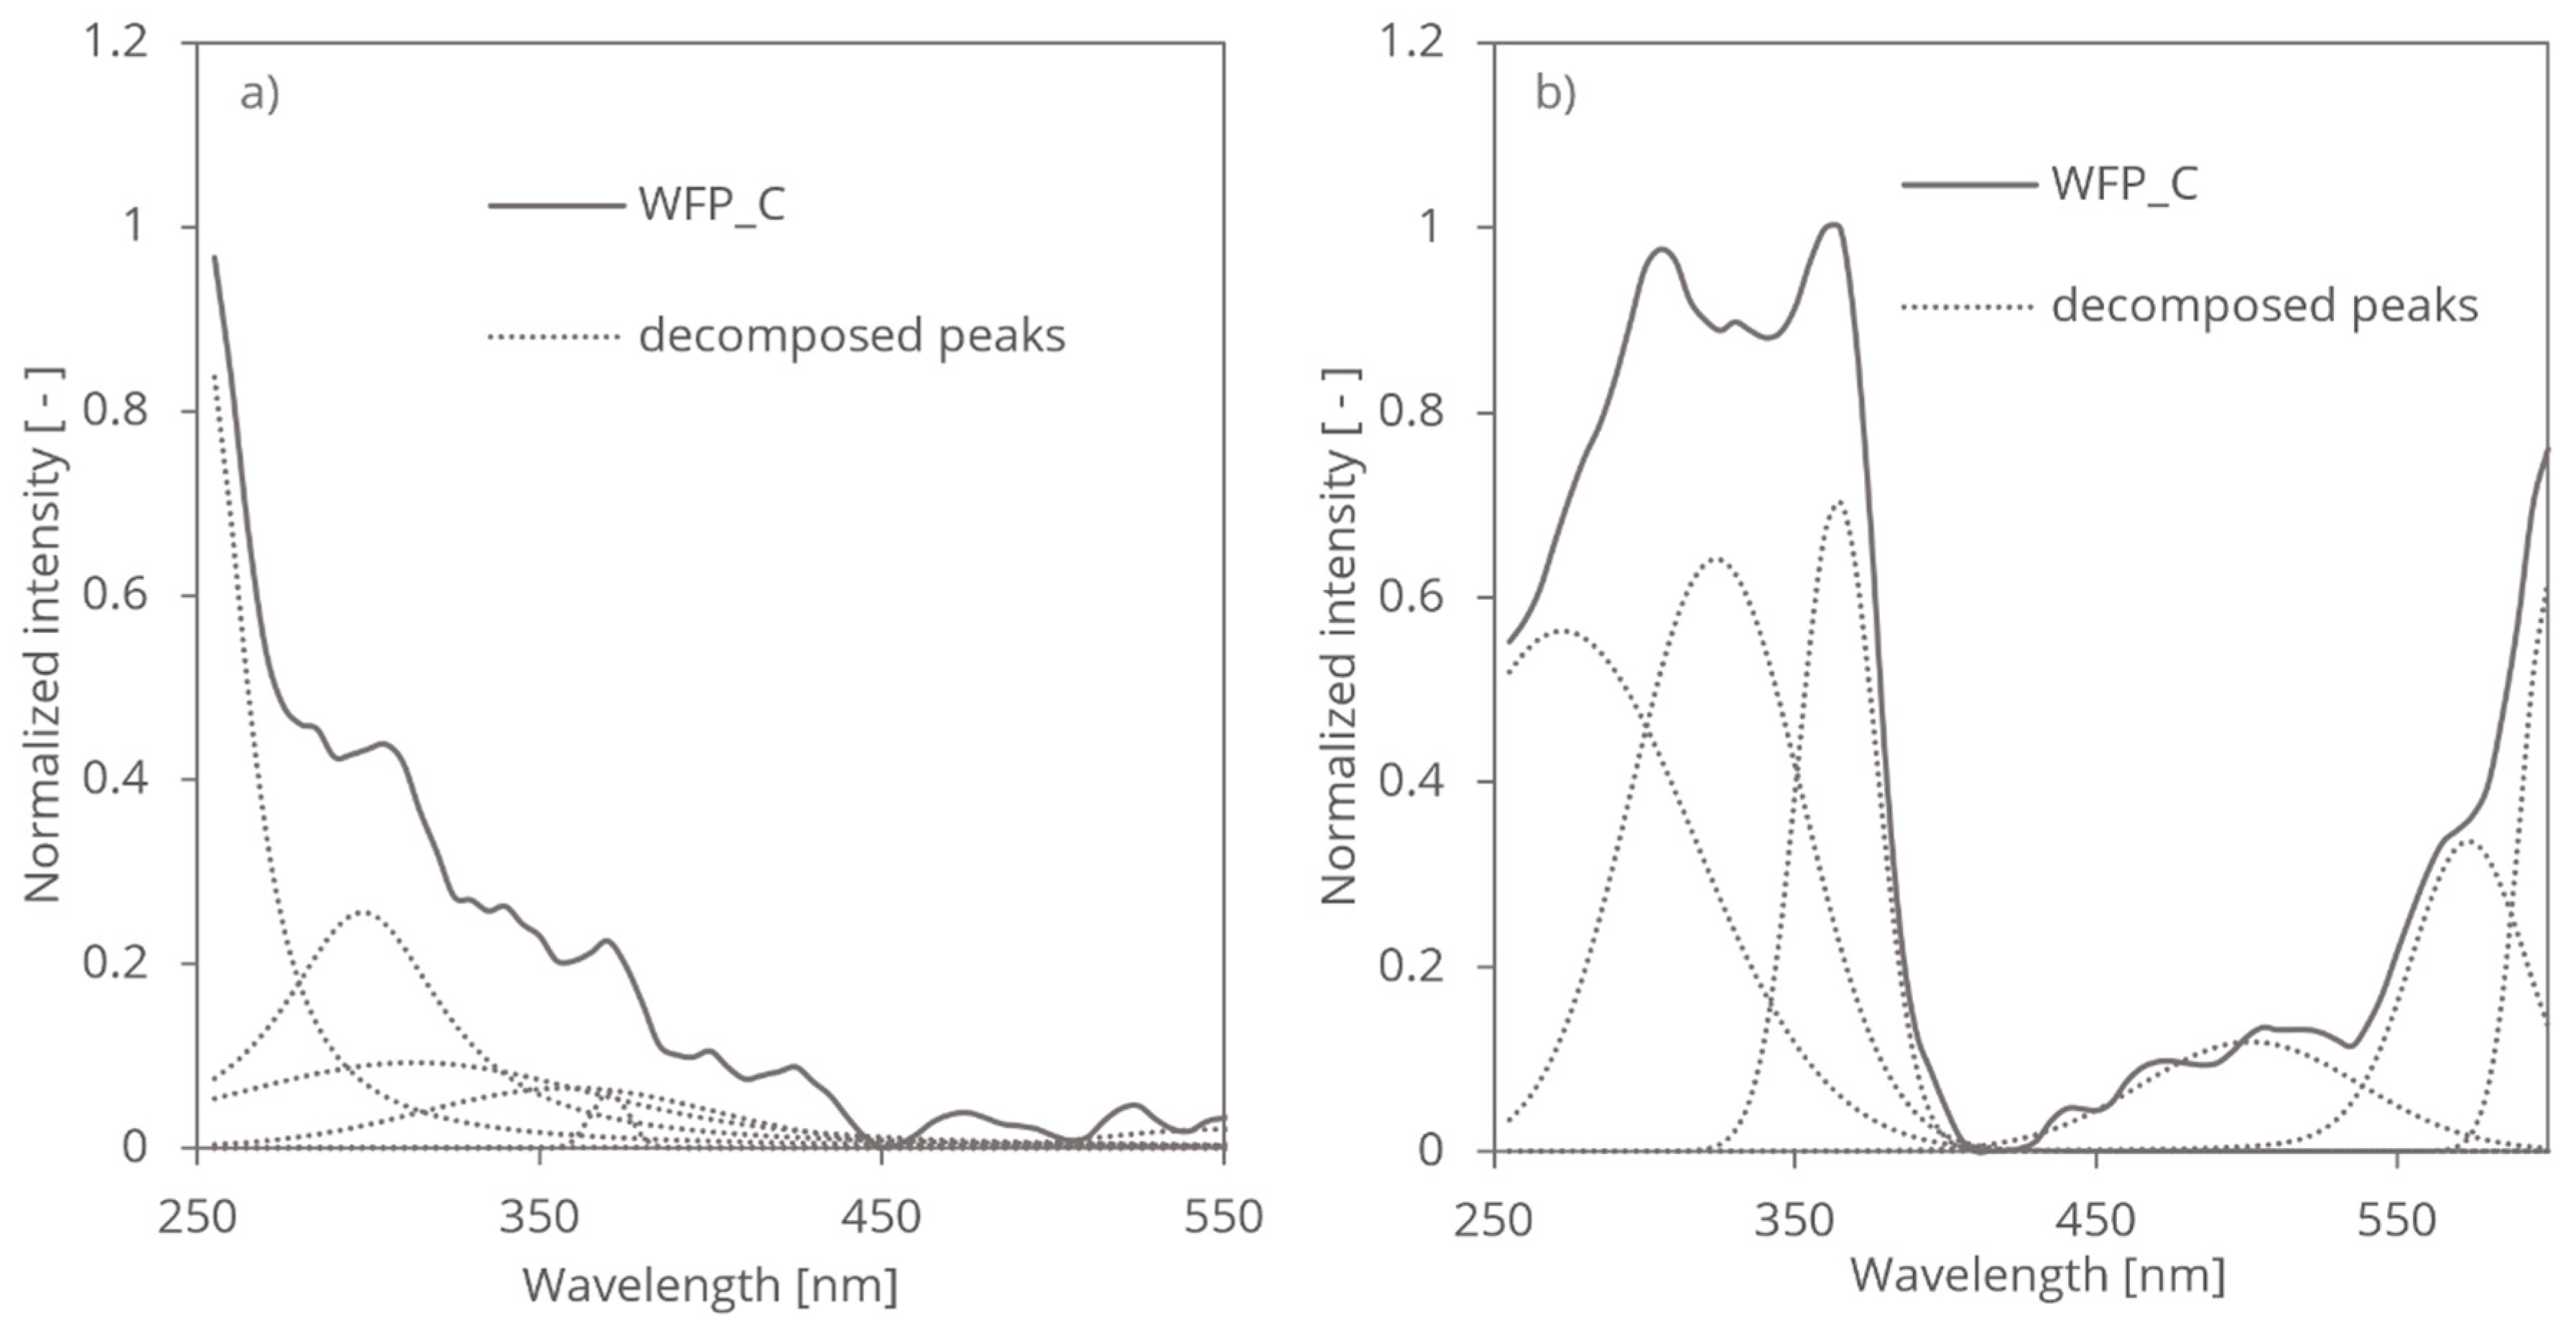
Consequently, PAS spectra reveal shifts or broadening of absorption bands associated with changes in the electronic and vibrational states in disordered regions of cellulose, whereas RDB-PAS spectra highlight intensity variations within the same UV range (
Figure 2), reflecting the altered structural and compositional aspects of the treated samples.
Furthermore, the introduction of hydroxyl and carboxyl groups onto the cellulose backbone alters its chemical reactivity and interaction with incident light. Additionally, alterations in surface chemistry and morphology induced by HCl vapor treatment can influence the refractive index and light scattering properties of cellulose materials [
27].
This is evident in other studies, where treatments led to changes in UV-visible spectra due to the introduction of such functional groups and their impact on the material's optical properties [
25].
3.2. Mechanical Treatment
The mechanical treatment of SW and HW cellulose fibres plays a crucial role in altering its light-absorbing properties, influencing its spectroscopic behaviour and optical characteristics. Mechanical treatments, such as grinding, have been shown to significantly modify the structural and optical properties of cellulose fibers, as highlighted in studies involving mechanical fibrillation and UV treatments [
21]. Cellulose, a biopolymer composed of carbon, hydrogen, and oxygen, exhibits a complex molecular structure consisting of both crystalline and amorphous domains. These structural features contribute differently to the light absorption of cellulose. The mechanical impact is assessed through PAS and RDB-PAS techniques, each providing distinct insights.
Mechanical treatment, such as grinding, induces physical changes in cellulose structure, resulting in modifications to its crystallinity, particle size, and surface morphology. Specifically, mechanical forces applied during treatment can disrupt hydrogen bonding interactions and break down cellulose aggregates, leading to the fragmentation of cellulose fibres and the generation of smaller particles with increased surface area. These effects are particularly evident in studies that demonstrate how mechanical grinding enhances fibrillation and alters the UV absorption characteristics of cellulose fibers, especially in terms of surface roughness and light scattering properties [
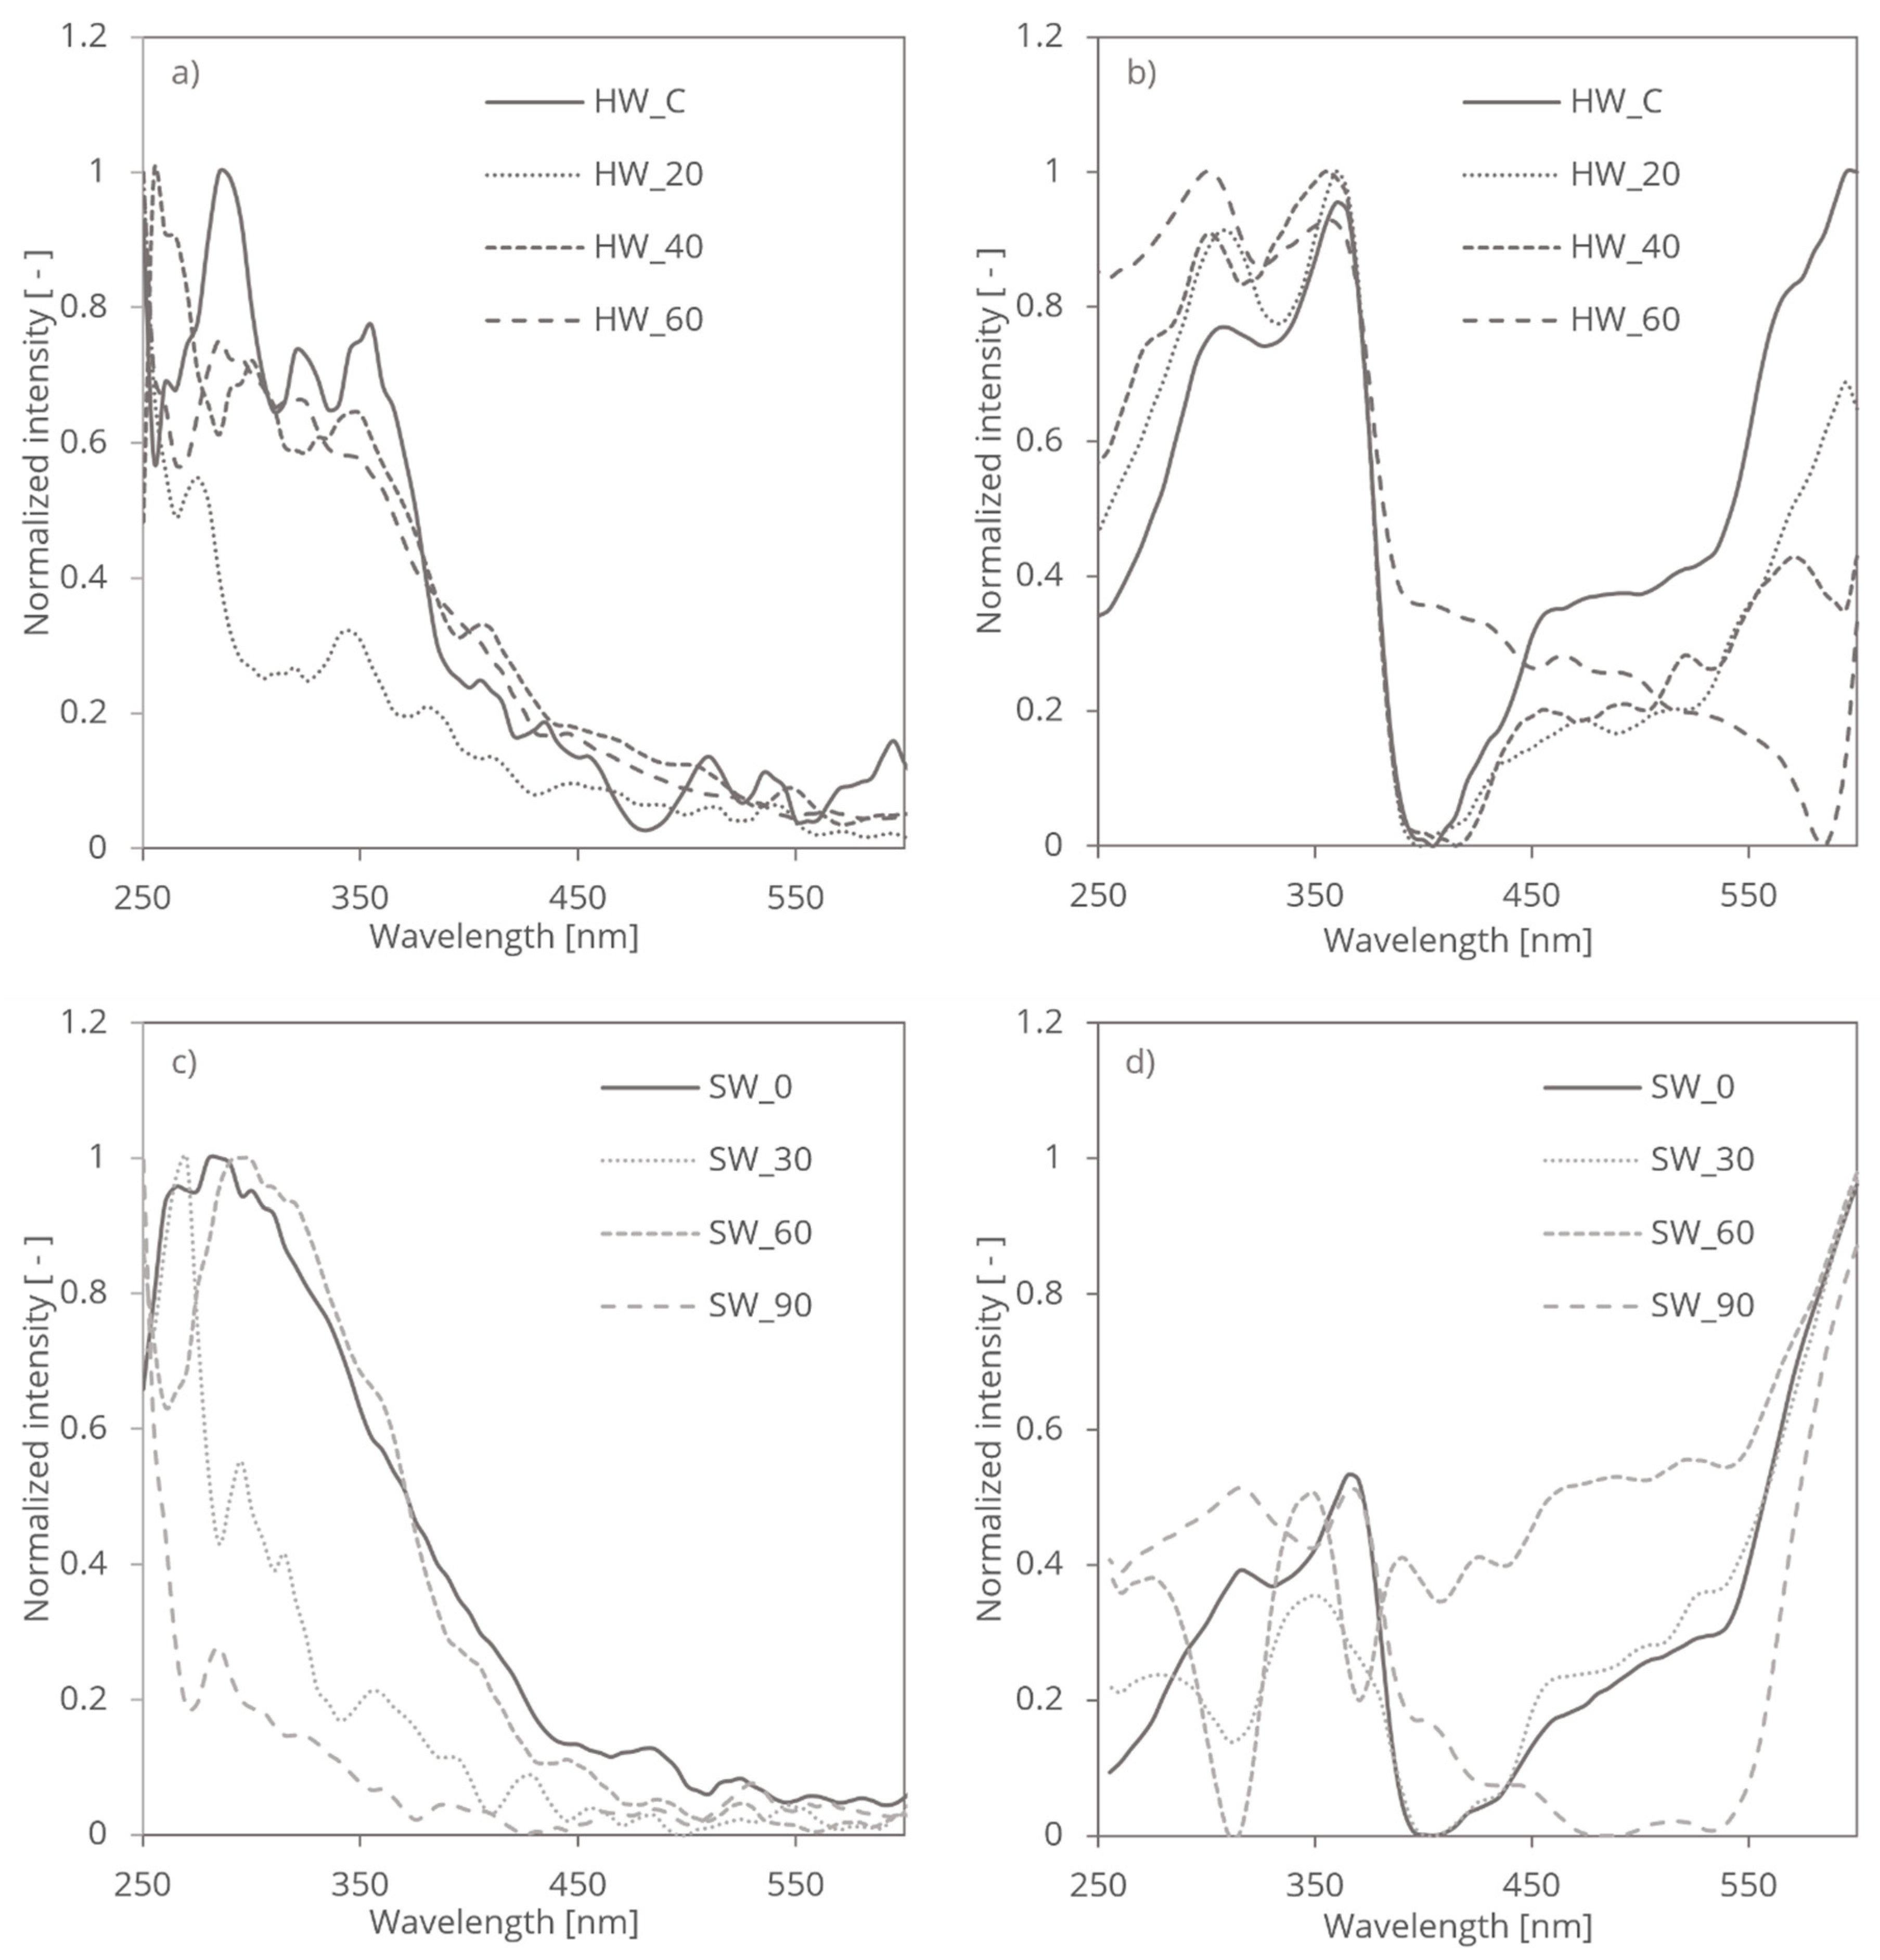
26]. The mechanical treatment resulted in a progressive increase in fibrillation for softwood (SW) fibres as the treatment duration extended, while hardwood (HW) fibres exhibited an initial decrease in fibrillation followed by a subsequent increase. The mechanical grinding process enhanced the surface area of the fibres, as evidenced by the observed increase in fibrillation, measured by a demo version Valmet fractionator. Photoacoustic Spectroscopy (PAS) measures the absorption-induced acoustic signals in different cellulose fibers, reflecting changes in the material’s electronic and vibrational transitions. PAS detects shifts and broadening of absorption bands that result from mechanical treatment-induced structural changes, such as reductions in crystallinity and the formation of defects or disordered regions. These spectral changes provide information about how the mechanical treatment affects the internal structure of cellulose, including the disruption of hydrogen bonding and the breakdown of cellulose aggregates (
Figure 3a,c).
Reversed Double-Beam Photoacoustic Spectroscopy, on the other hand, focuses on detecting relative changes in signal intensity. This technique is sensitive to modifications in the surface area and morphology of cellulose particles. Such sensitivity is crucial in distinguishing the effects of different mechanical treatments, as seen in studies where RDB-PAS was employed to analyze the surface energy changes in UV-treated fibers [
21]. For cellulose fibers subjected to mechanical grinding, RDB-PAS reveals how the treatment influences the light scattering and absorption properties due to changes in particle size and surface roughness. Enhanced fibrillation and increased surface area, as observed in both SW and HW fibers, lead to more pronounced light scattering and absorption. RDB-PAS thus highlights the effects of mechanical treatment on the dispersion and interaction of cellulose particles with incident light (
Figure 3b,d).
In summary, PAS provides insights into the structural changes and alterations in light absorption within the cellulose fibers, while RDB-PAS emphasizes how these structural modifications impact light scattering and absorption properties. Both techniques together offer a comprehensive understanding of the effects of mechanical treatment on different cellulose fibers. This comprehensive approach aligns with recent research on the impact of mechanical treatments on cellulose's optical properties, underscoring the importance of analyzing both electronic and structural modifications [
23].
Overall, the mechanical treatment of cellulose has profound effects on its light-absorbing properties, leading to alterations in its spectroscopic behaviour and optical characteristics. Understanding these effects is essential, as highlighted by multiple studies, for optimizing the processing and utilization of cellulose-based materials in various applications, including papermaking, biomaterials, and renewable energy technologies [
25].
3.3. Coifman Discrete Wavelength
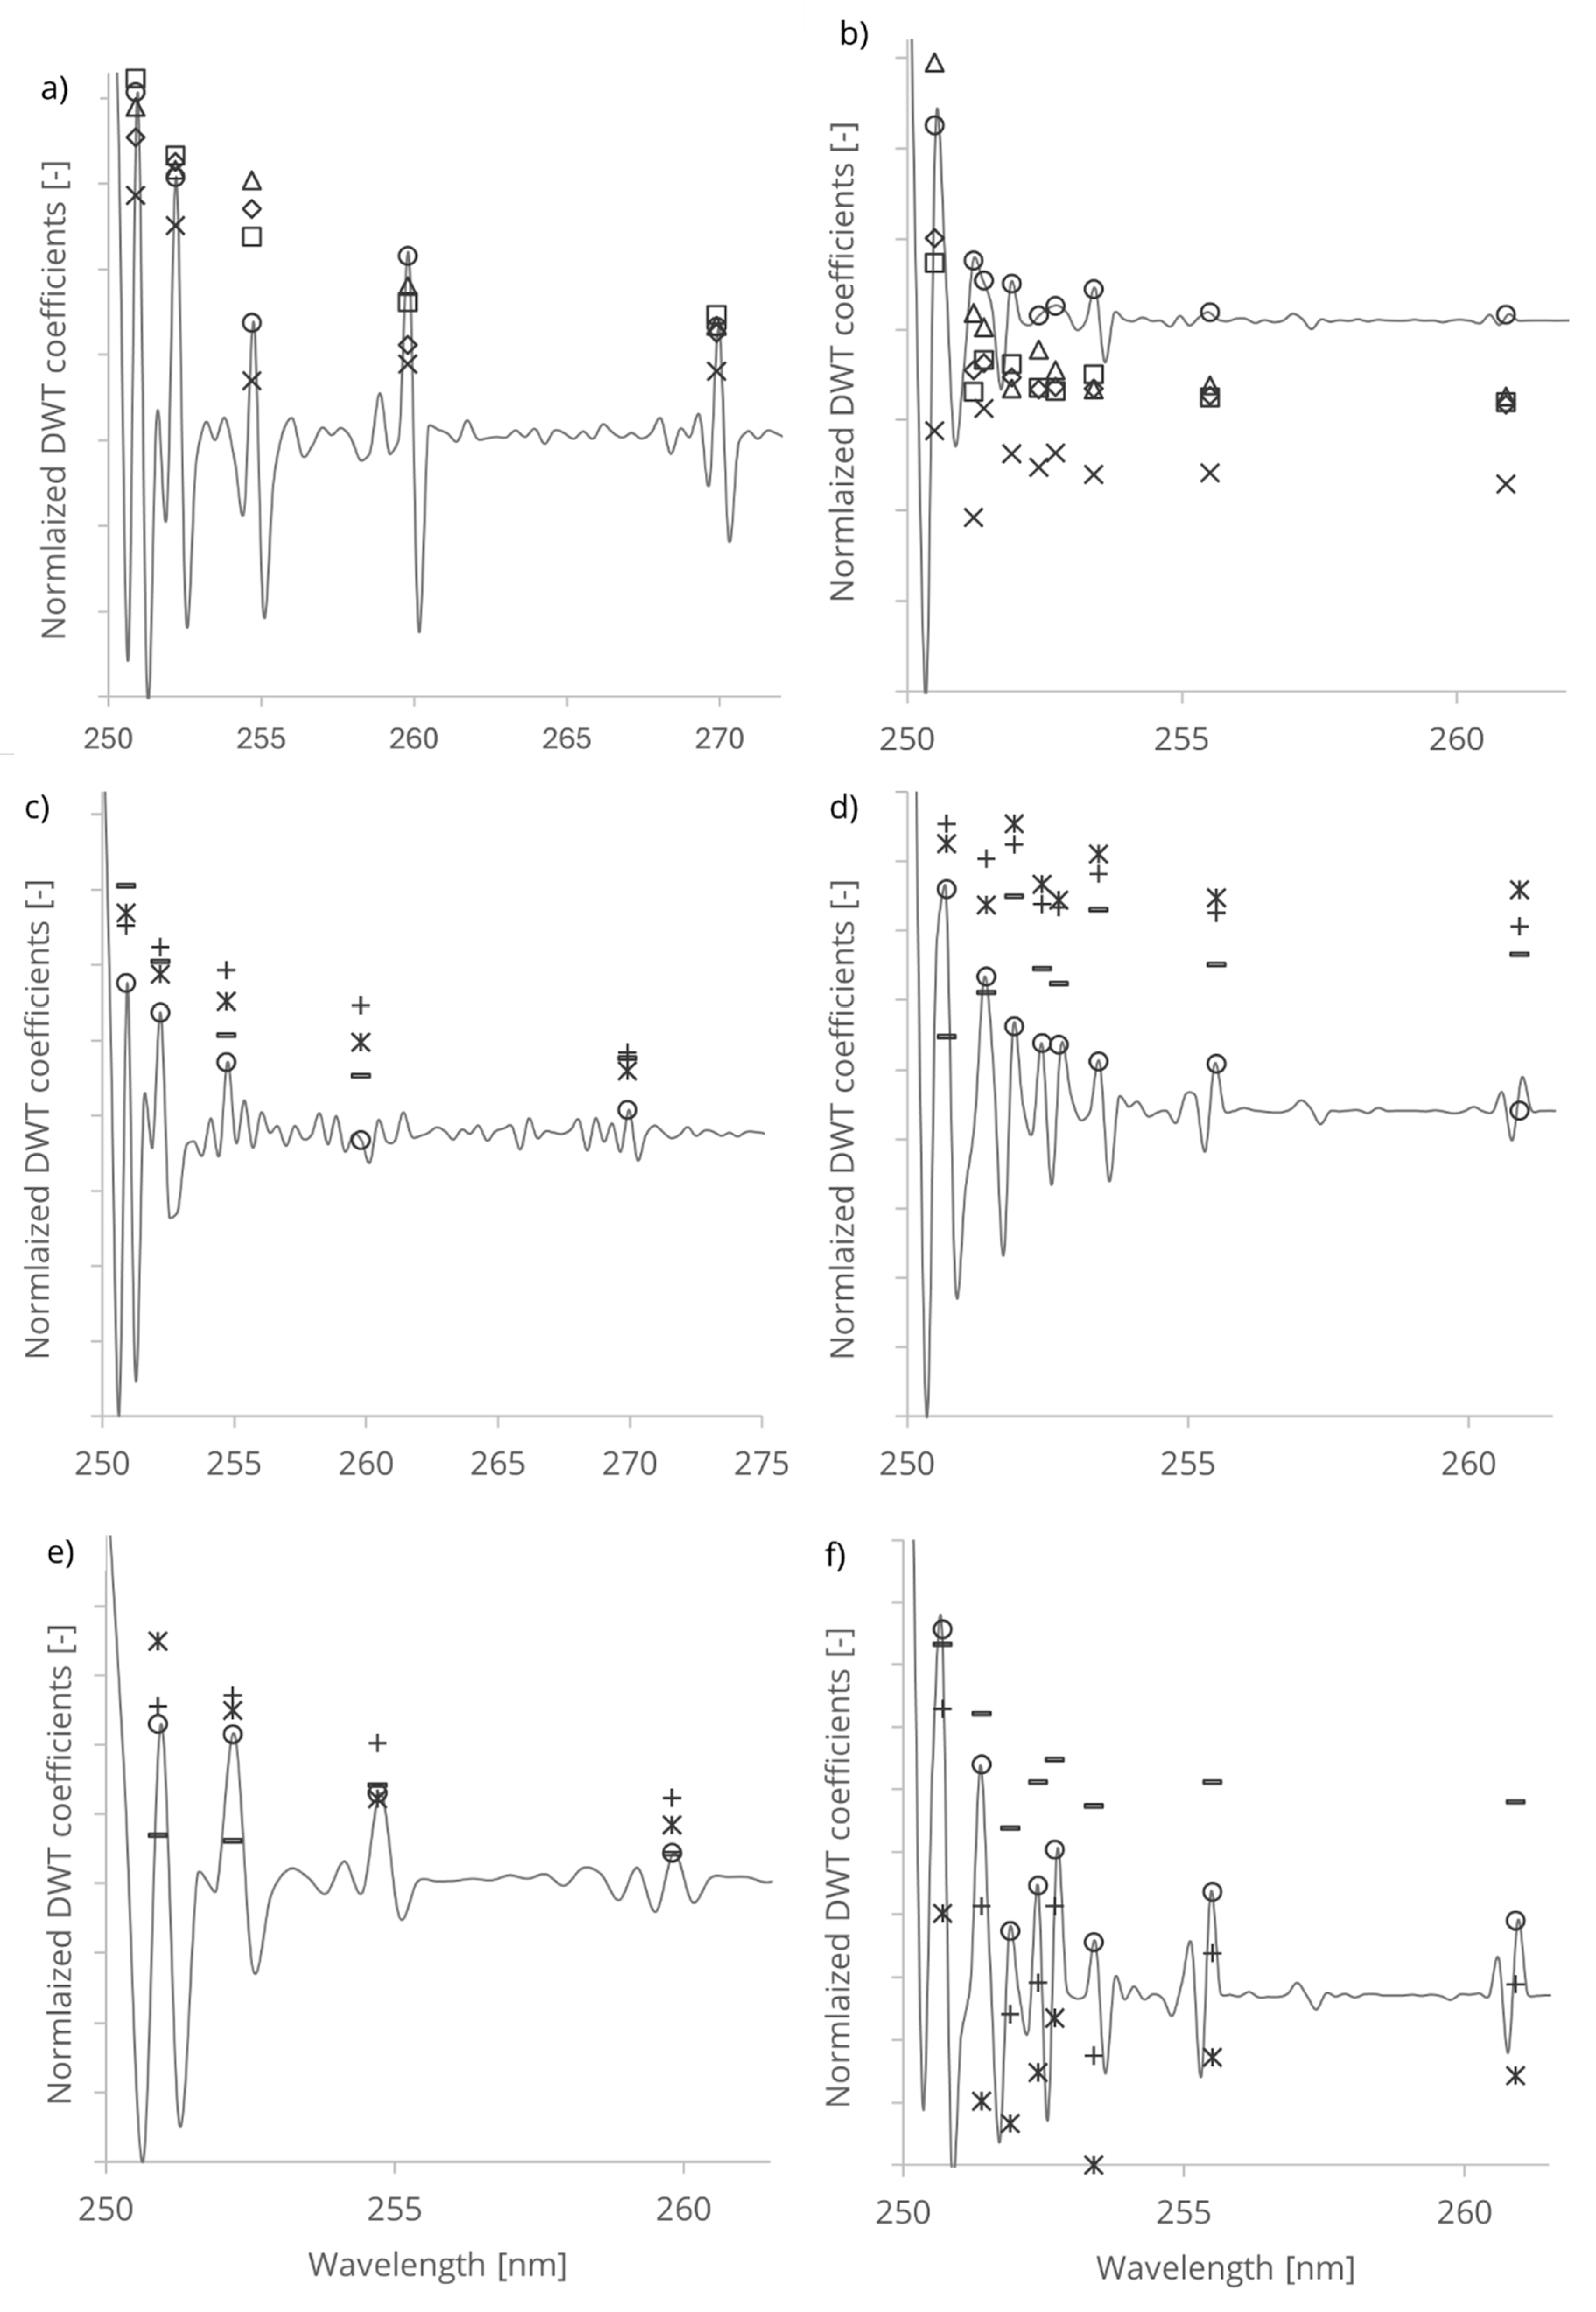
The wavelet analysis of untreated and treated cellulose fibres resulted in characteristic wavelet coefficient distribution on the wavelength domain. The resulting coefficients exhibited peaks, localized features at different wavelength positions indicating the surface structure of the cellulose fibres (
Table 1).
To quantify and visualize the treatment-induced changes, we normalized the wavelet coefficients of the treated samples (
Figure 4). This approach allowed us to identify regions of increased or decreased absorbance, thereby highlighting the spectral regions most affected by the chemical and mechanical treatment. The resulting coefficient distributions provided a clear representation of how the treatment modified the cellulose structure over time, with distinct patterns emerging at different treatment durations.
The peaks in the wavelet coefficients represent the presence of -OH groups absorption in the PAS and RDB-PAS signal localized at corresponding wavelength. The exponentially decreasing magnitude and position of the peaks provide information about the strength and localization of -OH group conformations within the PAS and RDB-PAS signal. The observed decrease in intensity of peaks from UV to visible wavelengths indicate different absorption spectra of cellulose fibres (
Figure 4).
-OH group on the cellulose surface absorbs more strongly in the UV range compared to the visible range, leading to higher photoacoustic response. Differences in the distribution or density of surface -OH groups contribute to the observed variation in photoacoustic response across different wavelengths. Crystalline regions of cellulose fibres exhibit higher absorbance in the UV range compared to non-crystalline regions. The increased absorbance arose from electronic transitions or resonance effects associated with the ordered arrangement of molecular chains in the crystalline lattice. Crystalline regions can lead to stronger absorption of UV radiation and consequently a more pronounced photoacoustic response in the UV domain. The presence of highly ordered -OH groups in crystalline cellulose regions contributes to the structural integrity and stability of cellulose fibres, influencing the generation and propagation of photoacoustic waves and results stronger response in the Coifman spectrum.
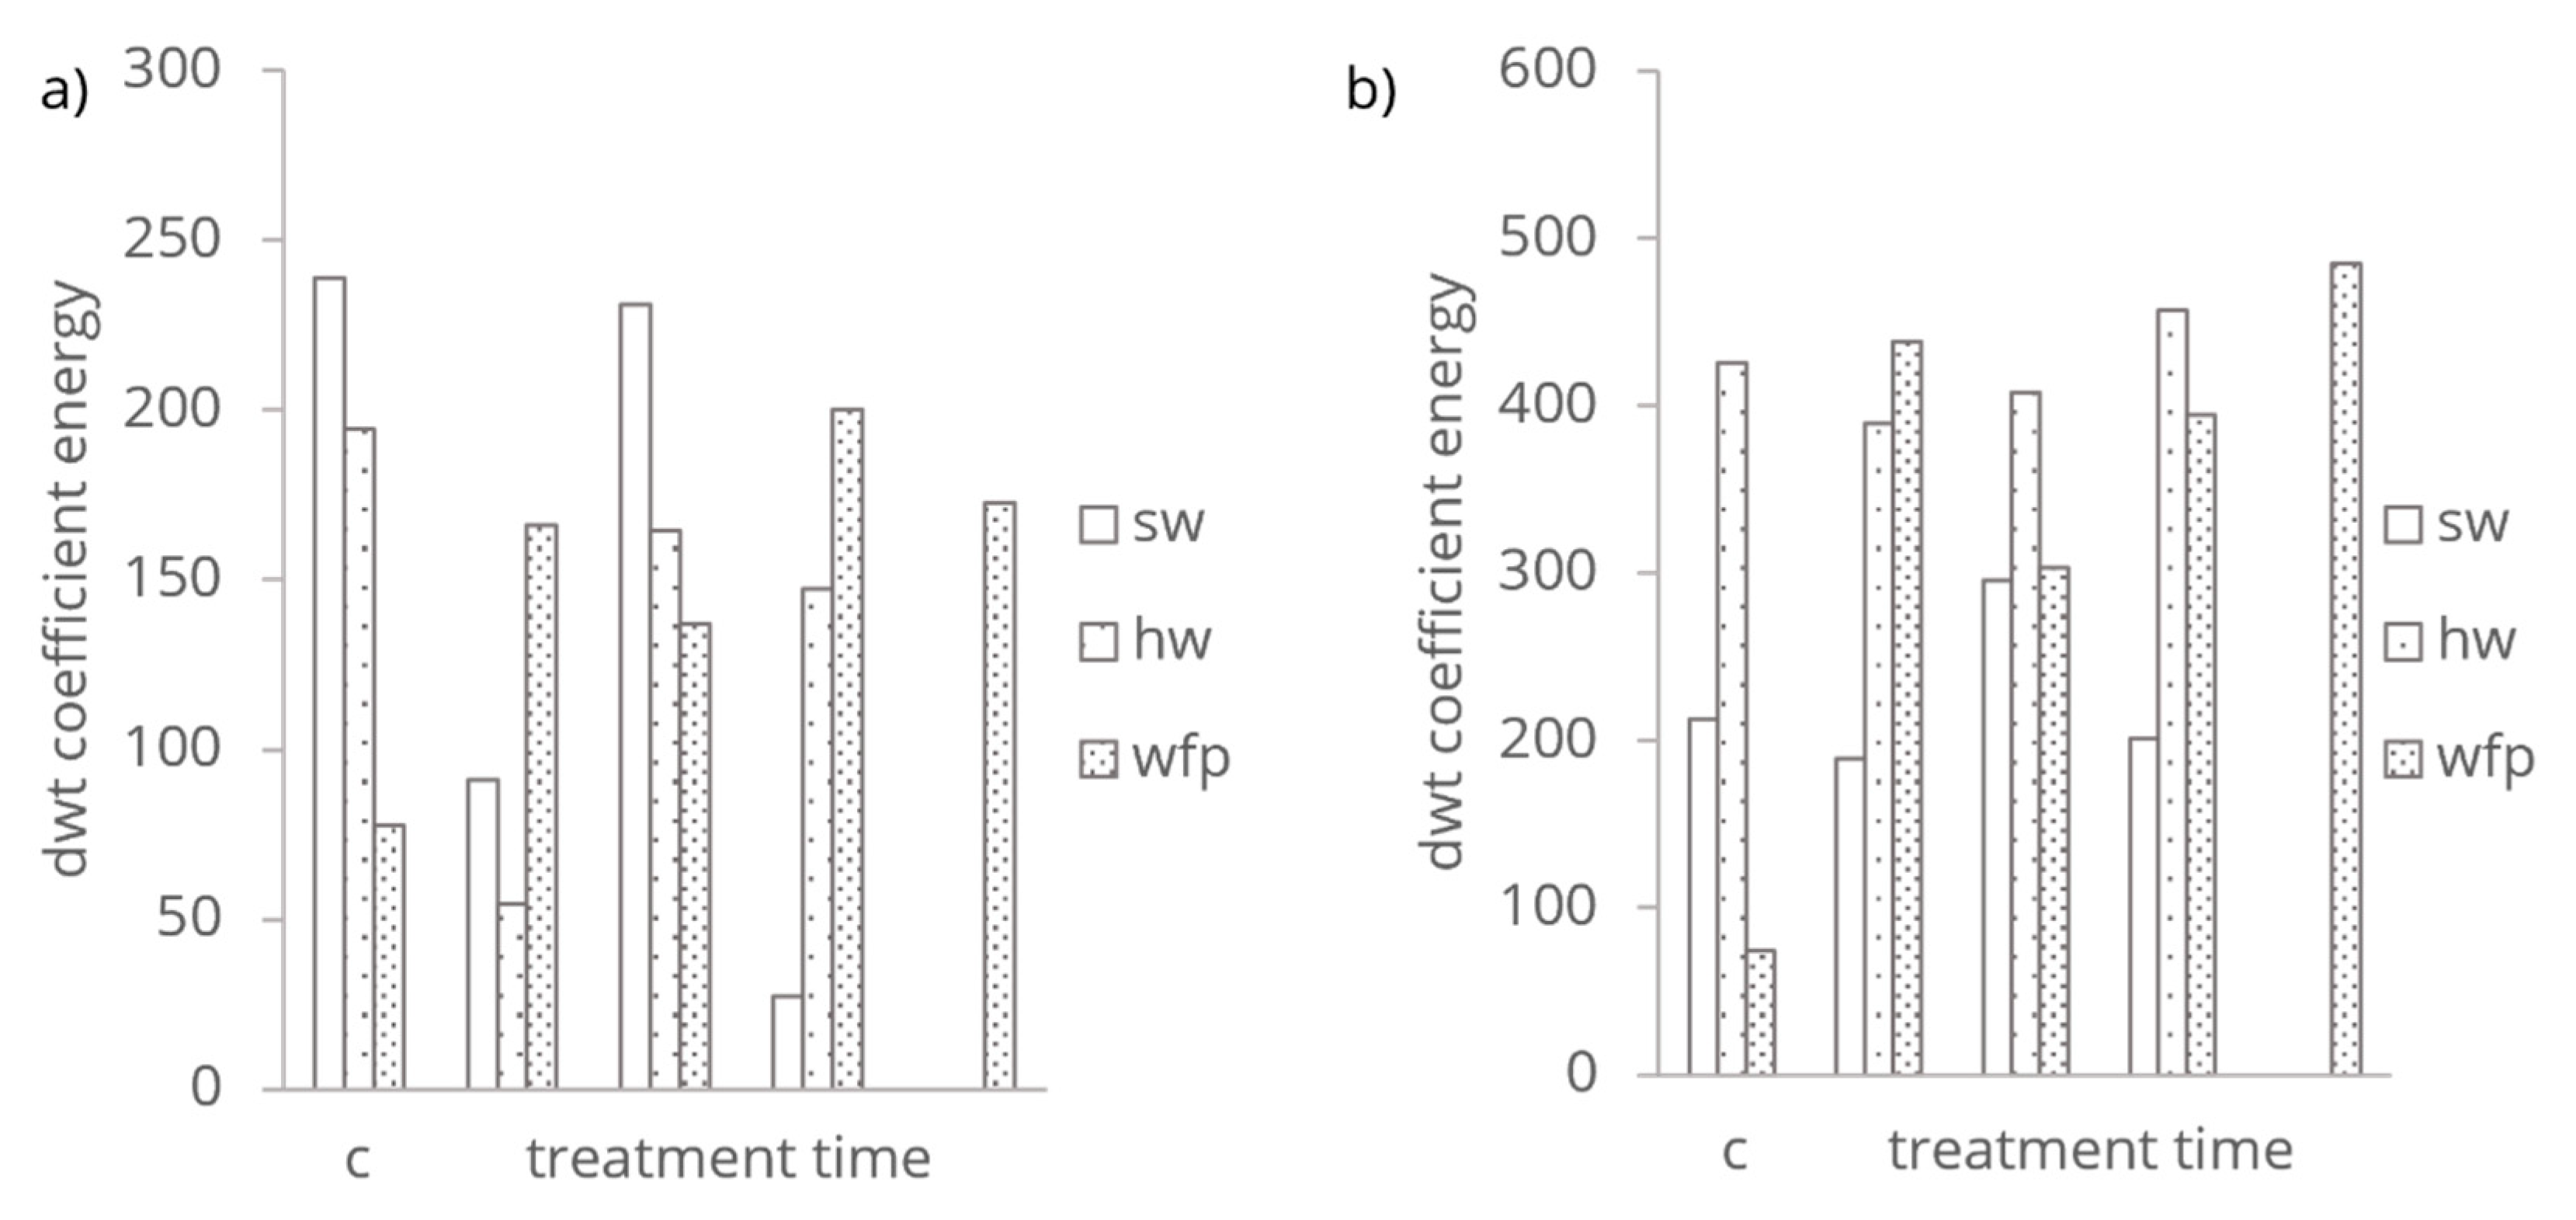
Summing up the squared coefficients in the Coifman DWT of PAS and RDB-PAS spectra an indicative signal’s energy distribution across different frequencies and wavelength points generated. This integrated value referred as wavelet energy were depicted on
Figure 5. The energy or signal strength measure reflects the total signal variance of chemical and mechanical treatments explained by the wavelets. The directly integrated DWT coefficients of the mechanical treated SW and HW cellulose fibres first reducing, compared to the control then increasing and decreasing again. The mechanical treatment reducing the crystallinity and increasing the molecular bonding through increasing the surface area [
28]. The chemical treatment of WFP cellulose fibres integrated dwt coefficients first increasing than decreasing and increasing with increasing treatment time. In the beginning of the HCl vapor hydrolysis the hydrogen chloride interacts with the cellulose and alter its surface roughness reducing the amorphous parts which might enhance the photoacoustic response.
The reduction in energy after 4 hours, but still above the control levels indicate the progression in the chemical modification where structural and compositional changes begin to stabilize of the cellulose to interact with photoacoustic waves. After 6 hours HCl vapor treatment a more complex interaction of dwt coefficients indicates a secondary phase of changes, like crystallization, a new type of structural alteration that increase the cellulose fibre’s ability to absorb radiation in the UV domain enhancing the photoacoustic response. The prolonged HCl vapor exposure after 8 hours treatment led to excessive degradation in the cellulose structure where its ability to generate strong photoacoustic signal diminishes.
That excessive degradation resulted uniform structure, reducing heterogeneity that contribute to the photoacoustic response.
3.4. Electron Trap Distribution
The formation of electron traps on the cellulose surface involves complex interactions at the molecular level, leading to the creation of localized energy states that can capture and hold electrons temporarily [
15]. These traps are defects or irregularities within the cellulose structure that have distinct electronic properties.
The mechanisms leading to the formation of these traps under the HCl vapor and mechanical grinding processing include the protonation of hydroxyl groups and cleavage of glycosidic bonds in cellulose chain and mechanical disruption the crystalline structure creating amorphous areas in cellulose chain, respectively.
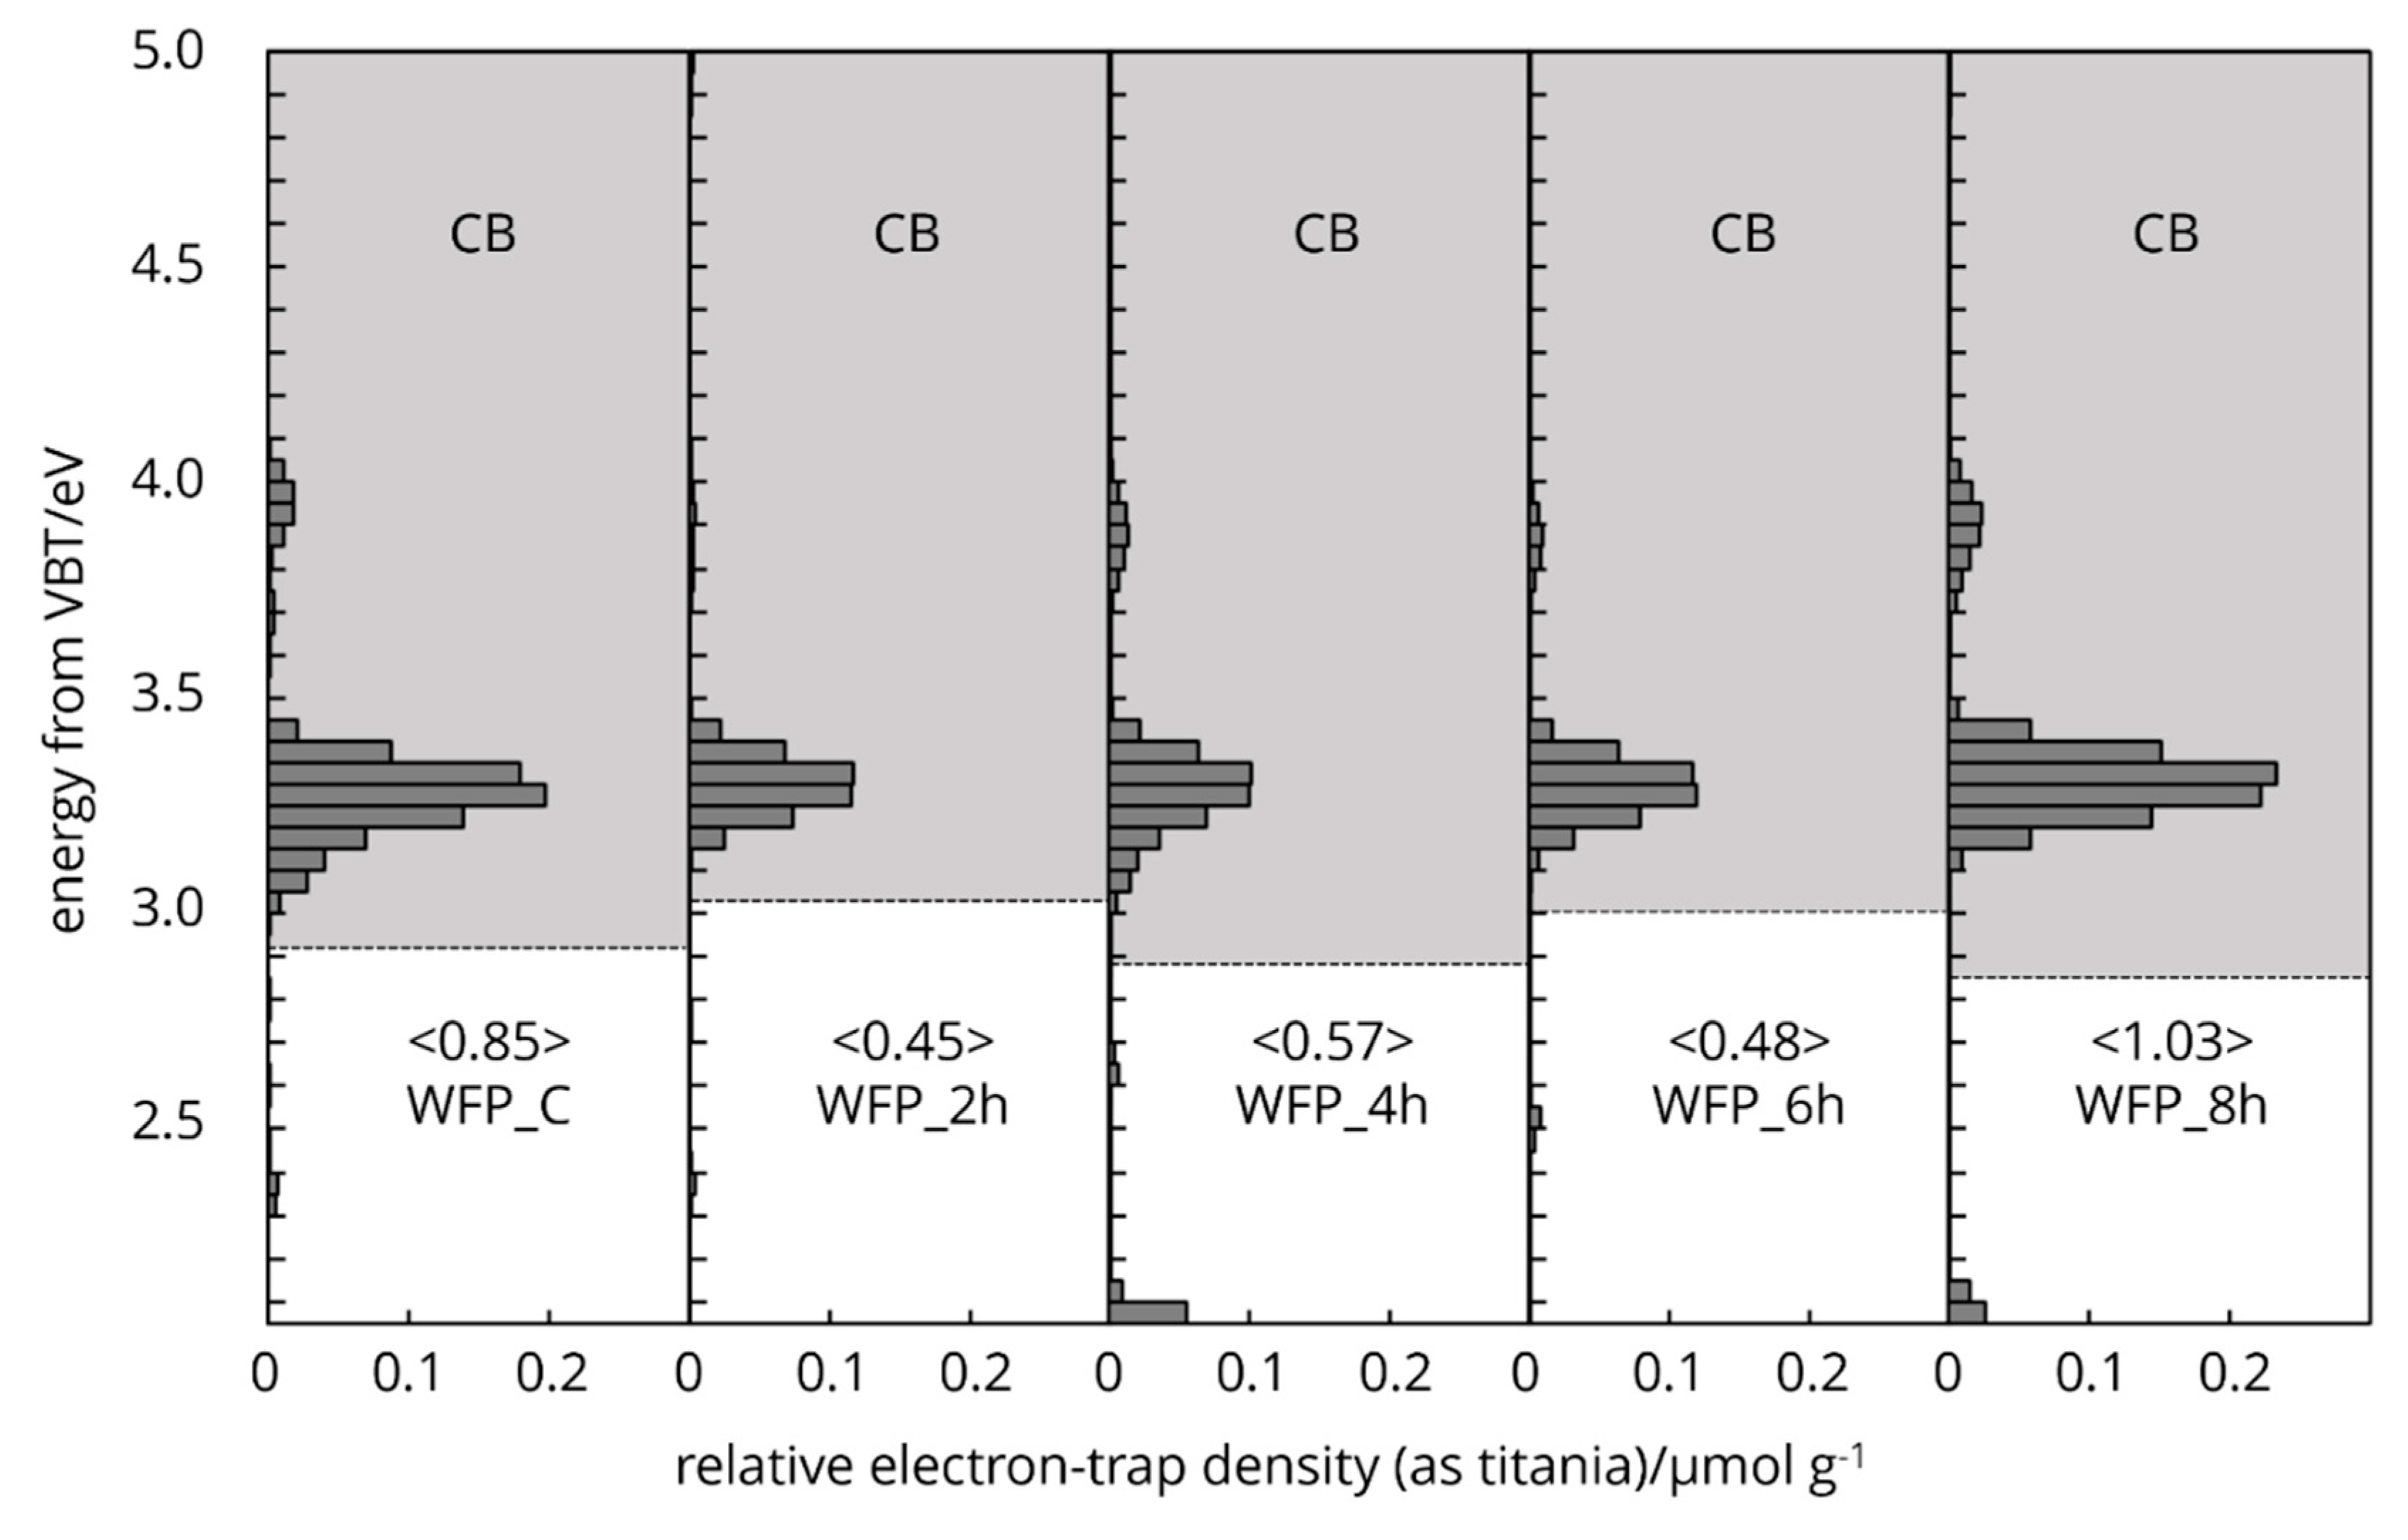
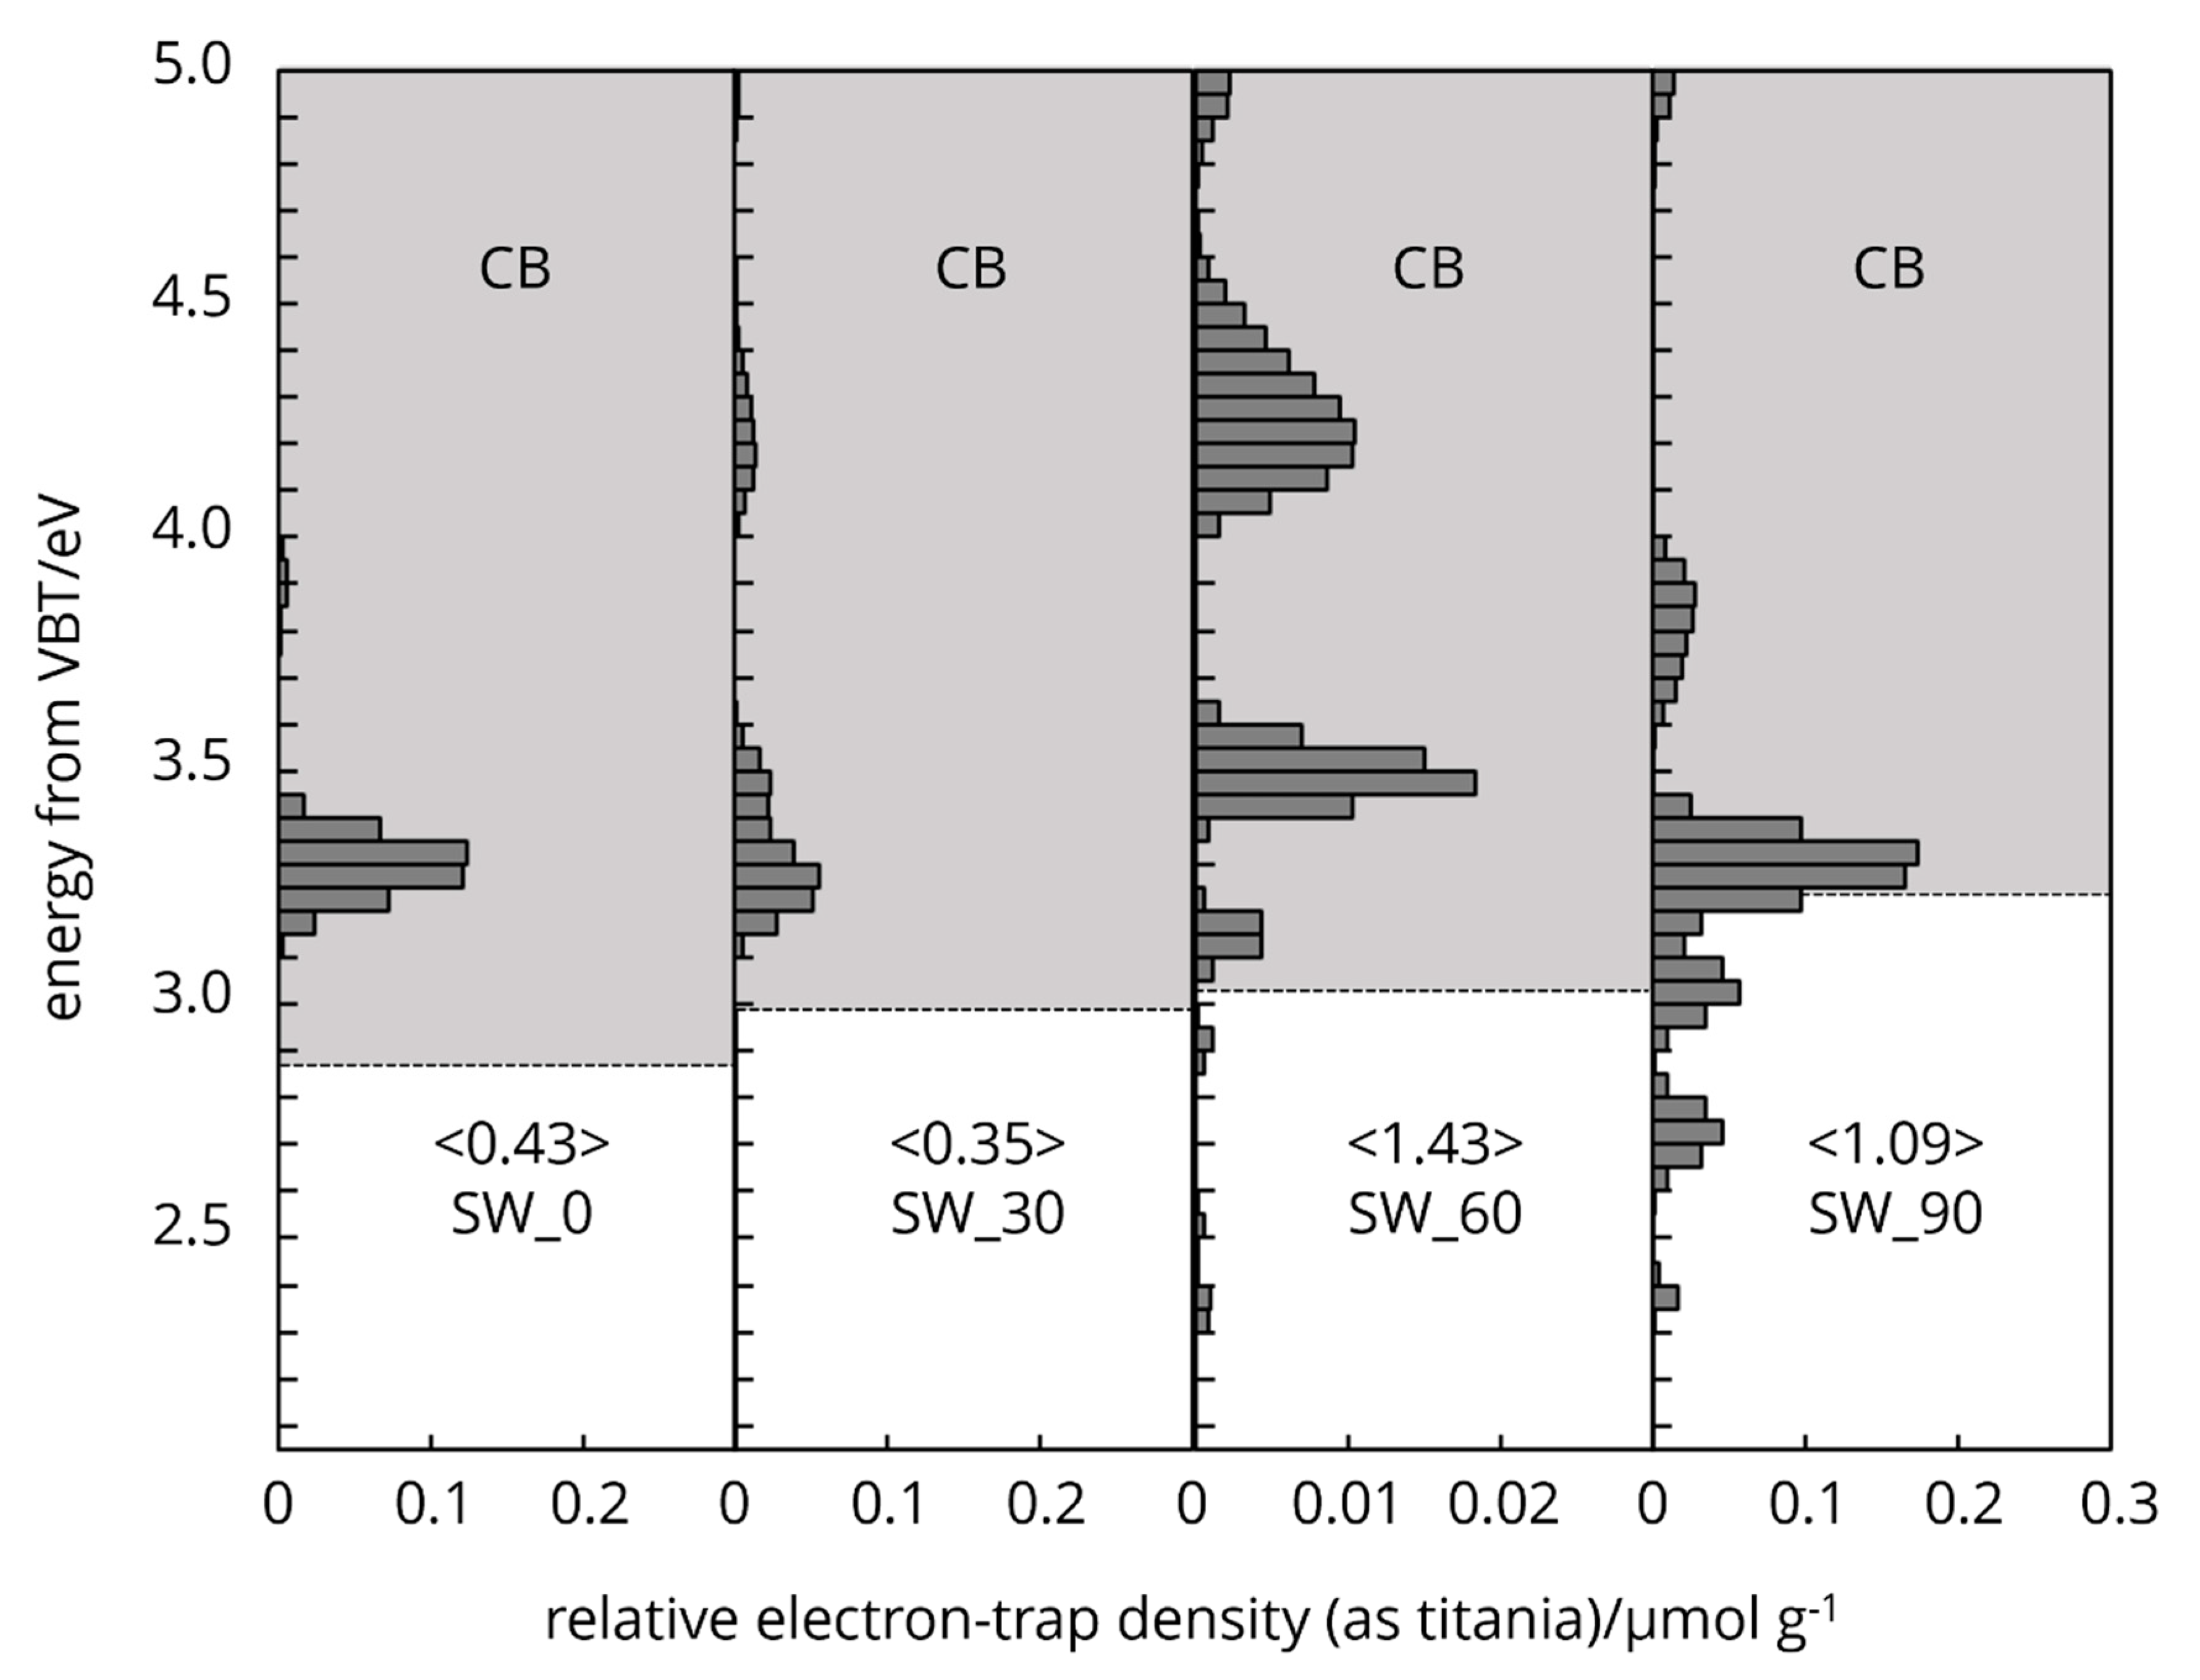
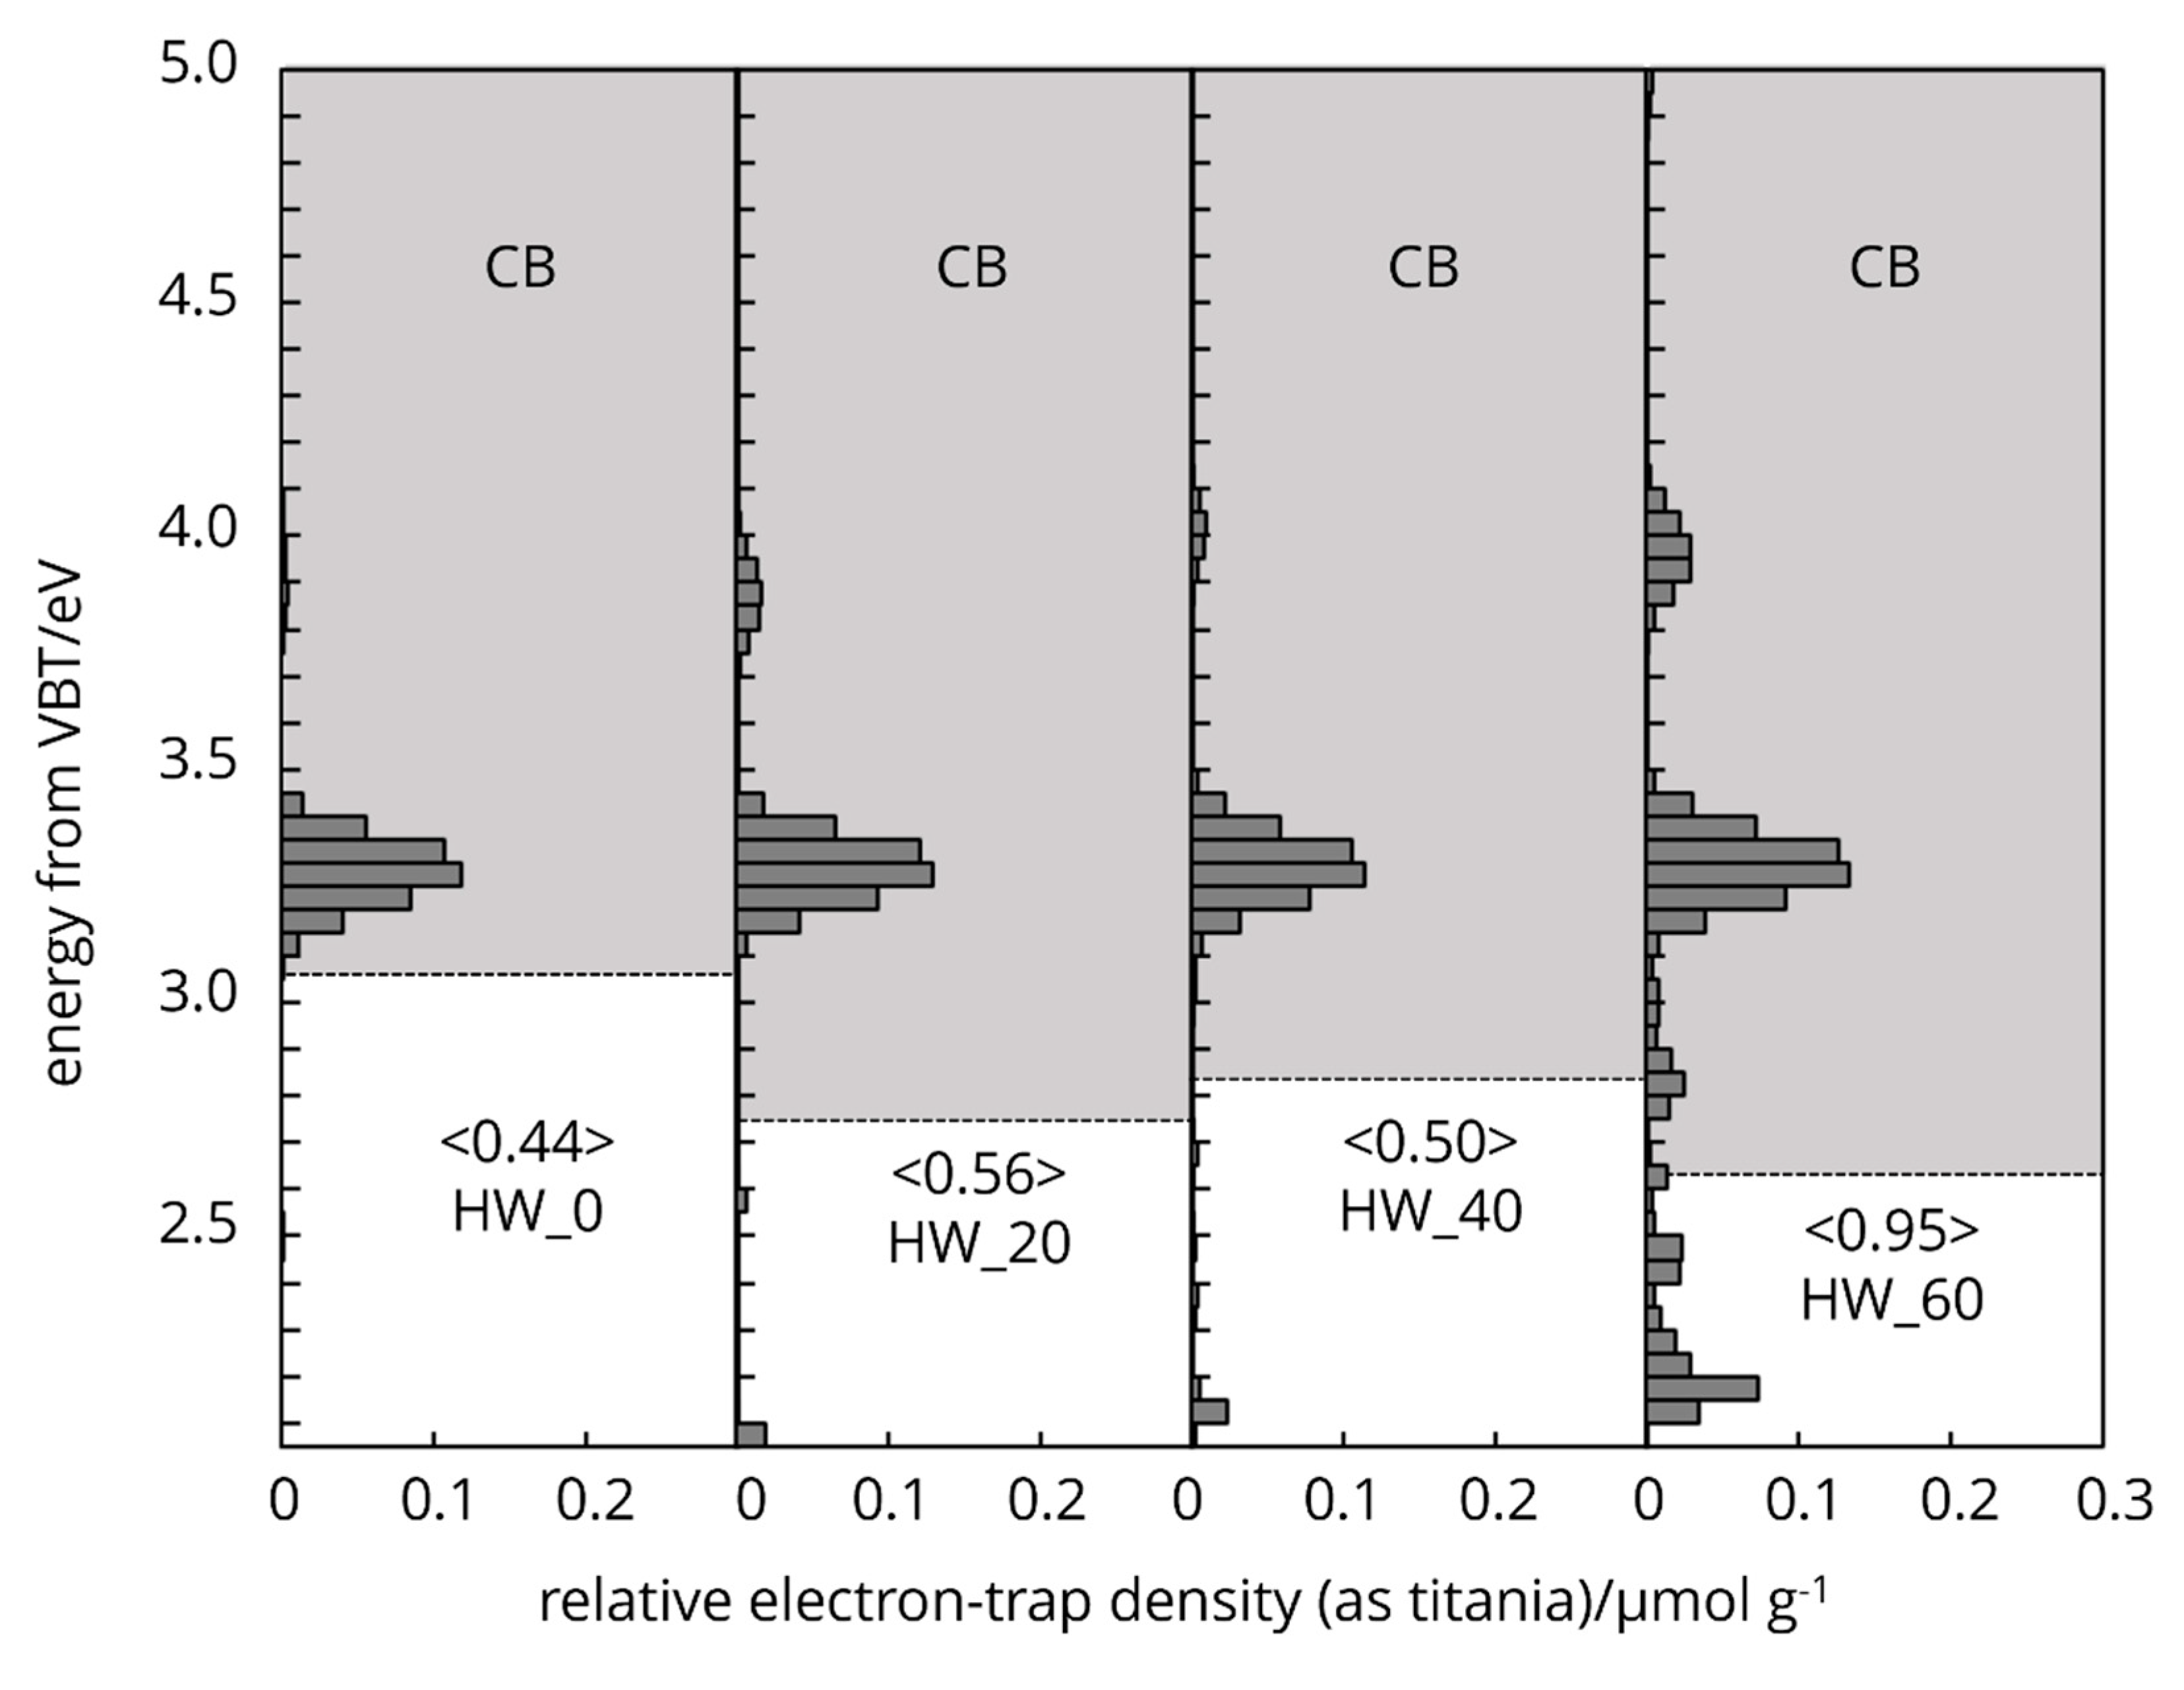
Cellulose naturally possesses intrinsic type electron traps and the distribution of these traps in the energy levels spectra is unique (
Figure 6,
Figure 7 and
Figure 8). The characteristic features arise from the two different crystallography phase structure and from imperfections or defects within its crystal lattice.
The extrinsic type of electron traps arose from the HCl vapor chemical and mechanical grinding processes.
The energy levels of the electron traps in different processed cellulose fibres spanning below the conduction band, overall, from 4.7-2.8 eV. This range indicates a broad distribution of trap depth. The energy distribution of electron traps centred around 4.3 eV (
Figure 7.) holds tightly the electrons (deep traps), located further from the bands, effectively immobilizing them and influence the non-linear dielectric properties (Salama 2004), storage of charge and electrical insulation stability of cellulose [
29,
30,
31]. Electron traps distribution centred around 3.2 eV (
Figure 6,
Figure 7 and
Figure 8.) holds loosely electrons (shallow traps) and located closer to the conduction band. This latter one can easily release electrons back to the band, contributing to photoconductivity or slight increase in conductivity under illumination [
32,
33,
34,
35].
The presence of the characteristic electron trap distribution on cellulose surface affects the charges move, dielectric behaviour and serves a non-radiative recombination centres and response to external electric field.
The protonation of hydroxyl groups and the potential cleavage of glycosidic bonds by HCl vapor treatment create new radical sites or carbocations for electron trapping [
36]. The energy levels of the electron traps in chemically processed cellulose fibres spanning below the conduction band (grey area) from 4.1-3.0 eV (
Figure 6). The deep electron trap band distribution of WFP type cellulose is located further to the conduction band, centred at 3.9 eV in the control sample. As the HCl vapor hydrolysis time increases up to 6h, the deep electron bands move to a lower energy range. As crystallization occurs at 8h treatment, the deep electron bands move back to a higher energy level and at the same time increases the intensity. The shallow traps centre was not changed, however the intensity increased at 8h treatment and exceeded the control sample. The degree of polymerization was reduced by 85% after 8h treatment [
37,
38,
39] resulting in a higher crystallinity and thermally more stable cellulose material.
The mechanical grinding imposes physical changes, generates mechanical stress on the cell wall, leading to the disruption of the crystalline structure and the creation of amorphous regions. The physical distortion and creation of structural defects, such as dislocations in the cellulose fibres can lead to the formation of electron traps. The physical irregularities enhance cellulose ability to interact with electrons, facilitating the trapping mechanism. These defects disturb the periodic potential of the crystalline lattice, creating localized energy levels within the band gap, where electrons can be trapped (
Figure 7 and
Figure 8).
4. Conclusions
In the realm of molecular spectroscopy, the association between chemical bond lengths and the wavelength of absorbed radiation is crucial, particularly when studying electronic transitions. This relationship is underpinned by the principles of quantum mechanics, where molecular energy levels are quantized, and transitions between these levels correspond to the absorption or emission of electromagnetic radiation. Both chemical and mechanical treatments significantly influence the photoacoustic signal in cellulose fibres. HCl vapor treatment of cellulose induces complex, non-linear chemical modifications that profoundly affect its light-absorbing properties, leading to significant alterations in its spectroscopic behavior and optical characteristics. Mechanical treatment of cellulose fibres derived from hardwood and softwood diminishes their capacity to absorb incident light, whereas chemical treatment enhances the absorption capabilities of cotton cellulose fibres, as evidenced by increased discrete wavelet transform energy levels. These variations in integrated DWT coefficient energy levels reflect structural changes in the cellulose due to different treatment durations, involving the breakdown of glycosidic bonds, alterations in crystalline regions, and changes in molecular weight. Coifman wavelets, with their heightened sensitivity to changes in signal structure, effectively highlight these modifications. The observed 'increasing-decreasing' pattern of energy could indicate the dynamics of the treatments and non-linear responses within the cellulose matrix. This comprehensive analysis not only advances our understanding of fibre modification processes but also enhances the potential for optimizing industrial applications of cellulose-based materials. Our findings pave the way for the development of tailored fibre treatments designed to improve material performance across various applications.
Supplementary Materials
The following supporting information can be downloaded at the website of this paper posted on Preprints.org, Supporting file.
Author Contributions
LCs, WCs, BO performed the experiment, LCs and WCs made the experiment design, LCs, WCs, ET, EN, YH and BO interpreted the data and gave a major contribution to manuscript preparation and writing. All authors read and approved the final manuscript.
Institutional Review Board Statement
Not applicable.
Data Availability Statement
The datasets used and/or analysed in the current study are available from the corresponding author upon reasonable request.
Acknowledgments
The authors are acknowledged for the "Innovative Analysis Technologies for Circular Economy Biorefinery Processes" project (CEBIPRO) from 2023-2025. The project receives funding from Business Finland through the EU NextGeneration program as well as from participating companies. The project is part of the Valmet Beyond Circularity R&D program.
Conflicts of Interest
The authors declare no conflicts of interest.
References
- Jin, Y.; Yin, Y.; Li, C.; Liu, H.; Shi, J. Non-Invasive Monitoring of Human Health by Photoacoustic Spectroscopy. Sensors 2022, 22. [Google Scholar] [CrossRef] [PubMed]
- Janczarek, M.; Endo-Kimura, M.; Wang, K.; Wei, Z.; Akanda, M.M.A.; Markowska-Szczupak, A.; Ohtani, B.; Kowalska, E. Is Black Titania a Promising Photocatalyst? Catalysts 2022, 12. [Google Scholar] [CrossRef]
- Bell, A.G. On the Production and Reproduction of Sound by Light. Am J Sci 1880, s3-20. [Google Scholar] [CrossRef]
- Ohtani, B. Photoacoustic Spectroscopy. In Springer Handbooks; 2022.
- Khan, M.N.; Abidin, Z. ul; Khan, S.; Almas; Mustafa, S.; Ahmad, I. Birefringence of Cellulose: Review, Measurement Techniques, Dispersion Models, Biomedical Applications and Future Perspectives. Wood Sci Technol 2024, 58.
- Caixeiro, S.; Peruzzo, M.; Onelli, O.D.; Vignolini, S.; Sapienza, R. Disordered Cellulose-Based Nanostructures for Enhanced Light Scattering. ACS Appl Mater Interfaces 2017, 9. [Google Scholar] [CrossRef] [PubMed]
- Hellwig, J.; Durán, V.L.; Pettersson, T. Measuring Elasticity of Wet Cellulose Fibres with AFM Using Indentation and a Linearized Hertz Model. Analytical Methods 2018, 10. [Google Scholar] [CrossRef]
- Hellwig, J.; Karlsson, R.M.P.; Wågberg, L.; Pettersson, T. Measuring Elasticity of Wet Cellulose Beads with an AFM Colloidal Probe Using a Linearized DMT Model. Analytical Methods 2017, 9. [Google Scholar] [CrossRef]
- Norgren, M.; Costa, C.; Alves, L.; Eivazi, A.; Dahlström, C.; Svanedal, I.; Edlund, H.; Medronho, B. Perspectives on the Lindman Hypothesis and Cellulose Interactions. Molecules 2023, 28. [Google Scholar] [CrossRef]
- Jarvis, M.C. Hydrogen Bonding and Other Non-Covalent Interactions at the Surfaces of Cellulose Microfibrils. Cellulose 2023, 30. [Google Scholar] [CrossRef]
- Hussain, S.A.; Ali, S.; Islam, Z.U.; Khan, M. Low-Temperature Synthesis of Graphite Flakes and Carbon-Based Nanomaterials from Banana Peels Using Hydrothermal Process for Photoelectrochemical Water-Splitting. Physica E Low Dimens Syst Nanostruct 2022, 141. [Google Scholar] [CrossRef]
- Chami Khazraji, A.; Robert, S. Self-Assembly and Intermolecular Forces When Cellulose and Water Interact Using Molecular Modeling. J Nanomater 2013, 2013. [Google Scholar] [CrossRef]
- Lin-Vien, D.; Colthup, N.B.; Fateley, W.G.; Grasselli, J.G. Introduction. In The Handbook of Infrared and Raman Characteristic Frequencies of Organic Molecules; 1991.
- Elia, V.; Oliva, R.; Napoli, E.; Germano, R.; Pinto, G.; Lista, L.; Niccoli, M.; Toso, D.; Vitiello, G.; Trifuoggi, M.; et al. Experimental Study of Physicochemical Changes in Water by Iterative Contact with Hydrophilic Polymers: A Comparison between Cellulose and Nafion. J Mol Liq 2018, 268. [Google Scholar] [CrossRef]
- Csóka, L.; Hosakun, W.; Kolonics, O.; Ohtani, B. Reversed Double-Beam Photoacoustic Spectroscopic Analysis of Photoinduced Change in Absorption of Cellulose Fibres. Sci Rep 2022, 12. [Google Scholar] [CrossRef] [PubMed]
- Tian, J.; Wells, R.O. Remark on Vanishing Moments. In Proceedings of the Conference Record of the Asilomar Conference on Signals, Systems and Computers; 1997; Vol. 2.
- Pan, G.; Toupikov, M.V.; Gilbert, B.K. On the Use of Coifman Intervallic Wavelets in the Method of Moments for Fast Construction of Wavelet Sparsified Matrices. IEEE Trans Antennas Propag 1999, 47. [Google Scholar] [CrossRef]
- Buzzini, P.; King Dempsey, M.; Laughlin, G.J.; Sparenga, S.B. The Effect of Ultraviolet Radiation on Dyed Man-Made Textile Fibers Using UV-Vis Microspectrophotometry (MSP): Technical Aspects on Spectral Alterations in Time. The Microscope 2022, 69. [Google Scholar] [CrossRef]
- Tu, Q.; Gao, W.; Zhou, J.; Wu, J.; Zeng, J.; Wang, B.; Xu, J. Characteristics of Dialdehyde Cellulose Nanofibrils Derived from Cotton Linter Fibers and Wood Fibers. Molecules 2024, 29. [Google Scholar] [CrossRef]
- Zhang, H.; Wang, X.; Wang, J.; Chen, Q.; Huang, H.; Huang, L.; Cao, S.; Ma, X. UV–Visible Diffuse Reflectance Spectroscopy Used in Analysis of Lignocellulosic Biomass Material. Wood Sci Technol 2020, 54. [Google Scholar] [CrossRef]
- Kahl, C.; Gemmeke, N.; Bagnucki, J.; Heim, H.P. Investigations on Fiber–Matrix Properties of Heat-Treated and UV-Treated Regenerated Cellulose Fibers. Compos Part A Appl Sci Manuf 2022, 152. [Google Scholar] [CrossRef]
- Gould, J.M. Characterization of Lignin in Situ by Photoacoustic Spectroscopy. Plant Physiol 1982, 70. [Google Scholar] [CrossRef]
- Yang, W.; Liao, N.; He, S.; Cheng, H.; Li, H. Large-Aperture UV (250~400 Nm) Imaging Spectrometer Based on a Solid Sagnac Interferometer. Opt Express 2018, 26. [Google Scholar] [CrossRef]
- Kocić, A.; Bizjak, M.; Popović, D.; Poparić, G.B.; Stanković, S.B. UV Protection Afforded by Textile Fabrics Made of Natural and Regenerated Cellulose Fibres. J Clean Prod 2019, 228. [Google Scholar] [CrossRef]
- Kathiresan, S.; Meenakshisundaram, O. Effect of Alkali Treated and Untreated Cellulose Fibers and Human Hair on FTIR and Tensile Properties for Composite Material Applications. SN Appl Sci 2022, 4. [Google Scholar] [CrossRef]
- Bogner, P.; Bechtold, T.; Pham, T.; Manian, A.P. Alkali Induced Changes in Spatial Distribution of Functional Groups in Carboxymethylated Cellulose. Cellulose 2024, 31. [Google Scholar] [CrossRef]
- Yang, H.; Jacucci, G.; Schertel, L.; Vignolini, S. Cellulose-Based Scattering Enhancers for Light Management Applications. ACS Nano 2021. [Google Scholar] [CrossRef] [PubMed]
- Wang, Z.; Xu, K.; Zhang, Y.; Wu, J.; Lin, X.; Liu, C.; Hua, J. Study on Electro-Spin Performance of Different Types of Cellulose by Activation in the Solvent of LiCl / DMAc. Journal of Forestry Engineering 2020, 5. [Google Scholar] [CrossRef]
- Sari, I.M.; Suwarno; Kinkeldey, T.; Werle, P. Effect of Thermal Aging on the Mechanical Characteristic of Insulating Paper Impregnated with Different Insulating Oils. In Proceedings of the 2018 Condition Monitoring and Diagnosis, CMD 2018 - Proceedings; 2018.
- Li, Z.; Wang, G.; Zhao, Z.; Jiang, X. The Deterioration Mechanism of the Mechanical and Electrical Properties of Insulating Cardboard under Mechanical Force. In Proceedings of the Proceedings of 2022 IEEE 5th International Electrical and Energy Conference, CIEEC 2022; 2022.
- Hao, J.; Ye, W.; Gao, C.; Zhu, M.; Yang, L.; Liao, R. Experimental and Molecular Level Analysis of Natural Ester Delaying Degradation of Cellulose Insulation Polymer. High Voltage 2022, 7. [Google Scholar] [CrossRef]
- Utamuradova, S.B.; Mamadalimov, A.T.; Khakimova, N.K.; Norbekov, S.M.; Isayev, M.S. STUDY OF ELECTROPHYSICAL AND OPTICAL PROPERTIES OF NATURAL CELLULOSE FIBERS DOPED WITH IODINE AND KMnO4. New Materials, Compounds and Applications 2023, 7. [Google Scholar]
- Zakirov, A.S.; Yuldashev, S.U.; Wang, H.J.; Lee, J.C.; Kang, T.W.; Mamadalimov, A.T. Study on Electrical Transport and Photoconductivity in Iodine-Doped Cellulose Fibers. J Mater Sci 2011, 46. [Google Scholar] [CrossRef]
- Zakirov, A.S.; Yuldashev, S.U.; Cho, H.D.; Jeon, H.C.; Kang, T.W.; Mamadalimov, A.T. Electrical and Optical Properties of Air-Stable, Iodine-Doped Natural Cotton Fibers. Journal of the Korean Physical Society 2014, 64. [Google Scholar] [CrossRef]
- Luyt, A.S.; Škipina, B.; Csóka, L.; Dudić, D. Charge-Trapping Capability and AC Conductivity at Different Humidities of Poly(Ethyleneimine)–TiO2–Anthocyanin-Modified Cellulose Fibres. Wood Sci Technol 2018, 52. [Google Scholar] [CrossRef]
- Tong, W.; Fang, H.; Song, K.; Xie, X.; Wang, J.; Jin, Y.; Wu, S.; Hu, J.; Chu, Q. Modified Acid Pretreatment to Alter Physicochemical Properties of Biomass for Full Cellulose/Hemicellulose Utilization. Carbohydr Polym 2023, 299. [Google Scholar] [CrossRef]
- Ioelovich, M.I. Study on Acidic Degradation of Cellulose. Innovations in Corrosion and Materials Science (Formerly Recent Patents on Corrosion Science) 2017, 7. [Google Scholar] [CrossRef]
- Battista, O.A.; Coppick, S.; Howsmon, J.A.; Morehead, F.F.; Sisson, W.A. Level-Off Degree of Polymerization. Ind Eng Chem 1956, 48. [Google Scholar] [CrossRef]
- Kontturi, E.; Meriluoto, A.; Penttilä, P.A.; Baccile, N.; Malho, J.M.; Potthast, A.; Rosenau, T.; Ruokolainen, J.; Serimaa, R.; Laine, J.; et al. Degradation and Crystallization of Cellulose in Hydrogen Chloride Vapor for High-Yield Isolation of Cellulose Nanocrystals. Angewandte Chemie - International Edition 2016, 55. [Google Scholar] [CrossRef] [PubMed]
|
Disclaimer/Publisher’s Note: The statements, opinions and data contained in all publications are solely those of the individual author(s) and contributor(s) and not of MDPI and/or the editor(s). MDPI and/or the editor(s) disclaim responsibility for any injury to people or property resulting from any ideas, methods, instructions or products referred to in the content. |
© 2024 by the authors. Licensee MDPI, Basel, Switzerland. This article is an open access article distributed under the terms and conditions of the Creative Commons Attribution (CC BY) license (http://creativecommons.org/licenses/by/4.0/).
 of control WFP; HW; +30 min, *60 min, - 90 min, –DWT of control SW.
 of control WFP; HW; +30 min, *60 min, - 90 min, –DWT of control SW.