1. Introduction
The domestic exploitation of conventional oil reservoirs has entered the middle and late stage, and the oil equivalent extracted can not meet the national demand for oil and gas. With the development of science and technology, the exploitation technology of unconventional reservoirs has been improved, and more and more attention has been paid to the exploitation of unconventional reservoirs, especially fracture-vuggy carbonate reservoirs. There are 68[
1,
2,
3] fracture-cave carbonate reservoirs in the world, 10 of which are in China, mainly located in Renqiu[
4,
5,
6], Sichuan[
7,
8,
9], Ordos[
10,
11,
12] and Tarim[
13,
14]. Among them, the Ordovician reservoirs in Tahe Oilfield[
15,
16] are the largest fracture-cavity carbonate reservoirs that have been proved. These reservoirs[
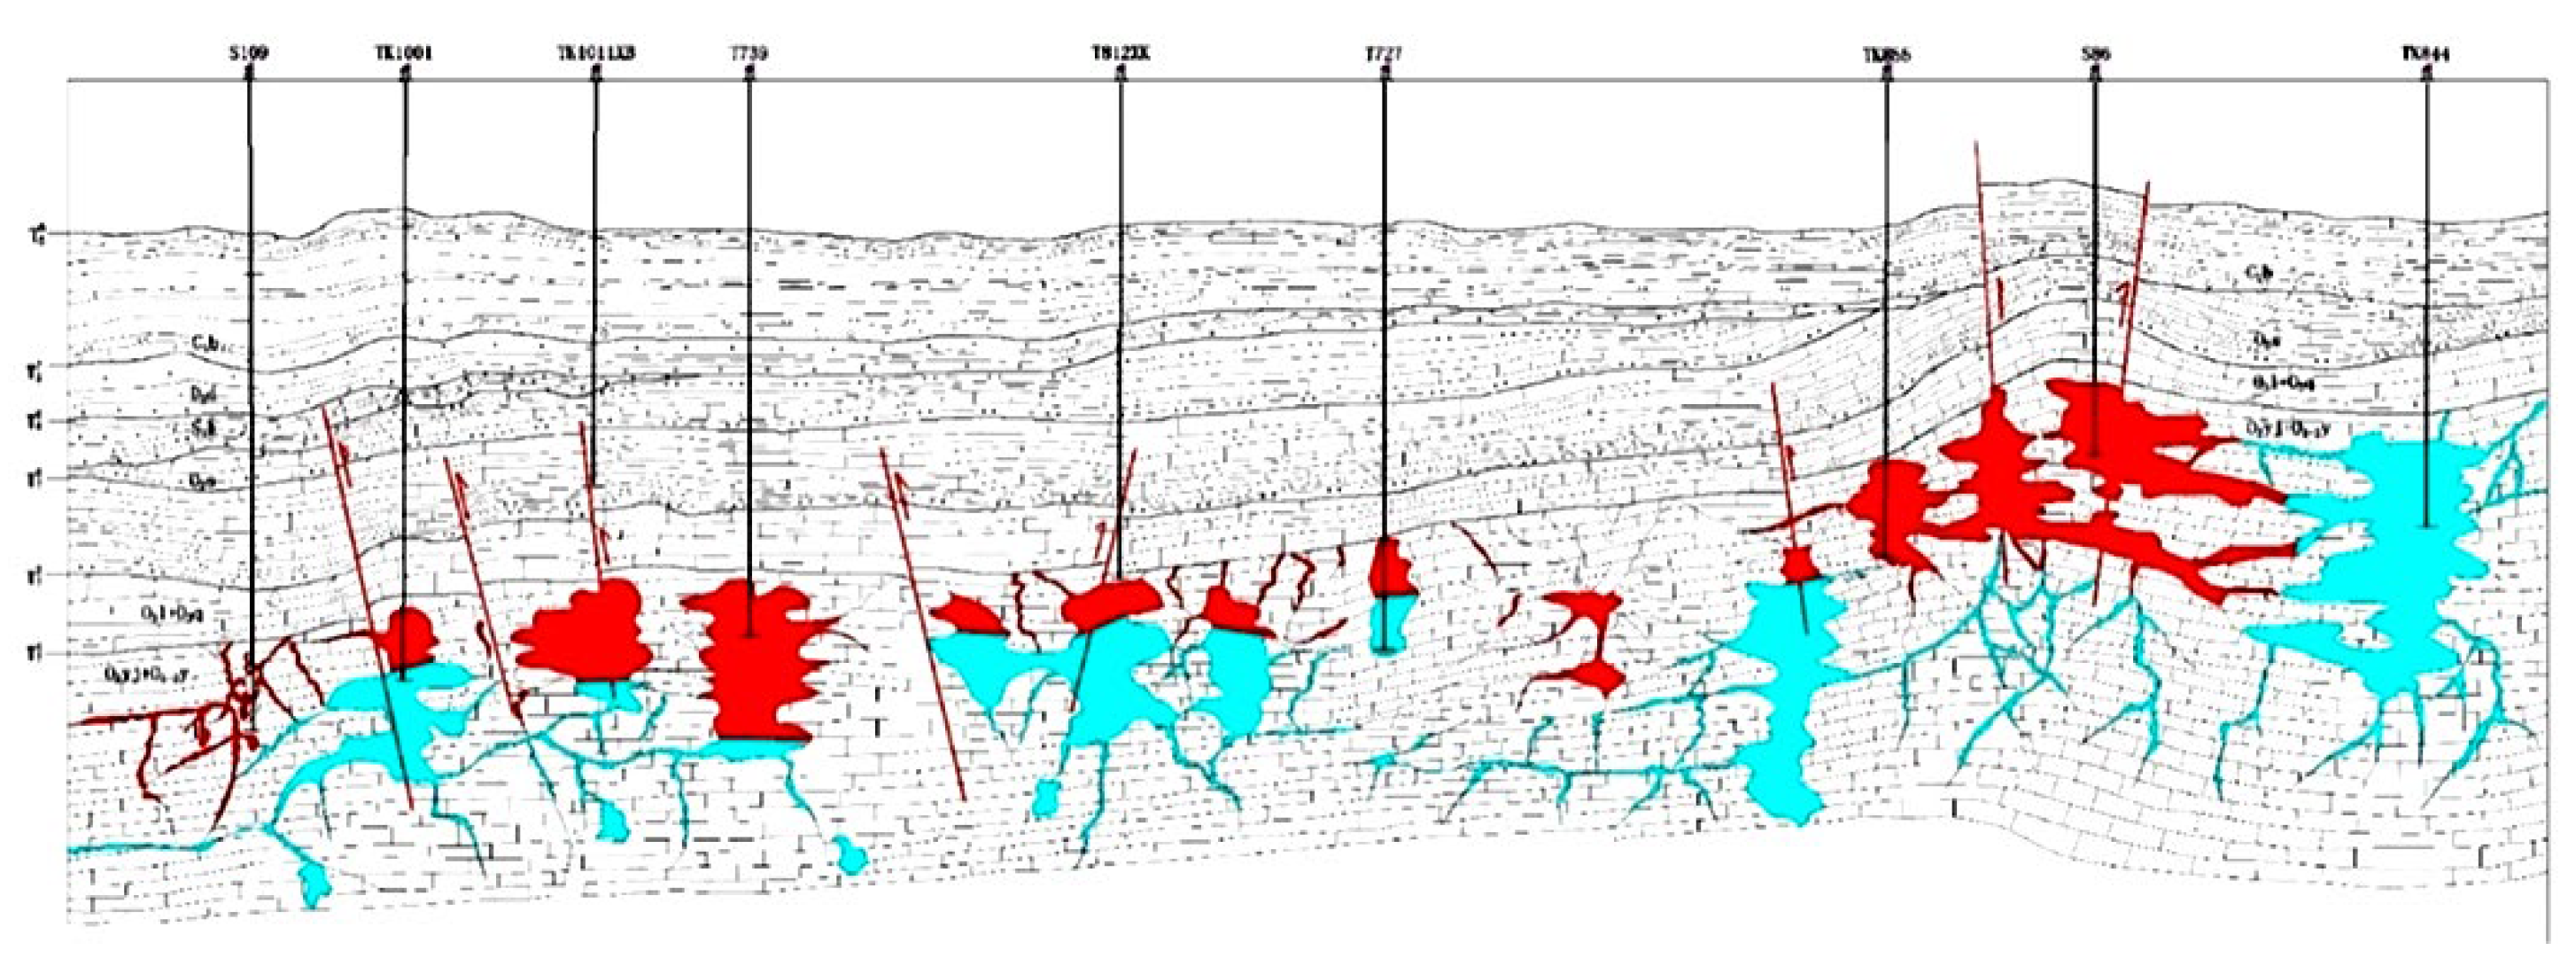
17] are mainly composed of fractures formed by tectonic deformation and pores, fractures and caverns formed by karst processes, among which large caverns are the most important reservoir Spaces. The structure of the fractured cave unit is shown in
Figure 1.
Since the breakthrough of nitrogen injection extraction technology in Tahe Oilfield in 2012, nitrogen injection production has become an important technology to increase and stabilize production after water injection development in fracture-cavity reservoirs. However, due to the heterogeneity of the reservoir and the high mobility of the gas fluid, gas channeling is easy to occur after nitrogen injection into the reservoir, and the gas extraction response time is short, so the oil and gas produced by the oil well is relatively high. The gas injection production curve is shown in
Figure 2. The foam fluid has the characteristics of high viscosity, mobility control, and strong migration ability, which can realize the selective plugging of "high plugging but not low plugging", and can be used to assist gas drive to improve the recovery efficiency of surface karst fracture-cavity reservoir. However, the technology of foam assisted gas drive control in fracture-cavity reservoir has not been reported, so it is necessary to carry out experiments to clarify the injection technology and mechanism. Therefore, a visualization model was designed and prepared for foam-assisted gas drive injection parameter optimization study.
2. Materials and Methods
2.1.2 D Visualization Model of Seam-Hole Assemblies
The reservoir depth is 5300~7000m; the formation temperature is 120~150℃; the total mineralisation of formation water is 22x104mg/L; the reservoir space is dominated by dissolution holes and cracks; the oil-water relationship is extremely complex, with no uniform interface.The average porosity of the reservoir reservoir space is 0.76 per cent and the average permeability is 2.59 × 10⁻³ μm 2
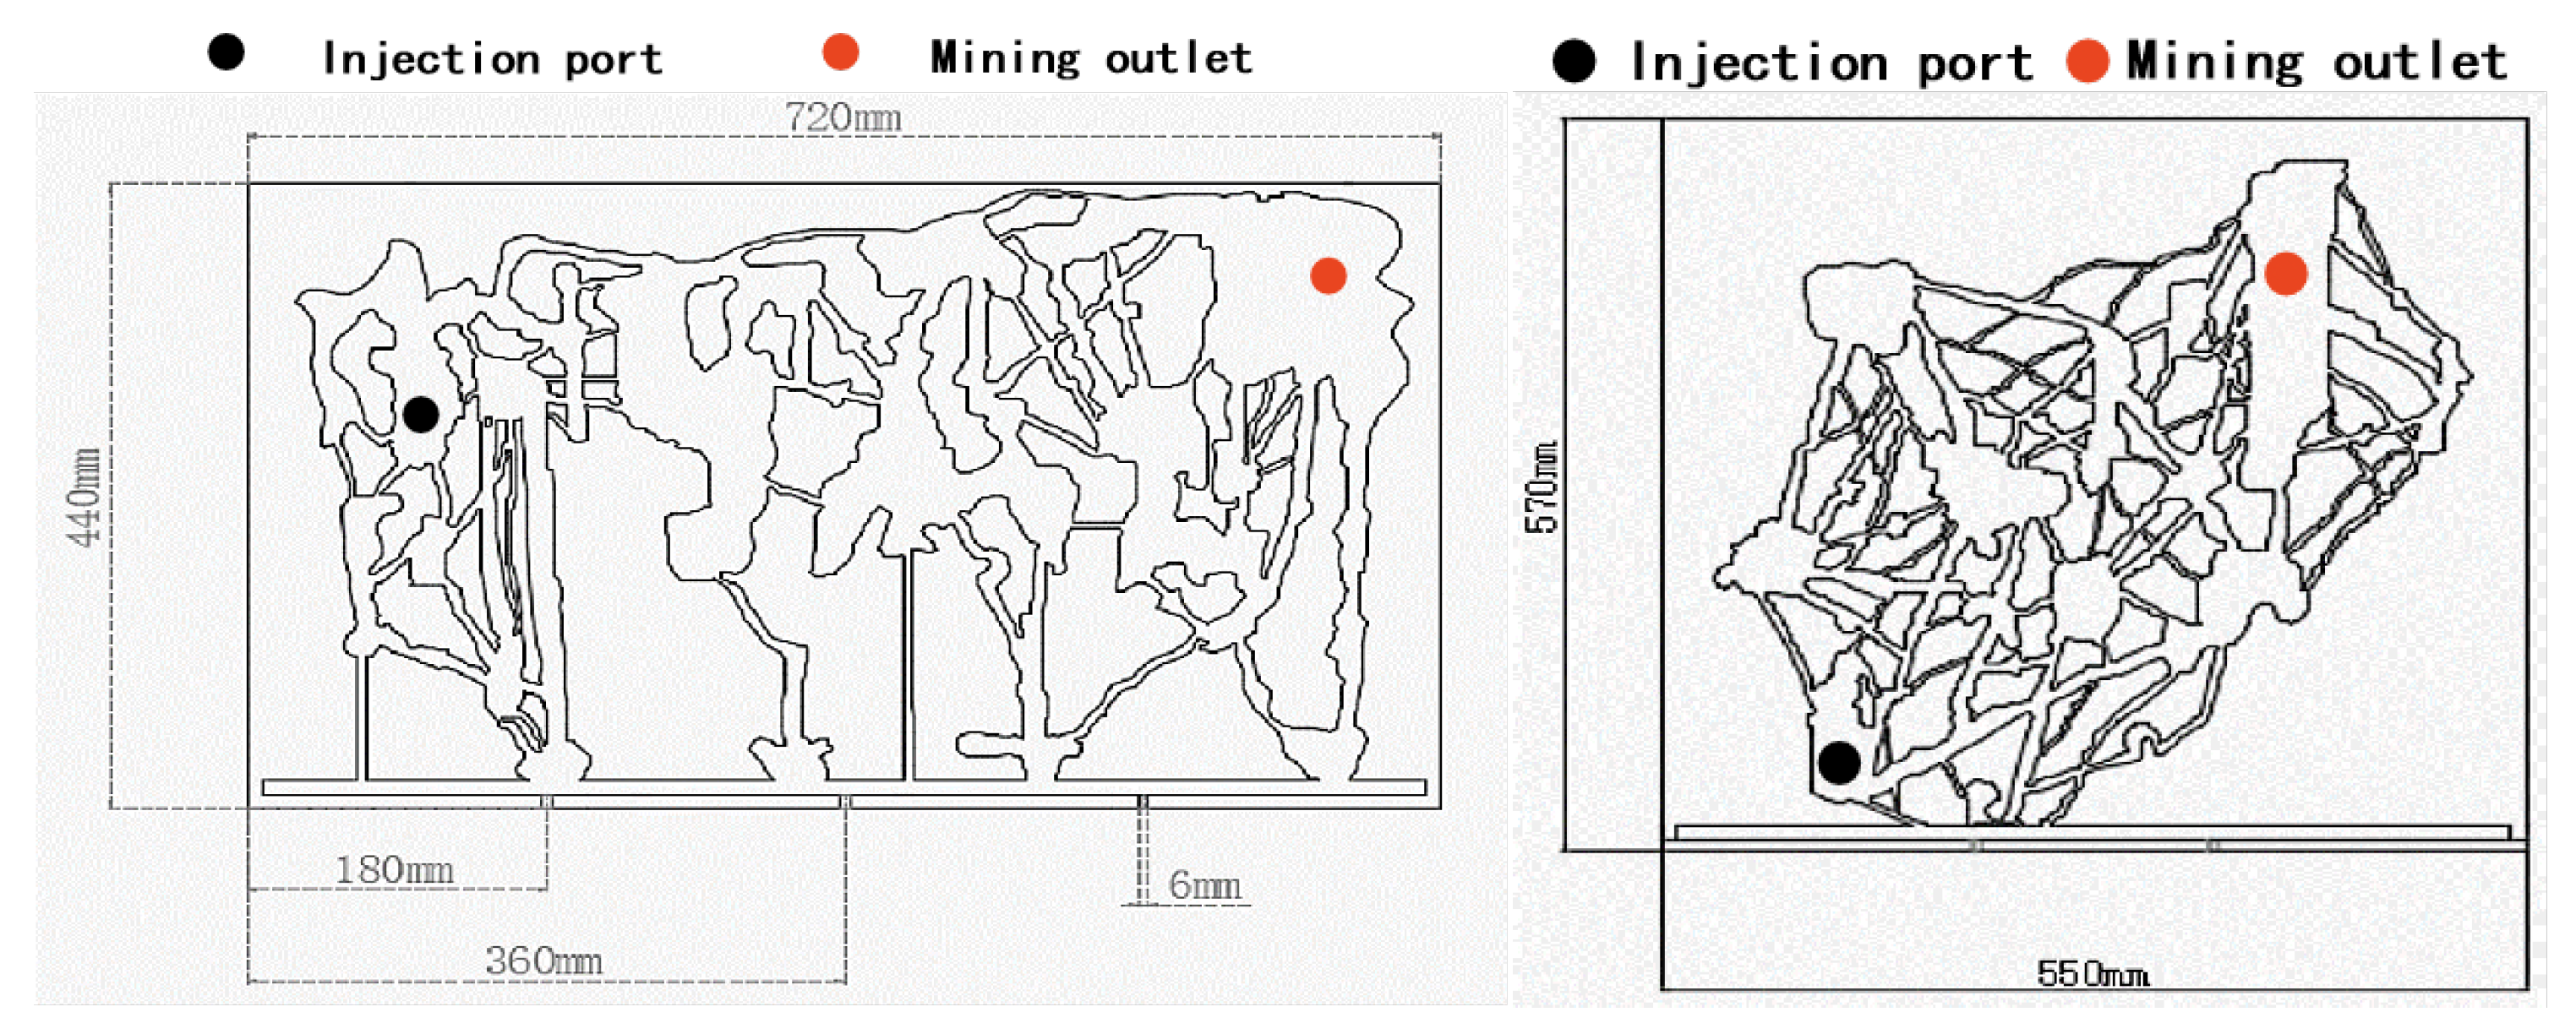
With reference to the typical suture-hole combination pattern of the tabular karst zone in the Tahe Oilfield, a two-dimensional visualized tabular karst model was designed and produced, as shown in
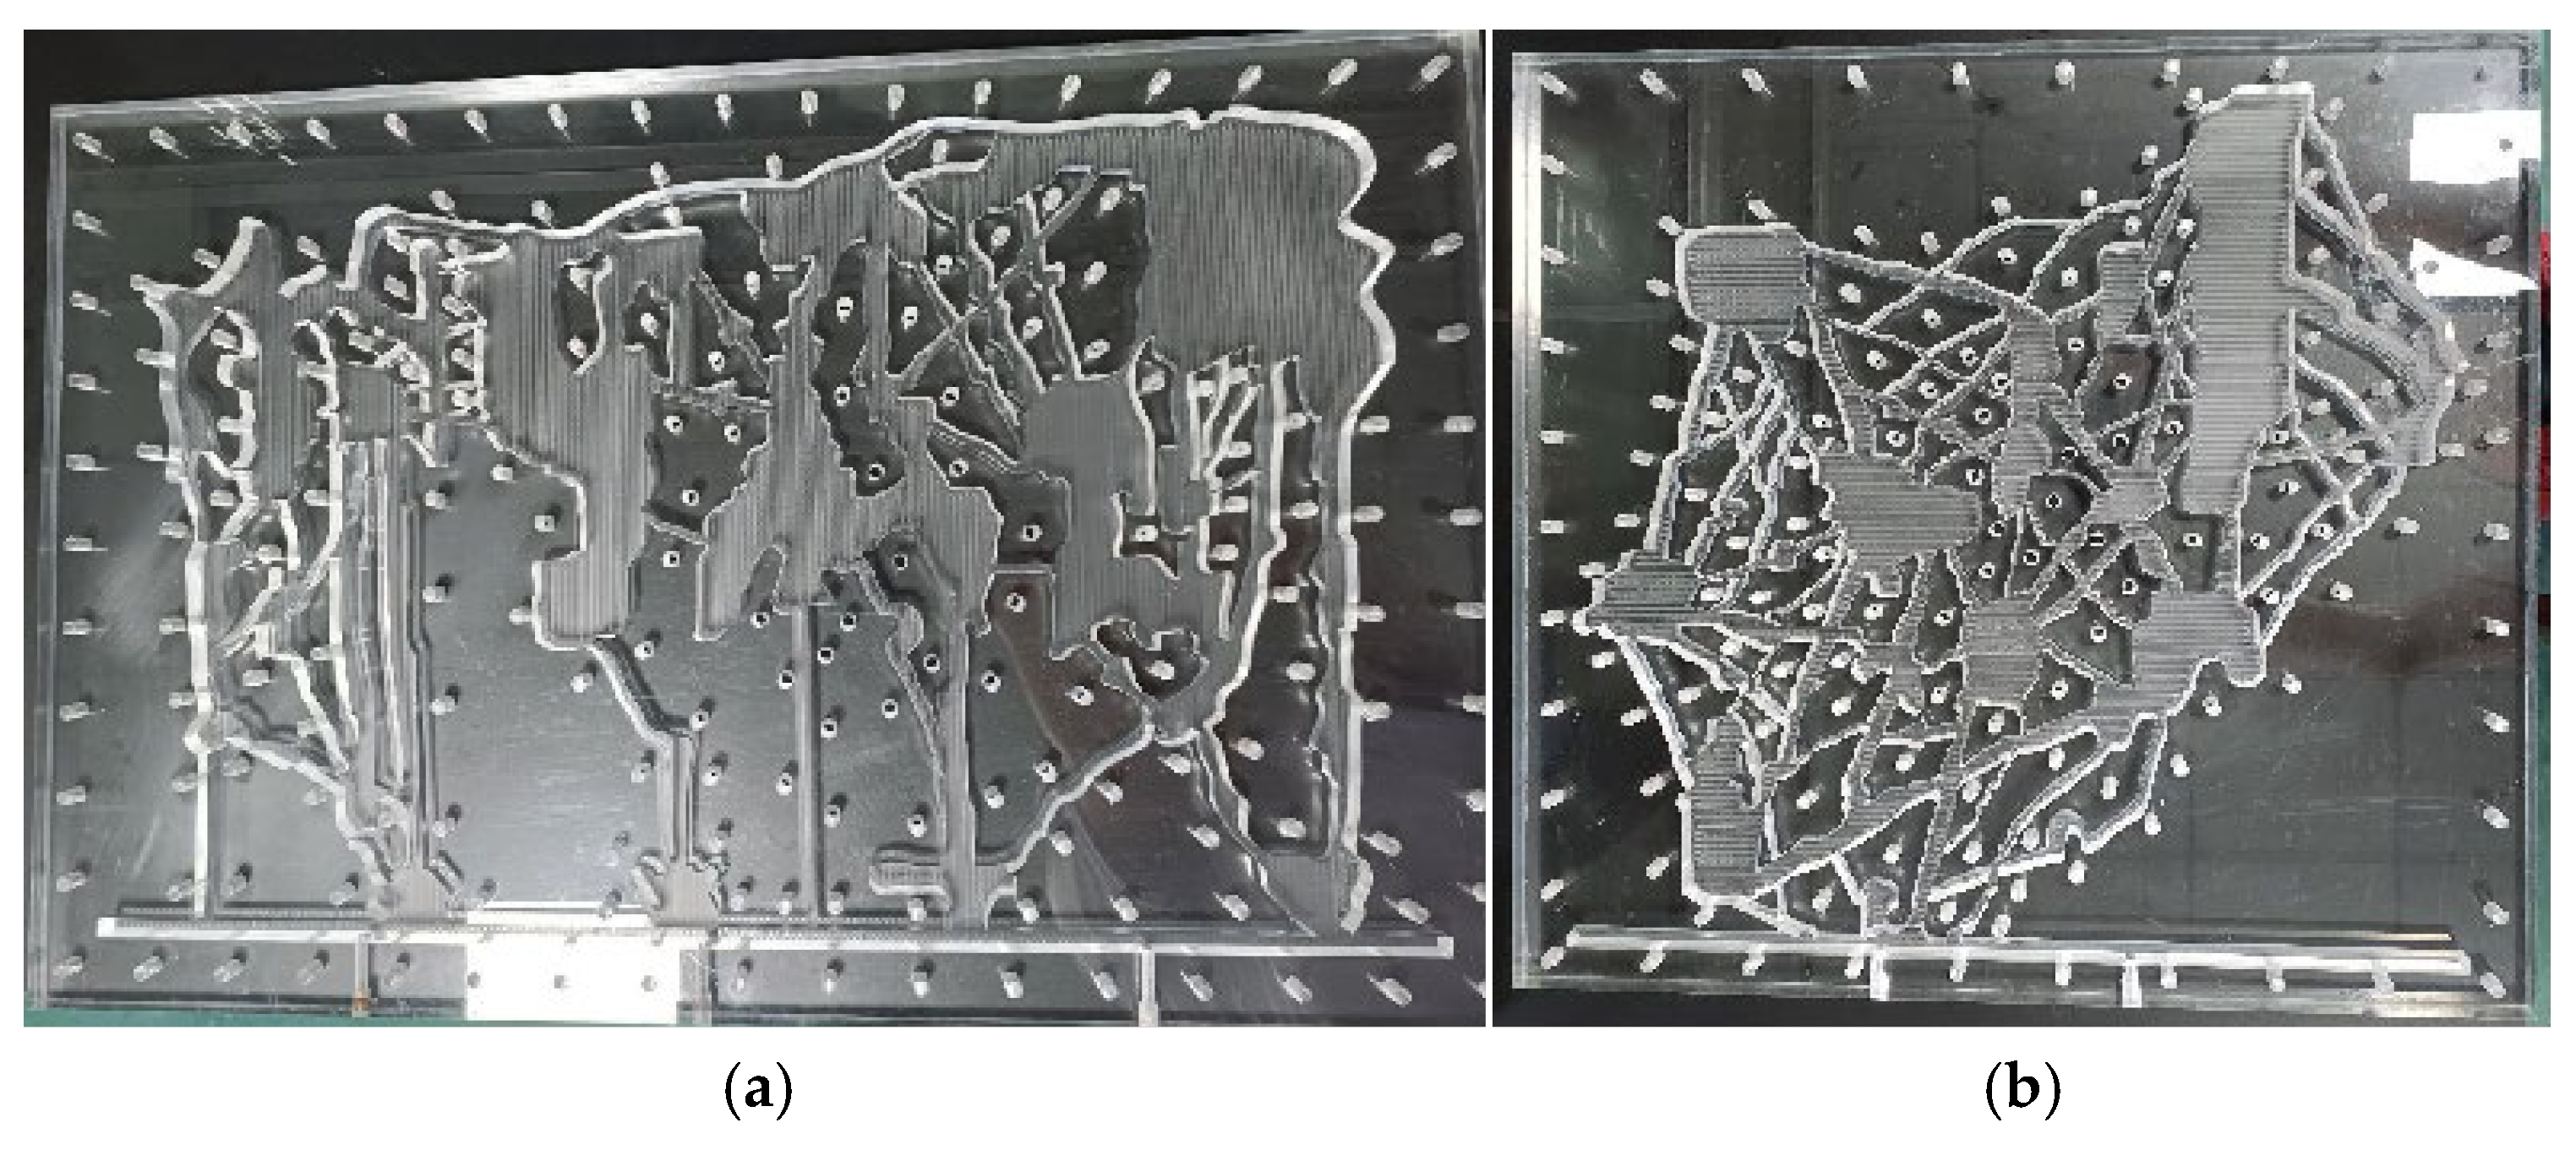
Figure 3. The crack opening in the model is 0.5~2 mm, the overall size of the vertical model is 720×440 mm, with a total volume of 1300 ml, and the overall size of the horizontal model is 550×570 mm, with a total volume of 880 ml. The model is made of alexandrite plate, which is divided into two parts of the etching plate as well as the sealing plate. As shown in
Figure 4.
2.2. Experimental Setup and Methods
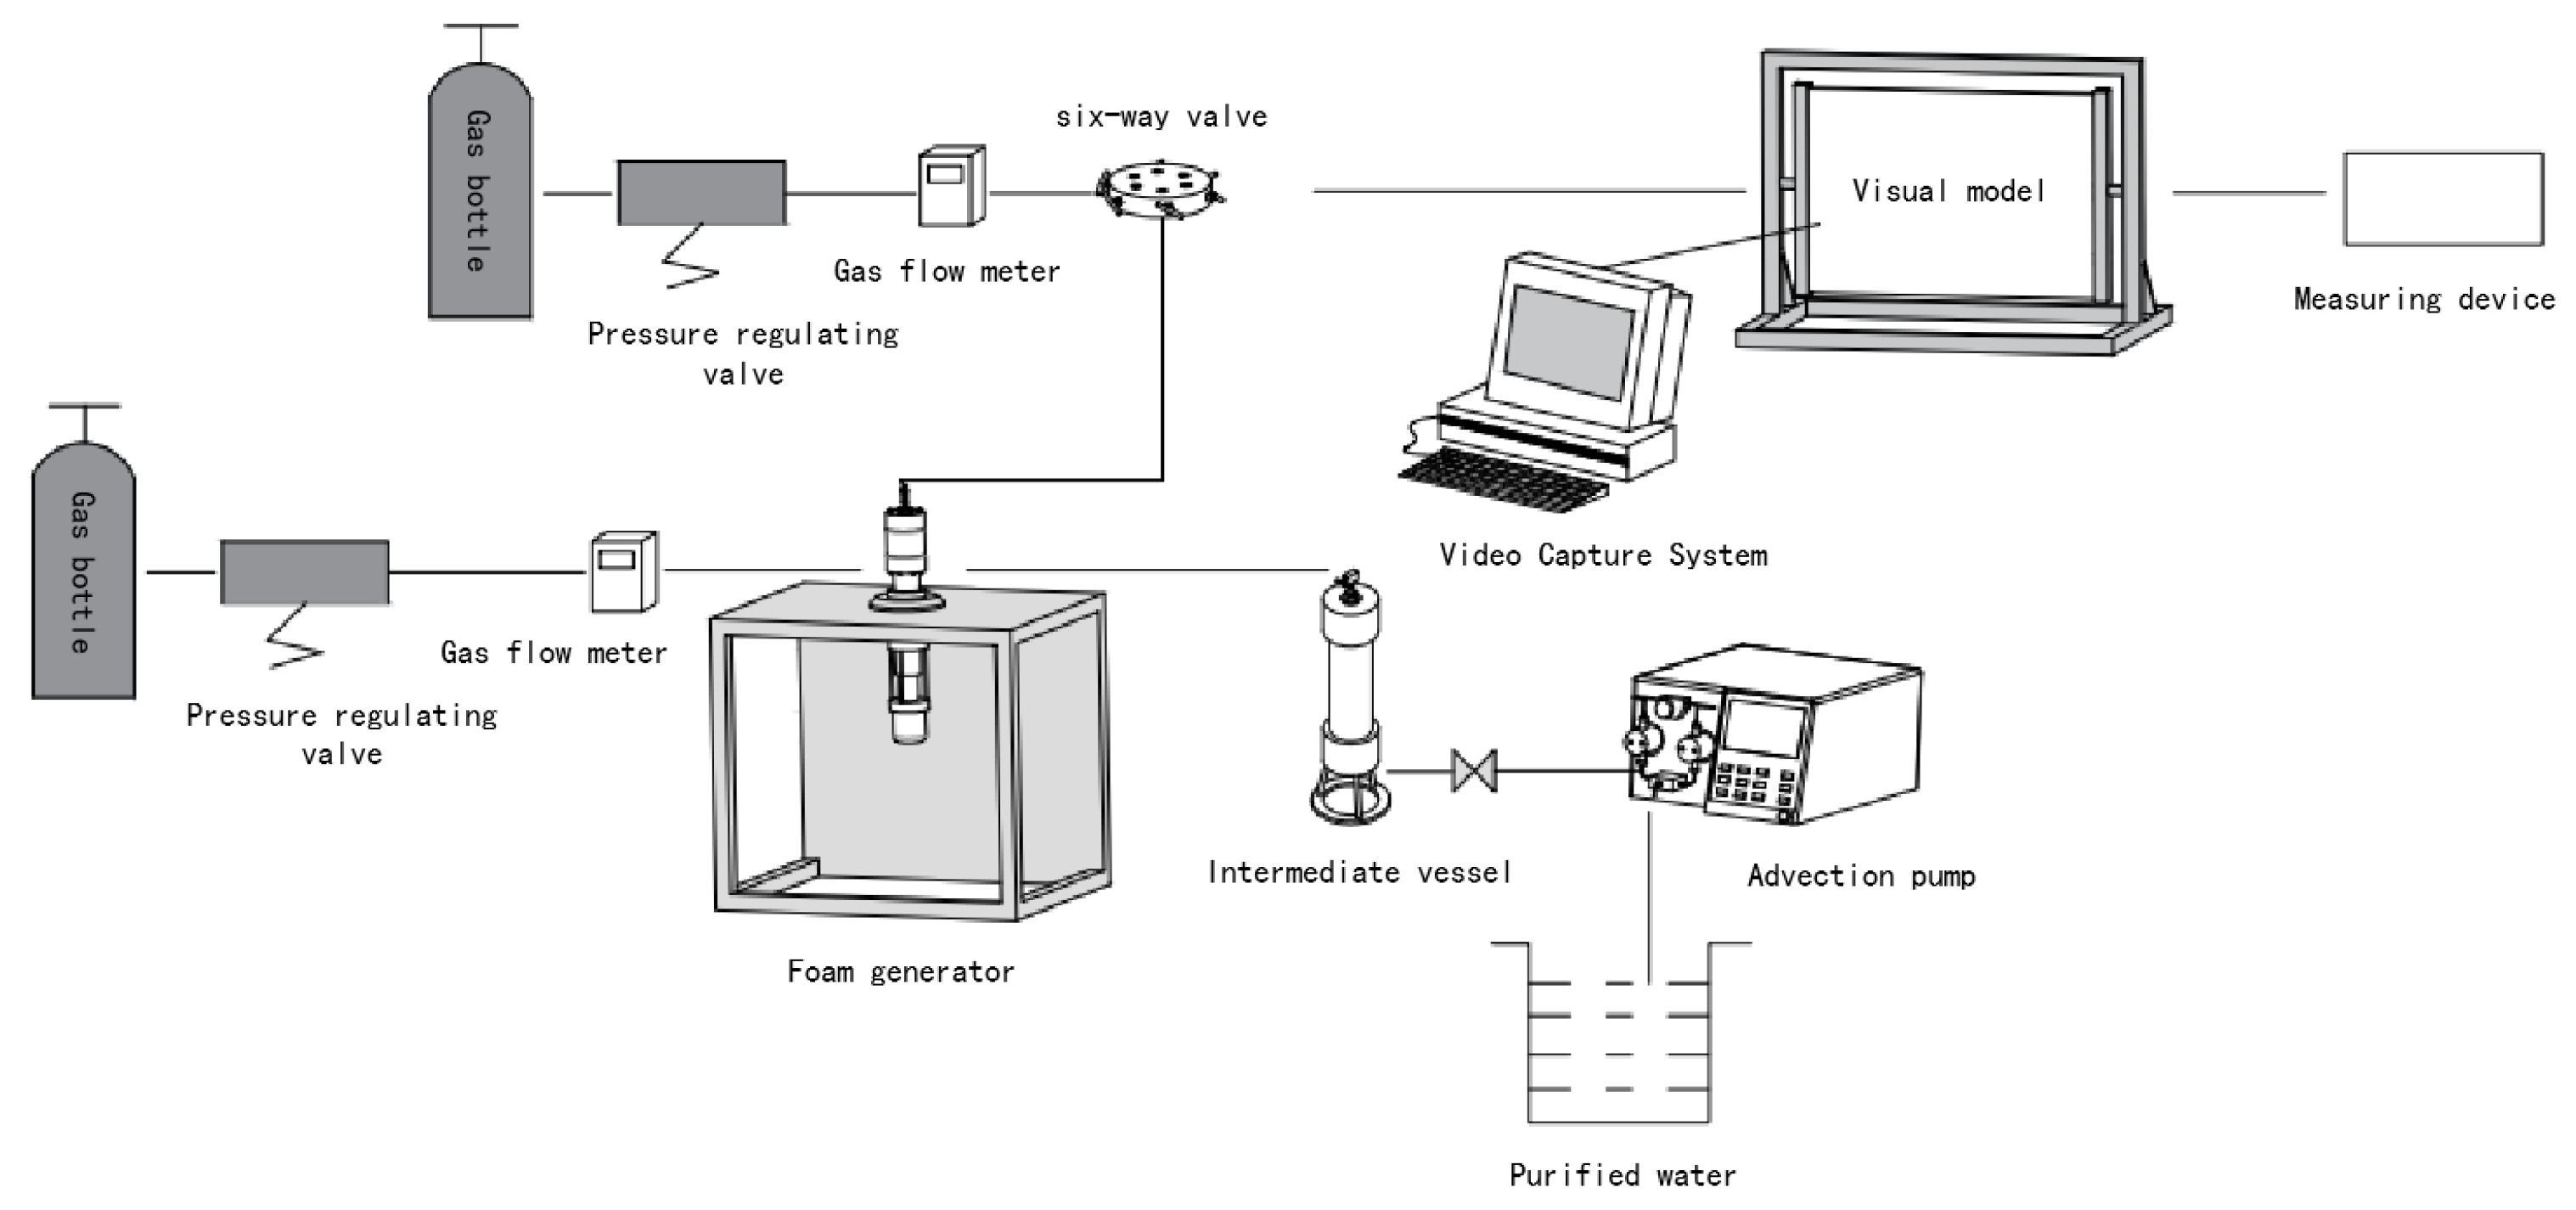
Experimental setup: Visualization experimental device. The experimental setup consists of three parts, namely the seam hole visualization physical model system, the foaming and injection system, and the video monitoring and data acquisition system. The physical modeling system consists of a model holder and an experimental model. The model holder is made of welded stainless steel with a retractable base to accommodate different sizes, and fixed steel clips are installed on both sides of the holder to secure the model. The foaming and injection system consists of a foam generator, a constant speed and pressure advection pump, an intermediate container, and a number of valves and pipelines. The minimum injection volume of the advection pump is 0.01 ml/min, and the maximum injection volume is 9.99 ml/min. The intermediate container is a high-pressure resistant container with a maximum pressure of 50 MPa. The experimental flow chart is shown in
Figure 5.
Experimental methods: The water used for the experimental visualization of the slit holes was homemade formation water, with a total mineralization of about 22×104 mg/L and calcium and magnesium particles of 1×10⁴ mg/L, which was a highly mineralized CaCl2-type formation water, and was stained with methyl blue stain; the oil used for the experiments was stained with Sudan Ⅲ reagent. The injection method was 1 injection and 1 extraction. The experimental temperature was 25℃. The experimental data measurement was mainly focused on the measurement of oil repellent volume. The experimental foam was generated by a foam generator with N2, foaming agent, foam stabilizer and formation water.
2.3. Experimental Steps and Program
Experimental steps: ① Assemble the model as required and check the sealing of the model, confirm the sealing and then saturate the oil and water with the stained experimental water as well as the experimental oil and record the volume of saturated oil and water respectively;②The saturated model is placed on the mold gripper for fixation and the pipe connections are made according to the scheme;③Open the gas cylinder, measure the gas flow rate, after reaching the predetermined injection flow rate to carry out a gas drive experiment, record the volume of oil extracted from the extraction outlet, until the extraction outlet out of gas and no oil that is the end of a gas drive;④The configured foaming solution was placed in an intermediate container and sent to the foam generator via an advection pump for foaming, and the corresponding amount of foam was injected into the model according to the experimental program for assisted gas drive, and the volume of oil recovered at the extraction point was recorded;⑤Open the gas cylinder, measure the gas flow rate, after reaching the predetermined injection flow rate to carry out the second gas drive, record the volume of oil extracted from the extraction outlet, until the gas tampering, end of the experiment.
3. Foam-Assisted Gas Drive Mechanism
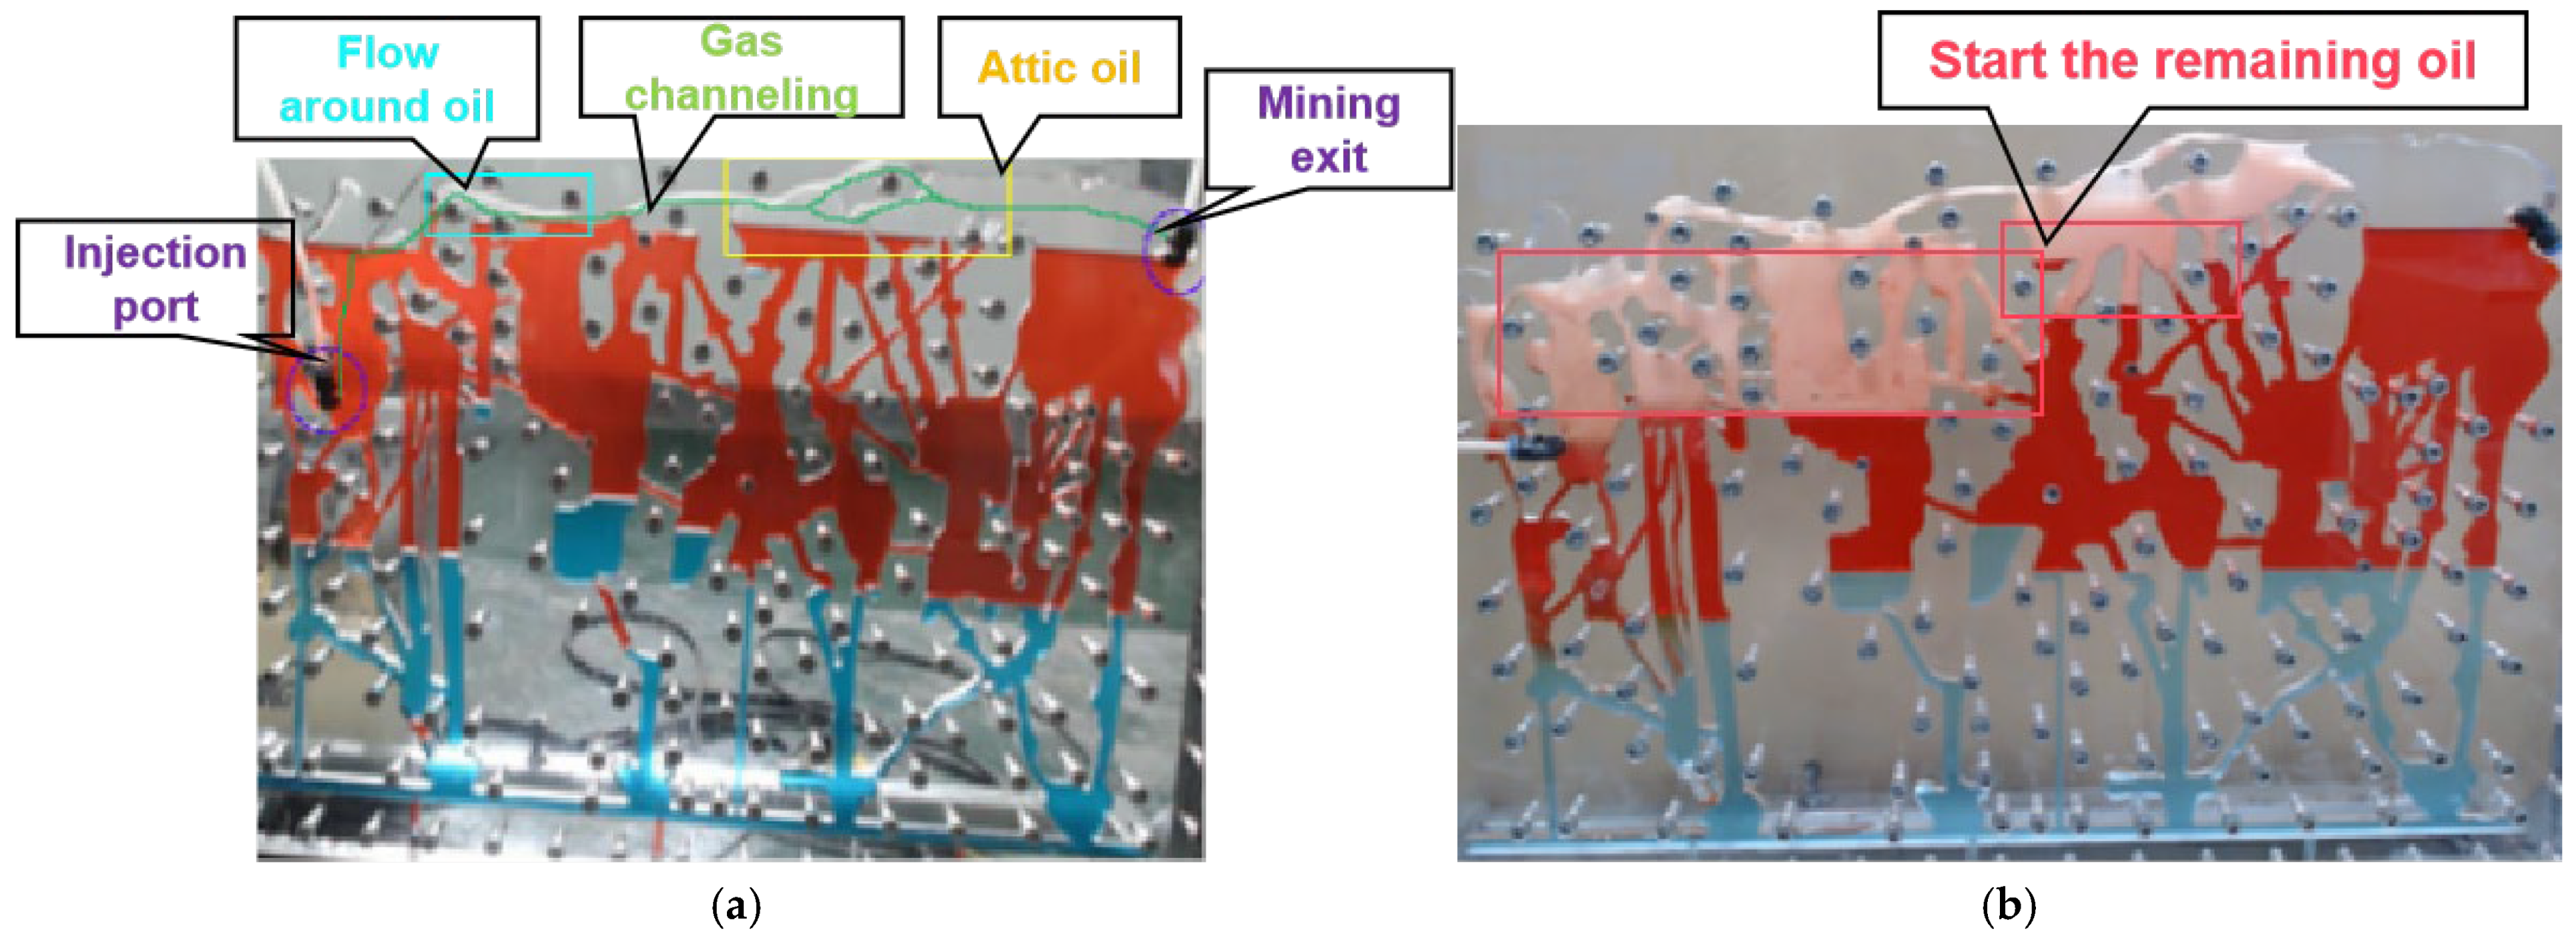
(1) Gravity differentiation, vertical distribution. In the longitudinal model, nitrogen is injected to drive out the oil, and the gas, due to the density difference, is transported to the high part of the structure to form the “gas roof” under the effect of gravity differentiation, replacing the “attic oil” in the high part of the structure; at the same time, under the influence of the large difference in gas-liquid flow, the gas-oil-water distribution of the fluid medium from the high part to the low part of the model is “gas-oil-water”. At the same time, under the influence of large differences in gas-liquid flow, part of the “bypass oil” is driven out, and the model fluid medium is distributed as “gas-oil-water” from the high part to the low part. As shown in
Figure 6(a). After gas flurry, foam is injected to assist gas drive, and under the action of density difference, the foam is transported to the middle part of the structure along the crack, and under the action of pressure cone, the auxiliary nitrogen gas drives out the unused residual oil in the middle part of the structure, and the modeled fluid medium is distributed as "gas-foam-oil-water” from the high part to the low part. As shown in
Figure 6(b).
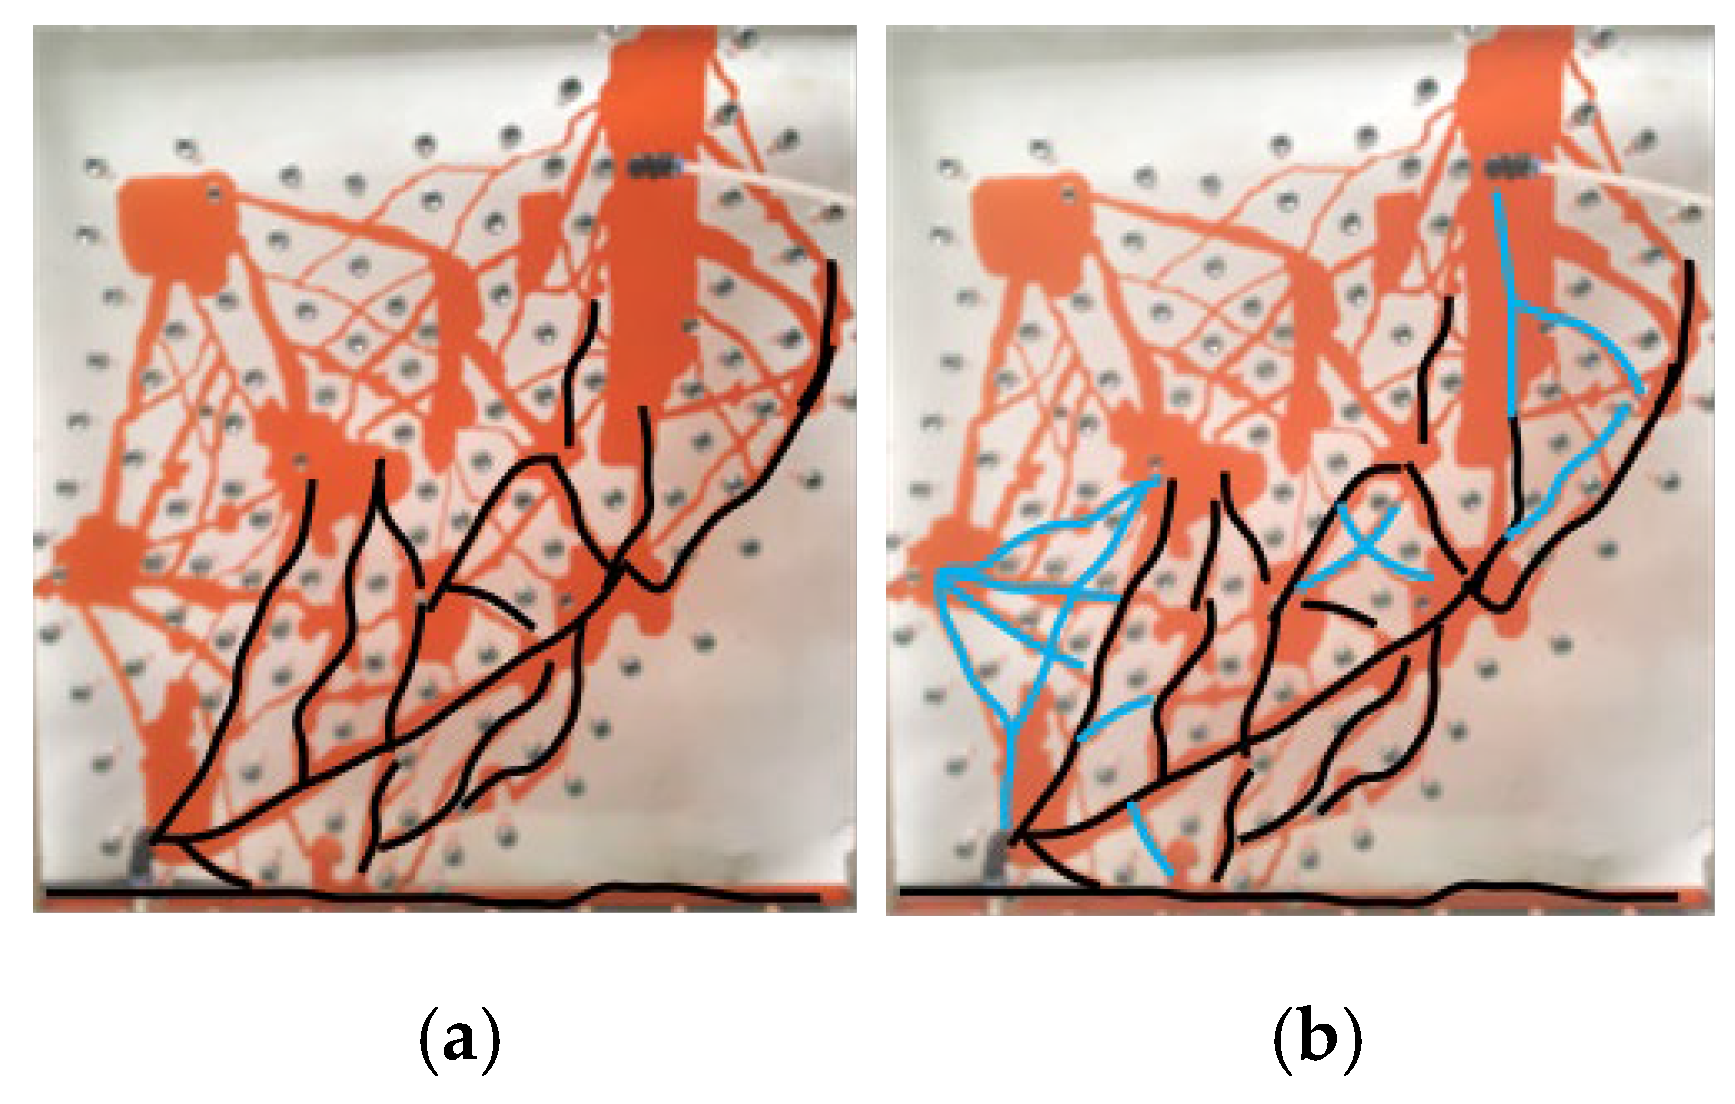
(2) Gas extrusion, fracture selection. In the horizontal model, nitrogen is injected to drive out the oil, and the gas is transported deep into the model under the action of pressure, playing the role of extrusion and driving out the remaining oil in the surface layer of the model. When the gas is transported, following the principle of minimum resistance, it is prioritized to enter the cracks with large openness to drive out the remaining oil in the surface layer (Figure. 7a); with the increase of the injection volume, it gradually enters the cracks with small openness and small tortuosity to drive out the remaining oil in the surface layer, and then the gas forms the dominant channel, and the gas flurry occurs (
Figure 7b).
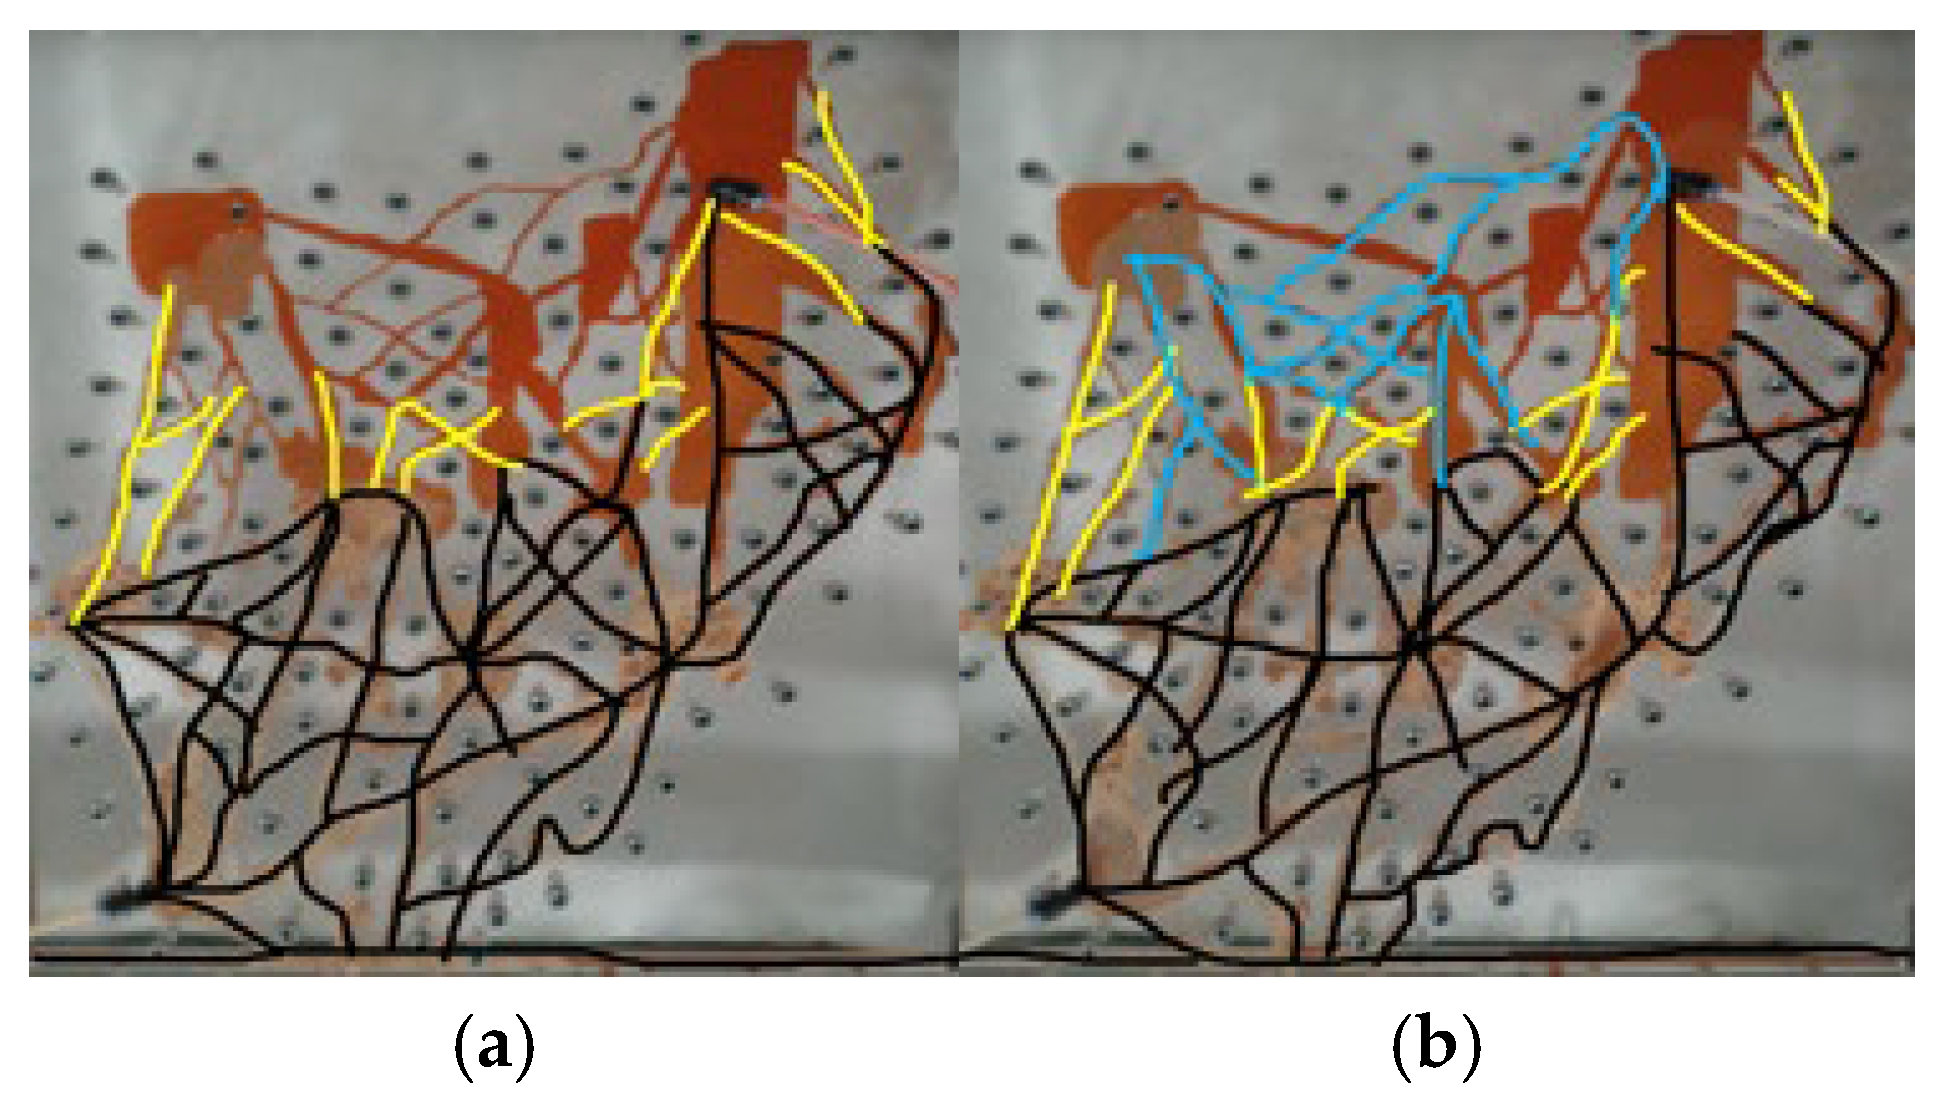
(3) Jamin effect, gas steering. In the horizontal model, after the gas scavenging, foam is injected to assist the gas drive. After foam injection, the gas is transported to the deeper part of the model, expanding the reach of the gas and displacing the remaining oil in the model (yellow line in Figure. 8a). At the same time, due to the Jamin effect of the foam, the pore throats of the large cracks are blocked, and the subsequently injected gas is steered to enter the large tortuosity and small cracks to displace the remaining oil in them (blue line in
Figure 8b).
4. Optimization of Foam Injection Parameters
4.1. Vertical Model
(1) Foam Type Optimization
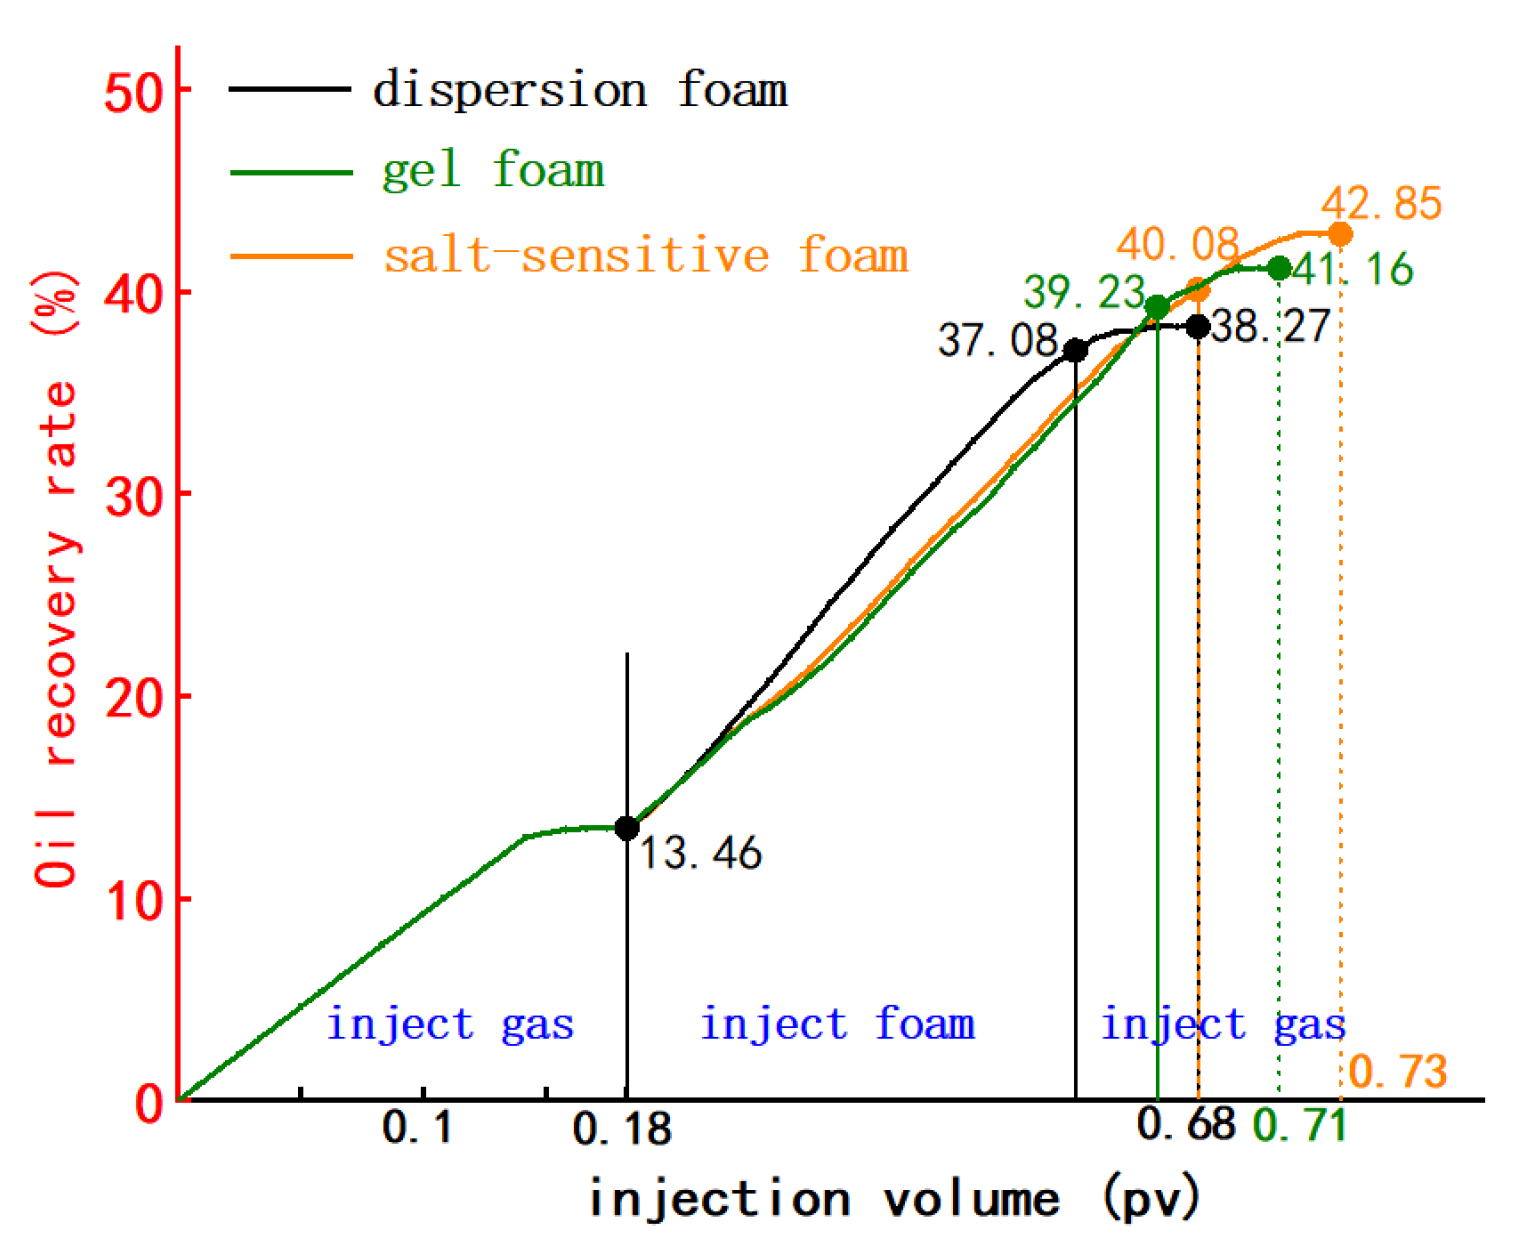
The comparison of the effect of injecting different types of foams for assisted oil drive was studied when the injection volume was 0.4 pv, the gas-liquid ratio was 3:1, and the foam was injected for assisted gas drive at the late stage of gas flushing, and the experimental results are shown in
Table 1 and
Figure 9.
The experimental results show that the recovery rate of salt sensitive foam assisted gas flooding model is the best among dispersed foam, gelatin foam and salt sensitive foam. The main reason is that compared with gelatin foam and dispersion foam, salt-sensitive foam has a longer half-life, defoaming is more difficult, and after injection into the model, the foam is more stable, and more parts of the remaining oil can be started. Therefore, the injection of salt sensitive foam assisted gas flooding provides the best economic benefits after gas cannot be enhanced.
(2) Foam injection volume optimization
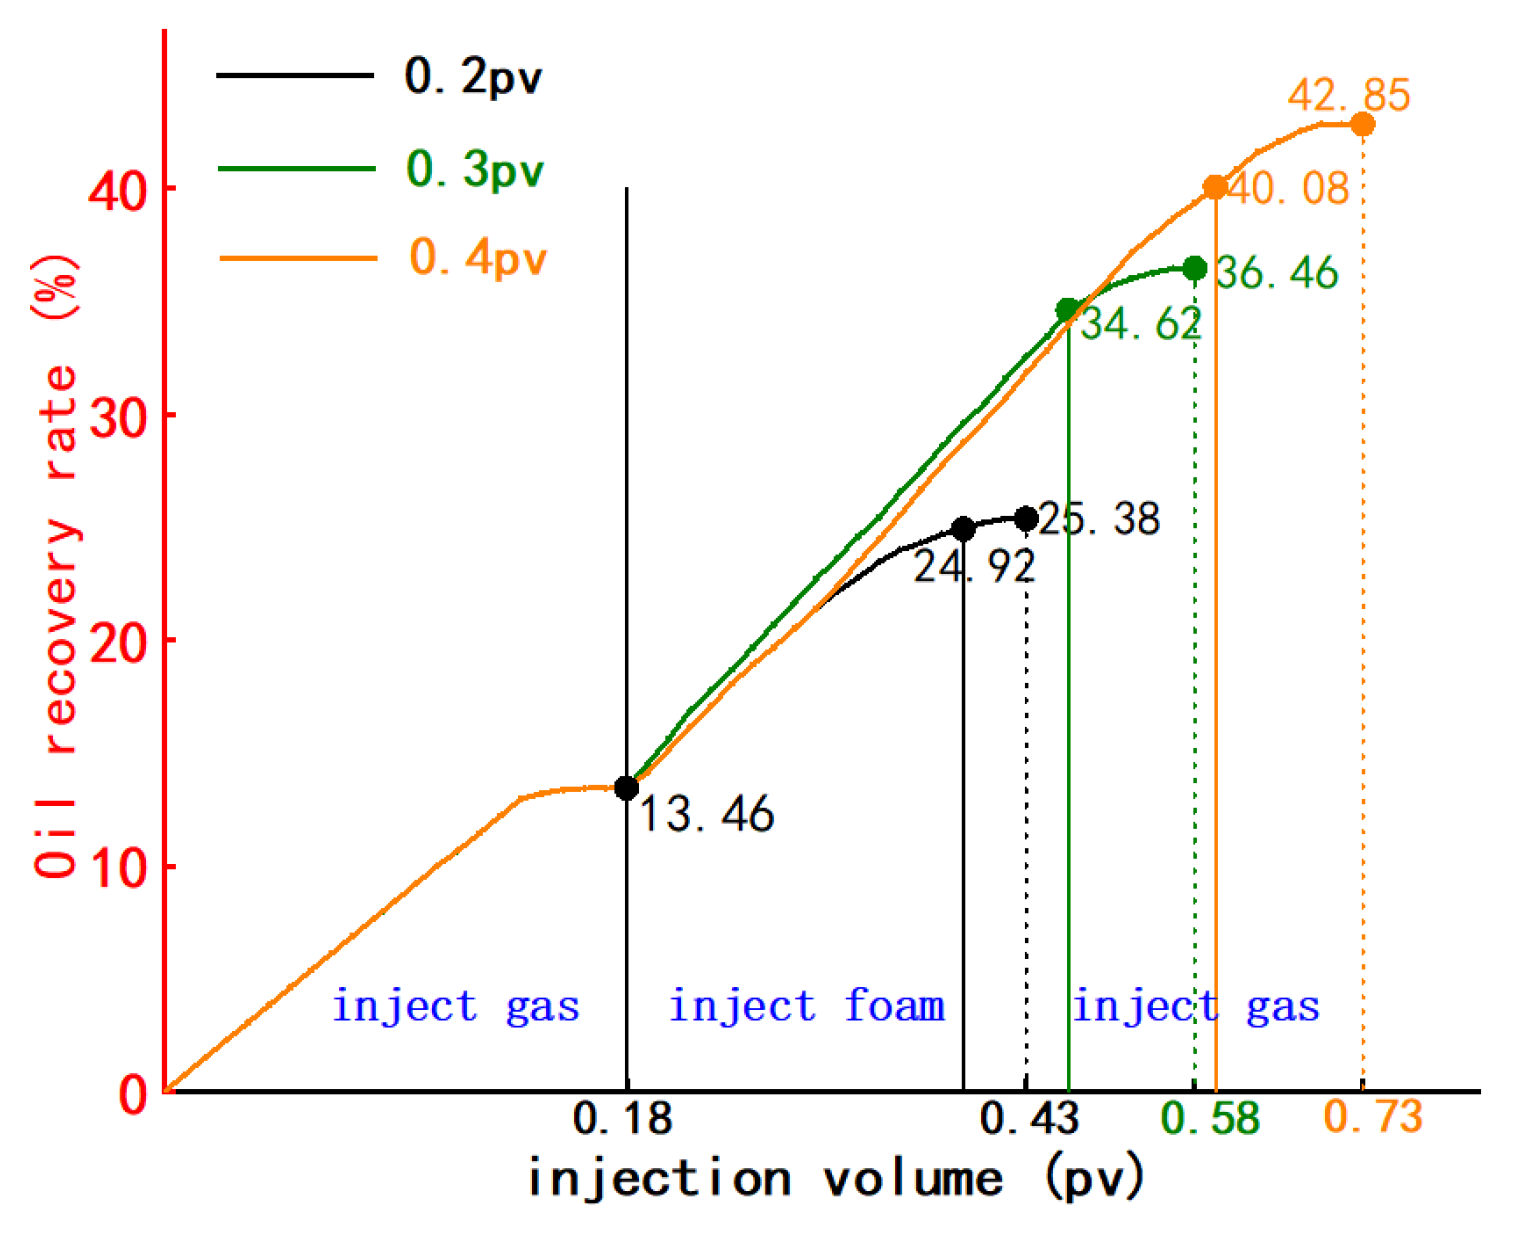
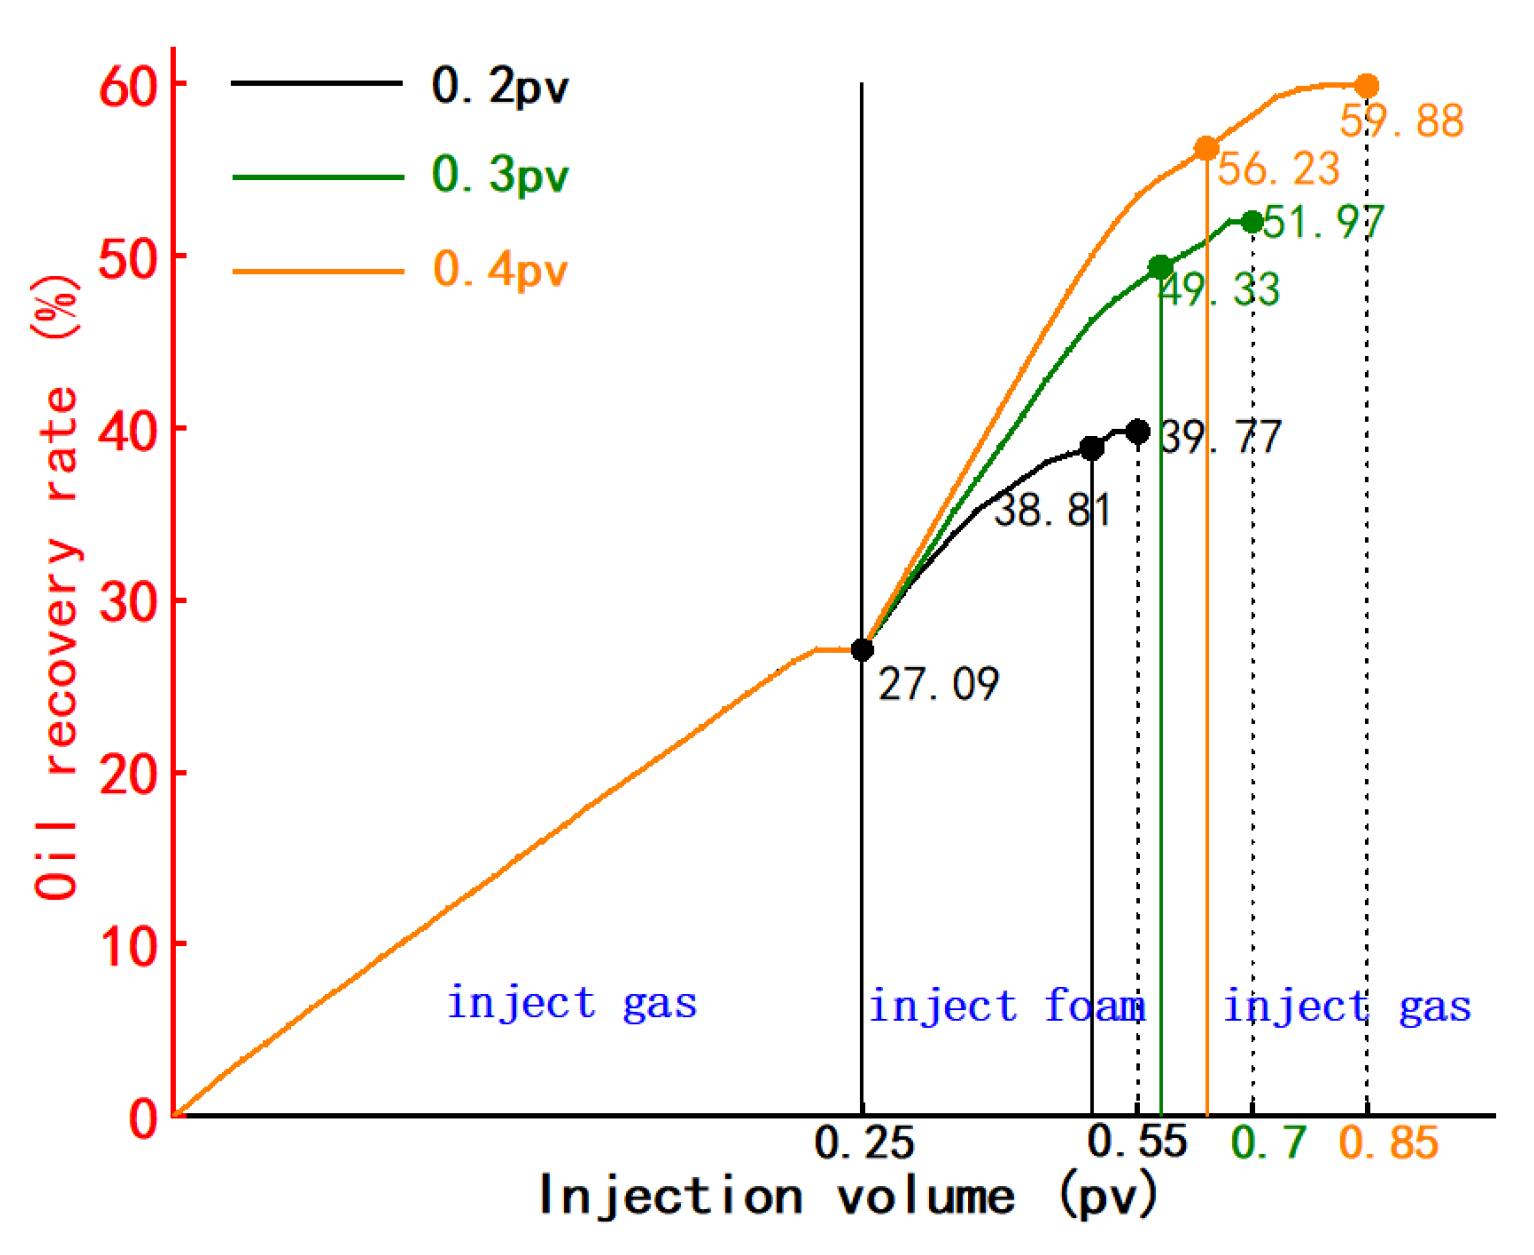
For the salt-sensitive foam, the comparison of oil repelling effect under different foam injection volume was studied when the gas-liquid ratio was 3:1 and foam-assisted gas drive was injected at the late gas flurry stage, and the experimental results are shown in
Table 2 and
Figure 10.
When 0.2pv foam is injected, the recovery range of each 0.1pv foam assisted gas is 5.73%. When 0.3pv foam is injected, the recovery range of each 0.1pv foam assisted gas is 7.05%. When 0.4pv foam was injected, the recovery range of each 0.1pv foam assisted gas displacement was 6.65%. When the foam injection rate increases from 0.2pv to 0.3pv, the recovery rate increases by 11.08%, and when the foam injection rate increases from 0.3pv to 0.4pv, the recovery rate increases by 6.39%. The increase of recovery rate decreased.
According to the mean and range analysis, the optimal foam injection amount is between 0.3pv and 0.4pv. The optimized injection volume was 0.3pv.
(3) Foam gas-liquid ratio optimization
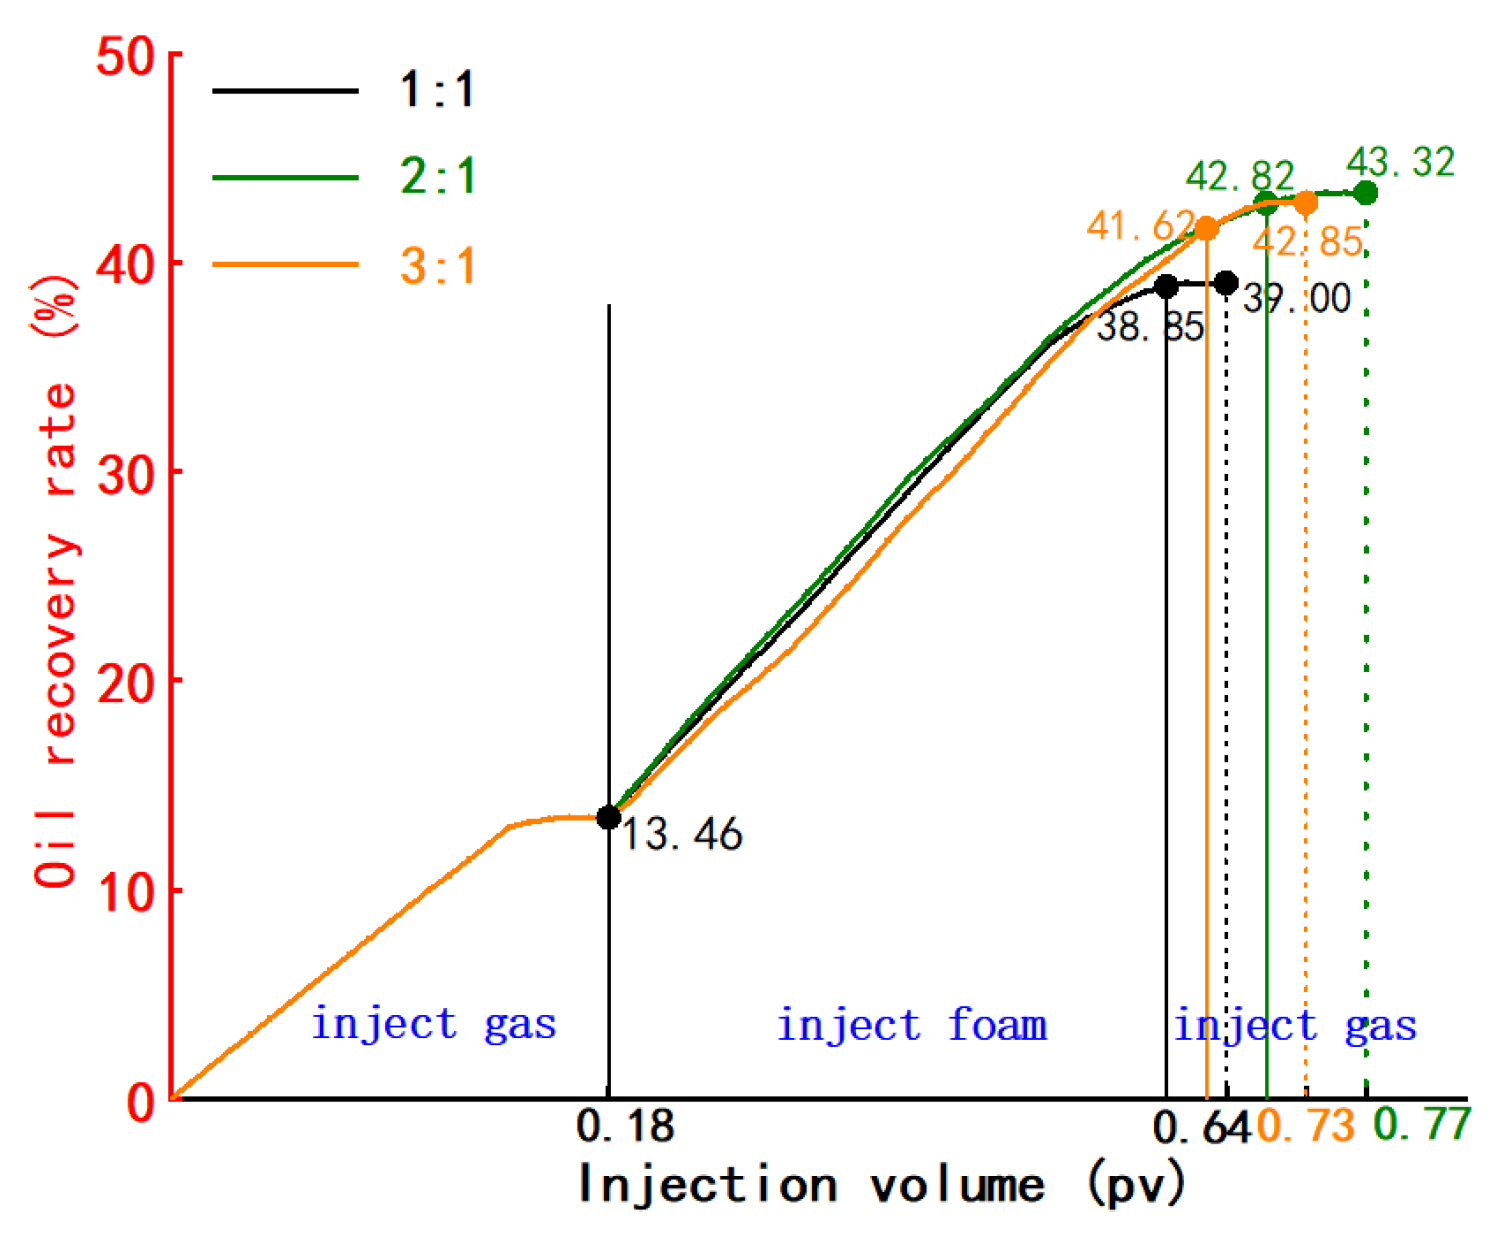
For the salt-sensitive foam, the comparison of oil repelling effect under different gas-liquid ratios was investigated when the injection volume was 0.4 pv and the foam-assisted gas drive was injected at the late stage of the gas flurry, and the experimental results are shown in
Table 3 and
Figure 11.
When the gas-liquid ratio of foam injection is 1:1, the foam extraction range is 6.35% for every 0.1pv. When the gas-liquid ratio of foam injection is 2:1, the foam extraction range is 7.34% for every 0.1pv. When the gas-liquid ratio of foam injection is 3:1, the foam extraction amplitude is 7.04% for every 0.1pv. When the gas-liquid ratio of foam is increased from 1:1 to 2:1, the recovery efficiency is increased by 4.32%, and when the gas-liquid ratio is increased to 3:1, the recovery efficiency is decreased by 0.47%.
According to the mean and range analysis, the foam gas-liquid ratio 2:1 is the best gas-liquid ratio, and the foam-assisted gas drive effect is the best among the three kinds of gas-liquid ratio in the experiment.
(4) Foam injection timing optimization
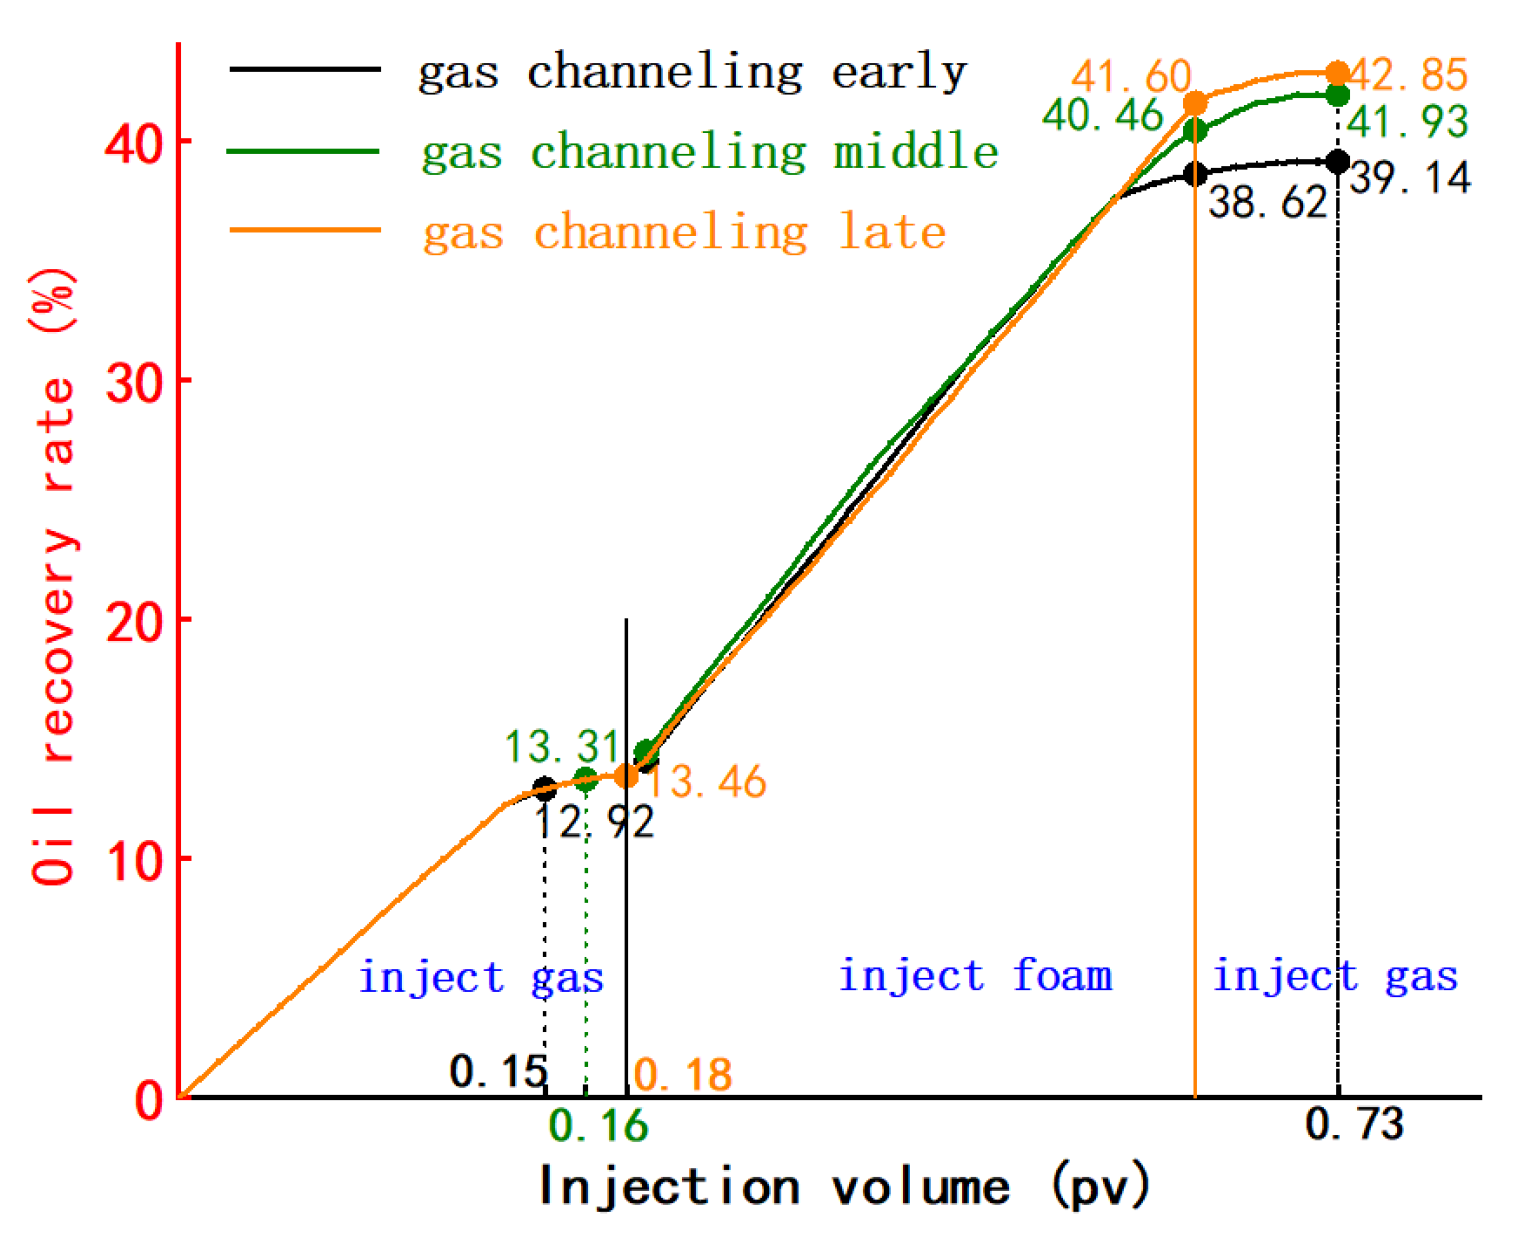
Salt-sensitive foam with 0.4 pv and a gas-liquid ratio of 3:1 was injected at the early stage, middle stage and late stage of gas flushing to assist gas flushing, and the oil repelling performance of salt-sensitive foam at different injection times was compared. The experimental results are shown in
Table 4 and
Figure 12.
When the injection time is adjusted from the initial stage of gas channeling to the middle stage of gas channeling, the recovery rate increases by 2.79%. When adjusted to the late stage of gas channeling, the recovery rate increased by 0.92%. The recovery rate of foam-assisted gas drive in the early stage of gas channeling is 0.52%, that of foam-assisted gas drive in the middle stage of gas channeling is 1.47%, and that of foam-assisted gas drive in the late stage of gas channeling is 1.25%.
Comprehensive analysis of oil recovery at range and secondary gas injection stage shows that foam injection assisted gas flooding in the middle stage of gas channeling has the best economic benefit.
4.2. Horizontal Model
(1) Foam Type Optimization
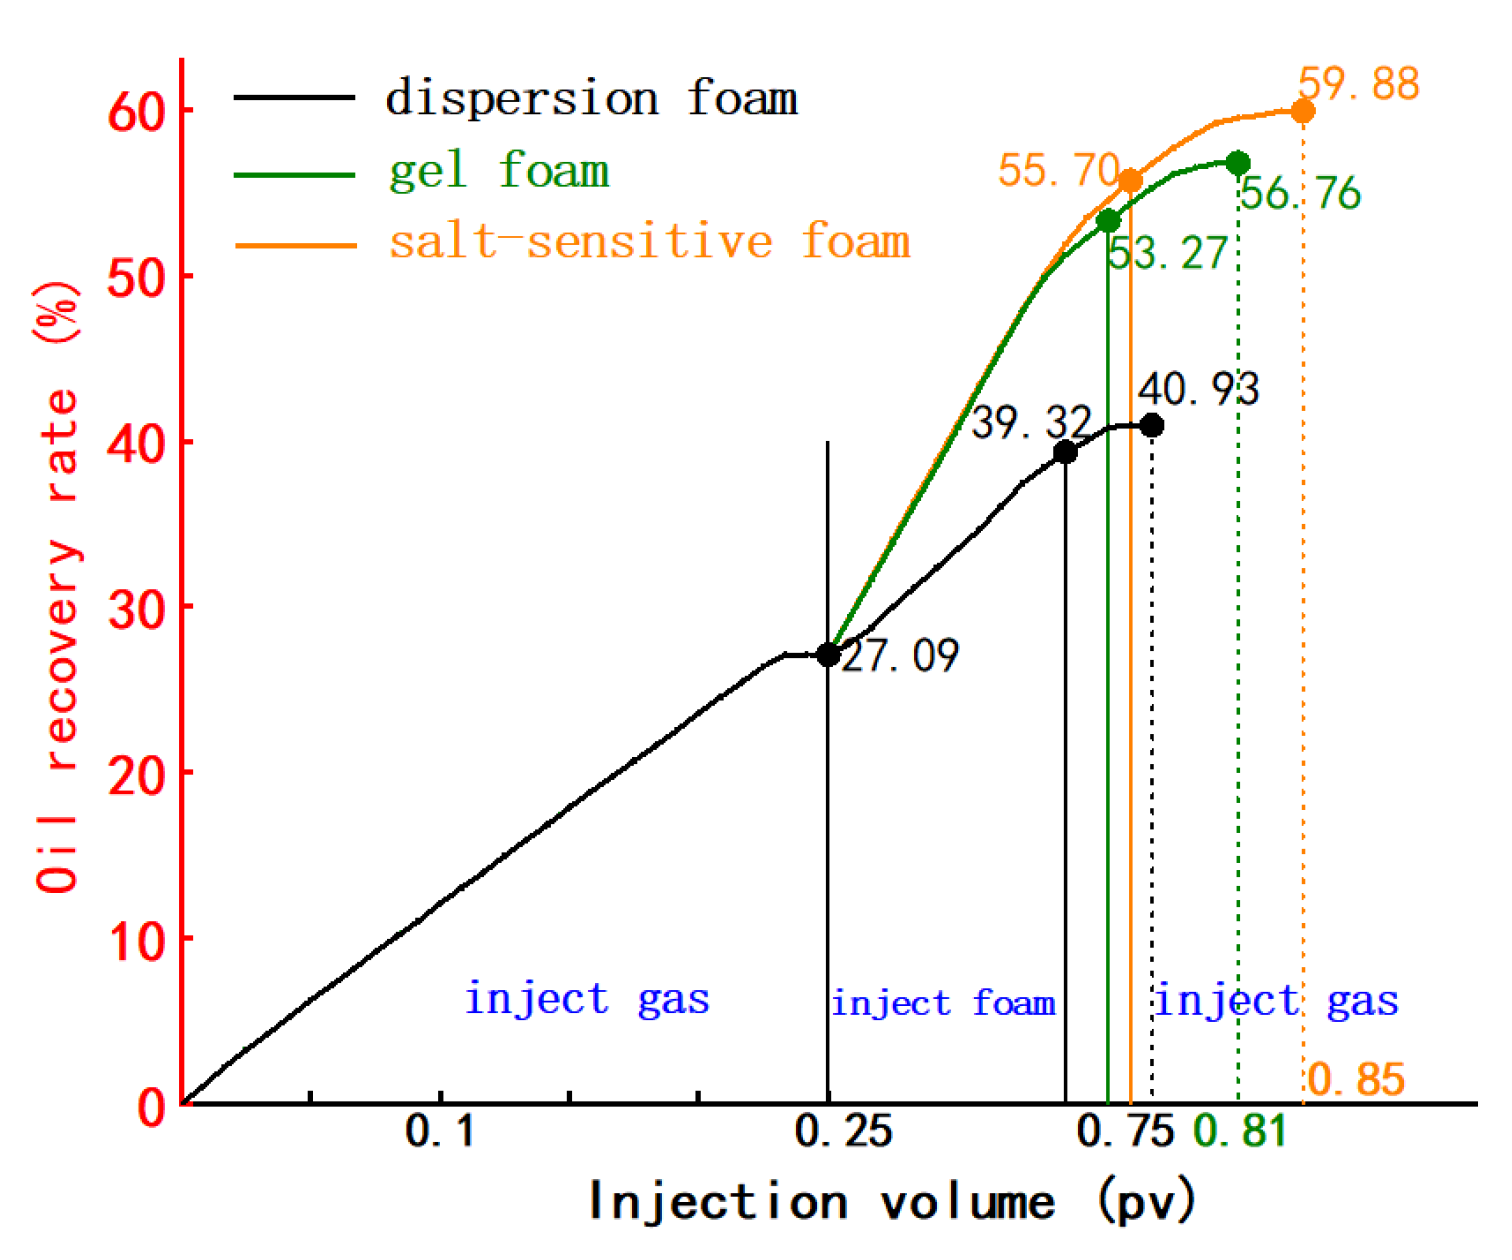
The comparison of the effect of injecting different types of foams for oil repulsion was studied when the injection volume was 0.4 pv, the gas-liquid ratio was 2:1, and foam-assisted gas drive was injected at the late stage of gas flushing, and the experimental results are shown in
Table 5, and
Figure 13.
The experimental results show that after gas flooding reaches the maximum recovery rate, injection of dispersed foam assisted gas flooding can increase the recovery rate by 13.84%. Injection of gel-foam assisted gas drive can increase the recovery rate by 29.67%. Injection of salt-sensitive foam assisted gas drive can increase the recovery rate by 32.79%. It can be seen that salt-sensitive foam has the best auxiliary benefits in auxiliary gas flooding, mainly because the flow channel plugging ability of salt-sensitive foam is stronger than that of dispersion foam and gelled foam. After injection, the effect of deep gas migration and steering is increased, and the sweep coefficient of gas is increased.
(2) Foam injection volume optimization
For the salt-sensitive foam, the comparison of oil repelling effect under different foam injection volume was studied when the gas-liquid ratio was 2:1 and foam-assisted gas drive was injected at the late gas flurry stage, and the experimental results are shown in
Table 6 and
Figure 14.
It was found that when 0.2pv foam was injected, the recovery enhancement per 0.1pv foam-assisted gas drive was 6.34%; when 0.3pv foam was injected, the recovery enhancement per 0.1pv foam-assisted gas drive was 8.3%; and when 0.4pv foam was injected, the recovery enhancement per 0.1pv foam-assisted gas drive was 8.19%. When the foam injection amount was increased from 0.2pv to 0.3pv, the recovery rate was improved by 12.2%, and when the injection amount was increased from 0.3pv to 0.4pv, the recovery rate was improved by 3.65%; the recovery rate improvement was reduced.
From the mean value as well as the extreme deviation analysis, it can be seen that there exists an economically optimal foam injection volume between 0.3pv and 0.4pv. The optimized result of injection volume was 0.3pv.
(3) Foam gas-liquid ratio optimization
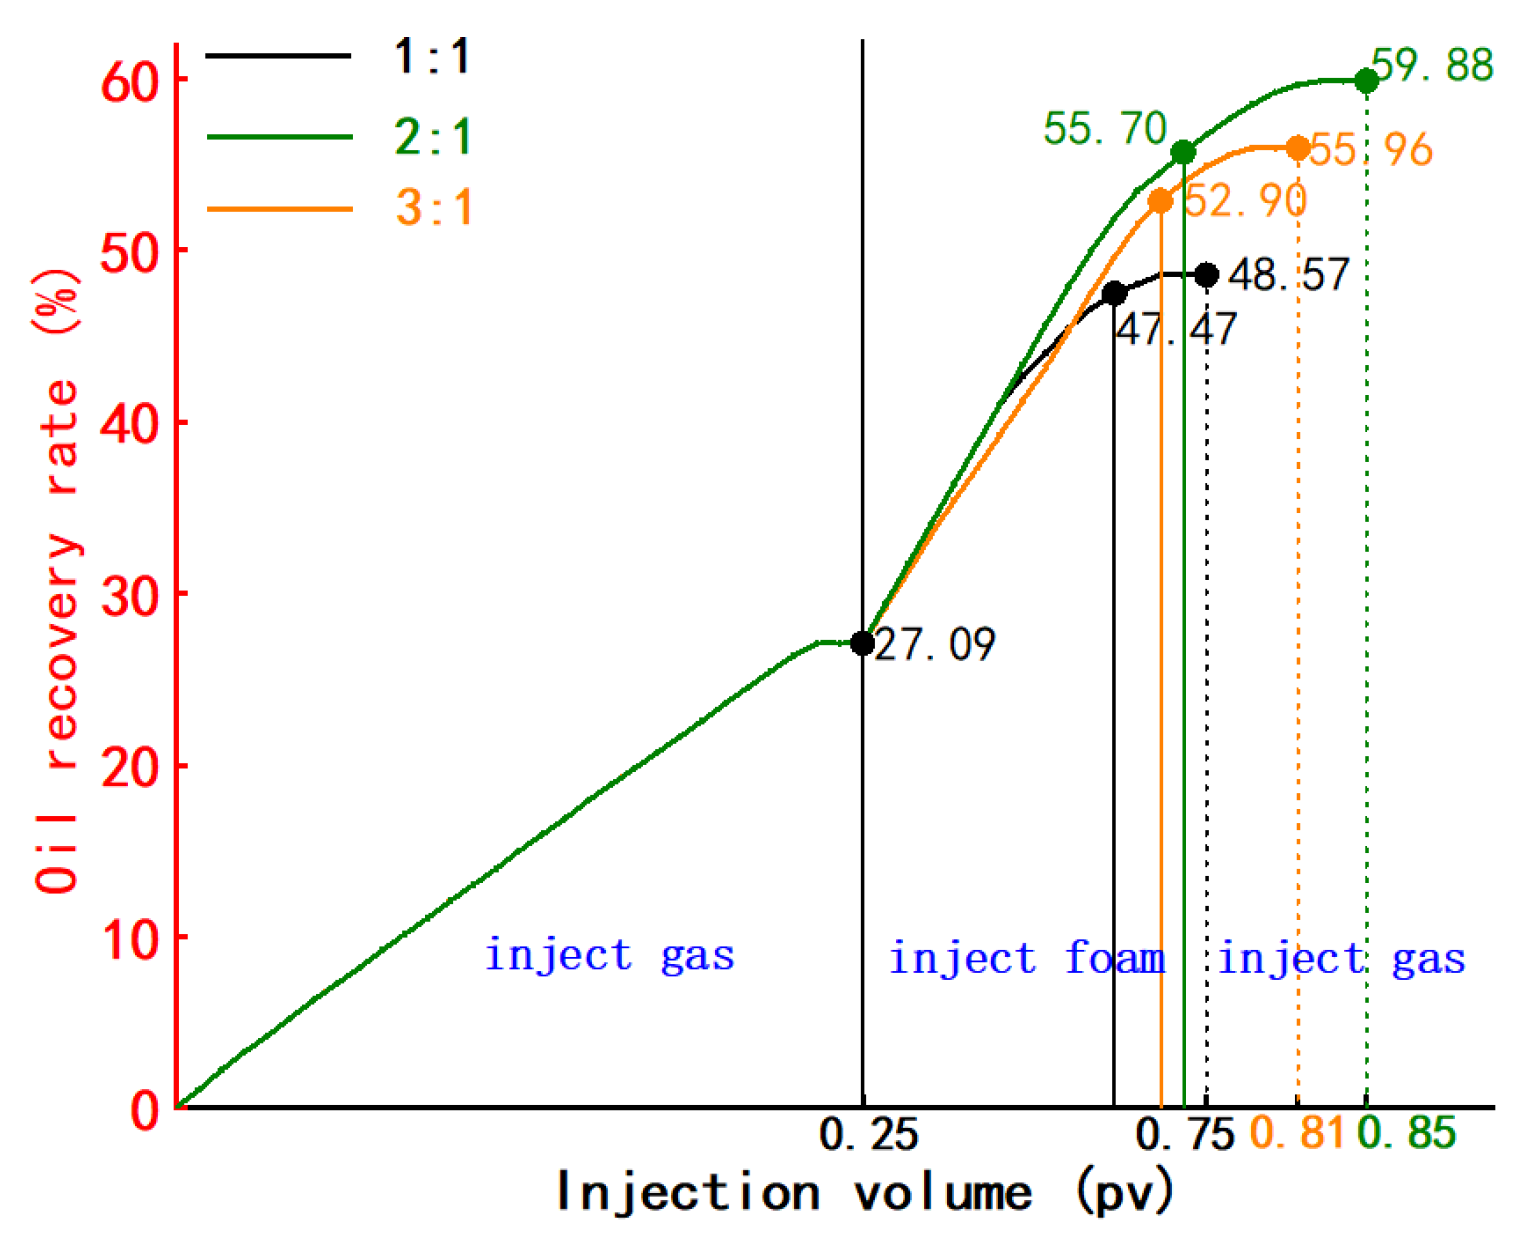
For the salt-sensitive foam, the comparison of oil repelling effect under different gas-liquid ratios was investigated when the injection volume was 0.4 pv and the foam-assisted gas drive was injected at the late stage of the gas flurry, and the experimental results are shown in
Table 7 and
Figure 15.
When the foam injection gas-liquid ratio was 1:1, the recovery enhancement was 5.09% per 0.1pv foam; when the foam injection gas-liquid ratio was 2:1, the recovery enhancement was 7.15% per 0.1pv foam; when the foam injection gas-liquid ratio was 3:1, the recovery enhancement was 6.45% per 0.1pv foam. When the foam gas-liquid ratio was increased from 1:1 to 2:1, the recovery rate was increased by 11.31%, and when the gas-liquid ratio was increased to 3:1, the recovery rate was decreased.
From the mean value as well as the extreme deviation analysis, it can be seen that the foam gas-liquid ratio of 2:1 is the best gas-liquid ratio.
(4) Foam injection timing optimization
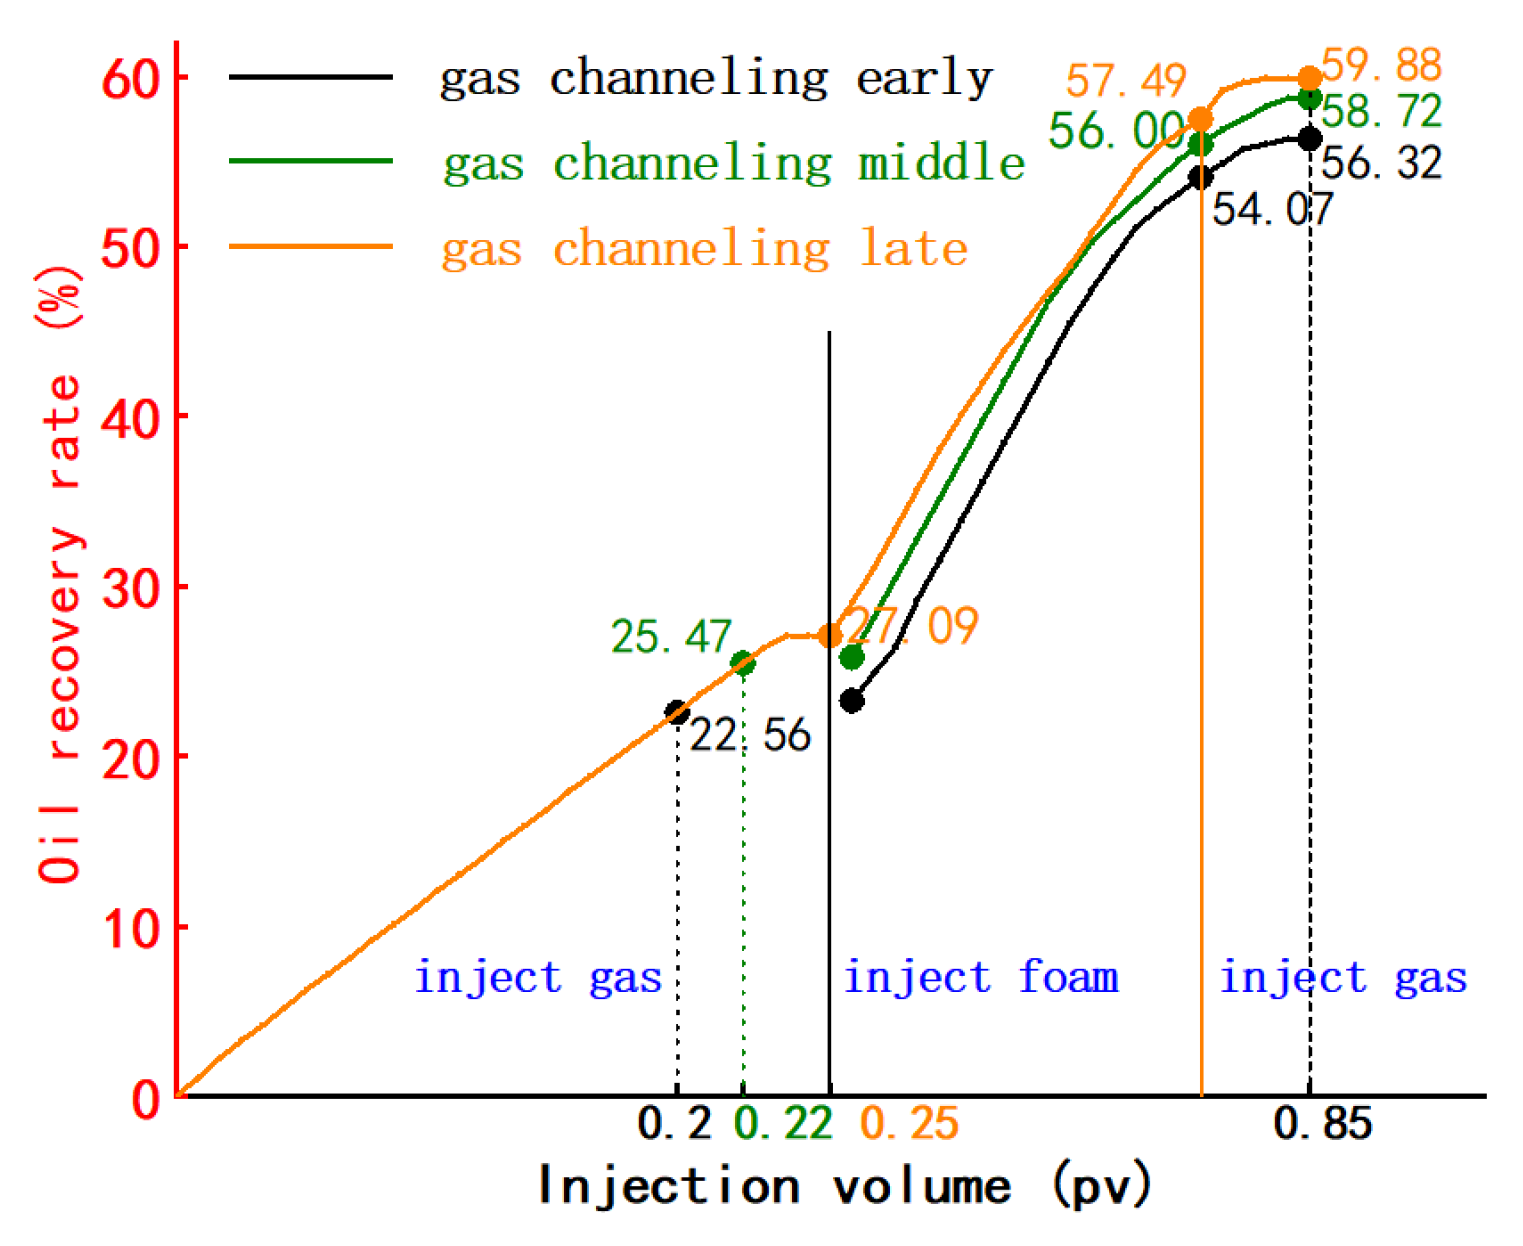
Foam-assisted gas drive was carried out by injecting 0.4 pv salt-sensitive foam with a gas-liquid ratio of 2:1 at the early, middle and late stages of gas flushing to compare the oil repelling performance of salt-sensitive foam at different injection times. The experimental results are shown in
Table 8 and
Figure 16.
When the foam injection timing was adjusted from the early stage of gas flushing to the middle stage of gas flushing, the recovery rate was increased by 2.4%, and when it was adjusted to the late stage of gas flushing, the recovery rate was increased by 1.16%. The recovery rate of foam-assisted gas drive injected at the beginning of gas scram is 2.25% in the secondary gas injection and oil drive stage, the recovery rate of foam-assisted gas drive injected at the middle of gas scram is 2.72% in the secondary gas injection and oil drive stage, and the recovery rate of foam-assisted gas drive injected at the late stage of gas scram is 2.39% in the secondary gas injection and oil drive stage.
Comprehensively analyzing the extreme difference and the recovery rate in the second gas injection and oil driving stage, the gas scrambling middle injection foam-assisted gas drive has the best economic benefit.
4.3. Vertical and Horizontal Integrated Effects Evaluation
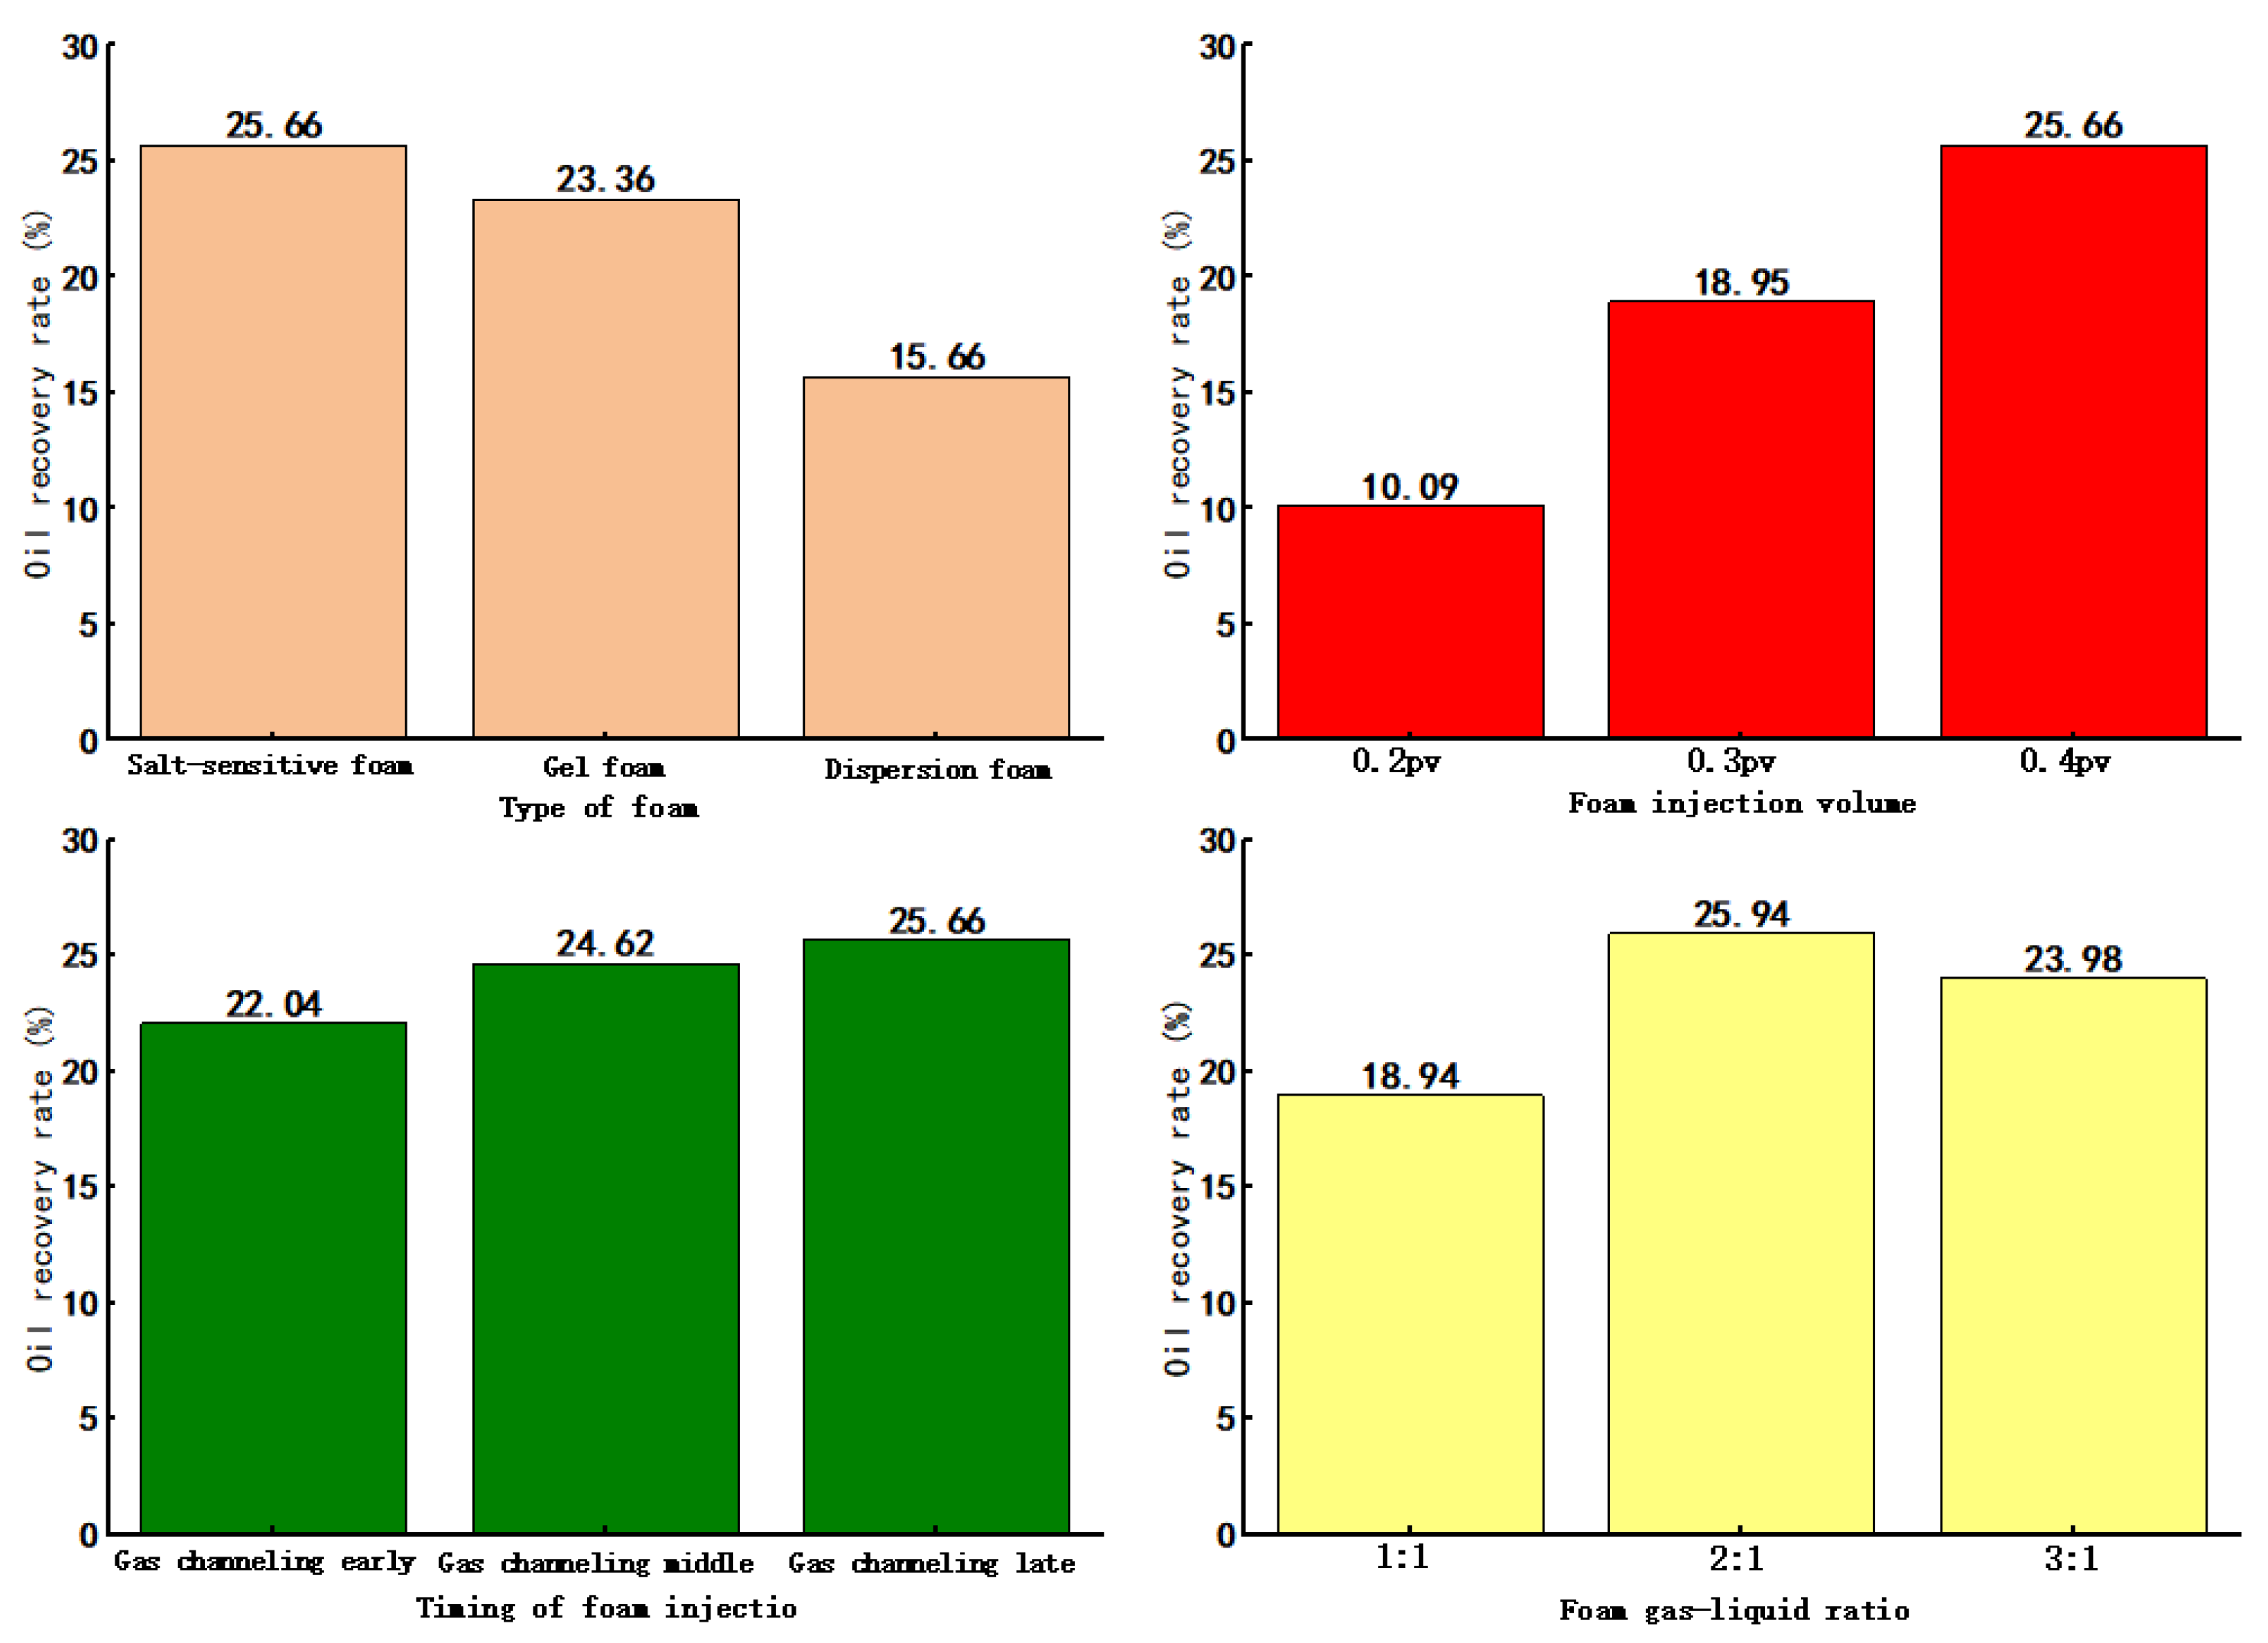
Integrated recovery was introduced to evaluate the combined role of foam in the vertical and horizontal models. It is calculated by multiplying the vertical model recovery rate by the vertical model recovery rate. Considering the effect of foam in both vertical and horizontal models, the results are shown in Table 17.and
Figure 17.
| Experimental factors |
Oil recovery rate/% |
| Vertical model |
Horizontal model |
Combined recovery rate |
| Type of foam |
Salt-sensitive foam |
42.85 |
59.88 |
25.66 |
| Gel foam |
41.16 |
56.76 |
23.36 |
| Dispersion foam |
38.27 |
40.93 |
15.66 |
| Foam injection volume |
0.2 |
25.38 |
39.77 |
10.09 |
| 0.3 |
36.46 |
51.97 |
18.95 |
| 0.4 |
42.85 |
59.88 |
25.66 |
| Foam gas-liquid ratio |
1:1 |
39.00 |
48.57 |
18.94 |
| 2:1 |
43.32 |
59.88 |
25.94 |
| 3:1 |
42.85 |
55.96 |
23.98 |
| Timing of foam injection |
Gas channeling early |
39.14 |
56.32 |
22.04 |
| Gas channeling middle |
41.93 |
58.72 |
24.62 |
| Gas channeling late |
42.85 |
59.88 |
25.66 |
Comparing and analysing the combined recovery data, it is clear from the mean and extreme deviation that the salt-sensitive foam has the best extraction effect, with an injection volume of 0.3 and a gas-liquid ratio of 2:1, and that injecting salt-sensitive foam in the middle of the gas scavenging has the best economic benefits.
5. Conclusions
(1) Foam system can be used to assist gas drive to improve the recovery rate, and can meet the requirements of residual oil after gas drive in the startup reservoir.
(2) Foam-assisted gas drive visualization experimental results show that: foam-assisted gas drive mechanism is divided into ① gravity differentiation, vertical distribution; ② gas extrusion, fracture selection; ③ Jamin effect, gas steering.
(3) The experimental results of foam-assisted gas drive injection parameter optimization show that: ① different types of foam-assisted gas drive have different effects, and among the three types of foams studied, the salt-sensitive foam has the best economic benefits. ② Foam injection volume increases, the extraction capacity shows a trend of increasing and then decreasing, and there exists the best economic efficiency of the injection volume (between 0.3 and 0.4 pv). ③Foam gas-liquid ratio increases, the foam-assisted gas drive effect first increases and then decreases, and when the gas-liquid ratio is 2:1, the foam-assisted gas drive effect is most significant. ④ Injecting foam-assisted gas drive in the middle of gas scavenging has the best economic benefit.
Author Contributions
Conceptualization, Zhengbang Chen and Lei Wang.; methodology, Zhengbang Chen and Lei Wang.; software, Zhengbang Chen.; validation, Zhengbang Chen and Jianpeng Zhang.; formal analysis, Zhengbang Chen and Lei Wang.; investigation, Zhengbang Chen.; resources, Lei Wang.; data curation, Zhengbang Chen and Jianpeng Zhang.; writing—original draft preparation, Zhengbang Chen.; writing—review and editing, Zhengbang Chen.; visualization, Lei Wang,Juan Luo.; supervision, Lei Wang,Juan Luo.; project administration, Lei Wang,Juan Luo.; funding acquisition, Lei Wang,Juan Luo . All authors have read and agreed to the published version of the manuscript.
Funding
Funding: This study was supported by the project team of “Optimization of Process Parameters for Gas Flight Channel Regulation in Slit Cave Reservoirs” of the Northwest Bureau of Sinopec under Grant No. 34400007-21-ZC0607-0114.
Data Availability Statement
Not applicable.
Acknowledgments
Thanks to other authors for his support of the experimental methods, experimental materials and amendments to the content of the article.
Conflicts of Interest
The authors declare no conflict of interest.
References
- Chen Zhi-Hai,DAI Yong,LANG Zhao-Xin. Reservoir storage and permeability pattern and its exploitation characteristics in seam-hole carbonate reservoirs. Petroleum Exploration and Development,2005(03):101-105.
- SINOPEC Research Institute of Petroleum Exploration and Development. SINOPEC Development Project “Research on Development Dynamic Tracking and Planning Deployment of Tahe Oil Area” [R]. Beijing: SINOPEC Research Institute of Petroleum Exploration and Development, 2004.
- Jack All an,S Qing Sun.Recovery fact or in fractured reservoirs: lessons learned from 100 factured fields. Oil Exploration and Development, 2003,30(6):129-135.
- YU Jiaren, FAN Zheren. Study on carbonate reservoirs in Renqiu Guqianshan Oilfield. Carbonate rock oil and gas field development. Beijing: Petroleum Industry Press,1988.3-12.
- Yu Jiaren. Discussion on the distribution law of slit holes in carbonate reservoirs of Renqiu ancient submerged mountain. Petroleum exploration and development,1987,14(3):52-61.
- North China Petroleum Exploration and Development Research Institute. Development of North China Carbonate Submarine Reservoir [M]. Beijing: Petroleum Industry Press,1985.152-168.
- Tang Zeyao, Kong Jinxiang. Structural Characteristics of Aurignacian Reservoirs in Weiyuan Gas Field. Carbonate oil and gas field development. Beijing: Petroleum Industry Press,1988.115-125.
- TANG Zeyao, KONG Jinxiang. Geological characteristics of low porosity and low permeability carbonate gas reservoirs in the Sichuan Basin. Carbonate oil and gas field development. Beijing: Petroleum Industry Press,1988.125-134.
- Zhu Youjian, Ding Chuanbai. Analysis on the development of Aurora gas reservoir in Weiyuan gas field, Sichuan. Carbonate oil and gas field development. Beijing: Petroleum Industry Press,1988.178-187.
- Xie Qingbang. Characterization of carbonate reservoirs in the central gas field of Shanxi-Gansu-Ningxia Basin. Petroleum Exploration and Development,1994,21(4):105-106.
- MA Zhenfang, ZHOU Shuxun, YU Zhongping, et al. Characteristics of paleo-weathered crusts at the top of Ordos Basin and their relationship with natural gas enrichment. Petroleum Exploration and Development, 1999,26(5):21-23.
- WANG Dongxu, WANG Caili, GOU Honggang, et al. Modeling of reservoir permeability in Jingbian carbonate reservoir. Petroleum Exploration and Development,2002,29(5):41-43.
- TAN Chengjun. A preliminary study on the relationship between reservoir space and reservoir group connectivity in Tahe carbonate oilfield. Development of Ordovician Slit Hole Carbonate Reservoirs in Tahe Oilfield. Beijing: Petroleum Industry Press,2003.51-56.
- Zhou Xingxi. A preliminary study on carbonate network oil and gas reservoirs--Taking the example of the Ordovician submarine reservoir in Lunan, Tarim Basin. Petroleum Exploration and Development,2000,27(3):5-8.
- LIU Zhongchun, WANG Yong, HOU Jirui, LU Min, ZHENG Zeyu, QU Ming, ZHU Daoyi. Technical feasibility of foam-assisted gas drive for enhanced recovery in seam-hole reservoirs[J]. Journal of China University of Petroleum (Natural Science Edition),2018,42(01):113-118.
- Dou Zhilin. Development Technology of Carbonate Rock Slit Hole Type Reservoir in Tahe Oilfield [M]. Beijing: Petroleum Industry Press, 2012: 64-72.
- Rong Yuanshuai, Zhao Jinzhou, Lu Xinbin, Li Xinhua, Li Xiaobo. Residual oil distribution pattern and countermeasures for tapping in carbonate slit-hole type reservoirs[J]. Journal of Petroleum,2014,35(06):1138-1146.
Figure 1.
The structure of the fractured cave unit.
Figure 1.
The structure of the fractured cave unit.
Figure 2.
Gas scramble production curves for seam-hole reservoirs.
Figure 2.
Gas scramble production curves for seam-hole reservoirs.
Figure 3.
Surface karst visualization model design drawing(a)vertical model;(b)Horizontal model.
Figure 3.
Surface karst visualization model design drawing(a)vertical model;(b)Horizontal model.
Figure 4.
Etching plate physical picture (a)vertical model;(b)Horizontal model.
Figure 4.
Etching plate physical picture (a)vertical model;(b)Horizontal model.
Figure 5.
Flow chart of foam-assisted gas drive visualization experiment.
Figure 5.
Flow chart of foam-assisted gas drive visualization experiment.
Figure 6.
Gravity differentiation, vertical distribution(a)Nitrogen flooding;(b)Foam assisted gas drive.
Figure 6.
Gravity differentiation, vertical distribution(a)Nitrogen flooding;(b)Foam assisted gas drive.
Figure 7.
Gas extrusion, crack selection(a)Large opening crack;(b)Small opening crack.
Figure 7.
Gas extrusion, crack selection(a)Large opening crack;(b)Small opening crack.
Figure 8.
Jamin effect, gas steering(a)Deep migration;(bJamin Effect.
Figure 8.
Jamin effect, gas steering(a)Deep migration;(bJamin Effect.
Figure 9.
Foam type optimization.
Figure 9.
Foam type optimization.
Figure 10.
Foam injection volume optimization.
Figure 10.
Foam injection volume optimization.
Figure 11.
Foam gas-liquid ratio optimization.
Figure 11.
Foam gas-liquid ratio optimization.
Figure 12.
Foam injection timing optimization.
Figure 12.
Foam injection timing optimization.
Figure 13.
Foam type optimization.
Figure 13.
Foam type optimization.
Figure 14.
Foam injection volume optimization.
Figure 14.
Foam injection volume optimization.
Figure 15.
Foam gas-liquid ratio optimization.
Figure 15.
Foam gas-liquid ratio optimization.
Figure 16.
Foam injection timing optimization.
Figure 16.
Foam injection timing optimization.
Figure 17.
Modelled integrated recovery.
Figure 17.
Modelled integrated recovery.
Table 1.
Experimental results of foam type optimization.
Table 1.
Experimental results of foam type optimization.
| Foam type |
Oil recovery rate % |
| Inject gas |
Inject foam |
Inject gas |
| Salt-sensitive foam |
13.46 |
26.62 |
2.77 |
| Gel foam |
13.46 |
25.77 |
1.93 |
| Dispersion foam |
13.46 |
23.62 |
1.19 |
Table 2.
Experimental results of foam injection volume optimization.
Table 2.
Experimental results of foam injection volume optimization.
| Foam injection volume/pv |
Oil recovery rate/% |
| Inject gas |
Inject foam |
Inject gas |
| 0.2 |
13.46 |
11.46 |
0.46 |
| 0.3 |
13.46 |
21.16 |
1.84 |
| 0.4 |
13.46 |
26.62 |
2.77 |
Table 3.
Experimental results of foam gas-liquid ratio optimization.
Table 3.
Experimental results of foam gas-liquid ratio optimization.
| Foam gas-liquid ratio |
Oil recovery rate/% |
| Inject gas |
Inject foam |
Inject gas |
| 1:1 |
13.46 |
25.39 |
0.15 |
| 2:1 |
13.46 |
29.36 |
0.5 |
| 3:1 |
13.46 |
28.16 |
1.23 |
Table 4.
Experimental results of foam injection timing optimization.
Table 4.
Experimental results of foam injection timing optimization.
| Injection timing |
Oil recovery rate/% |
| Inject gas |
Inject foam |
Inject gas |
| Gas channeling early |
12.92 |
25.7 |
0.52 |
| Gas channeling middle |
13.31 |
27.15 |
1.47 |
| Gas channeling late |
13.46 |
28.14 |
1.25 |
Table 5.
Experimental results of foam type optimization.
Table 5.
Experimental results of foam type optimization.
| Foam type |
Oil recovery rate % |
| Inject gas |
Inject foam |
Inject gas |
| Salt-sensitive foam |
27.09 |
28.61 |
4.18 |
| Gel foam |
27.09 |
26.18 |
3.49 |
| Dispersion foam |
27.09 |
12.23 |
1.61 |
Table 6.
Experimental results of foam injection volume optimization.
Table 6.
Experimental results of foam injection volume optimization.
| Foam injection volume/pv |
Oil recovery rate/% |
| Inject gas |
Inject foam |
Inject gas |
| 0.2 |
27.09 |
11.72 |
0.96 |
| 0.3 |
27.09 |
22.24 |
2.64 |
| 0.4 |
27.09 |
29.14 |
3.65 |
Table 7.
Experimental results of foam gas-liquid ratio optimization.
Table 7.
Experimental results of foam gas-liquid ratio optimization.
| Foam gas-liquid ratio |
Oil recovery rate/% |
| Inject gas |
Inject foam |
Inject gas |
| 1:1 |
27.09 |
20.38 |
1.1 |
| 2:1 |
27.09 |
28.61 |
4.18 |
| 3:1 |
27.09 |
25.81 |
3.06 |
Table 8.
Experimental results of foam injection timing optimization.
Table 8.
Experimental results of foam injection timing optimization.
| Injection timing |
Oil recovery rate/% |
| Inject gas |
Inject foam |
Inject gas |
| Gas channeling early |
22.56 |
31.51 |
2.25 |
| Gas channeling middle |
25.47 |
30.53 |
2.72 |
| Gas channeling late |
27.09 |
30.4 |
2.39 |
|
Disclaimer/Publisher’s Note: The statements, opinions and data contained in all publications are solely those of the individual author(s) and contributor(s) and not of MDPI and/or the editor(s). MDPI and/or the editor(s) disclaim responsibility for any injury to people or property resulting from any ideas, methods, instructions or products referred to in the content. |
© 2024 by the authors. Licensee MDPI, Basel, Switzerland. This article is an open access article distributed under the terms and conditions of the Creative Commons Attribution (CC BY) license (https://creativecommons.org/licenses/by/4.0/).
