1. Introduction
In Deep Learning (DL), the proliferation of model parameters and their complex correlations has raised a critical issue - data overfitting during the training stage. This phenomenon, observed across various tasks and domains, impedes the model's ability to generalize well on unseen test data, leading to suboptimal performance. Despite recent studies suggesting that the inherent bias in the DL training process helps mitigate overfitting to some extent, it remains crucial to develop effective techniques to address this pervasive problem, as stated by [
1]. Furthermore, deep and complex Convolutional Neural Networks (CNNs) architectures, such as VGGNet and GoogLeNet, involve a significant number of parameters and computations during training. The forward and backward propagations through numerous layers demand substantial computational resources, resulting in prolonged training times. The memory requirements of CNN training on GPUs can be significant due to extensive data and parameter sizes. Despite overcoming some challenges using high-end cloud servers, specific issues persist. As discussed by [
2] GPU kernels have limitations on the shape and size of data they can efficiently process, impacting the performance of CNN implementations on GPUs. Ensuring efficient memory utilization and handling shape constraints becomes crucial to avoid bottlenecks during GPU kernel execution. Moreover, CNNs demand considerable computational power for real-time object detection. Onboard sensors on UAVs often possess limited computing capacity, which may be insufficient to process large CNN models efficiently or in real-time object detection tasks, as highlighted by [
3]. [
4] In their works, they analyzed that the automobile industry is also shifting towards CNN onboard computers and facing similar challenges.
Objects in the universe can be interpreted based on two fundamental divisions: spectral and geometric. Spectral signatures determine spectral characteristics, while geometric attributes involve shape, size, association, and texture. CNNs have transformed image processing by extracting spectral and geometric features, utilizing DNN hidden layers for segmentation. However, challenges persist in achieving human-like efficiency with CNNs. To address these limitations and enhance computational efficiency, Evolutionary Converging Functions (ECF) are proposed in this study. This innovative approach leverages the strengths of spectral and geometric interpretations, converging them through mathematical transformations to improve image segmentation outcomes. The spectral nature of an object is converted into a mathematical combination of spectral bands, providing a deeper understanding of intricate patterns. Geometric nature is encoded into segments using precise shape equations, preserving spatial relationships for more accurate and context-aware segmentation. Our proposed approach strategically fuses transformed spectral and geometric representations through Evolutionary Converging Functions (ECF), offering significant advancements in image segmentation. By transcending the limitations of traditional interpretations, this method empowers computers to process images with enhanced efficiency and accuracy, approaching human-like perception. The primary objective is to explore the untapped potential of synergistic spectral-geometric representations and demonstrate the effectiveness of Evolutionary Converging Functions in achieving superior image segmentation results. This research aims to pave the way for more robust and intuitive image segmentation techniques, propelling image processing capabilities closer to human-level perception.
1.1. Aims and Objectives
This work develops a method to detect objects in any satellite image into a specific Land Use Land Cover (LULC) instance segmented map. The method aims to monitor changes in both man-made and natural features with high accuracy and low computational cost across diverse geographic regions globally, utilizing a Machine Learning and Deep Neural Network model. The primary aim of this research is to assess the effectiveness of the Evolutionary Converging Functions approach in achieving superior image segmentation results. The objectives of our work are the following:
To achieve high object detection accuracy for diverse features with a smaller training set and low computational cost, significantly improving computational efficiency.
To train the decision tree classifier with an appropriate training set and generate accurate boundary conditions.
To derive the spectral equation from graphical representations of the decision tree.
To determine the appropriate geometric properties that describe the interested feature effectively.
To converge the vector table to the appropriate class using deep neural networks.
1.2. Structure of the Paper
The paper is divided into five sections.
Section 2 discusses related literature.
Section 3 comprehensively explains and discusses the methodology, dataset, and proposed method.
Section 4 analyses the results, and
Section 5 concludes the paper.
2. Literature Review
The utilization of Earth observation (EO) satellite data and its evolving trends have been extensively examined in recent literature. [
5] introduce the concept of the remote sensing impact factor (RSIF), offering a novel metric for predicting the impacts of EO satellites. Highlighted missions such as Landsat, Sentinel, MODIS, Gaofen, and WorldView underscore the pivotal role of satellite missions in Earth observation. Moreover, the integration of artificial intelligence (AI) in Earth System prediction tasks is emphasized by [
6], highlighting the imperative of ethical and responsible development in this domain. Additionally, [
6] addresses a specific application in the manufacturing industry, proposing a convolutional neural network (CNN)-based framework for surface defect detection, overcoming challenges related to limited training data and computational resources. [
7] provide a historical perspective on the evolution of research in the computer vision domain, introducing a convolutional neural network (CoNN) for texture classification. [
8] contribute to satellite image classification by introducing SAT-4 and SAT-6 datasets and utilizing a Deep Belief Network (DBN) for feature extraction and classification. [
9] present a CNN designed explicitly for detecting geosynchronous Earth orbit resident space objects, demonstrating superior performance on the SatNet dataset [
10]. Also, a cross-entropy-based sparse penalty mechanism for the Convolutional Deep Belief Network (CDBN) will be introduced to enhance its recognition capabilities.
The literature review identifies key themes and trends within the field. [
11] focus on enhancing crop classification accuracy using a decision tree method. [
12] conducted a bibliometric analysis of the Google Earth Engine (GEE), emphasizing its multidisciplinary applications.[
13] propose a clustering algorithm combining DBSCAN and k-means for high-density region reduction. [
14] explore various weight initialization techniques for neural networks.[
15] developed an EAF-Unet algorithm leveraging GF2 imagery to detect eutrophic and green ponds (EGPs) automatically. Through feature selection and model tuning, optimal input features and encoding methods were identified, resulting in high precision, recall, and F1-score metrics, indicating robust performance in EGP extraction without the need for water masks. These findings suggest the algorithm's potential for aiding environmental monitoring by identifying ponds prone to eutrophication and areas at risk of environmental degradation due to improper sewage management. [
16] introduce a novel approach, SPS-UNet, which utilizes a super-pixel sampling module (SPSM) within the MobileNetV2 backbone to address the challenge of extracting buildings from high-resolution satellite images, particularly in the presence of noise. By replacing traditional down-sampling operators with SPSM and incorporating an entropy loss item during training, SPS-UNet achieves superior segmentation accuracies and improved robustness to noisy buildings compared to existing methods, as demonstrated through experiments on two public datasets.[
17] proposes an automated real-time crack detection method using drones, integrating lightweight classification and segmentation algorithms along with crack width measurement, facilitating efficient building damage assessment with improved accuracy under non-ideal conditions, and similar views were proposed by [
18]. [
19] proposes a stacked CNN architecture trained on UAV imagery to enhance post-disaster preliminary damage assessment, achieving improved classification accuracy and precision through innovative loss function and correlation analysis. [
20] proposes TAAWUN, a novel approach for autonomous and connected vehicles (CAVs), utilizing data fusion from multiple vehicles to enhance environment perception and decision-making, particularly addressing challenging conditions like problematic shadows and extreme sunlight.
Additionally, the study highlights the general applicability of SPSM across various fully convolutional networks, consistently enhancing semantic segmentation results. [
21] propose CM-Unet, a novel semantic segmentation method tailored for high-resolution remote sensing images, which addresses issues such as holes, omissions, and fuzzy edge segmentation. Through the integration of channel attention mechanisms, residual modules, and multi-feature fusion in the U-Net framework, along with an improved sub-pixel convolution method, CM-Unet achieves impressive segmentation results. Experimental evaluations on multiple datasets demonstrate CM-Unet's efficiency, with a segmentation time of approximately 62 ms/piece, a Mean IoU of 90.4%, and lower computational complexity than other models while outperforming them in segmentation precision. [
22]propose a dataset-pruning method for examining the influence of removing specific training samples on a model's generalization ability.[
23] comprehensively review deep learning techniques, encompassing CNN architectures, challenges, applications, and future directions. [
24] introduces FAST–CNN, an efficient feature extraction technique for remote sensing using convolutional neural networks.
Furthermore, [
25] provides an in-depth review of CNN architectures and their optimizations, while [
26] evaluates the computational cost of deep models designed for the frequency domain [
27] despite transfer learning. A comparative analysis reveals insights into the performance of different models. [
28] assess eight CNN models for predicting the Seabed Objects-KLSG dataset, reporting variations in prediction accuracy. The diverse nature of AI and ML challenges is discussed by [
29]. The literature review critically evaluates the quality and reliability of existing studies. Presenting a robust CNN for texture classification [
8] introduces novel satellite datasets and a DBN-based classification framework. [
11] contribute to precision agriculture, and [
13] presents a data reduction method. Delving deep into the above literature highlights challenges to deep learning algorithms, such as limited training data, imbalanced datasets, interpretability concerns, uncertainty scaling, and low learning rates. These challenges are addressed through various strategies and methodologies proposed in recent studies, providing insights into the evolving landscape of deep learning research. However, significant opportunities remain for improving accuracy, achieving universal applicability, and developing computationally robust methods within computer vision.
3. Methodology
3.1. Introduction
A low learning rate in computer vision negatively impacts performance compared to other AI/ML methods. The intricacies of visual data and the complexity of convolutional neural networks (CNNs) make the optimization landscape more challenging. A low learning rate may lead to slow convergence or the model getting trapped in local minima, hindering the ability to capture and learn from intricate image patterns effectively. Unlike machine learning techniques, computer vision often requires careful tuning of hyperparameters, including learning rates, to balance convergence speed and avoid suboptimal solutions. In this work, Evolutionary Converging Functions (ECF) are proposed, in which a method created for generating equations from a decision tree and fused with a neural network applying convergence weightage to input neurons, thus increasing the learning rate of the entire system of computer vision to a large extent.
The challenge lies in finding a learning rate that facilitates efficient learning without compromising the model's ability to extract meaningful features from visual data. A low learning rate can make training computationally intensive in computer vision due to its impact on convergence speed. When the learning rate is set too low, the model updates its parameters very gradually, requiring a more significant number of iterations to reach convergence. As a result, more epochs are needed to train the model adequately, leading to increased computational time and resource consumption. This prolonged training process can strain computational resources, especially in scenarios where large-scale datasets or complex neural network architectures are involved. In addition, it may require extended access to powerful hardware or cloud computing resources, contributing to the computational intensity of training with a low learning rate in computer vision tasks. High-frequency mapping challenges arise in CNN-based computer vision applied to satellite data due to the down-sampling effects of pooling layers, leading to the loss of fine details critical for tasks such as change detection and precise mapping. The high spatial resolution of satellite imagery exacerbates this issue, demanding computationally intensive processes and hindering the model's ability to adapt to heterogeneous data patterns. Striking a balance between preserving intricate details and avoiding excessive computational demands remains a crucial challenge in optimizing CNNs for effective analysis of high-resolution satellite data. By converting the image into tabular data while preserving the complexity of the image information, our approach effectively addresses the learning rate challenges associated with CNNs when handling large datasets. Tabular data representation facilitates the efficient processing of intricate image details, enabling CNNs to navigate and learn from the extensive information within the image. This conversion enhances the network's ability to discern patterns, features, and relationships in the data, leading to improved training and more accurate predictions.
3.2. Dataset and Platform
Obtaining high-resolution satellite images poses several challenges, primarily stemming from technological, financial, and regulatory constraints. Technologically, developing and launching high-resolution imaging satellites capable of capturing fine details entail significant engineering complexities and costs. Financial challenges arise due to the substantial investment in the satellite development process, launch expenses, and the ongoing costs of maintaining and upgrading the satellite constellation. Additionally, regulatory restrictions related to national security and privacy concerns may limit the accessibility and dissemination of high-resolution satellite data, further complicating efforts to acquire comprehensive and up-to-date imagery for various applications, including urban planning, environmental monitoring, and disaster response.
Due to its unique advantages [
30], Planet Skysat Dataset is selected for our training and validation purposes. The dataset offers a Multispectral/Pan collection containing images with five 16-bit bands, up-sampled from the original 12-bit data. The inclusion of bands representing Blue (B), Green (G), Red (R), and Near-Infrared (Near-IR) provides a comprehensive spectral profile, enabling us to capture a wide range of environmental information. The high resolution of approximately 2 meters per pixel in these bands ensures detailed and accurate spatial representation, crucial for land cover classification and environmental monitoring. Moreover, the Pan band with an impressive 0.8-meter resolution (closer to 1 meter for off-nadir images) enhances the dataset's capability for capturing fine-grained details. It is well-suited for applications that demand high spatial precision, such as urban planning and infrastructure assessment. Notably, freely available data on Google Earth Engine (GEE) enhances accessibility, making it a cost-effective choice for research and development endeavors.
In Convolutional Neural Networks (CNNs), the substantial demand for sizable training datasets poses a common challenge. CNNs, known for their data-hungry nature, necessitate thousands of labeled examples to grasp intricate features and patterns effectively. Companies often resort to services like Amazon Mechanical Turk and specialized data labeling firms to curate and annotate expansive training datasets to address this. Noteworthy alternatives, such as Hexagon and ESRI, may offer data collection and annotation consulting services. However, Evolutionary Converging Functions take a distinct approach. These techniques, relying on domain knowledge and heuristics, operate with smaller training sets—typically 20 to 30 examples. Leveraging genetic algorithms, evolutionary strategies, or other optimization methods, they aim to iteratively converge toward accurate results without requiring extensive labeled data. They offer a pragmatic solution where acquiring such data is either impractical or cost-prohibitive.
The testing dataset was meticulously crafted with precision through manual digitization using QGIS. A total of 20 to 30 instances were carefully created, ensuring a comprehensive representation of the features and patterns relevant to evaluating the model's performance. The manual digitization process in QGIS allows for a detailed and accurate delineation of geographic elements, ensuring that the testing dataset encapsulates the diversity and complexity expected in real-world scenarios. This approach provides a solid foundation for robust testing and validation, enabling a thorough assessment of the model's capabilities in handling various spatial features and intricacies.
The datasets encompass diverse features, each crucial for comprehensive spatial analysis. The "water" category includes various water bodies, such as rivers, lakes, or ponds. The "road" feature represents different types of transportation infrastructure, such as highways, streets, and pathways. "Buildings" encompass structures of various sizes and purposes, contributing to the urban landscape. Lastly, the "trees" category incorporates information about the distribution and types of vegetation, aiding in environmental and land cover assessments. These features collectively provide a rich and varied dataset, offering a robust foundation for training and evaluating models in geospatial analysis and computer vision tasks. The study area is within a 500 km buffer of New York City.
Utilizing Google Earth Engine (GEE) and QGIS, the datasets undergo vectorization for precise feature delineation. The focus includes land use and land cover (LULC) classification, incorporating diverse terms like "water," "road," "buildings," and "trees," ensuring a comprehensive dataset for geospatial analysis and computer vision tasks. Now that the dataset has been reviewed, the challenges faced during project execution will be examined.
3.3. Challenges
Several challenges are faced in this work. Firstly, extracting a mathematical equation from a decision tree is challenging. Decision trees are inherently non-linear and hierarchical, making it complex to represent their logic in a concise mathematical form. The extraction process required careful consideration of each decision node and leaf in the tree to derive an equation that accurately represents the decision-making process. Secondly, determining the optimal number of clusters in clustering algorithms, such as k-means, presented another challenge. It involves finding a balance between having enough clusters to capture meaningful patterns and avoiding excessive granularity. Various methods, including the elbow method or silhouette analysis, were explored to identify the most suitable number of clusters for the given data. Third, developing a weightage equation based on the deviation of neural network output was a crucial step. This process involved assigning weights to input neurons, facilitating faster neural network convergence during training. Balancing the importance of different input features and determining their impact on the network's learning process required careful consideration and optimization to enhance the overall performance of the neural network. Now that the dataset has been reviewed, the challenges faced during execution will be examined.
3.3. Properties of Evolutionary Converging Functions
We divide computer vision into two components to classify any object across the universe. The first component involves the interpretation of spectral signatures, and the second comes to the geometric properties, transcending beyond traditional visual recognition. In this context, geometric attributes encompass parameters such as area, centreline length, shape, and orientation, forming a comprehensive toolkit for spatial analysis crucial in tasks like object detection and spatial relationship understanding. Meanwhile, spectral signatures, analogous to unique fingerprints, represent object characteristics across electromagnetic wavelengths, aiding in material distinction and object identification. Transitioning to the second component, we emphasize the significance of these principles in remote sensing applications. The spectral signature, acting as a cornerstone, discloses how objects interact with light across different wavelengths, particularly evident in our utilization of Planet SkySat data with essential bands like Blue, Green, Red, and Near-Infrared. Additionally, geometric properties, including area and centreline length, offer valuable insights into shape and spatial relationships, providing a potent toolset for extracting information from satellite and aerial imagery. The universality of these principles is highlighted in various fields, from land use mapping to disaster response and ecological monitoring, showcasing their integral role in computer vision and remote sensing. The integration of decision trees and neural network-based algorithms, detailed in the following sections, further enhances the precision in calculating spectral and geometric features, contributing to the overall system's effectiveness.
Table 1 illustrates a comprehensive comparison between parameters used in the visual interpretation of objects and their computational counterparts in the computer world. Color Attributes are fundamental for object identification in the visual domain, emphasizing the importance of spectral information. Textural Features in the visual realm involve spectral and geometric aspects, highlighting the significance of patterns and structures. Shape and size are crucial for spatial characteristics pertaining to geometric properties in visual interpretation. Association, primarily a geometric parameter, delves into relationships between visual entities. Temporal Characteristics, considering both spectral and geometric aspects, emphasize changes over time in the visual context.
On the computational side, these parameters are further categorized into Spectral and Geometric Interpretation, as stated in
Table 2. Spectral interpretation aligns with the visual Colour Attributes and Temporal Characteristics, emphasizing the importance of computationally analyzing the object's spectral characteristics and changes over time. Geometric interpretation corresponds to both Textural Features and Shape and Size, highlighting the significance of spatial attributes and patterns in the computational analysis of visual data. This comparative breakdown elucidates the parallelisms and distinctions between the parameters employed in the visual interpretation of objects and their computational counterparts, providing insights into the multifaceted nature of computer vision applications. Now, we dive into the spectral algorithm to see how a multispectral image is converted into a greyscale image with interesting features highlighted through an evolved function. We will know the derivation of the Evolved Function.
3.4. Spectral Algorithm
Identifying spectral signatures in computer vision is crucial for analyzing electromagnetic radiation patterns emitted or reflected by objects. These unique signatures enable discrimination between various land cover types, material classification, and precise monitoring of vegetation health. Spectral information aids in tasks such as water quality assessment, mineral exploration, urban planning, and climate studies. In applications like precision agriculture, it provides insights into crop health and nutrient levels. Additionally, spectral signatures play a pivotal role in object recognition and scene understanding, making them indispensable for remote sensing applications and enhancing the depth and accuracy of computer vision analyses. As the spectral algorithm is based on a decision tree, the memory requirement is less than that of other methods but will depend on the training image size. In this study, the images range from 25000 pixels to 50000 pixels, with four bands, i.e., Blue, Green, Red, and NIR (Near Infrared), in the specified order. So, the memory of 16Gb RAM and a processor greater than 2.5GHz will be sufficient.
A decision tree applied to spectral signature data operates by recursively splitting the input features, which represent different bands or wavelengths in the spectral signature, based on learned decisions during training. Each decision node poses questions about specific spectral features, leading to a hierarchical structure of nodes. The final nodes, called leaf nodes, represent predicted class labels, such as land cover types or objects. During classification, new spectral signature data traverses the tree, and the final output is the predicted class label based on the learned spectral characteristics. Decision trees are adequate for their ability to handle complex relationships within the spectral signature space and find application in tasks such as land cover classification and object recognition in remote sensing and computer vision. GDAL, the Geospatial Data Abstraction Library, is an open-source library for reading and writing raster and vector geospatial data formats. It provides tools and APIs for various GIS (Geographic Information System) file formats. When converting an image to a matrix using GDAL, the library essentially acts as a bridge between geospatial data and numerical representations. The process involves reading the raster data from an image file, such as a satellite image or a digital elevation model, and converting it into a matrix format, where each matrix element corresponds to a pixel value. GDAL handles the intricacies of different geospatial data formats, allowing users to extract pixel values, perform manipulations, and work with the data as numerical matrices, facilitating analysis and processing in applications like remote sensing and geospatial data science.
3.4.1. Approximations and Assumptions
While creating the spectral equation from the thresholds of the decision tree, we make some approximations. The Approximations mainly are:
While joining the segments of the slope equation, common elements are taken to the minus side if one is on the minus side.
In the final equation, the variables and their coefficients should be in the order they are in the graph.
The denominator will always consist of plus signs.
In some equations, the positive side of the numerator is multiplied.
3.4.2. The Method
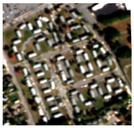
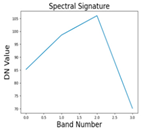
As the spectral signature plays a vital role in the identification of the material composition of an object, we convert the graph of spectral signature into mathematical equations. We all know the equation of a line and a series of line segments. The main component that describes the line is its slope. Each line segment of the spectral signature can be written as a band combination. The difference between the band at higher and lower end enhances that part of the spectrum. When it is divided by the sum of those two bands, an output image between -1 and 1 is created after normalization, perfectly describing that part of the spectrum, adding all the parts representing the entire spectral signature of the object. Decision Trees is one of the most interpretable and widely used algorithms in machine learning and data analytics. Thresholds are the boundaries that decide how the data will be divided at each node in a decision tree. The threshold creates a box around interested data in a graphical format. In Evolutionary Converging Functions, we convert those thresholds into coefficients in our function, evolving the function into indices that perfectly describe the trained object in the decision tree. Let us now mathematically describe the method.
If the slope between two bands is negative, then the band combination will be
If the slope between two bands is positive, the band combination will be:
where the components of the spectral equation are denoted by
, the band 1 and band 2 are denoted by
, and Coefficient 1, and Coefficient 2 are denoted by
. Whereas the Coefficient for each band is denoted by
.
The final equation will be the combination of all the slope equations between all the bands, i.e. Finally, the evolved function (EF) is given below:
where
are the spectral components
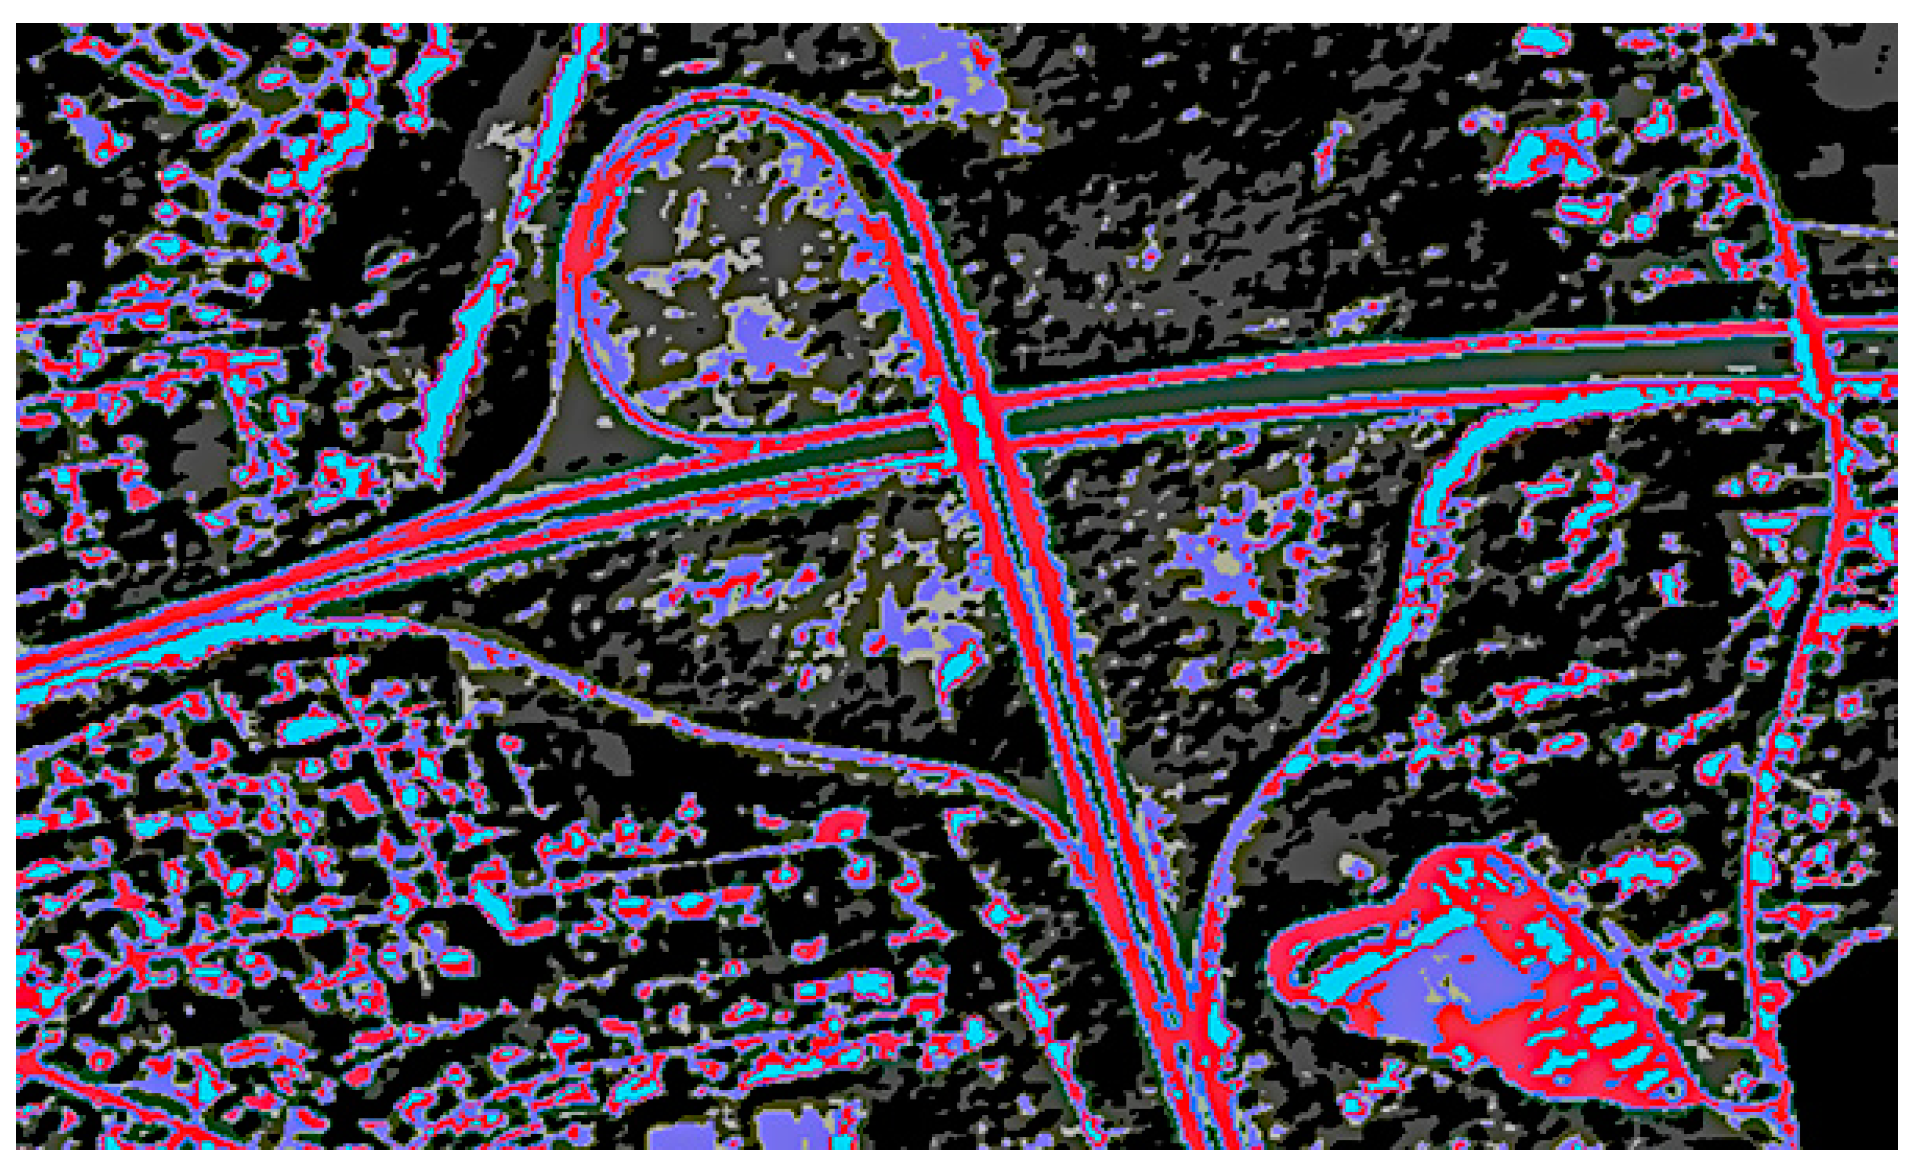
Figure 1 describes the steps in the spectral algorithm. Various methods exist to determine the optimal number of clusters. Still, in remote sensing, this task is often simplified as typically 5 to 7 classes of signatures are present in a complete satellite data tile. Our study found that setting the number of clusters to 7 worked well for detecting areas of interest. The effectiveness of this approach relies on the proper evolution of a spectral formula, where different types of land use signatures are incorporated during training. When the spectral formula is well-developed, the object of interest tends to be located in the cluster with the highest value. In less ideal situations, it may still be found within the top three clusters, arranged based on mean spectral values derived from the greyscale image generated through the spectral algorithm.
Figure 2 describes the clustered image. The necessary number of classes typically falls between 3 and 10. Silhouette score can be employed to automate this process. In cases where clustering based solely on spectral values proves insufficient, the DB Scan method, incorporating X and Y coordinates along with DN values, offers a solution for determining the optimum number of clusters. Now, we look into the geometric part, where the clustered image will be converted into a tabular image, and geometric properties will be added. They will be converged using initial weights to the input neurons for higher learning rates.
3.5. Geometric Algorithm
The geometric properties of an image, such as area, shape, and orientation, provide essential insights into spatial relationships and patterns. Understanding these properties is crucial for tasks like object recognition, image classification, and geometric analysis, enhancing the overall interpretability and utility of the image data. Transforming a grayscale image into tabular data or shapefiles, a critical step in Evolutionary Converging Functions (ECF), is known as vectorization.
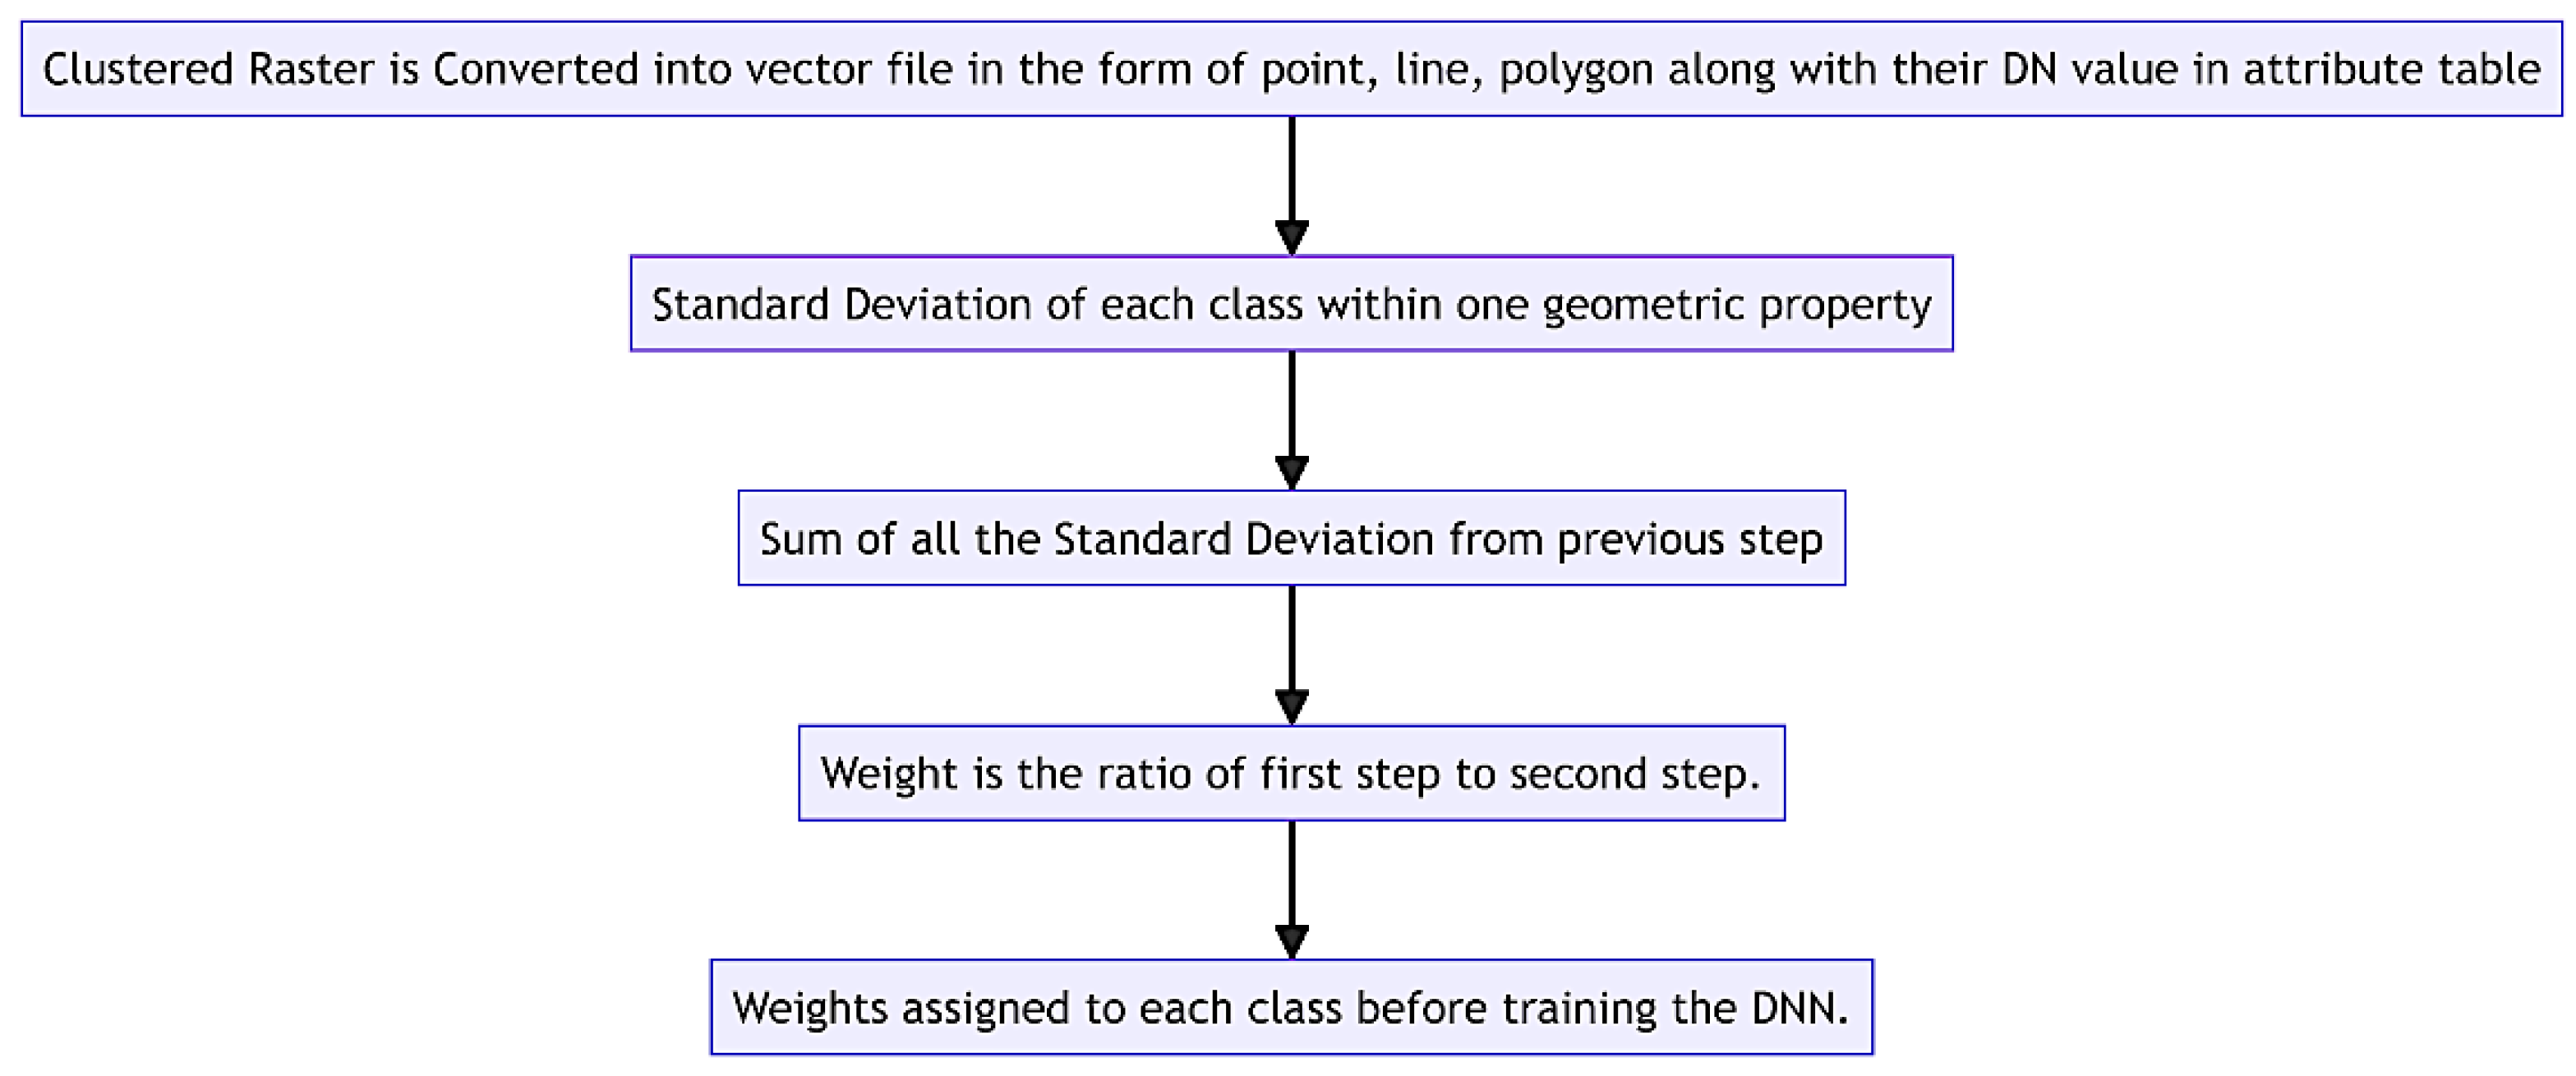
Figure 3 describes the steps in the geometric algorithm. This conversion is essential for retaining image properties to facilitate efficient processing by neural networks. In this context, the Python library Geopandas plays a crucial role by enabling the extraction of various geometric parameters from vector polygons derived from the clustered image. These parameters, including area, centerline, aspect ratio, and a novel feature introduced in ECF—the angle between line segments of the vector polygon—compose the columns of the Vector Table, a pivotal component in ECF methodology. Once the table is generated, the subsequent challenge lies in assigning weights to these geometric properties before inputting them into a neural network for training. This amalgamation of geopandas, vectorization, and neural networks elevates the representation of image features as vector data, offering significant advantages for analytical and visualization tasks within the ECF framework.
Weights are directly proportional to standard deviation. Standard deviation of class i, where i ranges from 0 to n, denoted by
such that:
So, the summation of the standard deviation, which is denoted by
for a particular geometric property of all the training set of a specific class is given as:
Consider our example of a road network, where we aggregate the standard deviations of the centerline for both class 0 and class 1. In this scenario, the road network class exhibits a higher standard deviation for the centerline, contrasting with the lower standard deviations for other geometric features. Consequently, the ratio is higher when the summed standard deviation for the centerline is divided by the summation of standard deviations for all other classes. This implies that the weight assigned to the centerline is more significant for the road network class than other geometric properties' weights. The Weightage of each geometric property, which is denoted by
Such that:
where 'gp' is the geometric property and c is the class from 1 to n. Then
Is the convergence weight. Now we look into the combined algorithm i.e., ECF, where we join the spectral and geometric parts.
3.6. Evolutionary Converging Function
In our pursuit of achieving high accuracies, we commenced by comprehensively studying the workings of a neural network. Our findings revealed that a neural network fundamentally involves assigning weights to neurons or data properties, influencing the output characteristics through forward and backward propagation. In the context of Evolutionary Converging Functions (ECF), we devised a distinctive approach for determining weights in the dataset. Each parameter in the tabular data is assigned a specific weight before undergoing neural network processing. This unique methodology ensures that the deep neural network converges efficiently to the desired solution, yielding exceptionally high accuracies.
where in Equation 10, the Weightage of spectral or geometric property denoted by
, the standard deviation of geometric or spectral column denoted by
, the sum of the standard deviation of spectral denoted by
and geometric column denoted by
.
Having determined the weights, we construct a sequential model of a deep neural network through which the prepared table is passed.
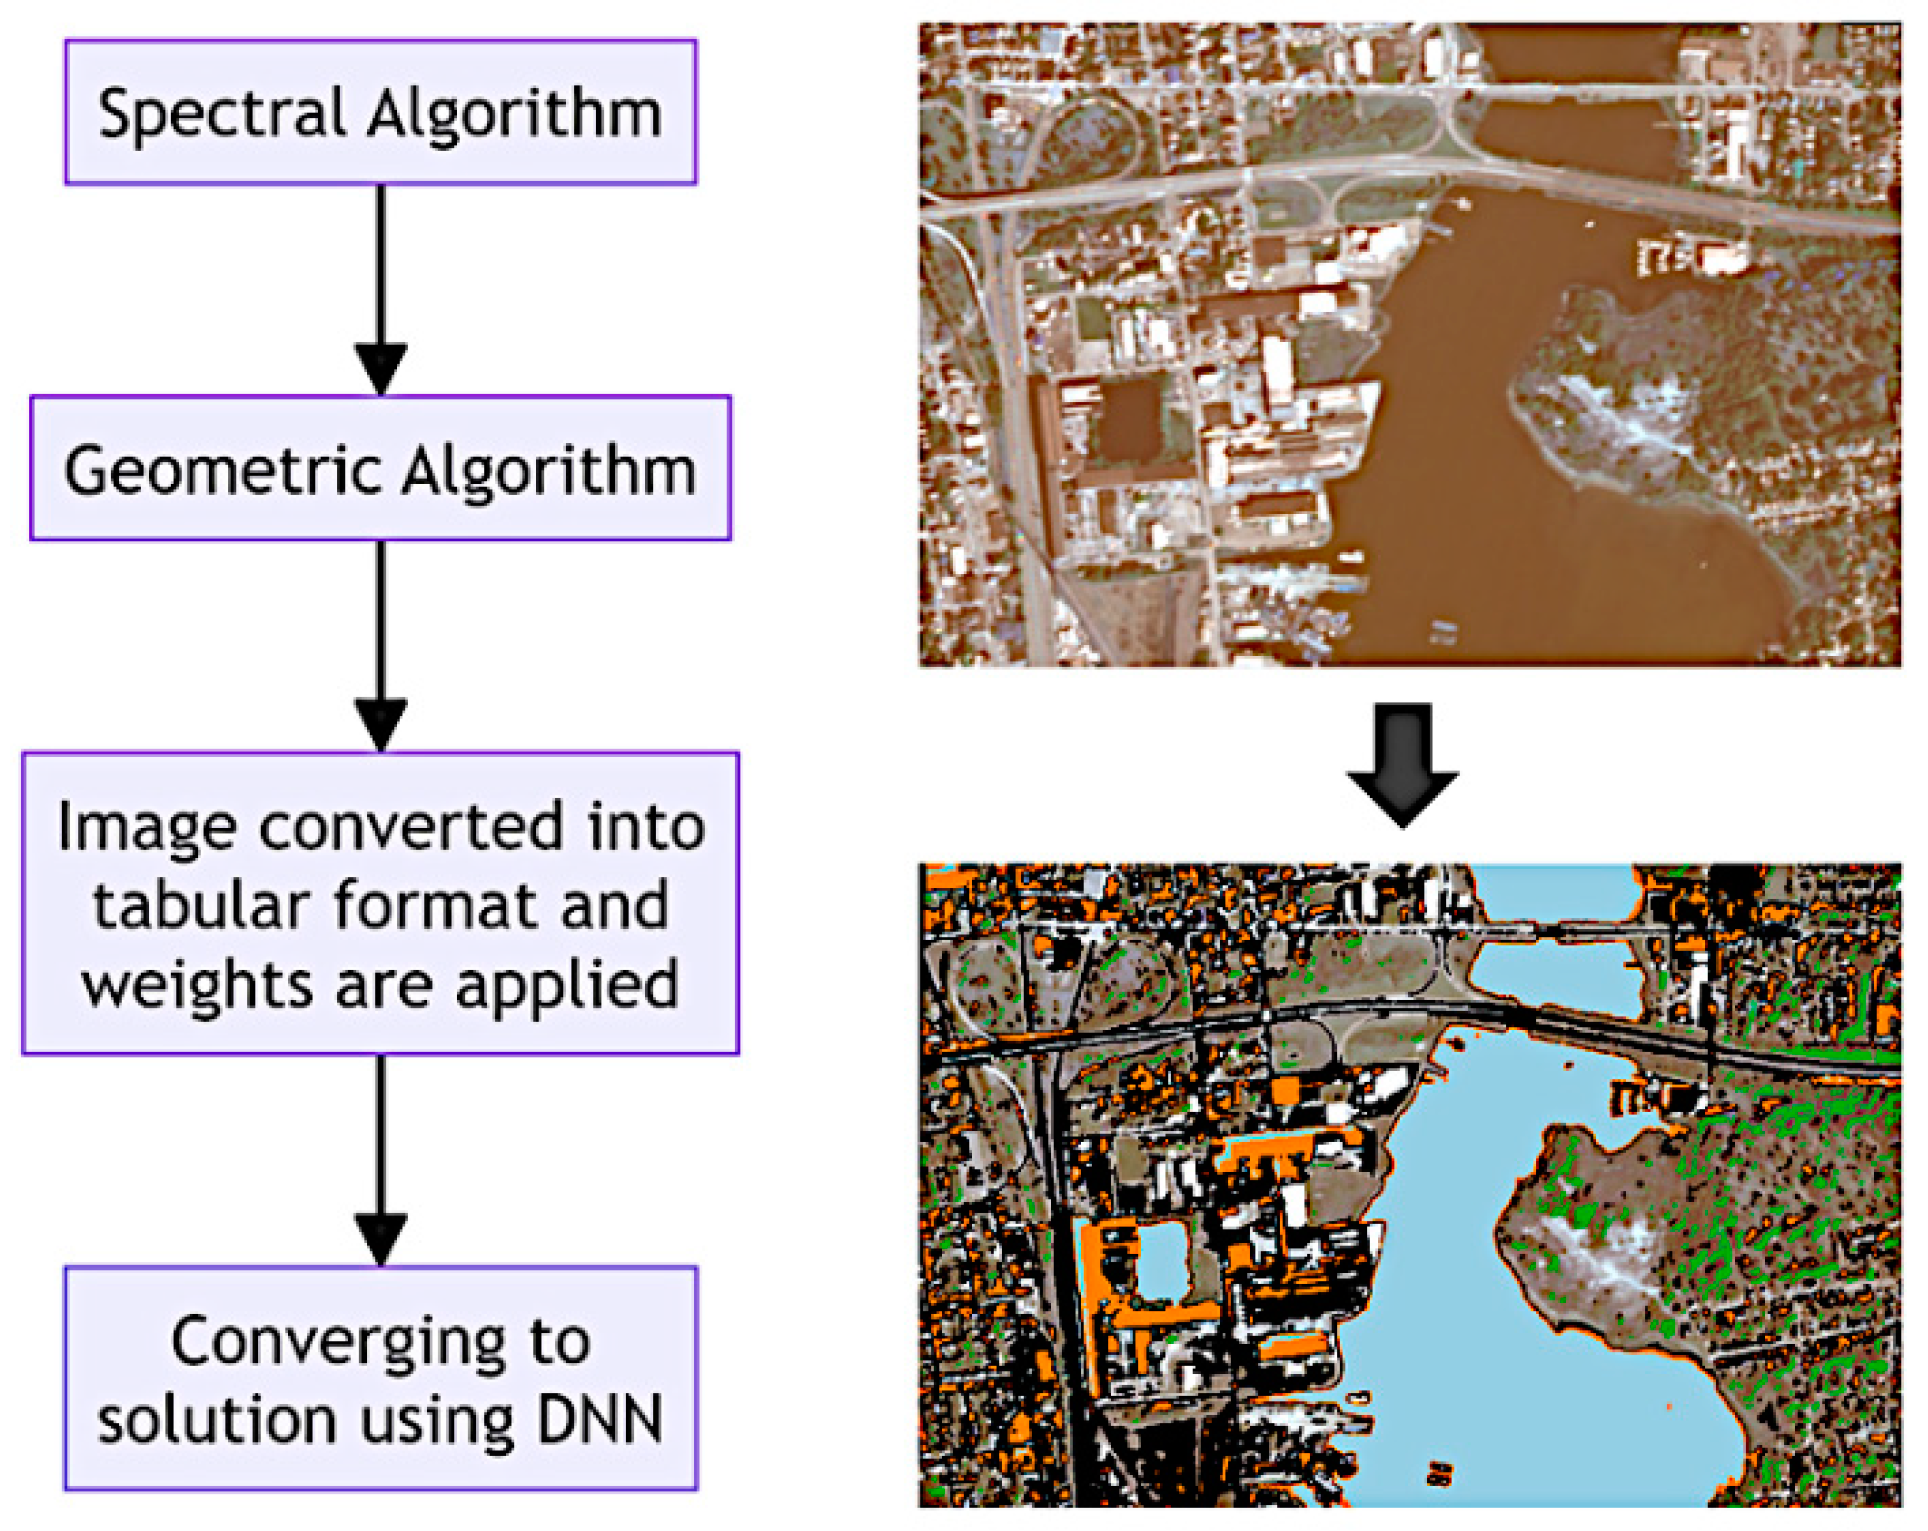
Figure 4 describes the Multiclass application of ECF. The distinctive advantage of Evolutionary Converging Functions (ECF) lies in its ability to transform complex satellite images, rich in features and spectral bands beyond the capability of ordinary cameras, into simple tabular data. This transformation preserves every intricate detail of the image. With this, we concluded the methodology of ECF and looked into the findings we reached going through the process.
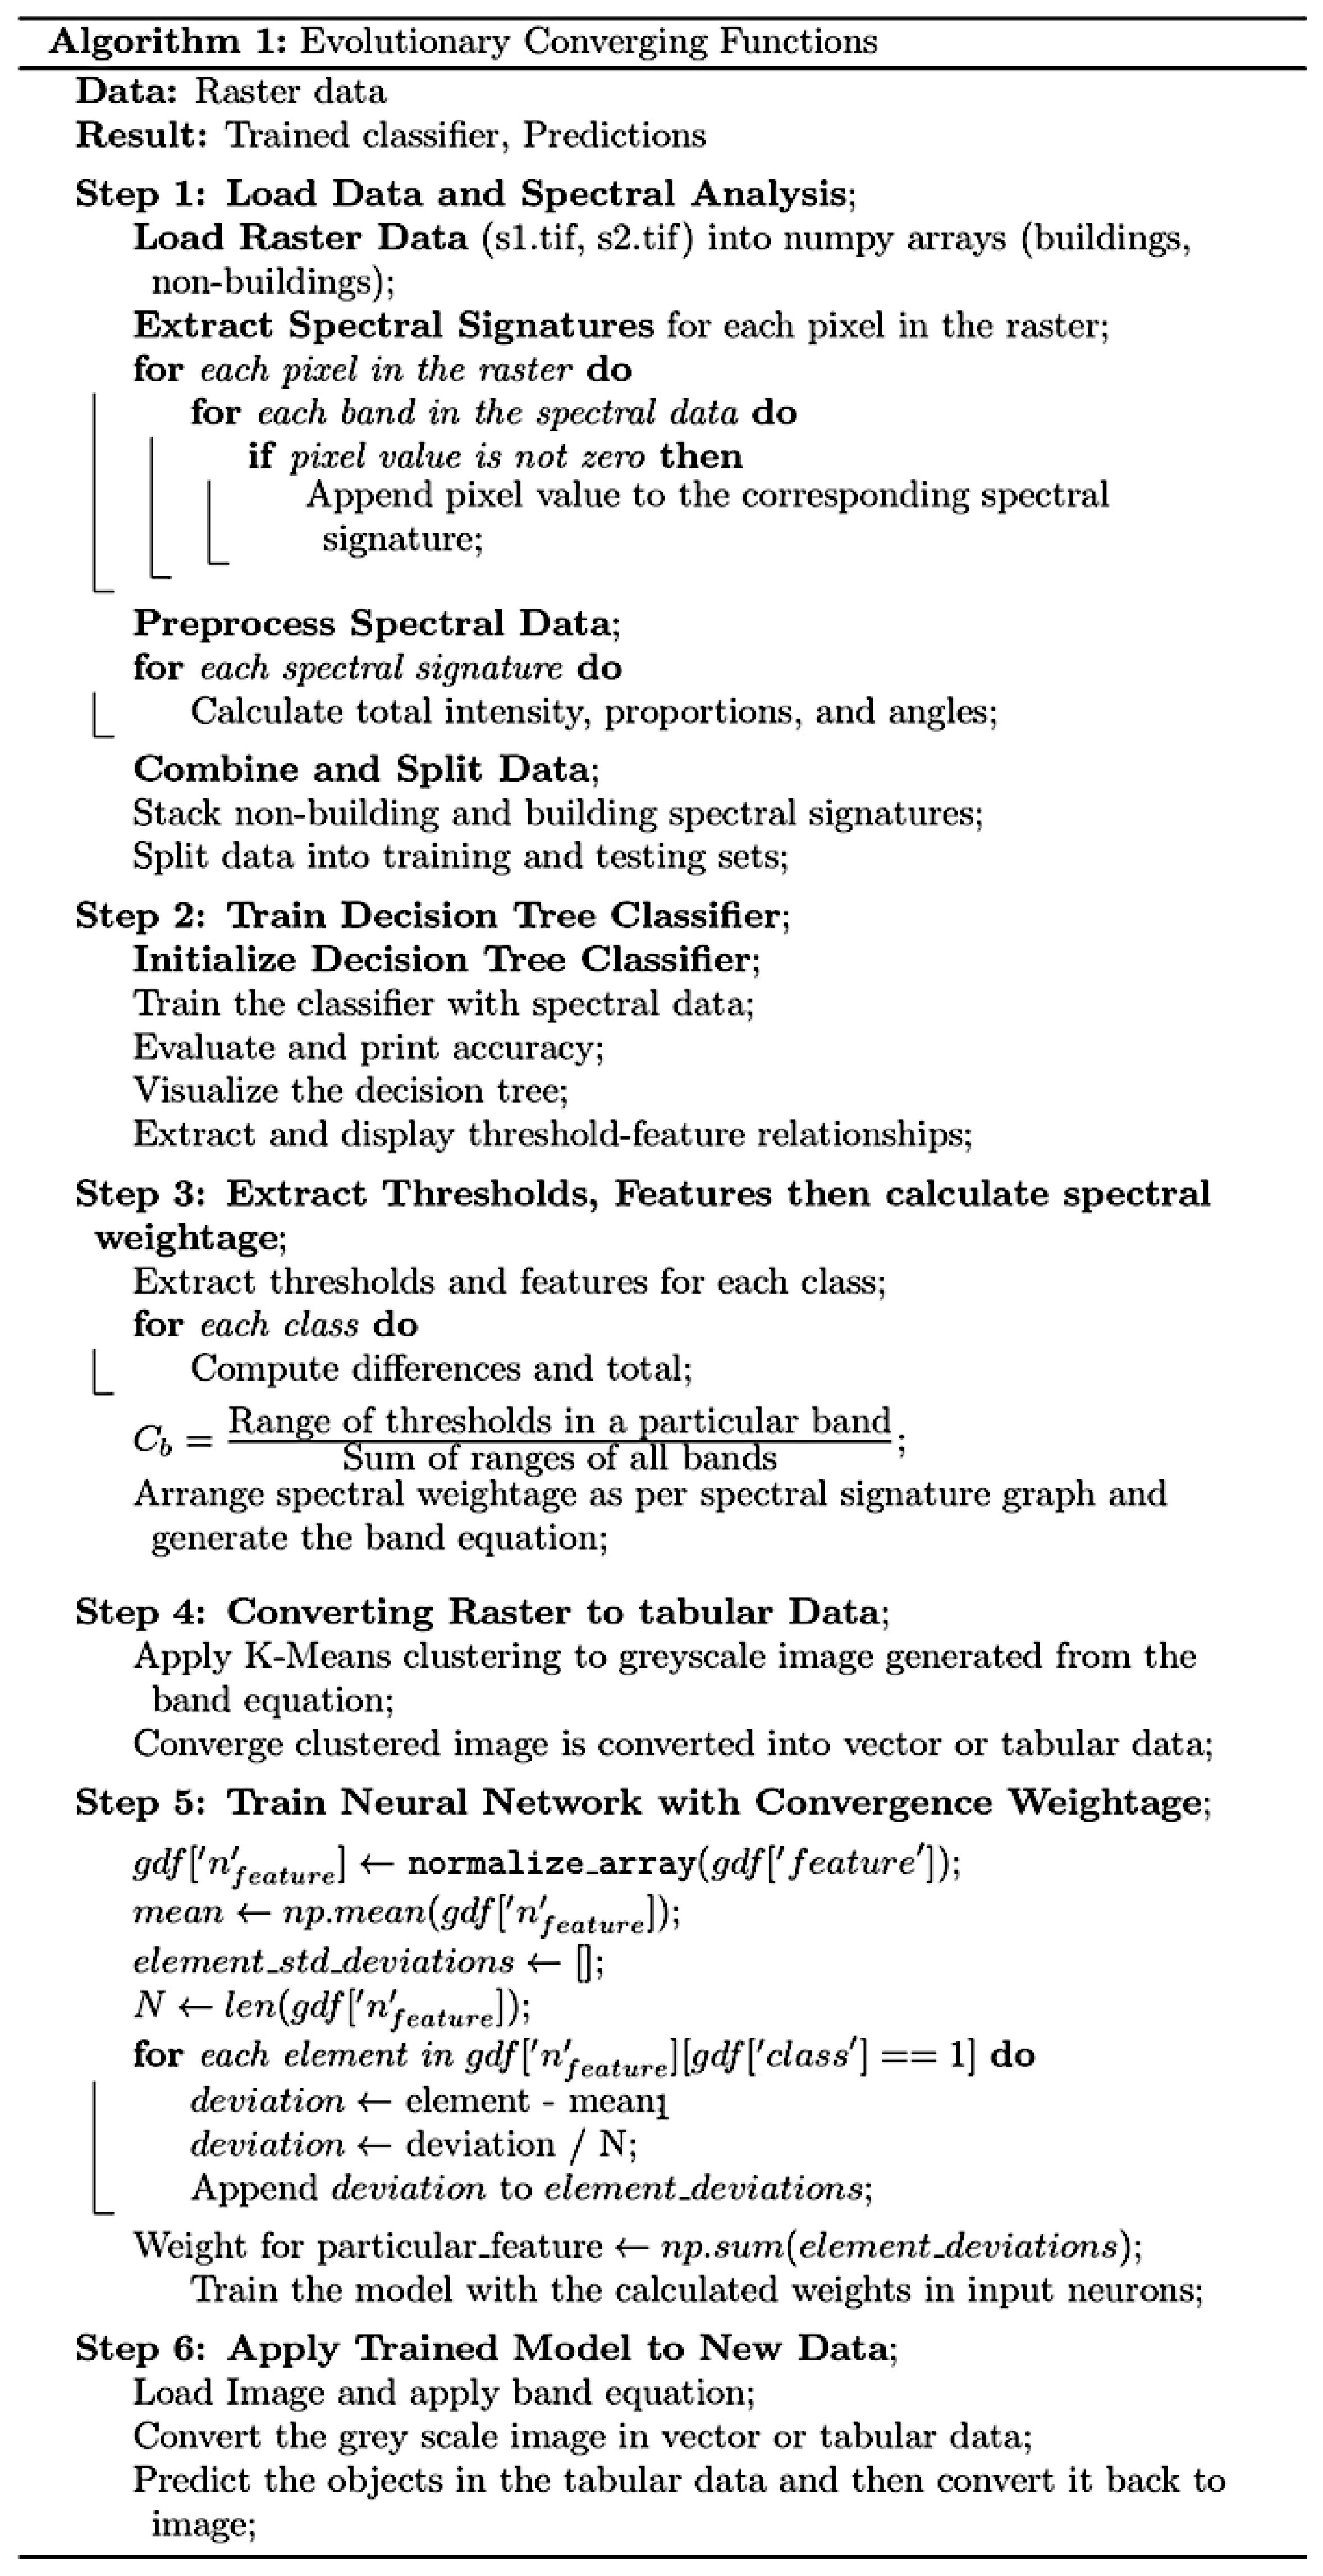
Figure 5 describes the entire process algorithmically.
4. Results And Analysis
To validate and provide evidence of the proposed ECF's superior performance, we will compare it with 31] specialized image segmentation method. Several variants of U-Net [
32] have been proposed, which are do-main-specific, need extensive training data, and are resource-exhaustive. However, the novelty of ECF also lies in the fact that it is a universal method and can be applied to heterogeneous domains. ECF is compared with U-Net using the classification benchmarks given by [
33] prediction accuracy percentage, precision, recall, and Area-under-the-curve to measure performances. Accuracy is a critical indicator of the holistic performance of the model.
4.1. Spectral Evolved Function
As depicted in
Table 3, the following spectral equations are invented using the spectral algorithm. The ECF stands because it is one of the first kinds [
34] to automatically generate its equation, i.e., an algorithm from a decision tree. By applying the formulas below, the multispectral image gets converted into a greyscale image with interested objects highlighted, which makes extraction of the object by clustering possible. Then, it is further processed with a geometric algorithm that can make ECF more accurate. The formulas are made from Planet Skysat satellite DN values and may not work accurately on other satellites.
4.2. Building and Non-Building Classification
As depicted in
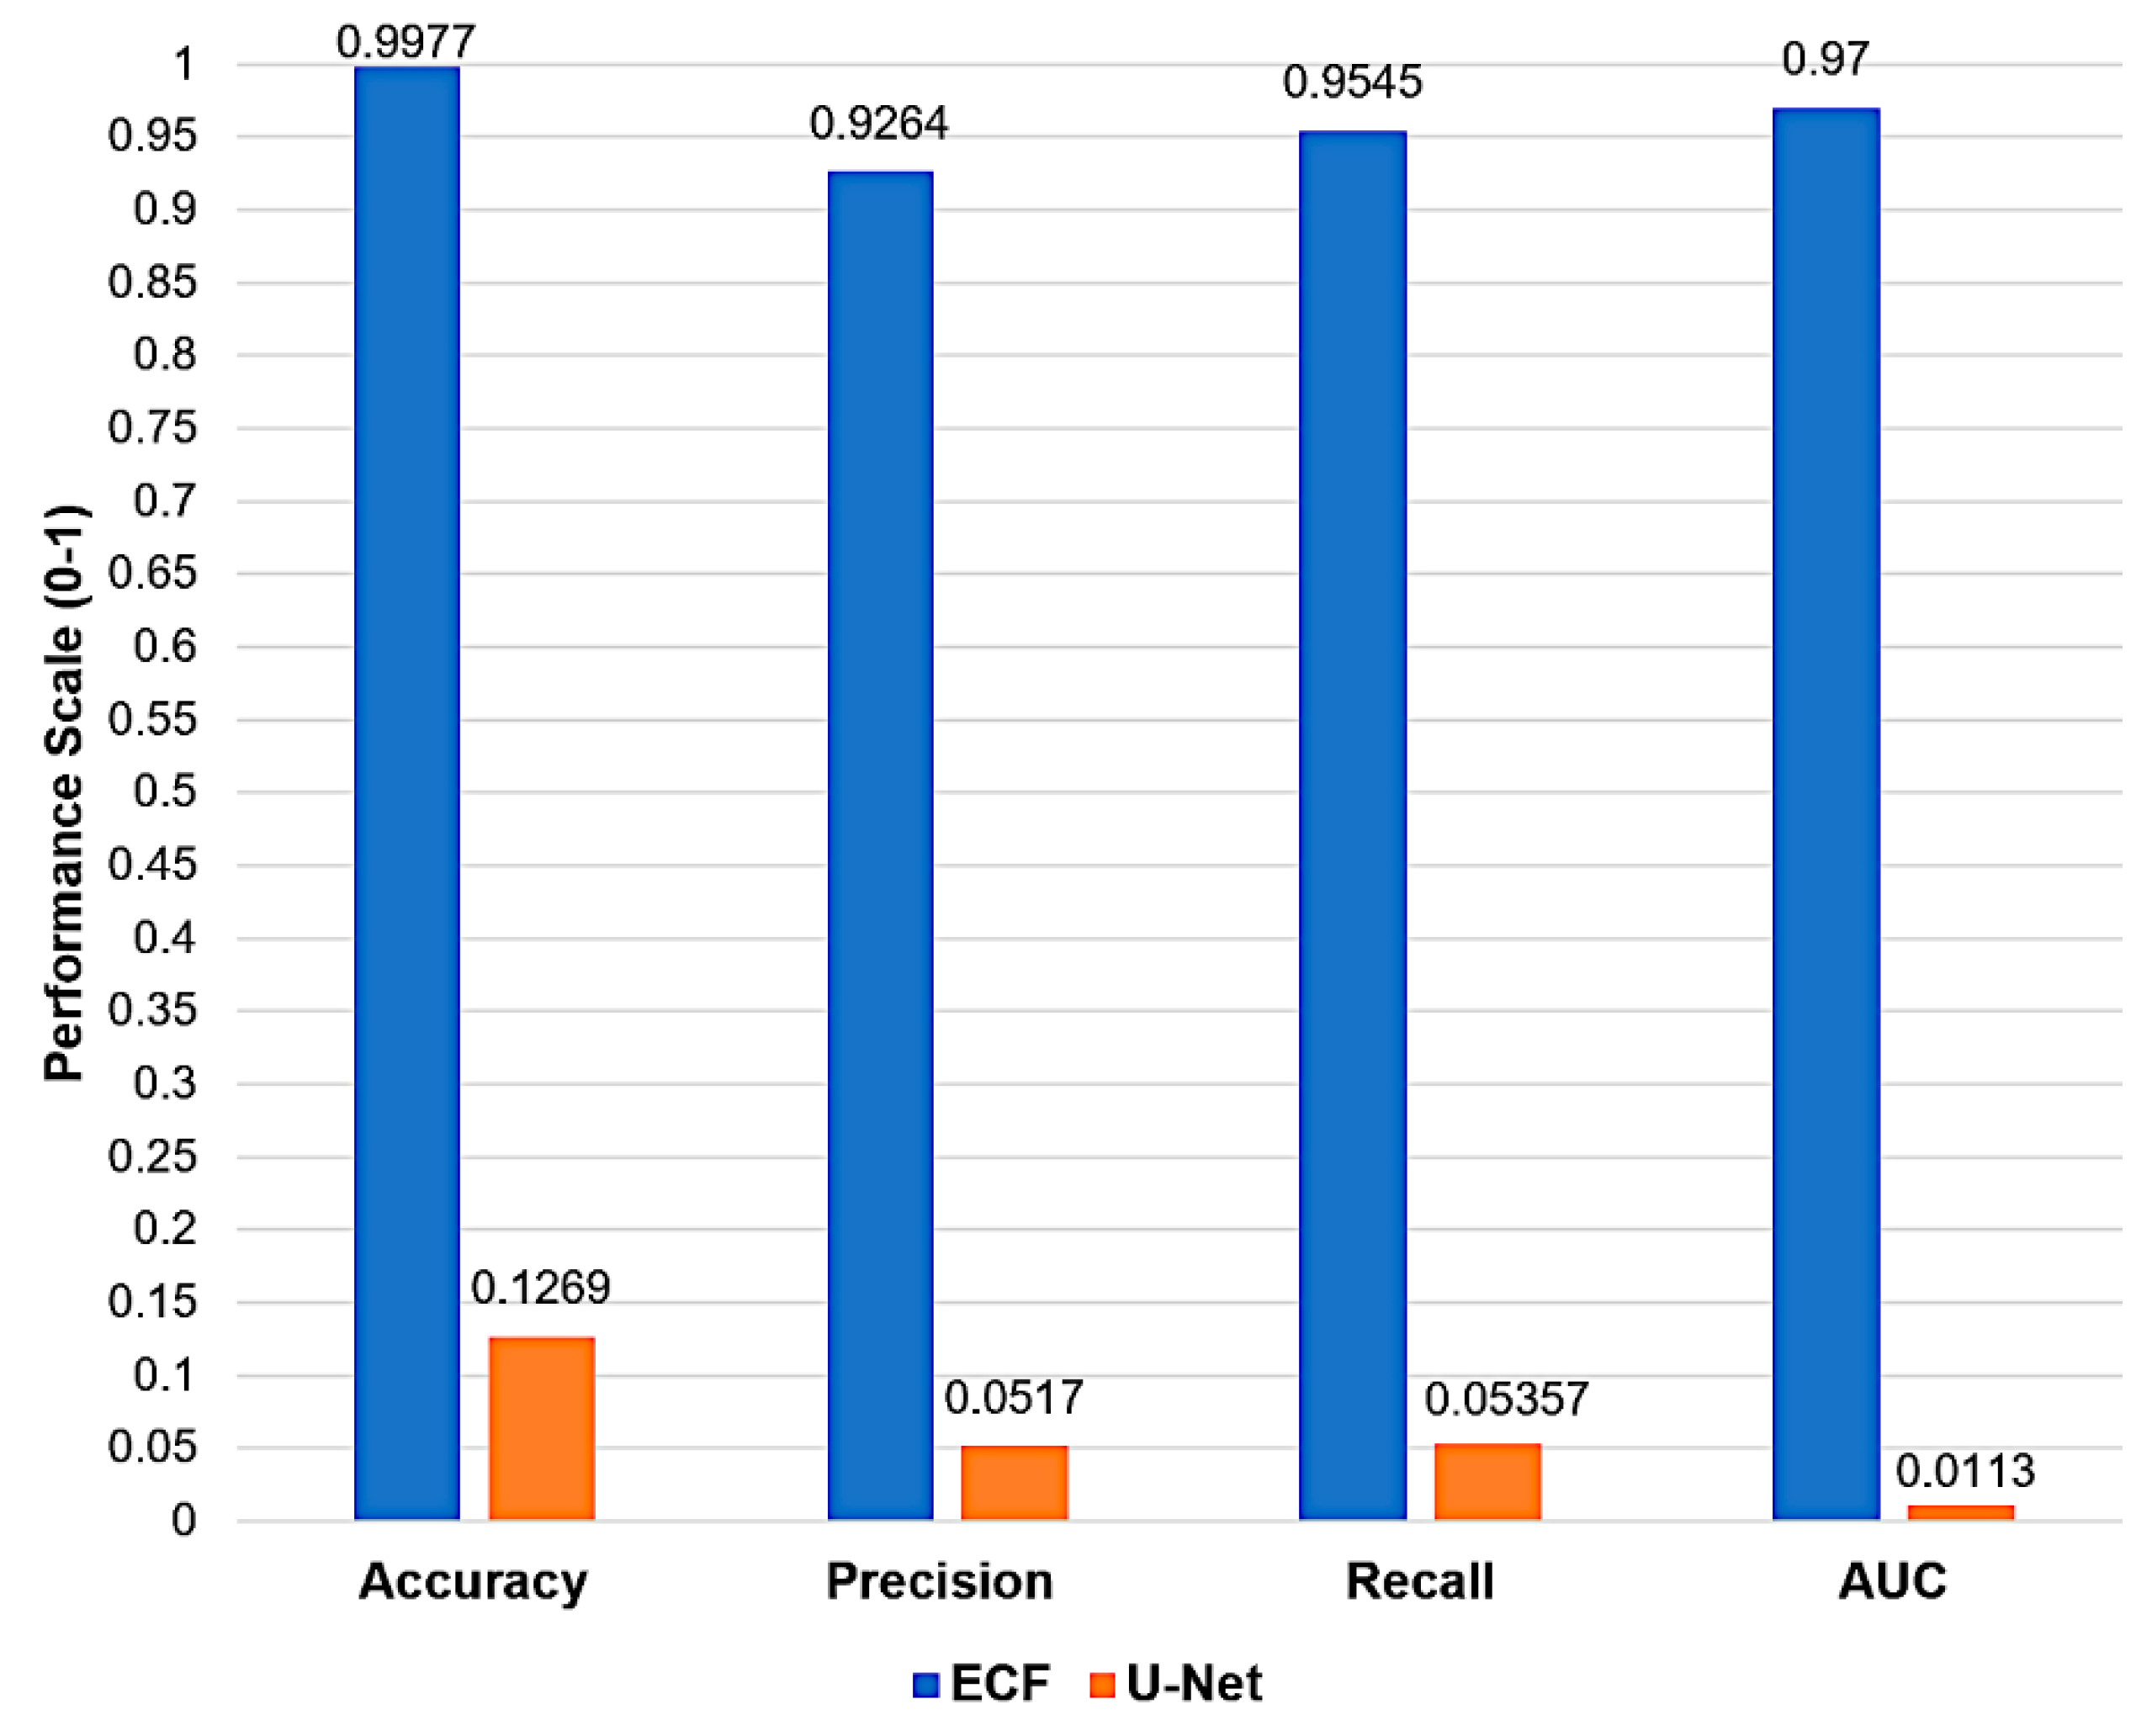
Figure 6, the ECF model produces 99.77% prediction accuracy, which signifies its exceptional capability to classify Building and Non-Building objects correctly. In contrast, the U-Net model exhibits an accuracy of 12.69%, which is considerably low and signifies a higher misclassification rate. ECF achieves a precision rate of 92.64%, reflecting its reliability in identifying Buildings accurately. However, U-Net's precision is at 5.17%, which signifies a higher number of false positives, resulting in an unreliable model for detecting Building objects. Whereas ECF achieves a recall of 95.45%, it is highly effective in predicting most building objects correctly compared to a 5.357% recall of U-Net, which means that it is ineffective in predicting building objects accurately. The classification of buildings has proven crucial for numerous applications [
35]. However, CNNs faced limitations addressed through our AI model, and a generalized workflow has been devised that is applicable across various scenarios.
Further, the ECF has an AUC of 0.97, which is nearer to 1, which signifies that the ECF model is strongly differentiating between Building and Non-building objects compared to 0.0113 AUC of U-Net which is closer to 0 baseline indicates weak ability to distinguish the two classes.
4.3. Road and Non-Road Classification
As depicted in
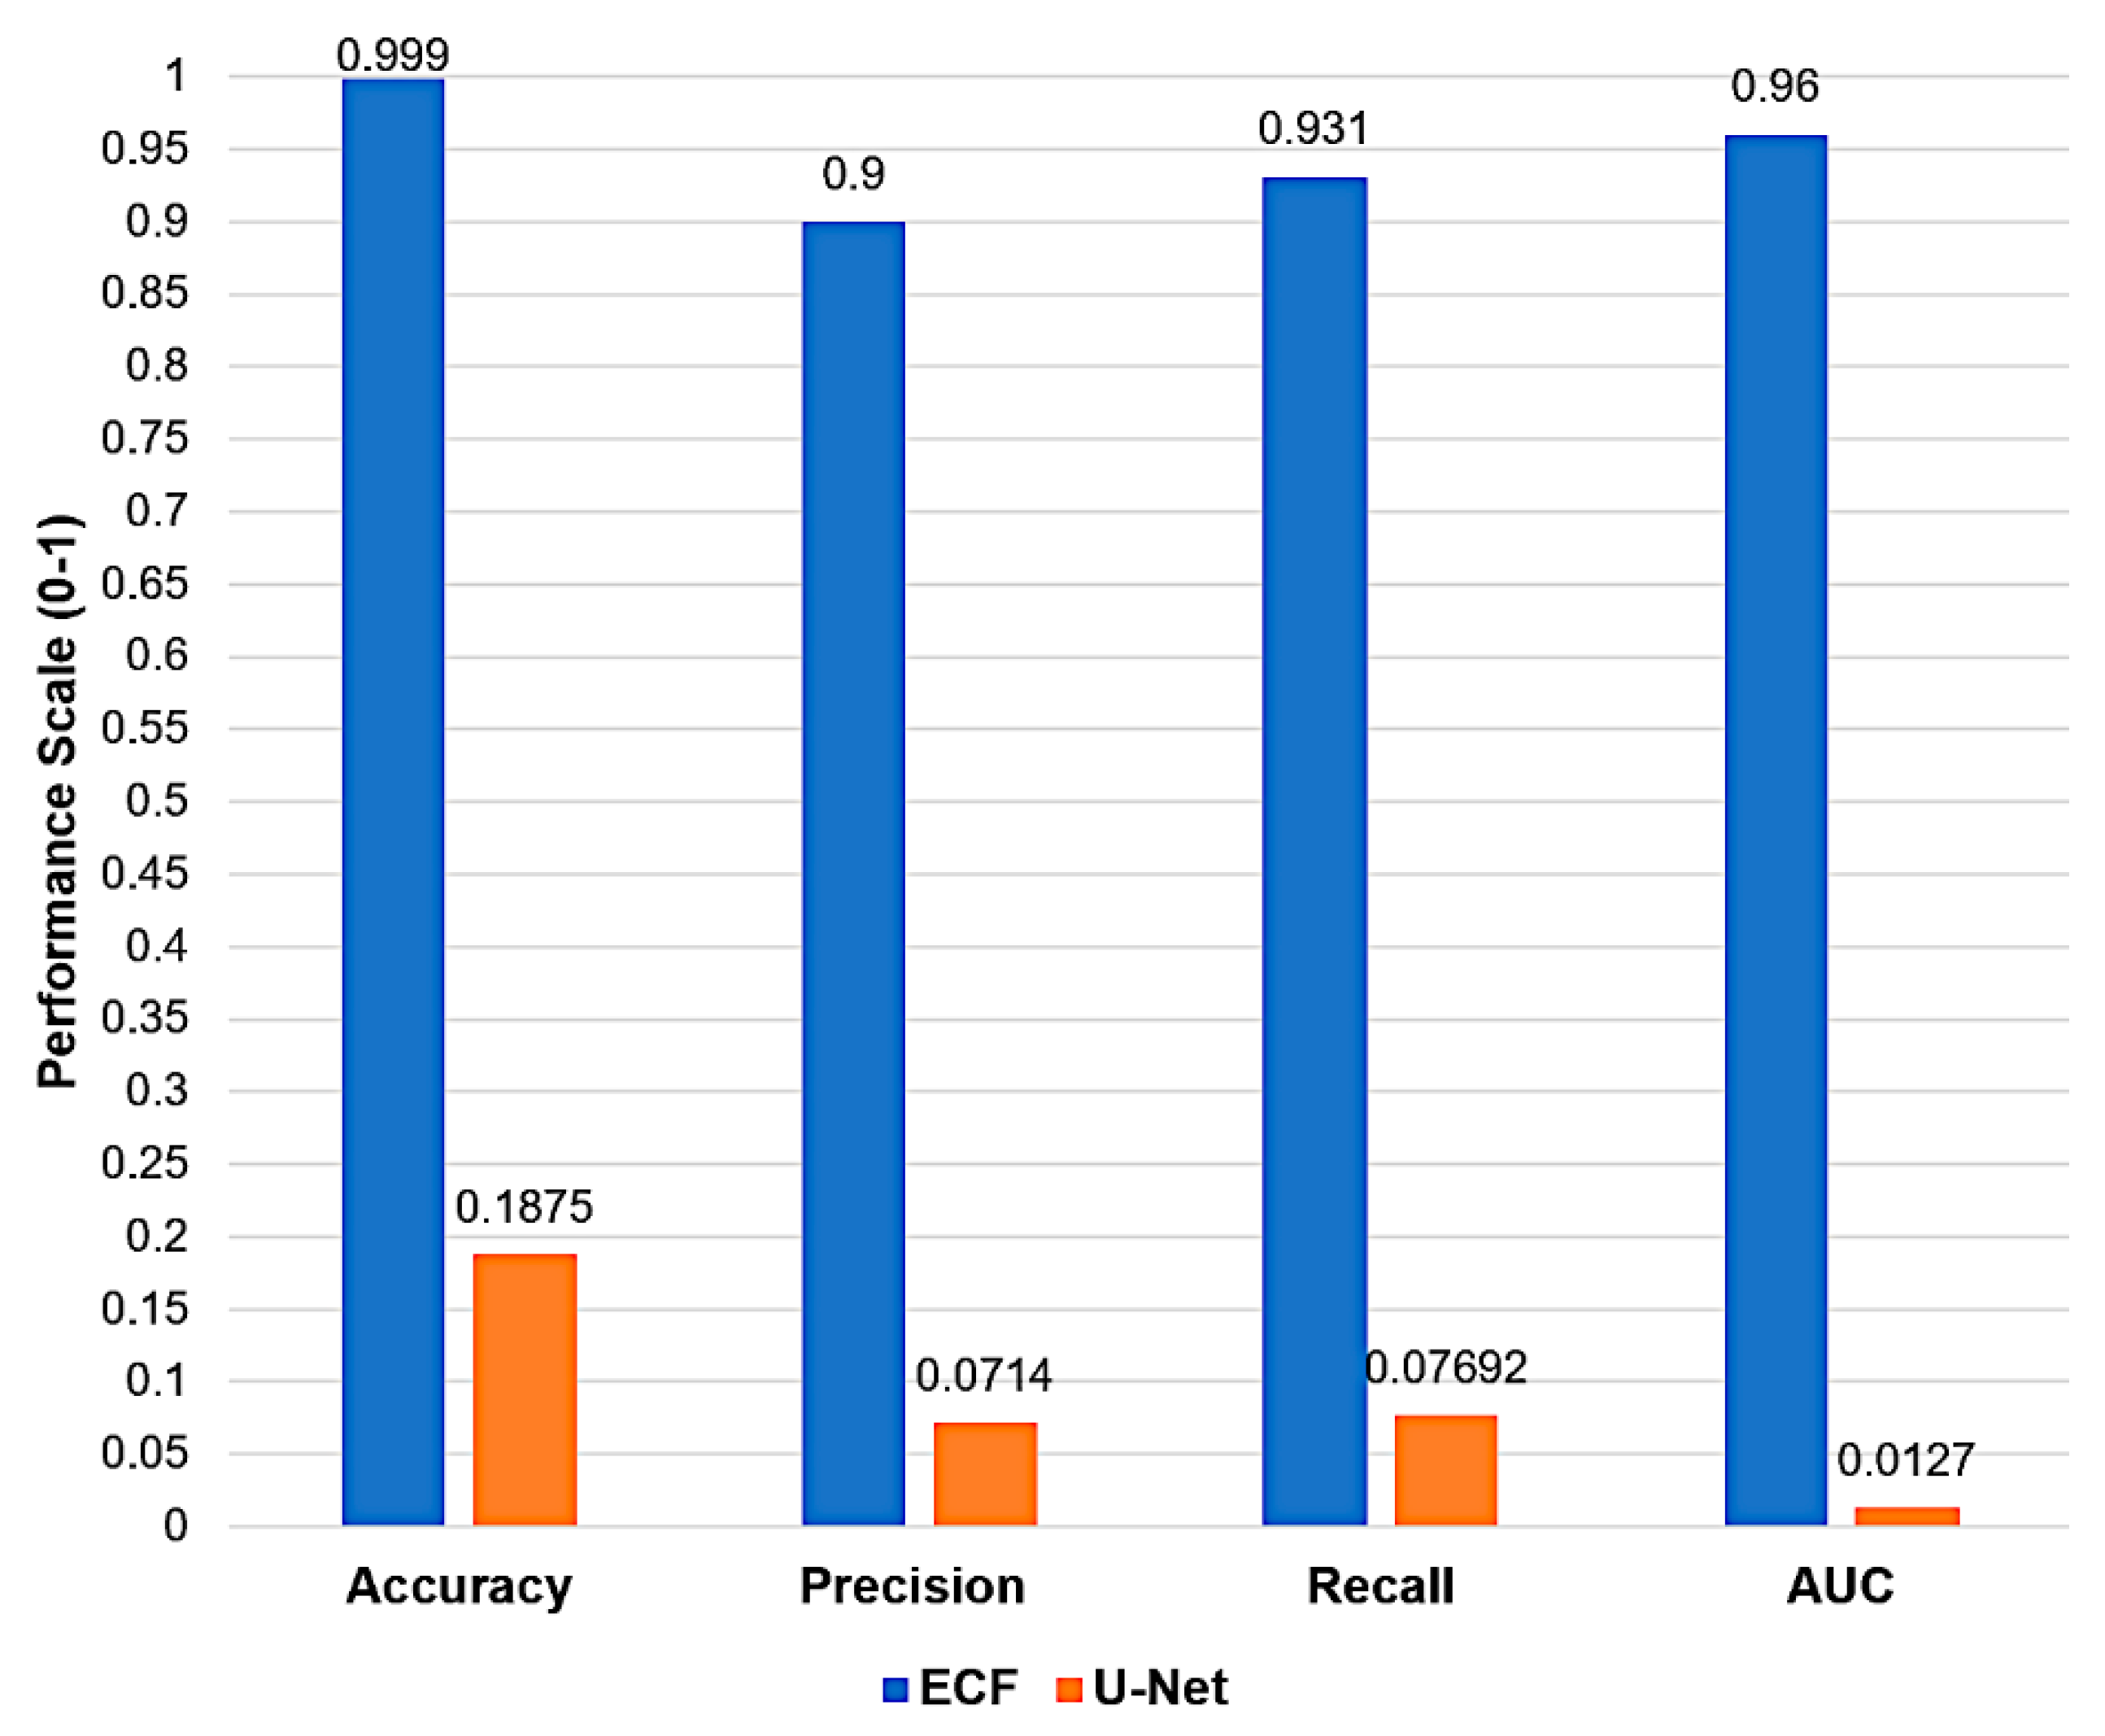
Figure 7, the ECF model produces 99.99% prediction accuracy, which signifies its exceptional capability to classify Road and Non-Road objects correctly. In contrast, the U-Net model exhibits an accuracy of 18.75%, which is considerably low and signifies a higher misclassification rate. ECF achieves a precision rate of 90%, reflecting its reliability in identifying Roads accurately. However, U-Net's precision is at 7.14%, which signifies a higher number of false positives, resulting in an unreliable model for detecting Road objects. Whereas ECF achieves a recall of 93.10%, it is highly effective in predicting most Road objects correctly compared to merely 7.692% recall of U-Net, which means ineffectiveness in predicting Road objects accurately. Road classification has been significant for many purposes [
36]. Still, there were some limitations with CNNs that ECF has overcome by increasing the learning rate of the AI model and creating a generalized, universally applicable workflow.
Further, the ECF has an AUC of 0.96, which is nearer to 1, which signifies that the ECF model is strongly differentiating between Road and Non-Road objects compared to 0.0127 AUC of U-Net which is closer to 0 baseline indicates weak ability to determine the two classes.
4.4. Tree and Non-Tree Classification
As depicted in
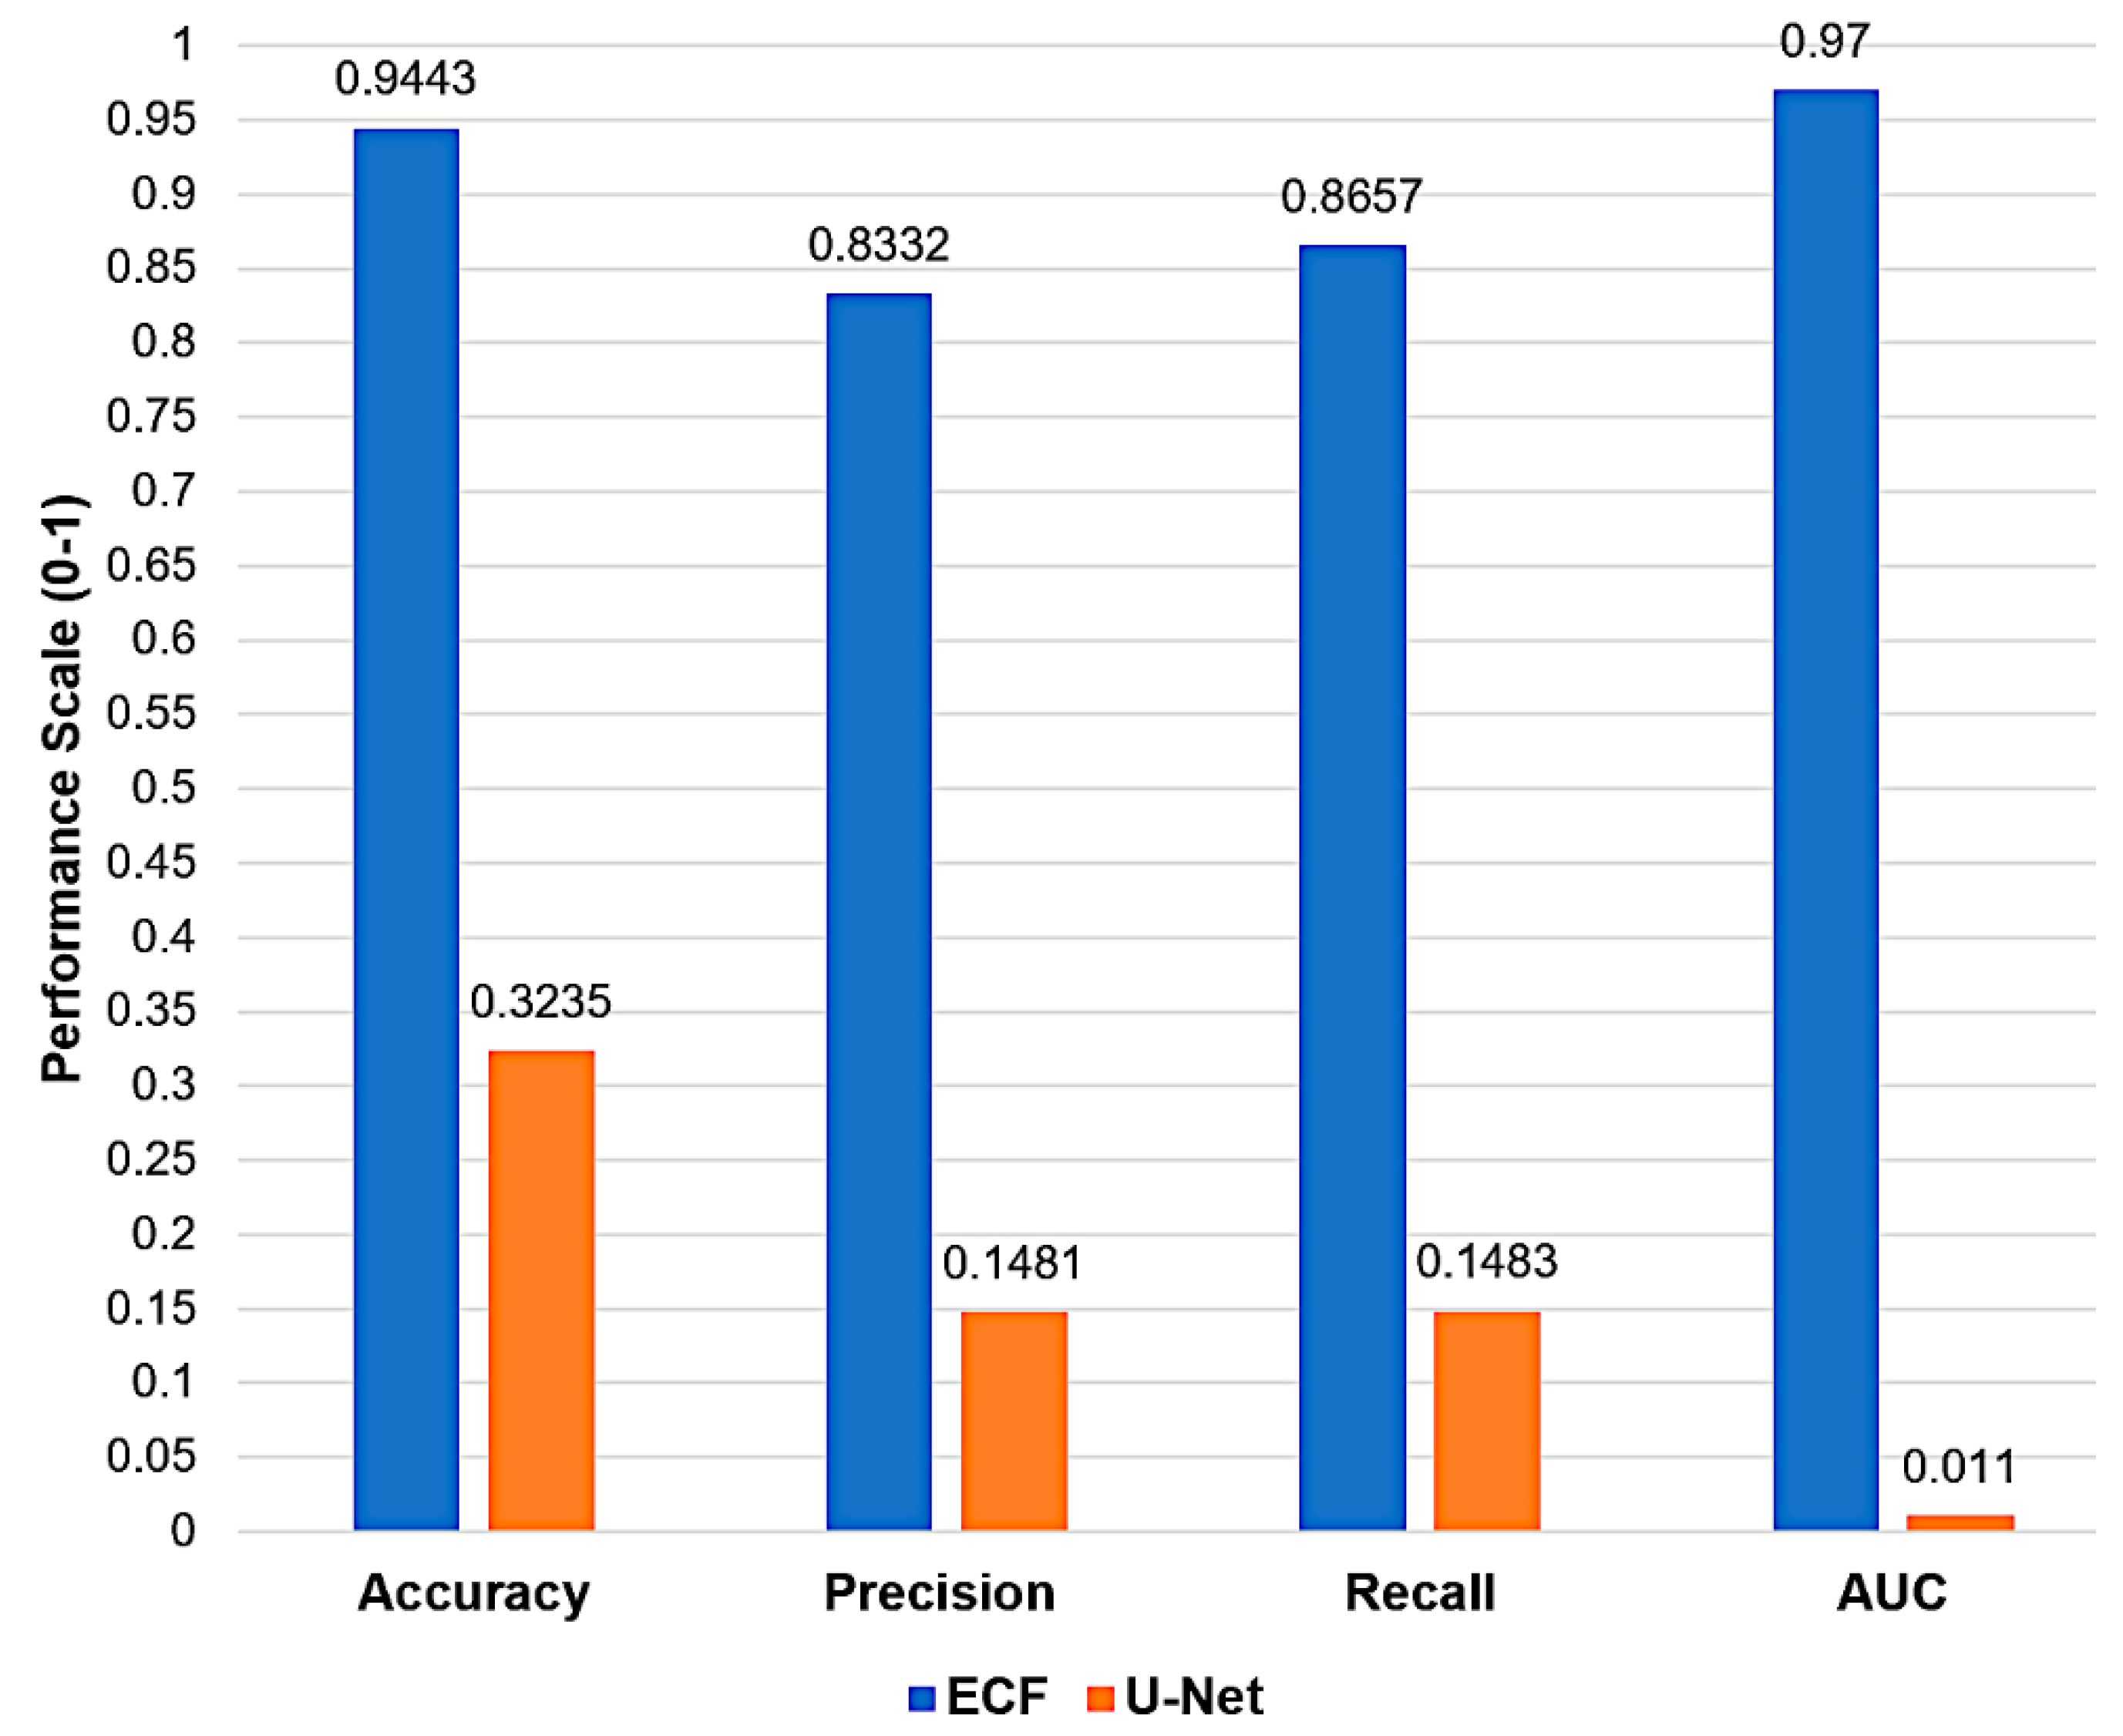
Figure 8, the ECF model produces 94.43 prediction accuracy, which signifies its exceptional capability to correctly classify Tree and Non-Tree objects. In contrast, the U-Net model exhibits an accuracy of 32.35, which is considerably low and indicates a higher misclassification rate. ECF achieves a precision rate of 83.32, reflecting its reliability in identifying Trees accurately. However, U-Net's precision is at 14.81, which signifies a higher number of false positives, resulting in an unreliable model for detecting Tree objects. Whereas ECF achieves a recall of 86.57, it is highly effective in predicting most Tree objects correctly compared to merely 14.83 recall of U-Net, which means ineffectiveness in predicting Tree objects accurately.
Further, the ECF has an AUC of 0.97, which is nearer to 1, which signifies that the ECF model is strongly differentiating between Tree and Non-Tree objects compared to 0.011 AUC of U-Net which is closer to 0 baseline, indicating a weak ability to distinguish the two classes.
4.5. Water and Non-Water Classification
As depicted in
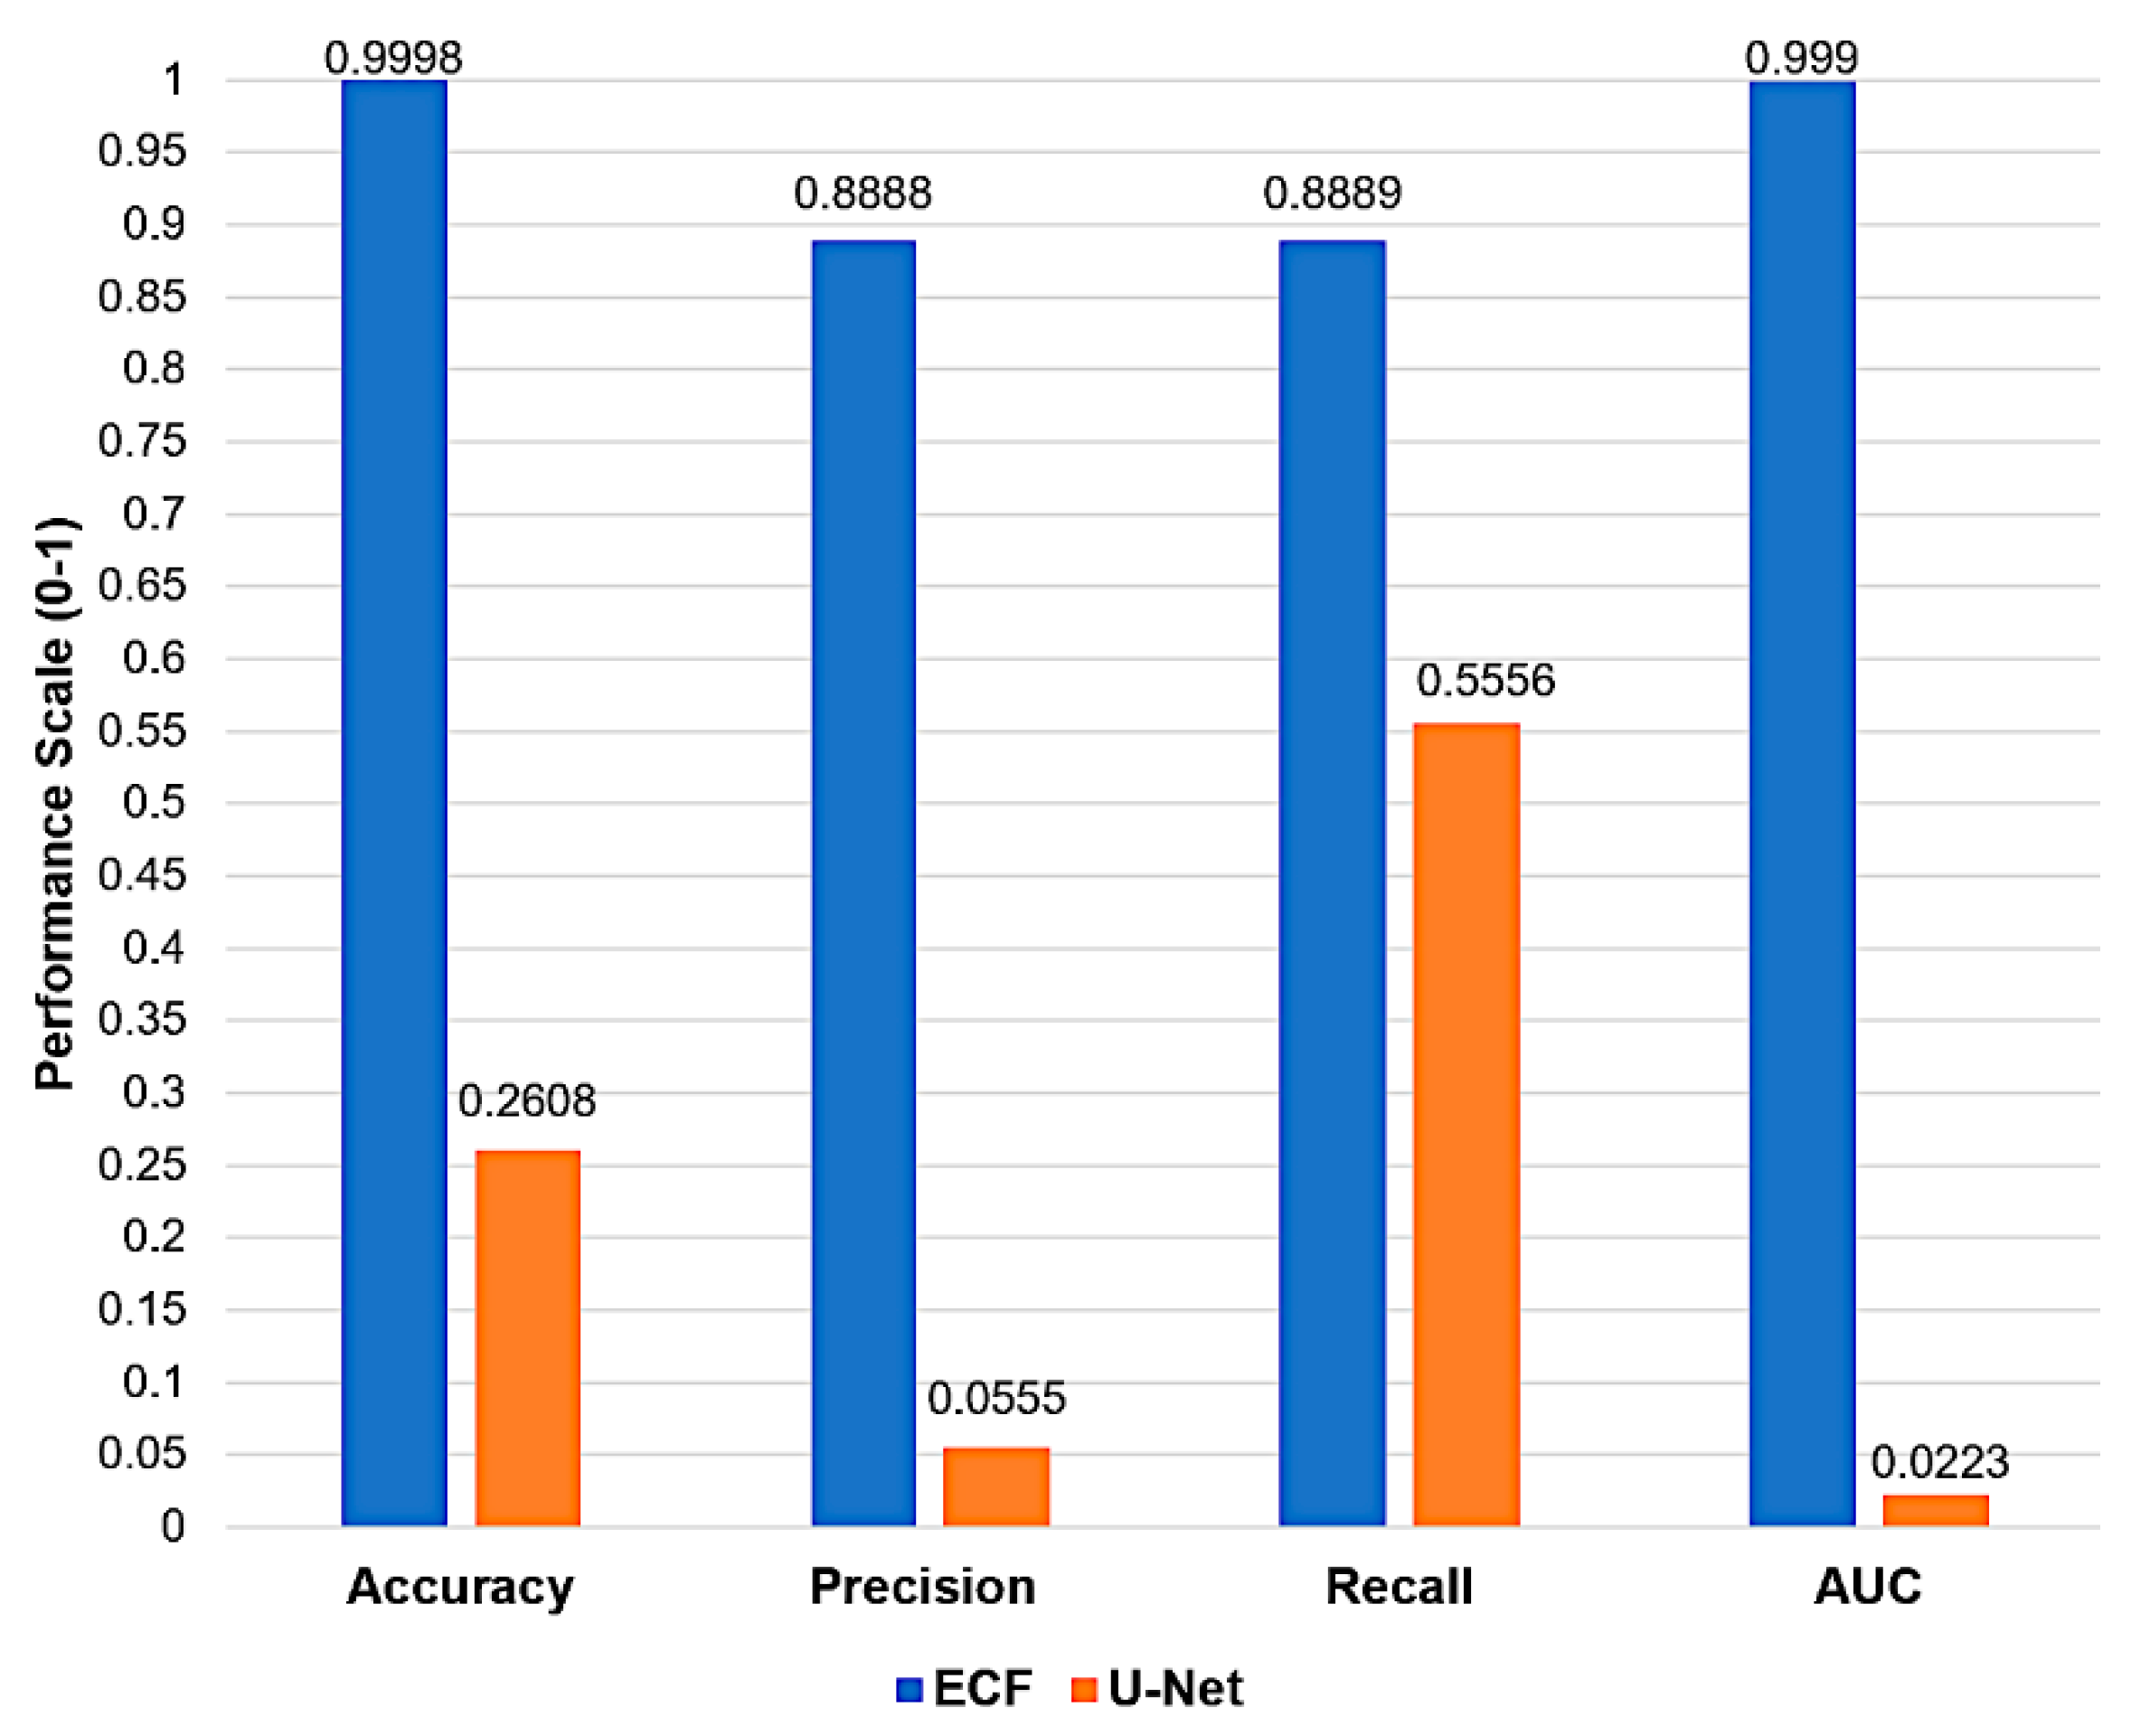
Figure 9, the ECF model produces 99.98% prediction accuracy, which signifies its exceptional capability to classify Water and Non-Water objects correctly. In contrast, the U-Net model exhibits an accuracy of 26.08%, which is considerably low and signifies a higher misclassification rate. ECF achieves a precision rate of 88.88%, reflecting its reliability in accurately identifying water objects. However, U-Net's precision is at 5.55%, which signifies more false positives, resulting in an unreliable model for detecting Water objects. Whereas ECF achieves a recall of 88.89%, it is highly effective in predicting most water objects correctly compared to a recall of merely 55.56% of U-Net, which means ineffectiveness in predicting water objects accurately.
Further, the ECF has an AUC of 0.999, which is nearer to 1, which signifies that the ECF model is strongly differentiating between Water and Non-water objects compared to 0.0223 AUC of U-Net which is closer to 0 baseline indicates weak ability to distinguish the two classes.
4.6. Prediction Time
One of our primary objectives, alongside object detection accuracy and other performance benchmarks of object detection in satellite imagery, is to minimize computational expenses through ECF. This is critical for deploying ECF applications on devices with limited memory, processing capabilities, and power resources. As depicted in
Figure 10, ECF has superior speed across various object classification tasks compared to U-Net, which is very slow in predicting. For classifying buildings from non-building objects, the ECF took 66 seconds, significantly faster than U-Net's 204 seconds. Similar patterns are noted for road and non-road, as well as tree and non-tree classification between ECF and U-Net.
The most striking contrast is in the water and non-water object classification, where ECF merely took 31.8 seconds, and U-Net took 210 seconds. For all four cases, the prediction time of ECF is the evidential proof that shows ECF is substantially faster, which means it needs fewer computational resources for binary classification tasks in the con-texts tested.
Author Contributions
"Conceptualization, F.A., S.M and P.P.; methodology, S.M., and F.A.; validation, F.A. formal analysis, F.A., and S.M; resources, A.A.; data curation, S.M.; software, S.M.; writing—original draft preparation, F.A.; writing—review and editing, F.A. and S.M.; visualization, A.A. and T.A.; supervision, F.A.; project administration, F.A. All authors have read and agreed to the published version of the manuscript."

