1. Introduction
Leishmaniasis ranks among the top ten neglected tropical diseases (NTD) with 0.7 to 2M new cases with 12 million overall prevalence, 20,000 to 30,000 deaths, and >350M people at risk of infection per year [
1,
2,
3]. These numbers are presumed to be underestimations, due to non-mandatory reporting and unrecognized cases [
4]. Leishmania parasites are endemic in almost 100 countries spanning large areas of the tropics and subtropics which can be divided into “Old World” (Europe, Africa, Asia) and “New World” (North America, South America, Caribbean) based on geographic location [
1,
5,
6]. Individuals infected with Leishmaniasis can suffer from three main forms of disease: visceral (VL or kala-azar, black fever), cutaneous (CL) and muco-cutaneous (MCL). Visceral, the most serious, impacts several internal organs, such as spleen and liver, and can be fatal if left untreated [
7,
8]. A secondary complication of VL is skin rashes consisting of macules, papules, or nodules (post-kala-azar dermal leishmaniasis) [
9]. Cutaneous, the most common, causes skin sores which can vary in severity, number and appearance [
10]. MCL impacts the mucosal membranes of the nose, mouth and throat, which can lead to permanent disfigurement and pain [
11]. In 2020, of the 200 countries and territories that reported to the WHO, 98 (49%) were considered endemic for leishmaniasis [
12]. Both MCL and VL can initially present with cutaneous lesions, therefore rapid diagnosis of more severe disease-causing species is vastly important [
13,
14]. While the majority of the 21 species that infect humans cause CL
, L. donovani and
L. infantum, are most commonly associated with VL in the Old World, whereas
L. brazilensis, L. panamensis, and
L. guyanensis are most common for MCL in the New World [
10,
15].
Consensus from clinicians in endemic regions of low- and middle-income countries (LMIC) indicates that the most accurate and reliable methods of diagnosis, PCR and qPCR, are generally restricted to larger clinics in more urban settings and, where available, can be cost prohibitive at >
$45(US) [
16,
17,
18,
19]. Initial diagnosis of leishmaniasis is typically performed using microscopic examination of lesion scrapings for CL or blood and bone marrow aspirates for VL [
20,
21,
22]. When Leishmaniasis is suspected, nucleic acid-based tests such as PCR or qPCR are used for definitive diagnosis. In low-resource settings, confirmative diagnostic tests can be impacted by factors such as distance to clinic, lack of electricity, availability of supplies, instrumentation and/or trained personnel [
17,
23]. Samples can be sent to central laboratories, but the results are often not available for two or more weeks which can make patient follow-up difficult and delay treatment. In addition, the cost of DNA purification and PCR (approximately
$45 per test) can be a barrier.
What is lacking is an accurate and sensitive, low-cost, instrument-free leishmania diagnostic that can be deployed into the field and used in low-resource settings [
24]. Current available options compatible with field detection include clinical evaluation and either microscopic examination (lesion scrapings, biopsy impression smears and histopathology) or rapid antibody tests including: IT Leish from Bio-Rad, CL Detect ™ from InBios International, Inc., and Signal®KA from Span Diagnostics Ltd. [
25,
26,
27]. Limitations of microscopic examination include the inability to distinguish between different species of Leishmania [
1,
28]. Limitations of antibody tests include the inability to distinguish between active and past infections. False positive diagnosis may lead to unnecessary therapies with expensive and toxic drugs while false negative diagnosis correlate to prolonged disease course and greater patient suffering [
28].
Treatment of Leishmaniasis is determined by type of disease, stemming from parasite identify, and can be involved and expensive, especially for impoverished regions where travel into city centers is required for PCR confirmation and treatment [
29,
30]. Although there is no universal treatment procedure for leishmaniasis, current practices include intravenous pentavalent antimonials, chemotherapies and antifungal azole drugs, with durations in excess of 28 days which require residing at or near treating hospitals [
5,
31,
32]. Due to the frequent side effects of the drugs, aggressive treatment is often reserved for those with visceral, mucocutaneous, or severe cutaneous disease.
To improve the diagnostic process, we are developing a rapid nucleic acid diagnostic that requires no electricity or instrumentation and can be used in the field, point-of-care clinics, or low-resource settings as well as advanced care and state-of-the-art hospitals [
33,
34,
35,
36,
37]. The process is sensitive and specific rivaling the results produced by PCR in laboratory settings. The technology uses detergent lysis of parasites to release target DNA, Recombinase Polymerase Amplification (RPA) to boost sensitivity, and finally, Clustered Regularly Interspaced Short Palindromic Repeats (CRISPR-Cas12a) for specific detection. In this report, we present data derived using thin-wall PCR tubes and plan to adapt the assay to a novel multichambered “Funnel-Adapted Sensing Tube” (FAST) device. The diagnostic will incorporate reactions for identification of (1) all Leishmania species while avoiding the detection of Trypanasoma spp. [All], (2) selected species that cause either MC or VL disease, and (3) a final chamber for detection of human DNA as a positive control [Human Control]. We demonstrate detection of target DNA sequences from less than one parasite and differential detection of
L. braziliensis, as species that can cause MCL`1.
2. Materials and Methods
The following reagents were obtained through BEI Resources, NIAID, NIH: Leishmania parasite species: Leishmania braziliensis, Strain HOM/BR/75/M2903, NR 50608; Leishmania panamensis, Strain PSC-1 (MHOM/PA/94/PSC 1), NR-50162; Leishmania infantum, Strain HOM/CN/93/KXG-LIU, NR 50605; Leishmania venezuelensis, Strain MHOM/VE/80/H-16, NR-29184; Leishmania tropica, Strain HOM/TR/99/EP41, NR-51828; Leishmania gerbilli, Strain RHO/CN/62/20, NR-50601; Leishmania donovani, Strain HOM/IN/83/AG83, NR-50602. The parasites were propagated in tissue culture. Briefly, frozen samples of the parasites were inoculated into T-25 flasks with Modified M199 medium (Gibco; Ref: 12350-039) supplemented with 10% Heat-Inactivated Fetal Bovine Serum [HIFBS] (Neuromonics; Cat. No. FBS006) and 10 ug/mL Hemin Chloride (Millipore Sigma; Ref: 3741-5GM) at 25⁰C then expanded into T-182 flasks (CellTreat; Ref:229351). When peak density was achieved, the parasites were cryopreserved in 0.5mL aliquots at a final concentration of approximately 3 x 10⁷ parasites/mL in fresh medium with 5% DMSO (Fisher; Ref:BP231-1) in liquid nitrogen for long-term storage. When used as targets in assay development, the parasites were enumerated using a cytometer, pelleted from growth media at 2,000 x g, and washed with phosphate buffered saline (PBS) (Gibco; Ref:10010-031). For purified DNA samples, the parasites were extracted twice each with phenol-chloroform (1:1) (Fisher: Ref:BP1750I-100/BP1145-1) and chloroform (Fisher; Ref: BP1145-1) and ethanol precipitated (Fisher; Ref: A407P-4). For use as crude parasites, the washed parasites were resuspended in PBS for addition of detergents. During these processes, the concentration of parasites in each sample was recorded.
Initial Lysis: 12mL of peak density L. braziliensis, or other species, were harvested, pelleted, washed with 10mL of PBS, pelleted, resuspended in 12mL of PBS (Gibco; Ref:10010-031) and aliquoted into 1.5mL micro-centrifuge tubes. The parasites were pelleted and supernatant decanted, then 200µl of a 0.1% or 0.5% (v/v) solution of the detergents was added: CHAPS (Fisher; Ref: BP571-5), Triton X-100 (Acros; Ref: 21568-2500) , NP40 (Boston BioProducts; Ref: P-872), Tween-20 (Fisher; BP337-500), n-octyl glucopyranoside (Affymetrix; Ref: 29736-26-8) detergents were added and exposed to 56⁰C for 10 minutes. The negative control was an equivalent number of parasites with 1xPBS only. The extent lysis by each detergent was determined microscopically. Compatibility with enzymatic reactions was determined by 2.75µl of lysed DNA to an equivalent number of targets in phenol-extracted DNA using an RPA reaction. As an additional test, 100µl of each lysis condition were added into a 12-well plate (TrueLine; TR5001) with 3 mL of culture media and incubated for 4 days to observe propagation as a sign of un-lysed parasites.
Master preparations of lysed parasites were stored at -20⁰C between experiments.
RPA amplification was conducted using the TwistAmpTM Basic Kit (TwistDx Part #: INTABAS), using a modified protocol of 14µl reactions in PCR tubes [
33,
34,
35,
36,
37,
38,
39,
40]. Each reaction tube consisted of 1µl each of 5µM forward and reverse primers, 6µl of rehydration buffer, 2.5µl of previously diluted polymerase reaction mix [10µl nuclease-free water added to the TwistAmpTM reagent tubes], ~2.75µl Template DNA, 0.8µl MgOAc, and ~2.45µl NG water to final volume. Standard reactions were incubated at 39⁰C for 20 minutes. For visualization on 2.5% agarose gels (BioRad; Ref: 161-3102), 1µl of a 0.1 ug/mL solution of BioLab SYBR Green (Biotium; Ref: 40086) and 2µl 6x tracking dye (NEB; B70245) were added to each tube prior to electrophoresis. A variety of temperatures and incubations times were evaluated to determine RPA parameters and detergent compatibilities
RPA primers were designed after identifying primer sites that flank potential CRISPR guide sequences through the analysis of multiple sequence alignments. Kinetoplast maxicircle DNA (kDNA) was targeted for the diagnostic due to each parasite having 30-50 copies. Maxicircle DNA contains a mixture of sequences that are both conserved and variable between leishmania species. The region targeted for detection maps to nucleotides 1808 to 2769 in the Leishmania panamensis strain PSC1 (maxicircle) kinetoplast (BK010875). Seven forward and eight reverse primers were selected for evaluation and purchased from Integrated DNA Technologies (IDT, Coralville, IA) (
Table 1).
For consensus guides, CRISPOR (hosted by UC Santa Cruz) was used to score and select potential guide target regions. For less common specific guides, manual selection, or bespoke algorithm aided selection (Python) was performed to screen for guides. The IDT website tools were used for generating the remaining constant RNA using the CRISPR-Cas12a guide oligos design tool. In CRISPOR, Step 1 is to input a created consensus sequence for each of the conserved regions, Step 2 is selection of the Homo sapiens Human target genome, and Step 3 identification of the [TTT(A/C/G)-23bp – Cas12a (Cpf1)] – recommended, guides. The highest scoring guides were selected for region 1 (All-1, All-2) and region 2 (All-3, All-4). Target regions for the guides are shown in (
Table 2). IDT website tools were utilized in selecting CRISPR-Cas12a guide oligos (crRNA). The PAM elements are not included in the synthesized RNA guides, but are included in the table (Bold) to demonstrate their importance for predicting specificity. gRNAs that are target conserved and variable regions were purchased. The sequence of the reporter oligo is “56-FAM/TTATT/3IABkFQ” with a 6-carboxyfluorescein modification on the 5’ end and an Iowa Black™ fluorescence quencher modification on the 3’ end.
A standard 20 µl CRISPR detection reaction contains: ITD Alt-R® A.s Cas12a (cfp1) ultra [1.0µl-3.0µl of a 1 µM solution] complexed to the complementary IDT crRNA [1.5µ-3.5µl of a 1µM solution]. The complex is incubated at room temperature of 10 minutes, then to the reaction tube the IDT ssDNA green quench reporter [0.5µl - 1µl of 100µM solution], NEBuffer™ r2.1 10X [2 µl], target DNA [1µl-5µl (undiluted up to 1/100 dilution], and Ambion™ Nuclease Free Water (Invitrogen) to the final volume of 20µl [
33]. The sequence of addition of the reagents is important: Cas12a is complexed with crRNA for 10 minutes at room temperature, after which the remaining reagents are added and the reaction mixed by vortex prior to incubation at 37⁰C for up to 30 minutes. The reaction demonstrated viability with a variety of targets including phenol extracted ethanol purified DNA, 0.1% Triton X-100 crude parasite lysates, and RPA amplified DNA.
For qualitative assessment the fluorescent signal of reaction tubes was observed visually after placement on a blue-light transilluminator (Invitrogen Safe Imager TM 2.0 Cat no. G6600) accompanied with an amber viewing cover. The transilluminator has a narrow emission peak centered at approximately 470 nm which is compatible with the excitation wavelength of the fluorescent reporter tag in our diagnostic assay. Green fluorescent intensity was compared in relation to no-DNA control tubes. An inexpensive “blue light” flashlight will be included in future diagnostic kits for excitation of the fluorescent signal.
For quantitative fluorescent analysis during assay design, reactions were conducted in either 96-well (CellTreat; Ref: 229195) (80µl reactions) or 384-well plates (Greiner: Ref: 781-096) (20µl reactions) and placed into a fluorescent plate reader (Thermo Scientific Spectrophotometer Varioskan LUX machine, Ref# VLBL00D0) using an excitation wavelength of 485nm and an emission of 520nm. Unless indicated the machine is pre-warmed to 37⁰C prior to plate insertion and either single or kinetic loop readings are taken. Resulting information is exported from SkanIT™ Software into Excel for graphical production.
3. Results
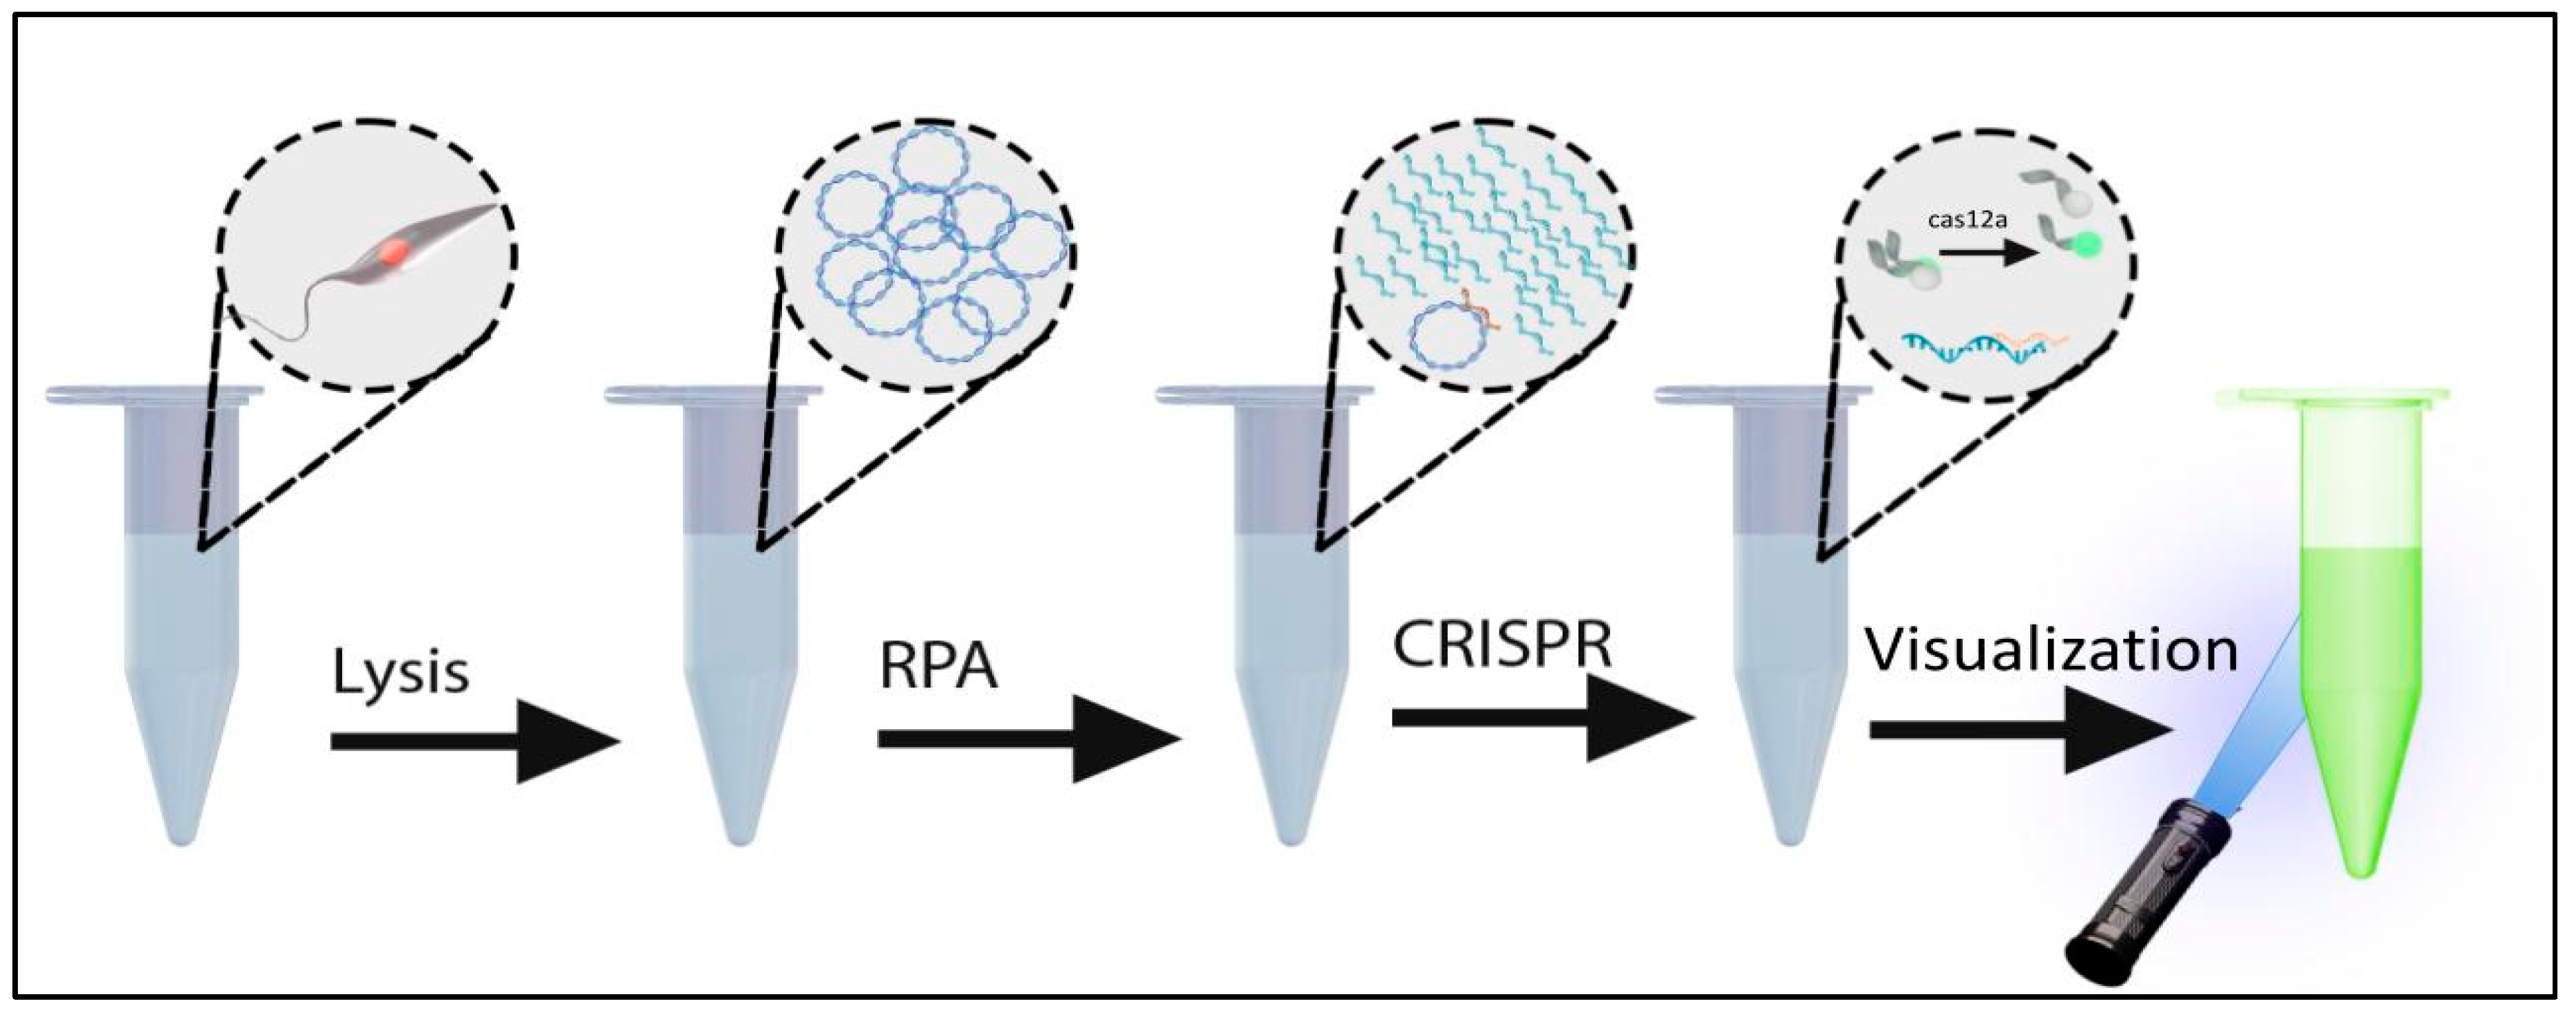
A systematic approach was taken to develop an instrument-free leishmania diagnostic. PCR-based diagnostics targeting kDNA are among the most sensitive methods for detection of leishmania parasites and are superior to microscopic methods in both sensitivity and specificity. Kinetoplasts are present in 30-50 copies per parasite and contain sequences that are both conserved and variable between species. Because PCR requires instrumentation and electricity, we selected isothermal RPA as a viable substation method for amplification, to both detect and amplify specific targets prior to detection with Cas12a. To introduce additional specificity and sensitivity, we used CRISPR/Cas12a to detect the RPA amplicons. An overview of the process is depicted in
Figure 1.
Kinetoplast DNA (kDNA) forms an ultra-structure specific to genera of the family Trypanosoimatidae that consists of a network of interlocking rings [
41,
42,
43]. The unique kDNA structure was vaguely described after viewing under a phase contract by renowned parasitologist William Trager in 1953, and continued to be illuminated in greater detail through advances in microscopic technology [
44,
45].
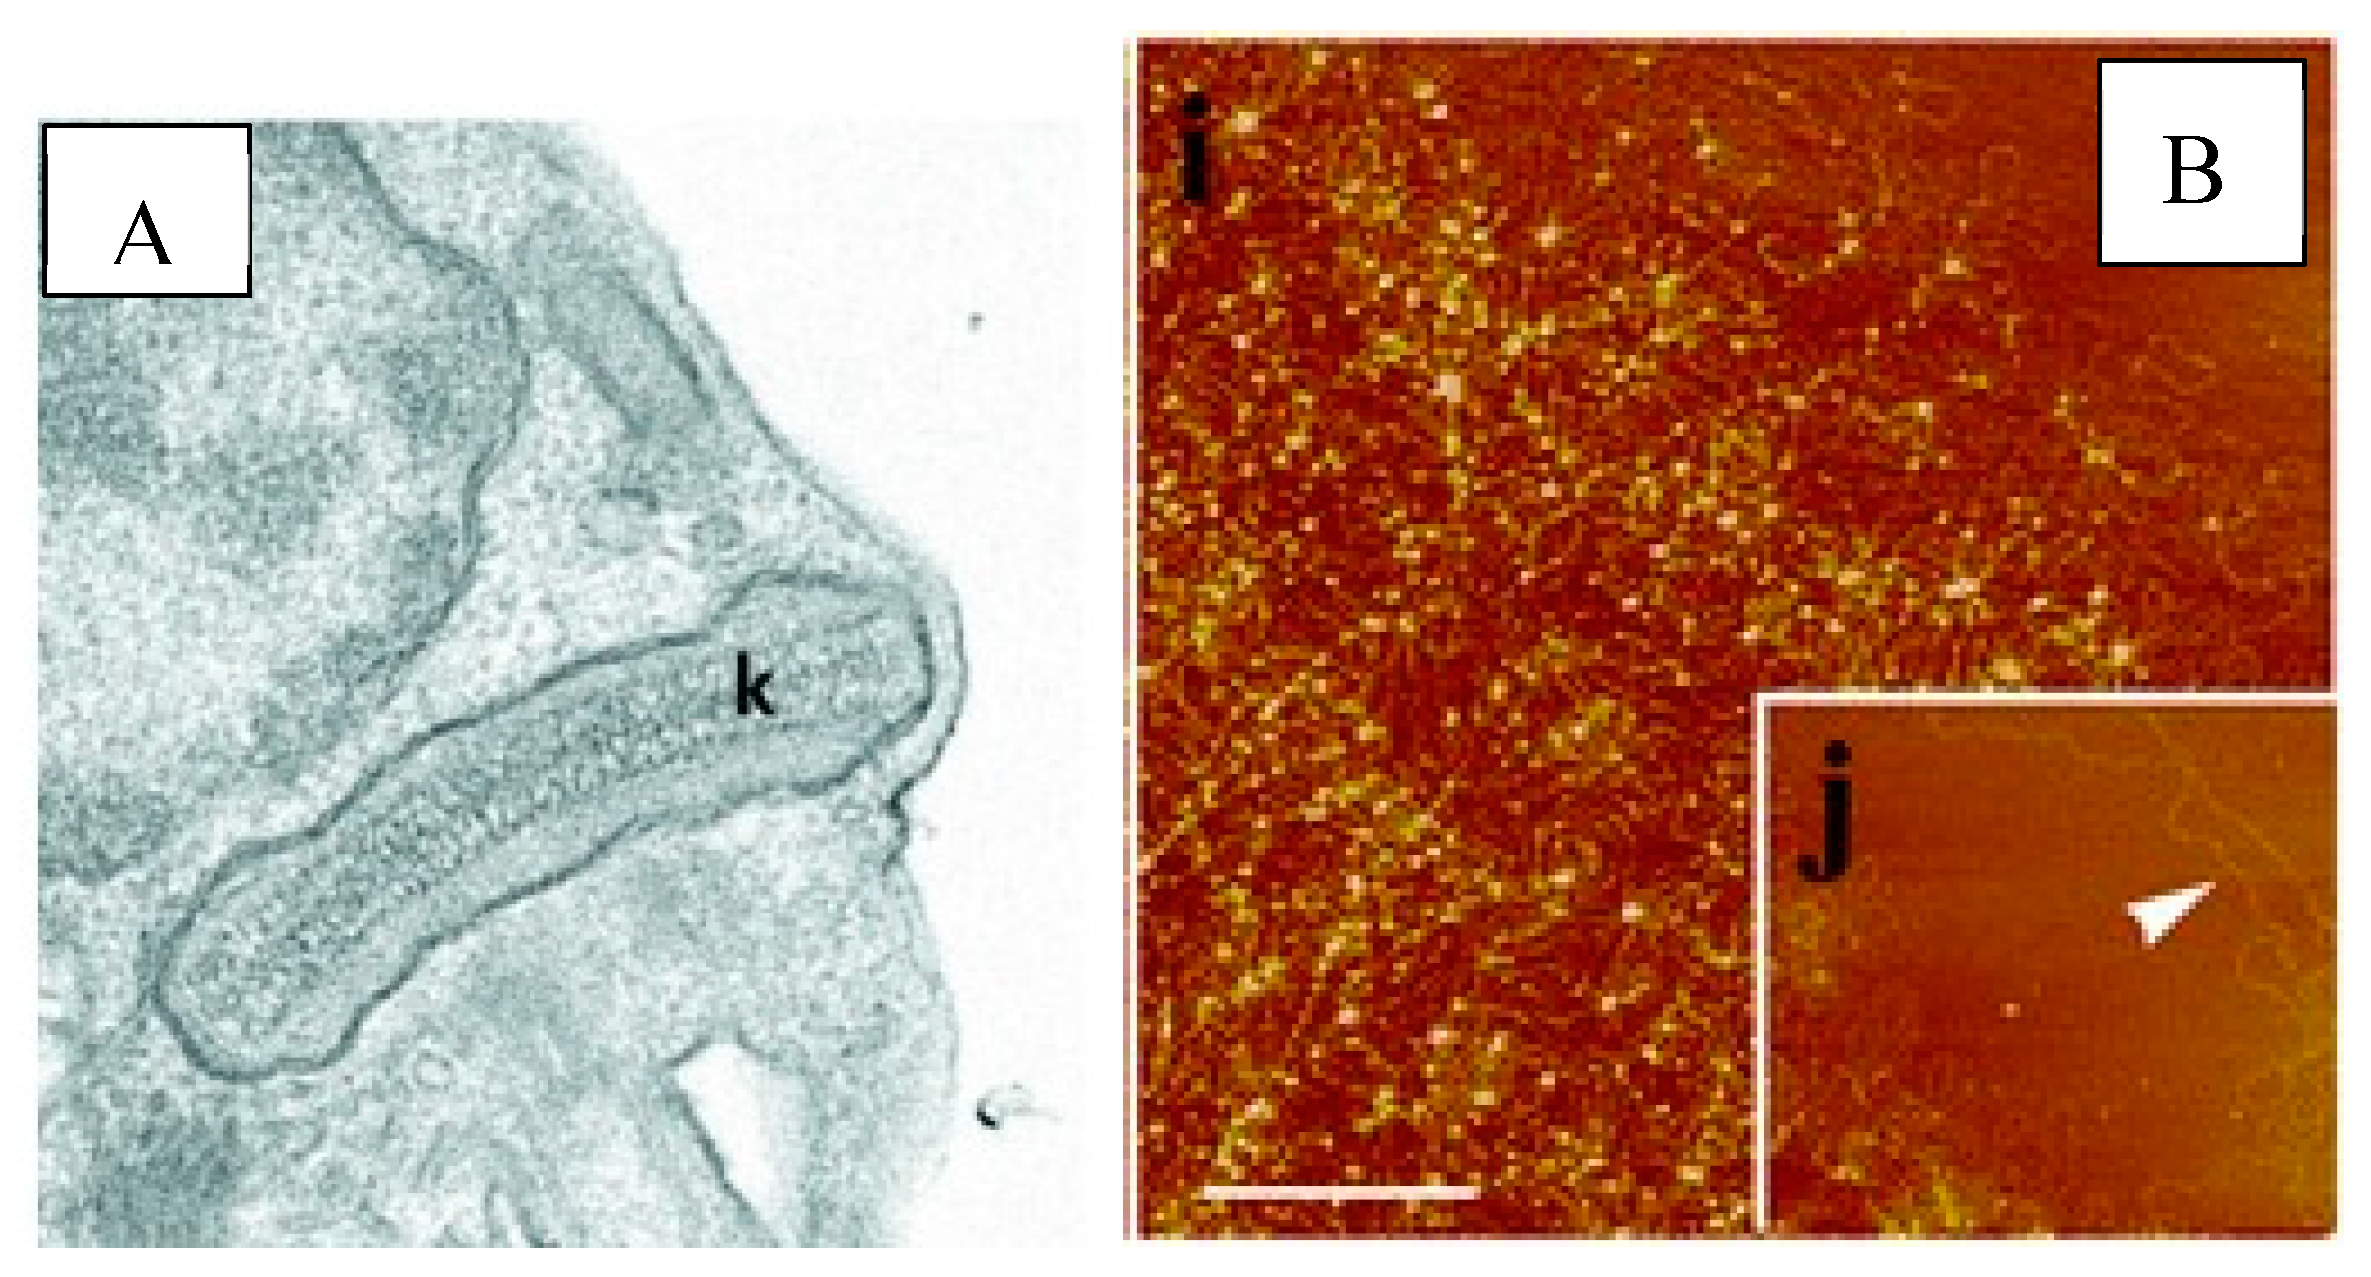
Figure 2A, letter K indicates the tightly packed kDNA in a disk-like structure with electron microscopy. In
Figure 2B, letter i depicts the isolated networks of kDNA and letter j focuses on the maxicircle region [
46,
47]. The kDNA target for conventional or quantitative PCR assays is composed of minicircle and maxicircle DNA molecules [
48]. We evaluated mini-circles, which are often the first choice for diagnostics because of their high copy number (10,000 – 20,000 copies/parasites). However, the high variability between leishmania species, and even amongst strains of individual species, created challenges for the design of useful primers and probes [
49]. Although parasites contain only 30-50 copies of maxicircles, they are more conserved within a species while exhibiting sufficient variation between species for diagnostic differentiation [
50]. The robust amplification due to RPA more than compensates for the reduction in copy number to 30-50 per parasite.
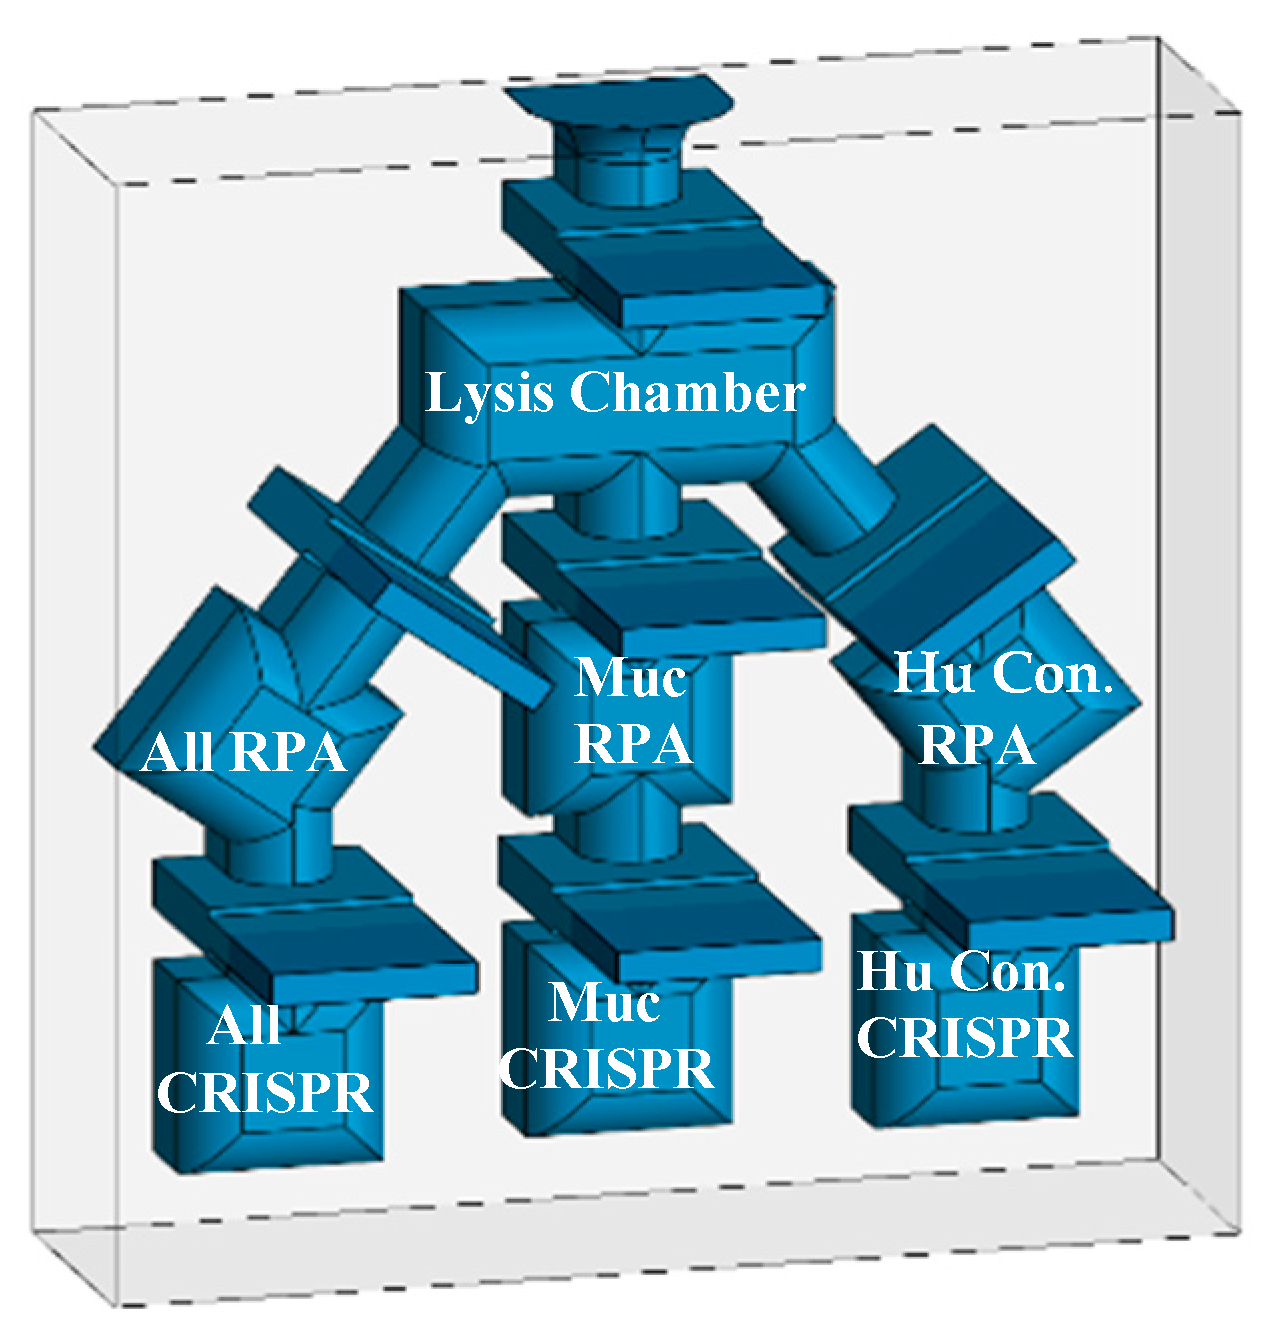
The initial diagnostic is intended to comprise three channels for detection of: 1) All leishmania species, 2) species that cause mucosal disease, and 3) a human gene as a positive control. Later versions of the diagnostic will selectively detect L. donavani and L. infantum species that cause visceral disease in Old World countries. A 960bp region from nucleotides 1808 to 2769 in the Leishmania panamensis strain PSC1 (maxicircle) kinetoplast (BK010875) was selected for amplification and detection due to the presence of sequences that are both conserved and variable between species. After selection of maxicircles, a comprehensive analysis for the design of amplification primers and CRISPR guide sequences was performed. Analyses included ClustalW pairwise analysis of Genbank deposited sequences covering all the major species available including those that are associated with Cutaneous or Mucosal disease. Target regions for the first channel were selected for conservation amongst all Leishmania species, but exclude sequences from non-leishmania Trypanosomatidae. In the second channel, regions specific to mucocutaneous associated species will be detected only. In this paper we focus on the specific detection of L. panamensis.
Eight forward and seven reverse oligonucleotide primers of 26 nucleotides were designed to amplify regions of kDNA containing both conserved and variable regions.
Figure 3 shows the position of the “forward” and “reverse” primers within a 960 bp region of the maxicircle kintoplast. The primers were combined as 24 pairs for amplification of two conserved regions that encompass the CRISPR guides All-1, -2, -3, and -4 (
Table 1 and
Figure 3).
The performance of the 24 Leishmania primer pairs in RPA was assessed using DNA that was phenol-chloroform extracted from a pool of 3 x 10
6 parasites equally composed of
L. panamensis, L. braziliensis, and
L. infantum, ethanol precipitated, and resuspended in 0.45 mL of 20 mM Tris pH 7.4.
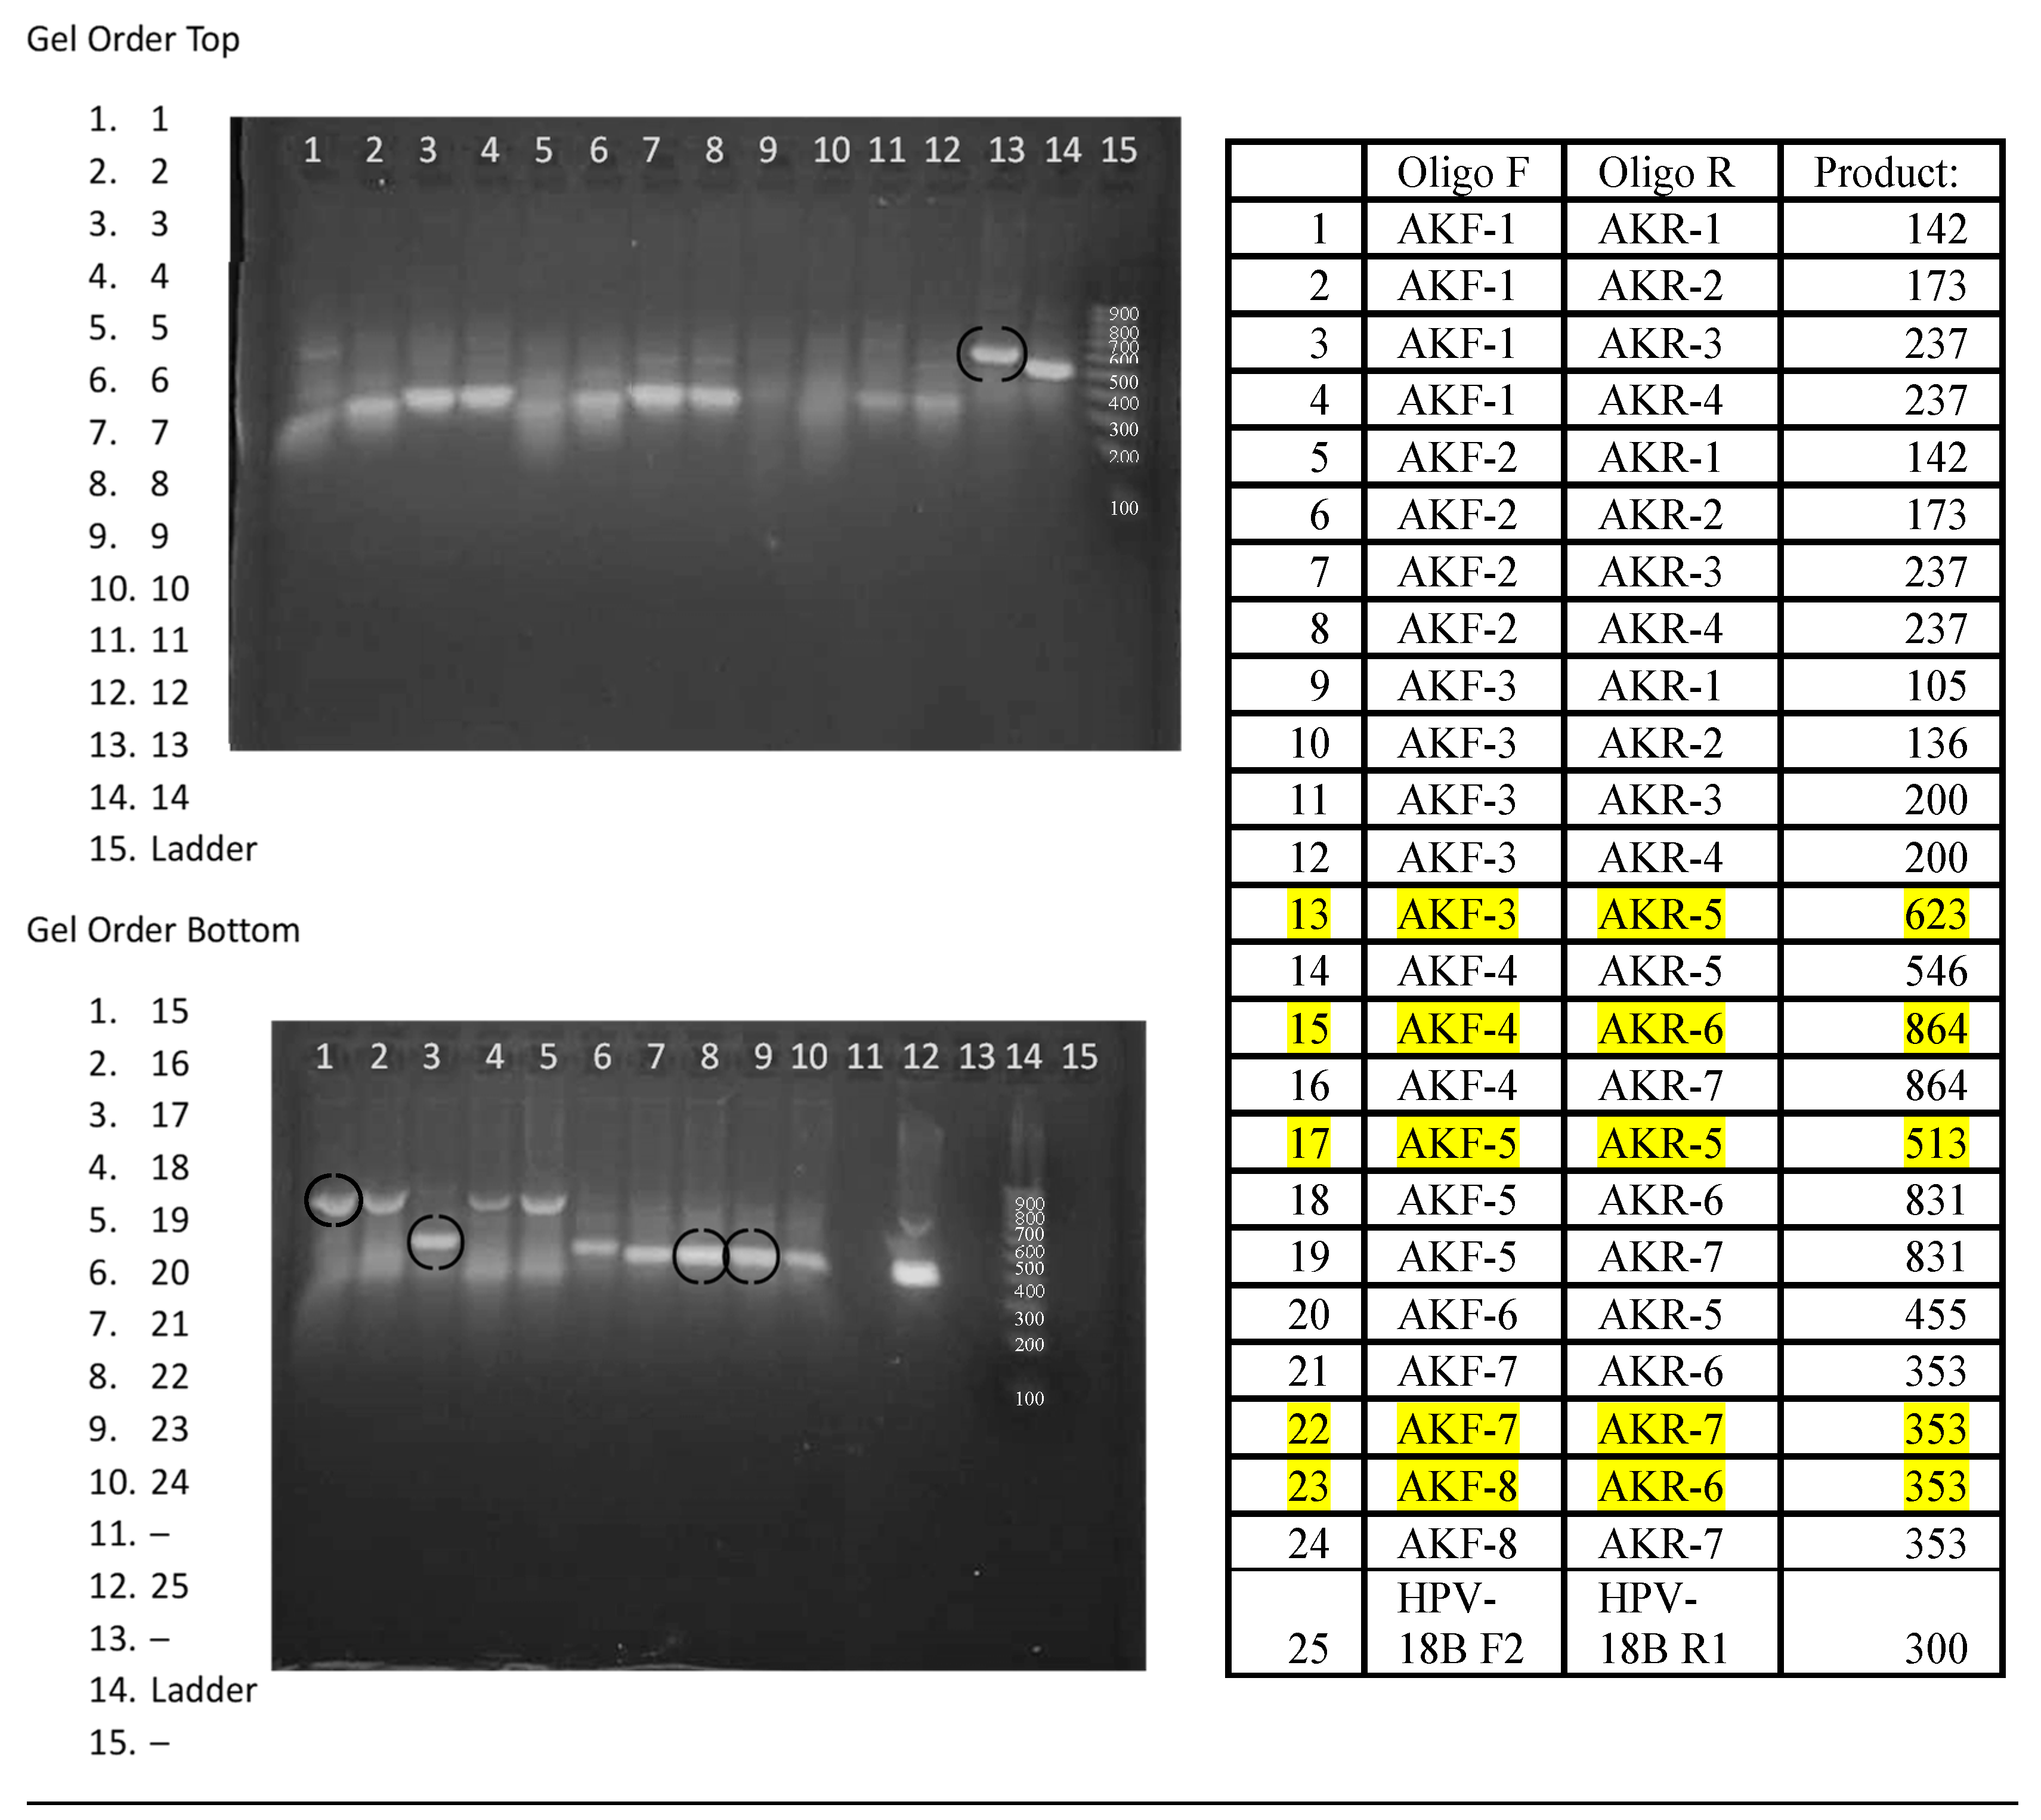
Figure 4 shows the amplicons generated from 20 µl isothermal reactions, incubated for 20 minutes at 39⁰C using ~2 x 10
4 copies of purified DNA. While most reactions generated amplicons, five primer pairs were selected for continued analysis due to enhanced performance. Primer pairs #13 F3/R5 and #17 F5/R5 amplify region 1, primer pairs #22 F7/R7 and #23 F8/R6 amplify region 2, and primer pair #15 F4/R6 amplifies both region 1 and 2 (
Figure 3). To examine amplification over time, the progress of the RPA reaction of
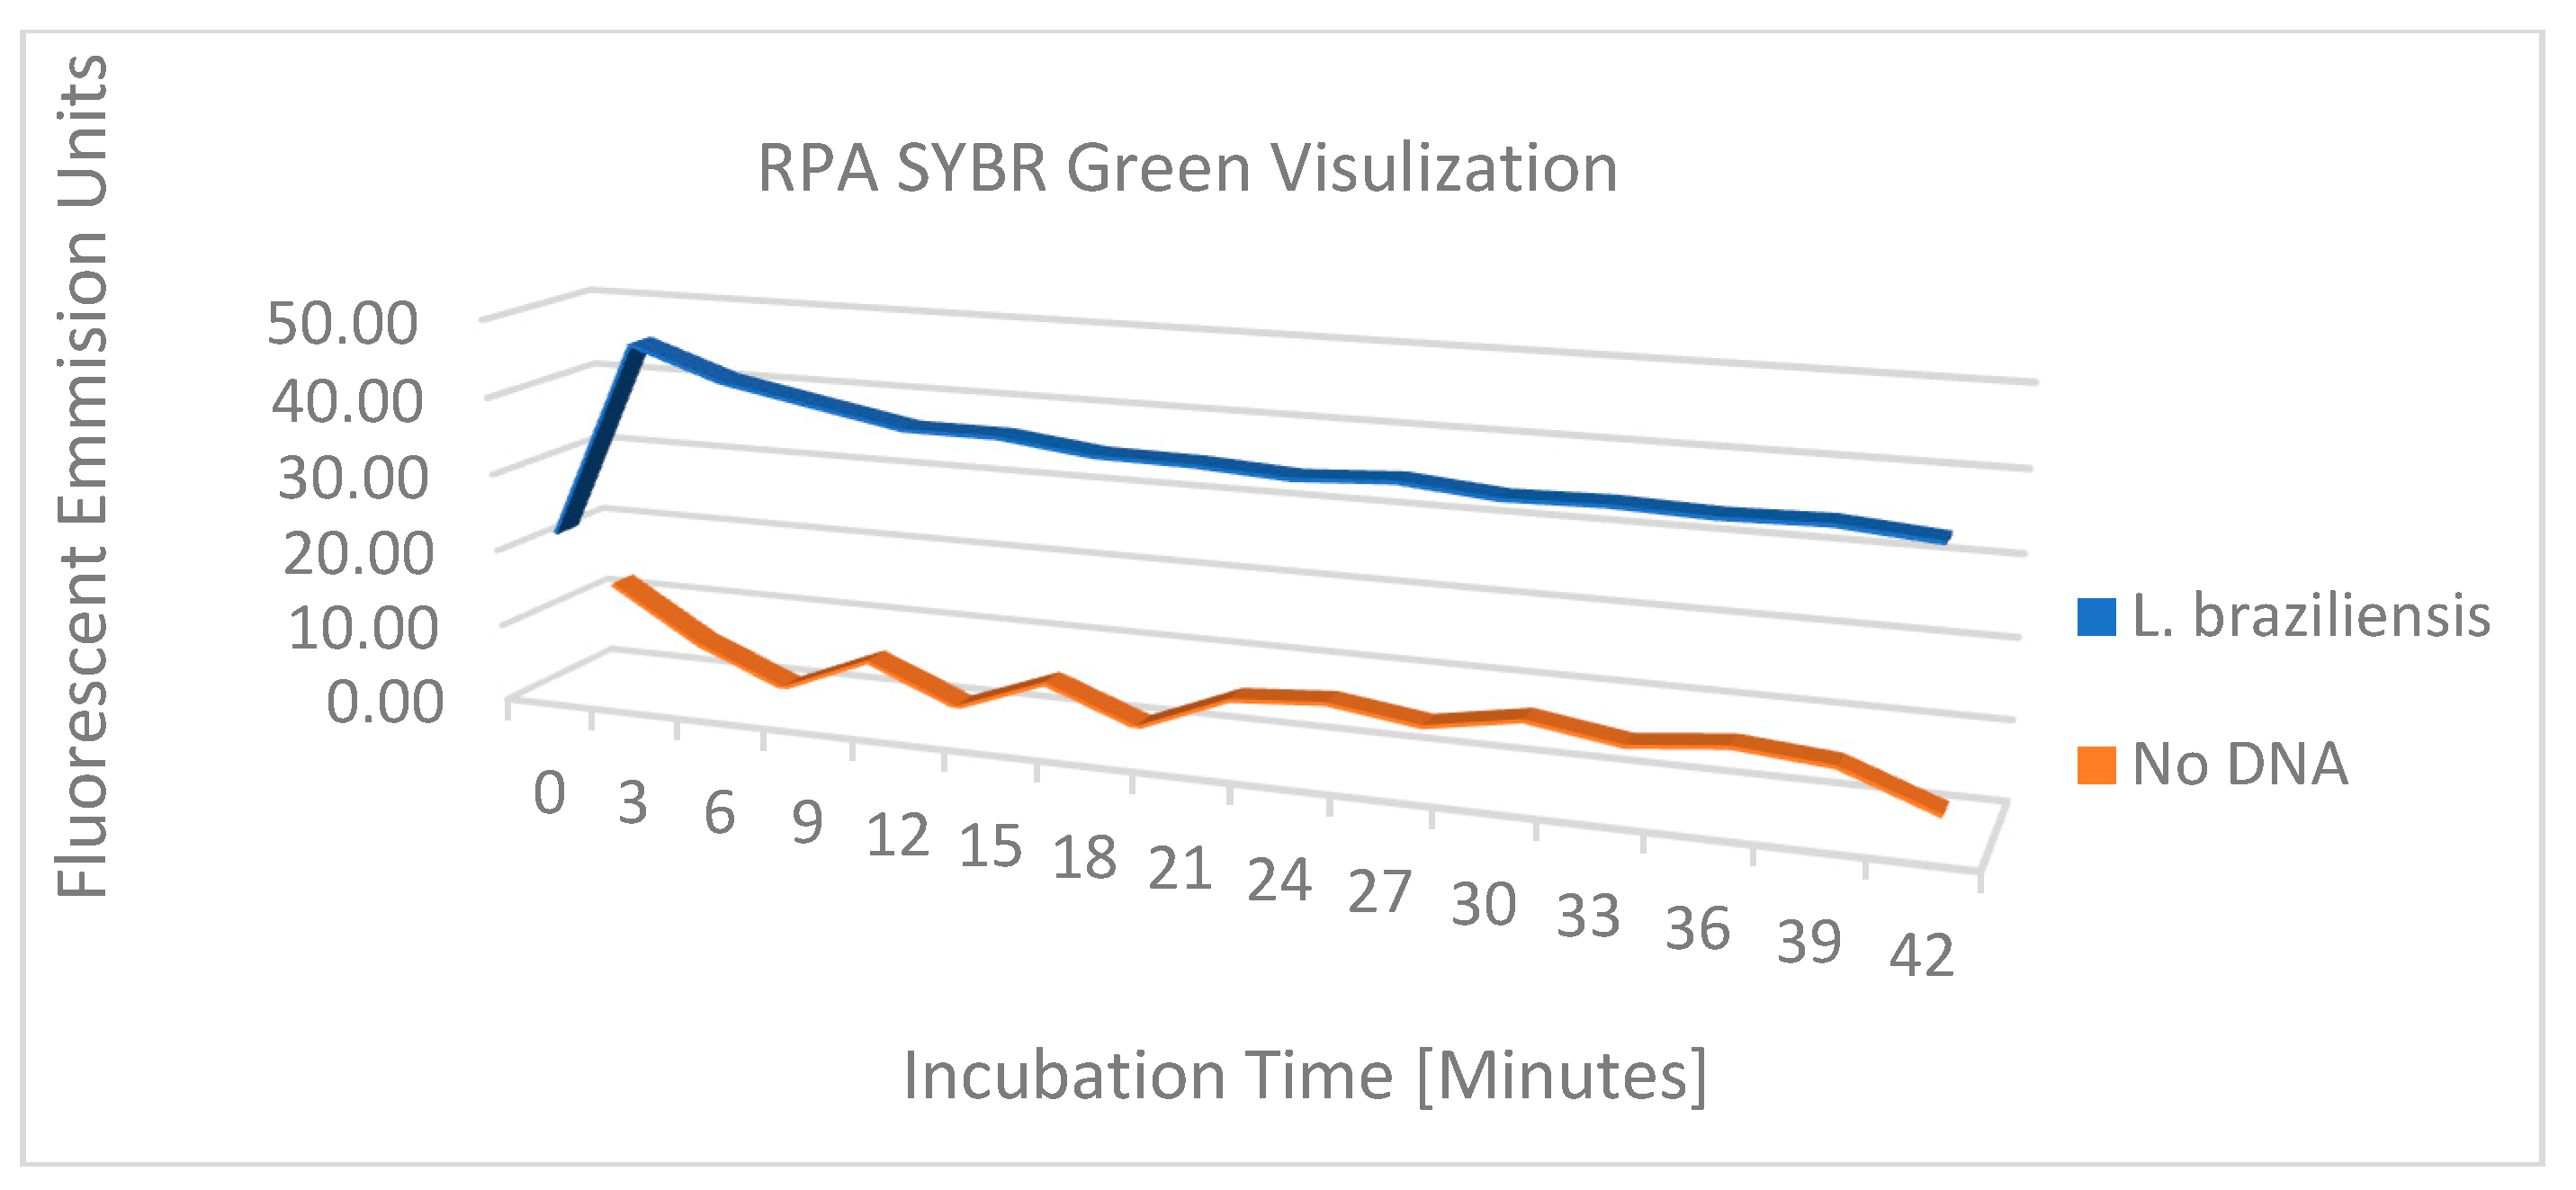
L. braziliensis was monitored on a VarioSkan fluorescent plate reader over time with 50x SYBR Green and primer pair #15 F4/R6 and compared to the RPA reaction without target DNA (
Figure 5). We demonstrated a rapid increase in fluorescence, which indicates that the amplification of this reaction is rapid with a stable signal when compared to the negative control.
Common detergent-based lysis buffers were assessed for release of leishmania DNA and compatibility with RPA. Initial studies assessed isotonic phosphate buffers containing CHAPS, Triton X-100, NP40, Tween-20, OCG at concentrations of 3%, 1%, 0.5%, and 0.1% (v/v) for disruption of parasites and amplification by RPA. Microscopic inspection identified the minimum concentrations of each detergent that lysed the parasites. For each parasite tested 0.1% (v/v) was sufficient to lyse parasites to an undetectable level in each microscope field examined
Figure 6, shows the appearance of native
L. panamensis under phase-contrast microscopy on a standard hemocytometer, Panel 6A demonstrating the preference of this species for aggregation dispersed slightly after vortexing, Panel 6B. Panel 6C demonstrates
L. panamensis parasites completely disrupted post lysis with 0.1% Triton X-100 detergent. Due to Triton X-100 detergents’ ability to fully lyse parasites when compared to other reagents and not interfere with the RPA amplification reaction, the 0.1% Triton X-100 was chosen to move forward in the assay development process.
The viability of this diagnostic will be directly correlated to the sensitivity and specificity of detection. Therefore, the minimum parasite concentration was quantitatively determined in the RPA amplification assay. The ultimate goal would be to have the specificity above 97% and sensitivity under 10 parasites per complete RPA+CRISPR reaction. The number of parasites in a single infected macrophage is around this number [
51]. A majority of the sensitivity will come from RPA amplification, but CRISPR will aid the process as well. Following protocol RPA conditions, with incubation at 39oC for 20 minutes, a sample of lysed
L. venezuelensis DNA at a concentration of 3 x 10
7 parasites per mL was serially diluted for assessment of the sensitivity of detection.
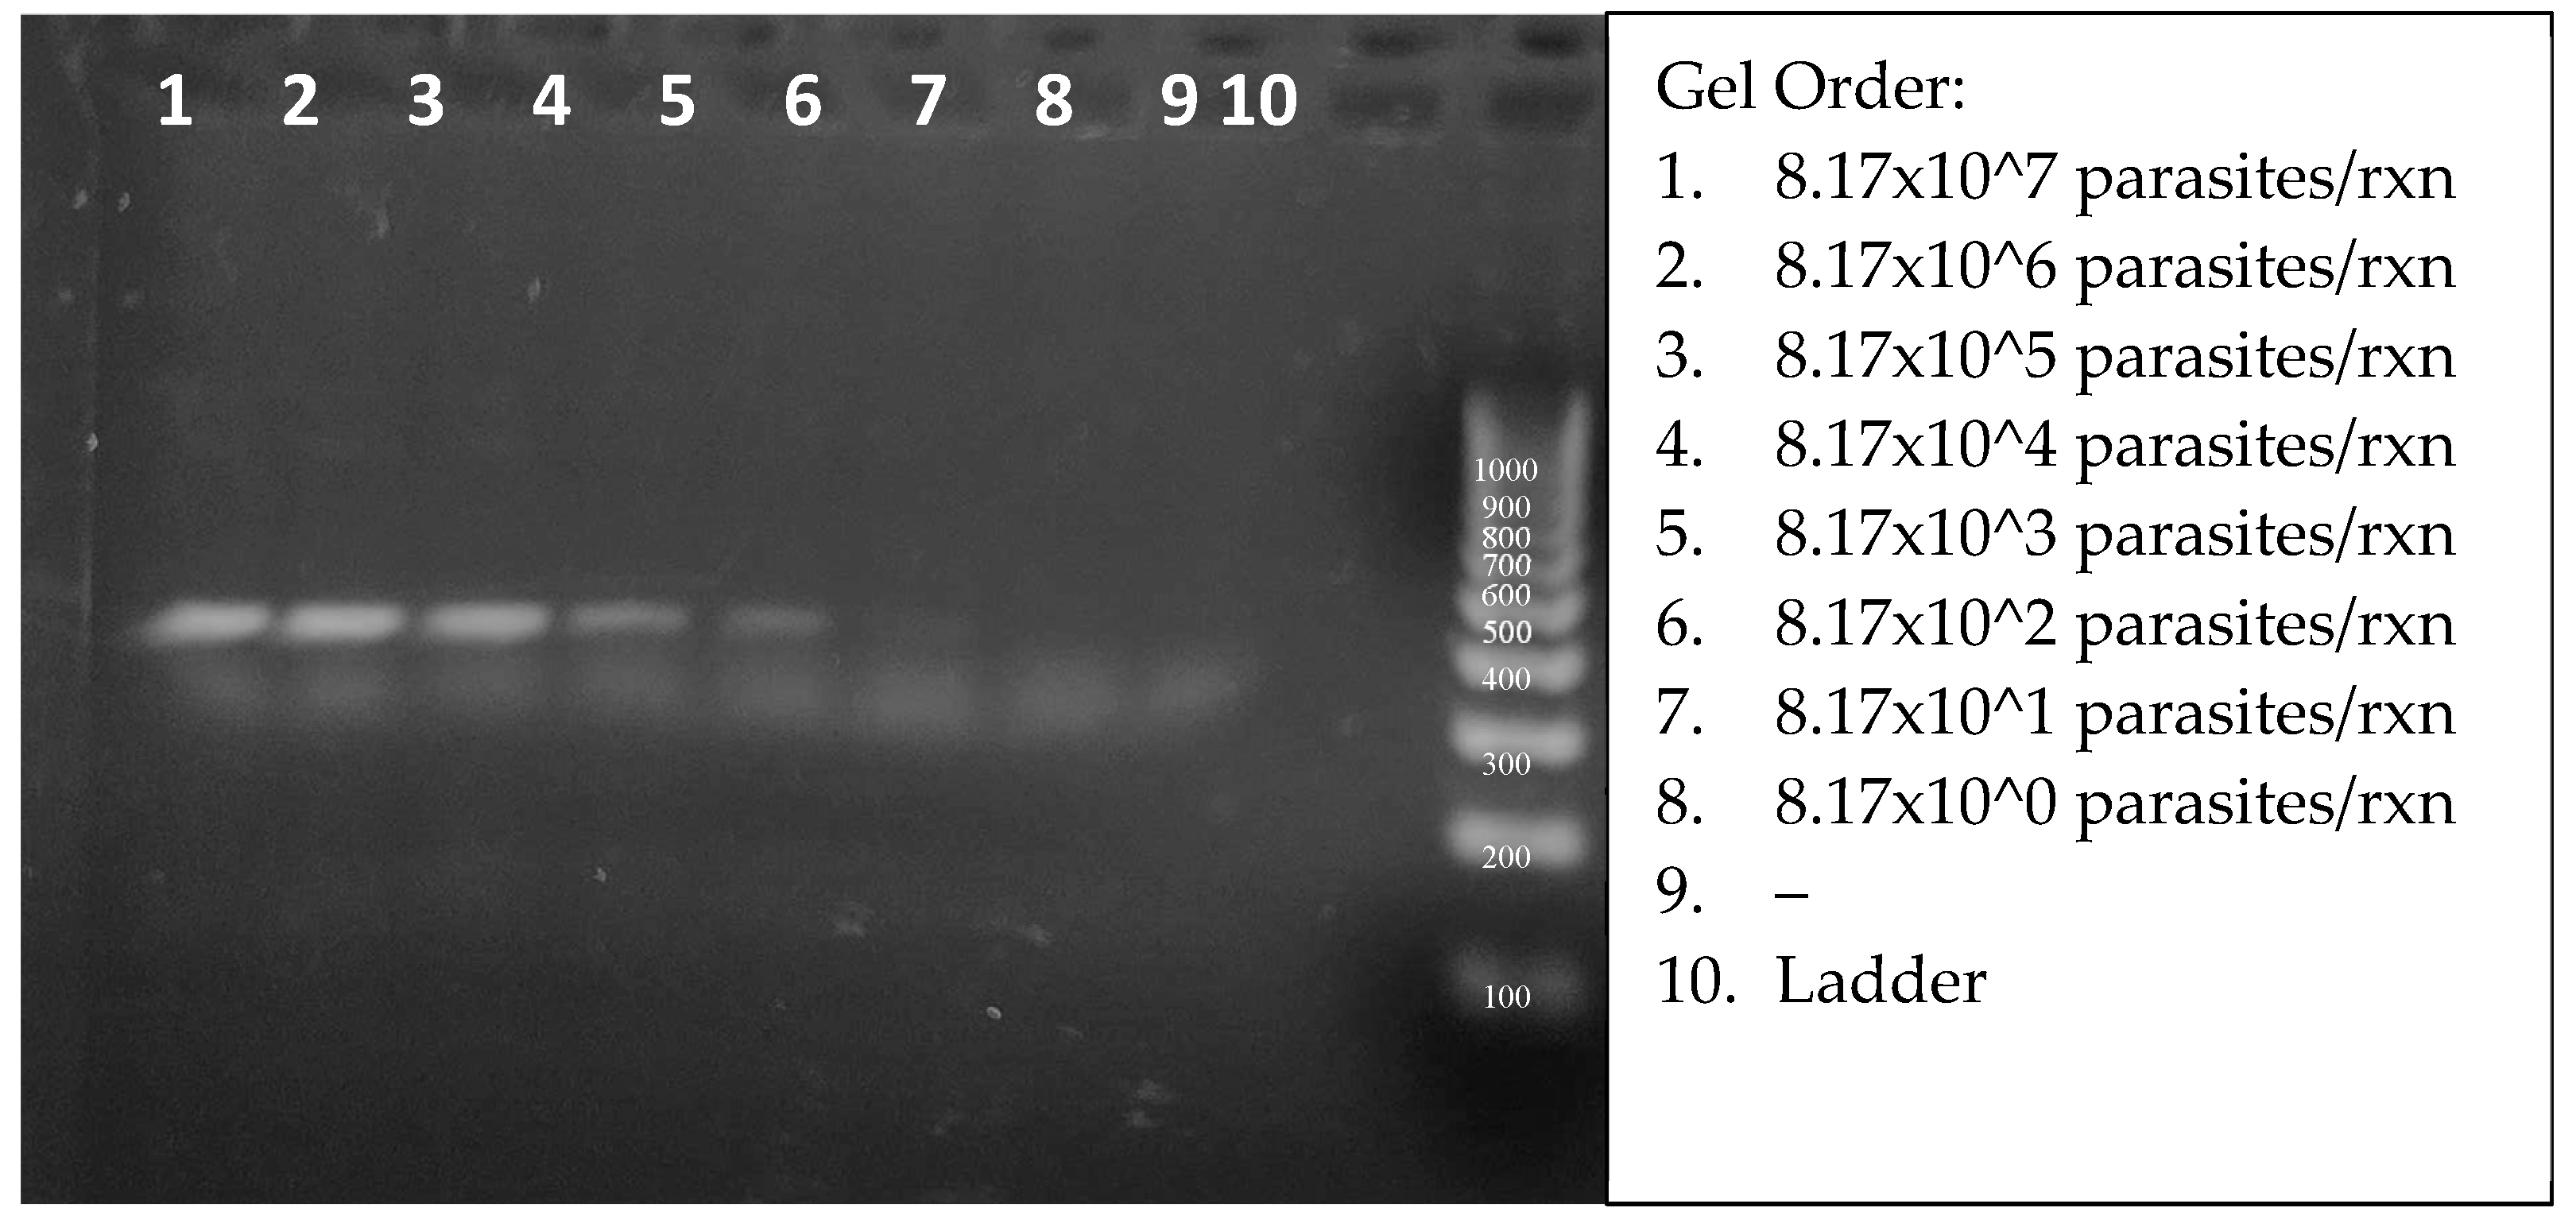
Figure 7 shows the amplicons from 2.75 µl aliquots of 20 µl reactions. Careful inspection of the SYBRgreen-stained gel enabled the visual detection of target DNA from 817 parasites (lane 6). The true RPA threshold is likely below 817 parasites, but limited by the visual parameters of the gel. The quantifiable threshold of detection will be the combined RPA + CRISPR reaction, with the more sensitive fluorescent emissions.
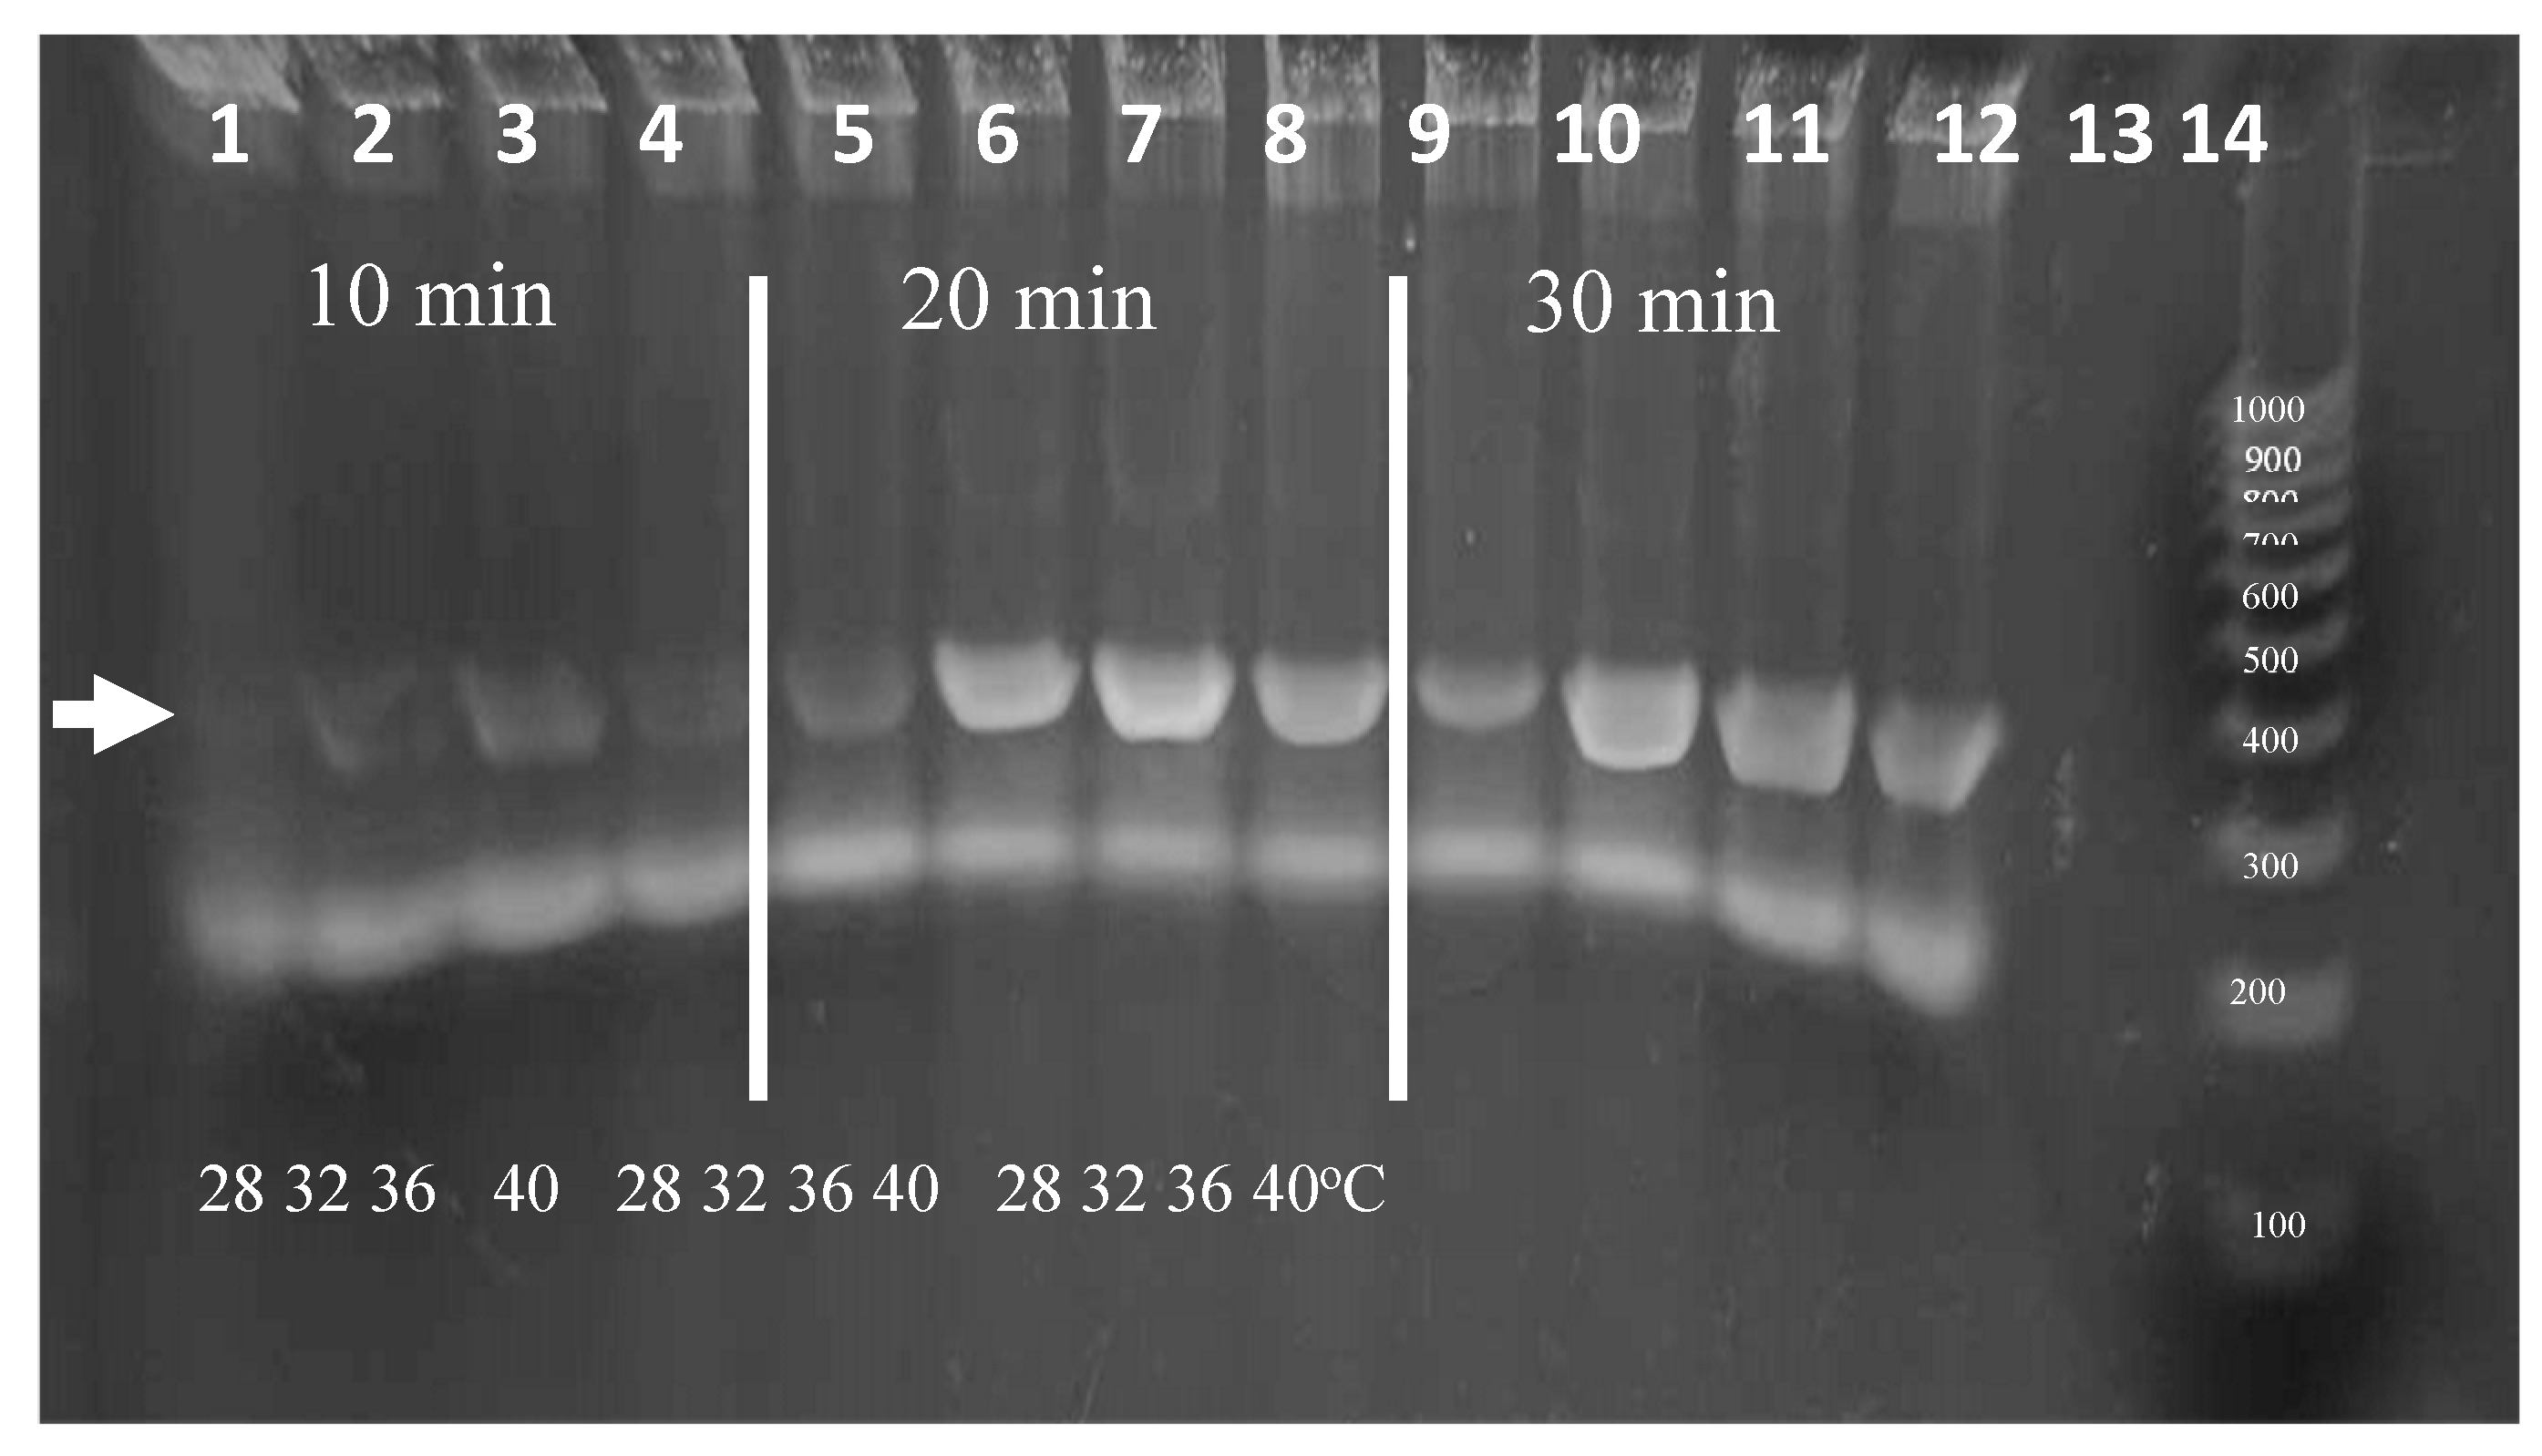
Isothermal amplification over a range of temperatures is advantageous for ease of use. RPA is known to have peak polymerase activity at parameters of at 39⁰C with typical reaction times of for 20 minutes. Because ambient temperatures in areas where the diagnostic is intended to be deployed can vary, the effect of temperature on RPA performance was analyzed. We evaluated the parameters of incubation duration and temperature in strategic stepwise increments. To ensure ample signal for visualization, experiments were conducted using 0.1% Triton X-100 lysates containing 2,000
L. panamensis parasites per reaction.
Figure 8 shows the amplicons produced following incubations of 10, 20, or 30 minutes at temperatures of 28, 32, 36, or 40⁰C. Amplicons are visible in each temperature after a 20-minute incubation. Additionally, while less vibrant, weak bands were visible after only 10 minutes. We note that additional sensitivity is produced during the following CRISPR detection step and that the amount of amplification to produce a visible band in an agarose gel (~25 ng or >108-fold amplification) may not be necessary. In the event that the ambient temperature is below 28⁰C, the reactions could be heated using an inexpensive chemical hand warmer or a small battery-operated thermal chamber.
The compatibility of the crRNA guide sequences to the RPA amplified target DNA is critical to the CRISPR reaction, and the success of the diagnostic relies on the specificity from the CRISPR guide sensing. To properly evaluate CRISPR detection, purified RPA amplified DNA was utilized to minimize incompatibility variables that might be found from inhibitors from crude parasites, the RPA reagents, and the CRISPR reagents. Correctly sized RPA DNA bands were gel-purified, ethanol precipitated and rehydrated with nuclease free water. The amplicon concentrations were determined by absorbance at 260nm and the samples normalized to 0.1 ug/µl. The Cas12a reactions were performed at 39⁰C for 20 minutes, and probe
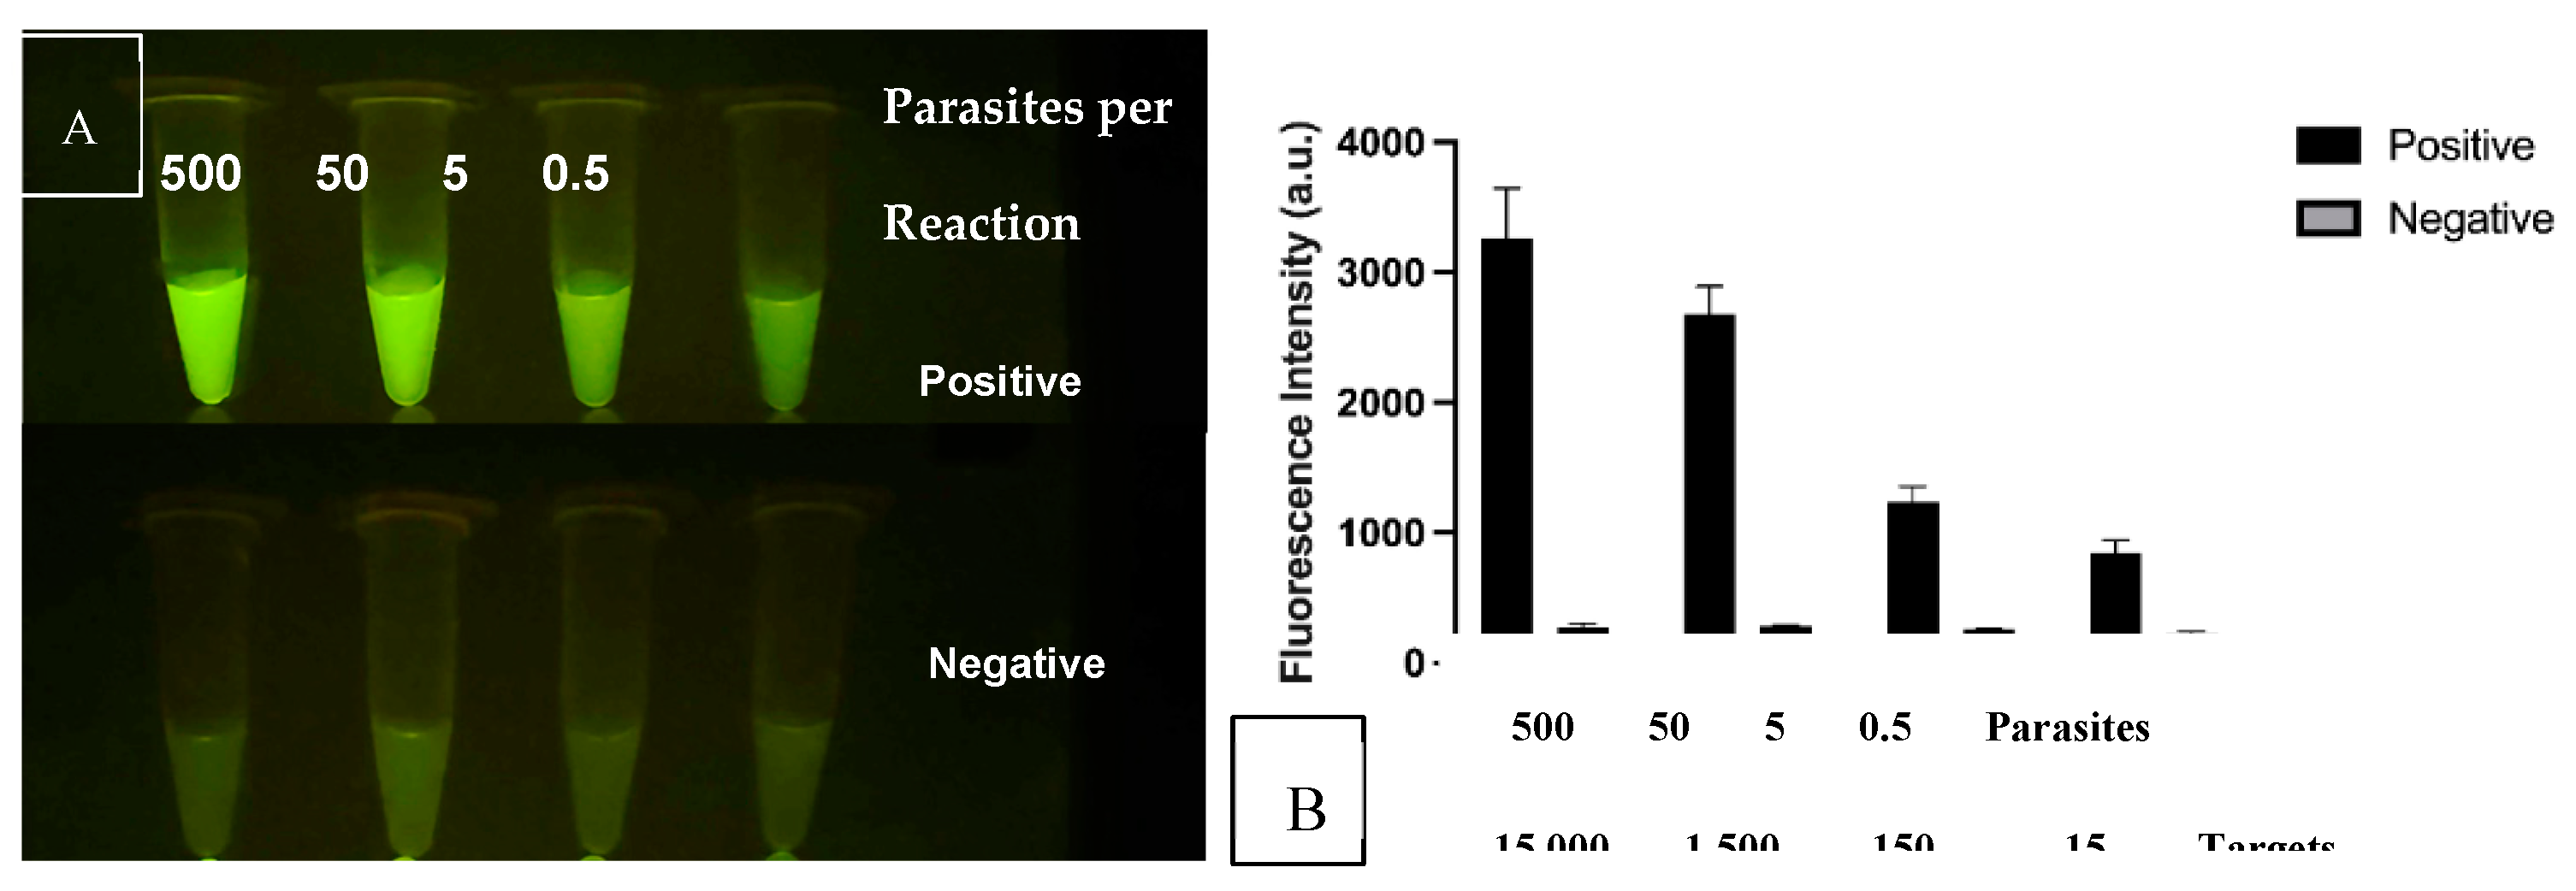
cleavage emission was visualized on a blue-light transilluminator. All reactions produced visible fluorescent signals which glowed more intensely than the no-DNA negative control tube (
Figure 9A). These results were confirmed using lysed parasites and RPA amplification with and without purification (data not shown). Quantitative analysis was then performed using fragment DNAs with the VarioSkan fluorescent plate reader (
Figure 9B).
After confirmation that the CRISPR reactions detected their intended target sequences, we analyzed the threshold of detection in comparison to background signal.
Figure 10A shows the CRISPR/Cas12a signals as the DNA in the RPA-CRISPR reaction is reduced from 500 to 0.5 parasites. The Negative reactions contained the CRISPR reagents without inclusion of the RPA products. Both the specificity and sensitivity are enhanced through the combination of RPA + CRISPR than in either standalone reaction. The results also support the use of the multi-copy nature of the kDNA target as the tube from 0.5 parasites produces a signal over background. The lower set of tubes emulate negative samples and lack parasite DNA.
Figure 10B shows the same samples analyzed for fluorescent intensity in the plate reader. In this study, the sensitivity was determined to be 0.5 lysed parasites per reaction or 15-25 kDNA targets which in below our initial goal of 10 parasites per test.
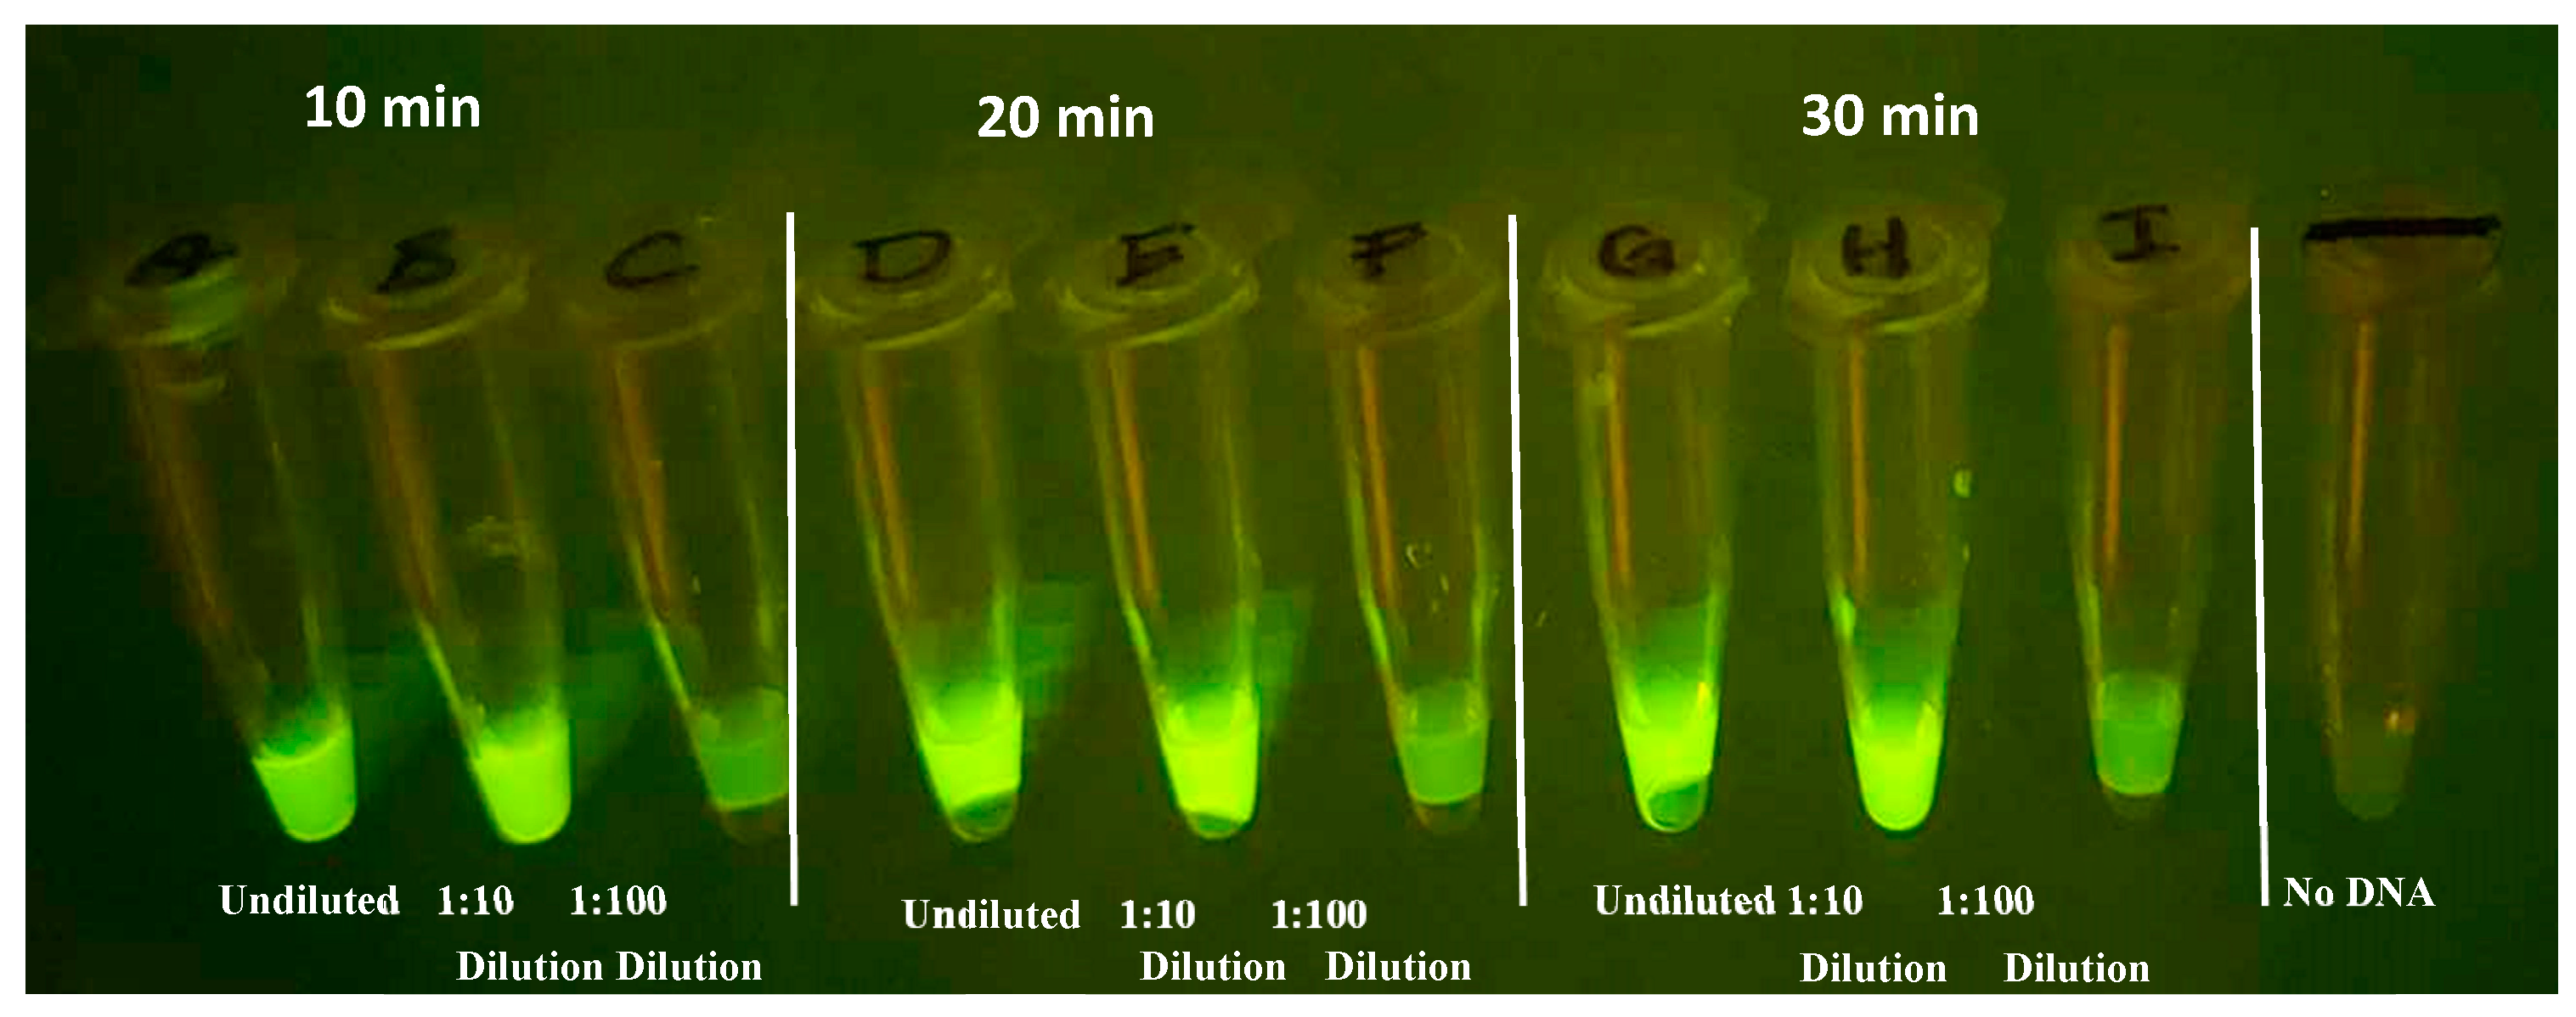
Evaluation of the incubation time and RPA product dilution for the RPA - CRISPR transition are critical for development for compatibility with the device. Shorter assay times should translate into better field adoption, provided that the results remain consistent. The greater the dilution from RPA the smaller the reaction volume can be and still provide sufficient product for the CRISPR assay. RPA reactions were performed for 10, 20, and 30 minutes in 20 µl volumes, to determine the impact RPA incubation has on CRISPR fluorescent signal. After the RPA step, 5 µl of the products, diluted and undiluted, were added to
CRISPR reactions using guide All-3 with a 20 min incubation at 37⁰C.
Figure 11 demonstrates that, while not as vibrant as 20- and 30-minute incubation, as little as 10 minutes of RPA amplification produces a distinguishable fluorescent signal. In addition, undiluted and 1/10 dilutions of the RPA product had comparable signal, however, 1/100 was too dilute in this experiment for the current reaction parameters.
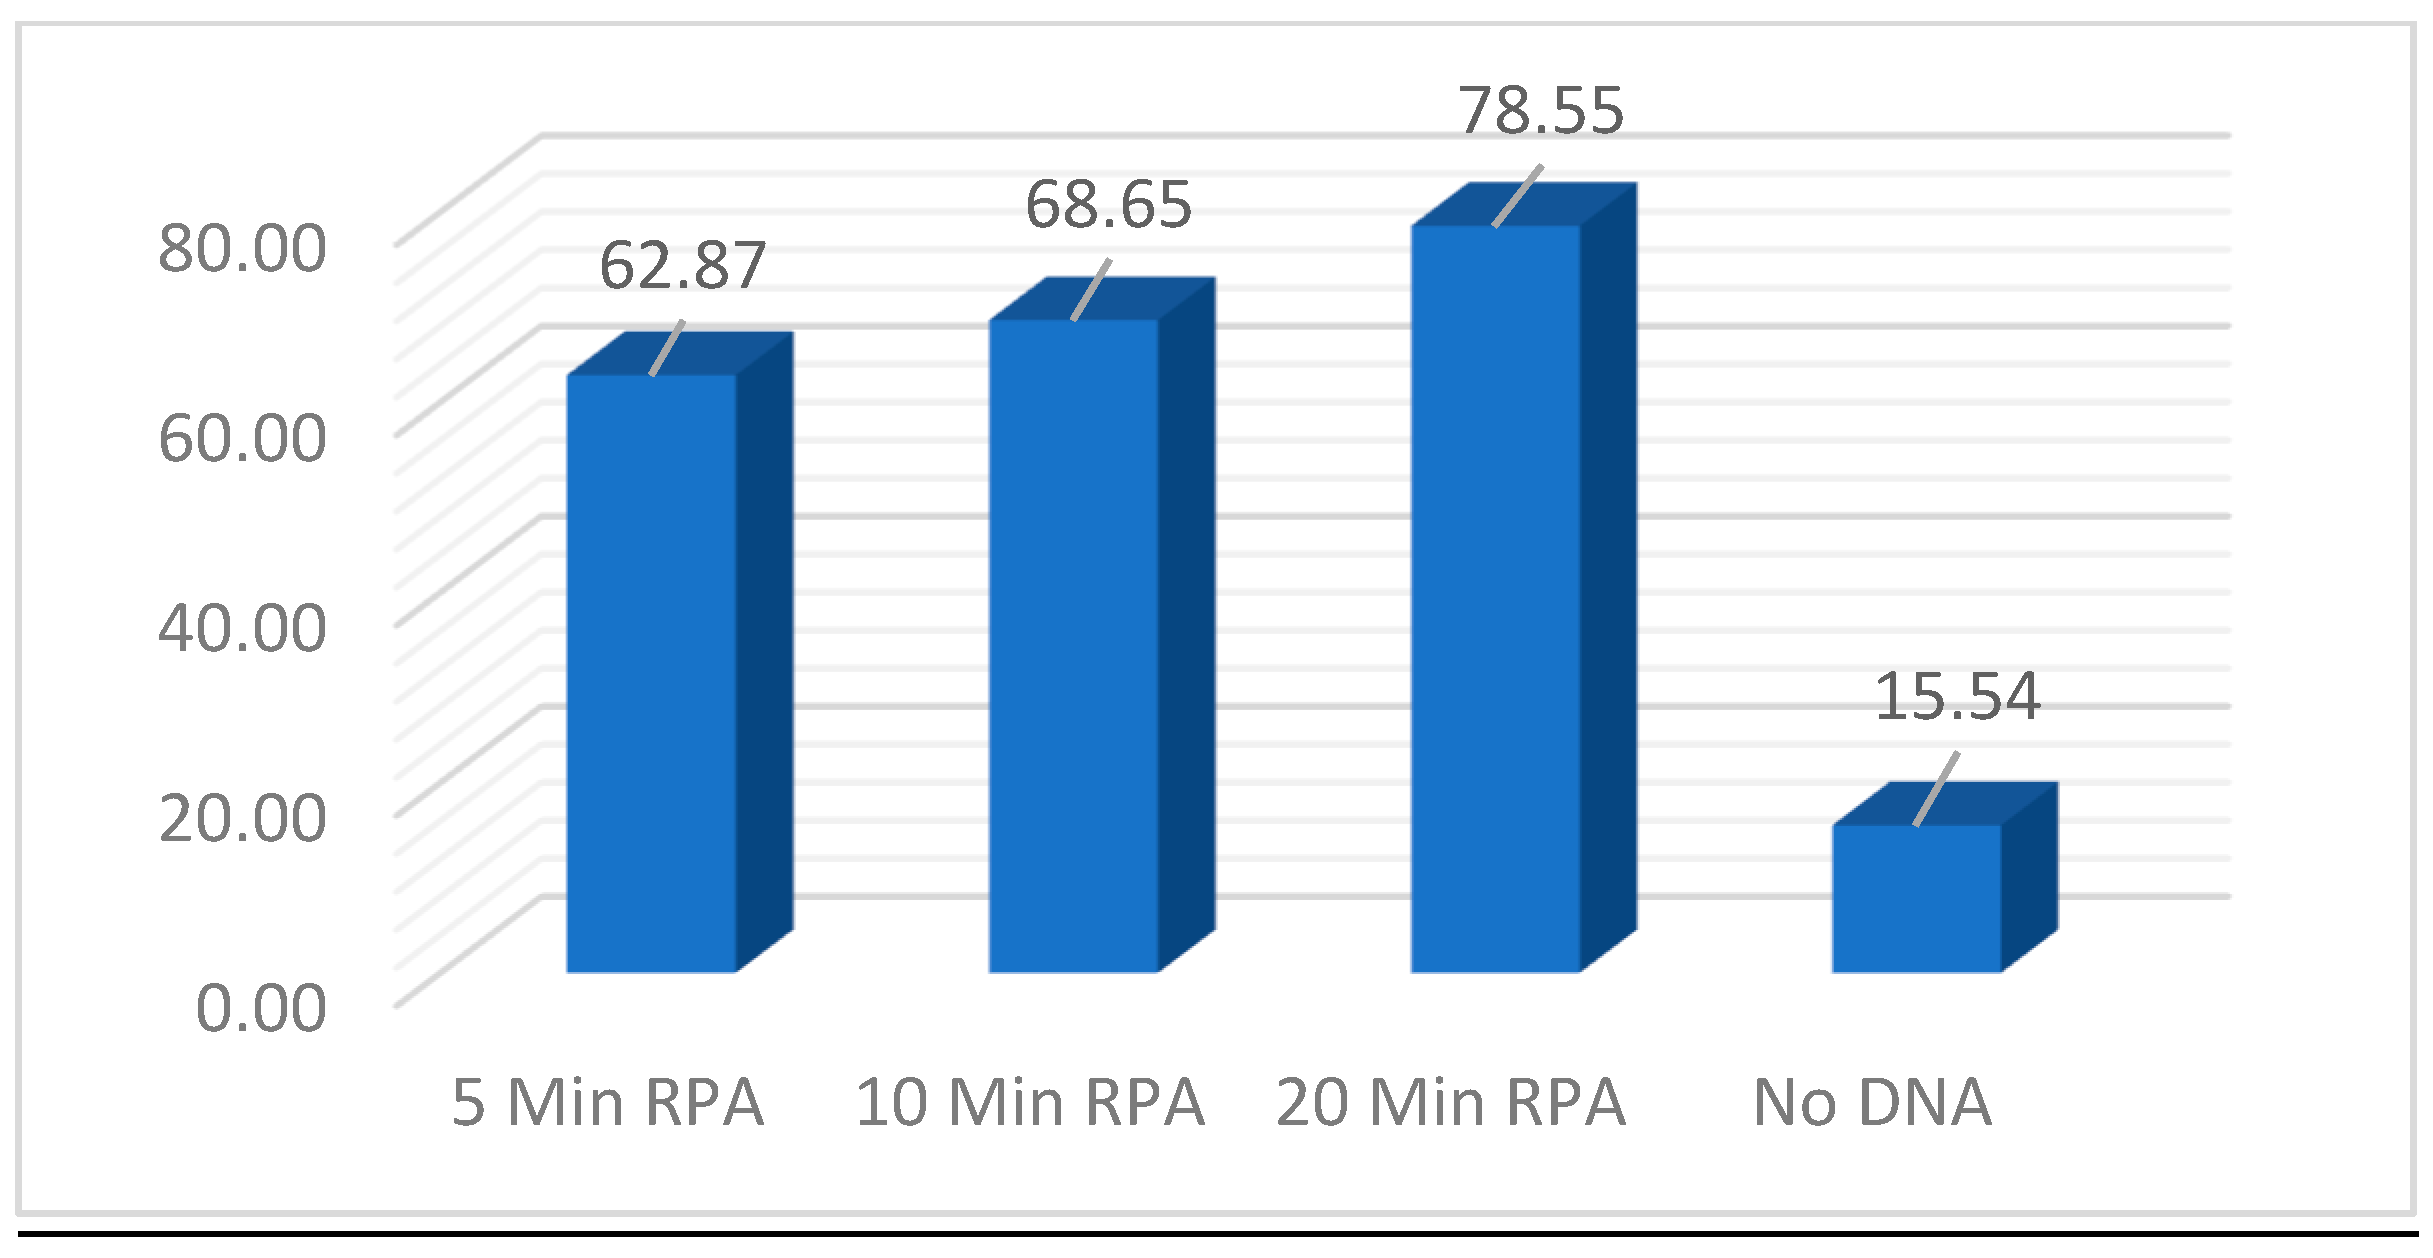
To examine further the impact of RPA amplification incubation time has on the CRISPR fluorescent signal, a timepoint experiment was performed. Identical reactions using 600ng of DNA was utilized and timepoints of 5, 10, and 20 minutes were evaluated at 37⁰C. Promptly at the designated timepoints 1/10 dilutions were made. In the CRISPR reaction 5ul of the 1/10 dilutions were utilized in the 384-well plates and fluorescent signal was evaluated after 25 minutes.
Figure 12 demonstrated that as little as 5 minutes of RPA amplification was enough to generate a strong fluorescent signal above No DNA background. While increasing the incubation does translate to a slightly stronger signal, additional experiments will be required to determine the statistical significance.
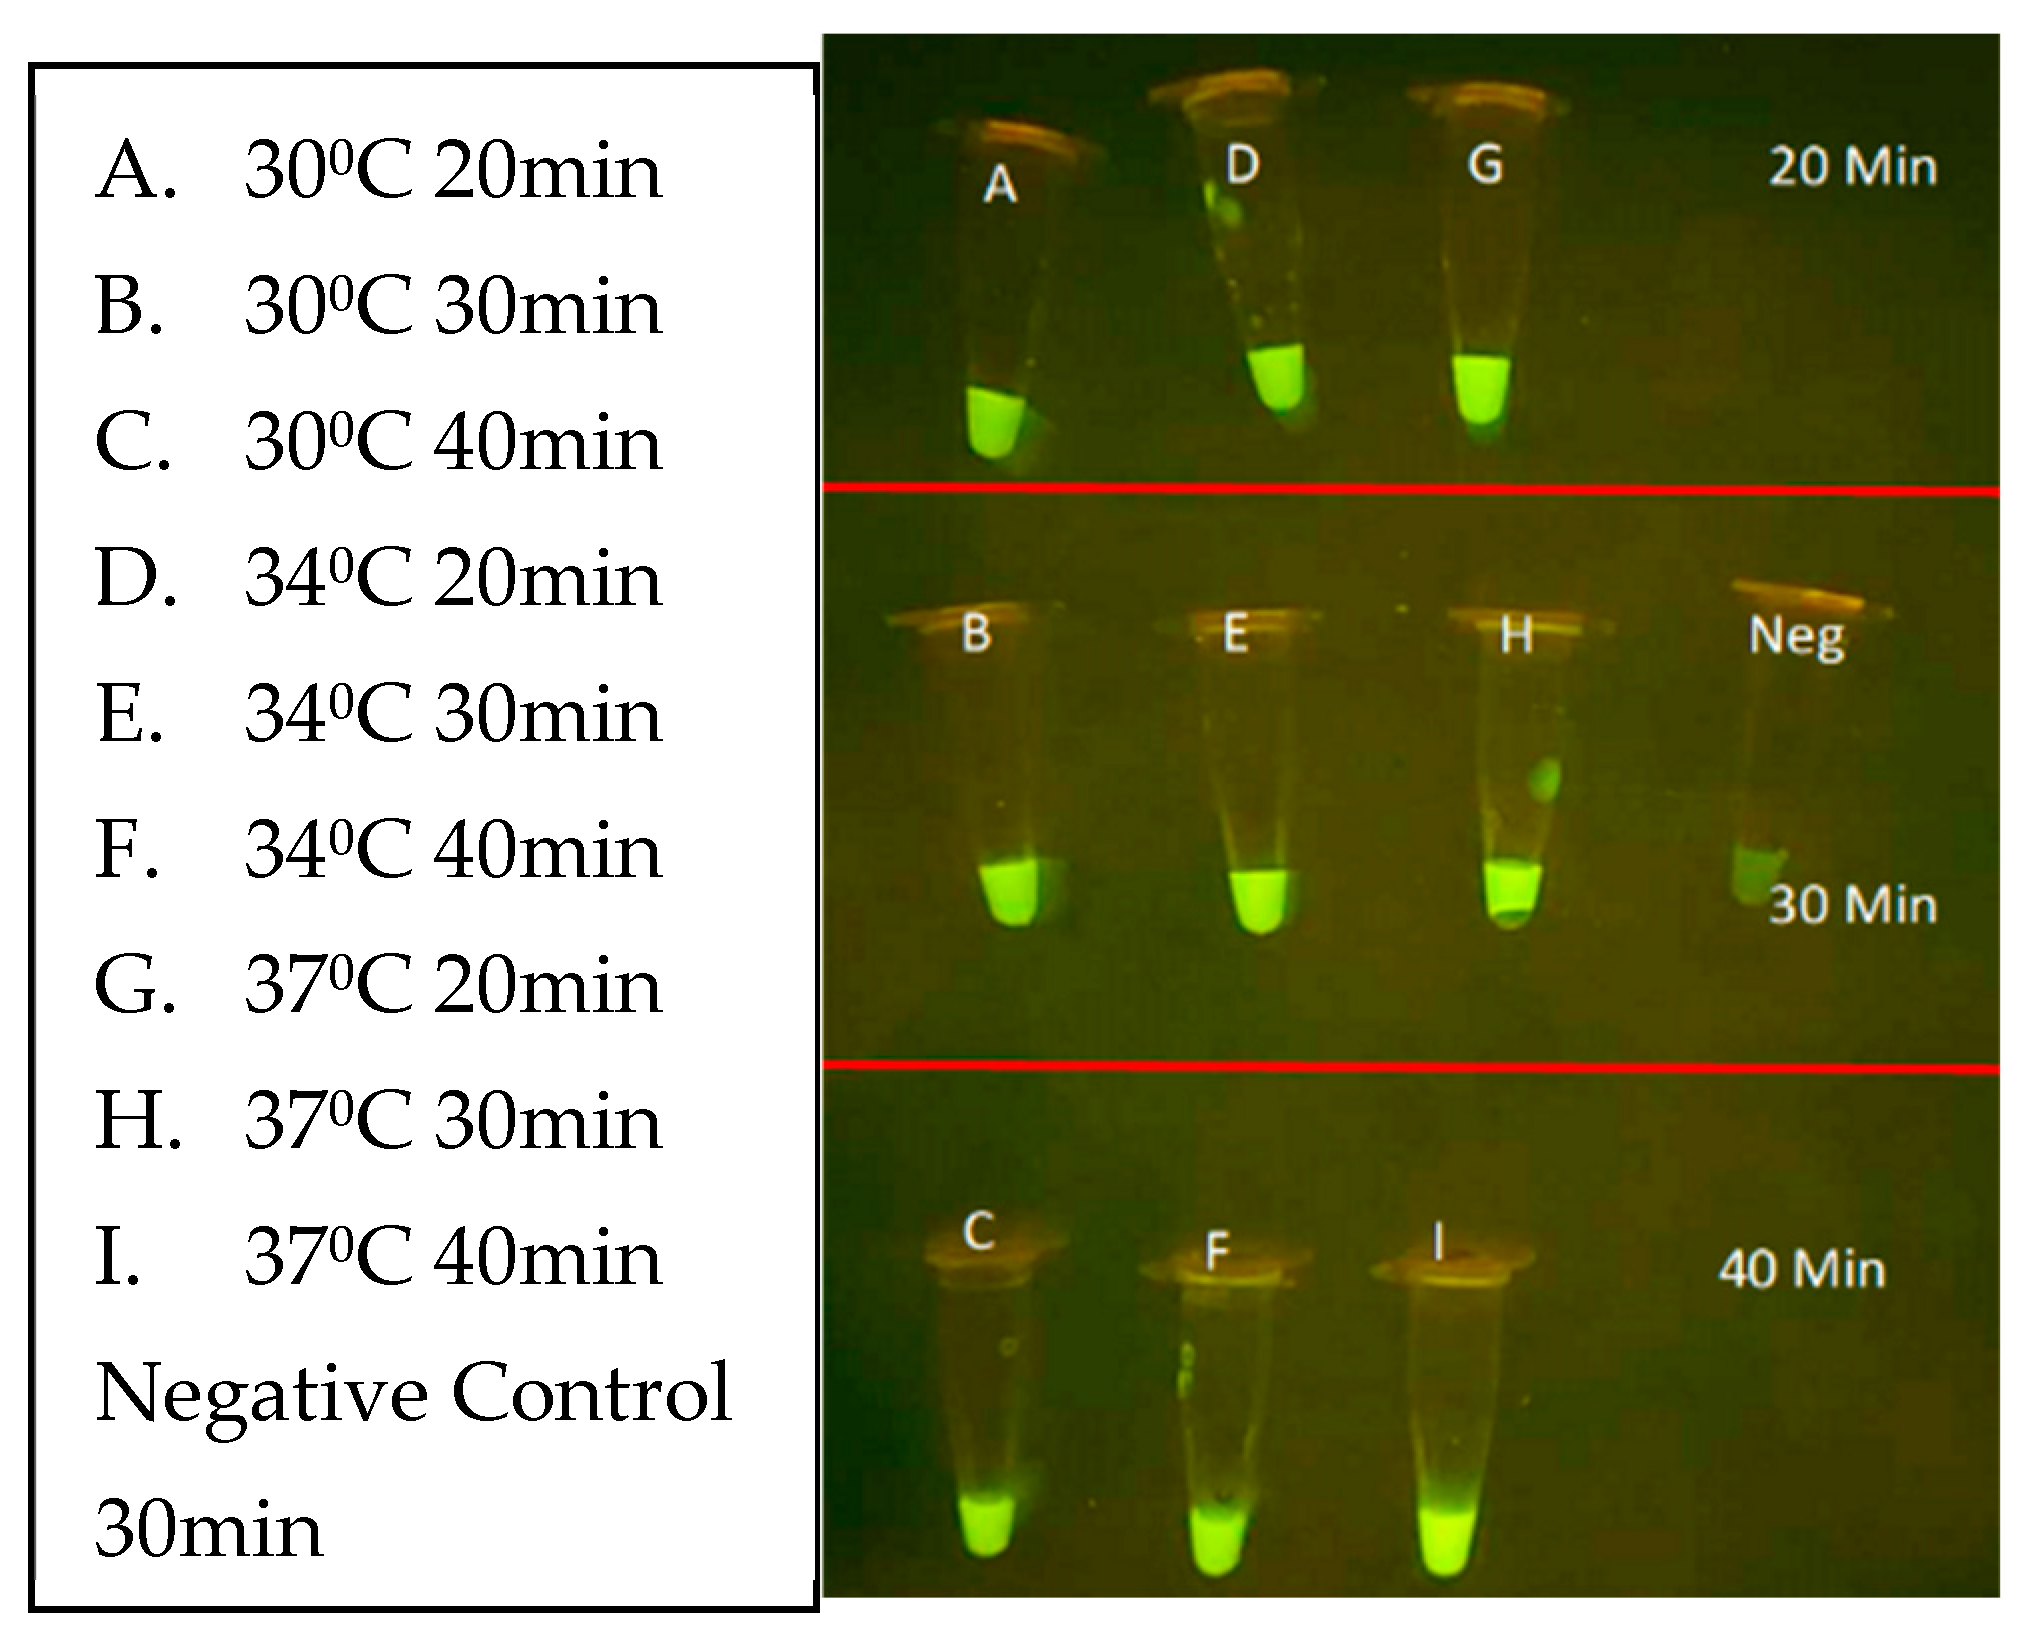
Next, the CRISPR parameters of incubation duration and temperature were evaluated using unpurified
L. venezueliensis lysates containing 2,000 parasites per reaction. As shown in
Figure 13 minimal difference is distinguishable between 20-, 30-, and 40-minute reactions performed at 30, 34, and 37⁰C. Shorter reaction times and wider ranges of temperatures are currently under evaluation.
Clinical providers in endemic countries highlight that differentiation between species of Leishmania parasites is an important component in the diagnosis and treatment of Leishmaniasis [
30,
51]
. L. panamensis is a major contributor of mucocutaneous disease in Central America and was selected as the first target for specificity testing [
13,
52]. The objective was to locate sections unique only to L. panamensis species that share conservation to most
L. panamensis and
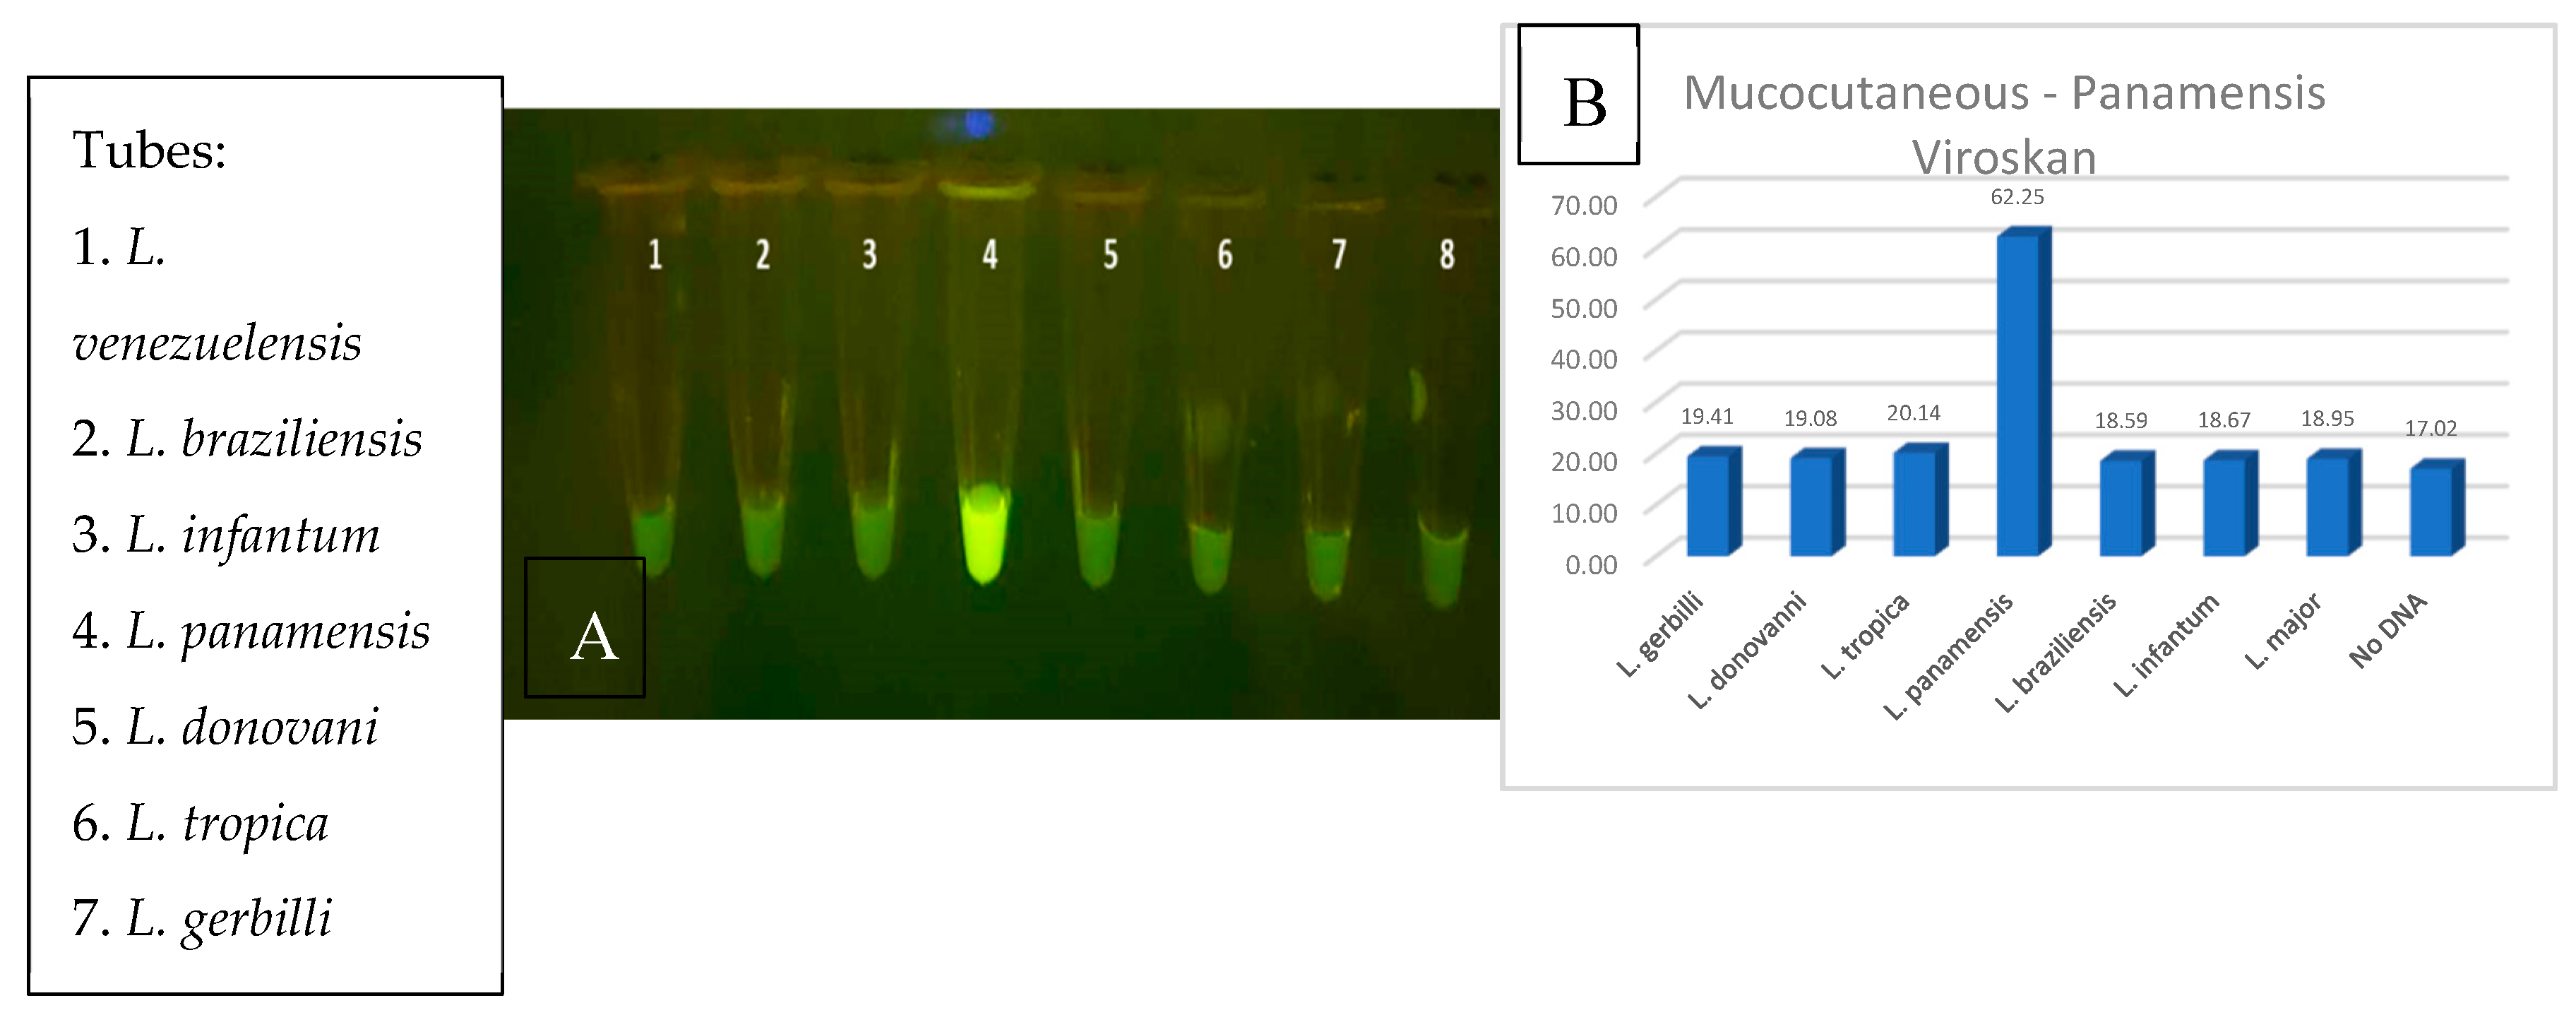
L. guyanensis isolates that could be encountered. After rounds of thorough multisequence alignment analysis, two promising sections of conservation were selected for the design of MC-1 and MC-2 CRISPR guides; located in region 1 of the maxicircle kinetoplast shown in
Figure 3. Specificity was demonstrated when fluorescent signal was restricted only to
L. panamensis in comparison to the seven other Leishmania species, using either RPA amplified lysed parasites or purified DNA fragments (
Figure 14A,B, respectively). These results were upheld when the RPA amplification region was extended to span both regions 1 and 2 that would be required for multiplexing RPA amplification in the FAST device. Thus, the current design of the diagnostic is for Channel 1 to detect all leishmania species and Channel 2 to detect species that progress to muco-cutaneous disease. Future specificity testing will incorporate the mucocutaneous Leishmania species
, L. braziliensis and
L. guyanensis for detection of the species in additional regions and include specific detection of VL-causing species.
Figure 1.
Diagram depicting the diagnostic assay incorporating Lysis, RPA, and CRISPR fluorescent detection.
Figure 1.
Diagram depicting the diagnostic assay incorporating Lysis, RPA, and CRISPR fluorescent detection.
Figure 2.
Microscopy images of T. cruzi kinetoplast DNA A) under electron microscopy (Cavalcanti 2018) B) under atomic force microscopy. (Concalves 2018).
Figure 2.
Microscopy images of T. cruzi kinetoplast DNA A) under electron microscopy (Cavalcanti 2018) B) under atomic force microscopy. (Concalves 2018).
Figure 3.
Map of 900bp target region of Leishmania maxicircle showing relative locations of all RPA oligos and CRISPR guides designed.
Figure 3.
Map of 900bp target region of Leishmania maxicircle showing relative locations of all RPA oligos and CRISPR guides designed.
Figure 4.
Agarose gel image demonstrating 24 primer pair RPA reactions with Leishmania parasite DNA.
Figure 4.
Agarose gel image demonstrating 24 primer pair RPA reactions with Leishmania parasite DNA.
Figure 5.
RPA amplification with SYBR Green for visualization of fluorescent output between L. braziliensis and No DNA.
Figure 5.
RPA amplification with SYBR Green for visualization of fluorescent output between L. braziliensis and No DNA.
Figure 6.
Phase contrast microscope images showing L. panamensis parasites A) before lysis with grouping B) before lysis vortexed and C) after 0.1% Triton X-100 lysis.
Figure 6.
Phase contrast microscope images showing L. panamensis parasites A) before lysis with grouping B) before lysis vortexed and C) after 0.1% Triton X-100 lysis.
Figure 7.
Agarose gel analysis of RPA amplified products from 10-fold dilutions of starting lysed Leishmania DNA concentrations.
Figure 7.
Agarose gel analysis of RPA amplified products from 10-fold dilutions of starting lysed Leishmania DNA concentrations.
Figure 8.
Agarose gel analysis of RPA using range of temperature and timepoint parameters.
Figure 8.
Agarose gel analysis of RPA using range of temperature and timepoint parameters.
Figure 9.
CRISPR analysis for All-Leishmania visualized A) In PCR tubes on blue light, B) bar graphed based on quantitative fluorescent output from VarioSkan LUX machine.
Figure 9.
CRISPR analysis for All-Leishmania visualized A) In PCR tubes on blue light, B) bar graphed based on quantitative fluorescent output from VarioSkan LUX machine.
Figure 10.
RPA-CRISPR threshold of detection experiment when 500, 50, 5 and 0.5 parasites were utilized in the RPA reaction whose product was then used with the corresponding CRISPR assay. A) Fluorescent tubes visualization B) Graph of Fluorescent intensity.
Figure 10.
RPA-CRISPR threshold of detection experiment when 500, 50, 5 and 0.5 parasites were utilized in the RPA reaction whose product was then used with the corresponding CRISPR assay. A) Fluorescent tubes visualization B) Graph of Fluorescent intensity.
Figure 11.
CRISPR reaction evaluating viability of RPA at three timepoints 10, 20, 30 min and three dilutions undiluted, 1/10 and 1/100 alongside no DNA control.
Figure 11.
CRISPR reaction evaluating viability of RPA at three timepoints 10, 20, 30 min and three dilutions undiluted, 1/10 and 1/100 alongside no DNA control.
Figure 12.
CRISPR reaction evaluating RPA incubation timepoints of 5, 10, and 20 minutes with a 1/10 of RPA product alongside a no DNA control.
Figure 12.
CRISPR reaction evaluating RPA incubation timepoints of 5, 10, and 20 minutes with a 1/10 of RPA product alongside a no DNA control.
Figure 13.
CRISPR optimization reaction evaluating time and temperature parameters of 30, 34 and 37⁰C and incubation time of 20, 30 and 40 minutes alongside a No-DNA control.
Figure 13.
CRISPR optimization reaction evaluating time and temperature parameters of 30, 34 and 37⁰C and incubation time of 20, 30 and 40 minutes alongside a No-DNA control.
Figure 14.
RPA + CRISPR experiment demonstrating the P+G only specific CRISPR was only able to positively detect the L. panamensis DNA sample.
Figure 14.
RPA + CRISPR experiment demonstrating the P+G only specific CRISPR was only able to positively detect the L. panamensis DNA sample.
Figure 15.
3-D depiction of the three-track diagnostic prototype with separate RPA and CRISR chambers.
Figure 15.
3-D depiction of the three-track diagnostic prototype with separate RPA and CRISR chambers.
Table 1.
Details for the eight forward and seven reverse RPA oligos designed for the amplification of Region 1 and/or Region 2 on the maxicircle kinetoplast.
Table 1.
Details for the eight forward and seven reverse RPA oligos designed for the amplification of Region 1 and/or Region 2 on the maxicircle kinetoplast.
| Primer Name |
Nucleotide Sequence |
Length |
Nt. Location in PSC1 kinetoplast ACC#BK010875 |
| F1 |
GGCAAGTCCTACTCTCCTTTACAAAG |
26 |
1808..1838 |
| F2 |
GGCAAGTCCTACTCTCCTTTACAAAGAGAAC |
31 |
1808..1833 |
| F3 |
TTGTATGTTTGATTGGGGCAATACT |
25 |
1851..1875 |
| F4 |
AGGTTCGAGCAGGTTAACAAGC |
22 |
1922..1943 |
| F5 |
ATGTGTTTCATCGTCTACTTATTGC |
25 |
1955..1979 |
| F6 |
TTCGTTAGTTGGGTTAAAATCGTTG |
25 |
2012..2036 |
| F7 |
GATGCCAGCCGTTGCGGTAATTTCTATGC |
29 |
2417..2445 |
| F8 |
GATGCCAGCCGTTGCGGTAATTTC |
24 |
2417..2440 |
| R1 |
ATTAATGCTTGTTAACCTGCTCGAAC |
26 |
rev:1924..1949 |
| R2 |
TAGCAATAAGTAGACGATGAAACAC |
25 |
rev:1957..1981 |
| R3 |
TGCTTTACAACGATTTTAACCCAAC |
25 |
rev:2019..2043 |
| R4 |
TGCTTTACAACGATTTTAACCCAACTAACG |
30 |
rev:2014..2043 |
| R5 |
TAAAAGCATAGAAATTACCGCAACG |
25 |
rev:2426..2450 |
| R6 |
GTTGTCTTTATTACAAAGAATGGTGGGCAAC |
31 |
rev:2738..2768 |
| R7 |
GTTGTCTTTATTACAAAGAATGGTG |
25 |
rev:2744..2768 |
Table 2.
Details for the six CRISPR Guides designed for the detection of All Leishmania and Muco-cutaneous specific species. PAM sequence in bold not included in oligo.
Table 2.
Details for the six CRISPR Guides designed for the detection of All Leishmania and Muco-cutaneous specific species. PAM sequence in bold not included in oligo.
| Guide Name |
Nucleotide Target Sequence |
Length |
Location on Maxicircle |
| All-1 (L+T1) |
TTTACAACGATTTTAACCCAACTAA |
25 (21+PAM) |
rev:2016..2040 |
| All-2 (L+T2) |
TTTAGGAATAGTTAATAATAATTTA |
25 (21+PAM) |
2284..2308 |
| All-3 (LnotT1) |
TTTGACAACATGATAAGGATTATAA |
25 (21+PAM) |
2629..2653 |
| All-4 (LnotT2) |
TTTATAAAATAAATGTATAATATTT |
25 (21+PAM) |
rev:2450..2474 |
| MC-1 (P+G1) |
TTTAAAAATATAAAAGTCAATTGTT |
25 (21+PAM) |
2138..2161 |
| MC-2 (P+G2) |
TTTATATTATTTTATATTATTTTAT |
25 (21+PAM) |
2178..2201 |
