Submitted:
26 October 2024
Posted:
28 October 2024
You are already at the latest version
Abstract
Global climate change, characterised mainly by an upsurge in extreme rainfall events, is affecting the precarious economies of most vulnerable countries. The aim of this study is to analyse extreme rainfall events in the Oti watershed, which is characterised by high climatic variability. Daily observed and simulated rainfall and temperature data from two models (CCLM and REMO) in the Cordex programme were used. The data is subjected to statistical processing methods. Climatic indices were calculated using RclimDex software. The results obtained show a spatio-temporal variability in observed and simulated rainfall that follows an increasing north-south gradient. Both models overestimate observed rainfall, with deviations of 1.95 for the CCLM and 8.53 for the REMO. This shows that the CCLM is more realistic in reproducing observed rainfall, is therefore validated for the rainfall projection. The rainfall indices show a non-statistically significant increase in PRCPTOT, R99p, RX1day, RX5 days and CWD on the one hand, and a decrease in the SDII, R10 mm, R20 mm and R95p indices on the other for the observed rainfall. For simulated rainfall, the RCP 8.5 and RCP 4.5 scenarios predict an upward trend in some indices and a downward trend in others from 2025 to 2069.
Keywords:
Extreme rainfall events
; Rainfall indices
; Simulated rainfall
; Cordex
; Climate models
; Oti watershed
; Togo
1. Introduction
West Africa is one of the regions of the world most vulnerable to climate change. According to forecasts by the Intergovernmental Panel on Climate Change [1], certain extreme phenomena will increase in frequency and intensity in the 21st century as a result of changes in climatic averages and/or climate variability. All climate projections predict an intensification of average warming, in addition to changes in rainfall and also a greater frequency and intensification of extreme phenomena [2].
Many climate projections have shown that West Africa will experience a significant rise in temperatures associated with high variability in rainfall [3]. These climate changes could have harmful consequences for the environment, such as flooding or drought, reduced water availability and crop yields, and loss of biodiversity [4]. The increase in the frequency of extreme events such as droughts, floods and very intense rainfall has been mentioned by several authors [5,6]. These extreme weather and climate events will condition vulnerability to future extreme events by modifying already fragile ecosystems [7]. Indeed, West African climates are subject to strong variability or change depending on the time scale and analysis, the consequences of which are detrimental to sustainable development [8]. Several studies [9,10,11,12,13] on climate change in general and rainfall in particular have shown that climate change has been characterised by an intensification of rainfall and a recurrence of extreme events. The question of future changes in the frequency or intensity of these events, particularly as a result of increased concentrations of greenhouse gases in the atmosphere, is therefore a major one [5,14,15].
The Oti watershed in Togo is no exception to the extreme rainfall events associated with current climate variability. The occurrence of daily rainfall has repercussions on its hydrological dynamics and exceptional flooding, which has a serious impact on the livelihoods of the local population. These extreme rainfall events in the watershed have repercussions for all the ecosystems, and the populations affected suffer the consequences, leading to migration and hampering the achievement of the Sustainable Development Goals.
Populations are often surprised by the onset of drought on the one hand, and the occurrence of floods on the other, with dramatic consequences for the physical environment, human settlements and socio-economic systems. Nowadays, planners and engineers continue to use tools and guides dating back to the 1960s to assess extreme hydroclimatic events [16,17], whereas in the current context of global and environmental changes added to demographic growth, this approach seems to be obsolete and deserves to be updated with modern tools adapted to current climate trends and land use. This would make it possible to cope with flood episodes that are detrimental to environmental and human systems [18,19,20].
The aim of the present study is to analyse extreme rainfall events in the Oti watershed in Togo. In other words, the aim is to help decision-makers manage flood risk, which is why this study includes projections of future rainfall using data from two regional climate models (CCLM et REMO) from the Cordex West Africa programme under different RCP4.5 and RCP8.5 climate scenarios. By calculating indices for future periods, the study will provide policy-makers with a clearer picture of how extreme rainfall could change and help with risk planning and management in Togo.
2. Materials and Methods
2.1. Study Area
The Oti river basin in Togo is located in the extreme north of the country, in the Volta river basin, and drains part of the catchment areas of the countries bordering Togo, namely Burkina Faso, Benin and Ghana. At the Mango outlet, the Oti basin covers an area of 3,652 square kilometres and is located between 11°05‘ and 10°96’N and 0°12‘ and 0°95’E (Figure 1).
The topography of the watershed is based on a morphology that includes the Gourma peneplain, the Dapaong-Bombouaka plateaus and the Oti plain. The total elevation ranges from 106 to 506 meters. Its relatively dense hydrographic network is controlled by the Oti River. The Oti, the main water collector (167 kilometers long in Togo), rises in northern Benin on the eastern slopes of the Atacora chain, under the name of Pendjari. It follows a south-west-north-east orientation, crosses the Atacora region, and then reverses and returns south-west, arriving in Togo, where it takes the name of the Oti [21]. The Oti forms the natural border between Togo and Benin from its confluence with the Koumongou River, south of the Galangachi classified forest, to the Ghanaian commune of Sabari, south of which the Oti flows into Lake Volta. Its tributaries are the Wabga, Namiélé and Sansargou on its right bank. Its left bank tributaries are the Koumongou, Kéran and Kara. The riverbed of the Oti is cut into the clay formations and here and there bordered by a forest gallery. When the Oti overflows its banks during the rainy season, it causes major flooding with serious consequences for the people living along its banks.
According to the 5th General Census of Population and Housing (5thRGPH) in 2022, the Oti watershed had a population of 1,143,520. Several activities are practiced by these populations. These include agriculture, livestock, fishing, hunting, handicrafts, commerce, tourism, sand and gravel extraction, and transportation. However, agriculture seems to be the main activity of the people living in the watershed.
2.2. Data
The data used for this study are daily rainfall and air temperatures (maximum and minimum). They are collected from seven meteorological stations (Barkoissi, Borgou, Dapaong, Mandouri, Mango, Tankpamba, Toaga) of the National Agency for Meteorology in Togo (ANAMET) covering the period 1961-2022.
Simulation data from two models (CCLM and REMO) from the Cordex programme, which provides high-resolution data in the form of 0.44° * 0.44° grids, i.e., approximately 50 km * 50, are also used. These data cover the period from 2006 to 2100. The data is simulated in two phases, taking into account the historical aspect from 1961 to 2022 without the RCP (Representative Concentration Pathways) scenarios and the future aspect from 2025 to 2069 with the combination of RCP 4.5 and RCP 8.5 for the simulations. The priority simulations carried out as part of the CORDEX project concern only two of the RCPs defined, namely the RCP 4.5 and RCP 8.5 scenarios. These particular scenarios correspond to the B1 and A1B scenarios of the old GHG evolution profiles (SRES) [16]. They represent optimistic and pessimistic climate change scenarios for the 21st century, respectively [22]. For this reason, both scenarios are used in this study.
2.3. Methods
2.3.1. Interpolation of Rainfall Data in the Oti Watershed in Togo
There are several methods for interpolating rainfall data (simple arithmetic mean, linear interpolation, Thiessen polygon interpolation and ordinary block Kriging). The most robust and most widely used in recent years in tropical regions, particularly in West Africa, are linear interpolation and interpolation by Thiessen polygons. For the purposes of this study, the Thiessen polygon interpolation method was used. The weighted average precipitation P for the basin is then calculated by summing the precipitation Pi from each station, multiplied by their weighting factor (area Si), divided by the total surface area S of the basin. The average rainfall over the basin is therefore written as:
With Pi: rainfall at the station within the polygon; Si: surface area of the polygon and S: total surface area of the watershed area.
2.3.2. Bias Calculation Method
In order to assess the performance of the two models (CCLM and REMO) of the Cordex programme in reproducing as well as possible the interannual variability of annual accumulations on the one hand, and for the analysis of extreme rainfall events in the future on the other hand, the calculation of biases is necessary. The bias calculation method involves calculating the difference in means between simulated and observed rainfall [17,23]. It is used to identify the best simulation model that best matches the analysis of future projections of mean rainfall and extremes [24,25,26]. It evaluates the deviation of simulated rainfall from observations and is obtained by the following formula:
where SimP = simulated precipitation and ObsP: observed precipitation.
Bias = PSim - Pobs / PObs
2.3.3. Data Quality Control
For the data to be usable in the RclimDex software, quality control must first be carried out to help identify any recording errors that may exist in the daily data [27,28]. Thus, the principle consists of:
- replace the daily maximum temperature of the erroneous values by -99.9, if it is lower than the daily minimum temperature ;
- not more than 365 daily observations per year ;
- no more than 28 observations in the month of February, whatever the year ;
- replace missing or negative data (for rainfall) with -99.9 before quality control by the software.
2.3.4. Choice of Climatic Indices Used
Several indices were used to analyse extreme rainfall events. These indices are relatively simple ways of assessing changes in extreme rainfall events that affect the natural and human environment [29]. It was in this context that the CLIVAR (Climate Variability and predictability) group [30] of the WCRP (World Climate Research programme) of the WMO (World Meteorological Organisation) proposed a list of twenty-seven (27) indices calculated from daily series of surface variables (rainfall and temperature). The purpose of these indices is to characterise extremes, frequency, amplitude and persistence. In the context of this study, the calculation of these indices is based on rainfall, and nine indices have been calculated to analyse extreme rainfall events as proposed by the ETCCDI expert group (Table 1). This analysis method is commonly used to study extreme events [31,32,33].
2.3.5. Trend Analysis
Trends were analyzed using linear regression between the different rainfall indices and time over the entire series. The slopes estimated in this way were grouped into three classes ([p > 0.05] insignificant, [0.01 < p < 0.05] significant and [p < 0.01]) highly significant, indicating upward or downward trends. The threshold is defined on the basis of the Student’s t statistic, which is used to test the hypothesis of a slope equal to 0. The trend is therefore qualified as significant if the probability p of the t-test applied to the regression slope is less than 0.05, while it is not significant if it exceeds the 0.05 threshold.
3. Results
3.1. Interannual Trends in Maximum Daily Rainfall from 1961–2022
Figure 2 illustrates the interannual variability of maximum daily rainfall in the Oti watershed in Togo.
Analysis of Figure 3 reveals interannual variability in maximum daily rainfall in the Oti watershed in Togo. This indicates a non-statistically significant upward trend in maximum daily rainfall, with a positive slope. The calculated p-value (0.20) is above the significance level at the alpha value threshold of 0.05. Maximum daily rainfall varies from 53.22 to 124.90 mm in the watershed. The maximum daily rainfall for the entire series was 124.9 mm in 1999. The lowest value for maximum rainfall is 53.22 mm recorded in 1976. It should be noted that it is the accumulation of rainfall maxima that amplifies extreme rainfall events in the Oti watershed in Togo. This in turn increases run-off followed by flooding.
3.2. Interannual Variability of Observed and Simulated Rainfall from 1961 to 2005 in the Oti Watershed in Togo
Figure 3 shows the interannual variability of observed and simulated rainfall in the Oti watershed in Togo, based on data from the African Cordex programme.
Analysis of Figure 3 shows that the cumulative rainfall simulated by the models and that observed have almost the same trend. Figure 3 shows that both models overestimate observed rainfall in the study area. It should be noted that the CCLM model overestimates observations less than REMO. This is justified by the difference values of 1.95 for CCLM and 8.53 for REMO. Cumulative annual rainfall varies from 715.3 mm to 1762.2 mm for REMO, while the CCLM shows cumulative precipitation ranging from 646.7 to 1402.1 mm. At the same time, observations vary from 878.4 mm to 1233.3 mm.
3.3. Rainfall Regime of Observed and Simulated Rainfall Amounts with the Output of the African Cordex RCM 1961-2005 for the Oti Watershed in Togo
Figure 4 shows the rainfall pattern of observed and simulated rainfall amounts from 1961 to 2005. This will enable the REMO and CCLM models and the mean climatological regime of the study area as a whole to be evaluated to see whether these models are suitable for the seasonal study.
Figure 4 shows that the two models are close to the observed rainfall and tend to represent the rainfall regime towards a unimodal rainfall regime for the observed rainfall in the Oti watershed, which peaks in August. The REMO model overestimates the observations, while the CCLM model underestimates them by 6.27 and 0.01 respectively. It should be pointed out that they reproduce the seasonal variability of rainfall within the same region and in the same sector in different ways, which is likely to influence the variability of cumulative rainfall and the choice of the appropriate model. From this observation, it should be noted that CCLM reflects the reality of observations and is suitable for seasonal analysis in the Oti watershed in Togo. The CCLM model was therefore chosen to project rainfall in the Oti watershed in Togo.
3.4. Rainfall Projections under RCP 4.5 and RCP 8.5 Scenarios for the Period 2025–2069
Climate projections are needed to analyse future rainfall extremes under the RCP 4.5 and RCP 8.5 scenarios for the period 2025-2069 in the Oti watershed. The Cordex programme in West Africa offers data from several models and concerns historical data and data projected to 2100. For this research, the analysis of extreme rainfall data is carried out taking into account the period 2025-2069 with the RCP 4.5 and RCP 8.5 scenarios for the Oti watershed in Togo. This period covers 44 years and is linked to the reference period (1961-2005) for evaluating the performance of the RCM.
Figure 5 shows the precipitation trends for 2025-2069 in the CCLM model according to the RCP 8.5 and RCP 4.5 scenarios.
Analysis of Figure 5 reveals interannual variability in future rainfall for the RCP 4.5 and RCP 8.5 scenarios and the reference rainfall for the period 2025-2069 in the Oti watershed in Togo. The RCP 4.5 and RCP 8.5 scenarios underestimate the reference rainfall, with differences of -0.15 for each RCP. This shows that with RCP 4.5 and RCP 8.5, rainfall in the CCLM model will decrease by 2025-2069.
3.5. Changes in Maximum Daily Rainfall Under RCP 4.5 and 8.5 Scenarios for the Period 2025-2069
Figure 6 shows daily rainfall variability in the Oti watershed in Togo from 2025 to 2069.
Figure 6 shows the daily rainfall variability projected from 2025 to 2069 in the Oti watershed in Togo. The simulated daily rainfall varies from 1 mm to 137.95 mm with an average of 2.36 mm for the RCP 8.5 scenario and from 1 to 196.52 mm with an average of 2.38 mm for the RCP 4.5 scenario. The change in daily rainfall by 2069 will therefore be accompanied by an increase in run-off and, consequently, recurrent flooding over this period.
3.6. Spatial Variation of Observed and Simulated Mean Annual Rainfall
In the case of the flood risk study, it is important to project the rainfall field in the Oti watershed in order to see the sectors that will record the most rainfall by 2069. This makes it possible to determine the amount of rain that will fall on the watershed under both RCP 8.5 and RCP 4.5.
Figure 7 shows the distribution of observed and simulated mean annual rainfall fields in the Oti watershed for 1961-2005 and 2025-2069.
Analysis of Figure 7 shows that rainfall increases from north to south, indicating a variation in mean annual rainfall in the watershed. The reference rainfall varies from 999.66 mm in the north to 1103.83 mm in the south and is distributed along an increasing north-south gradient. RCP 8.5 varies spatially from 837.62 mm in the north to 905 mm in the south and RCP 4.5 varies from 840.55 mm to 915.57 mm. In fact, the south is the wettest part of the basin, with average annual rainfall in excess of 1,000 mm. The north-east (Mandouri) receives little rainfall, with average annual rainfall always below 1000 mm.
Generally speaking, the south of the watershed (downstream) will record more rainfall than the north (upstream) according to the RCP 4.5 and RCP 8.5 scenarios of this model. The models predict an increase in rainfall from the north to the south of the watershed. This decrease is more pronounced in the vicinity of Mandouri in the north-east and in the north-west at Dapaong.
3.7. Variability of Extreme Rainfall Events with Observed Rainfall
Table 2 shows the nine climatic indices calculated to characterise extreme rainfall events observed in the Oti watershed in Togo. These are PRCPTOT, SDII, R10 mm, R20 mm, R95p, R99p, RX1day, RX5 days and CWD.
Analysis of Table 2 shows that total annual rainfall in rainy days (PRCPTOT) in the Oti catchment in Togo is increasing and varies from 665.5 mm to 1373.5 mm. The positive value of the slope (0.93) confirms the non-statistically significant increase, with an estimated p-value of 0.40. In contrast, the daily rainfall intensity (SDII) showed a non-significant decrease with a p-value of 0.27. The indices for the number of days with rainfall of more than 10 mm (R10 mm) and 20 mm (R20 mm) show a non-significant downward trend, with p-values of 0.37 and 0.70 respectively. Rainfall amounts associated with the 95th percentile vary from 28.4 to 511.1 mm and are considered to be very heavy rainfall events in the study area. These 95th percentile rainfall amounts show a non-significant downward trend, with a p-value of 0.83. On the other hand, at the 99th percentile, rainfall amounts vary from 0 to 260.4 mm and are described as extremely heavy in the catchment area. This index shows a statistically insignificant upward trend, with a p-value of 0.49.
There is an upward trend in the maximum total rainfall indices for one rainy day (Rx1day) and five consecutive rainy days (Rx5day). The respective p-values are 0.20 and 0.90. Analysis of the maximum number of consecutive days of rainfall in excess of 1 mm in the watershed provides a better understanding of the extreme rainfall phenomenon. The CWD shows a non-significant upward trend, with a p-value of 0.34.
3.8. Variability of Simulated Extreme Rainfall Events in the Oti Watershed between 2025 and 2069
Table 3 shows the characteristics of the trends in extreme rainfall events simulated using nine climate indices under the RCP 8.5 and RCP 4.5 scenarios from 2025 to 2069.
Analysis of Table 3 shows that, according to the CCLM model, climate indices such as Rx1 day, SDII and R99P will show a non-significant upward trend from 2025 to 2069 for RCP 8.5, as shown by their slope and P-value. The rest of the indices will show an insignificant downward trend. For the RCP 4.5 scenario, on the other hand, the Rx1 day, Rx5 days and R99P will rise over the same period and the rest of the climate indices will fall.
4. Discussion
This study analyses extreme rainfall events in the Oti watershed in Togo using simulated data from two models (CCLM and REMO) from the Cordex programme and observed station data. The results show interannual variability in observed and simulated rainfall. The rainfall of the two models overestimates observed rainfall. Between the two models, the CCLM overestimates the observations less than REMO in relation to the calculated biases. This enabled the CCLM to be validated for projecting future rainfall in the study area, as it is more realistic than REMO. These results corroborate the research of [34] who find that regional climate models (RCMs) reproduce rainfall differently for the same study area. This point was raised by [17,24,35], when they found that some models overestimate observations while others underestimate them.
An uneven distribution of observed and simulated mean annual rainfall is recorded over the whole of the Oti watershed in Togo, following a decreasing south-north gradient showing a significant accumulation of water downstream of the watershed. This situation could be explained by the orographic effect, as the south benefits from the effect of orographic rainfall from the extension of the Togo mountains. Similarly, the Atacora to the east plays an amplifying role in rainfall in the Oti watershed and the transfer of water from upstream to downstream. This phenomenon has already been reported by [36,37,38] in the Mono basin in Benin and Togo.
According to the CCLM model, rainfall is set to fall over the period 2025-2069 under the RCP 4.5 and RCP 8.5 scenarios. This is in line with the study by [39], whose results from three regional models under the RCP4.5 and RCP8.5 scenarios show a general downward trend in average rainfall in West Africa. Similarly, [40] predict a decline in rainfall for the distant future. The study showed a non-statistically significant upward trend in maximum daily rainfall in the Oti watershed in Togo. However, the link between cumulative maximum rainfall and runoff in the Oti watershed should be emphasised. The cumulative daily maximum can have repercussions on runoff. This finding has already been reported by [17,41,42,43,44]. For these authors, maximum daily rainfall is an indicator for assessing rainfall hazards in the wet season or during periods of high rainfall intensity, which leads to flooding.
The results also show monthly variability in rainfall across the watershed, indicating that the wettest or rainiest months are August and September. This indicates the unimodal nature of the climate in the study area, with a single rainy season and a single dry season. The same observation was made by [45,46,47,48] in the Oti Basin in Togo. These wettest months constitute the period during which cumulative rainfall causes high water followed by flooding in the Oti watershed in Togo. This observation corroborates the results of [17,41] in the Ouémé watershed in Benin. The period from May to October is marked by a slight dip in August. Overall, this is the period during which cumulative rainfall contributes to replenishing water stocks in soil horizons and replenishing underground reservoirs. This phenomenon would be more noticeable in the downstream part of the basin due to the differential hydrodynamics associated with the geological bedrock in place and the topography of this part of the basin. These results confirm those of [17,49] in Benin. Under these conditions, any change in rainfall patterns during these months would disrupt the hydrogeological functioning of the basin, with slightly more acuity in the downstream part of the basin. Similarly, the REMO model overestimates observations and the CCLM underestimates them, reflecting the different reproduction of seasonal rainfall variability within the same area. This collaborates with the results of [17,50].
The results for the nine climate indices calculated to characterise extreme rainfall events in the Oti watershed in Togo show that the PRCPTOT, R99p, RX1day, RX5 days and CWD indices showed a non-statistically significant increase between 1961 and 2022. The upward trend in these indices is characteristic of extreme rainfall events in the watershed. This increases runoff and consequently the recurrence of floods in the Oti watershed in Togo. This corroborates the results of [51] in Togo. These results are consistent with those of [52], who reported a clear increase in extreme rainfall, extremely heavy rainfall and consecutive maximums over 1, 2, 3, 5 and 10 days in the Ouémé delta (Benin). In addition, [53] noted a significant increase in total rainfall on wet days over the 39-year observation period, as well as in cumulative rainfall over 5 consecutive days.
In addition, the SDII, R10 mm, R20 mm and R95p indices show an insignificant downward trend from 1961-2022. The downward trend in these indices should help to reduce flooding in the watershed. On the other hand, flooding has recurred in recent decades in the Oti watershed in Togo. It is therefore likely that the increase in flooding is linked to an increase in vulnerability, particularly in the absence of territorial planning, rather than to the hazard, as various studies have already suggested [54,55,56]. The same observations were made by [57]. The Rx1 day, SDII and R99P rainfall indices simulated by the CCLM model will show an upward trend from 2025 to 2069 for RCP 8.5. This corroborates the results of several studies [58,59,60]. For the RCP 4.5 scenario, Rx1 day, Rx5 days and R99P will also increase over the same period, while the rest of the climate indices will decrease. This finding corroborates the results of work by [61], based on the PRECIS/ECHAM4-A2 model, [54] using the UKhadCM3 model and [17]. Thus, increased rainfall according to PCR 4.5 and PCR 8.5 with extreme rains could lead to flood risks in the study area. [62] had previously shown that the projected rising rainfall trend of the general circulation model leads to a likely increase in extreme rainfall events in West Africa.
5. Conclusions
The analysis of extreme rainfall events in the Oti watershed in Togo with simulated and observed rainfall shows a spatio-temporal variability of the annual mean rainfall fields as well as the daily maximum rainfall. The distribution of rainfall follows a decreasing south-north gradient in the watershed. The simulated rainfall overestimates the observed rainfall with a difference of 1.95. According to the CCLM model, rainfall will decrease during the period 2025-2069 depending on whether we are with the RCP 4.5 and RCP 8.5 scenarios.
The examination of the different rainfall indices calculated from the observed rainfall to characterize extreme rainfall events in the watershed shows a statistically non-significant upward trend in PRCPTOT, R99p, RX1day, RX5 days and CWD on the one hand, and a non-significant decrease in the SDII, R10 mm, R20 mm and R95p indices on the other hand. For the simulated rainfall, climate indices such as Rx1 day, SDII and R99P will experience a non-significant upward trend from 2025 to 2069 for RCP 8.5. In the same sense, the RCP 4.5 scenario predicts an increase in the Rx1 day, Rx5 days and R99P indices. The trend in these indices justifies the recurrence of floods and consequently flooding in the Oti watershed in Togo. This study provides a clearer picture of how extreme rainfall could change and constitutes a tool to support planning and flood risk management in the context of climate change and the high vulnerability of populations in the Oti watershed in Togo.
Author Contributions
K.D.: Conceptualization, Methodology, Software, Validation, Formal analysis, Investigation, Data curation, Climate Change Analysis, Preparation maps, Writing-original draft, Writing-review and editing, Visualization ; K.J.D.: Conceptualization, Methodology, Validation, Methodology, Validation, Formal analysis, Writing-review and editing ; T.V.S.H.: Formal analysis, Writing-review and editing, Supervising ; A.E.: Formal analysis, Writing-review and editing, Supervising ; All authors have read and agreed to the published version of the manuscript.
Funding
The corresponding authors acknowledged the financial support provided by the Prince Albert II of Monaco Foundation as part of the IPCC postdoctoral research fellowship.
Declaration of data availability
The National Agency for Meteorology of Togo (ANAMET) has provided observational climate data. Simulation data from the Coordinated Regional climate Downscaling Experiment (Cordex) programme are available free of charge on the following website: https://cordex.org/data-access/.
Acknowledgments
“This document was produced with the financial support of the Prince Albert II of Monaco Foundation. The contents of this document are solely the liability of Dambré Koungbanane and under no circumstances may be considered as a reflection of the position of the Prince Albert II of Monaco Foundation and/or the IPCC.”.
Conflicts of Interest
The authors declare no conflicts of interest.
References
- IPCC. Regional Impacts of Climate Change: Vulnerability Assessment in Africa, Report of Working Group I of the Intergovernmental Panel on Climate Change, 2001, pp 1-3.
- IPCC. Climate Change: Impacts, Adaptation and Vulnerability, 2014, 201 p.
- Ly, M. ; Traoré S. B. ; Alhassane, A. ; Sarr, B. Evolution of Some Observed Climate Extremes in the West African Sahel. Weath. and Clim. Ext., 2013, 19–25. [CrossRef]
- Sylla, M.B. ; Nikiema, P.M. ; Gibba, P. ; Kebe, I. ; Klutse, N.A.B. Climate Change over West Africa: Recent Trends and Future Projections. J.A. Yaro and J. Hesselberg (eds.), Adaptation to Climate Change and Variability in Rural West Africa, 2012. [CrossRef]
- Amoussou, E. ; Camberlin, P. ; Totin, V. S. H. ; Tramblay, Y. ; Houndénou, C. ; Mahé, G. ; Paturel, J.-E. ; Boko, M. Évolution des précipitations extrêmes dans le bassin versant du Mono (Bénin-Togo) en contexte de variabilité / changement climatique. In Clim.: Système & Interactions, 2014, XXVIIème colloque de l’Association Internationale de Climatologie (AIC), Dijon, France, pp 331-337.
- Descroix, L. ; Diongue Niang, A. ; Panthou, G. ; Bodian, A. ; Sane, Y. ; Dacosta, H. ; Quantin, G. Évolution récente de la pluviométrie en Afrique de l’Ouest à travers deux régions: La Sénégambie et le bassin du Niger moyen. J. of Clim., 2015, 12, 25-43pp.
- Katz, R.W. and Brown, B.G. Extreme Events in a Changing Climate: Variability Is More Important than Averages. Clim. Chang., 1992, 21, 289-302. [CrossRef]
- Tapsoba, D. Caractérisation événementielle des régimes pluviométriques Ouest africains et de leur récent changement. Thèse de Doctorat de l’Université de PARIS-XI (ORSAY), 1997, 300 p.
- Panthou, G. ; Vischel, T. et Lebel, T. Recent trends in the regime of extreme rainfall in the Central Sahel. Inter. J. of Clim., 2014, vol. 34, n° 15, p. 3998-4006. [CrossRef]
- Donat, M.G. ; Lowry, A.L. ; Alexander, L.V. ; O’Gorman, P.A. ; Maher, N. More extreme precipitation in the world’s dry and wet regions. Nat. Clim. Chang., 2016, vol. 6, n° 5, p. 508-513. [CrossRef]
- Ozer, P. ; Laminou Manzo, O. ; Tidjani, A.D. ; Djaby, B. et De Longueville, F. Évolution récente des extrêmes pluviométriques au Niger (1950-2014). Geo-Eco-Trop., 2017, vol. 41, n° 3, p. 375-383.
- Biasutti, M. Rainfall trends in the African Sahel: Characteristics, processes, and causes. Wiley interdisciplinary reviews. Clim. Chang., 2019, vol. 10, n° 4, article e591, 22 p. [CrossRef]
- Nouaceur, Z. La reprise des pluies et la recrudescence des inondations en Afrique de l’Ouest sahélienne. Physio-Géo., 2020, vol. 15, p. 89-109. [CrossRef]
- Crétat, J. ; Vizy, K.E. and Cook, H.K. How well are daily intense rainfall events captured by current climate models over Africa? Clim. Dyn., 2013. [CrossRef]
- Mladjic, B. ; Sushama, L. ; Khaliq, M.N. ; Laprise, R. ; Caya, D. ; Roy, R. Canadian RCM Projected Changes to Extreme Precipitation Characteristics over Canada. J. of Clim. 2011, 24(10), 2 565-2 584. [CrossRef]
- Nka Nnomo, B. Contribution à l’Actualisation des Normes Hydrologiques en relation avec les Changements Climatiques et Environnementaux en Afrique de l’Ouest, Thèse de Doctorat, UPMC, 2016, 253 p.
- Kodja, D. J. Indicateurs des événements hydroclimatiques extrêmes dans le bassin-versant de l’Oueme à l’exutoire de Bonou en Afrique de l’ouest. Thèse de Doctorat, Université de Montpellier, 2018, 287p.
- Paturel, J. E. ; Ouedraogo, M. ; Mahé, G. ; Servat, E. et Dezetter, A. Utilisation de modèles hydrologiques pour évaluer les ressources en eau de surface et leur évolution spatio-temporelle-application à l’Afrique de l’Ouest. IAHS Publication, 2003, 117-123.
- Koumassi, D. H. ; Tchibozo, A. E. ; Vissin, E. ; et Houssou, C. Analyse fréquentielle des évènements hydro-pluviométriques extrêmes dans le bassin de la Sota au Bénin. Afrique Science: Inter. Sc. et Techn., 2014, 10(2).
- Komi, K. ; Barnabas, A.A. ; Bernd D. Integrated Flood Risk Assessment of Rural Communities in the Oti River Basin, WestAfrica. Hydrol., 2016, (46):7-12.
- Mul, M. ; Obuobie E. ; Appoh, R. ; Kankam, Y. ; Bekoe-Obeng, E. ; Amisigo, B. ; Logah, Y. ; Ghansah, B. ; McCartney, M. Évaluation des ressources en eau du bassin de la Volta. Programme des Nations Unies pour l’Environnement, 2015, Accra-Ghana.
- Herbst, L. ; Rautenbach, H. Climate change impacts on South African wind energy resources. Africa Insight, 2016, 45(4), 1-31 p.
- Yèkambèssoun, N. M. ; Agnidé, E. L. ; Ganiyu, T. O. ; Benjamin, K. Y. et Abel, A.A. Comparison of Daily Precipitation Bias Correction Methods Based on Four Regional Climate Model Outputs in Ouémé Basin, Benin. Hydrol., 2016, Vol. 4, No. 6, pp. 58-71. [CrossRef]
- Taïbi-Freddal, S. Influence de la circulation atmosphérique générale sur les précipitations du Nord de l’Algérie, Thèse de Doctorat, Ecole Nationale Supérieure d’Hydraulique (Algérie), 2016, 192p.
- Yira, Y. ; Diekkrüger, B. ; Steup, G. ; Bossa, A.Y. Modeling land use change impacts on water resources in a tropical West African catchment (Dano, Burkina Faso). Hydrol., Volume 537, June 2016, Pages 187-199. [CrossRef]
- Sarr, AB. Évolution Des Indices Pluviométriques Extrêmes Par L’analyse De Modèles Climatiques Régionaux Du Programme CORDEX: Les Projections Climatiques Sur Le Sénégal. Euro. Sc. Journal edition .13 (2017), 206-222.
- Balliet, R. Impacts du changement climatique et de la pression anthropique sur l’environnement naturel et humain de la région du Gôh (Centre-ouest de la Côte d’Ivoire): analyse de mesures endogènes d’adaptation. Thèse unique, Université Félix Houphouët Boigny ; 2017, 193 p.
- Atcheremi, K.N.D ; Jourda, J. P. R. ; Saley, M. B. ; Kouame, K. J. ; Balliet, R. Etude de l’évolution des extrêmes pluviométriques et de température dans le bassin versant de Rivière Davo (Sud-Ouest de la Cote d’Ivoire). Larhyss Journal, ISSN 1112-3680, n°36, Dec 2018, pp. 99-117 © 2018 All rights reserved, Legal Deposit 1266-2002.
- Gbohoui, Y. P. ; Hountondji, Y. C. ; De Longueville, F. ; Ozer P. Aperçu synoptique de la variabilite des extremes climatiques au Bénin (1960-2016). 31 ème colloque de l’Association Internationale de Climatologie, Nice, 2018, PP 98-103.
- Frich, P. ; Alexander, L. V. ; Della-Marta, P. ; Gleason, B. ; Haylock, M. ; Klein Tank, A. M. G. and Peterson, T. Observed coherent changes in climatic extremes during the second half of the twentieth century. Clim. Res., 2002, 19, 193–212.
- Hountondji, Y. C. ; De Longueville, F. ; Ozer, P. Trends in extreme rainfall events in Benin (West Africa), 1960-2000. Proceedings of the 1st International Conference on Energy, Environment and Climate Change, 26-27 August 2011, Ho Chi Minh City, Vietnam. http://orbi.ulg.ac.be/handle/2268/96112 (April 19, 2016).
- Filahi, S. ; Mouhir, L. ; Tanarhte, M. ; Tramblay, Y. Tendance et variabilité des événements extrêmes au Maroc. XXVIIIe Colloque de l’Association Internationale de Climatologie, Liège 2015.
- Djossou, M. L. D. ; Kodja, D. J. ; Vissin, E. W. Analyse de la Variabilité des Extrêmes Climatiques dans le Bassin Versant de la Pendjari à l’Exutoire de Porga au Bénin. Inter. J. of Progr. Sc. and Techn., Vol 22, No 2 (2020).
- Tramblay, Y. ; Badi, W. ; Driouech, F. ; El Adlouni, S. ; Neppel, L. ; Servat, E. Climate change impacts on extreme precipitation in Morocco. Global and Planetary Chang., 2012, 82-83, p.104–114.
- Mascaro, G. ; White, D.D. ; Westerhoff, P. & Bliss, N. Performance of the CORDEX-Africa regional climate simulations in representing the hydrological cycle of the Niger River basin. Journal of Geophysical Research: Atmos., 2015, 120(24), 12425-12444.
- Klassou, S. D. Évolution climato-hydrologique récente et conséquences sur l’environnement: l’exemple du basin versant du fleuve Mono (Togo-Bénin). Thèse de Doctorat, Université de Bordeaux III, 1996, 472 p.
- Amoussou, E. Variabilité pluviométrique et dynamique hydro-sédimentaire du bassin-versant du complexe fluvio-lagunaire Mono-Ahémé-Couffo (Afrique de l’Ouest). Université de Bourgogne, Thèse de Doctorat, 2010, 315p+ annexes.
- Houessou, S. Les inondations et les risques prévisionnels lies aux barrages hydroélectriques dans la basse vallée du mono. Thèse de Doctorat de Géographie, Université d’Abomey-Calavi, Cotonou, Bénin, 2016, 198 p.
- Diallo, I. ; Sylla M.B. ; Giorgi, F. ; Gaye, A.T. & Camara, M. Multimodel GCM-RCM ensemble-based projections of temperature and precipitation over West Africa for the Early 21st Century. Inter. J. of Geophysics, 2012.
- Tall, M. ; Albergel, C. ; Bonan, B. ; Zheng, Y. ; Guichard, F. ; Dramé, M.S. ; Gaye, A.T. ; Sintondji, L.O. ; Hountondji, F.C.C. ; Nikiema, P.M. Towards a Long-Term Reanalysis of Land Surface Variables over Western Africa: LDAS-Monde Applied over Burkina Faso from 2001 to 2018. Remote Sens., 2019, 11(6):735. [CrossRef]
- Totin, V. S. H. ; Amoussou, E. ; Odoulami, L. ; Boko, M. ; Blivi, B. A. Seuils pluviométriques des niveaux de risque d’inondation dans le bassin de l’Ouémé au Bénin (Afrique de l’Ouest). In XXIXe Colloque de l’Association Internationale de Climatologie, Lausanne-Besançon, 2016, pp 369-374.
- Koumassi, D. H. Risques hydroclimatiques et vulnérabilité des écosystèmes dans le bassin-versant de la Sota. Thèse de Doctorat de l’Université d’Abomey-Calavi, 2014, 244 p.
- Amoussou, E. ; Camberlin, P. et Mahé, G. Impact de la variabilité climatique et du barrage de Nangbéto sur l’hydrologie du système Mono-Couffo au Bénin. In Hydrol. Sc. Journal, 2012, Vol.57, Issue 4, pp 805-817.
- Amoussou, E. Analyse hydrométéorologique des crues dans le bassin versant du Mono en Afrique de l’Ouest avec un modèle conceptuel pluie-débit. Rapport à publier avec la Fondation Maison des Sciences de l’Homme (FMSH), 2015, 190 avenue de France, 75013 Paris, France. http://www.fmsh.fr - FMSH-WP-2014-90.
- Baritsé, L. Versants et systèmes de versants ; l’exemple du Nord Togo. Thèse de doctorat de Géographie physique, Paris, Panthéon Sorbonne, 1986, 179p.
- Kankpénandja, L. Contribution à l’étude géomorphologique de la plaine alluviale du Kpendjal (Région des Savanes). Mémoire de maîtrise en Géographie, Université de Lomé, 2002, 136p.
- Adéwi, E. Les stratégies agricoles de gestion de la péjoration pluviométrique au Togo. Thèse de Doctorat Unique de Géographie, spécialité Agroclimatologie, Université de Lomé, Togo, 2012, 320 p.
- Badjana, H. M. ; Hounkpè, K. ; Wala, K. ; Batawila, K. ; Akpagana, K. ; Edjamé, K. S. Analyse de la variabilité temporelle et spatiale des séries climatiques du nord du Togo entre 1960 et 2010. In Euro. Sc. Journal, 2014, vol.10, No.11 ISSN: 1857–7881 (Print) e - ISSN 1857-7431, 19 p.
- Atchadé, A. A. G. Impacts de la dynamique du climat et de l’occupation des terres sur les ressources en eau du bassin-versant de la rivière zou dans le Bénin méridional. Thèse de Doctorat, EDP/FLASH, 2014, 235 p.
- Taïbi, S. ; Meddi, M ; Mahé, G. et Assani A. Relationships between atmospheric circulation indices and rainfall in northern Algeria and comparison of observed and RCM-generated rainfall. Theoretical and Applied Clim. 2015, ISSN 0177-798X. 19 p. [CrossRef]
- Issaou, L. Risques climatiques dans le Sud-Togo: manifestations, impacts et stratégies d’adaptation. Thèse de Doctorat de Géographie de l’Université de Lomé, Togo, 2014, 264 p.
- Hounguè, R.; Lawin, AE; Moumouni, S.; Afouda, AA Évolution des extrêmes climatiques et des facteurs d’influence de l’évaporation dans le delta de l’Ouémé au Bénin. Clim., 2019, 7 , 2. [ Google Scholar ] [ CrossRef ].
- Dike, VN; Lin, ZH; Ibe, CC Intensification des extrêmes de précipitations estivales au Nigéria au cours des dernières décennies. Atmos., 2020, 11,1084. [ Google Scholar ].
- Descroix, L. ; Diongue, N. A. ; Dacosta, H. ; Panthou, G. ; Quantin, G. et Diedhiou, A. Evolution des pluies de cumul élevé et recrudescence des crues depuis 1951 dans le bassin du Niger Moyen (Sahel). In Clim., 2013, 10, pp. 37-49.
- Oze, P. Catastrophes naturelles et aménagement du territoire: de l’intérêt des images Google Earth dans les pays en développement. Geo-Eco-Trop., 2014, 38,1, n.s.: 209-220.
- Hangnon, H. ; De Longueville, F. et Ozer, P. Précipitations extrêmes et inondations à Ouagadougou: Quand le développement urbain est mal maîtrisé…, In Actes du 28ème colloque de l’AIC, Liège, Belgique, 2015, (pp. 497-502).
- Ozer, P. ; Djaby, B. et De Longueville, F. Evolution récente des extrêmes pluviométriques au Niger (1950-2014). Communication, Workshop « Coopération Universitaire au Développement avec le Niger » Université de Liège, Arlon, 2015, Campus Environnement.
- Koala, S. ; Nakoulma, G. ; Dipama, J-M. Évolution des précipitations et de la température à l’horizon 2050 avec les Modèles Climatiques CMIP5 dans le bassin versant du Nakambé (Burkina Faso). Inter. J. of Progr. Sc. and Techn. (IJPSAT). Vol. 37 No. 2 March 2023, pp. 110-124.
- Famien, A.M. Analyse de la variabilité décennale et du changement climatique en Afrique de l’ouest à l’aide des produits CMIP5-Application à l’estimation des rendements agricoles à la fin du siècle. Thèse de Doctorat en Physique Atmosphérique et Océanique, Université Félix Houphouët Boigny Abidjan (Côte d’Ivoire), 2020, 338 p.
- Sarr AB. Évolution Des Indices Pluviométriques Extrêmes Par L’analyse De Modèles Climatiques Régionaux DuProgramme CORDEX: Les Projections Climatiques Sur Le Sénégal. Euro. Sc. Journal edition .13 (2017), 206-222.
- Totin, V.S. Simulation de l’évolution récente et future du climat du Bassin Sédimentaire Côtier du Bénin par le modèle PRECIS/ECHAM4-A2 et B2, Rapport de stage. 2009, ACMAD, 20p.
- Abiodun, B.J.; Adegoke, J.; Abatan, A.A.; Ibe C.A.; Egbebiyi, T.S.; Engelbrecht, F.; Pinto I. Impacts potentiels du changement climatique sur les précipitations extrêmes dans quatre villes côtières africaines. Clim. Chang. 2017, 143, 399–413. [ Google Scholar ].
Figure 1.
Location of the Oti watershed in Togo.
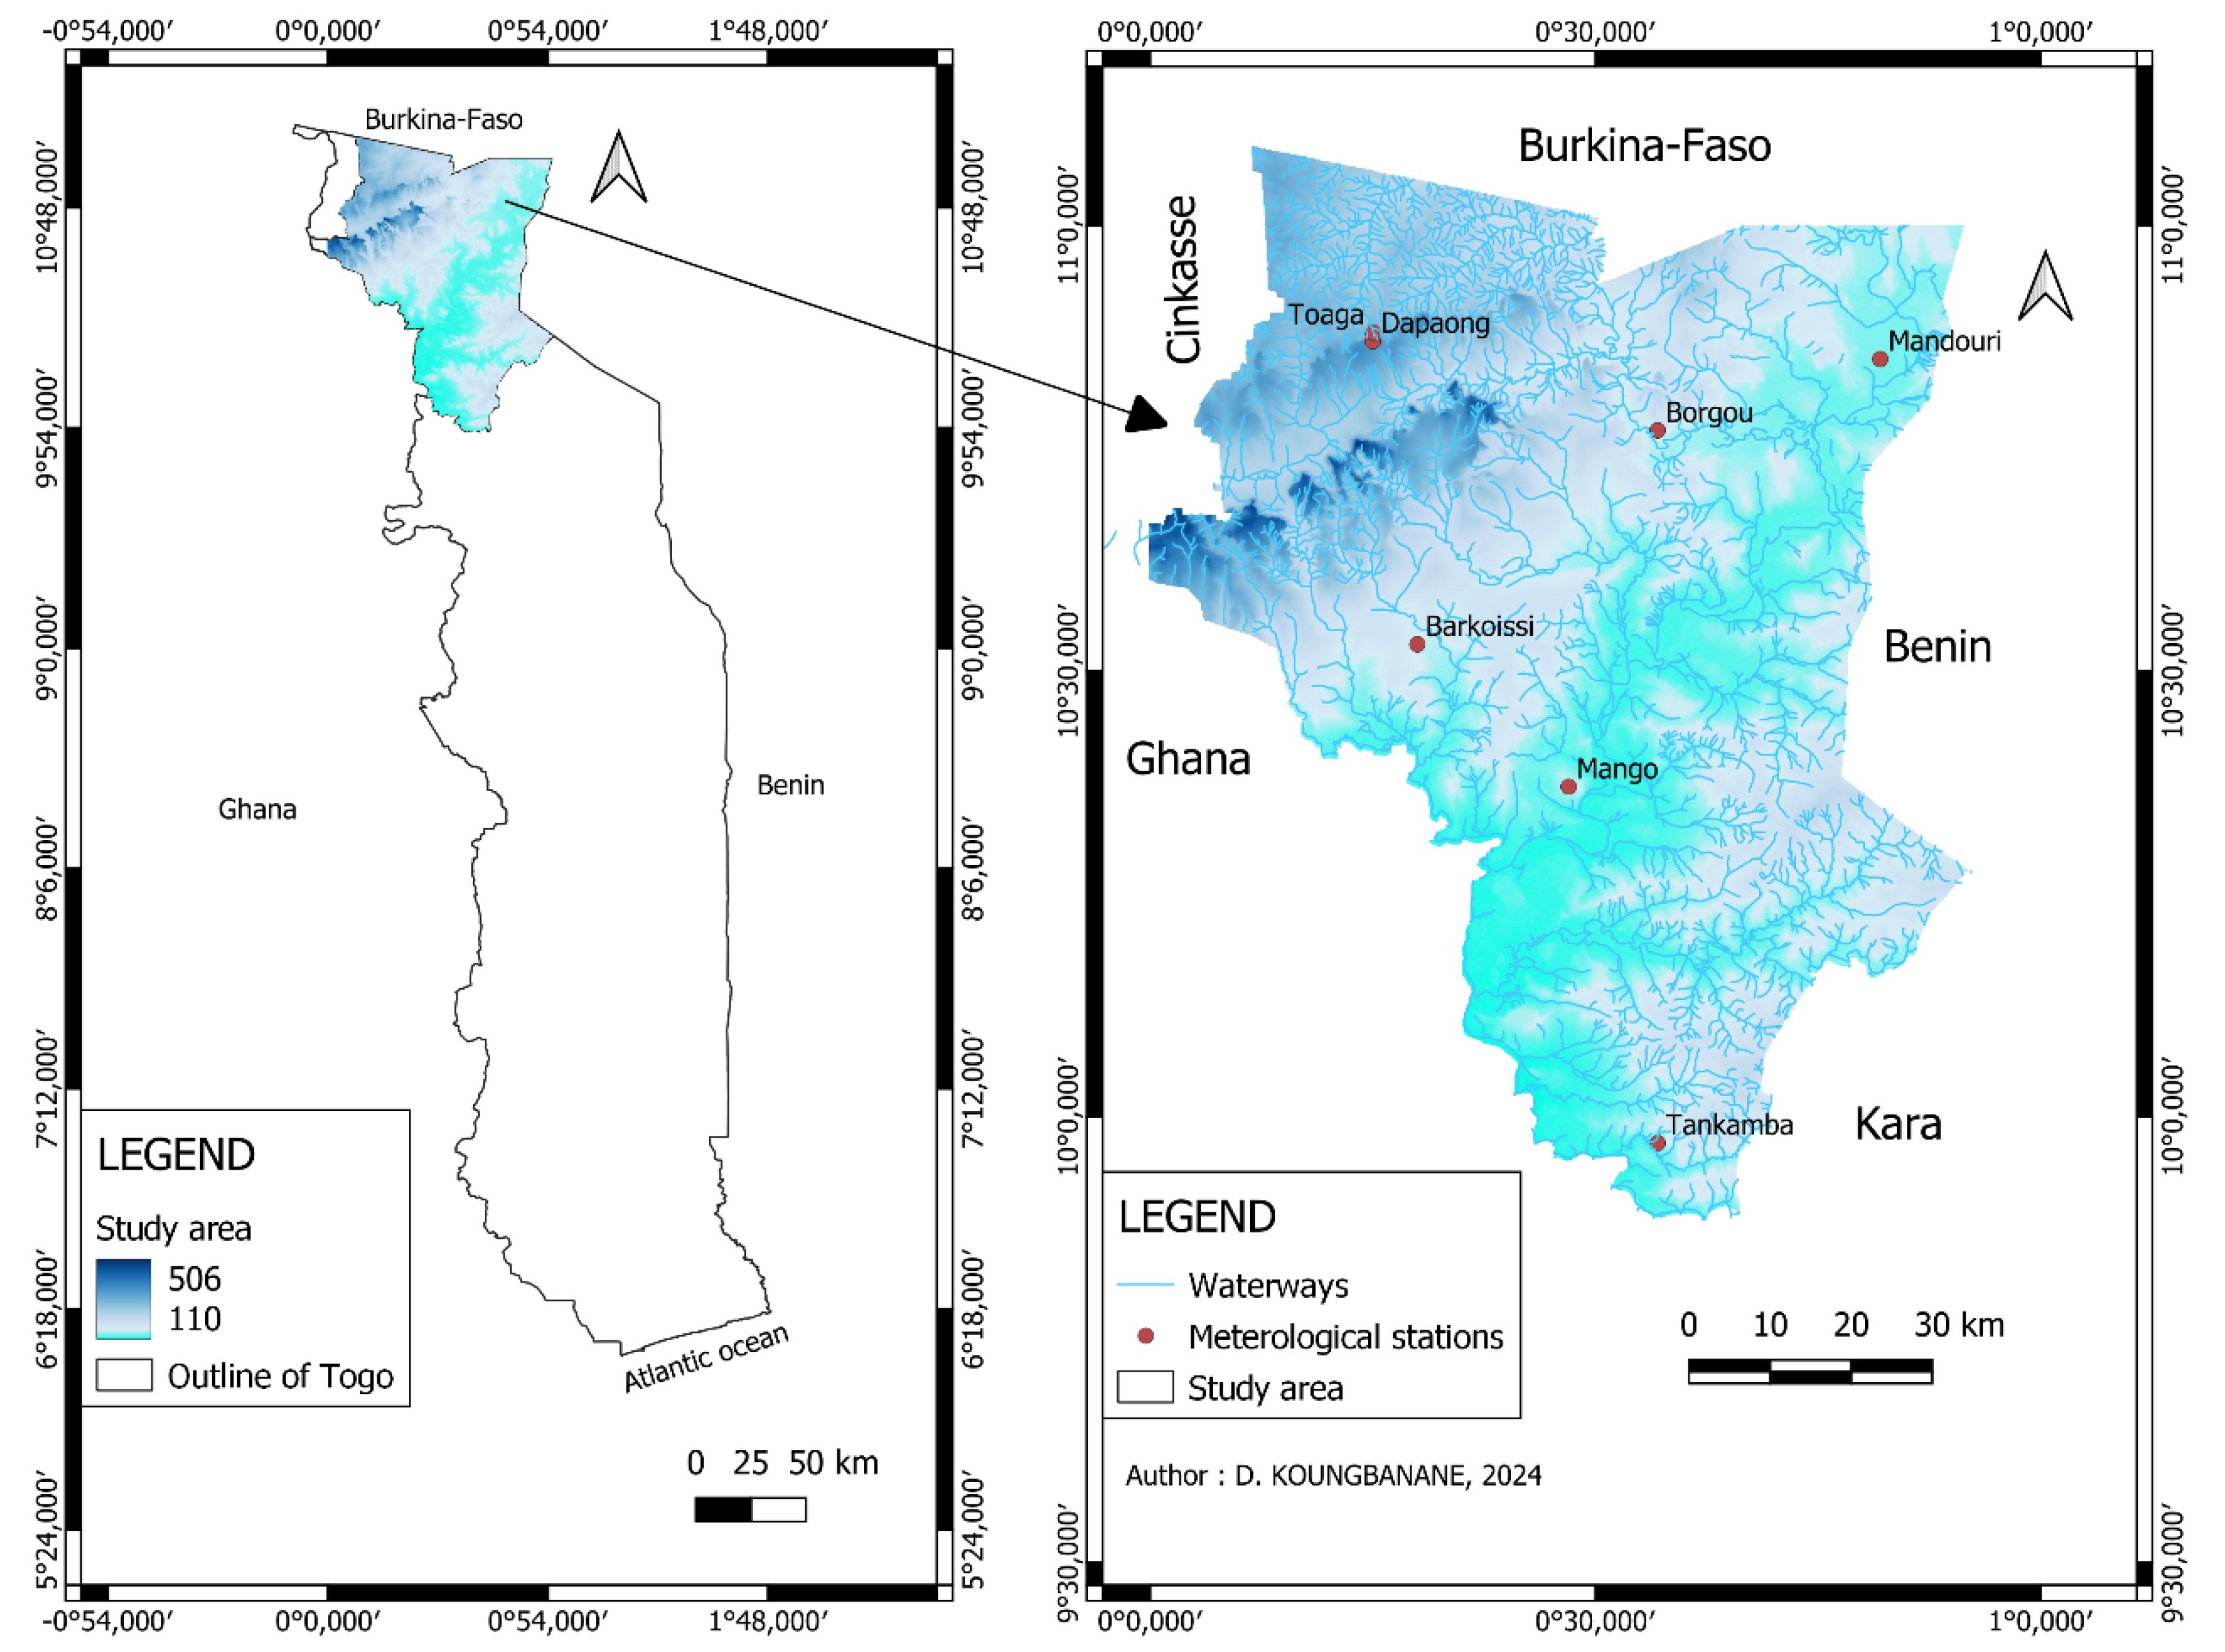
Figure 2.
Interannual variation in maximum daily rainfall from 1961-2022.
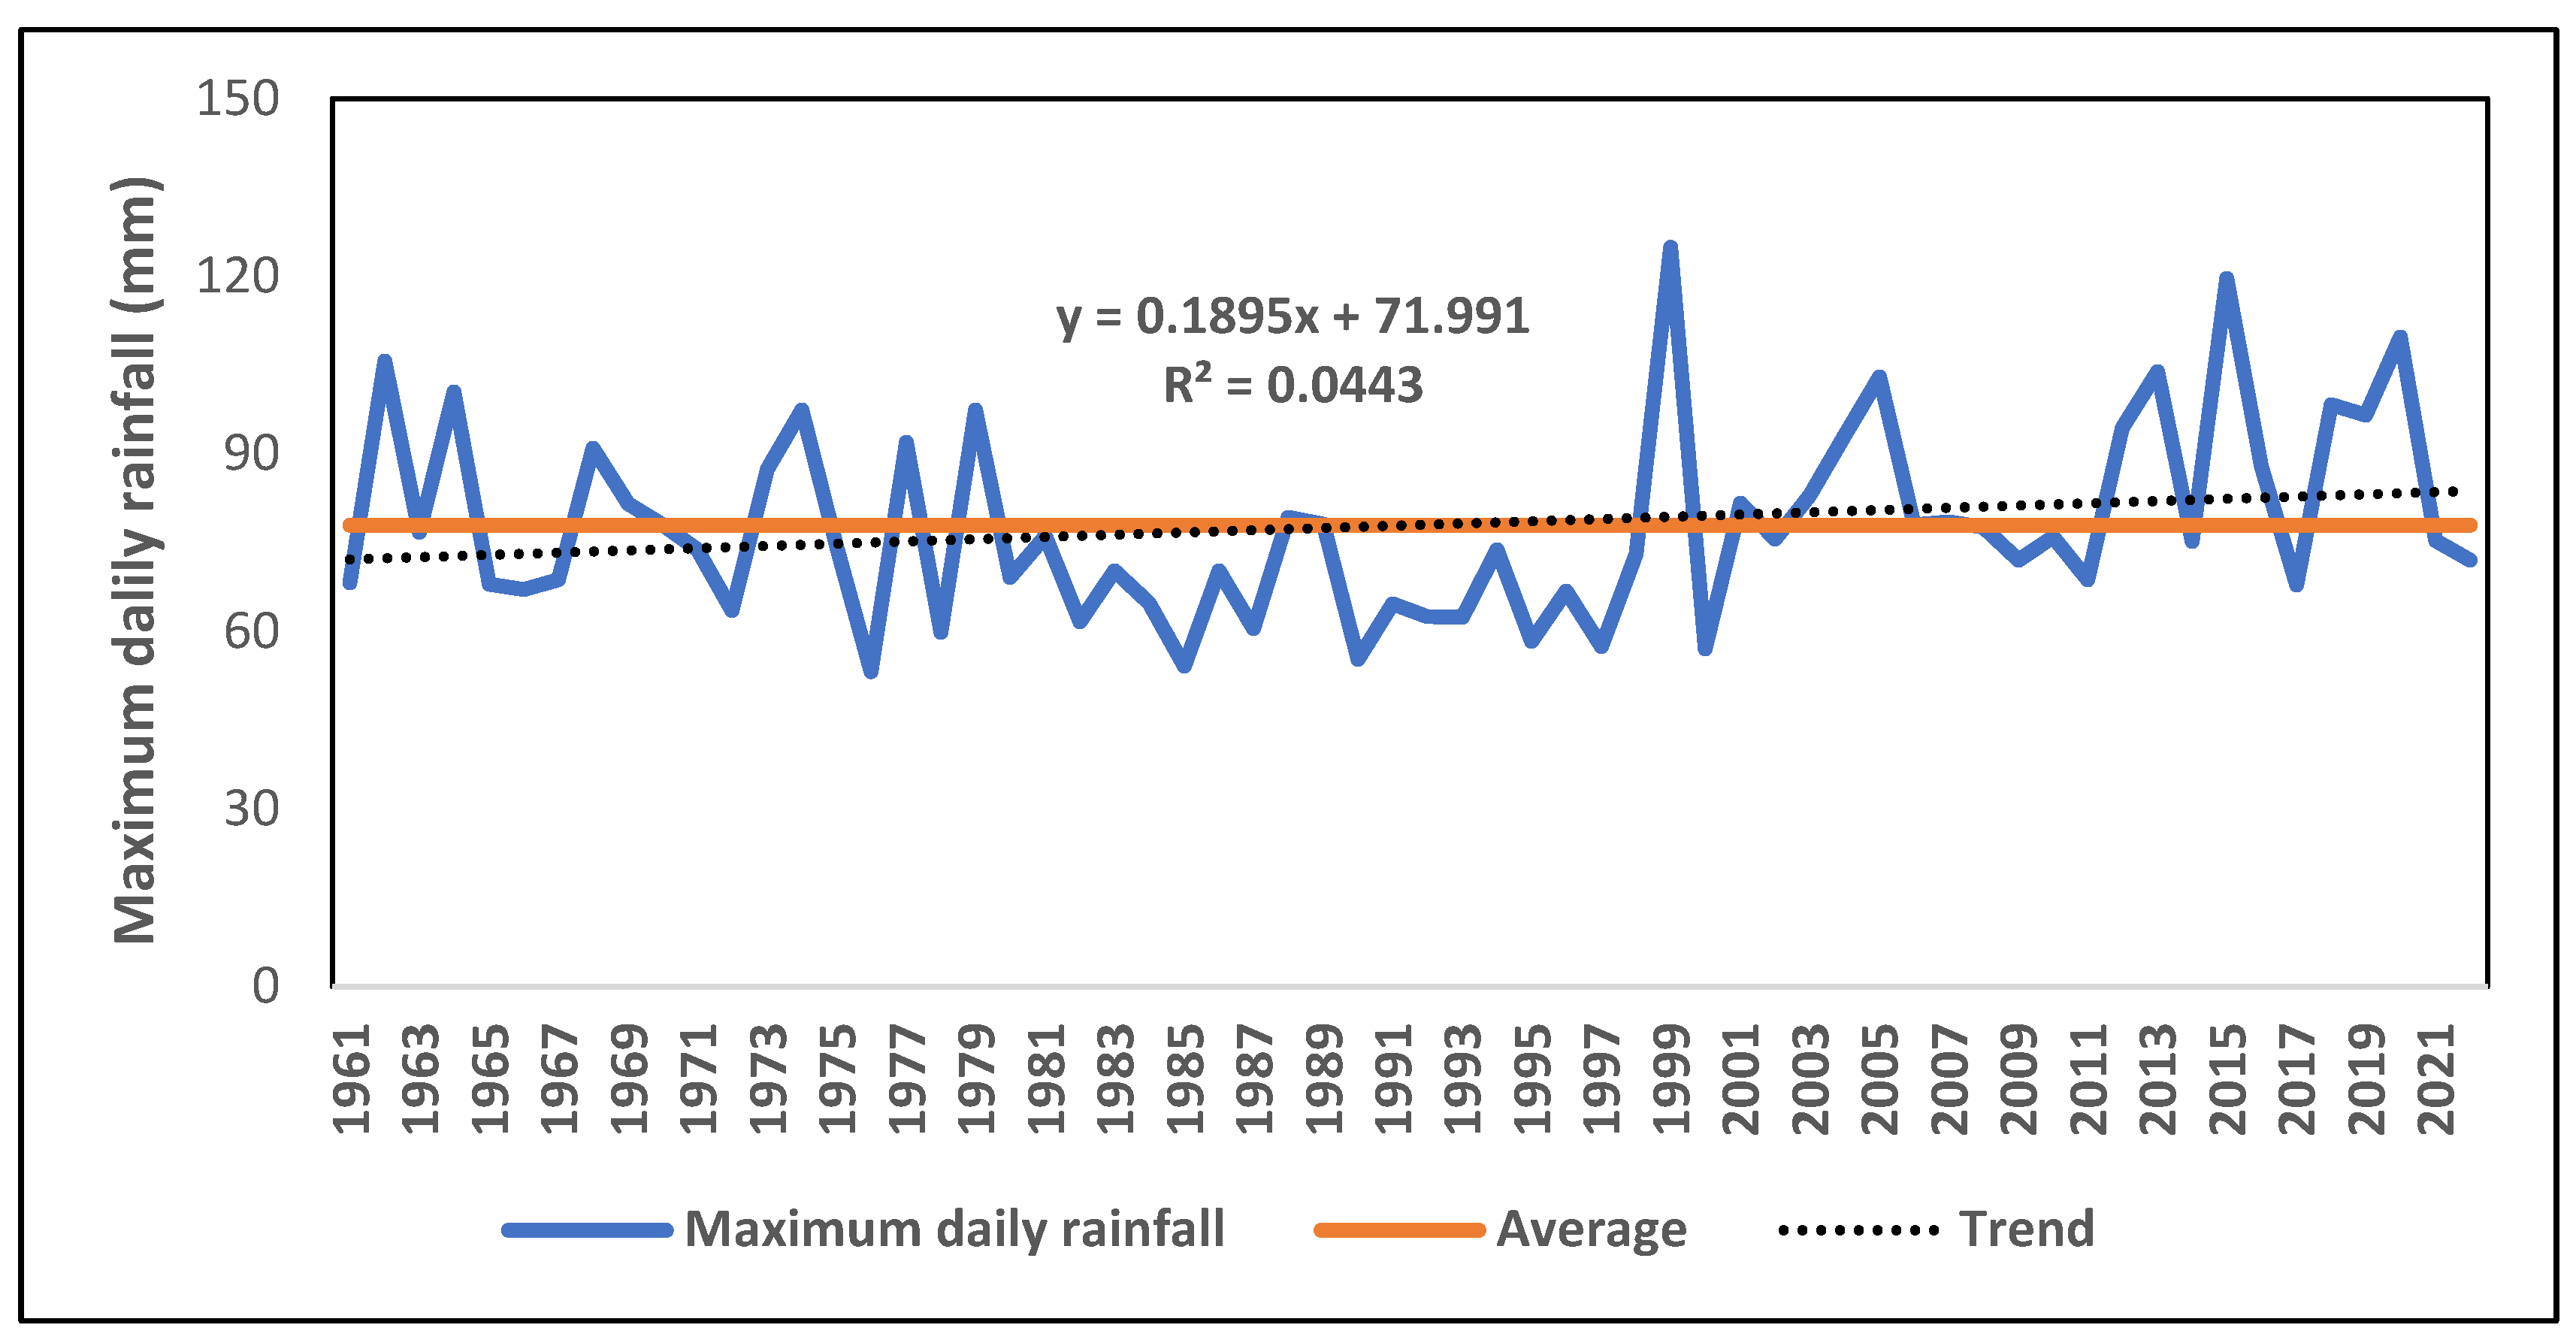
Figure 3.
Interannual trends in observed and simulated rainfall in the Oti watershed in Togo from 1961 to 2005.
Figure 3.
Interannual trends in observed and simulated rainfall in the Oti watershed in Togo from 1961 to 2005.
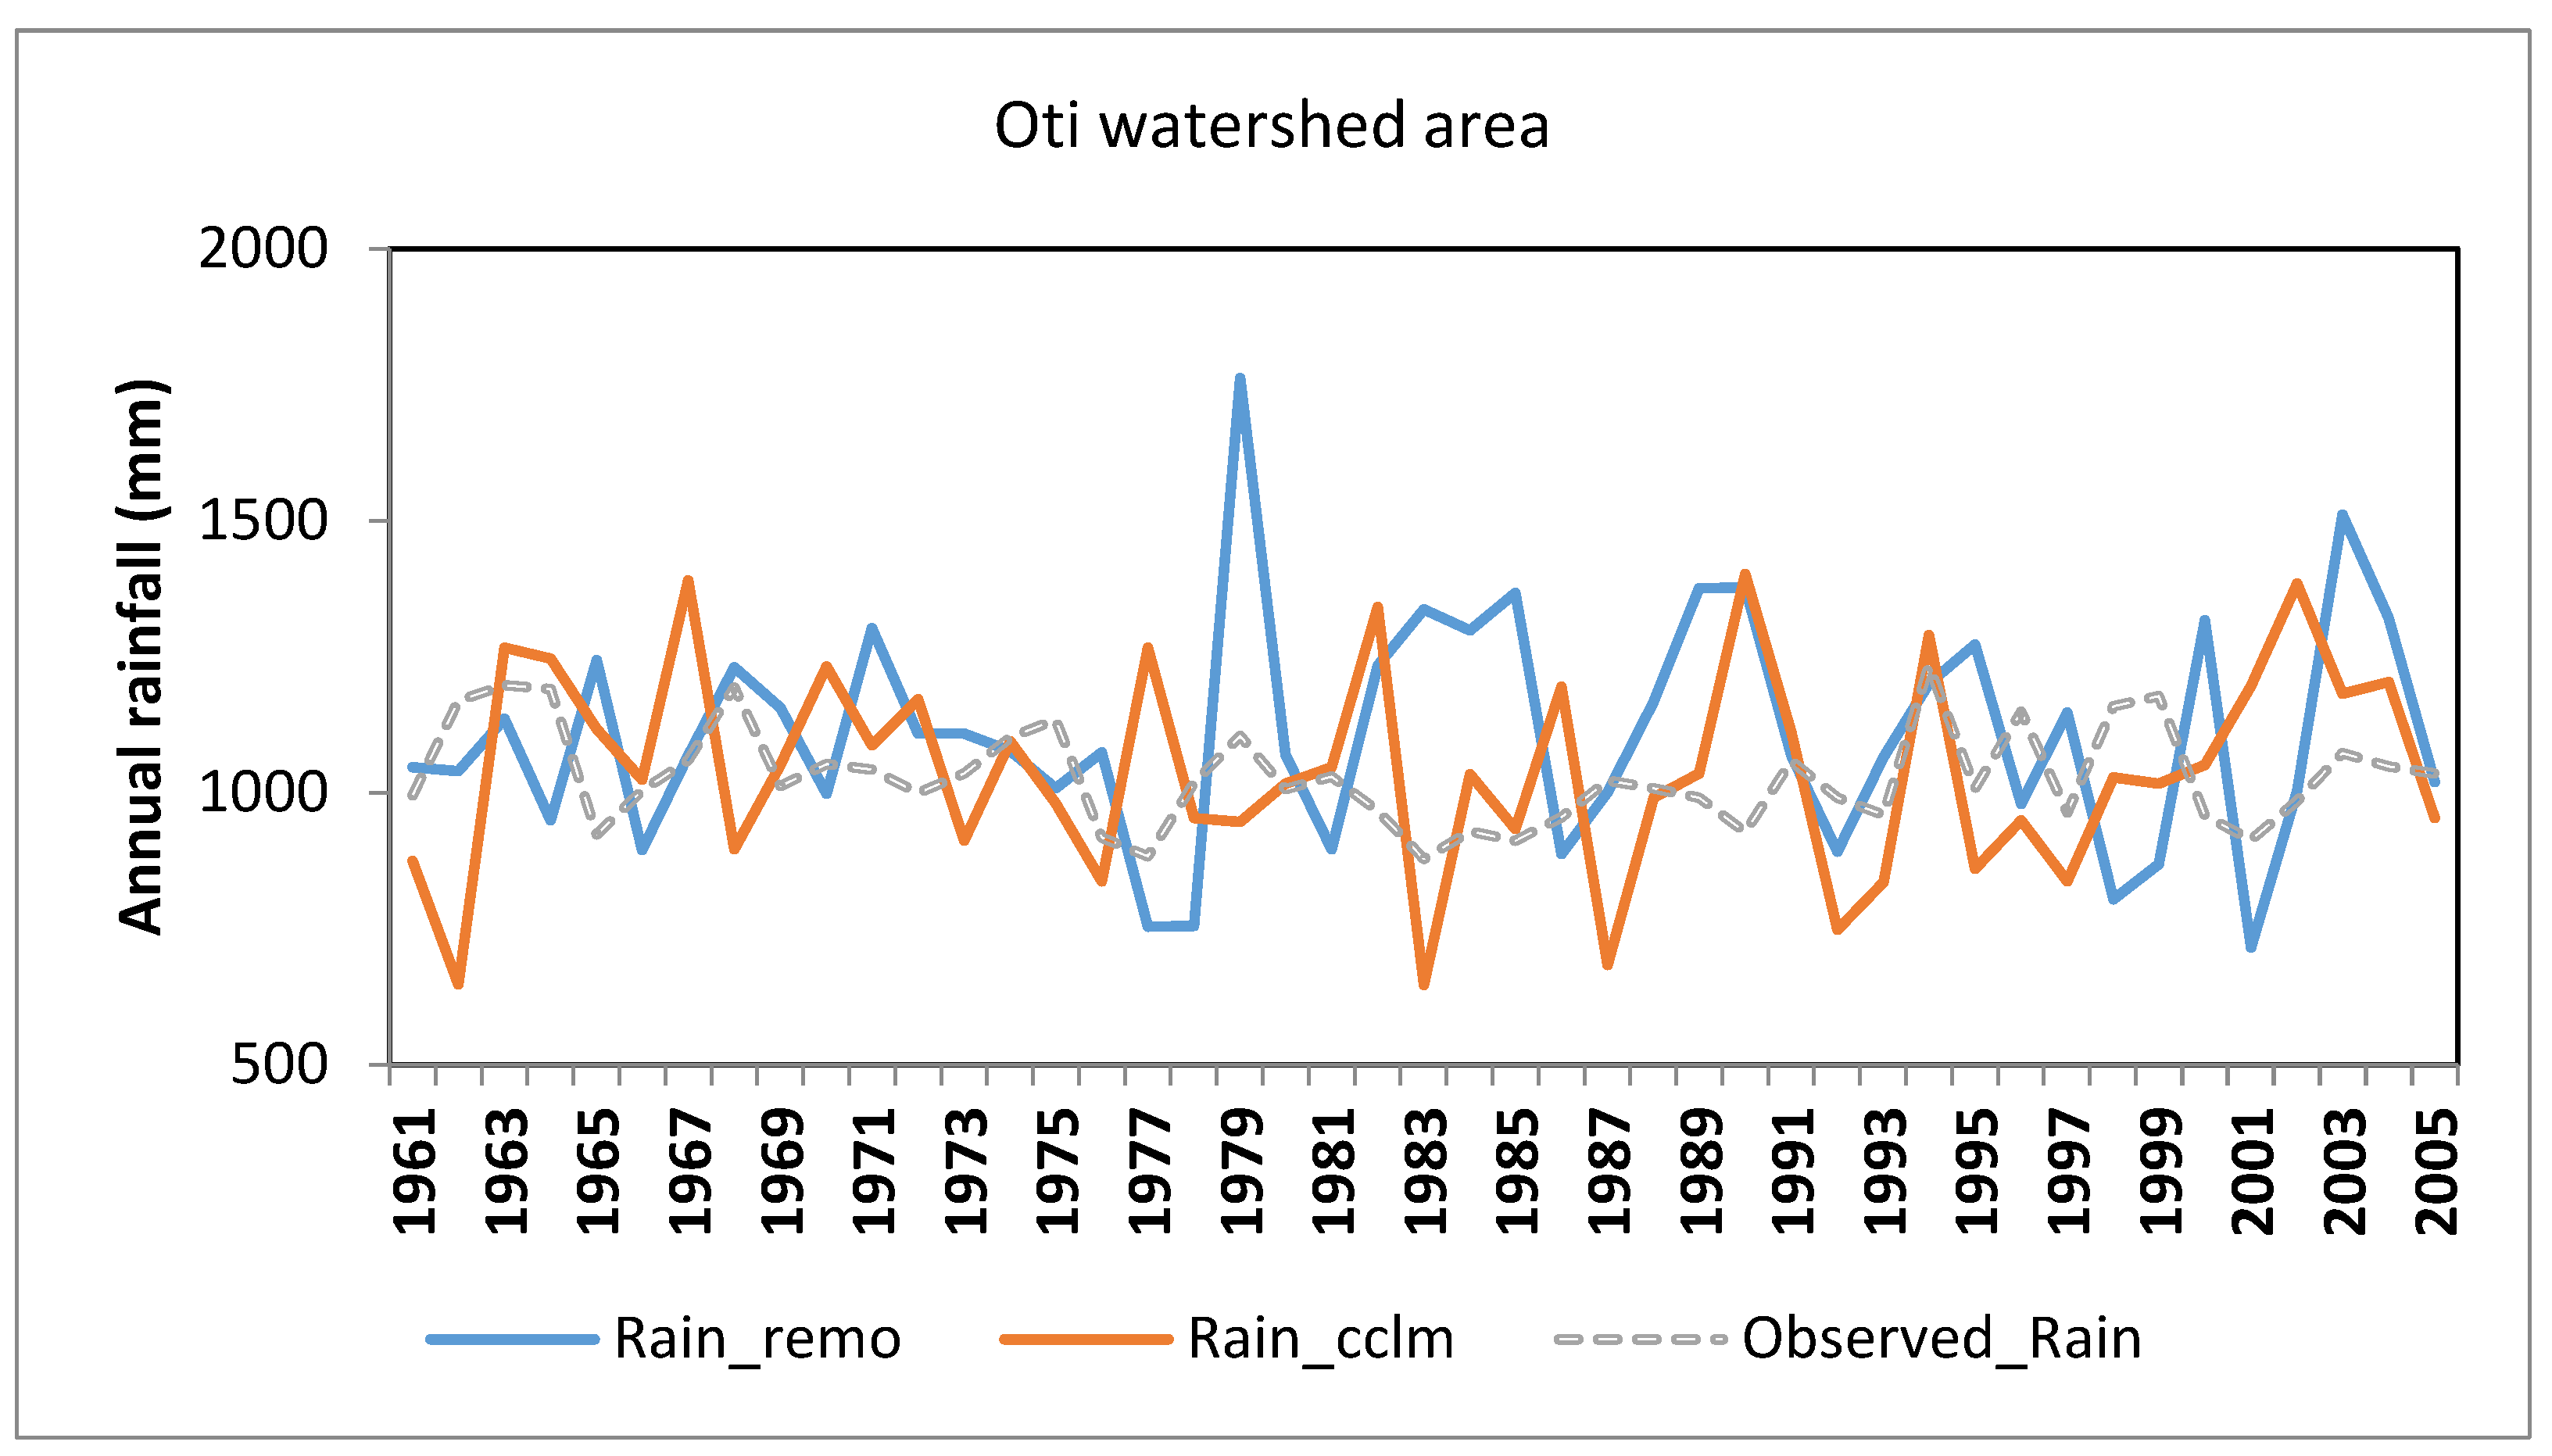
Figure 4.
Schematic diagram of observed and simulated rainfall based on data from the Cordex Africa programme in the Oti watershed in Togo.
Figure 4.
Schematic diagram of observed and simulated rainfall based on data from the Cordex Africa programme in the Oti watershed in Togo.
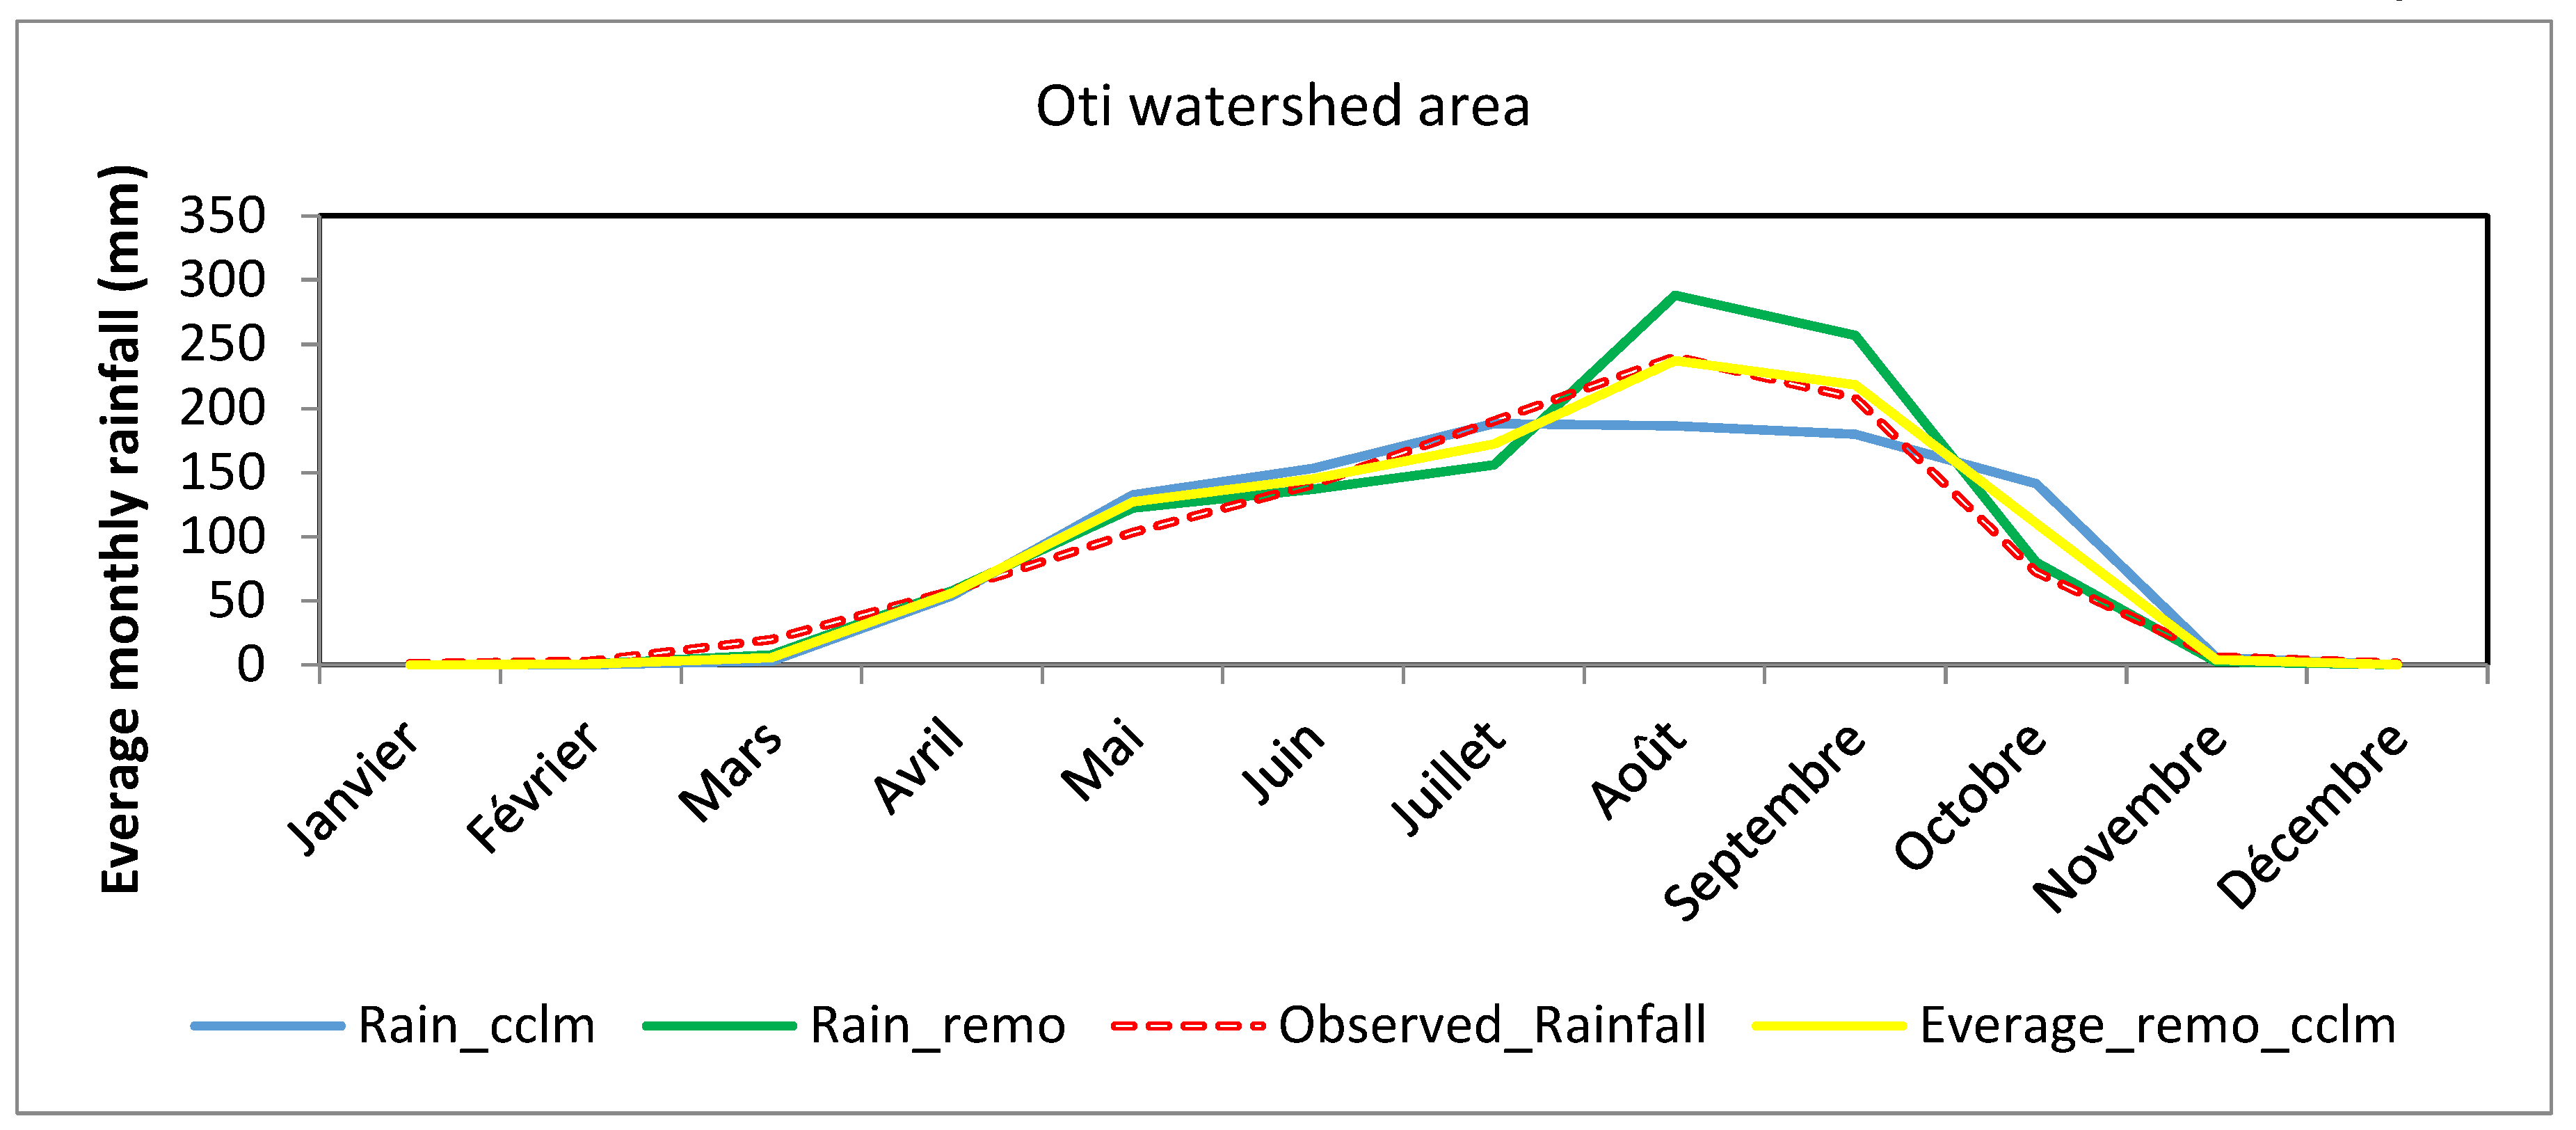
Figure 5.
Observed and simulated rainfall trends.
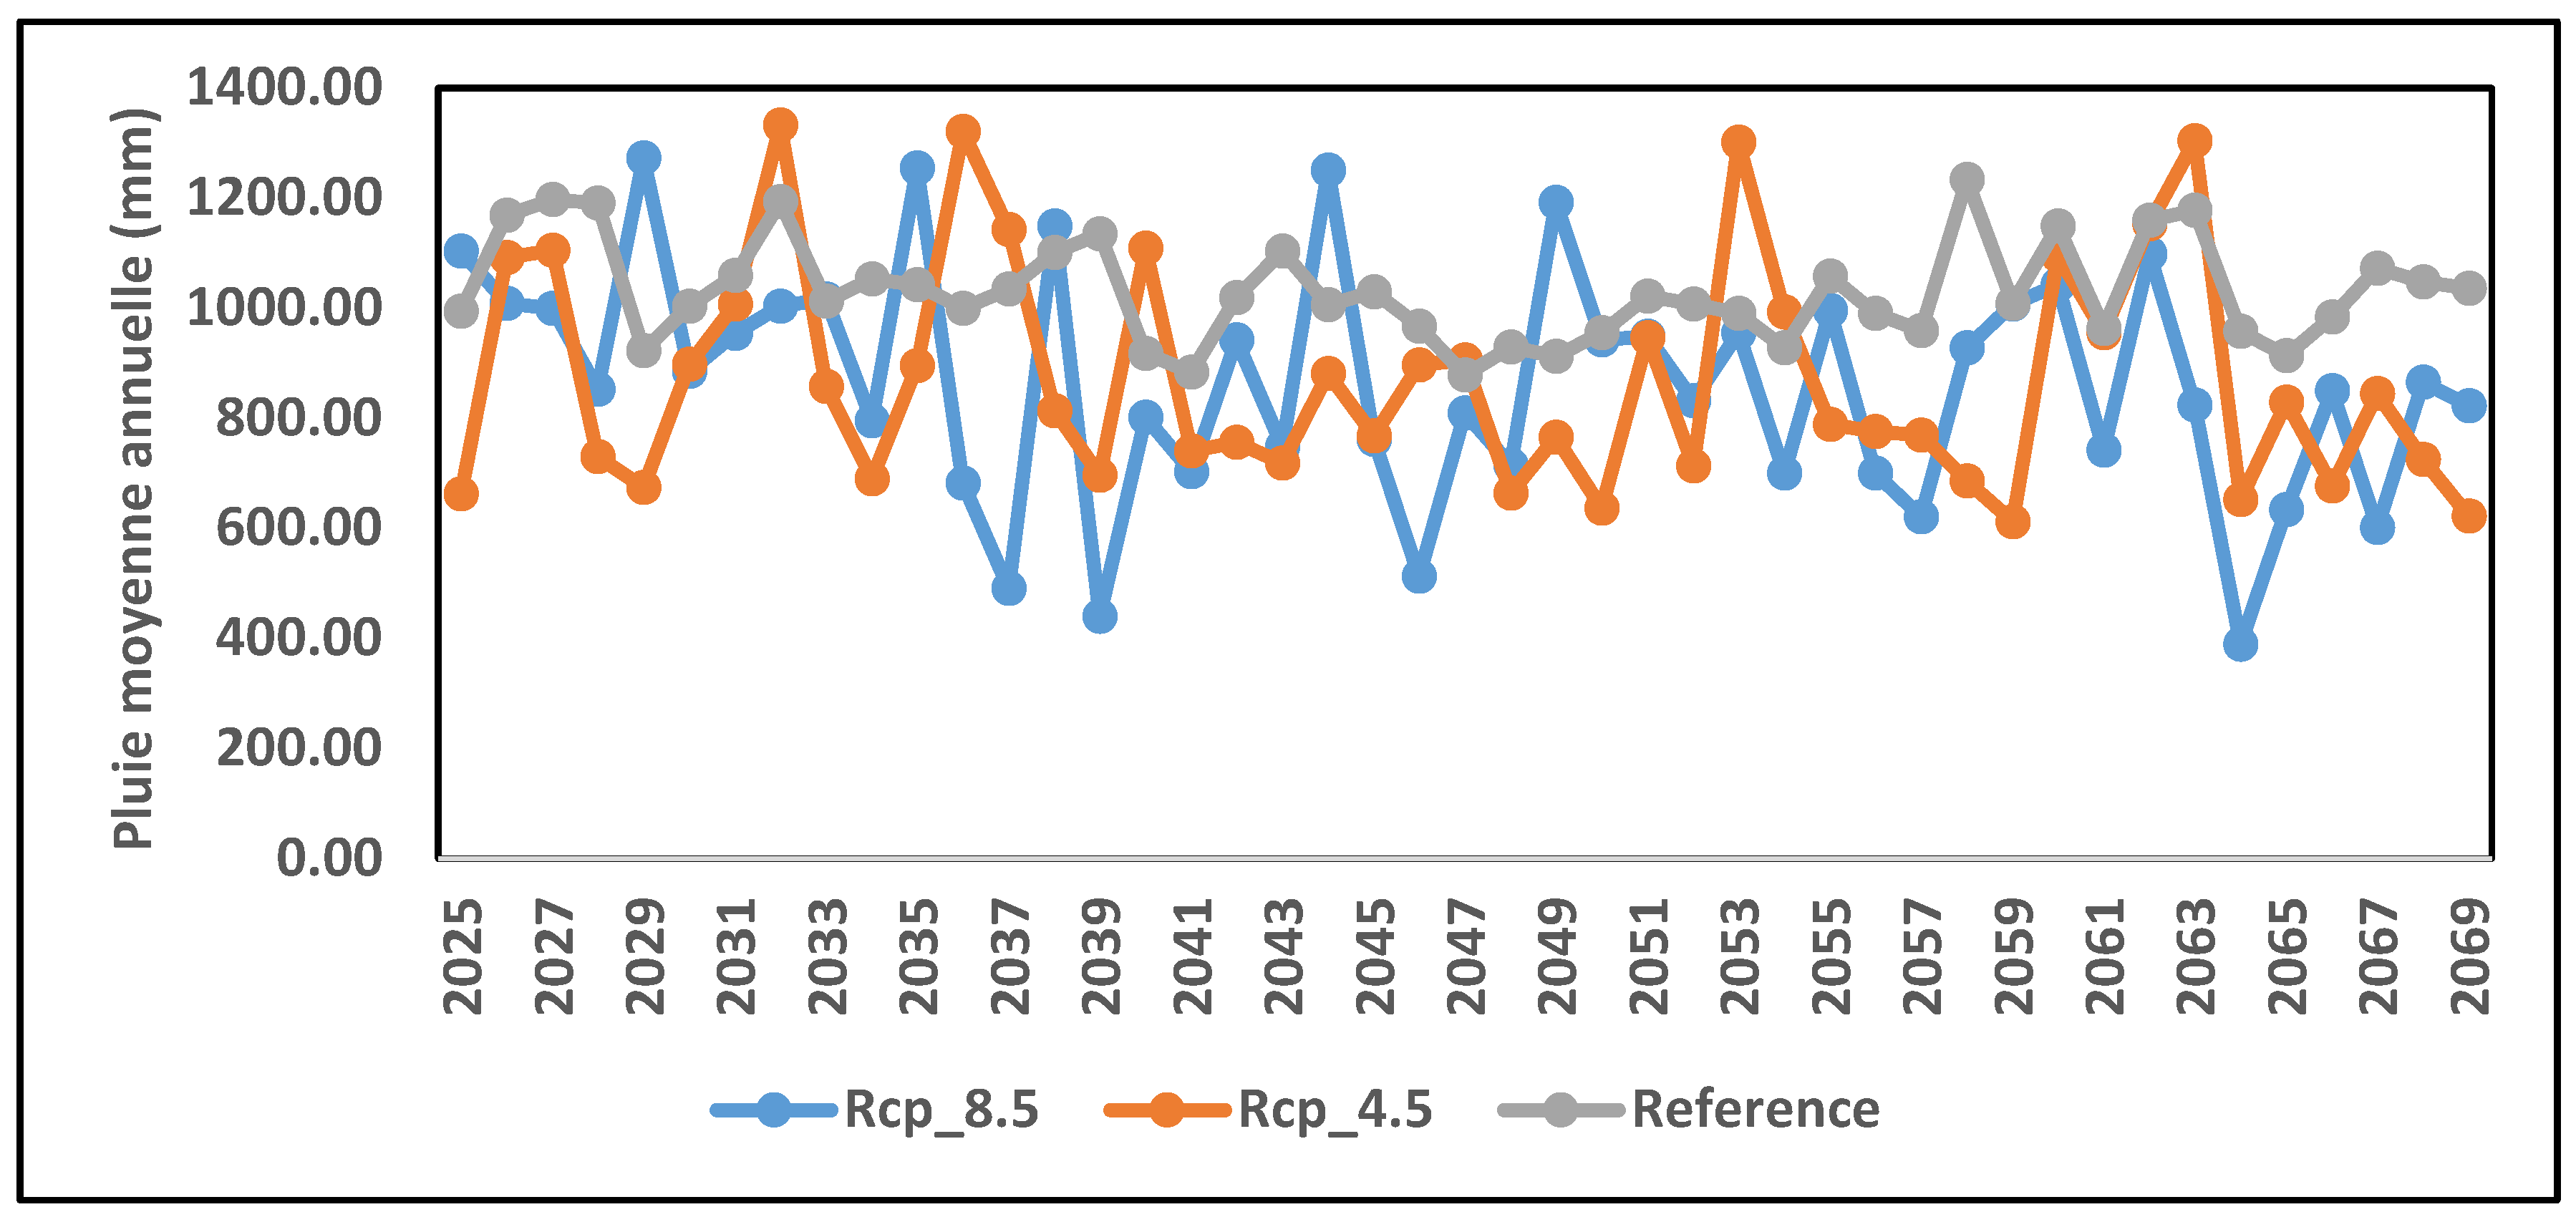
Figure 6.
Interannual variability of extreme daily rainfall.
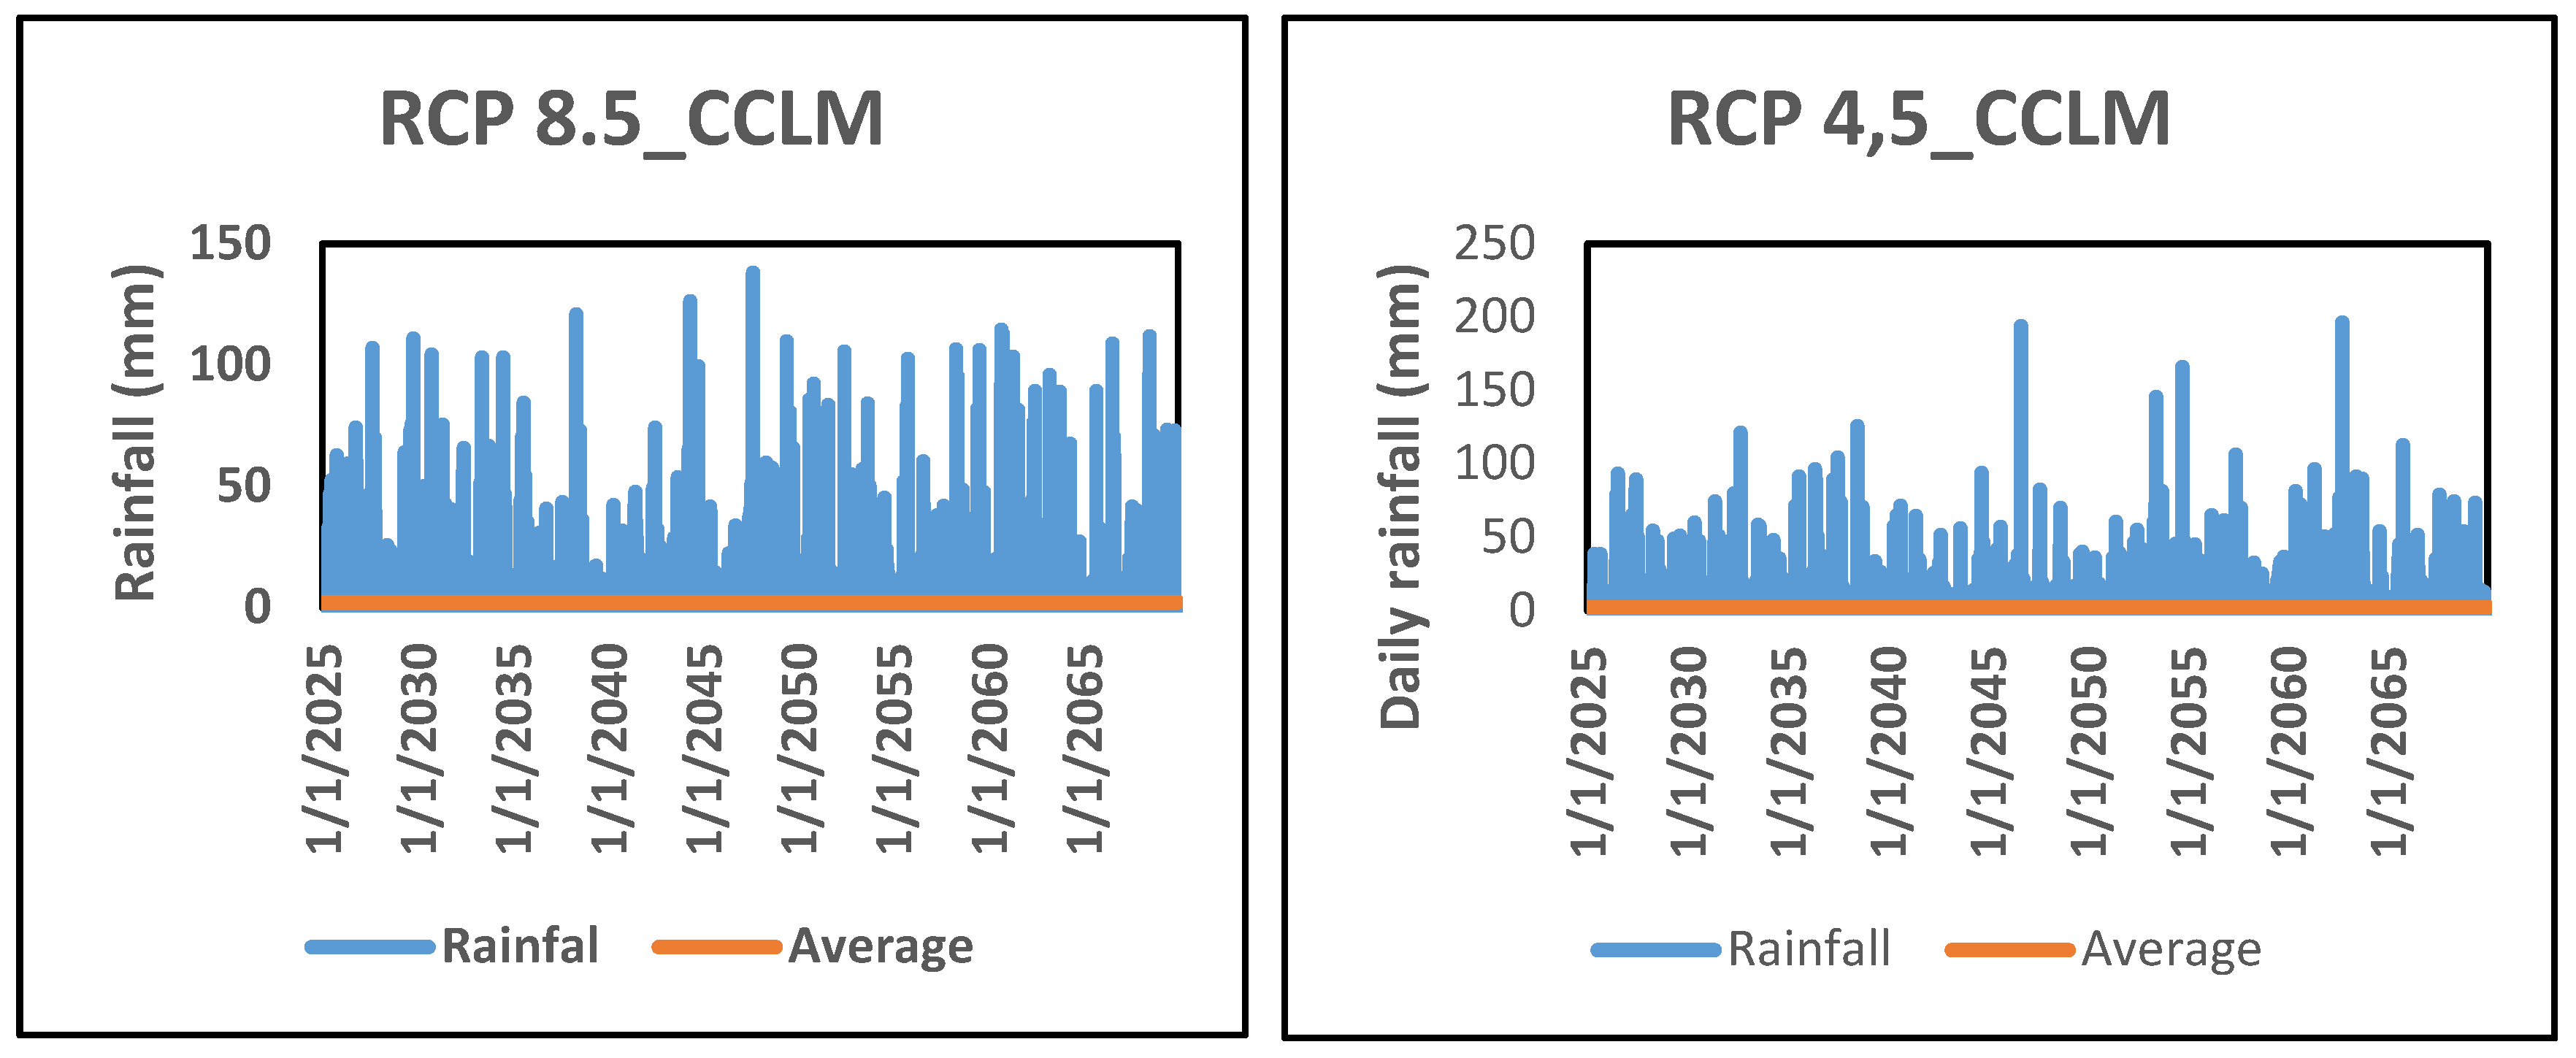
Figure 7.
Average annual rainfall fields observed and simulated by the CCLM model.
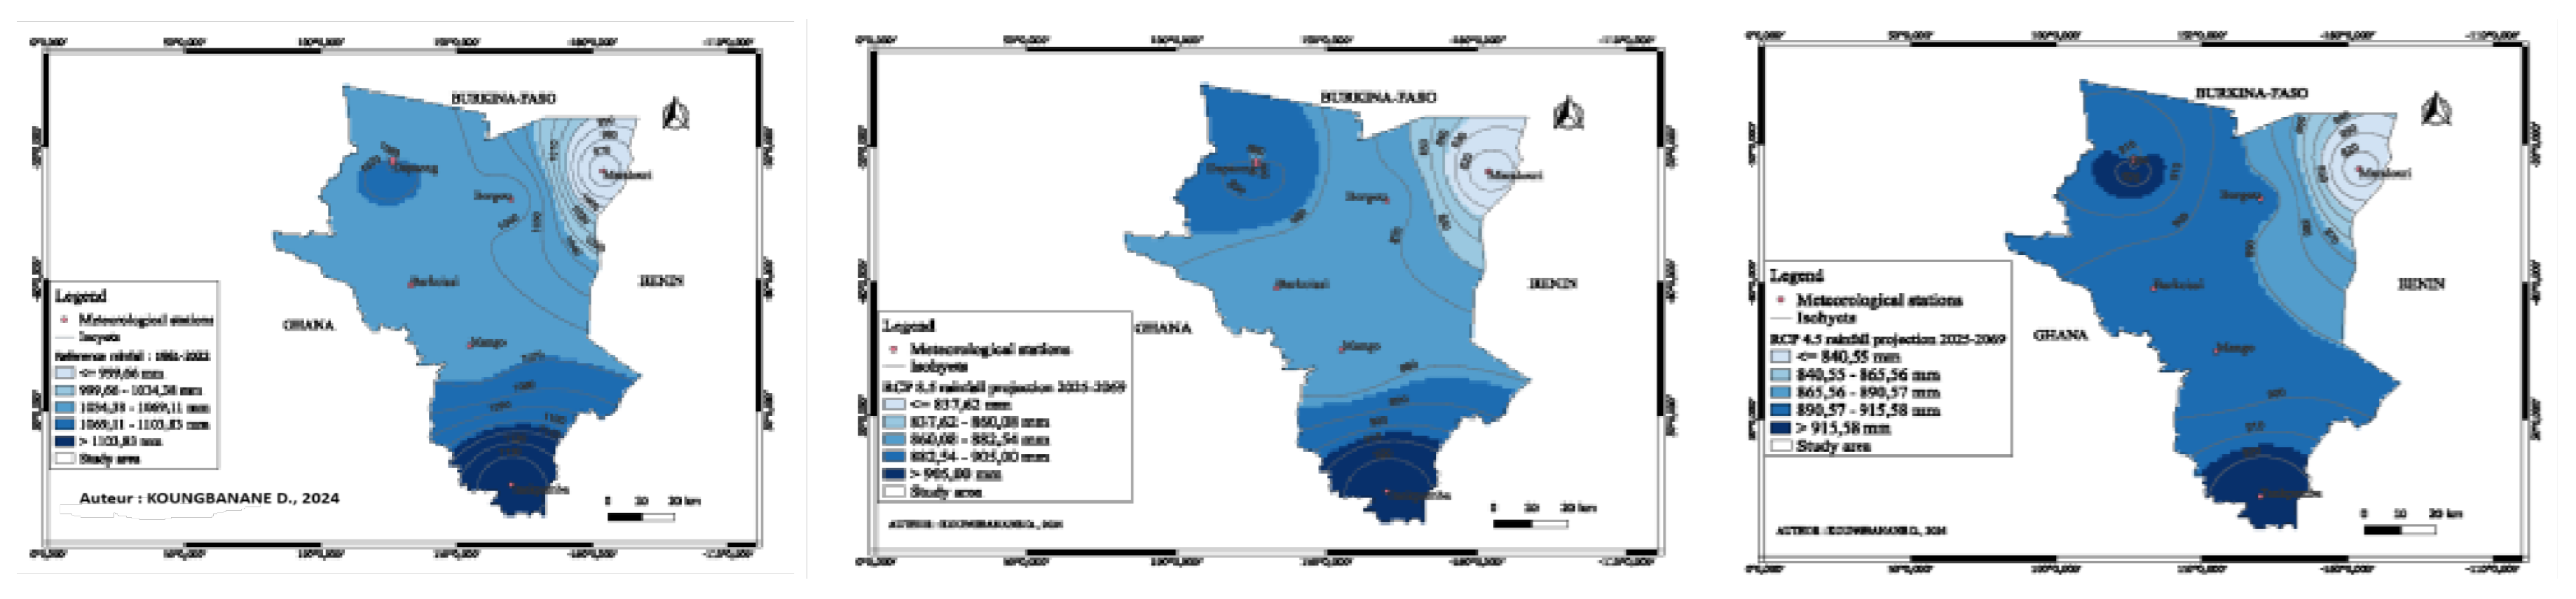

Table 1.
Characteristics of rainfall indices calculated using RclimDex.
| Indices | Indicator name | Definitions | Unit |
|---|---|---|---|
| Rx1day | Max 1-day precipitation amount | Monthly maximum 1-day rainfall | Mm |
| Rx5day | Max 5-day precipitation amount | Monthly maximum consecutive 5-day rainfall | Mm |
| SDII | Simple daily intensity index | Annual total precipitation divided by the number of wet days (defined as PRCP>=1.0mm) in the year | Mm/day |
| Rx10 | Number of days with very heavy precipitation | Annual number of days with PRCP>=20mm | Day |
| Rx20 | Number of days with very heavy precipitation | Annual number of days with PRCP>=20mm | Day |
| CWD | Consecutive wet days | Maximum number of consecutive days with RR>=1mm | Day |
| R95P | Very wet days | Annual total PRCP when RR>95th percentile | Mm |
| R99P | Extremely wet days | Total annual PRCP when RR>99th percentile | Mm |
| PRCPTOT | Annual Total Precipitation in Wet Days | Yearly total PRCP in wet days (RR>=1mm) | Mm |
Table 2.
Characteristics of the 1961-2022 climate index trend.
| Pluies observées | ||
|---|---|---|
| Indices | Slope | P-value |
| PRCPTOT | 0.93 | 0.40 |
| SDII | -0.01 | 0.27 |
| Rx10 mm | -0.04 | 0.37 |
| Rx20 mm | -0.01 | 0.70 |
| R95P | -0.17 | 0.83 |
| R99P | 0.33 | 0.49 |
| Rx1day | 0.16 | 0.20 |
| Rx5day | 0.02 | 0.90 |
| CWD | 0.03 | 0.34 |
Table 3.
Trend characteristics of nine climate indices.
| Simulated rainfall indices | ||||
|---|---|---|---|---|
| RCP 8.5 | RCP4.5 | |||
| Indices | Slope | P-value | Slope | P-value |
| Rx1day | 0.36 | 0.29 | 0.33 | 0.46 |
| Rx5day | -0.001 | 0.99 | 0.59 | 0.34 |
| SDII | 0.002 | 0.91 | -0.004 | 0.79 |
| Rx10 mm | -0.14 | 0.01 | -0.09 | 0.11 |
| Rx20 mm | -0.06 | 0.09 | -0.03 | 0.23 |
| CWD | -0.11 | 0.05 | -0.10 | 0.17 |
| R95P | -1.30 | 0.54 | -0.88 | 0.62 |
| R99P | 1.82 | 0.16 | 0.48 | 0.73 |
| PRCPTOT | -4.77 | 0.05 | -2.59 | 0.28 |
Disclaimer/Publisher’s Note: The statements, opinions and data contained in all publications are solely those of the individual author(s) and contributor(s) and not of MDPI and/or the editor(s). MDPI and/or the editor(s) disclaim responsibility for any injury to people or property resulting from any ideas, methods, instructions or products referred to in the content. |
© 2024 by the authors. Licensee MDPI, Basel, Switzerland. This article is an open access article distributed under the terms and conditions of the Creative Commons Attribution (CC BY) license (http://creativecommons.org/licenses/by/4.0/).
Copyright: This open access article is published under a Creative Commons CC BY 4.0 license, which permit the free download, distribution, and reuse, provided that the author and preprint are cited in any reuse.


