Preprint
Article

Asymmetric Roles of Different Punishments under Centralized Sanctions

This version is not peer-reviewed.

Submitted:

26 October 2024

Posted:

28 October 2024

You are already at the latest version

Abstract
Altruistic punishment has been found to promote cooperation and address social dilemmas in both small and large societies. For many years, peer punishment has been viewed as a decentralized sanction to promote cooperation. Recent studies have found that centralized sanctions and punishments are more effective. In this paper, we incorporate centralized sanctions (third-party sanctions) into the repeating public goods game to investigate how different patterns of third-party punishment impact public cooperation and the organization’s profit, given enough information. Furthermore, the study assesses the influence of various punishments on cooperative behavior and examines the asymmetric roles of punishments in centralized sanctions. As a result: (1) Given enough information, high-intensity and non-random punishment can maintain long-term and high-level cooperation. (2) Punishment successfully deters free riding, regardless of intensity or randomness. (3) Under punishment, people can swiftly establish cooperative social norms to avoid punishment and, eventually, increase profits, regardless of the pattern applied. Therefore, our study sheds light on the heterogeneity of human cooperative behaviors under different centralized sanctions and proves the effectiveness of punishment in promoting human cooperation.
Keywords: 
Subject: 
Social Sciences  -   Behavior Sciences

1. Introduction

In real-world settings, the distinction between cooperation and free riding is a dynamic and complex aspect of social relationships. In many social situations, individuals choose whether to cooperate with others for mutual benefit or to engage in free-riding behavior, taking advantage of the efforts of others without contributing proportionally. The connection between inhibiting free-riding behavior, fostering cooperation, and human reproduction is an interesting perspective within the framework of evolutionary psychology and social evolution [1,2,3,4,5,6,7]. Voluntary cooperative behaviors exist in related and unrelated groups but also among people who interact only once with each other [8,9].
Based on its importance, cooperative behavior has received extensive attention from different disciplines and scientists put forward various theoretical hypotheses and effects, such as kin selection theory [10], reciprocal altruism theory [11], indirect reciprocity theory[12], and cost signal theory [13]. Interestingly, the evolution of human cooperative behavior has been accompanied by free riding, as opposed to cooperative behavior, which benefits from cooperation but does not contribute. To guarantee cooperative behavior, human society produces different types of sanction mechanisms such as decentralized sanction mechanisms and centralized sanction mechanisms. No matter what kind of sanction mechanism people use, peer punishment is one of the most common incentives [14]. Various studies conducted through different approaches and disciplines have produced inconsistent findings regarding the effectiveness of peer punishment in promoting cooperation [15,16,17,18,19].
Several studies on punishment proved that both peer punishment and centralized punishment can effectively inhibit free-riding behavior significantly promote cooperation[8,20,21,22,23,24,25], and even maintain a high level of cooperation at a small cost [1,12,26]. The application of computer simulation technology has shown that punishment promotes cooperation in small and big groups. A study conducted by Boyd et al. [1] used computer simulation technology to analyze the frequency of long-term evolution. The study incorporated factors such as imitation and migration in the pattern to make it more realistic to the real human social evolution process. Scholars found that punishment promotes cooperation in larger settings, and the level of cooperation is directly related to the cost of punishment. Additionally, they observed that compared to fixed punishment, people are more willing to pay variable costs. Moreover, computer simulation modeling was used by other researchers to study peer punishment, pool punishment, and institutional punishment [27,28].
In recent years, researchers have conducted studies using public goods games that offer optional choices, to examine how various forms of punishment affect cooperative behavior. The findings suggest that when second-order punishment is not present, peer punishment is more effective than overall punishment. However, when second-order punishment is present, overall punishment outperforms peer punishment [29]. According to researchers who analyze institutional punishment, institutions tend to use high costs as a way to deter free riders. However, optimal mechanisms would allow institutions to punish free riders at lower costs, thereby achieving the goals of larger-scale stable cooperation and regime consolidation [30].
In light of this, studies have confirmed that the above measures inhibited free riding to some extent and promoted cooperation among groups. While some scientists believe that second-party sanctions are more effective in promoting public cooperation and are more in line with real-world interactions, others argue that third-party sanctions can have a more significant impact on promoting cooperation and maintaining long-term cooperation. It is worth noting that both second-party and third-party sanctions have their advantages and disadvantages, and the effectiveness of each type of sanction may vary depending on the specific context and conditions [15,16,18,31], other studies have suggested that second sanctions are costly, causing a second-order free-rider problem. However, third sanctions may overcome these defects and achieve higher efficiency [20,29].
In comparison to second-party sanctions, third-party sanctions not only have a fundamental role in social structure but also serve as an important model for social stability and governance. Conducting an empirical study on free riding in the laboratory using the behavioral economics paradigm is a good approach from a methodological perspective. This approach simulates the process of social norms generation and explains the mechanism of human cooperation and decision-making to a certain extent [32,33].
Studies have shown that punishment can be used to improve cooperation. However, there is no consensus on the specific roles that punishment plays in this process, and the effects of such measures on cooperative behavior and the underlying mechanisms remain unclear. This is largely because most research has either concentrated on one or the other or has only looked at punishment in the context of a second-party sanction mechanism. There have been very few studies that investigated punishment within the framework of a centralized sanctions mechanism [32,34].
Torsten Decker et al. [35] proposed that different patterns of punishment rules, intensity, peer punishment, and centralized sanctions are all factors that affect the level of cooperation. Enrique Fatas et al. [36] also argued that although random sanction mechanisms cannot eliminate the downward trend of cooperation level, they still raise the level of cooperation behaviors, and Skinner’s [37] reinforcement theory proposed, that if the theory that interval reinforcement can maintain higher response rates and lower regression rates than continuous reinforcement holds, then in centralized sanctions mechanisms, the intensity and randomness are critical factors affecting the effectiveness of punishment.
Based on the above-cited studies, we propose the following hypotheses 1 and 2:
H1. 
In centralized sanctions mechanisms, various patterns of third-party punishment have an unbalanced impact on cooperation levels.
H2. 
People's level of cooperation varies depending on whether they are subjected to high-intensity or low-intensity punishment. Non-random punishment and random punishment have distinct impacts on cooperative behavior levels.
Research by Baldassarria & Grossman [38] finds that third-party punishment not only effectively promotes the improvement of cooperation levels, but also as a centralized sanction mechanism promotes the effectiveness of punishment. Gao et al. [39] conducted a study on punishment in centralized sanctions mechanisms. They found that punishment is more effective in promoting cooperation and can maintain long-term stable cooperation levels. In addition, subjects’ reactions to punishment also vary. Therefore, we put forward the hypothesis 3:
H3. 
Third-party punishments can successfully reduce free-riding behavior, with an asymmetrical effect across different patterns.
This paper aims to look into broad patterns of human behavior using punishment mechanisms in centralized sanctions. Investigating the impact of punishment on free riding through an ecological perspective, we believe that various factors, such as the frequency, intensity, and randomness of punishments, as well as psychological factors, may influence behavior. In real life, punishments are not always foreseeable and can occur at random [36]. Consequently, we intend to investigate the relationship between randomness and punishment intensity, as well as examine techniques for reducing free riders and promoting cooperation.

2. Research Framework

The research aimed to study the effects of punishment within the framework of centralized sanctions. Based on previous literature and simulations of real-life scenarios, we conducted a study to examine the effects of different structures of third-party punishment on cooperation and profit levels, as well as people's behavior configurations. To do so, we classified punishment into four distinct patterns and examined two factors: intensity and randomness.
This study fills a theoretical gap in previous research by conducting an in-depth study on how punishment works in the centralized sanctions mechanism. It also makes theoretical contributions to what function this mechanism has at the micro-individual level and how much it influences public cooperation.

2.1. Method

The study utilizes a repeated public goods game as a fundamental experimental framework. The study examines the impact of third-party punishment on public cooperation. Specifically, we investigate five different treatment groups, which include the control group, low punishment group, high punishment group, low random punishment group, and high random punishment group. We aim to investigate and compare the levels of cooperation, profit, and cooperative behavior across the different groups. Additionally, we establish a multiple linear regression model to analyze the mechanism behind cooperative behavior.

2.2. Subjects and Treatment Groups

Our behavioral experiment was conducted at the Zhejiang Sci-Tech University between October 2022 and May 2023. A total of 160 undergraduate and graduate students (consisting of 83 males and 77 females) from the university, aged between 17 to 26, took part in the experiment. None of the participants had taken part in a public goods experiment before. The subjects were randomly assigned to different treatment groups, and each subject took part in only one experimental treatment.
There are 5 treatment groups in the experiment. These groups include the control group (G), low-intensity punishment group (r1p), high-intensity punishment group (r3p), low random punishment group (r1rp), and high random punishment group (r3rp). Each treatment group consists of 8 groups and each group has 4 subjects, making the total number of subjects 32.

2.3. Experimental Design

This experiment was conducted in the psychology laboratory of the university, using the z-Tree platform to edit and run the experimental program [40]. The software package was developed by the Department of Economics at the University of Zurich in Switzerland, and this experiment has been authorized by the other party. The authorization letter can be found in Appendix A.
The experiment consists of 5 computers placed in 5 separate rooms, with 1 being the main operating host (experimenter) and the remaining 4 being the terminals used by the subjects. Both the G group and the experimental groups took part in 30 series of the experiment. In the G group, each participant was given 20 initial tokens at the beginning of each sequence. They were then given the option to invest their tokens in the public account( g i ). The investment amount could be any integer between 0 and 20. After each subject made their investment decision, the number of tokens in the public account was multiplied by 1.6 times. The tokens were then divided equally among all the subjects, while the remaining ones (tokens) belonged to the individual subjects. The profits of each subject in each round ( π i 1 )were the tokens left after they invested in the public account and the public advantages or benefits generated by the public account. At the end of the initial level, every individual's temporary profit is equivalent to
π i 1 = ( 20 g i ) + 0.4 j = 1 4 g j
Where g j is the contribution of the player i , g j is the contribution of the player j .
Before starting the next round (phase two), participants will be given feedback on the following information: (a) the number of tokens contributed by the subjects in the previous round. (b) the total number of tokens invested by the group in the previous round. (c) the profit earned (payoff) by the subjects in that stage. In the first stage, after the subjects had inserted their tokens, each of them received a payoff as per (1). They then proceeded to the second stage, the punishment stage. In the r1p and r3r groups, the punishment was given at every stage, while in the r1rp and the r3rp groups, the punishment occurred randomly.
For this experiment, third-party punishments were automatically generated by a program using pre-written algorithms, without any involvement of human factors. The program designed by z-Tree first selected the subjects whose contribution ( C ) was less than the average contribution ( C ¯ ) of their group in a given stage, then the program punished subjects who met the condition: C ¯ C > 0 . The punishment will be calculated as the difference between the average contribution of the group ( C ¯ ) and the contribution of the subjects in that stage ( C ) multiplied by a coefficient ( r ). The final payoff of the subject was determined by subtracting the punishment from the first stage's payoff.
π i = π i 1 C ¯ C r r = 1 r = 3
Where π i is the payoff in each phase or period.
The subject either received no punishment (0) or was punished (1). The punishment treatment groups were divided into low-punishment and high-punishment groups based on the coefficient (r) equal to 1 or 3. Additionally, the punishment treatment groups were categorized into punishment groups and random punishment groups based on whether the punishment appeared randomly or not. Appendix B, Appendix C and Appendix D contains extensive experimental procedures and instructions.

2.4. Procedure

Upon arrival at the laboratory, the primary experimenter will inform the participants that the experiment will not have any physiological or psychological impact. They will also answer any questions that the subjects may have. Once the participants' issues are addressed, they will be asked to sign the "Subject Informed Consent Form," confirming their agreement to participate.
The participants of the experiment will be assigned to separate and isolated rooms where they will remain anonymous and won't be able to communicate with or see each other. The experiment will be conducted entirely on a computer program, including the instructions section and the formal experiment. The participants were instructed to use the computer to complete two calculation questions that were related to the experiment. If the participants have any problems during this period, they can ask the experimenter. The experimenter answered the questions or problems and ensured that each participant fully understood the experimental rules before proceeding to the formal experimental stage.
In this experiment, each participant is assigned to only one treatment group, and the design is participant-to-participant. The experiment lasts for approximately 30 minutes, after which the subjects will complete a questionnaire on the computer. The questionnaire will include questions about basic information, reasons behind their decision-making, and their thoughts on the experiment. Upon completion of the experiment, the experimenter will distribute fees to the subjects following the experimental outcomes. The G group participants earned an average of RMB 25.07, while those in the 4 punishment treatment groups earned an average of RMB 24.53.

4. Statistical Analysis

The data obtained from the experiment was analyzed using Statistical Packages for Social Sciences (SPSS) 25.0. To ensure accuracy and relevance, a combination of relevant research in the same field both domestically and internationally was considered, along with the characteristics of the experimental data. Non-parametric tests, including the Kruskal Wallis test, Mann-Whitney rank sum test, and OLS regression were primarily used for statistical analysis. A p-value less than 0.05 was considered as the statistical significance criterion.

4.1. The Impact of Third-Party Punishment on the Level of Cooperation in Different Patterns

4.1.1. The Overall Level of Cooperation Comparison

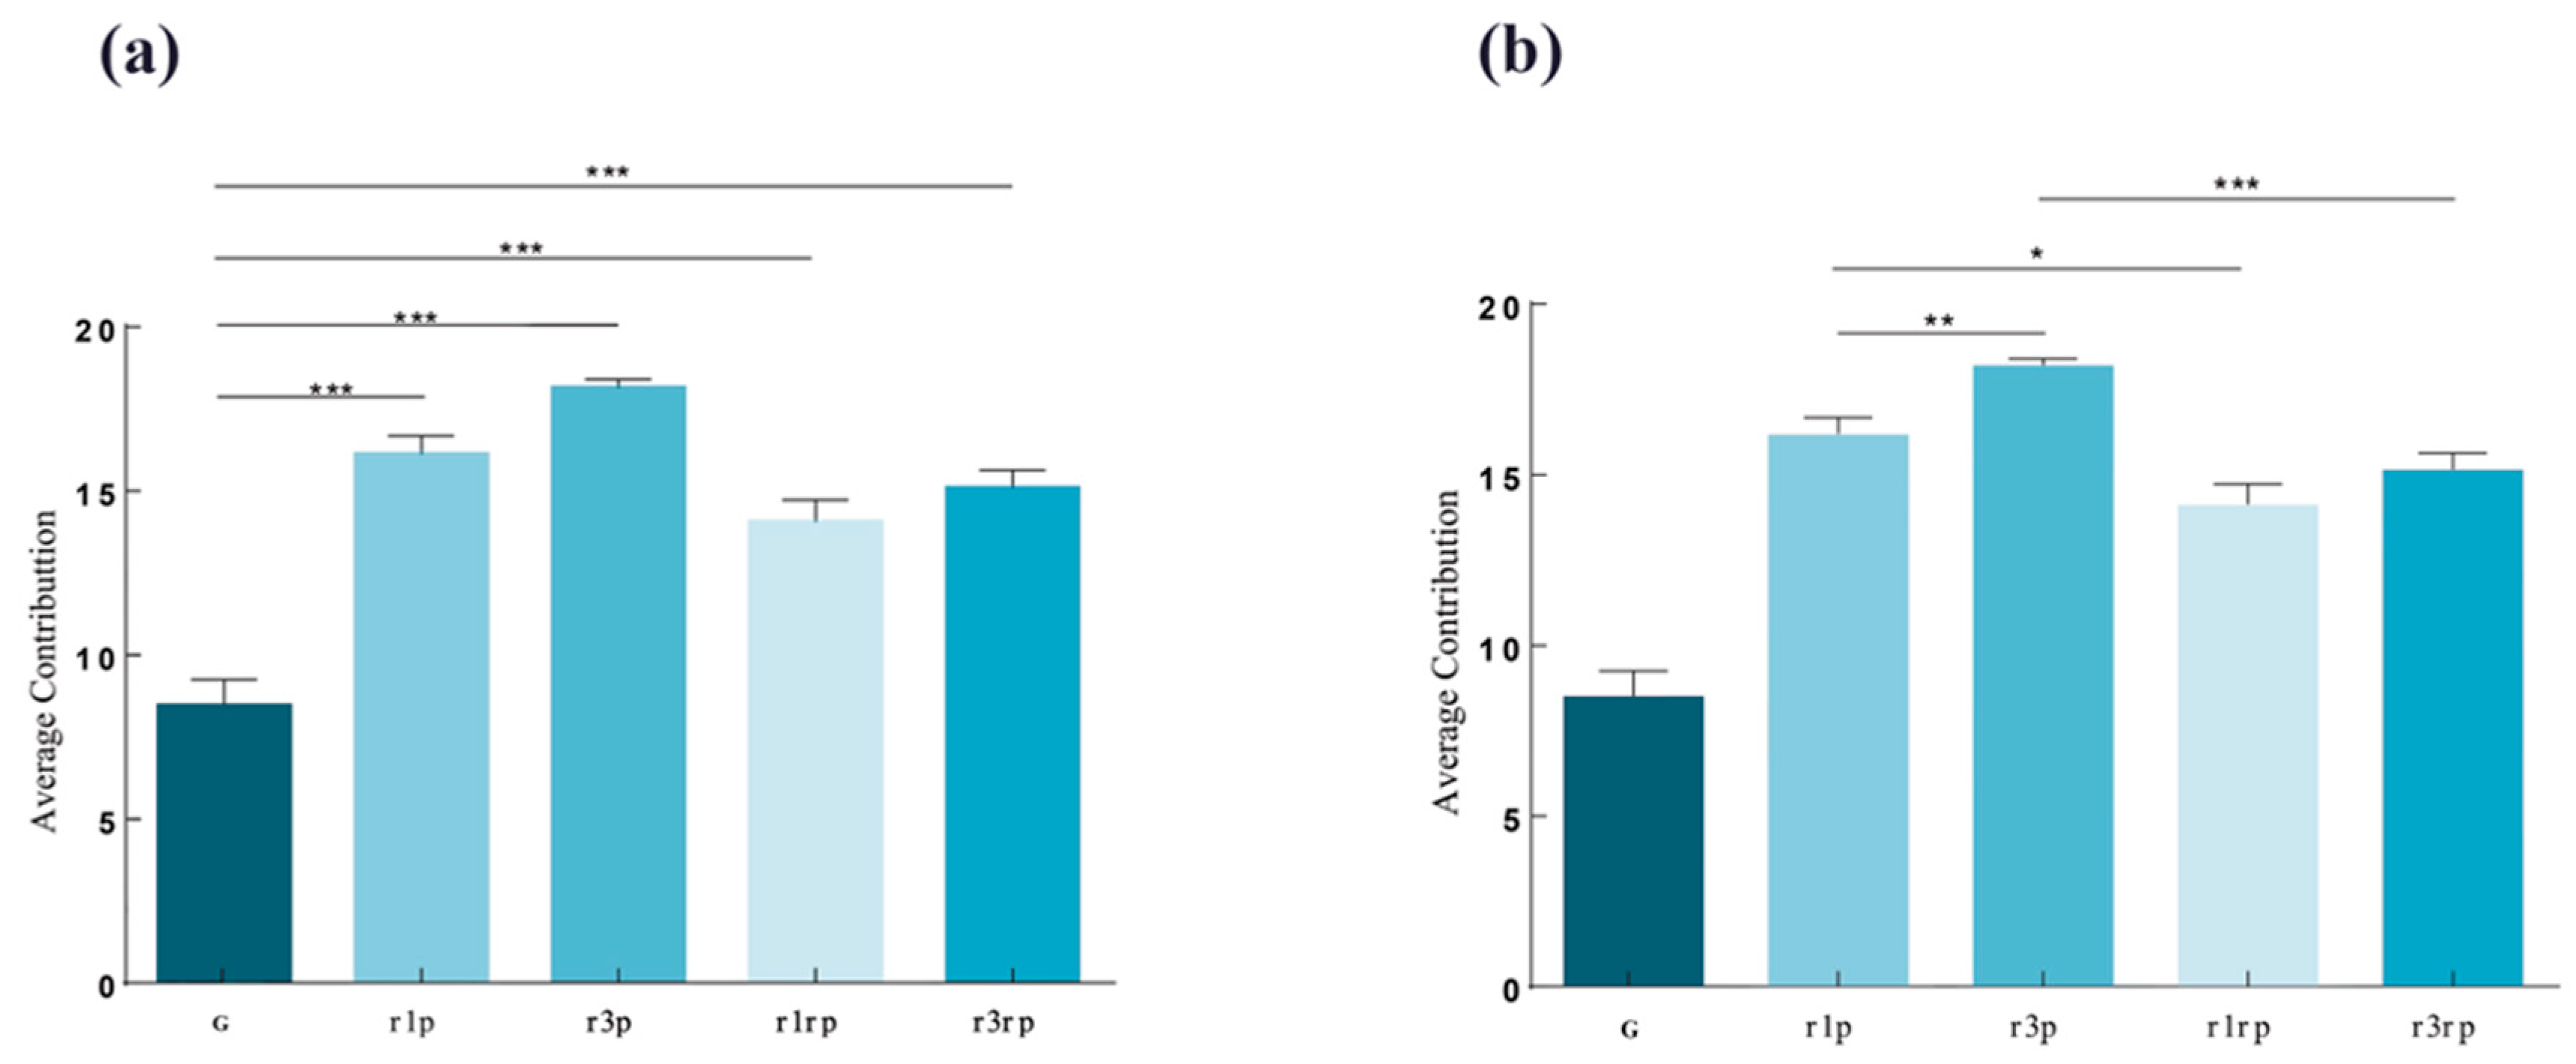
A pairwise comparison was made between the cooperation levels of the 4 punishment treatment groups. As displayed in Figure 1a, the overall cooperation level of the 4 punishment treatment groups was higher than that of the G group:(M±SD = 8.45±4.45). The average contributions of r1p group (M±SD=16.13 ± 3.13), r3p (M ± SD=18.15 ± 1.40), r1rp (M ± SD=14.06 ± 3.80), and r3rp (M ± SD=15.09 ± 3.03) were 90.77% and 114.71% higher than those of G, respectively 66.31% and 78.56% (Mann Whitney rank sum test, r1p and G, Z=-5.61, p<0.001; r3rp and G, Z=-5.38,p<0.001)). Except for the r1rp group, the average contribution of the other three punishment treatment groups exceeded 15 tokens, achieving a high level of cooperation. The r3p group has the highest level of cooperation among all processing groups, with an average contribution of 18.15 tokens, close to complete cooperation.
In Figure 1b, the Mann-Whitney rank test showed that there was significant difference in cooperation levels between r1p and r3p(Z=-3.14,p<0.01), r1p and r1rp(Z=-2.52,p<0.05), r3p and r3rp(Z=-4.18,p<0.001), except the cooperation between r1rp and r3rp(Z=-0.87,p>0.05).
The above results indicate that the 4 different patterns of third-party punishment all promote the improvement of cooperation levels, and there are significant differences between different punishment scenarios. Among them, The r3p group had the best effect on improving cooperation levels, and it had the largest increase in cooperation levels, which is significantly higher than the other three groups, as shown in the Figure 1a,b.

4.1.2. The Trend of Changes in Cooperation Level

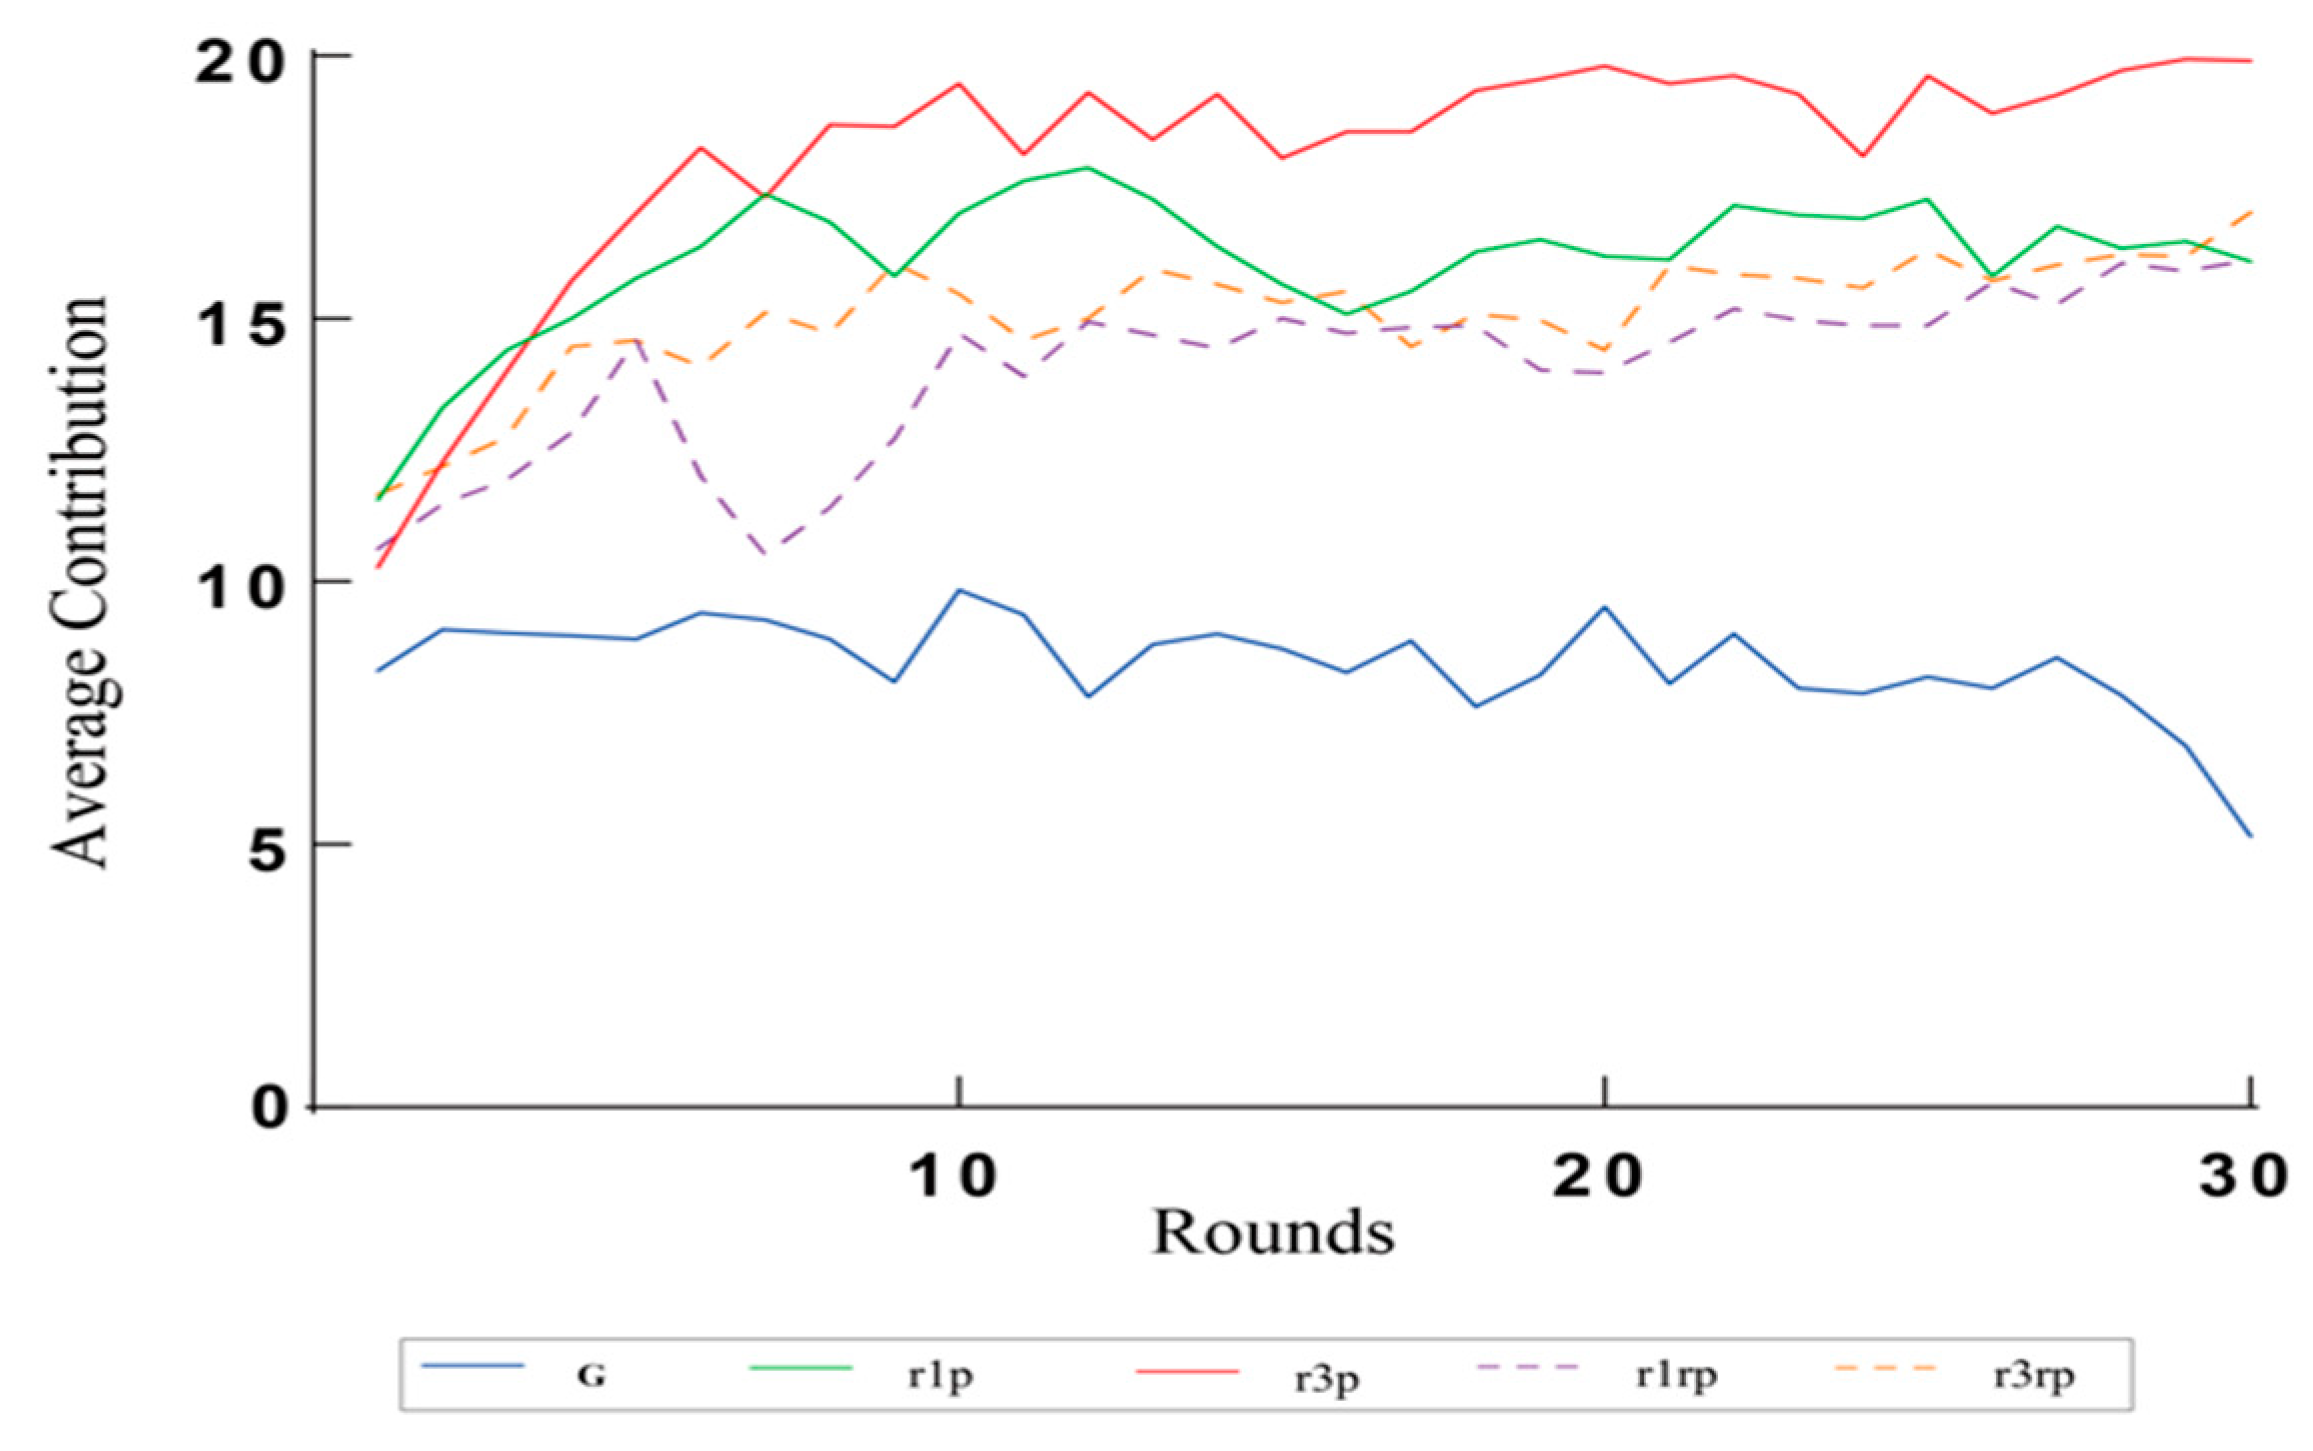
In Figure 2, it can be seen that in the first phase, the average contribution of the 4 punishment treatment groups was greater than 10 tokens. Specifically, the average contribution was 11.56 tokens for r1p, 10.28 tokens for r3p, 10.63 tokens for r1rp, and 11.66 tokens for r3rp. On the other hand, the average contribution of G in the first phase was only 8.31 tokens. The Kruskal-Wallis test was conducted to analyze the difference between the five groups, and it showed that the difference was not significant (χ²=4.00, df=4, p>0.05).
The cooperation level of the 4 punishment treatment groups shows an obvious upward trend over time, especially in the first 5 rounds, the cooperation level of the 4 punishment groups rapidly increased, with the highest in the r3p group. After five rounds, the cooperation level of each group reached a relatively stable phase, while the r3p group kept the highest level of cooperation from the 6th to the 30th rounds with an average contribution of 19.01 tokens, maintaining a nearly complete level of cooperation. The level of cooperation among the 4 groups receiving punishment treatment showed a noticeable increase over time. Particularly during the first 5 rounds, the level of cooperation between these groups increased rapidly. The highest level of cooperation was seen in the r3p group. After the initial 5 rounds, the cooperation level of each group stabilized. However, the r3p group maintained the highest level of cooperation from the 6th to the 30th round with an average contribution of 19.01 tokens.
The result has been found that the 4 different patterns of punishment can effectively enhance the level of cooperation and sustain it in the long run. Among all the patterns, the r3p group has been proven to be the most effective as it rapidly and significantly improves the level of cooperation and maintains full cooperation in the long run.

4.1.3. The Number and Proportion of Free-Riders

In Table 1 and Table 2, the results of the chi-square test showed that the proportion of free riders in all 4 punishment treatment groups was significantly lower than that in the G group (r1p and G, χ²= 41.16, df=1, p<0.001; r3p and G, χ²= 108.35, df=1, p<0.001; r1rp and G, χ²= 32.76, df=1, p<0.001; r3rp and G, χ²= 91.07, df=1, p<0.001). Further, a pairwise comparison of the proportion of free riders among the 4 punishment groups was conducted, and the chi-square test showed that the proportion of free riders in the r3p was significantly lower than that in the r1p (χ²=24.68,df=1,p<0.001), the proportion of free riders in the r3rp group was significantly lower than that in the r1rp (χ²=20.34,df=1,p<0.001). Nevertheless, there was no significant difference in the proportion of free riders between r1p and r1rp (χ²=0.00,df=1,p>0.05) as well as r3p and r3rp (χ²=0.00,df=1,p>0.05), as shown in Table 2.
The research study found that various forms of third-party punishment effectively reduce free-riding behavior, with intensity being the main factor affecting the inhibitory effect of punishment.

4.1.4. The Number and Proportion of High and Low Contributors

A statistical analysis was performed to study the differences between various punishment treatment groups and the factors that contribute to these differences. The study was based on the number of high contributors (who contributed more than 15 tokens) and low contributors (who contributed less than 5 tokens) in each round of each punishment treatment group(Gurerk, Irlenbusch, & Rockenbach, 2006).
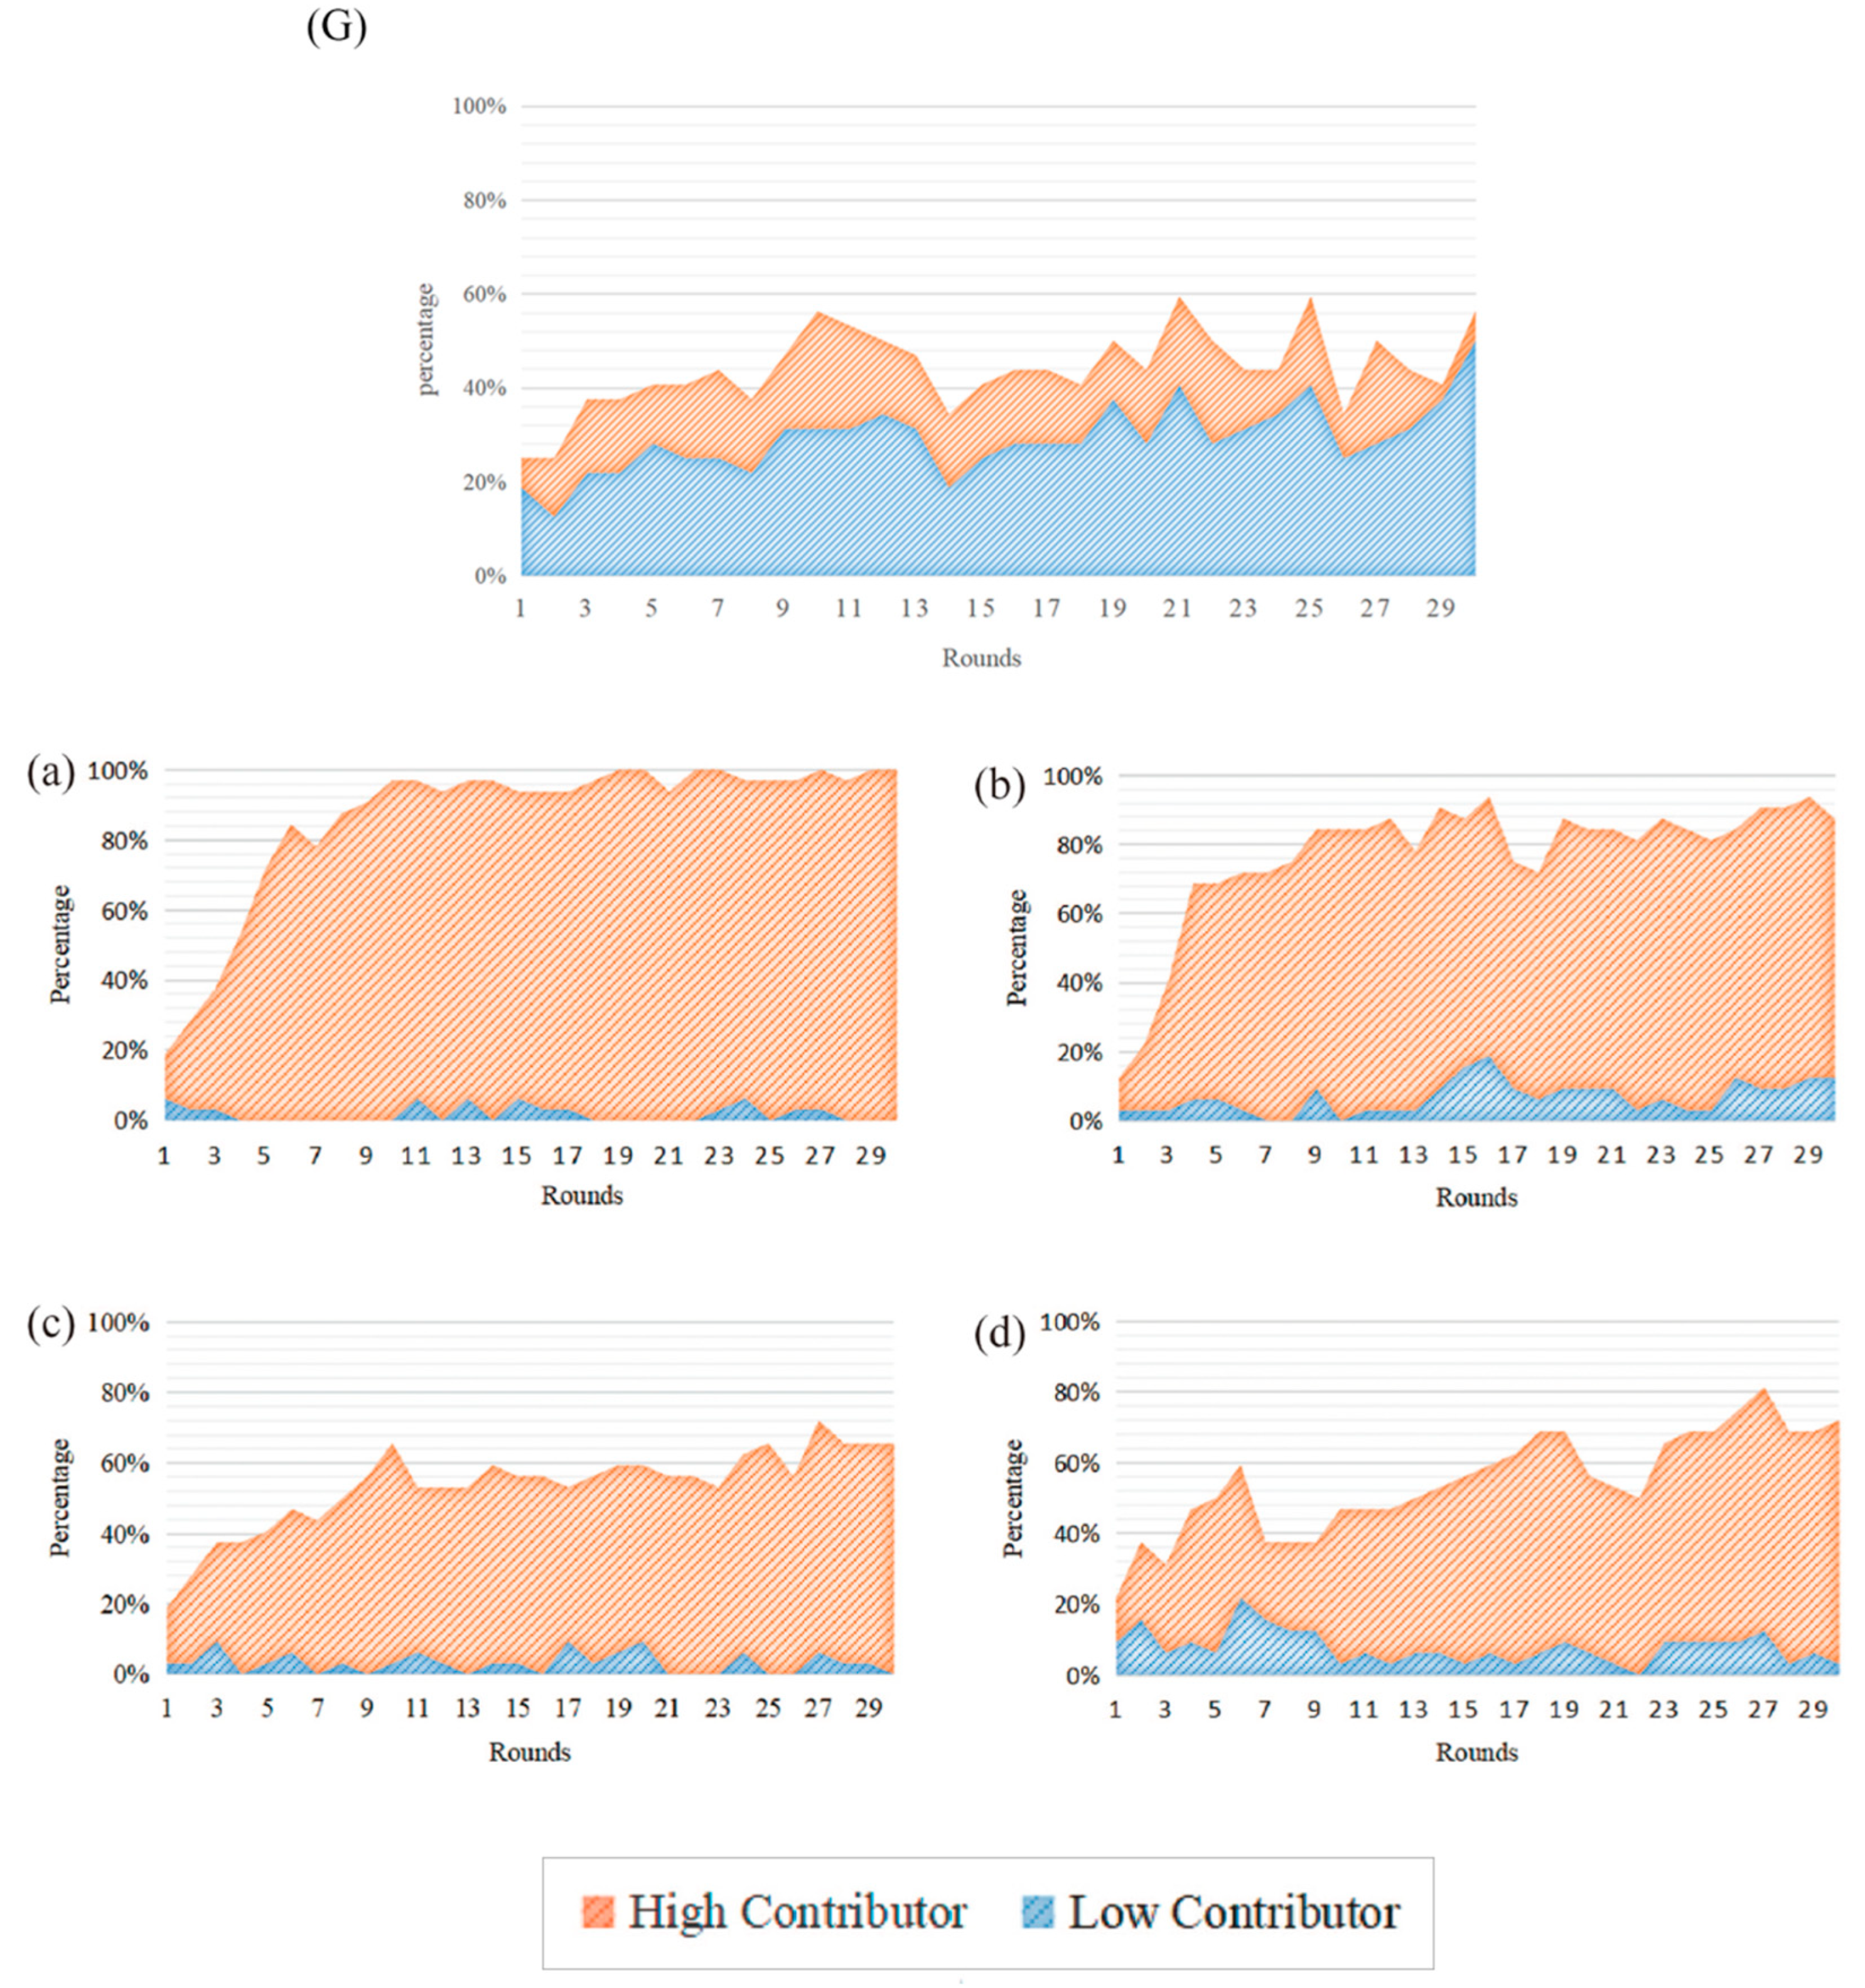
According to the results shown in Figure 3 below, in the control group, the average number of high contributors in each round was 4.73, while the number of low contributors was 9.33. The Mann-Whitney rank sum test was conducted to compare the number of high and low contributors in each punishment treatment group VS the control group. The results revealed that the control group had significantly fewer high contributors than all 4 punishment treatment groups(r1p and G, Z=-5.76, p<0.001; r3p and G, Z=-5.82, p<0.001; r1rp and G, Z=-4.26, p<0.001; r3rp and G, Z=-5.45, p<0.001). Furthermore, the control group had much lower contributors than any of the 4 punishment treatment groups(r1p and G, Z=-6.62, p<0.001; r3p and G, Z=-6.76, p<0.001; r1rp and G, Z=-6.57, p<0.001; r3rp and G, Z=-6.71, p<0.001).
Figure 3a shows that the average number of high contributors per round was 27.07, whereas the number of low contributors was only 0.57. In Figure 3b, the average number of high contributors was 22.43, whereas the average number of low contributors was 2.17. Figure 3d shows that the average number of high contributors was 15.07, whereas the average number of low contributors was 2.50 approximately. Finally, Figure 3c shows the average number of high contributors was 16.10 while the average number of low contributors was just 1.00.
The Mann-Whitney rank sum test was conducted to compare the number of high and low contributors in each punishment treatment group pairwise. The results showed that, except for no significant difference in the number of high contributors between Figure 3c,d (Z=-0.69, p>0.05), the other three groups had significant variances in the number of high contributors. These groupings include Figure 3a,b (Z=-5.35, p<0.001), Figure 3b,d (Z=-2.62, p<0.01), and Figure 3a,c (Z=-5.18, p<0.001). The number of low contributors did not differ significantly between Figure 3b and Figure 3c, or between Figure 3a,c. The p-values for both comparisons are above 0.05, (Z=-1.81, p>0.05). However, the number of low contributors varied significantly between Figure 3a,b, as well as Figure 3c,d. Both comparisons had p-values less than 0.001, (Z=-4.12, p<0.001).
Figure 3 shows that high contributors are the dominant group, and their presence encourages cooperative behavior. The change in the proportion of high and low contributors in each punishment treatment group over time demonstrates that there was a significant increase in the number of high contributors in the first 5 rounds, resulting in increased overall cooperation. Subjects in Figure 3a quickly established a pattern of highly cooperative conduct within the first 5 rounds, resulting in a significant increase in overall cooperation. From the 6th round, the proportion of high contributors remained stable at over 80%, and by the 10th round, it exceeded 90%. Figure 3c also showed similar behavior patterns, with a consistent proportion of high contributors around 60%. However, the two random punishments in Figure 3c,d had higher variations and more poor contributors appeared.

4.1.5. Contribution Distribution under Different Punishment Patterns

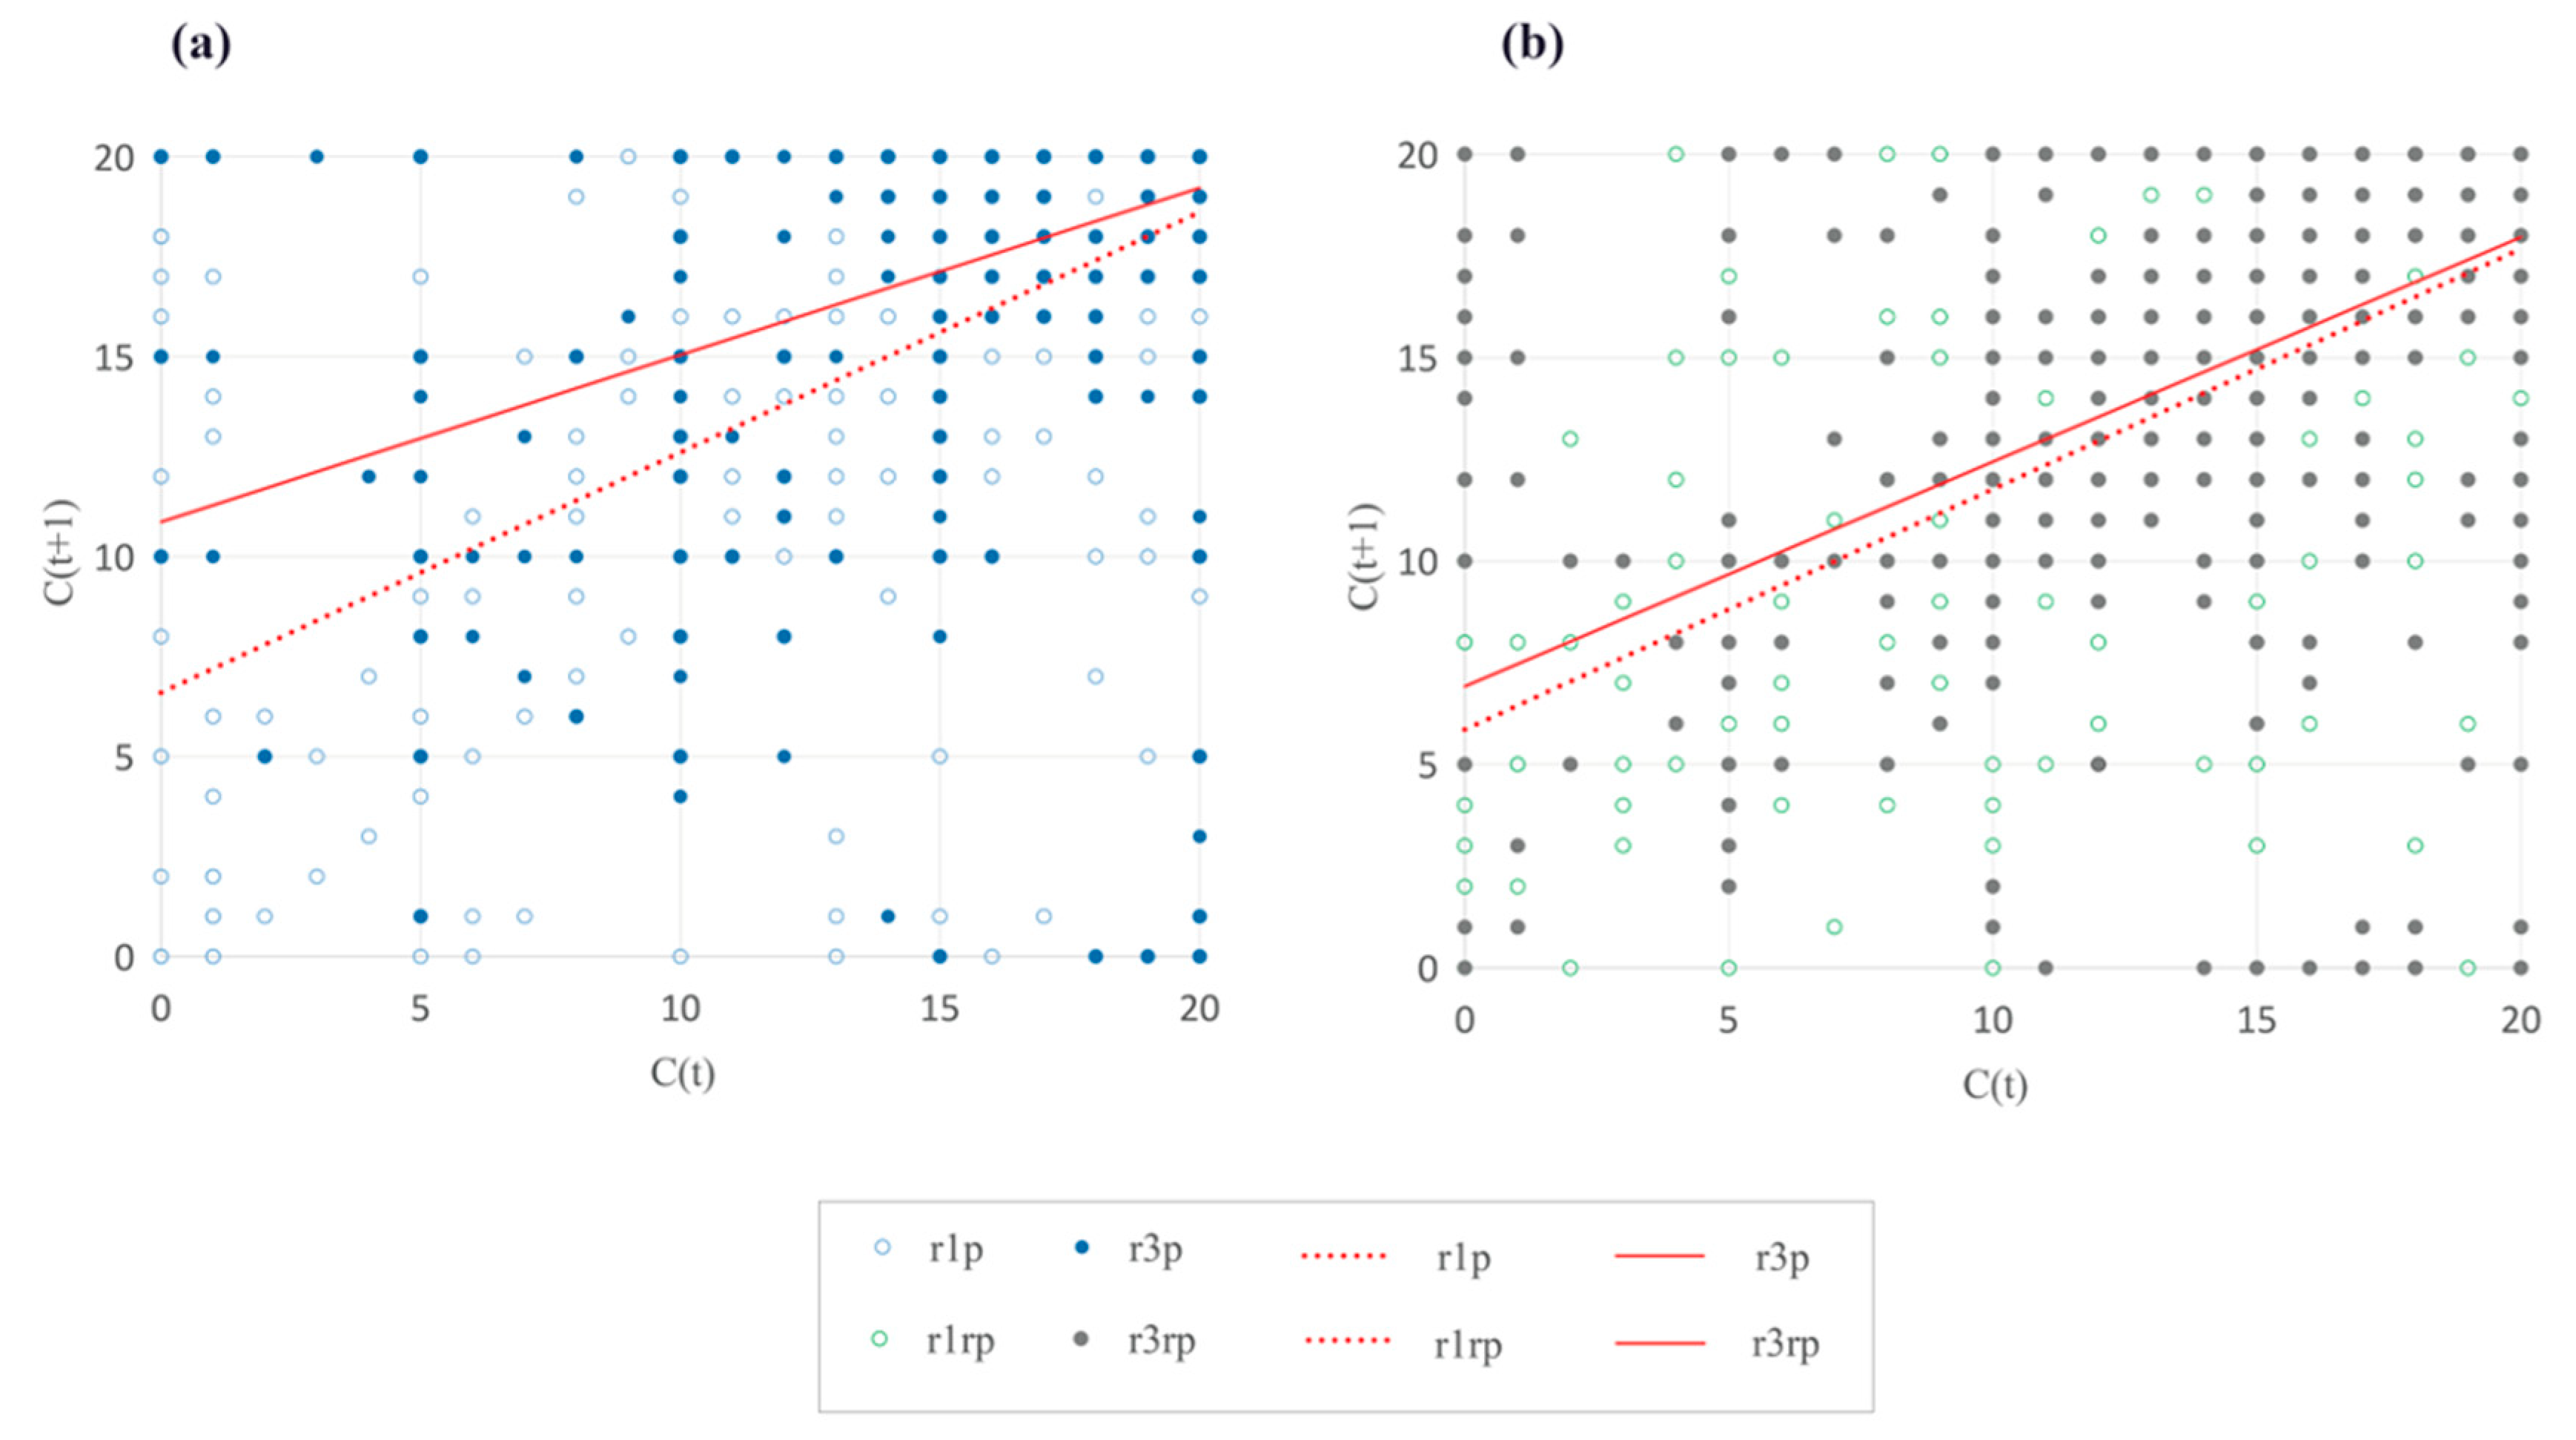
Figure 4a,b show scatter plots of each participant’s contribution values for round t and round t+1, respectively. The study analyzed the differences in contribution distribution under 4 different punishment patterns. When the scatter plots were compared, the results indicated that in Figure 4b, the dots of the r1p and r3p groups were more dispersed than the dots of r1rp and r3rp in Figure 4a. However, in Figure 4b, r1rp, and r3rp groups revealed more dots located on the X and Y axes, and more dots falling inside the range x 0,10 y 0,10 and the range x 10,20 y 0,10 .
Figure 4a,b show that the r3p and r3rp groups were more concentrated, indicating that the behaviors of the subjects were more consistent. The scatter plots’ trend lines revealed that the intercept of the trend line of the r3p group was greater than 10, while the other three groups were somewhat higher than 5. In Figure 4a, the trend lines of r1p and r3p groups show a wider gap when x<10, and a smaller gap when x>10. In contrast, in Figure 4b, the difference between the trend lines of r1rp and r3rp was relatively small.

4.2. The Impact of Third-Party Punishment in Different Modes on the Level of Profit

4.2.1. The Overall Profit Level Comparison

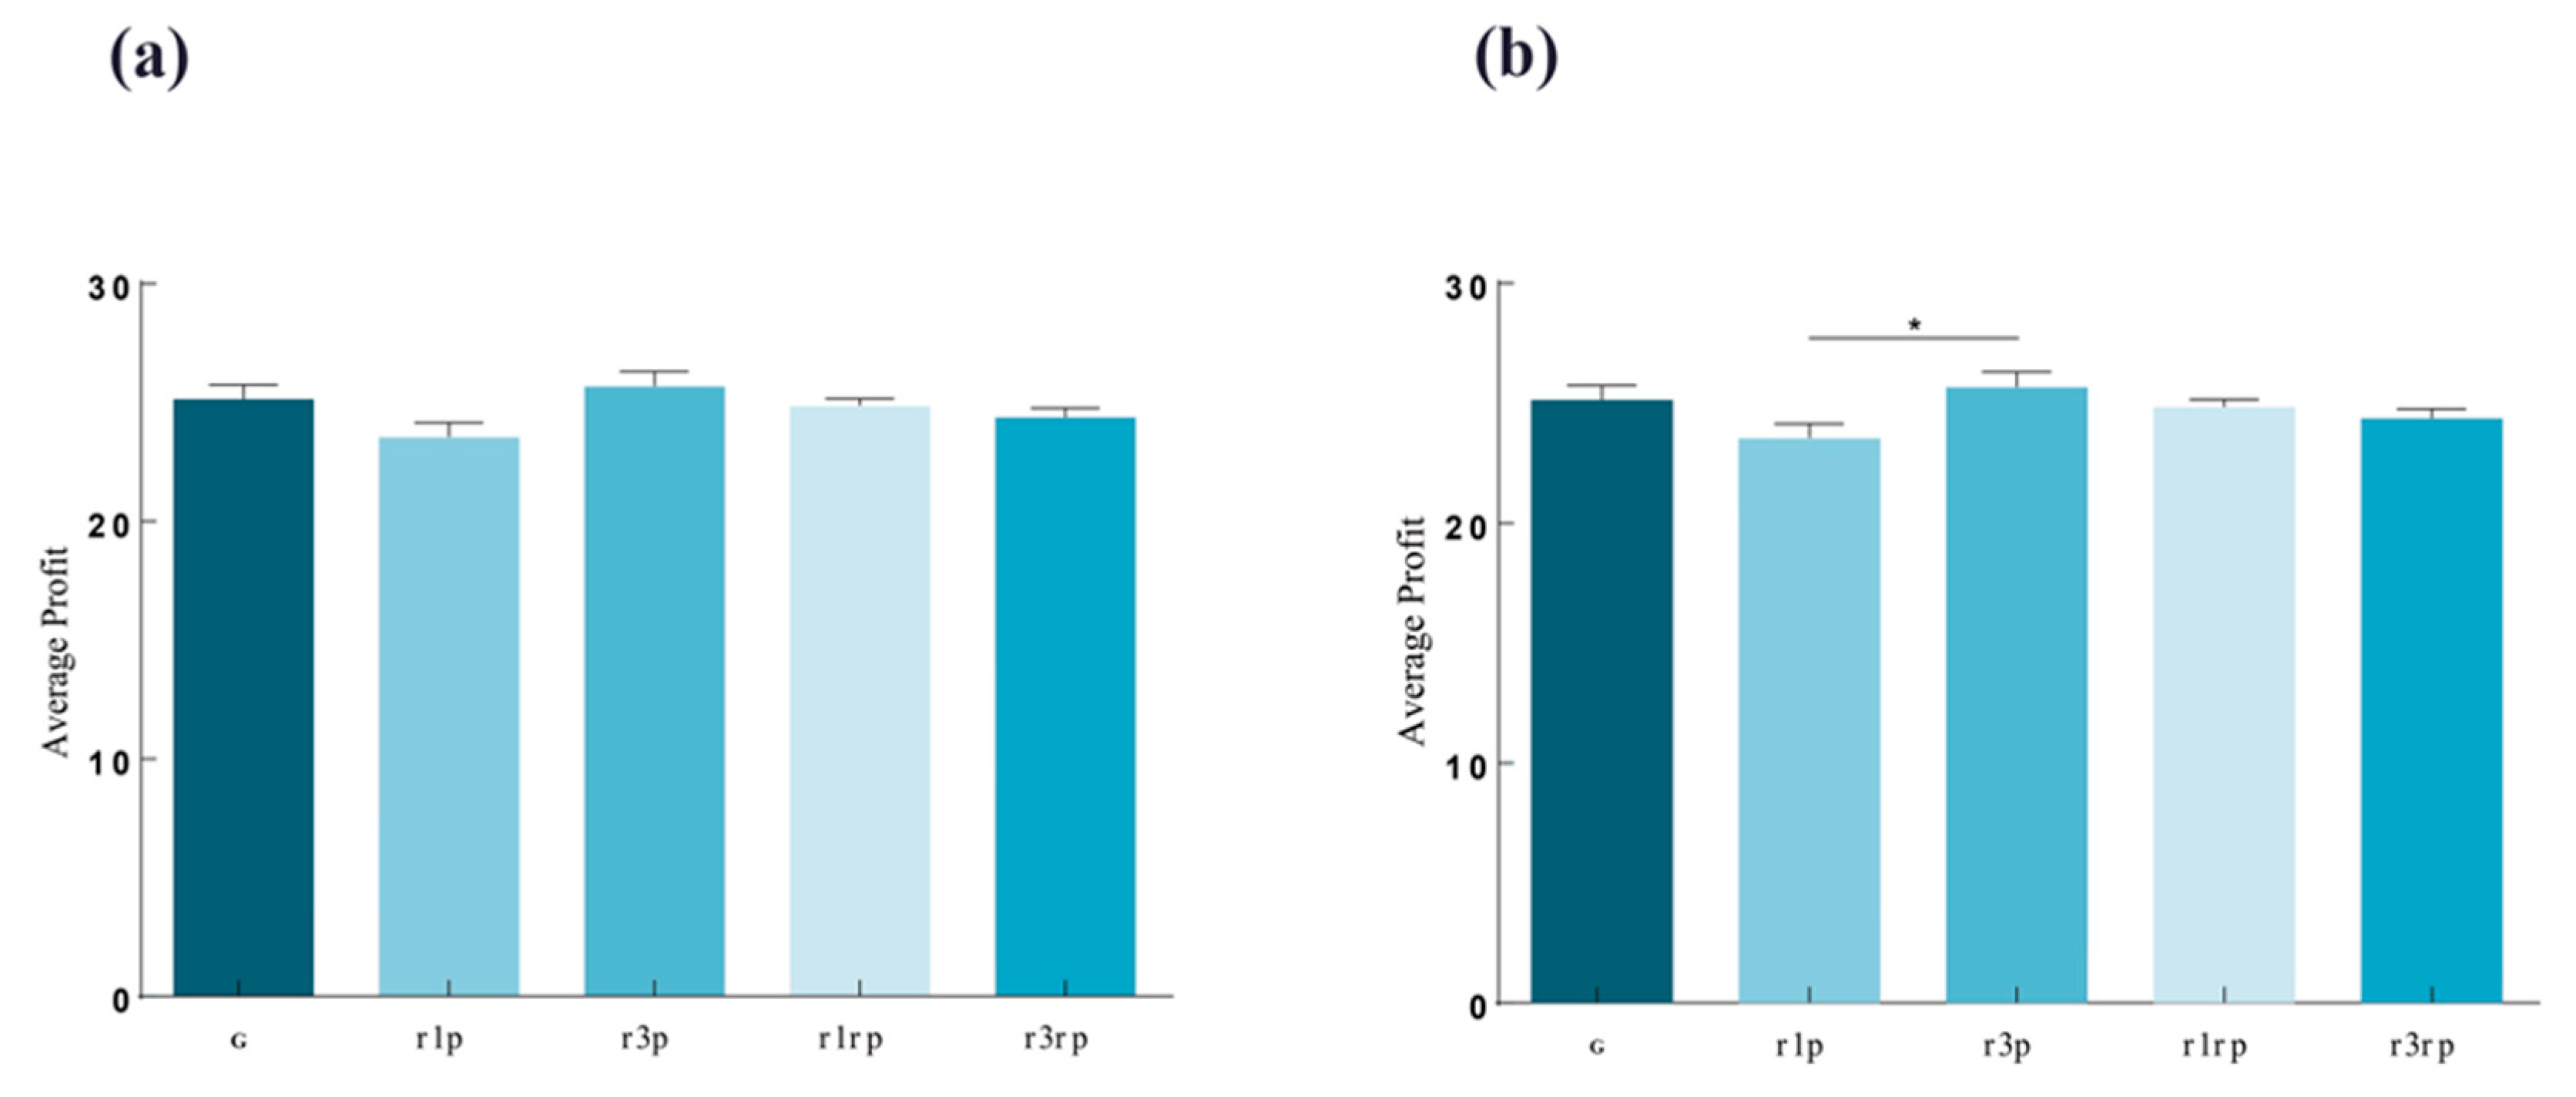
The average profit for r1p (M ± SD=23.46 ± 3.92), r3p (M ± SD=25.60 ± 3.97), r1rp(M ± SD=24.78 ± 2.18), and r3rp (M ± SD=24.30 ± 2.60) was not significantly different from that of G (M ± SD=25.07 ± 3.82). The Whitney rank sum test yielded the following results r1p and G, Z=-1.50, p>0.05; r3p and G, Z=-0.66, p>0.05; r1rp and G, Z=-0.63, p>0.05; r3rp and G, Z=-0.98, p>0.05. Based on this, it is possible to conclude that r3p has a positive impact on the average profit. However, the values for r1rp and r3rp have resulted in a drop in the average profit, as illustrated in Figure 5a.
The Mann-Whitney rank sum test was used to compare the profit levels between the 4 punishment treatment groups. The study showed that no significant difference between r1p and r1rp(Z = -1.34,p > 0.05), r3p and r3rp(Z = -1.69,p > 0.05), r1rp and r3rp(Z = -0.83,p > 0.05). Figure 5b demonstrated that r3p had a much bigger profit than r1p (Z = -2.15,p < 0.05).

4.2.2. The Trend of Profit Level Over Time

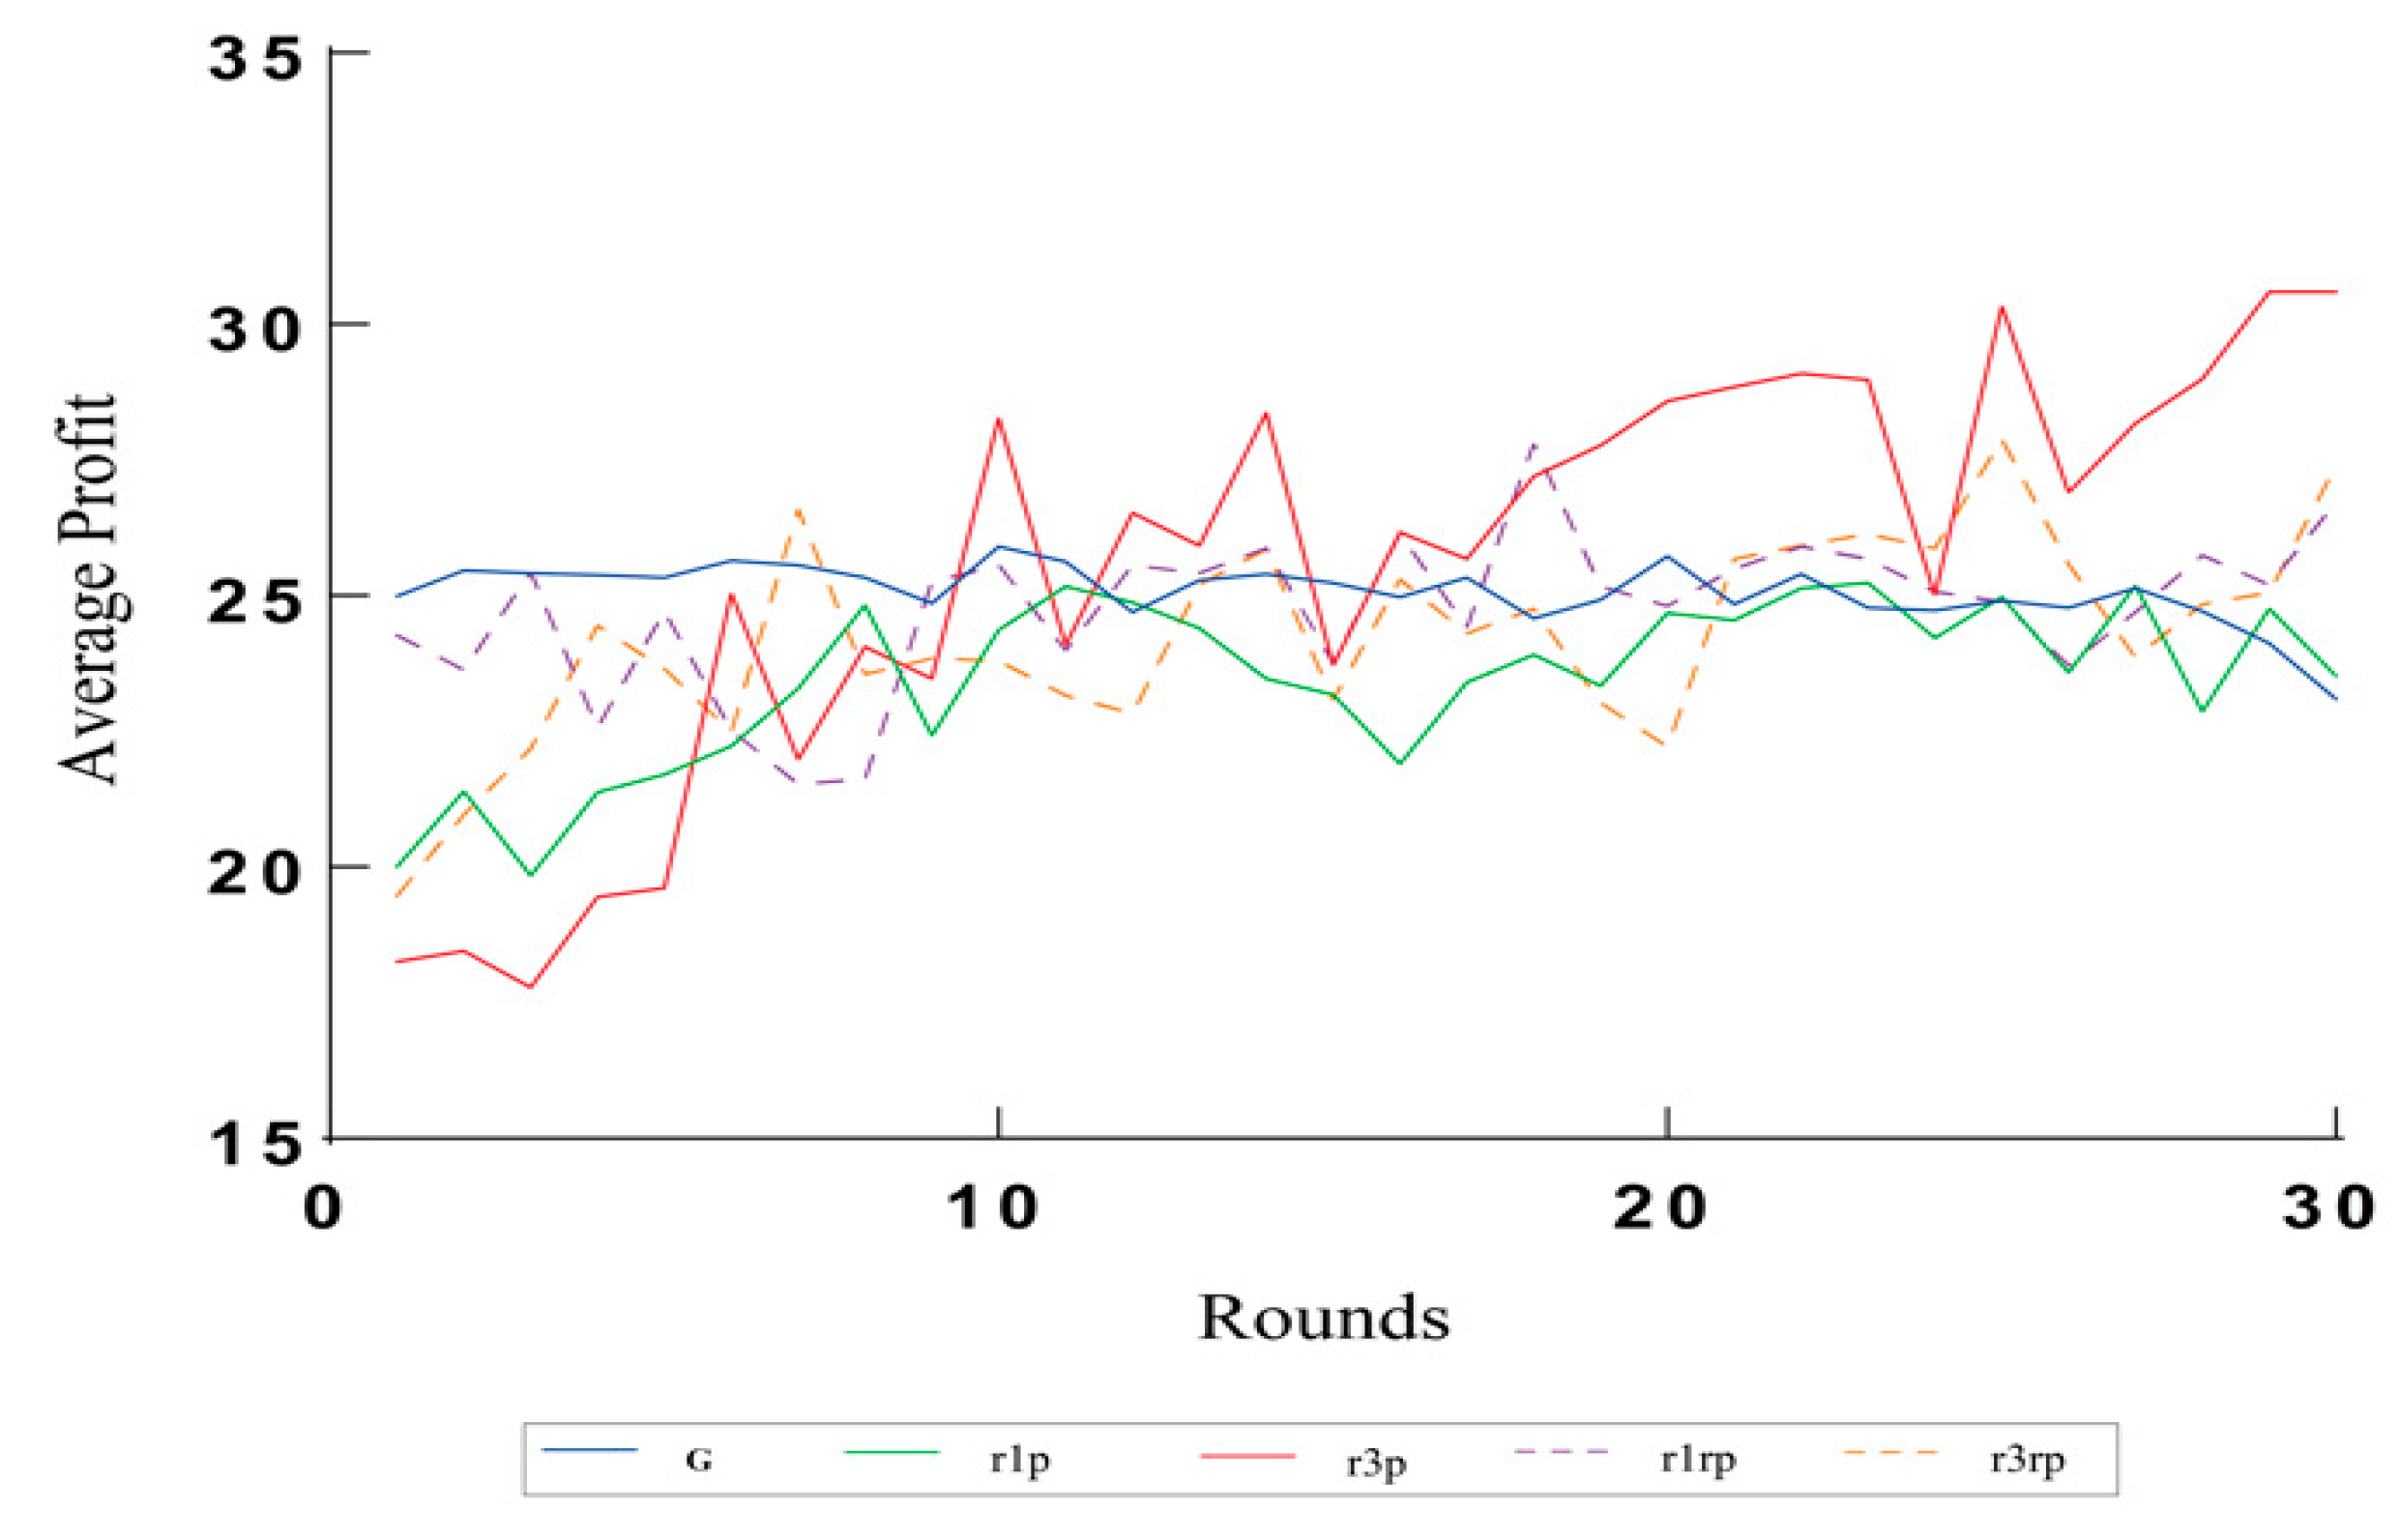
Figure 6 reveals an upward trend in profits for the 4 punishment treatment groups. Over time, these groups gradually approached and even surpassed the profit level of group G. Among the 4 punishment groups, r3p had the largest increase in profit, with its profit level remaining at the highest level and showing a consistent increasing trend after the 10th round. The average profit curves of r1rp and r3rp fluctuated significantly, starting from the 5th round and exceeding the baseline level. On the other side, r1p had the lowest average profit among the 4 punishment groups, with the entire process yielding a profit level lower than that of group G. After 20 rounds, r1p’s profit was largely at its lowest level, with only a few rounds where it outperformed G (baseline).

5. Results

We conducted multiple linear regression analysis based on the data collected from round 2 to round 30 to analyze the effect of various factors on the level of cooperation. The dependent variable was the contribution of each round, and we considered six independent variables in the punishment treatment groups. These variables included the number of rounds, previous round contribution, previous round profit, previous round punishment, intensity, and randomness. Intensity and randomness were the two dummy variables, as shown in Table 5.
The model of punishment groups demonstrates that several factors have a significant impact on the contribution level, including the contribution, profit, and punishment of the previous round, as well as intensity and randomness. Notably, non-random punishment may improve the contribution level, as randomness has a negative effect. Meanwhile, the contribution, profit, punishment, and intensity of the previous round all positively impact the contribution level of the current phase. Additionally, the number of rounds has a slight positive effect on the contribution level, indicating an upward trend in cooperation over time.
By comparing the coefficients, it can be found that the subjects in the punishment group who contributed more in the previous round are more likely to make high-level contributions in this round.
High-intensity and non-random punishments can be more effective in improving cooperation, especially in third-party punishment mechanisms. Punishment in the previous round can significantly increase the contribution level in the next stage. This is consistent with the results of the public goods experiment, which showed that the roles of punishment in third-party sanction mechanisms are significantly different.

6. Discussions

Several studies have shown that punishment can effectively improve cooperation and prevent free-riding, whether through peer punishments or centralized sanctions mechanisms, [15,20,21,38,39,41,42].
Previous research has focused on peer punishments, even though this approach faced a second-order free-riding problem with peers and punishments [3,23,39,43], while the centralized sanction mechanisms could avoid this problem and enhance the efficiency of punishments [26,38,44,45].

6.1. The Impact of Punishment on the Level of Cooperation Is Consistent

This study found that different intensity and randomness of third-party punishment can increase cooperation levels. On this account, the 4 different arrangements of third-party punishment effectively promoted cooperation, and the level of cooperation rapidly increased in the early stage of the experiment, indicating that the effect of punishment was more effective [8,38,42,45]. The results of the first sequence of contribution values indicated that even with the possibility of punishment, the level of cooperation can be improved [38,44]. The results have shown that high-intensity and non-random punishment successfully achieved and maintained almost complete cooperation, which confirmed the results of computer simulations of the evolution of cooperation by evolutionary game theory on cooperative evolution from the perspective of behavioral experiments, that punishment from institutions could maintain a long-term stable level of cooperation.
The above findings were consistent with the crucial role of punishment in promoting cooperation and empirically proved the views of evolutionary game theory: Punishment can maintain long-term and high-level cooperation at a relatively small cost[1,2,26]. Relying on the results, (H1), (H2), and (H3) are approved.

6.2. The Effect of Punishment on Free-Riding Behavior Is Asymmetric

In addition to increasing the level of cooperation behaviors, third-party punishments with different intensity and randomness also inhibited uncooperative behaviors, and there were significant differences between patterns of punishments. We found that different patterns of third-party punishment effectively suppressed extreme uncooperative free-riding behavior and had a significant inhibitory effect on this behavior. Among them, intensity has played a major role, which may be related to the subject’s preference for loss avoidance. Additionally, the r3p group triggered a stronger psychological pain(negative emotions), thus having a greater deterrent effect on those who attempted to take free-riding behavior. We also discovered that different patterns of punishment had asymmetric effects on the cooperators who had high contributions, and the differences in cooperators’ behaviors caused the differences in cooperation level. Since most people are conditional cooperators driven by self-interest motives, people will choose to avoid punishment and losses to increase personal profit. In addition, as the experiment progressed, conditional cooperators would choose and learn the most favorable strategy to protect their interests [15,16,18]. According to the results, (H1), (H2), and (H3) are verified.

6.3. Human Behavior Patterns Are Heterogeneous under the Punishment Mechanisms

The results of the analysis revealed that there are significant differences in human behavior patterns under different punishment patterns.
Under the third-party punishment, there was great heterogeneity in the cooperative behaviors, which is mainly reflected in the following three aspects: (1) Under random third-party punishment, individuals' cooperative behaviors were more different. (2) Under random or low punishment, the subjects who contributed lower tokens(x<10)in the previous round were more likely to keep the low contribution(x<10)in the later round. (3) Under random or low punishment, the subjects who made high contributions (x>10)were more likely to reduce their contribution(x<10)in the later round. (4) Under high and non-random punishment, the defectors who contributed less in the previous round will increase their contribution significantly in the later round and become cooperators. However, cooperators who contributed more in the previous round maintained a higher level of contribution regardless of the low or the high punishment. Therefore, under non-random or high-intensity punishment, especially in the high-punishment group, people were more likely to establish consistent behavior patterns, namely cooperation, consistent with evolutionary game theory. Studies demonstrated that high-intensity and non-random third-party punishment could prompt subjects to establish consistent patterns of highly cooperative behavior quickly[15,16,18]. Based on the findings, (H1), (H2), and (H3) are confirmed.

6.4. The Impact of Punishment on Profit Behavior Patterns

The research study found that punishment significantly improved the level of cooperation and the level of profit behavior patterns, which was inconsistent with previous research. Previous research has suggested that although the punishment was conducive to promoting cooperation, the significant cost it incurs has resulted in a loss of efficiency [15,16,18], which led to the assumption that this inconsistency is attributed to the experimental design.
This experiment research adopted a centralized sanction mechanism, where a third party vertically implemented punishment and subjects would not punish other members of the group, which indicated punishment does not cause losses when it is redistributed and converted into an efficient [36] avoiding the second-order free-riding problem. However, second-order free-riding was the main cause of efficiency loss and increased punishment costs. The study by Diekmann et al. [20] argued that the centralized sanction mechanisms had lower costs and higher efficiency than the peer sanction mechanisms.
In the experiment, we adopted the computer system as the third party, eliminating human factors, and better simulating the implementation of the regulations in the real world, which was conducive to a clear analysis of the behavior of the subjects under regulatory monitoring. The 30-round experiment gave subjects sufficient interaction time, making the experimental results more stable and able to simulate long-term states. Research by Gächter et al. [21] found through 50 rounds of experiments that punishment would not only improve cooperation levels but also increase long-term profit. From this, our research discovered that under centralized sanction mechanisms, punishment could quickly boost the level of cooperation behaviors. Although the large amount of punishment generated in the early stage of the experiment caused a loss of profits, playing an effective warning role, which resulted in the quick strategy adaption and the transformation that a large number of subjects turned from defectors to cooperators.
Under the high intensity and non-random punishment, the subjects formed the norm of cooperation to avoid punishment and protect personal profit. Therefore, in the early stage of the experiment, the profit loss was relatively large, and in the middle stage of the experiment, the profit increased significantly, exceeding the baseline level, and maintained an upward trend throughout the whole experiment. A study by Nakashima et al. [32] found that third-party intervention had a lasting impact on cooperative behaviors and the impact of early intervention was better than that of subsequent intervention. In our experiment, the subjects formed a unified cooperative behavior pattern under third-party punishment. Relying on the findings, (H1), (H2), and (H3) are verified.

6.5. The Impact of Intensity and Randomness on Cooperation Behavior Patterns

At the individual level, the study employed an Ordinary Least Squares (OLS) linear regression technique, which gained an understanding of how factors such as intensity and randomness influenced cooperation behavior patterns. The approach provided the following lines of findings: First, randomness diminished the effect of punishment, while non-random and punishment mechanisms performed better. Second, the r3p groups were more conducive to improving cooperation behaviors. Third, the effects of randomness and intensity were more significant in third-party punishment. Furthermore, the punishment of the previous round significantly increased the contribution of the subsequent round, explaining the transformation in behavior models as follows:
Subjects were significantly sensitive to third-party punishment, and both randomness and intensity of punishment significantly affected the behaviors of subjects, indicating that punishment was a powerful deterrent and threat for rule-breaking behaviors, which promoted the establishment of cooperation among people [45]. Research by Fischbacher & Gächter [46]found that the decline in collaboration is due to the preference of most people to contribute less than others. Research by Dong et al.[44] used institutional mechanisms and discovered that people don’t have much response to rewards and punishments. Institutional mechanisms promoted cooperation by influencing self-interest preferences, while other preferences seemed to exist independently of the incentive models.
Through the above experimental results, we discovered that punishment affected the actual behaviors of the subjects. Both the intensity and randomness of punishment significantly impacted the cooperative behaviors of the subjects. Thus, under centralized sanctions, people have significant and different responses to punishments with different intensity and randomness. The prospect theory proposed by Kahneman & Tversky [47] explains people's asymmetric behaviors in the face of punishment. They proposed that people's psychological feelings in the face of equal loss and gain were not equal, and people were more sensitive to loss than gain[47,48]. In accordance with the findings, (H1), (H2), and (H3) are approved.
For the subjects in our experiments, punishment results in a direct loss of earnings. Under the same conditions, punishment might provide higher psychological deterrence and encourage subjects to choose a scheme that can avoid punishment as much as possible. These feelings may be the psychological basis for people's behaviors. Additionally, the high-intensity and non-random settings increased the influence of the subject’s behavior, reshaping the subject's decision to embrace cooperative behavior more efficiently and swiftly. Based on the above conclusions (H3) is verified.

7. Conclusions

This study examined the impact of punishments in centralized sanction mechanisms by incorporating third-party punishment into the standard public goods experimental paradigm.
Our findings are threefold. Firstly, punishment achieves higher cooperation at a lower cost. Non-random and high-intensity punishment can maintain long-term and high-level cooperation under sufficient information. Secondly, punishment effectively inhibits free-riding behavior when there is sufficient information. Punishment intensity drives cooperation and inhibits free-riding behavior. Finally, in punishment schemes, people's behaviors remain consistent through high-intensity and non-random punishment mechanisms. This leads to the establishment of cooperative social norms, which help prevent punishment and eventually lead to increased profits.
In summary, these findings support (H1), (H2), and (H3), indicating that sanction systems play an asymmetric role in punishment.
The study was conducted in a controlled laboratory setting at Zhejiang Sci-Tech University; therefore, the results may not accurately reflect real-world situations due to the unlimited and unavailable information. Consequently, it is worthwhile to investigate how to conduct experimental research on the centralized sanction mechanism in such scenarios with a more ecological approach. Additionally, research could be replicated in different cultural contexts to validate the findings and look into cultural influences on the efficiency of punishment. Lastly, reward can be seen as another incentive mechanism that can be used as a supplement to this study to understand better the mechanisms that enable cooperative behavior and the effectiveness of centralized punishment in a number of settings.

Author Contributions

Conceptualization, Z.Z. and G.H.; methodology, Z.Z. and G.H.; software, Z.Z.; validation, Z.Z. and N.T.E.; formal analysis, Z.Z. and N.T.E.; investigation, N.T.E.; resources, G.H. and Y.S.; writing—original draft preparation, Z.Z.; writing—review and editing, Z.Z. and N.T.E.; supervision, G.H. and Y.S.; project administration, G.H. and C.K.; funding acquisition, G.H. All authors have read and agreed to the published version of the manuscript.

Funding

This work was supported by the Science Philosophy Betterment Society (Registered British Virgin Islands, 114329A4J12111, 1206111-J).

Ethical Approval

The Human Research Ethical Committee accepted this study under reference number 202310M001. The research was conducted in compliance with applicable regulations. Participants provided informed consent.

Informed Consent Statement

No applicable.

Acknowledgments

We thank the Participants for their collaboration in this study. For their crucial research assistance in the field, we thank Xiaopeng Sun for the technical support in graph making and Yuling Zhang, Bo Wang, Tianjing Sun, and Shuaiwen Li for their support and encouragement during the whole process of experiments.

Conflicts of Interest

The authors declare no conflicts of interest.

Appendix A. z-Tree Software Authorization Form (without Username and Password)

Dear z-Tree user,
Thank you for sending the license contract. You can download this version from http://www.econ.uzh.ch/ztree/downloads.html. Your username is ZXXXXX and your password is XXXXXXXX. You will need this username and password to download future releases of z-Tree. Make sure that your browser accepts cookies from our domain uzh.ch.
When you log in, you can change your password and your profile, which includes your email address. It would be nice if you would also enter the geographical coordinates of your location in your profile. We could then present a world map of z-Tree on our web page. Please do not forget to mention in your paper that you used z-Tree. The correct citation is: The experiment was programmed and conducted with the experiment software z-Tree (Fischbacher, 2007).
Reference: Fischbacher, U. (2007): z-Tree: Zurich Toolbox for Ready-made Economic Experiments. Experimental Economics, 10(2), 171-178.
The manual and other information on support can be found on our website.
You will also find references to experimental papers that used z-Tree. For some of them, you can download the treatment (i.e. the program). This list is open. If you have a publication or a working paper on an experiment conducted with z-Tree, you can contribute it to this list.
Regards,
Urs Fischbacher

Appendix B. The Control (G) Group Instructions and Experimental

This is a decision-making experiment, please read the instructions carefully as your decision will determine the profit for you and the other team members.
This experiment consists of several rounds in which you and three other team members form a temporary team during the game. Each team member will be given 20 tokens as capital in each round, which will be converted into actual profit in a specific ratio at the end of the experiment. You need to decide how many tokens Xn to put into the public account each round (0 ≤ Xn ≤ 20, Xn is an integer). The tokens you gain at the end of each round consist of two parts:
  • Tokens are not put into the public account each round, which is (20 − Xn).
  • The total number of tokens put into the public account by all team members is multiplied by 1.6 and shared, resulting in 1.6 × (X1 + X2 + X3 + X4) ÷ 4.
  • The total tokens you gain in each round: (20 − Xn) + 1.6 × (X1 + X2 + X3 + X4) ÷ 4.
Example B1:
1. If all 4 team members contribute 20 tokens to the public account, each member’s profit equals (20 − 20) + 1.6 × (20 + 20 + 20 + 20) ÷ 4 = 32 tokens.
2. If 3 team members give 20 tokens to the public account, and 1 gives 0 tokens, the profit for the team members who give 20 tokens: (20 − 20) + 1.6 × (20 + 20 + 20 + 0) ÷ 4 = 24 tokens.
3. The profit for the team member who gives 0 tokens: (20 − 0) + 1.6 × (20 + 20 + 20 + 0) ÷ 4 = 44 tokens.
The feedback receives after each round:
1. Total tokens are given by your team.
2. Tokens you give.
3. Tokens you gained in this round, then you will move to the next round.
To determine whether you fully understand the above experimental explanation, please complete the two mini-tests below and enter your answers into the computer by selecting "Check Answers":
1. If the other 3 team members give 5, 10, and 15 tokens respectively, and you give 20 tokens (4 people totaling 50 tokens), how many tokens will you receive in this round?
2. If the other 3 team members give 10, 15, and 20 tokens correspondingly, and you give 5 tokens (4 people totaling 50 tokens), how many tokens will you receive in this round? If you have any questions, please contact the experimenter for assistance.

Appendix C. Punishment Group Instructions and Experimental

This is a decision-making experiment, please read the instructions carefully as your decision will determine the profit for you and the other team members.
This experiment consists of several rounds in which you and three other team members form a temporary team during the game. Each team member will be given 20 tokens as capital in each round, which will be converted into actual profit in a specific ratio at the end of the experiment. You need to decide how many tokens Xn to put into the public account each round (0 ≤ Xn ≤ 20, Xn is an integer). The tokens you gain at the end of each round consist of two parts:
1. Tokens are not put into the public account each round, which is (20 − Xn).
2. The total number of tokens put into the public account by all team members is multiplied by 1.6 and shared, resulting in 1.6 × (X1 + X2 + X3 + X4) ÷ 4.
3. The total tokens you gain in each round: (20 − Xn) + 1.6 × (X1 + X2 + X3 + X4) ÷ 4.
Punishment occurs in each round, if the tokens you give are lower than the average tokens given by the team(Xn < Xa), your profit will be deducted by some tokens(Xp). Therefore, your final profit: (20 – Xn) + 1.6 × (X1 + X2 + X3 + X4) ÷ 4 – Xp. If the tokens you give are higher than the average, there is no punishment.
"In each round, if the number of tokens you contribute is less than the average number of tokens contributed by the team (Xn < Xa ), your profit will be reduced by a certain number of tokens (Xp). Therefore, your final profit is calculated as (20 - Xn) + 1.6 * (X1 + X2 + X3 + X4) ÷ 4 – Xp. As a result, if the number of tokens you contribute is higher than the average, there is no punishment."
Example B2:
1. If all 4 team members contribute 20 tokens to the public account, each member’s profit equals (20 − 20) + 1.6 × (20 + 20 + 20 + 20) ÷ 4 = 32 tokens.
2. If 3 team members give 20 tokens to the public account, and 1 gives 0 tokens, the profit for the team members who give 20 tokens:
3. (20 − 20) + 1.6 × (20 + 20 + 20 + 0) ÷ 4 = 24 tokens.
4. The profit for the team member who gives 0 tokens: (20 − 0) + 1.6 × (20 + 20 + 20 + 0) ÷ 4 = 44 tokens.
The feedback receives after each round:
1. Total tokens are given by your team.
2. Tokens you give.
3. Whether you are punished.
4. Tokens you gained in this round, then you will move to the next round.
To determine whether you fully understand the above experimental explanation, please complete the two mini-tests below and enter your answers into the computer by selecting "Check Answers":
1. If the other 3 team members give 5, 10, and 15 tokens respectively, and you give 20 tokens (4 people totaling 50 tokens), how many tokens will you receive in this round?
2. If the other 3 team members give 10, 15, and 20 tokens respectively, and you give 5 tokens (4 people totaling 50 tokens), how many tokens will you receive in this round?
If you have any questions, please contact the experimenter for assistance.

Appendix D. Random Punishment Group Instructions and Experimental

This is a decision-making experiment, please read the instructions carefully as your decision will determine the profit for you and the other team members.
This experiment consists of several rounds in which you and three other team members form a temporary team during the game. Each team member will be given 20 tokens as capital in each round, which will be converted into actual profit in a specific ratio at the end of the experiment. You need to decide how many tokens Xn to put into the public account each round (0 ≤ Xn ≤ 20, Xn is an integer). The tokens you gain at the end of each round consist of two parts:
1. Tokens are not put into the public account each round, which is (20 − Xn).
2. The total number of tokens put into the public account by all team members is multiplied by 1.6 and shared, resulting in 1.6 × (X1 + X2 + X3 + X4) ÷ 4.
3. The total tokens you gain in each round: (20 − Xn) + 1.6 × (X1 + X2 + X3 + X4) ÷ 4.
Punishment shows up in each round randomly, if the tokens you give are lower than the average tokens given by the team(Xn < Xa), your profit will be deducted by some tokens(Xp). Therefore your final profit: (20 − Xn) + 1.6 × (X1 + X2 + X3 +X4 ) ÷ 4 – Xp. Therefore, there is no punishment if the tokens you give are higher than the average.
Example B3:
1. If all 4 team members contribute 20 tokens to the public account, each member’s profit equals (20 − 20) + 1.6 × (20 + 20 + 20 + 20) ÷ 4 = 32 tokens.
2. If 3 team members give 20 tokens to the public account, and 1 gives 0 tokens, the profit for the team members who give 20 tokens: (20 − 20) + 1.6 × (20 + 20 + 20 + 0) ÷ 4 = 24 tokens.
3. The profit for the team member who gives 0 tokens: (20 − 0) + 1.6 × (20 + 20 + 20 + 0) ÷ 4 = 44 tokens.
The feedback receives after each round:
1. Total tokens given by your team
2. Tokens you give.
3. Whether you are punished.
4. Tokens you gained in this round, then you will move to the next round.
To determine whether you fully understand the above experimental explanation, please complete the two mini-tests below and enter your answers into the computer by selecting "Check Answers":
1. If the other 3 team members give 5, 10, and 15 tokens respectively, and you give 20 tokens (4 people totaling 50 tokens), how many tokens will you receive in this round?
2. If the other 3 team members give 10, 15, and 20 tokens respectively, and you give 5 tokens (4 people totaling 50 tokens), how many tokens will you receive in this round?
If you have any questions, please contact the experimenter for assistance.

References

  1. Boyd, R.; Gintis, H.; Bowles, S.; Richerson, P. J. The evolution of altruistic punishment. Proceedings of the National Academy of Sciences of the United States of America, 2003, 6, 3531-3531.
  2. Isakov, A.; Rand, D. G. The Evolution of Coercive Institutional Punishment. Dynamic Games & Applications, 2012, 2, 97-109. [CrossRef]
  3. Sasaki, T. ;Uchida, S. The evolution of cooperation by social exclusion. Proceedings of the Royal Society B Biological Sciences, 2013, 1752, 20122498.
  4. Mathew, S.; Boyd, R. The cost of cowardice: punitive sentiments towards free riders in Turkana raids. Evolution & Human Behavior, 2014, 1, 58-64. [CrossRef]
  5. Lewis, D. M.; Al-Shawaf, L.; Conroy-Beam, D.; Asao, K.; Buss, D. M. Evolutionary psychology: A how-to guide. American Psychologist, 2017, 4, 353-373. [CrossRef]
  6. Seiffert-Brockmann, J. Evolutionary Psychology: A Framework for Strategic Communication Research. International Journal of Strategic Communication, 2018, 4, 417-432. [CrossRef]
  7. Narvaez, D.; Moore, D. S.; Witherington, D. C.; Vandiver, T. I.; Lickliter, R. Evolving Evolutionary Psychology. American Psychologist, 2021, 3, 424-438. [CrossRef]
  8. Fehr, E.; Gächter, S. Altruistic punishment in. Nature, 2002, 6868, 137-140.
  9. Burton-Chellew, M. N.; Guérin, C. Self-interested learning is more important than fair-minded conditional cooperation in public-goods games. Evolutionary Human Sciences, 2022, 4, 1-29. [CrossRef]
  10. Hamilton, W.D. The genetical evolution of social behaviour. II. Journal of Theoretical Biology, 1964, 1, 17-52.
  11. Trivers, R. The Evolution of Reciprocal Altruism. Quarterly Review of Biology, 1971, 1, 35-57. [CrossRef]
  12. Nowak, M.A.; Sigmund, k. Evolution of indirect reciprocity by image scoring. Nature, 1998, 6685, 573-577. [CrossRef]
  13. Gintis, H.; Smith, E. A.; Bowles, S. Costly Signaling and Cooperation. Journal of Theoretical Biology, 2001, 1, 103-119. [CrossRef]
  14. Wu, J.; Luan, S.; Raihani, N. Reward, punishment, and prosocial behavior: Recent developments and implications. 2022, 44, 117-123. [CrossRef]
  15. Andreoni, J.; Harbaugh, W.; Vesterlund, L. The Carrot or the Stick: Rewards, Punishments, and Cooperation. The American economic review, 2003, 3, 893-902. [CrossRef]
  16. Almenberg, J.; Dreber, A.; Apicella, C.; Rand, D. G. Third Party Reward and Punishment: Group Size, Efficiency and Public Goods. Social Science Electronic Publishing, 2010.
  17. Wu, J.; Balliet, D.; Peperkoorn, L. S.; Romano, A.; Van Lange, P. A. Cooperation in groups of different sizes: the effects of punishment and reputation-based partner choice. Frontiers in Psychology, 2020, 10, 2956. [CrossRef]
  18. Ozono, H.; Kamijo, Y.; Shimizu, K. The role of peer reward and punishment for public goods problems in a localized society. Scientific Reports, 2020, 1. [CrossRef]
  19. Xiao, J.; Liu, L.; Chen, X.; Szolnoki, A. Evolution of cooperation driven by sampling punishment. Physics Letters A, 2023, 475, 128879. [CrossRef]
  20. Diekmann, A.; Przepiorka, W. Punitive preferences, monetary incentives and tacit coordination in the punishment of defectors promote cooperation in humans. Scientific Reports, 2015, 1, 10321. [CrossRef]
  21. Gachter, S.; Renner, E.; Sefton, M. The long-run benefits of punishment. Science (New York, N.Y.), 2008. [CrossRef]
  22. Nikiforakis, N.; Normann, H. T A Comparative Statics Analysis of Punishment in Public-Good Experiments. Social Science Electronic Publishing, 2008, 11, 358-369.
  23. Ozono, H.; Kamijo, Y.; Shimizu, K. Punishing second-order free riders before first-order free riders: The effect of pool punishment priority on cooperation. Scientific reports, 2017, 1, 14379. [CrossRef]
  24. Shinada, M., & Yamagishi, T. Punishing free riders: direct and indirect promotion of cooperation. Evolution & Human Behavior, 2008, 2, 147-147.
  25. Jean-Richard-Dit-Bressel, P.; Killcross, S.; McNally, G. P. Behavioral and neurobiological mechanisms of punishment: implications for psychiatric disorders. Neuropsychopharmacology, 2018, 8, 1. [CrossRef]
  26. Sasaki, T.; Brännström, Å.; Dieckmann, U.; Sigmund, K. The take-it-or-leave-it option allows small penalties to overcome social dilemmas. Proceedings of the National Academy of Sciences, 2012, 4, 1165-1169. [CrossRef]
  27. Zhu, P.; Guo, H.; Zhang, H.; Han, Y.; Wang, Z.; Chu, C. The role of punishment in the spatial public goods game. Nonlinear Dynamics, 2020, 6983, 1-10. [CrossRef]
  28. Ohdaira, T. The probabilistic pool punishment proportional to the difference of payoff outperforms previous pool and peer punishment. Scientific Reports, 2022, 1, 6604. [CrossRef]
  29. Ozono, H.; Jin, N.; Watabe, M.; Shimizu, K. Solving the second-order free rider problem in a public goods game: An experiment using a leader support system. 2016, 6, 38349. [CrossRef]
  30. Rand, D. G.; Nowak, M. A. The evolution of antisocial punishment in optional public goods games. Nature Communications, 2011, 2, 434. [CrossRef]
  31. Perc, M.; Jordan, J. J.; Rand, D. G.; Wang, Z.; Boccaletti, S.; Szolnoki, A.Statistical physics of human cooperation. Social Science Electronic Publishing, 2017, 1, 687-51. [CrossRef]
  32. Nakashima, N. A.; Halali, E.; Halevy, N. Third parties promote cooperative norms in repeated interactions. Journal of Experimental Social Psychology, 2017, 68, 212-223. [CrossRef]
  33. Peysakhovich, A., & Rand, D. G. Habits of Virtue: Creating Norms of Cooperation and Defection in the Laboratory. Management Science, 2016, 3, 631-647. [CrossRef]
  34. Dannenberg, A.; Gallier, C. The choice of institutions to solve cooperation problems: a survey of experimental research. Experimental Economics, 2020, 3, 716-749. [CrossRef]
  35. Decker, T.; Stiehler, A.; Strobel, M. A Comparison of Punishment Rules in Repeated Public Good Games: An Experimental Study. Journal of Conflict Resolution, 2003, 6, 751-772.
  36. Fatas, E.; Morales, A. J.; Ubeda, P.An experimental analysis of random punishment in team production. Journal of Economic Psychology, 2010, 3, 358-373. [CrossRef]
  37. Skinner, B. F. Science and human behavior (No. 92904). Simon and Schuster, 1965.
  38. Baldassarri, D.; Grossman, G. Centralized sanctioning and legitimate authority promote cooperation in humans. Proceedings of the National Academy of Sciences of the United States of America, 2011, 27, 11023-11027.
  39. Gao, L.; Wang, Z.; Pansini, R.; Li, Y. T.; Wang, R. W. Collective punishment is more effective than collective reward for promoting cooperation. Scientific Reports, 2015, 1, 17752. [CrossRef]
  40. Fischbacher, U. z-Tree: Zurich toolbox for ready-made economic experiments. Experimental Economics, 2007, 2, 171-178. [CrossRef]
  41. Balliet, D.; Mulder, L. B.; Van Lange, P. A. Reward, Punishment, and Cooperation: A Meta-Analysis. Psychological Bulletin, 2011, 4, 594-615. [CrossRef]
  42. Fehr, E.; Gächter, S. Cooperation and Punishment in Public Goods Experiments. American Economic Review, 2000, 4, 980-994.
  43. Sigmund, K.; De Silva, H., Traulsen, A.; Hauert, C. Social learning promotes institutions for governing the commons. Nature, 2010, 7308, 861-863. [CrossRef]
  44. Dong, Y.; Zhang, B.; Tao, Y. The dynamics of human behavior in the public goods game with institutional incentives. Scientific Reports, 2016, 6, 28809. [CrossRef]
  45. Gurerk, O.; Irlenbusch, B.; Rockenbach, B. The competitive advantage of sanctioning institutions. Science, 2006, 5770, 108-111. [CrossRef]
  46. Fischbacher, U.; Gächter, S. Social Preferences, Beliefs, and the Dynamics of Free Riding in Public Goods Experiments. The American economic review, 2010, 1, 541-556. [CrossRef]
  47. Kahneman, D.; Tversky, A. Prospect theory: An analysis of decision under risk. In Handbook of the fundamentals of financial decision making, 2013, 1, 99-127.
  48. Tversky, A.; Kahneman, D. Loss Aversion in Riskless Choice: A Reference-Dependent Model. The Quarterly Journal of Economics, 1991, 4, 1039-1061.
Figure 1. Pairwise comparison of cooperation levels between the 4 punishment groups and the control group. G: control group, r1p: low punishment group, r3p: high punishment group, r1rp: random punishment group, r3rp: high random punishment group. Source: Authors’ compilation.
Preprints 137584 g001
Figure 2. Trend of the average contribution of the 5 treatment groups. G: control group, r1p: low punishment group, r3p: high punishment group, r1rp: random punishment group, r3rp: high random punishment group. Source: Authors’ compilation.
Preprints 137584 g002
Figure 3. The proportion of high/low contributors in the punishment group. (G): Control group (a): High-intensity punishment group, (b): Low-intensity punishment group, (c): High random punishment group, (d): Low random punishment group. Source: Authors’ compilation.
Preprints 137584 g003
Figure 4. Scatter plot of contribution distribution for r1p and r3p. The X-axis represents the contribution value of the subject in the t round, the Y-axis stands for the contribution value of the subjects in the t+1 round, the light blue scatter plot represents the low-intensity punishment group (r1p), and the deep blue scatter represents the high-intensity punishment group (r3p). Source: Authors’ compilation.
Preprints 137584 g004
Figure 5. Pairwise comparison chart of profit levels among different treatment groups, G: control group, r1p: low-intensity punishment group, r3p: high-intensity punishment group, r1rp: low random punishment group, r3rp: high random punishment group. Source: Authors’ compilation.
Preprints 137584 g005
Figure 6. Trend chart of average profit for the control group and punishment groups. G: control group, r1p: low-intensity punishment group, r3p: high-intensity punishment group, r1rp: random punishment group, r3rp: high random punishment group. Source: Authors’ compilation.
Preprints 137584 g006
Table 1. The number and proportion of free-riders in the punishment groups and the control group.
Group Free-riders Cooperators Percentage of free-riders
G 123 837 12.81%
r1p 43 917 4.48%
r3p 8 952 0.83%
r1rp 51 909 5.31%
r3rp 15 945 1.56%
Note. G: control group, r1p: low punishment group, r3p: high punishment group, r1rp: random punishment group, r3rp: high random punishment group.
Table 2. Comparison of the proportion of free-riders between the punishment groups and the control group(chi-square).
Group G r1p r3p r1rp r3rp
G 0 41.16*** 108.35*** 32.76*** 91.07***
r1p - 0 24.68*** 0.00 -
r3p - - 0 - 2.16
r1rp - - - 0 20.34***
r3rp - - - - 0
Note. Significance levels: ***p<0.001. G: control group, r1p: low punishment group, r3p: high punishment group, r1rp: random punishment group, r3rp: high random punishment group.
Table 5. OLS regression analysis of the contribution levels of the punishment group and reward treatment group.
Model Dependent variable: Contribution of this round
Punishment
Round 0.02*
The contribution of the previous round 0.63***
The profit of the previous round 0.12***
The punishment of the previous round 0.16***
Intensity 0.56***
Randomness -0.74***
Constant 2.19***
R 2 0.42
N 128
Note The regression model is based on data from round 2 to round 30, Dummy variables: Intensity and randomness, *p<0.05, **p<0.01, ***p<0.001, R² is the coefficient of determination, which is a statistical measure that ranges from 0 to 1, N represents the size of the subjects.
Disclaimer/Publisher’s Note: The statements, opinions and data contained in all publications are solely those of the individual author(s) and contributor(s) and not of MDPI and/or the editor(s). MDPI and/or the editor(s) disclaim responsibility for any injury to people or property resulting from any ideas, methods, instructions or products referred to in the content.
Copyright: This open access article is published under a Creative Commons CC BY 4.0 license, which permit the free download, distribution, and reuse, provided that the author and preprint are cited in any reuse.
Alerts
Prerpints.org logo

Preprints.org is a free preprint server supported by MDPI in Basel, Switzerland.

Subscribe

© 2025 MDPI (Basel, Switzerland) unless otherwise stated