Submitted:
27 October 2024
Posted:
28 October 2024
Read the latest preprint version here
Abstract
Keywords:
Introduction
Methodology

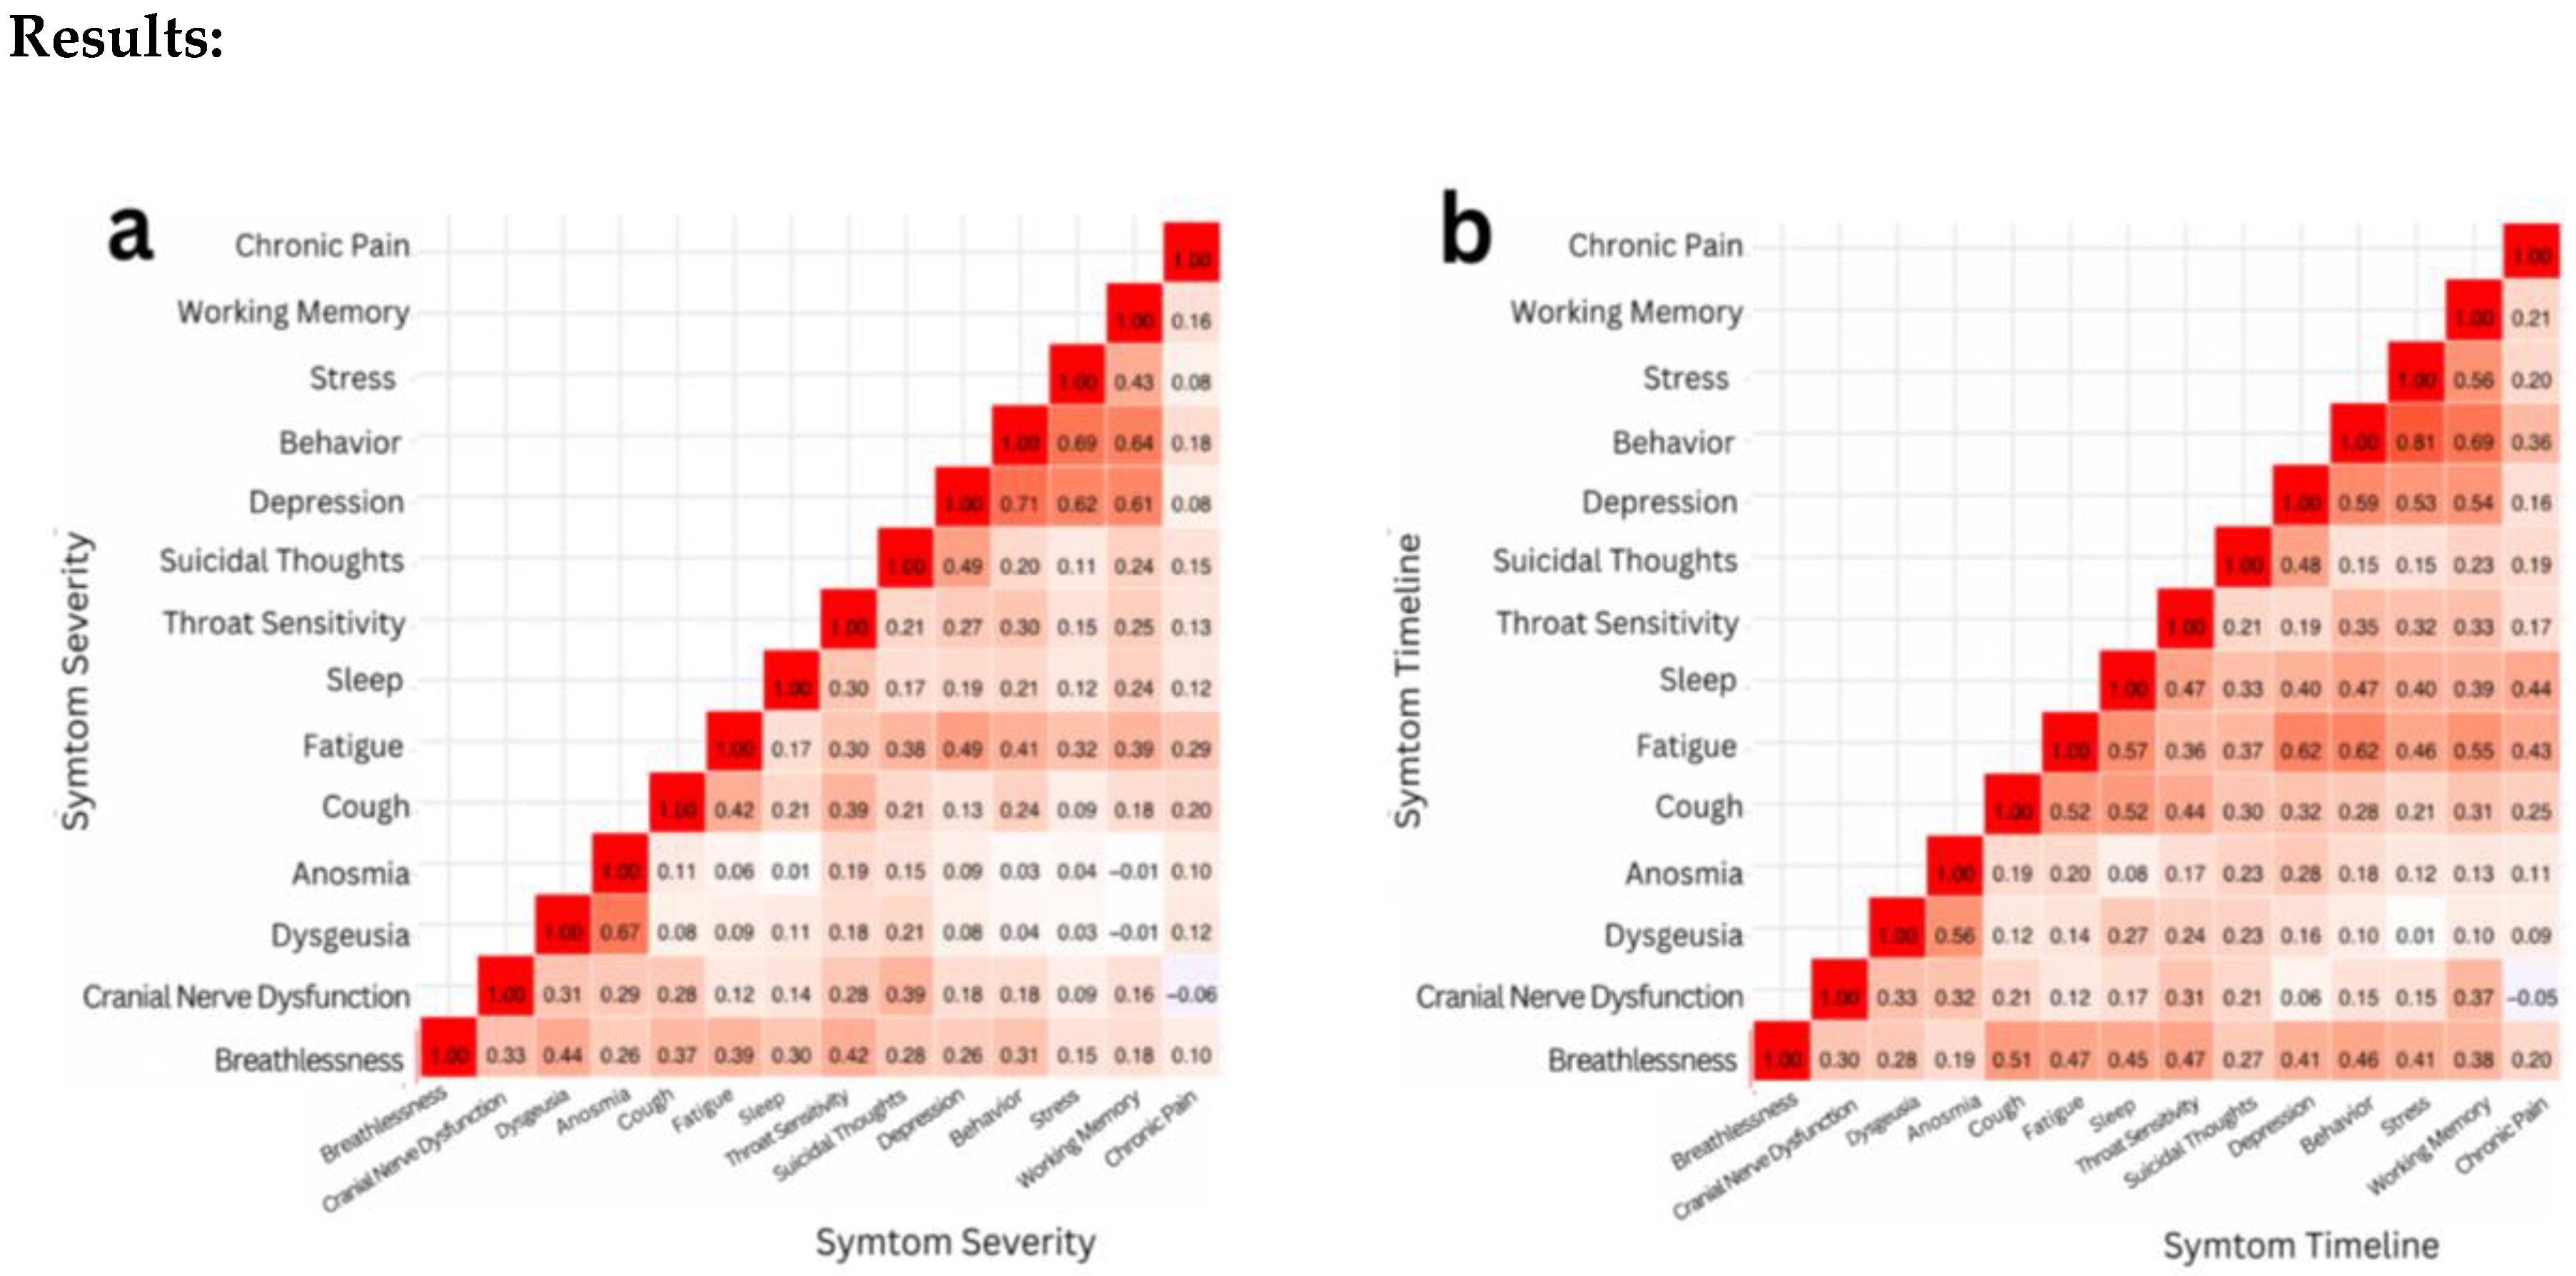

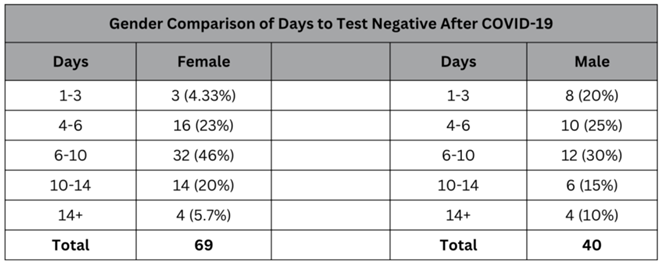
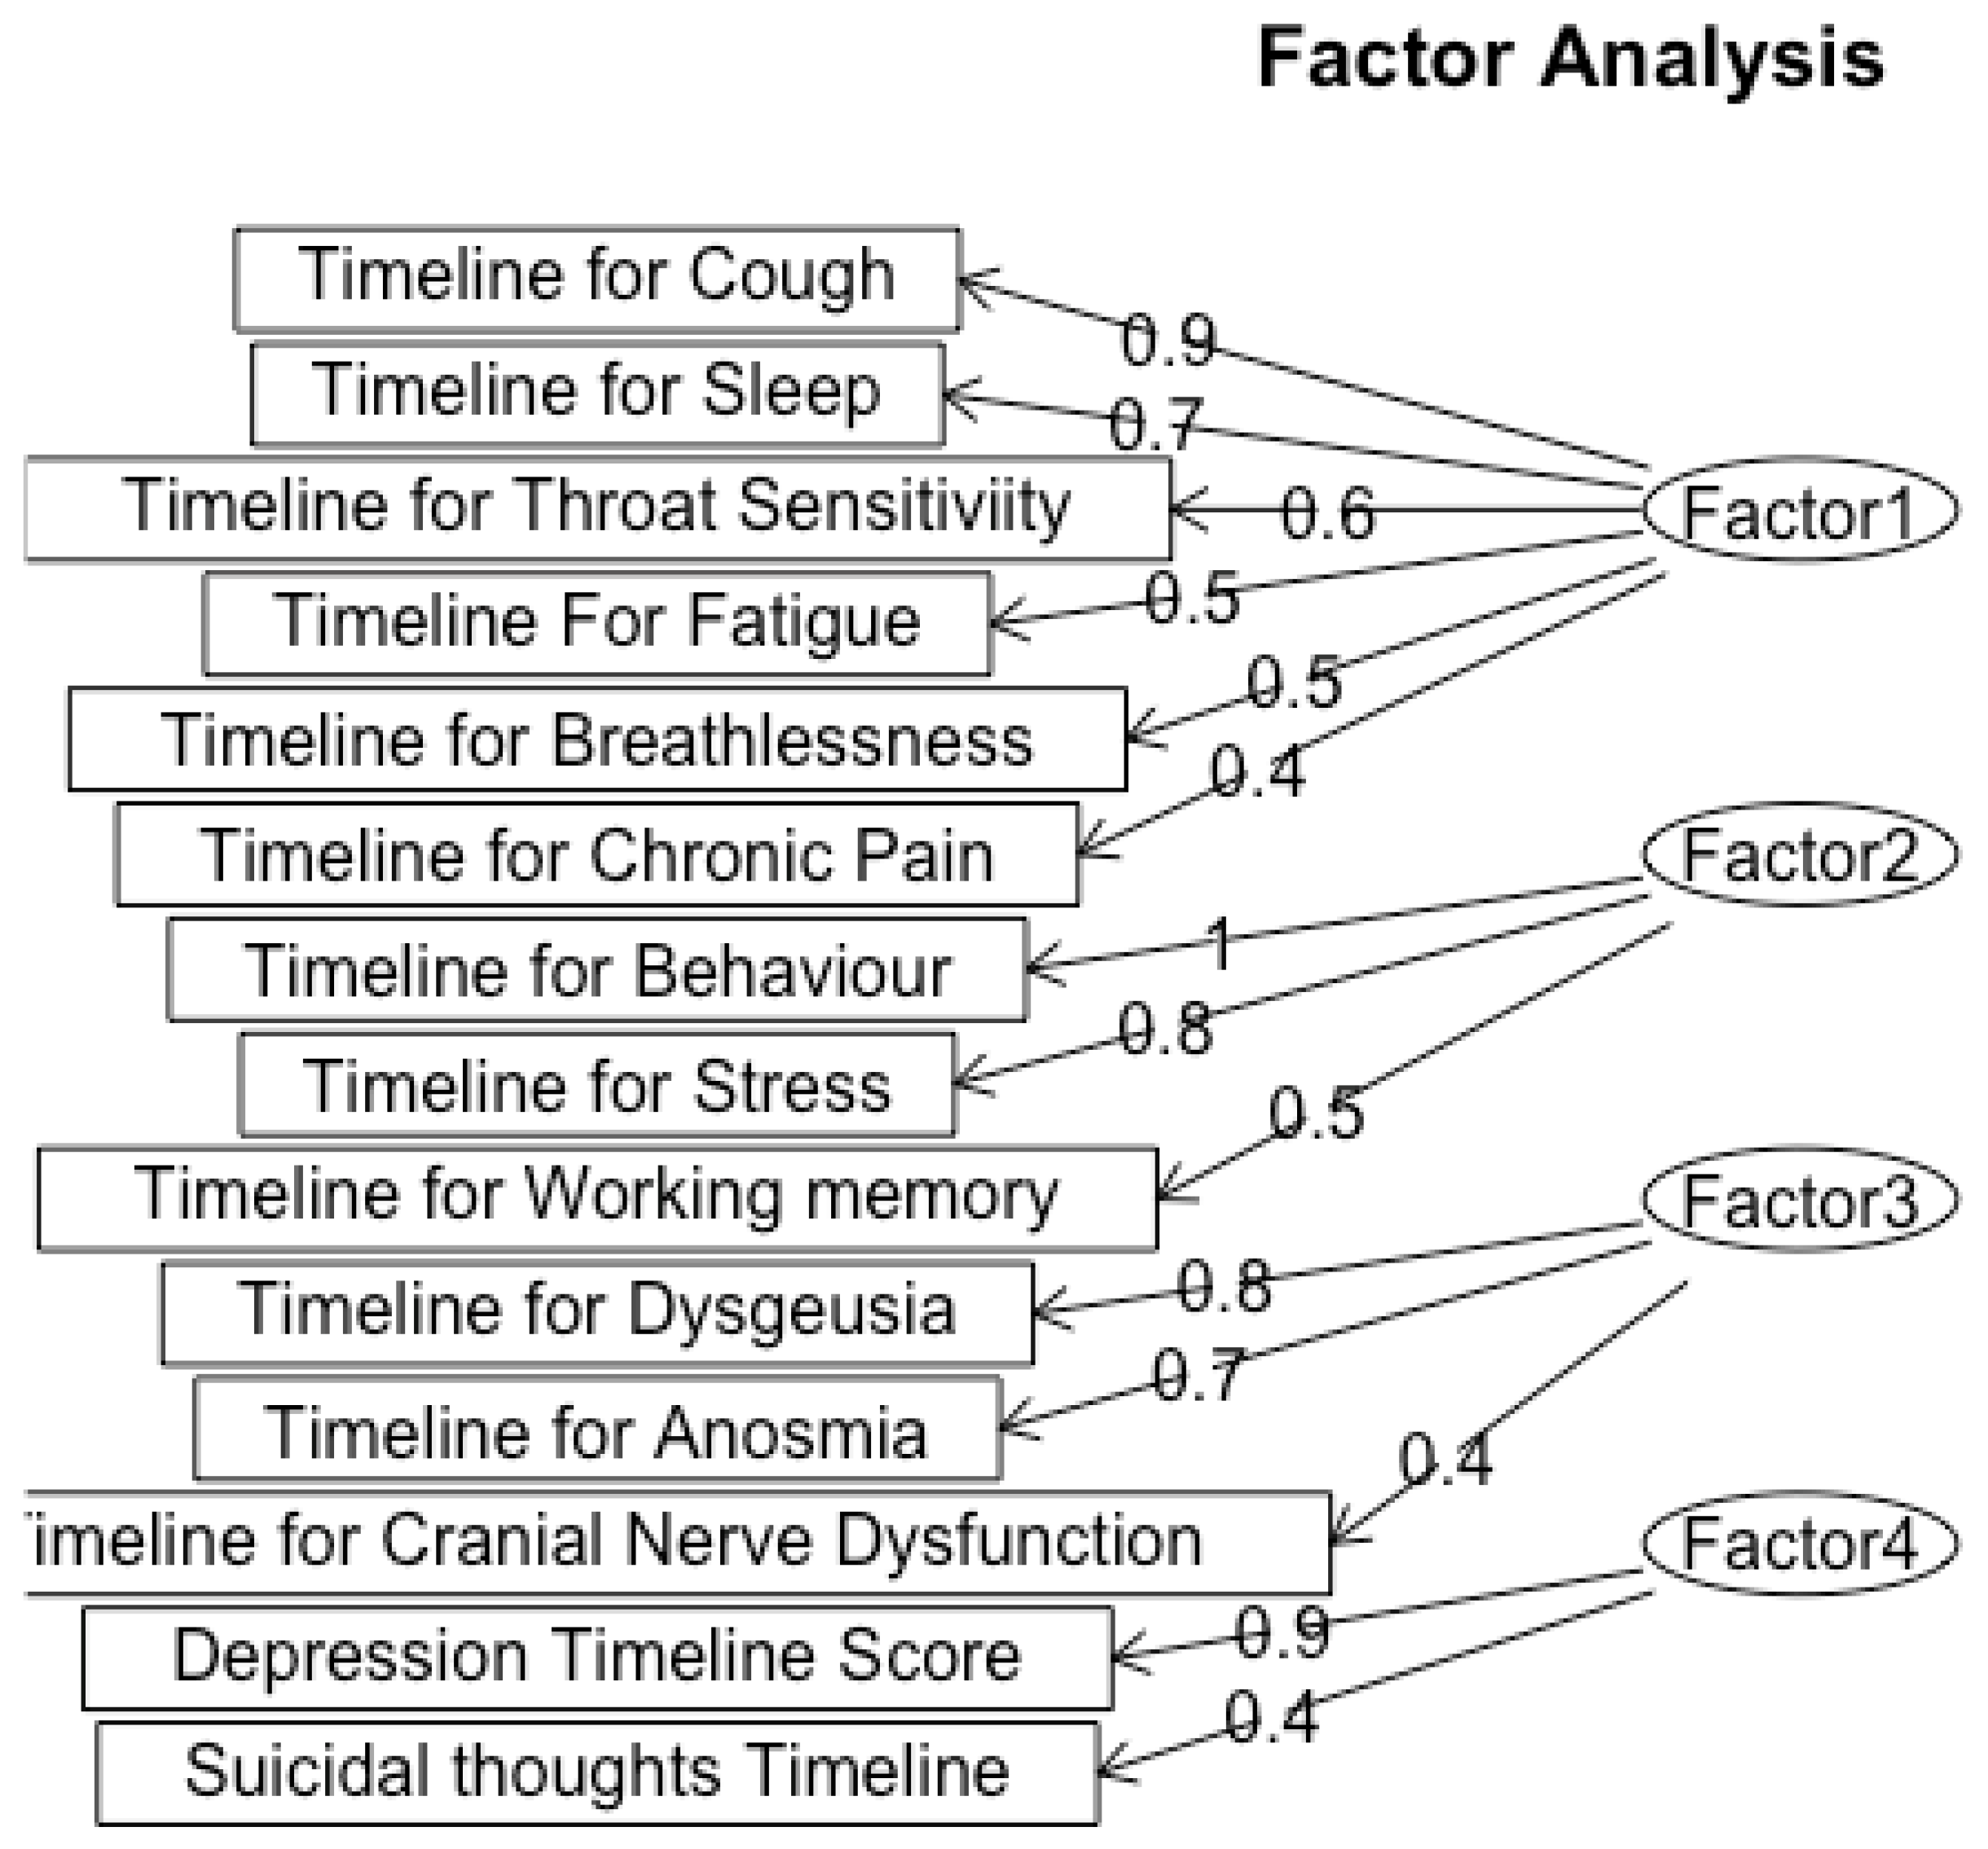
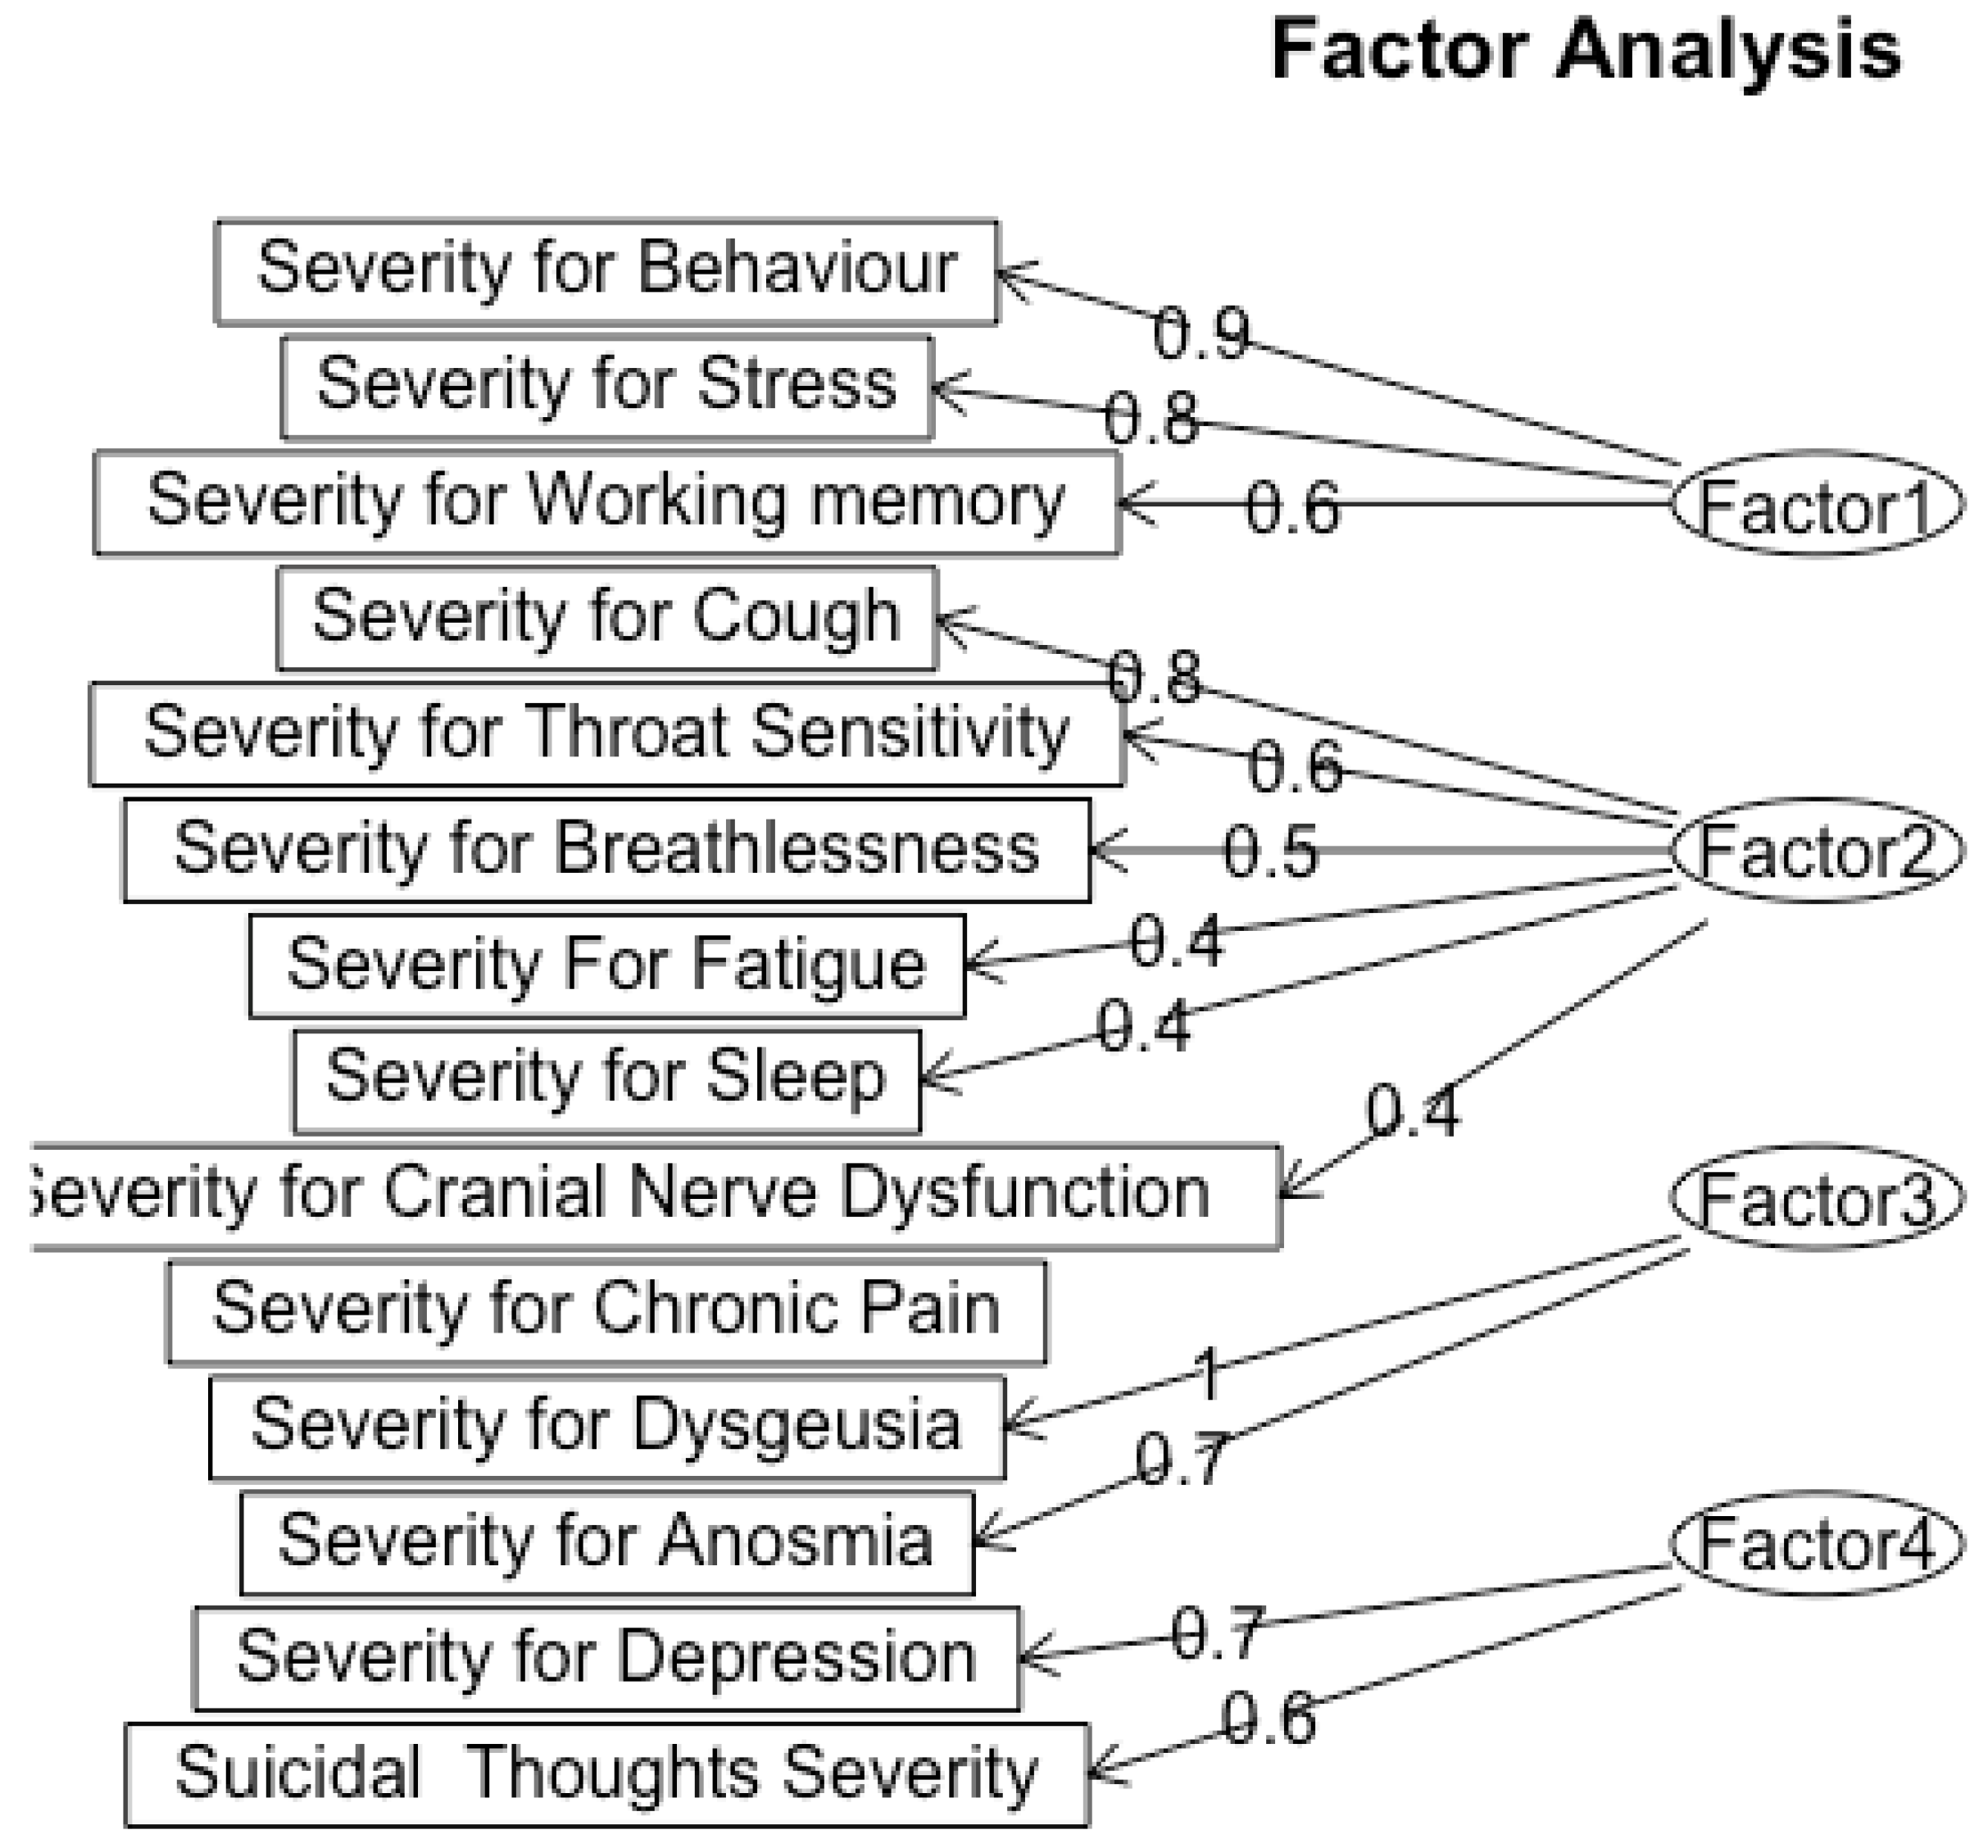
Discussion and Limitations
Conclusions
Author Contributions
Funding Information
Acknowledgments
Conflicts of Interest
References
- WHO COVID-19 dashboard. Available online: https://data.who.int/dashboards/covid19/cases?n=c (accessed on 16 June 2024).
- People with Certain Medical Conditions and COVID-19 Risk Factors. Available online: https://www.cdc.gov/covid/risk-factors/?CDC_AAref_Val=https://www.cdc.gov/coronavirus/2019-ncov/need-extra-precautions/people-with-medical-conditions.html (accessed on 16 June 2024).
- Dutta, S.S. Why Can Women Fight COVID-19 Better Than Men?. Available online: https://www.news-medical.net/health/Why-Can-Women-Fight-COVID-19-Better-Than-Men.aspx#:~:text=A%20growing%20pool%20of%20evidence,higher%20in%20men%20than%20women (accessed on 16 June 2024).
- Estrada, L.V.; Levasseur, J.L.; Maxim, A.; Benavidez, G.A.; Pollack Porter, K.M. Structural Racism, Place, and COVID-19: A Narrative Review Describing How We Prepare for an Endemic COVID-19 Future. Health Equity 2022, 6(1): 356–366, https://doi.org/10.1089/heq.2021.0190 (accessed on 16 June 2024).
- How many people have long COVID?. Available online: https://usafacts.org/articles/how-many-people-have-long-covid/ . (accessed on 16 June 2024).
- Adjaye-Gbewonyo, D.; Vahratian, A.; Perrine, CG.; Bertolli, J. Long COVID in adults: United States, 2022. CDC 2023, ID# 132417, 2, Available online: https://dx.doi.org/10.15620/cdc:132417 (accessed on 16 June 2024).
- Stroop Test. Available online: https://josieking.org/patientsafety/module_e/stroop_test.html (accessed on 16 June 2024).
- Coy, K.; Hoffman, N. Big Data Analytics under HIPAA. Available online: https://www.agg.com/news-insights/publications/big-data-analytics-under-hipaa-03-17-2016/ (accessed on 22 June 2024).
- Brief Suicide Safety Assesment. Available online: https://www.nimh.nih.gov/sites/default/files/documents/research/research-conducted-at-nimh/asq-toolkit-materials/adult-outpatient/bssa_outpatient_adult_asq_nimh_toolkit.pdf (accessed on 14 August 2022).
- Ergin, G.; Yildirim, Y. A validity and reliability study of the Turkish Checklist Individual Strength (CIS) questionnaire in musculoskeletal physical therapy patients. Physiotherapy Theory and Practice 2012, 28, 624–632. [CrossRef]
- Bennett, R.M., Friend, R., Jones, K.D.; Ward, R.; Han, B.K., Ross, R.L.; et al. The Revised Fibromyalgia Impact Questionnaire (FIQR): validation and psychometric properties. Arthritis Res Ther 2009, 11. [CrossRef]
- Besnier, F.; Bérubé, B.; Malo, J.; Gagnon, C.; Grégoire, C.-A.; Juneau, M.; Simard, F.; L’Allier, P.; Nigam, A.; Iglésies-Grau, J.; et al. Cardiopulmonary Rehabilitation in Long-COVID-19 Patients with Persistent Breathlessness and Fatigue: The COVID-Rehab Study. Int. J. Environ. Res. Public Health 2022, 19. [CrossRef]
- Health Insurance Portability and Accountability Act of 1996 (HIPAA). Available Online: https://www.cdc.gov/phlp/php/resources/health-insurance-portability-and-accountability-act-of-1996-hipaa.html?CDC_AAref_Val=https://www.cdc.gov/phlp/publications/topic/hipaa.html (accessed on 24 August 2022).
- Individuals’ Right under HIPAA to Access their Health Information 45 CFR § 164.524. Available Online: https://www.hhs.gov/hipaa/for-professionals/privacy/guidance/access/index.html (accessed on 24 August 2022).
- El Sayed, S.; Shokry, D.; Gomaa, S.M. Post-COVID-19 fatigue and anhedonia: A cross-sectional study and their correlation to post-recovery period. Neuropsychopharmacol Rep 202, 41, 50-55. [CrossRef]
- Graham, E.L.; Clark, J.R.; Orban, Z.S.; Lim, P.H.; Szymanski, A.L.; Taylor, C.; DiBiase, R.M.; Jia, D.T.; Balabanov, R.; Ho, S.U.; et al. Persistent neurologic symptoms and cognitive dysfunction in non-hospitalized Covid-19 "long haulers". Ann Clin Transl Neurol 2021, 8, 1073-1085. [CrossRef]
- COLLECTION, USE, AND DISCLOSURE LIMITATION. Available Online: https://www.hhs.gov/sites/default/files/ocr/privacy/hipaa/understanding/special/healthit/collectionusedisclosure.pdf (accessed on 24 August 2022).
- Adler, S. HIPAA Data Security Requirements. Available online: https://www.hipaajournal.com/hipaa-data-security-requirements/ (accessed on August 24, 2022).
- Kuut, T.A.; Müller, F.; Aldenkamp, A.; Assmann-Schuilwerve, E.; Braamse, A.; Geerlings, S.E.; Gibney, K.B.; Kanaan, R.A.A.; Nieuwkerk, P.; Olde Hartman, T.C.; et al. A randomised controlled trial testing the efficacy of Fit after COVID, a cognitive behavioural therapy targeting severe post-infectious fatigue following COVID-19 (ReCOVer): study protocol. Trials 2021, 22. [CrossRef]
- Mackay, A. A Paradigm for Post-Covid-19 Fatigue Syndrome Analogous to ME/CFS. Front Neurol 2021, 12. [CrossRef]
- Hafiz, R., Gandhi, T. K., Mishra, S., Prasad, A., Mahajan, V., Di, X., ... & Biswal, B. B. Higher Limbic and Basal Ganglia volumes in surviving COVID-negative patients and the relations to fatigue. medRxiv [Preprint]. 2022 Mar 1:2021.11.23.21266761. Originally published 2021 Nov 24. [Version 2]. [CrossRef]
- Mayo Clinic Staff. Fibromyalgia. Available online: https://www.mayoclinic.org/diseases-conditions/fibromyalgia/diagnosis-treatment/drc-20354785 (accessed on 24 August 2022).
- Nass, S. J., Levit, L. A., & Gostin, L. O. (2009). Beyond the HIPAA privacy rule - NCBI bookshelf. Available online: https://www.ncbi.nlm.nih.gov/books/NBK9578/ (accessed on 27 August 2022).
- Guidance Regarding Methods for De-identification of Protected Health Information in Accordance with the Health Insurance Portability and Accountability Act (HIPAA) Privacy Rule. Available online: https://www.hhs.gov/hipaa/for-professionals/privacy/special-topics/de-identification/index.html#rationale (accessed on August 27, 2022).
- Research. Available online: https://www.hhs.gov/hipaa/for-professionals/special-topics/research/index.html (accessed on 29 August 2022).
- Summary of the HIPAA security rule. Available online: https://www.hhs.gov/hipaa/for-professionals/security/laws-regulations/index.html (accessed on 30 August 2022).
- Ortelli, P., Ferrazzoli, D., Sebastianelli, L., Engl, M., Romanello, R., Nardone, R., ... & Versace, V. Neuropsychological and neurophysiological correlates of fatigue in post-acute patients with neurological manifestations of COVID-19: Insights into a challenging symptom. J Neurol Sci. 2021 Jan 15:420:117271. [CrossRef]
- SCL1201 - section 3: Suicide assessment: Questions to include. Available online: https://www.yourceus.com/pages/scl1201-section-three-suicide-assessment-questions-to-include (accessed on 30 August 2022).
- Sfera, A., Osorio, C., Zapata Martin del Campo, C. M., Pereida, S., Maurer, S., Maldonado, J. C., & Kozlakidis, Z. Endothelial senescence and chronic fatigue syndrome, a COVID-19 based hypothesis. Front Cell Neurosci. 2021 Jun 25:15:673217. [CrossRef]
- Square program (suicide, questions, answers and resources). Available online: https://www.square.org.au/wp-content/uploads/sites/10/2013/05/Questions-to-Assess-Suicide-Risk_May2013_Handout1.pdf (accessed on 30 August 2022).
- Summary of the HIPAA privacy rule.. Available online: https://www.hhs.gov/hipaa/for-professionals/privacy/laws-regulations/index.html (accessed on 30 August 2022).
- Vallat-azouvi, C., & Azouvi, P. The Working Memory Questionnaire: A scale to assess everyday life problems related to deficits of working memory in brain injured patients. Available online: https://www.academia.edu/17625012/The_Working_Memory_Questionnaire_A_scale_to_assess_everyday_life_problems_related_to_deficits_of_working_memory_in_brain_injured_patients (accessed on 30 August 2022).
- Robert L.S., Williams B.W.J., Kroenke K.. Patient Health Questionnaire-9 (PHQ-9). Available online: https://www.phqscreeners.com/images/sites/g/files/g10060481/f/201412/PHQ-9_English.pdf (accessed on 1 September 2022).
- Brain Fog: Solutions to Help You Improve Concentration. Available online: https://www.bangkokhospital.com/en/content/brain-fog-syndrome (accessed on 1 September 2022).
- Long Covid or Post-Covid Conditions. Available online: www.cdc.gov/coronavirus/2019-ncov/long-term-effects/index.html#:~:text=People%20with%20post%2DCOVID%20conditions%20(or%20long%20COVID)%20may,away%20or%20come%20back%20again. (accessed on 1 September 2022).
- Aiyegbusi, O.L.; Hughes, S.E.; Turner, G.; Rivera, S.C.; McMullan, C.; Chandan, J.S.; Haroon, S.; Price, G.; Davies, E.H.; Nirantharakumar, K.; et al.; Symptoms, complications and management of long COVID: a review. J R Soc Med. 2021, 14(9), 428-442. [CrossRef]
- Takao, M.; Ohira, M.; Neurological post-acute sequelae of SARS-CoV-2 infection. Psychiatry Clin Neurosci. 2023, 77(2), 72-83. [CrossRef]
- Shining a Light on Long COVID Brain Fog. Available online: https://covid19.nih.gov/news-and-stories/shining-light-long-covid-brain-fog#:~:text=%E2%80%9CBrain%20fog%E2%80%9D%20is%20a%20 range,also%20known%20as%20Long%20COVID. (accessed on 27 August 2024).
- H. Wickham; ggplot2: Elegant Graphics for Data Analysis; Springer-Verlag New York, 2016.
- Katella, K. Omicron, Delta, Alpha, and More: What To Know About the Coronavirus Variants, Available online: https://www.yalemedicine.org/news/covid-19-variants-of-concern-omicron#:~:text=Omicron%20was%20first%20identified%20in,skyrocket%20to%20over%20a%20million. (accessed on 13 September 2024).
- Bai, F.; Tomasoni, D.; Falcinella, C.; Barbanotti, D.; Castoldi, R.; Mulè, G.; Augello, M.; Mondatore, D.; Allegrini, M.; Cona, A.; et al.; Female gender is associated with long COVID syndrome: a prospective cohort study. Clin Microbiol Infect. 2022; 28(4), 611. [CrossRef]
- Aiyegbusi, O.L.; Hughes, S.E.; Turner, G.; Rivera, S.C.; McMullan, C.; Chandan, J.S.; Haroon, S.; Price, G.; Davies, E.H.; Nirantharakumar, K.; et al.; J R Soc Med. Symptoms, complications and management of long COVID: a review. 2021, 114(9), 428-442. [CrossRef]
- Jensen, A., Stromme, M., Moyassari, S., Chadha, A. S., Tartaglia, M. C., Szoeke, C., & Ferretti, M. T. (2022). COVID-19 vaccines: Considering sex differences in efficacy and safety. Contemporary Clinical Trials, 115. [CrossRef]
- Skaik, Y. The bread and butter of statistical analysis “t-test”: Uses and misuses. Pak J Med Sci. 2015 Nov-Dec;31(6):1558–1559. [CrossRef]
- Tae Kyun Kim, K.T. Understanding one-way ANOVA using conceptual figures. JKorean J Anesthesiol. 2017 Jan 26;70(1):22–26. [CrossRef]
Disclaimer/Publisher’s Note: The statements, opinions and data contained in all publications are solely those of the individual author(s) and contributor(s) and not of MDPI and/or the editor(s). MDPI and/or the editor(s) disclaim responsibility for any injury to people or property resulting from any ideas, methods, instructions or products referred to in the content. |
© 2024 by the authors. Licensee MDPI, Basel, Switzerland. This article is an open access article distributed under the terms and conditions of the Creative Commons Attribution (CC BY) license (http://creativecommons.org/licenses/by/4.0/).


