
Submitted:
26 October 2024
Posted:
28 October 2024
You are already at the latest version
Abstract
Background:Lower socioeconomic status (SES) has been associated with increased mortality from coronary heart disease. This excess risk, relative to affluent patients, may be due to a combination of more adverse cardiovascular‐risk factors, inequalities in access to cardiac investigations, longer waiting times for cardiac revascularisation and lower use of secondary prevention drugs. We sought to investigate whether socio-economic status influenced long-term all-cause mortality after PCI in a large metropolitan city (London), which serves a population of 11 million people with a mixed social background over a 10-year period. Methods: We conducted an observational cohort study of 123,780 consecutive PCI procedures from the Pan-London (United Kingdom) PCI registry. This data set is collected prospectively and includes all patients treated between January 2005 to December 2015. The database includes PCI performed for stable angina and ACS (ST-elevation myocardial infarction (STEMI), non-ST elevation myocardial infarction (NSTEMI) and unstable angina). Patient socio-economic status was defined by the English Index of Multiple Deprivation (IMD) score, according to residential postcode. Patients were analysed by quintile of IMD score (Q1, least deprived; Q5, most deprived). Median follow-up was 3.7 (IQR: 2.0-5.1) years and the primary outcome was all-cause mortality. Results: The mean age of the patients was 64.3±12.1 years and 25.2% were female. 22.4% of patients were diabetic and 27.3% had a history of previous myocardial infarction. The rates of long-term all-cause mortality increased progressively across quintiles of IMD score, with patients in Q5 showing significantly higher long-term mortality rates compared with patients in Q1 (p=0.0044). This persisted following the inclusion of a propensity score in the proportional hazard model as a covariate (HR for Q5 compared to Q1: 1.15 [95% CI: 1.10-1.42]). Conclusion: This study has demonstrated that low SES is an independent predictor of adverse clinical outcomes following PCI for in a large diverse metropolitan city of London. Hence, attention to reduce the burden of cardiovascular risk factors and improve primary prevention, particularly in patients with lower SES, is required.
Keywords:
Socioeconomic Status
Introduction
Cardiovascular disease (CVD) remains the leading cause of death in the United Kingdom and worldwide despite significant advances in treatments made in the past century. Lower socioeconomic status (SES) is associated with the development of CVD and appears to convey a risk independent of standard risk factors [1,2]. Those with lower SES not only bear a greater burden of CVD, but also appear to have disproportionately worse outcomes especially after acute coronary syndromes (ACS). Data from Denmark found that, even in a country with a universal, tax-financed health care system, patients with lower SES undergoing primary percutaneous coronary intervention (PCI) had worse outcomes than those with more resources [3], findings also replicated in data from Canada [4]. However, other studies have shown that lower SES patients have greater co-morbidities and longer reperfusion times resulting in comparable outcomes when these are accounted for [5]. This potential excess risk, relative to affluent patients, may be due to a combination of more adverse cardiovascular-risk factors [6], inequalities in access to cardiac investigations [7–9], longer waiting times for cardiac revascularisation [10] and lower use of secondary prevention drugs [11,12]. The effect of lower SES on outcome after PCI for coronary artery disease is less well established with studies both for and against the association [13,14].
Aims
We therefore investigated to see if SES status influenced procedural outcomes and long-term all-cause mortality after PCI in a large cohort of patients from London, which serves a diverse population with a mixed social background.
Methods
We conducted an observational cohort study of 123,780 consecutive PCI procedures from the Pan-London (United Kingdom) PCI registry. This data set is collected prospectively and includes all patients treated by PCI in London, United Kingdom between January 2005 to December 2015. The database includes all patients undergoing PCI performed for stable angina and ACS (ST-elevation myocardial infarction (STEMI), non-ST elevation myocardial infarction (NSTEMI) and unstable angina).
Pan-London PCI Registry
Information about every PCI in the UK procedure is recorded via The UK British Cardiac Intervention Society (BCIS) audit [15]. The database is part of the suite of datasets collected under the auspices of the National Institute for Cardiovascular Outcomes Research (NICOR) and is compliant with UK data protection legislation. Within The Pan-London (United Kingdom) PCI registry, all patients that are treated by PCI in the 9 PCI Centers within the London (England, UK) are included. This includes a population of 8.98 million. The nine tertiary cardiac centres in London include Barts Heart Centre (Barts Health NHS Trust), Kings College Hospital (King’s College Hospital NHS Foundation Trust), St Georges Hospital (St Georges Healthcare NHS Foundation Trust), Hammersmith Hospital (Imperial College Healthcare NHS Foundation Trust), Royal Brompton and Harefield Hospitals (Royal Brompton & Harefield NHS Foundation Trust), Guys & St. Thomas’ Hospital (St Thomas' NHS Foundation Trust), and the Heart Hospital (UCL Hospitals NHS Foundation Trust) Royal Free Hospital (Royal Free NHS Foundation Trust) The registry contains data on 123,780 patients who underwent PCI from 2005 – 2015. The anonymised databases of the 9 London centres, that collect data based on the BCIS dataset were merged. The BCIS audit is part of a national mandatory audit that all UK PCI centres participate in. PCI is defined as the use of any coronary device to approach, probe or cross one or more coronary lesions, with the intention of performing a coronary intervention [15]. At each hospital, there is prospective collection of data. The data are encrypted electronically and then transferred online to a central database. Every patient entry offers details of the patient journey, including the method and timing of admission, inpatient investigations, results, treatment and outcomes. Information regarding Patients’ survival is obtained by linkage of patients' National Health Service (NHS) numbers to the Office of National Statistics (ONS), which records live/death status and the date of death for all deceased patients. At the time of the procedure and during the admission, patient and procedural details were recorded into the individual centre’s local BCIS database. Anonymous datasets with linked mortality data from the ONS were merged for analysis from the 9 centres.
Study Population and Procedures
We collected patient demographic characteristics including age, left ventricular function, smoking status, previous myocardial infarction (MI), previous revascularisation (PCI and Coronary Artery Bypass Grafting), New York Heart Association classification, and indications for PCI. Further data included presence of hypercholesterolemia, hypertension, cardiogenic shock, diabetes mellitus, pre-procedural cardiac arrest, peripheral vascular disease (PVD) and chronic kidney disease (CKD, defined as Creatinine >200 micromol/L, or renal replacement therapy). We have also collected technical aspects of the PCI procedure and adverse outcomes, including complications up to the time of hospital discharge. All patients undergoing PCI were loaded with either clopidogrel (300-600 mg), ticagrelor (180mg), prasugrel (60mg) and aspirin (300 mg) prior to their PCI procedures. The P2Y12 inhibitor was typically continued for one year if they had a DES implanted or if they had PCI for an MI or 1 month if they had a BMS inserted. It was to the discretion of the interventional cardiologist performing the procedure to decide whether adjunctive pharmacology (GPIIb/IIIa inhibitors, bivalirudin, heparin and thrombolysis) was required for the procedure. Coronary artery disease was classified by severity of luminal narrowing (0%, 1-49%, 50-74%, 75-94%, 95-99%, or 100%) and by vessel affected (e.g. Left anterior descending).
Socio-Economic Status
Using the residential postal code, routinely collected as part of the dataset for the 2010 version of the English Index of Multiple Depravation (IMD) Score [16], the socio-economic status of each patient was calculated. The IMD Score is a vigorous index of deprivation which divides England into 32,482 small geographical areas, each of which contains about 1,500 residents, and grants them a score for seven domains (health and disability, income, education and training, employment, housing and services, crime and living environment) according to information obtained from the 2010 national census. Each of the domains were weighted and then pooled to provide a single measure of deprivation for each geographical area. There have been a number of studies that have used IMD scores to investigate relationships between socio-economic factors and health outcomes, such as disease presentation [17], life expectancy [18], equity of access to care [19], and post-surgical mortality [18]
Clinical Outcomes
All data was entered prospectively into an electronic database at the time of the PCI procedure. The data included patient characteristics, procedural details and complications. The primary outcome was all-cause mortality assessed at a median follow-up of 3.7 (IQR: 2.0- 5.1) years. Procedural complications and major adverse cardiac events (MACE) were again recorded prospectively. MACE events were defined as death, MI and repeat target vessel revascularisation. All-cause mortality status was recorded as of the 10th August 2018 and obtained from the British Cardiovascular Intervention Society (BCIS) national database, part of the National Institute of Cardiovascular Outcomes Research (NICOR). This national database is linked periodically to the UK Office of National Statistics and provides the life/death status of treated patients.
Ethics
The data collected were part of a mandatory national cardiac audit and all patient identifiable fields were removed prior to merging of the datasets and analysis. The local ethics committee advised that formal ethical approval was not required for this study.
Statistical Analysis
English IMD score was used to analyse patients by quintile11. We used Pearson’s chi- square test for categorical variables and ANOVA for continuous variables for comparison of clinical characteristics of patients. Shapiro-Wilk test was used to assess normality of distribution. The log-rank test was used to assess survival differences between quintiles. For the effect of socioeconomic status on clinical outcomes in age-adjusted and multiply-adjusted models, cox regression analysis was (hazard ratios (HRs) with 95% confidence intervals (CIs)). This incorporated all available covariates. The proportional hazards assumption was evaluated by examining log (-log) survival curves and tested with Schoenfeld’s residuals. The proportional hazards assumption was satisfied for all outcomes evaluated. A non-parsimonious logistic regression model comparing patients ranked by IMD score propensity score analysis was performed using a. A number of variables were included in the model, containing all variables with significant interactions. The multivariable Cox regression analysis was performed using only the two variables “propensity score” and “SES” in order to avoid over adjustment. Statistical analyses were performed using Stata version 14 (Stata Corp, TX).
Results
Overall, there were 123,780 PCI procedures performed during the whole study period. The mean age of the patients was 64.3±12.1 years and 25.2% were female. 22.4% of patients were diabetic and 27.3% had a history of previous myocardial infarction. The median IMD score was 24.4 (range 13.4 to 38.4). Over the study period, there was an increase in the proportion of patients in Quintile 5 compared to Quintile 1 (Figure 1).
Baseline Characteristics
In the most deprived group (Q5), patients were significantly younger compared to the least deprived (Q1) patients and were more likely to be of South Asian ethnicity. In addition, patients in Q5 had higher rates of chronic renal failure (CKD), diabetes mellitus, history of smoking, hypertension, previous MI, peripheral vascular disease and impaired systolic left ventricular function. However, patients in Q5 had lower rates of previous revascularization (PCI and CABG) (Table 1).
Procedural Characteristics
Acute coronary syndrome, particularly NSTEMI, was the most frequent indication for PCI, in patients in Q5 compared with Q1. Furthermore, patients in Q5 were more likely to have their procedure via the radial access for PCI, received a GP IIb/IIIa inhibitor and less likely to have a CTO procedure. Patients in Q5 were also less likely to have undergone multivessel PCI, adjunctive intravascular imaging, or had a drug-eluting stent inserted (Table 2). Despite the majority of patients being treated with clopidogrel during the study period, following the adoption of newer P2Y12 inhibitors higher rates of use were seen in Q1 vs Q5 (of either ticagrelor or prasugrel [53.5% vs 21.2%]).
Procedural Outcomes
There were no significant differences in procedural success or complication rates between the groups (Q1 to Q5). In-hospital death rates were higher from Q1 to Q5 (Table 3). Length of stay was longer from Q1 (3.6 [IQR: 2.3-6.5 days]) to Q5 {4.9 [IQR: 3.4 vs 7.3 days]). In addition, bleeding rates were lower from Q1 to Q5.
Long-Term Outcomes
The Kaplan-Meier estimates demonstrated that rates of long-term all-cause mortality increased progressively across quintiles of IMD score, with patients in Q5 showing significantly higher long-term mortality rates compared with patients in Q1 (p=0.0044) (Figure 2). Further landmark analysis demonstrated that the higher long0term mortality rates in Q5 appear to occur after 30 days (p-0.0083) (Figure 3). We also found that age-adjusted HRs for all-cause mortality were significantly higher in patients in Q5, Q4, Q3 and Q2 compared with patients in Q1. In addition, the age-adjusted HR for death was 1.37 (95% CI: 1.18-2.13) for Q5 compared with Q1 (Table 4). Following these multiple adjustments for confounding variables, the HR for death increased (compared to the age-adjusted hazard) for Q5 compared to Q1 (1.13 (95% CI: 1.07-1.32) (Table 5). We also found that the HRs for death increased in a linear trend for each decreasing quintile of SES. Finally, IMD was associated with long-term mortality following the inclusion of a propensity score in the proportional hazard model as a covariate (HR for Q5 compared to Q1: 1.15 [95% CI: 1.10-1.42]).
Discussion
This study is the largest study to date evaluating the impact of SES on all-cause mortality following PCI in a large contemporary dataset of nearly 125,000 patients. Patients with lower SES tender to be younger, more likely to be non-caucasian in origin, present acutely (ACS) and less likely to receive guideline-based treatments (i.e IVUS, DES, radial procedures, newer P2Y12 inhibitors). Over the study follow-up despite correction for confounding variables and co-morbidities lower SES remained associated with a poorer outcome. These findings suggest that SES may have a measurable and significant impact on cardiovascular outcomes after invasive treatment for CAD, with current risk models not adequately accounting for the risk conveyed by lower SES. There is an urgent need to address these inequalities. Furthermore, the differences in mortality appear to be more pronounced in the ACS group compared to the stable population. This suggests that SES is likely to be an important ‘risk factor’ in the development of ACS.
This data are comparable to other studies that have shown that SES appears independently associated with poorer health outcomes [3,14,19] however there is limited long-term data looking at outcome post PCI. Molendina et al. demonstrated that low SES was associated with increased mortality post-AMI, a finding most pronounced in the short-term, but demonstrating these same trends after 1-year post-infarct. In addition, their study showed that in Canada’s universal health care system, there was evidence of reduced access to standard-of-care interventions post-AMI, including cardiac catheterization, revascularization, and rehabilitation, for low-SES patients, highlighting the additional utility of the data provided by our analysis.
Other previous studies have observed that any SES-related differences in clinical outcome can be either partially [7,20–22] or completely [7,23] attributed to differences in baseline patient characteristics, which is at odds with our’s and others’ data suggesting that SES is independently associated with a worse outcome. A number of studies have demonstrated that the patients in lower SES have higher burden of cardiovascular risk factors [3,24–26]. At both a community level as well as at an individual-level, SES have been demonstrated to be associated with worse risk factor profile and cardiovascular disease [27]. There have been a few suggestions as to why this may be. Lower levels of participation in screening programs and regular monitoring for multiple disease conditions including for cardiovascular risk factors can result in a socioeconomic disadvantage [28,29]. Furthermore, there are lifestyle factors such as lower physical fitness, higher rates of smoking, which have been associated with low-community SES [30]. Additionally, poverty has been associated with lower use of invasive cardiac procedures in patients with AMI [31]. Kahn et al. [32] identified poorer processes of care in Medicare patients hospitalized with AMI. One of the main advantages of this study is that there is equivalence of insurance for the groups due to the National Health System. Hence there are no discrepancies in the ‘opportunity’ to access towards healthcare throughout the United Kingdom. An important aspect to note is that there differences in mortality appear to occur almost immediately following PCI, this strongly suggests that the ‘baseline’ differences in SES are likely to contribute significantly to this poorer outcome in the lower SES groups.
The reasons for worse post-PCI outcomes with lower SES are likely to be multifactorial. A number of studies after AMI have suggested that high-SES patients are more likely to receive guideline-recommended medications at discharge than are low-SES patients [21,33]. In addition, other studies have also demonstrated that patients from low-income were less likely to receive secondary medical prevention after 3 months [34] and that discontinuation of evidence-based medication was associated with not graduating from high school [35]. This latter study also suggested that medication therapy discontinuation was associated with higher mortality. However, there have not been any studies that have looked at SES-related differences in clinical outcomes after STEMI that have included information about secondary medical prevention. Hence, we do not yet know if the reported SES-related differences in clinical outcome could be mediated by differences in the secondary medical prevention use during follow-up. The likelihood of a patient taking up and completing a programme of cardiac rehabilitation is strongly influenced by SES with only 40% of patients from areas of high deprivation (lowest IMD quintile) starting, compared to 54% from areas of low deprivation (highest IMD quintile). Inequalities in access are also seen between gender (71% of those accessing CR in England are male) and ethnicity profiles (over 80% accessing CR in England are White British) (https://www.bhf.org.uk/informationsupport/publications/statistics/national-audit-of-cardiac-rehabilitation-quality-and-outcomes-report-2018). These findings all represent points at which interventions could be designed to improve access to care for patients with low SES, to improve their health and life expectancy after PCI. A study in England determined that CHD mortality was decreasing in individuals of all SES, but the rate of decline was steepest in the most affluent group in comparison with those with lower SES [36]. Hence there is a need to increase awareness about primary prevention and improve access to primary care services, particularly in communities with high socioeconomic deprivation to reduce the burden of cardiovascular disease in the future [28,29].
Limitations
This study is an observational analysis of consecutive patients from a single centre in London. Although our database contained majority of clinical variables that are known to have an impact on outcome, our result may still be confounded by variables that were not measured (similar to other observational studies). These factors may include cardiac rehabilitation and the impact of secondary medications. However, all data were prospectively collected, and its observational nature meant that the results are reflective of routine clinical practice. Although very robust, the English IMD score has a number of limitations that are due to the methodology involved in its derivation. The score incorporates seven domains into an overall quantification of deprivation, which is assigned based on defined geographical area rather than on an individual subject’s characteristics. Individuals who live in one particular area will obviously experience different levels of deprivation [37]. IMD scores are not a linear measure of deprivation and do not incorporate information on duration of residence. Therefore, we could not assess the contribution of deprivation exposure time to mortality. Nevertheless, the IMD score is the best available means for quantifying deprivation in England [39]. Another limitation to note is that while the IMD is still the most commonly used small-area metric, by identifying homes in need, other measures (such as the Census household deprivation indicators) can provide further detail to the picture. This is useful in rural areas since the IMD may miss minor deprivation hotspots.
Future Perspectives
There are chances to reevaluate traditional healthcare and offer complimentary treatments at no cost or at a reduced cost. Although clinical settings are typically thought of as the places where healthcare is provided, older persons can also benefit from other community-based resources, services, and initiatives. For instance, in order to assist low-income and vulnerable older persons in improving their health outcomes (such as fall prevention and chronic illness self-management), the federal government of the United States has funded a number of evidence-based initiatives [40–42]. These initiatives go beyond conventional clinical settings to enhance healthcare delivery and broaden patient access to medical services.
Reducing health inequities will necessitate a cooperative, multilevel strategy. The guiding ideas include identifying the most vulnerable people and communities and allocating additional resources to them, as well as enhancing cultural competence, expanding access to high-quality healthcare, and modernising medical education. The eradication of health disparities is a crucial task for the federal, local, and corporate governments, as well as employers, healthcare systems, educational institutions, community organisations, and individuals and families. Targeted preschool and early childhood treatments have significant implications for reducing gaps since childhood conditions impact the foundation of SES and health in adulthood [43].Conclusions
This study has demonstrated that low SES, as assessed by English IMD, is an independent predictor of adverse clinical outcomes following PCI for in a large diverse metropolitan city of London. Reducing disparities in health are a major public health challenge, and it troublesome to see that patients with low SES appear to be significantly disadvantaged with regards to their outcomes following PCI. Hence, attention to reduce the burden of cardiovascular risk factors and improve primary prevention, particularly in patients with low SES, is required.
Funding
No funding or grants involved in the generation of the manuscript.
Conflicts of Interest
No potential conflict of Interest.
References
- Davey-Smith G, Dorling D, Mitchell R, Shaw M. Health inequalities in Britain: Continuing increases up to the end of the 20th century. J. Epidemiol. Community Health 2002, 56, 434–435. [Google Scholar] [CrossRef] [PubMed]
- Suadicani P, Hein HO, Gyntelberg F. Socioeconomic status and ischaemic heart disease mortality in middle-aged men: Importance of the duration of follow-up. Cph. Male Study. Int. J. Epidemiol. 2001, 30, 248–255. [Google Scholar] [CrossRef] [PubMed]
- Jakobsen L, Niemann T, Thorsgaard N, Thuesen L, Lassen JF, Jensen LO; et al. Dimensions of socioeconomic status and clinical outcome after primary percutaneous coronary intervention. Circ. Cardiovasc. Interv. 2012, 5, 641–648. [Google Scholar] [CrossRef] [PubMed]
- Moledina A, Tang KL. Socioeconomic Status, Mortality, and Access to Cardiac Services After Acute Myocardial Infarction in Canada: A Systematic Review and Meta-analysis. CJC open 2021, 3, 950–964.
- Biswas S, Andrianopoulos N, Duffy SJ, Lefkovits J, Brennan A, Walton A; et al. Impact of Socioeconomic Status on Clinical Outcomes in Patients With ST-Segment-Elevation Myocardial Infarction. Circ. Cardiovasc. Qual. Outcomes 2019, 12, e004979. [Google Scholar] [CrossRef]
- Morris RW, Whincup PH, Lampe FC, Walker M, Wannamethee SG, Shaper AG. Geographic variation in incidence of coronary heart disease in Britain: The contribution of established risk factors. Heart (Br. Card. Soc. ) 2001, 86, 277–283. [Google Scholar] [CrossRef]
- Alter DA, Naylor CD, Austin P, Tu JV. Effects of socioeconomic status on access to invasive cardiac procedures and on mortality after acute myocardial infarction. New Engl. J. Med. 1999, 341, 1359–1367. [Google Scholar] [CrossRef]
- MacLeod MC, Finlayson AR, Pell JP, Findlay IN. Geographic, demographic, and socioeconomic variations in the investigation and management of coronary heart disease in Scotland. Heart (Br. Card. Soc. ) 1999, 81, 252–256. [Google Scholar]
- Philbin EF, McCullough PA, DiSalvo TG, Dec GW, Jenkins PL, Weaver WD. Socioeconomic status is an important determinant of the use of invasive procedures after acute myocardial infarction in New York State. Circulation 2000, 102 (19 Suppl 3), Iii107–Iii115.
- Pell JP, Pell AC, Norrie J, Ford I, Cobbe SM. Effect of socioeconomic deprivation on waiting time for cardiac surgery: Retrospective cohort study. BMJ (Clin. Res. Ed) 2000, 320, 15–18. [Google Scholar] [CrossRef]
- Avorn J, Monette J, Lacour A, Bohn RL, Monane M, Mogun H; et al. Persistence of use of lipid-lowering medications: A cross-national study. Jama 1998, 279, 1458–1462. [Google Scholar] [CrossRef] [PubMed]
- Ward PR, Noyce PR, St Leger AS. Are GP practice prescribing rates for coronary heart disease drugs equitable? A cross sectional analysis in four primary care trusts in England. J. Epidemiol. Community Health 2004, 58, 89–96. [Google Scholar] [CrossRef] [PubMed]
- Gasevic D, Khan NA, Qian H, Karim S, Simkus G, Quan H; et al. Outcomes following percutaneous coronary intervention and coronary artery bypass grafting surgery in Chinese, South Asian and White patients with acute myocardial infarction: Administrative data analysis. BMC cardiovascular disorders. 2013, 13, 121.
- Roth C, Berger R, Kuhn M. The role of the socio-economic environment on medical outcomes after ST-segment elevation myocardial infarction. BMC Public Health 2019, 19, 630. [Google Scholar]
- Ludman, PF. British Cardiovascular Intervention Society Registry for audit and quality assessment of percutaneous coronary interventions in the United Kingdom. Heart (Br. Card. Soc. ) 2011, 97, 1293–1297. [Google Scholar] [CrossRef]
- deprivation DfCaLGIo. Department for Communities and Local Government. Indices of deprivation 2010 [Available from: http://www.communities.gov.uk/communities/research/indicesdeprivation/deprivation10/.
- Bello AK, Peters J, Rigby J, Rahman AA, El Nahas M. Socioeconomic status and chronic kidney disease at presentation to a renal service in the United Kingdom. Clin. J. Am. Soc. Nephrol. 2008, 3, 1316–1323. [Google Scholar] [CrossRef]
- Leigh Y, Seagroatt V, Goldacre M, McCulloch P. Impact of socio-economic deprivation on death rates after surgery for upper gastrointestinal tract cancer. Br. J. Cancer 2006, 95, 940–943. [Google Scholar] [CrossRef]
- Kareem H, Shetty PN, Devasia T, Karkala YR, Paramasivam G, Guddattu V; et al. Impact of socioeconomic status on adverse cardiac events after coronary angioplasty: A cohort study. Heart Asia 2018, 10, e010960. [Google Scholar] [CrossRef]
- Rosvall M, Chaix B, Lynch J, Lindström M, Merlo J. The association between socioeconomic position, use of revascularization procedures and five-year survival after recovery from acute myocardial infarction. BMC public health 2008, 8, 44.
- Rao SV, Schulman KA, Curtis LH, Gersh BJ, Jollis JG. Socioeconomic status and outcome following acute myocardial infarction in elderly patients. Arch. Intern. Med. 2004, 164, 1128–1133. [Google Scholar] [CrossRef]
- Mehta RH, O'Shea JC, Stebbins AL, Granger CB, Armstrong PW, White HD; et al. Association of mortality with years of education in patients with ST-segment elevation myocardial infarction treated with fibrinolysis. J. Am. Coll. Cardiol. 2011, 57, 138–146. [Google Scholar] [CrossRef] [PubMed]
- Pilote L, Tu JV, Humphries K, Behouli H, Belisle P, Austin PC; et al. Socioeconomic status, access to health care, and outcomes after acute myocardial infarction in Canada's universal health care system. Med. Care 2007, 45, 638–646. [Google Scholar] [CrossRef] [PubMed]
- Agarwal S, Garg A, Parashar A, Jaber WA, Menon V. Outcomes and resource utilization in ST-elevation myocardial infarction in the United States: Evidence for socioeconomic disparities. J. Am. Heart Assoc. 2014, 3, e001057. [Google Scholar] [CrossRef] [PubMed]
- Bonow RO, Grant AO, Jacobs AK. The cardiovascular state of the union: Confronting healthcare disparities. Circulation 2005, 111, 1205–1207. [Google Scholar] [CrossRef] [PubMed]
- Mensah GA, Mokdad AH, Ford ES, Greenlund KJ, Croft JB. State of disparities in cardiovascular health in the United States. Circulation 2005, 111, 1233–1241. [Google Scholar] [CrossRef]
- Shimony A, Zahger D, Ilia R, Shalev A, Cafri C. Impact of the community's socioeconomic status on characteristics and outcomes of patients undergoing percutaneous coronary intervention. Int. J. Cardiol. 2010, 144, 379–382. [Google Scholar] [CrossRef]
- Damiani G, Federico B, Bianchi CB, Ronconi A, Basso D, Fiorenza S; et al. Socio-economic status and prevention of cardiovascular disease in Italy: Evidence from a national health survey. Eur. J. Public Health 2011, 21, 591–596. [Google Scholar] [CrossRef]
- Lang SJ, Abel GA, Mant J, Mullis R. Impact of socioeconomic deprivation on screening for cardiovascular disease risk in a primary prevention population: A cross-sectional study. BMJ Open 2016, 6, e009984. [Google Scholar] [CrossRef]
- Shishehbor MH, Gordon-Larsen P, Kiefe CI, Litaker D. Association of neighborhood socioeconomic status with physical fitness in healthy young adults: The Coronary Artery Risk Development in Young Adults (CARDIA) study. Am. Heart J. 2008, 155, 699–705. [Google Scholar] [CrossRef]
- Franks AL, May DS, Wenger NK, Blount SB, Eaker ED. Racial differences in the use of invasive coronary procedures after acute myocardial infarction in Medicare beneficiaries. Ethn. Dis. 1993, 3, 213–220. [Google Scholar]
- Kahn KL, Pearson ML, Harrison ER, Desmond KA, Rogers WH, Rubenstein LV; et al. Health care for black and poor hospitalized Medicare patients. Jama 1994, 271, 1169–1174. [Google Scholar] [CrossRef]
- Rathore SS, Berger AK, Weinfurt KP, Feinleib M, Oetgen WJ, Gersh BJ; et al. Race, sex, poverty, and the medical treatment of acute myocardial infarction in the elderly. Circulation 2000, 102, 642–648. [Google Scholar] [CrossRef] [PubMed]
- Ohlsson H, Rosvall M, Hansen O, Chaix B, Merlo J. Socioeconomic position and secondary preventive therapy after an AMI. Pharmacoepidemiol. Drug Saf. 2010, 19, 358–366. [Google Scholar] [CrossRef] [PubMed]
- Ho PM, Spertus JA, Masoudi FA, Reid KJ, Peterson ED, Magid DJ; et al. Impact of medication therapy discontinuation on mortality after myocardial infarction. Arch. Intern. Med. 2006, 166, 1842–1847. [Google Scholar] [CrossRef] [PubMed]
- Bajekal M, Scholes S, O'Flaherty M, Raine R, Norman P, Capewell S. Unequal trends in coronary heart disease mortality by socioeconomic circumstances, England 1982-2006: An analytical study. PLoS ONE 2013, 8, e59608. [Google Scholar]
- Greenland S, Robins J. Invited commentary: Ecologic studies--biases, misconceptions, and counterexamples. Am. J. Epidemiol. 1994, 139, 747–760. [Google Scholar] [CrossRef]
- Inclusion. OCfS. Why the Indices of Deprivation are Still Important in the Open Data Era. 2011 [Available from: https://ocsi.uk/2016/03/24/why-the-imd-is-still-important-in-the-open-data-age/.
- Jones DA, Howard JP, Rathod KS, Gallagher SM, Knight CJ, Jain AK; et al. The impact of socio-economic status on all-cause mortality after percutaneous coronary intervention: An observational cohort study of 13,770 patients. EuroIntervention 2015, 10, e1–e8. [Google Scholar]
- Smith ML, Towne S, Herrera-Venson A, Cameron K, Horel SA, Ory MG; et al. . Delivery of fall prevention interventions for at-risk older adults in rural areas: Findings from a national dissemination. Int. J. Environ. Res. Public Health 2018, 15, 2798. [Google Scholar] [CrossRef]
- Smith ML, Towne SD, Herrera-Venson A, Cameron K, Kulinski KP, Lorig K; et al. . Dissemination of chronic disease self-management education (CDSME) programs in the United States: Intervention delivery by rurality. Int. J. Environ. Res. Public Health 2017, 14, 638. [Google Scholar] [CrossRef]
- Ory MG, Smith ML. Research, practice, and policy perspectives on evidence-based programing for older adults. Front. Public Health 2015, 3, 136. [Google Scholar] [CrossRef]
- Vanassche T, Connolly SJ, Eikelboom JW, Healey JS, Lauw MN, Masiero S, Wang J, Yusuf S. Abstract 18936: Can Biomarkers Improve Risk Stratification of Atrial Fibrillation Patients? Analysis of 3578 Aspirin-treated Patients in ACTIVE and AVERROES. Circulation 2014, 130, A18936. [Google Scholar]
Figure 1.
Prevalence of patients in all the quintiles of Index of Multiple Deprivation (IMD). Most deprived group (Q5) and the least deprived group (Q1) in both Stable and ACS patients.
Figure 1.
Prevalence of patients in all the quintiles of Index of Multiple Deprivation (IMD). Most deprived group (Q5) and the least deprived group (Q1) in both Stable and ACS patients.
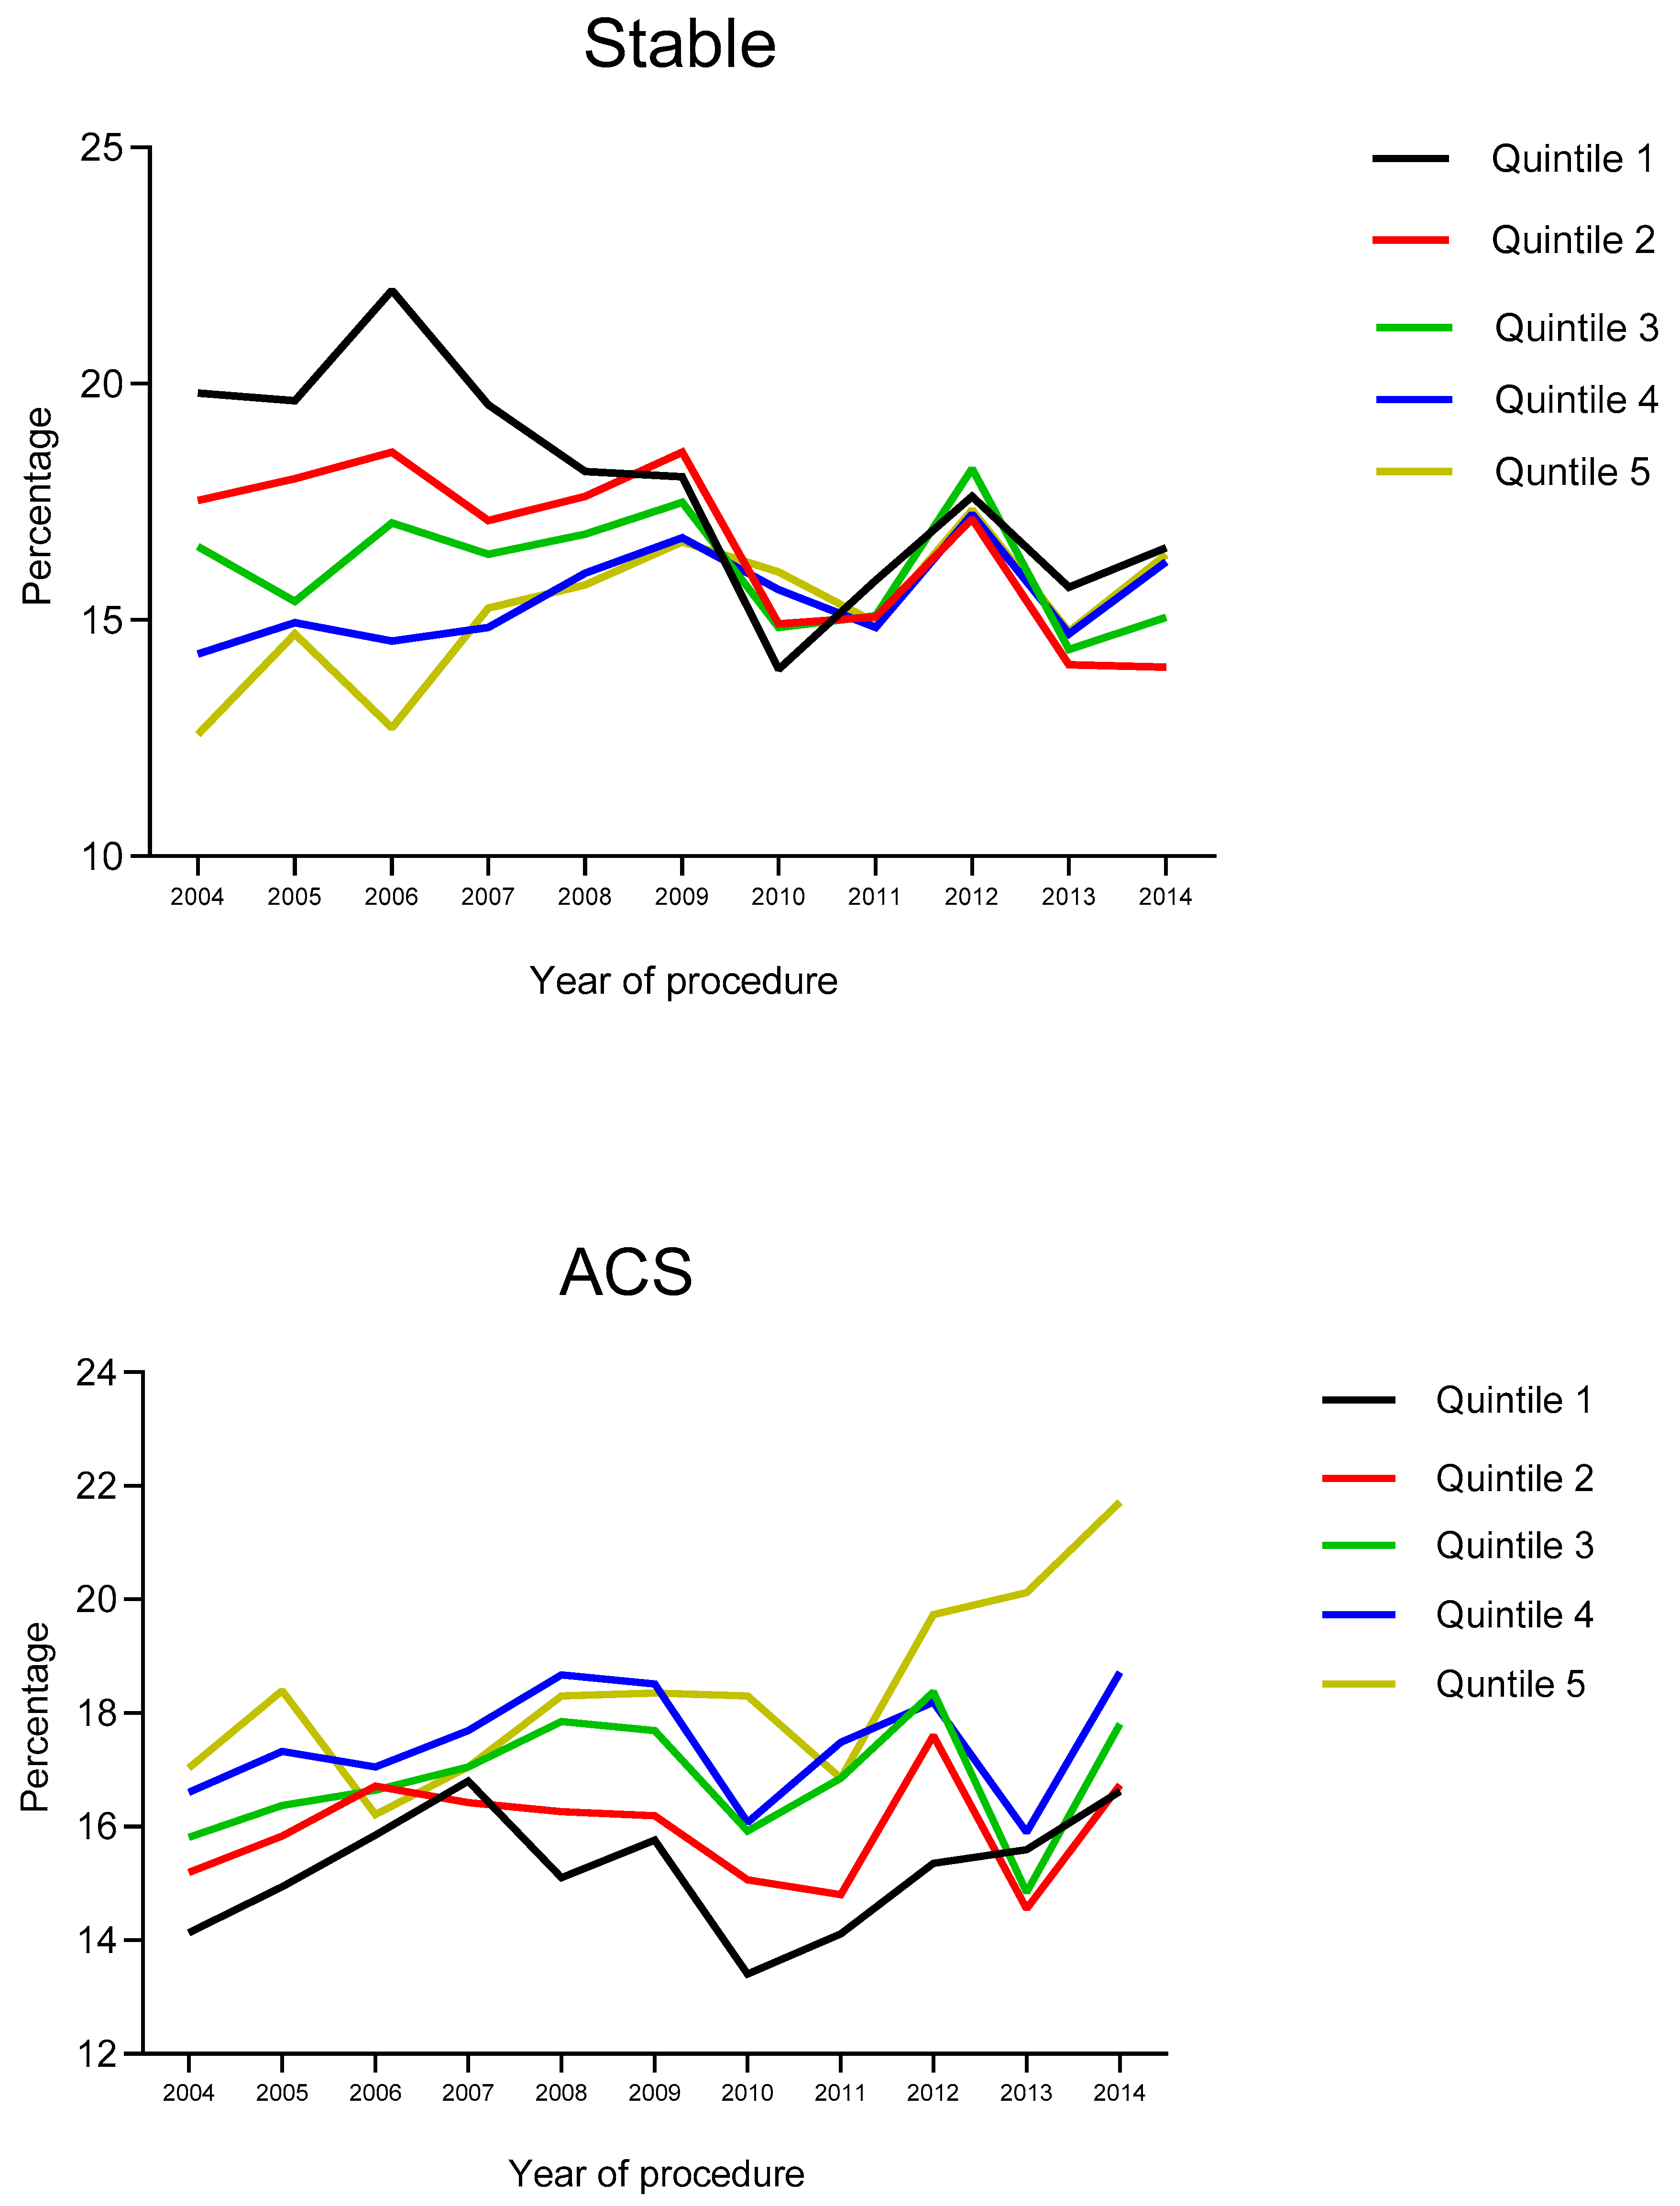
Figure 2.
Cumulative incidence of all-cause mortality after PCI by quintiles of socioeconomic status.
Figure 2.
Cumulative incidence of all-cause mortality after PCI by quintiles of socioeconomic status.
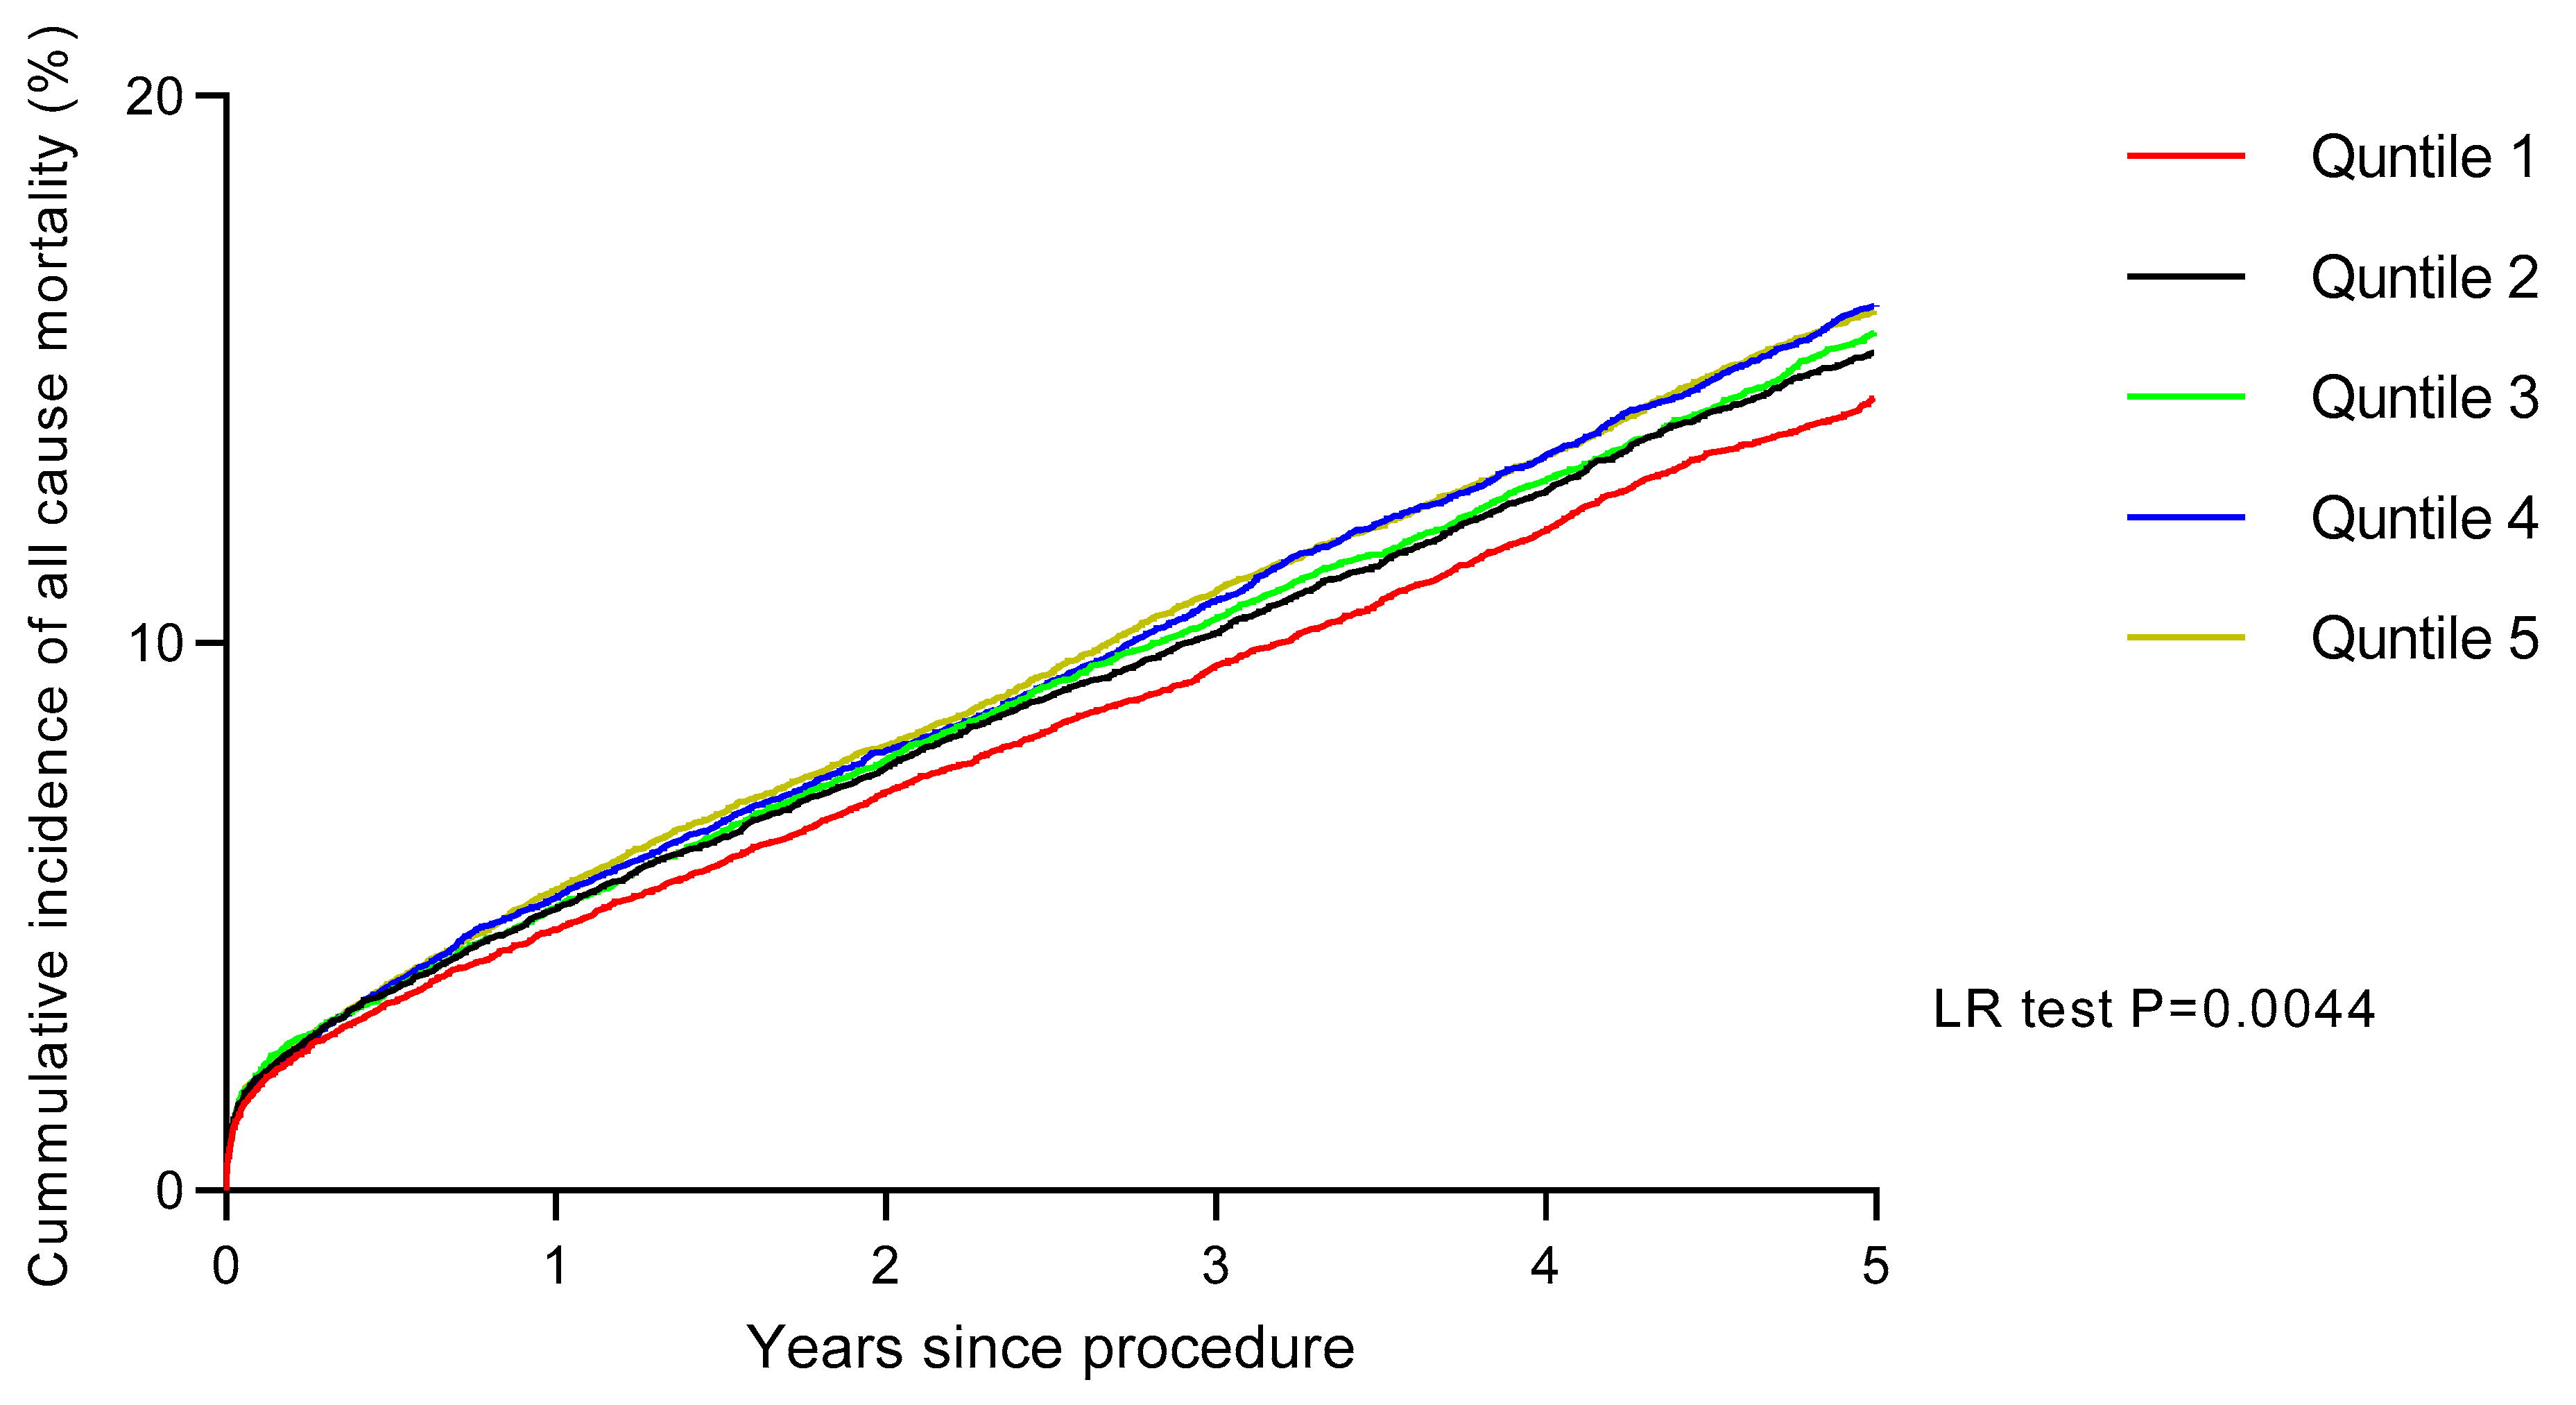
Figure 3.
Landmark Analysis of cumulative incidence of all-cause mortality after PCI by quintiles of socioeconomic status between 0-30 days and then >30 days.
Figure 3.
Landmark Analysis of cumulative incidence of all-cause mortality after PCI by quintiles of socioeconomic status between 0-30 days and then >30 days.
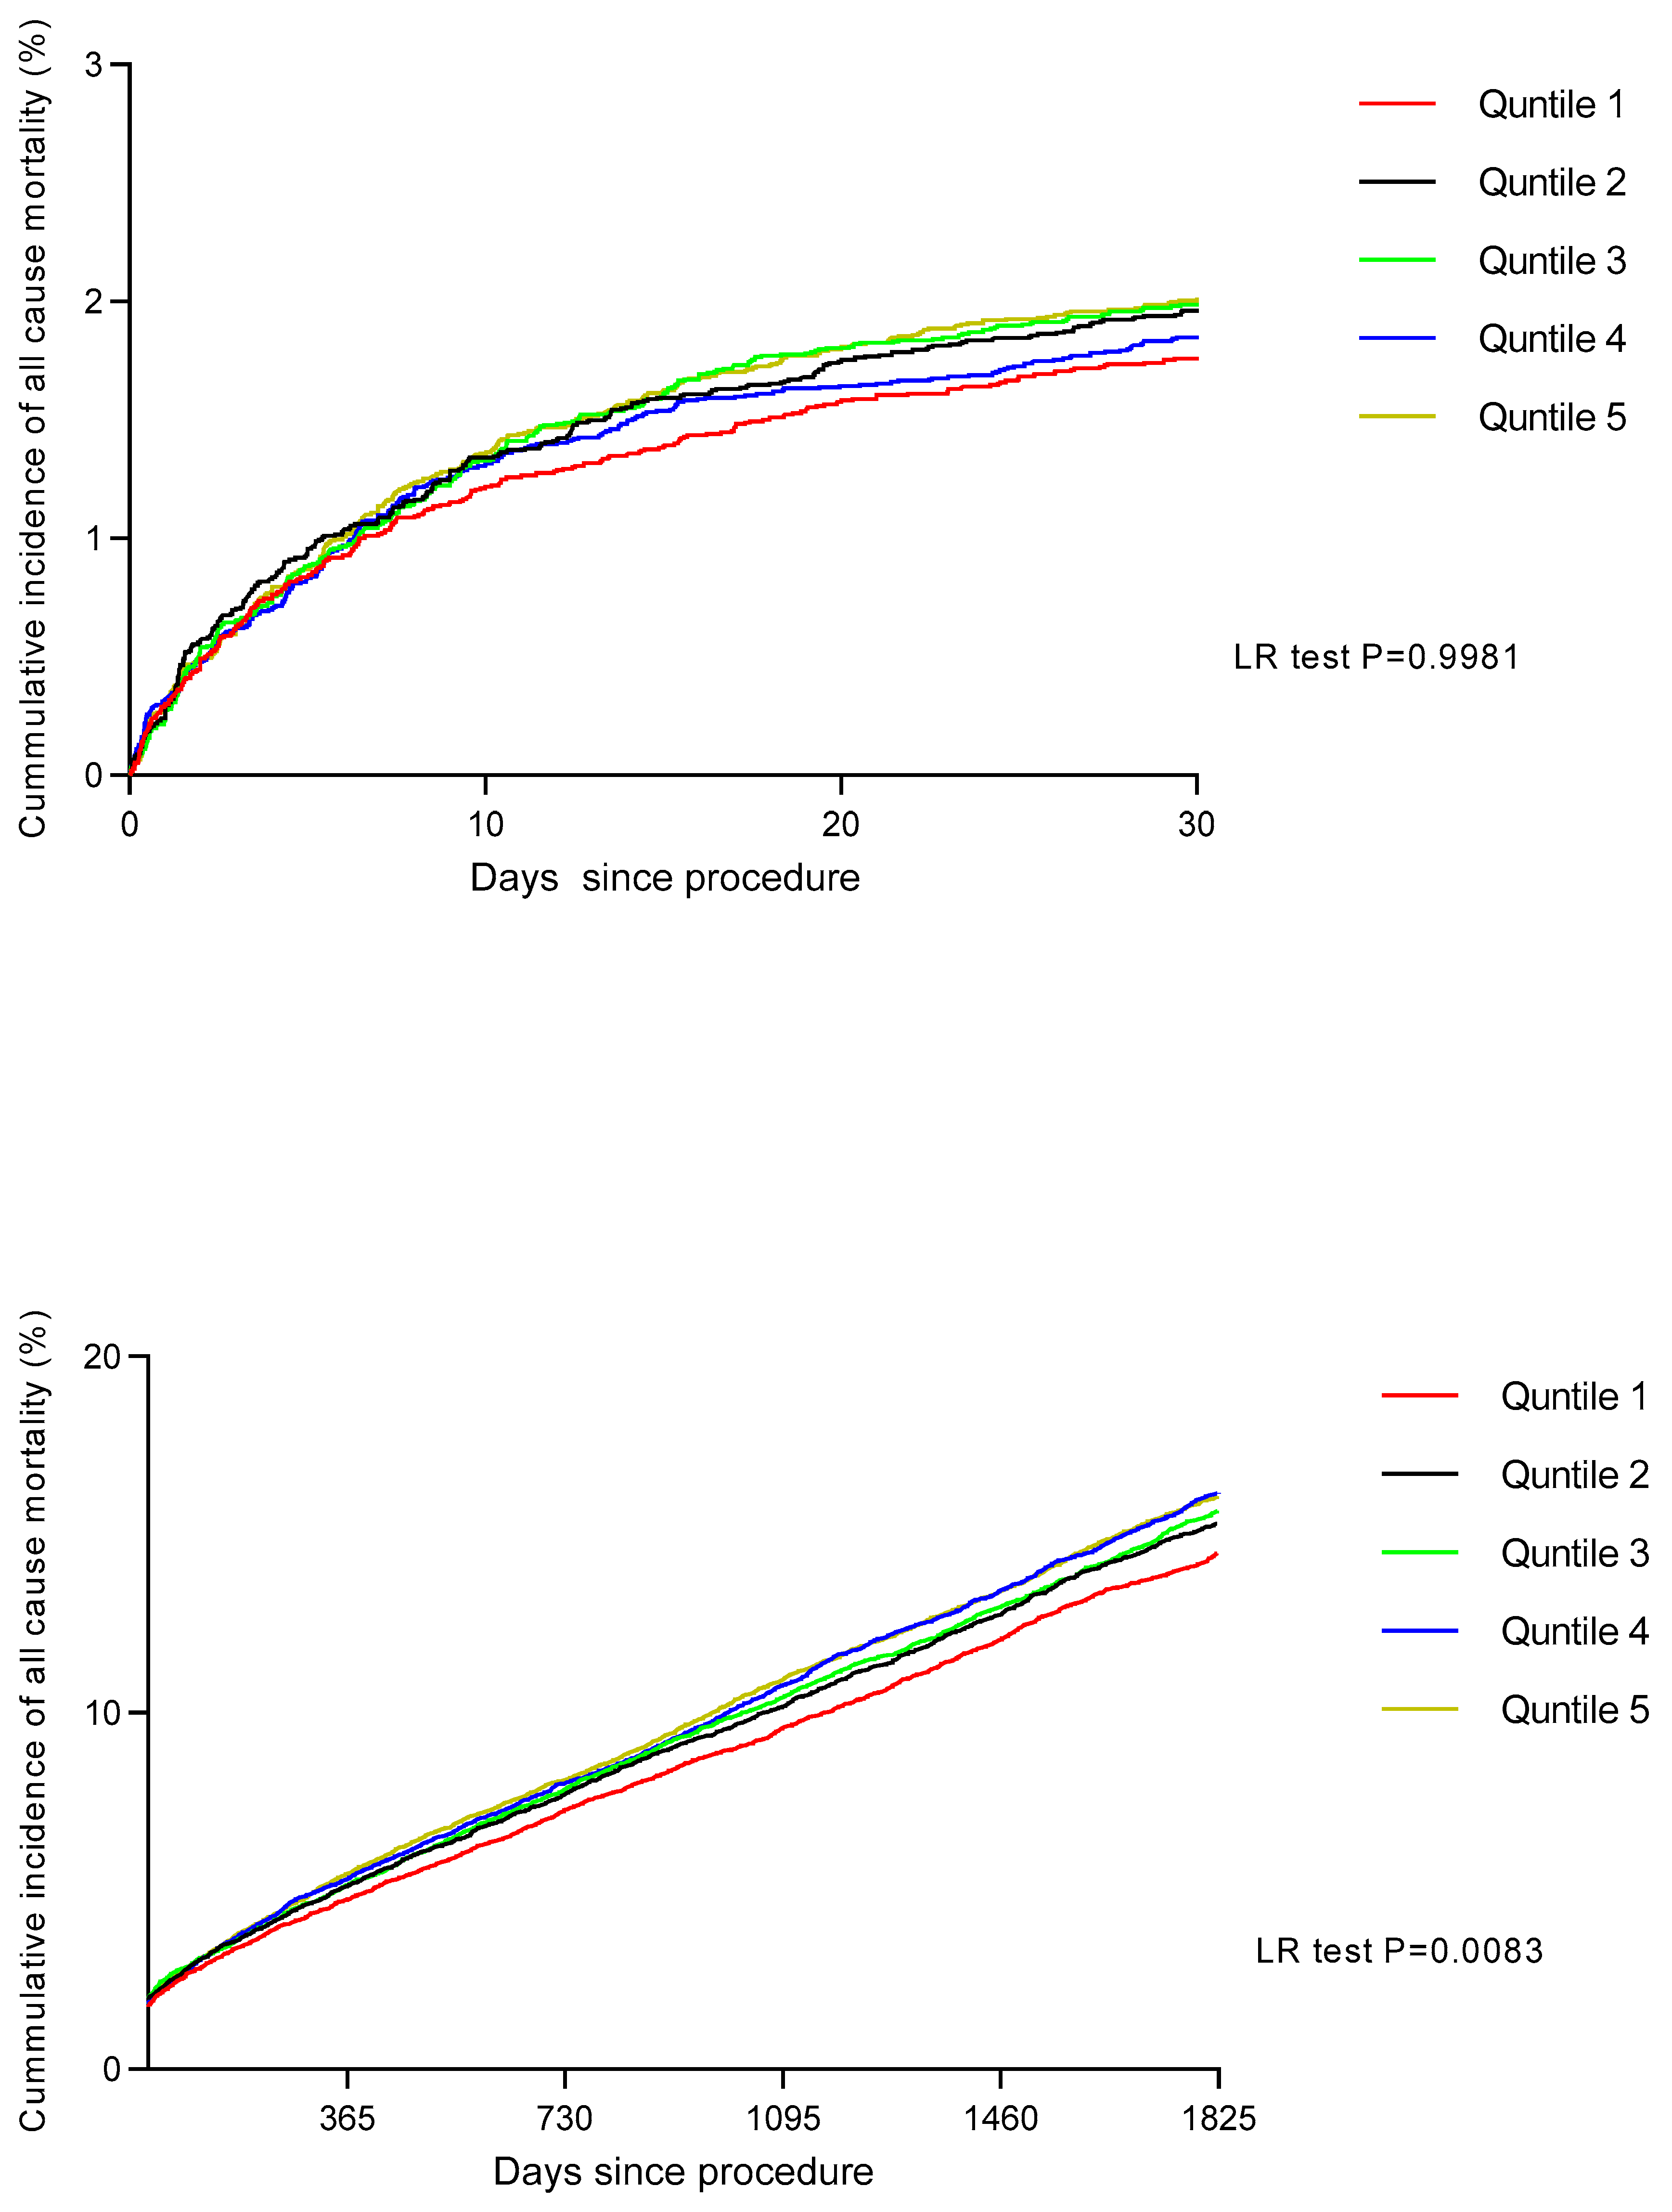

Table 1.
Baseline characteristics according to socio-economic status quintile..
| Quintile 1 | Quintile 2 | Quintile 3 | Quintile 4 | Quintile 5 | p Value | |
|---|---|---|---|---|---|---|
| (n = 18,727) | (n = 18,724) | (n = 18,708) | (n = 18,684) | (n = 18,717) | ||
| Age (yrs) | 66.70 ± 11.45 | 65.55 ± 11.86 | 64.46 ± 12.17 | 63.14 ± 12.24 | 64.32 ± 12.15 | <0.0001 |
| Ethnicity (Caucasian) | 11817 (63.1%) | 10598 (56.6%) | 9092 (48.6%) | 7997 (42.8%) | 6420 (34.3%) | <0.0001 |
| Gender (Male) | 14008 (74.8%) | 14024 (74.9%) | 13975 (74.7%) | 13452 (74.2%) | 13925 (74.4%) | 0.358 |
| Previous MI | 3521 (18.8%) | 3876 (20.7%) | 3779 (20.2%) | 3774 (20.2%) | 3762 (20.1%) | 0.218 |
| Previous CABG | 4232 (22.6%) | 4101 (21.9%) | 3816 (20.4%) | 3606 (19.3%) | 3332 (17.8%) | <0.0001 |
| Previous PCI | 5262 (28.1%) | 5149 (27.5%) | 4958 (26.5%) | 4914 (26.3%) | 4567 (24.4%) | <0.0001 |
| Hypercholesterolaemia | 10993 (58.7%) | 10879 (58.1%) | 10757 (57.7%) | 10818 (57.9%) | 10294 (55.0%) | <0.0001 |
| Diabetes mellitus | 3071 (16.4%) | 3782 (20.2%) | 4434 (23.7%) | 5007 (26.8%) | 5615 (30.0%) | <0.0001 |
| Hypertension | 10487 (56.0%) | 10617 (56.7%) | 10907 (58.3%) | 11080 (59.3%) | 11062 (59.1%) | <0.0001 |
| Smoking History | 10244 (54.7%) | 10785 (57.6%) | 10982 (58.7%) | 11715 (62.7%) | 12072 (64.5%) | <0.0001 |
| PVD | 543 (2.9%) | 618 (3.3%) | 617 (3.3%) | 654 (3.5%) | 674 (3.6%) | 0.002 |
| CKD (Creat >200) | 581 (3.1%) | 749 (4.0%) | 842 (4.5%) | 916 (4.9%) | 880 (4.7%) | <0.0001 |
| Previous CVA | 450 (2.4%) | 487 (2.6%) | 468 (2.5%) | 467 (2.5%) | 487 (2.6%) | 0.894 |
| Poor LV function | 974 (5.2%) | 1723 (9.2%) | 2077 (11.1%) | 1756 (9.4%) | 2059 (11.0%) | <0.0001 |
| Cardiogenic Shock | 412 (2.2%) | 431 (2.3%) | 468 (2.5%) | 486 (2.6%) | 468 (2.5%) | 0.120 |
Abbreviations: ACS= Acute Coronary Syndrome, MI = Myocardial Infarction, CABG= Coronary Artery bypass grafting, MV= Multi-vessel, PVD= Peripheral Vascular disease, CKD= Chronic Kidney disease, LV= Left ventricular, CVA= Cerebrovascular accident, OOHA= Out of hospital cardiac arrest.
Table 2.
Procedural characteristics according to socio-economic status quintile.
| Quintile 1 | Quintile 2 | Quintile 3 | Quintile 4 | Quintile 5 | p Value | |
|---|---|---|---|---|---|---|
| (n = 18,727) | (n = 18,724) | (n = 18,708) | (n = 18,684) | (n = 18,717) | ||
| Access for PCI | ||||||
| Radial | 9832 (25.2%) | 4831 (25.8%) | 5126 (27.4%) | 5400 (28.9%) | 5933 (31.7%) | <0.0001 |
| Acute coronary syndrome | ||||||
| Primary PCI for STEMI | 4345 (23.2%) | 4494 (24.0%) | 4602 (24.6%) | 4652 (24.9%) | 4773 (25.5%) | <0.0001 |
| PCI for NSTEMI/UA | 4700 (25.1%) | 5224 (27.9%) | 5519 (29.5%) | 6035 (32.3%) | 6382 (34.1%) | <0.0001 |
| Elective | 9289 (49.6%) | 8688 (46.4%) | 8213 (43.9%) | 7623 (40.8%) | 7637 (40.8%) | <0.0001 |
| CTOs | 1891 (10.1%) | 1741 (9.3%) | 1702 (9.1%) | 1682 (9.0%) | 1479 (7.9%) | <0.0001 |
| Left main coronary artery | 787 (4.2%) | 730 (3.9%) | 655 (3.5%) | 673 (3.6%) | 543 (2.9%) | <0.0001 |
| Right coronary artery | 6798 (36.3%) | 6853 (36.6%) | 7053 (37.7%) | 7119 (38.1%) | 6963 (37.2%) | 0.003 |
| Left anterior descending artery | 9326 (49.8%) | 9175 (49.0%) | 8999 (48.1%) | 9024 (48.3%) | 9096 (48.6%) | 0.020 |
| Left circumflex artery | 4607 (24.6%) | 4775 (25.5%) | 4752 (25.4%) | 4820 (25.8%) | 4923 (26.3%) | 0.004 |
| Vein graft | ||||||
| Multi-vessel PCI | 3521 (18.8%) | 3632 (19.4%) | 3891 (20.8%) | 4017 (21.5%) | 4080 (21.8%) | 0.042 |
| IVUS Use | 1854 (9.9%) | 1760 (9.4%) | 1721 (9.2%) | 1607 (8.6%) | 1348 (7.2%) | <0.0001 |
| DES use | 17060 (91.1%) | 17001 (90.8%) | 16912 (90.4%) | 16760 (89.7%) | 16827 (89.9%) | <0.0001 |
| GP IIb/IIIa inhibitor | 4700 (25.1%) | 4999 (26.7%) | 5145 (27.5%) | 5213 (27.9%) | 5634 (30.1%) | <0.0001 |
| Procedural Success | 18259 (97.5%) | 18237 (97.4%) | 18259 (97.6%) | 18217 (97.5%) | 18237 (97.4%) | 0.215 |
Abbreviations: DES= Drug-eluting Stent, IVUS= Intravascular Ultrasound, LAD= Left anterior descending, RCA= right coronary artery, CTO = chronic total occlusion.
Table 3.
Procedural outcomes following percutaneous coronary intervention according to socio-economic status quintile.
Table 3.
Procedural outcomes following percutaneous coronary intervention according to socio-economic status quintile.
| Quintile 1 | Quintile 2 | Quintile 3 | Quintile 4 | Quintile 5 | p Value | |
|---|---|---|---|---|---|---|
| (n = 18,727) | (n = 18,724) | (n = 18,708) | (n = 18,684) | (n = 18,717) | ||
| MACE | ||||||
| Death | 206 (1.1%) | 243 (1.3%) | 243 (1.3%) | 280 (1.5%) | 299 (1.6%) | 0.048 |
| Q wave MI | 75 (0.4%) | 56 (0.3%) | 94 (0.5%) | 75 (0.4%) | 94 (0.5%) | 0.105 |
| Re-Intervention PCI | 97 (0.5%) | 94 (0.5%) | 75 (0.4%) | 56 (0.3%) | 75 (0.4%) | 0.089 |
| CVA | 19 (0.1%) | 19 (0.1%) | 0 (0.0%) | 19 (0.1%) | 19 (0.1%) | 0.125 |
| Elective CABG | 37 (0.2%) | 19 (0.1%) | 19 (0.1%) | 19 (0.1%) | 19 (0.1%) | 0.101 |
| Emergency CABG | 19 (0.1%) | 19 (0.1%) | 19 (0.1%) | 19 (0.1%) | 19 (0.1%) | 0.201 |
| Bleeding | 150 (0.8%) | 169 (0.9%) | 150 (0.8%) | 131 (0.7%) | 112 (0.6%) | 0.027 |
Table 4.
Age-adjusted hazard ratios for all-cause mortality after PCI. Age-adjusted hazard ratios of the Cox analysis for all-cause mortality after PCI with 95% confidence intervals.
Table 4.
Age-adjusted hazard ratios for all-cause mortality after PCI. Age-adjusted hazard ratios of the Cox analysis for all-cause mortality after PCI with 95% confidence intervals.
| Variable | Comparator | Age-adjusted HR | 95%CI |
|---|---|---|---|
| Age | Age | 1.076 | 1.074-1.078 |
| Female | Male | 0.770 | 0.644-1.197 |
| Ethnicity (Asian) | Caucasian | 1.182 | 0.945-1.220 |
| Cardiogenic Shock | No Cardiogenic Shock | 4.643 | 4.329-4.981 |
| Smoking History | No Smoking History | 1.036 | 0.997-1.076 |
| Diabetic | Non diabetic | 1.528 | 1.473-1.586 |
| Previous MI | No previous MI | 1.492 | 0.839-1.546 |
| Previous PCI | No previous PCI | 1.106 | 0.765-1.149 |
| Previous CABG | No previous CABG | 1.666 | 0.992-1.744 |
| Hypertension | No hypertension | 1.403 | 1.354-1.453 |
| Hypercholesterolaemia | No hypercholesterolaemia | 1.013 | 0.957-1.049 |
| Previous CVA | No previous CVA | 2.887 | 1.935-4.309 |
| Peripheral vascular disease | No peripheral vascular disease | 2.934 | 2.750-3.131 |
| eGFR <60 ml/min/1.73m2 | eGFR > 60 | 2.605 | 2.215-3.064 |
| EF < 35% | EF > 35% | 2.179 | 2.042-2.325 |
| GP IIb/IIIa inhibitor use | No GP IIb/IIIa inhibitor use | 0.905 | 0872-0.940 |
| Procedural success | Procedural failure | 0.626 | 0.583-0.673 |
| Access route (Radial) | Femoral | 0.880 | 0.844-0.917 |
| Acute Coronary Syndrome | Elective Procedure | 1.209 | 1.164-1.255 |
| Chronic total occlusions | No chronic total occlusions | 1.043 | 0.987-1.103 |
| Drug-eluting stent use | Bare metal stent use | 0.773 | 0.735-0.812 |
| Multivessel disease | Single vessel disease | 1.428 | 1.380-1.478 |
| Socio-economic status | 1.001 | 1.000-1.012 | |
| Socio-economic quintile 2 | Socio-economic quintile 1 | 1.315 | 1.135-1.523 |
| Socio-economic quintile 3 | Socio-economic quintile 1 | 1.236 | 1.017-1.502 |
| Socio-economic quintile 4 | Socio-economic quintile 1 | 1.260 | 1.054-1.664 |
| Socio-economic quintile 5 | Socio-economic quintile 1 | 1.367 | 1.177-2.130 |
CABG: coronary artery bypass grafting; CVA: cerebrovascular accident; MI: myocardial infarction; PCI: percutaneous coronary intervention; PVD: peripheral vascular disease.
Table 5.
Multivariate hazard ratios for all-cause mortality after PCI. Multivariate hazard ratios of the Cox analysis for all-cause mortality after PCI with 95% confidence intervals.
Table 5.
Multivariate hazard ratios for all-cause mortality after PCI. Multivariate hazard ratios of the Cox analysis for all-cause mortality after PCI with 95% confidence intervals.
| Variable | Comparator | Age-adjusted HR | 95%CI |
|---|---|---|---|
| Socio-economic status | 1.001 | 1.000-1.002 | |
| Socio-economic quintile 2 | Socio-economic quintile 1 | 1.080 | 1.023-1.140 |
| Socio-economic quintile 3 | Socio-economic quintile 1 | 1.089 | 1.017-1.167 |
| Socio-economic quintile 4 | Socio-economic quintile 1 | 1.124 | 1.021-1.237 |
| Socio-economic quintile 5 | Socio-economic quintile 1 | 1.130 | 1.070-1.316 |
Disclaimer/Publisher’s Note: The statements, opinions and data contained in all publications are solely those of the individual author(s) and contributor(s) and not of MDPI and/or the editor(s). MDPI and/or the editor(s) disclaim responsibility for any injury to people or property resulting from any ideas, methods, instructions or products referred to in the content. |
© 2024 by the authors. Licensee MDPI, Basel, Switzerland. This article is an open access article distributed under the terms and conditions of the Creative Commons Attribution (CC BY) license (http://creativecommons.org/licenses/by/4.0/).
Copyright: This open access article is published under a Creative Commons CC BY 4.0 license, which permit the free download, distribution, and reuse, provided that the author and preprint are cited in any reuse.


