Submitted:
27 October 2024
Posted:
28 October 2024
You are already at the latest version
Abstract
Keywords:
1. Introduction
2. Materials and methods
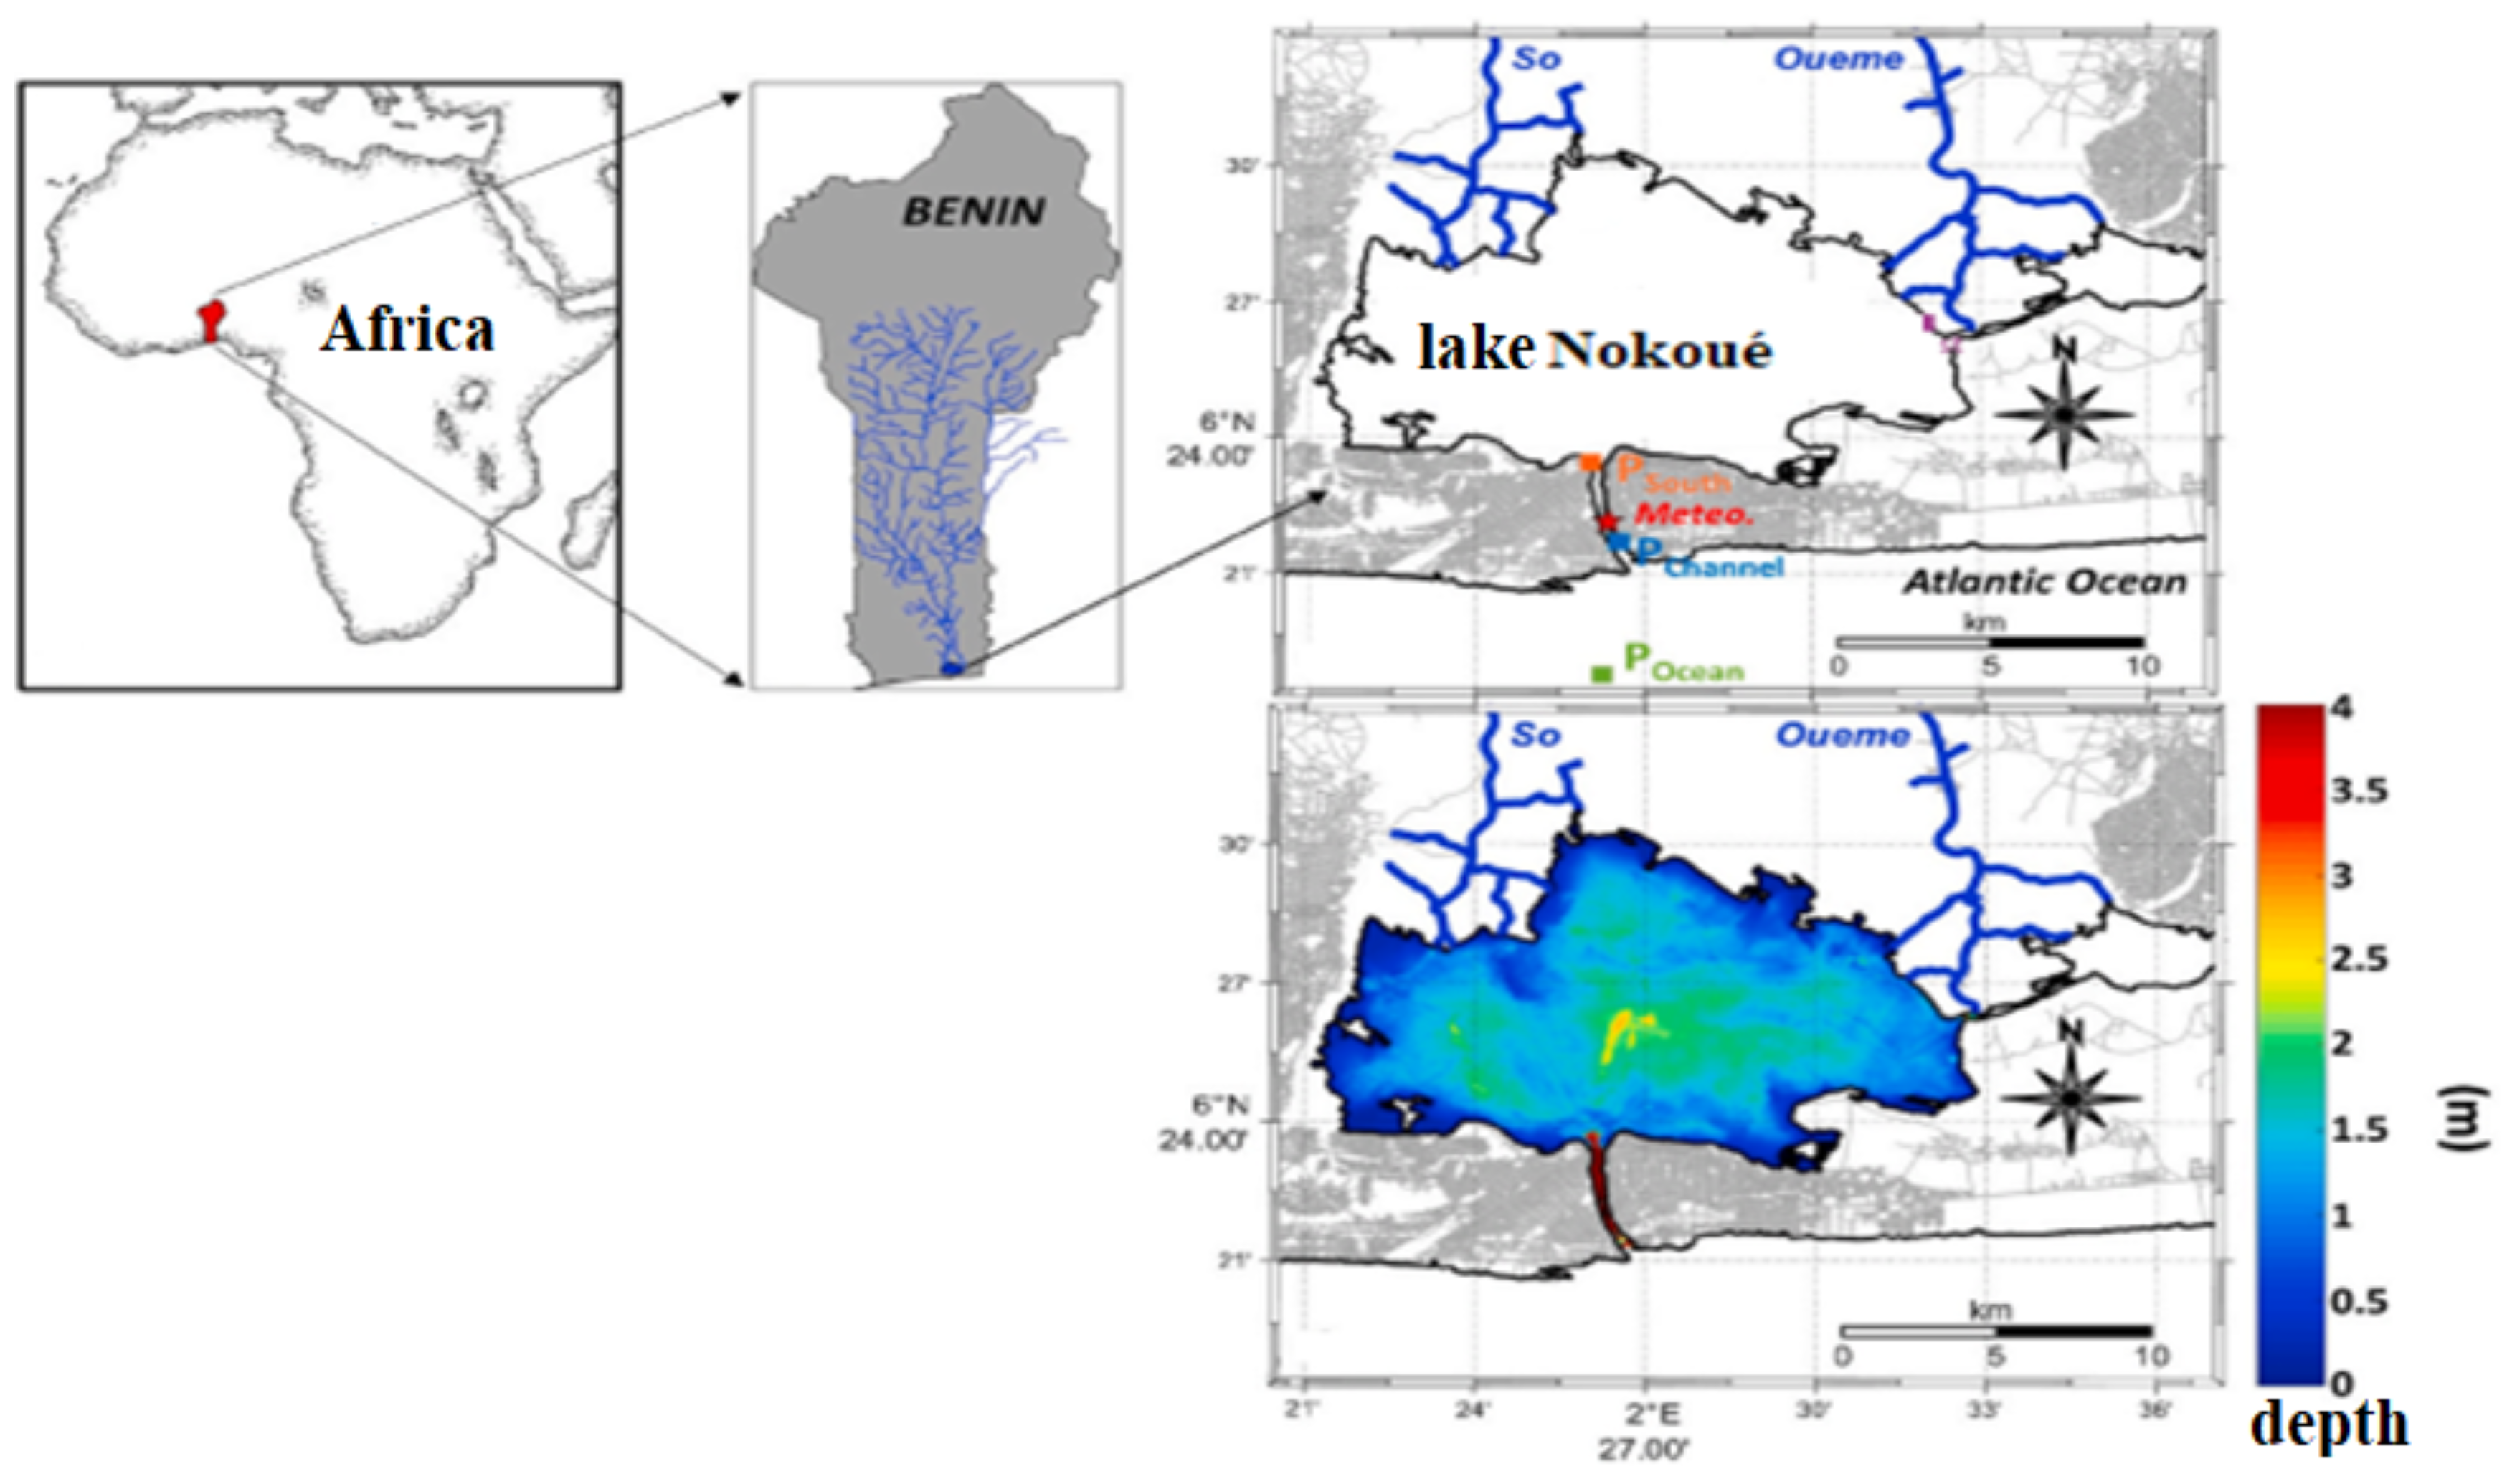
2.1. Study areas
2.2. Implementation of frequency models
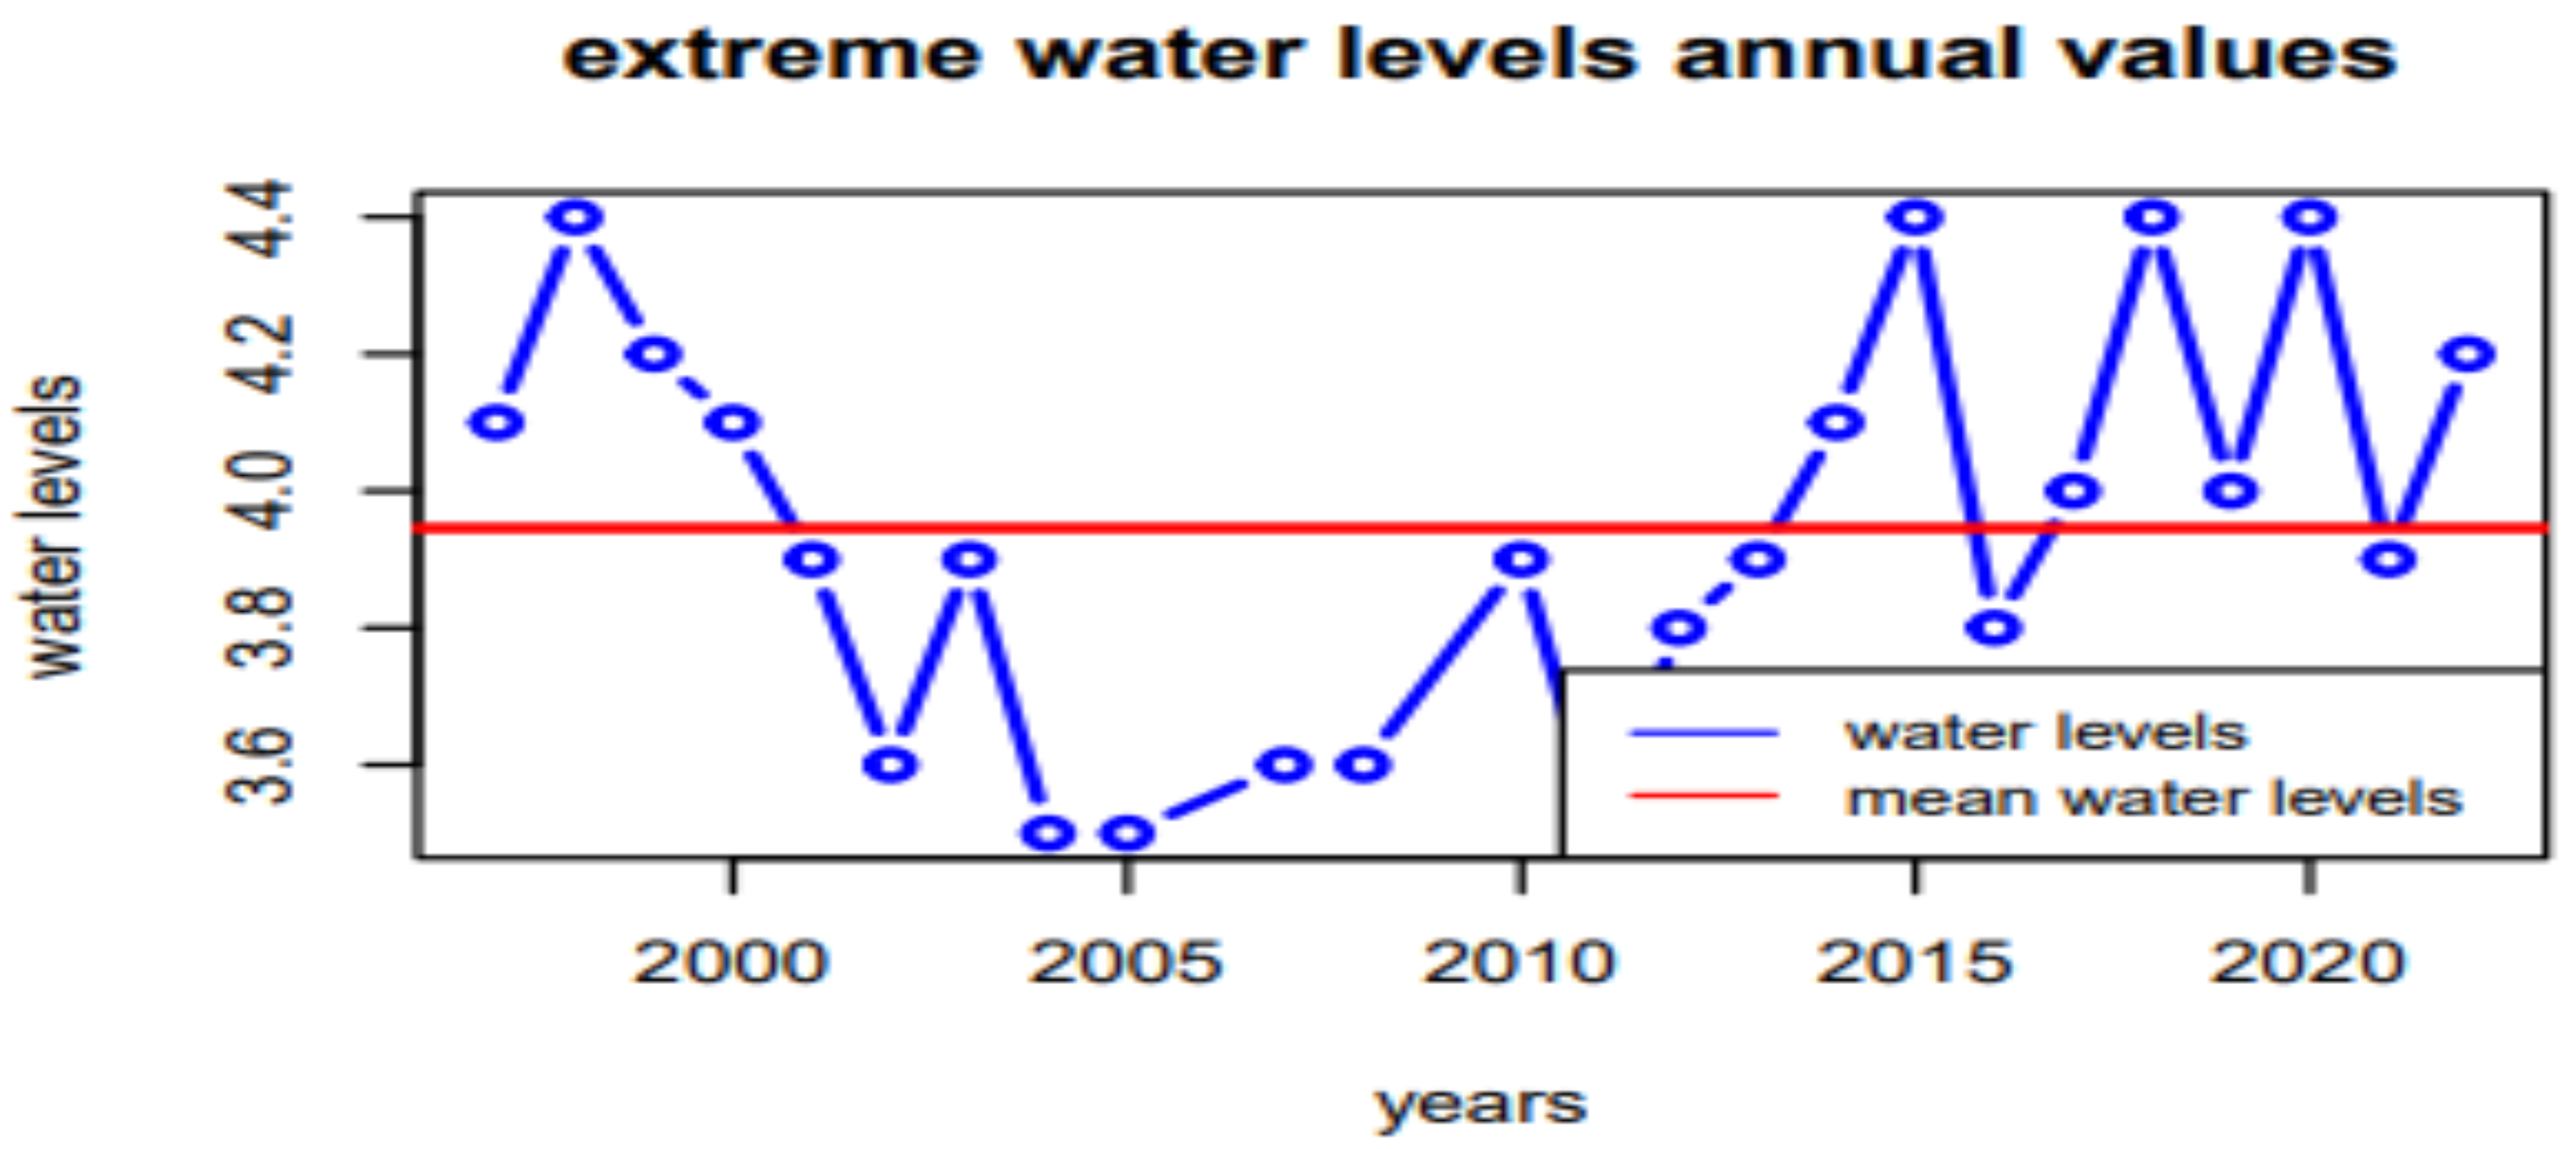
- Data on water levels of lake Nokoue
- Detection of hydrological flood risk thresholds
- Selection and calculation of empirical probabilities of observations
- Test of stationarity, independence, and homogeneity.
- Parametric fitting and extrapolation
- Model performance metrics
- Linear moments diagram
- Root Mean Square Error criterion
3. Results
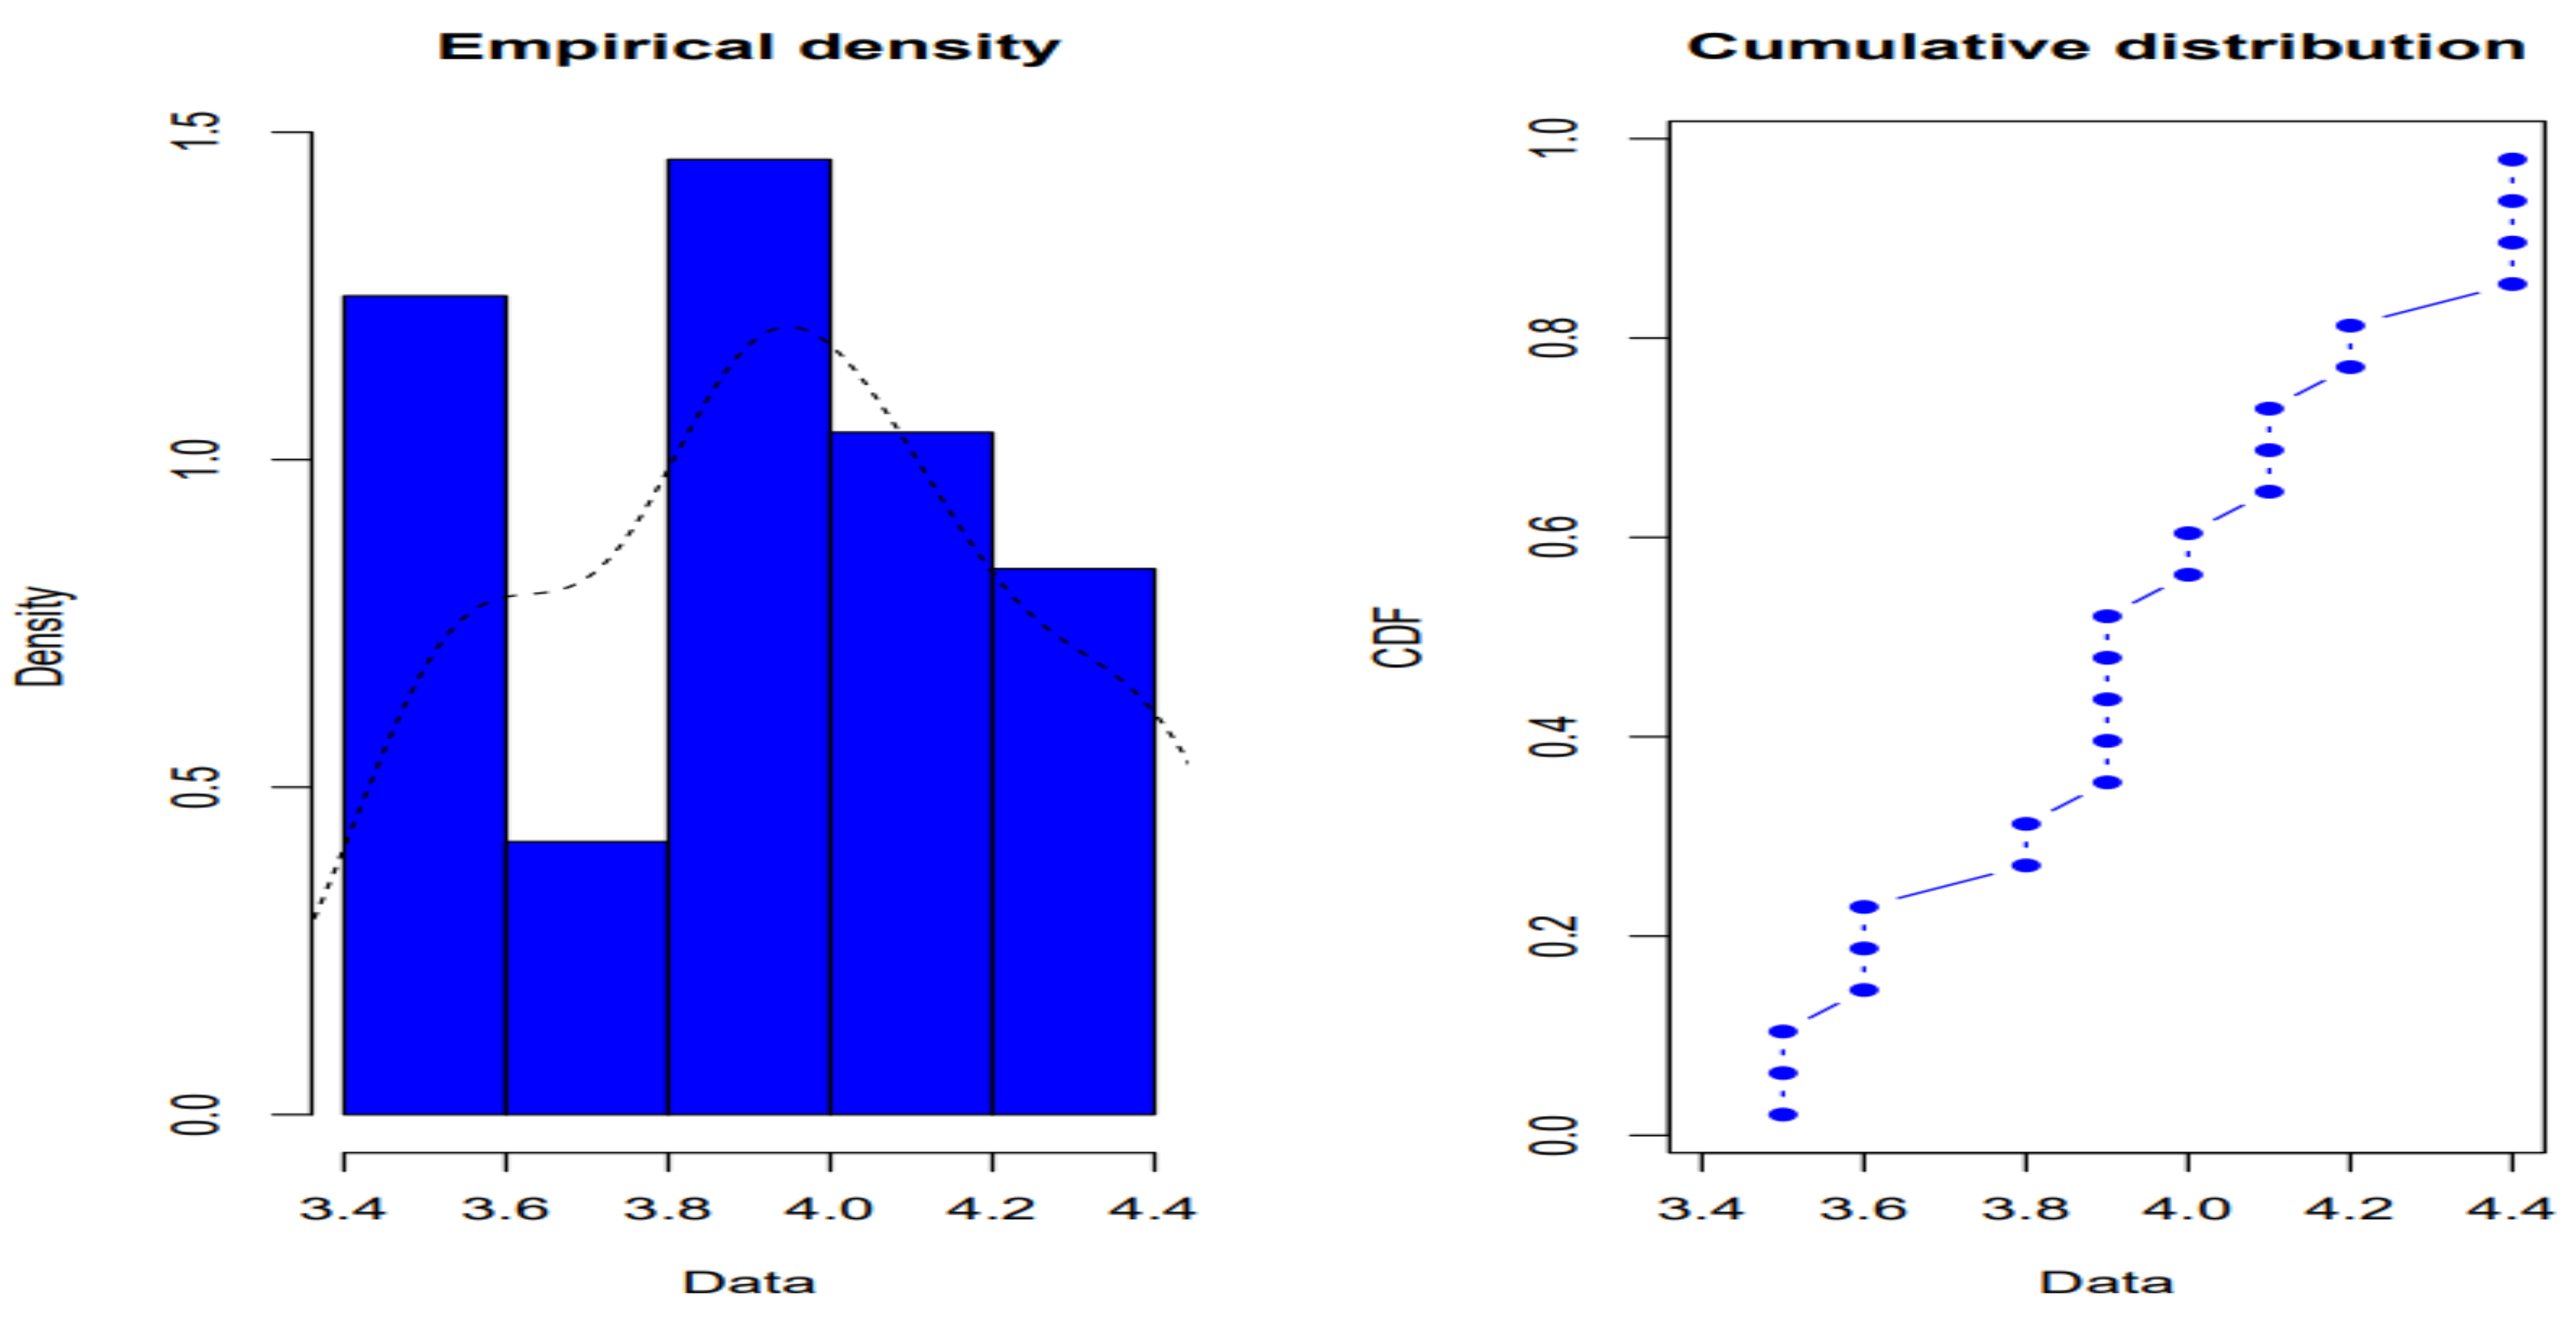
3.1. Description of the data
| min | 25% | 50% | 75% | max |
|---|---|---|---|---|
| 3.5 | 3.75 | 3.95 | 4.13 | 4.4 |
3.2. Results of hypothesis tests
- The hypothesis that the data series of annual maximum water levels is independent is accepted with a 95% confidence level. There is no correlation between the data in the series.
- The absolute value of the Mann-Kendall statistic is evaluated at 0.04. The hypothesis that there is no trend in the 10-minute and 15-minute data series is accepted at a 5% significance level.
- The absolute value of the Wilcoxon statistic is evaluated at 0.04. The mean of the two sub-samples (2015-2018 and 2019-2022) is statistically equal, meaning the series is homogeneous. Thus, the null hypothesis is accepted at a 5% significance level.
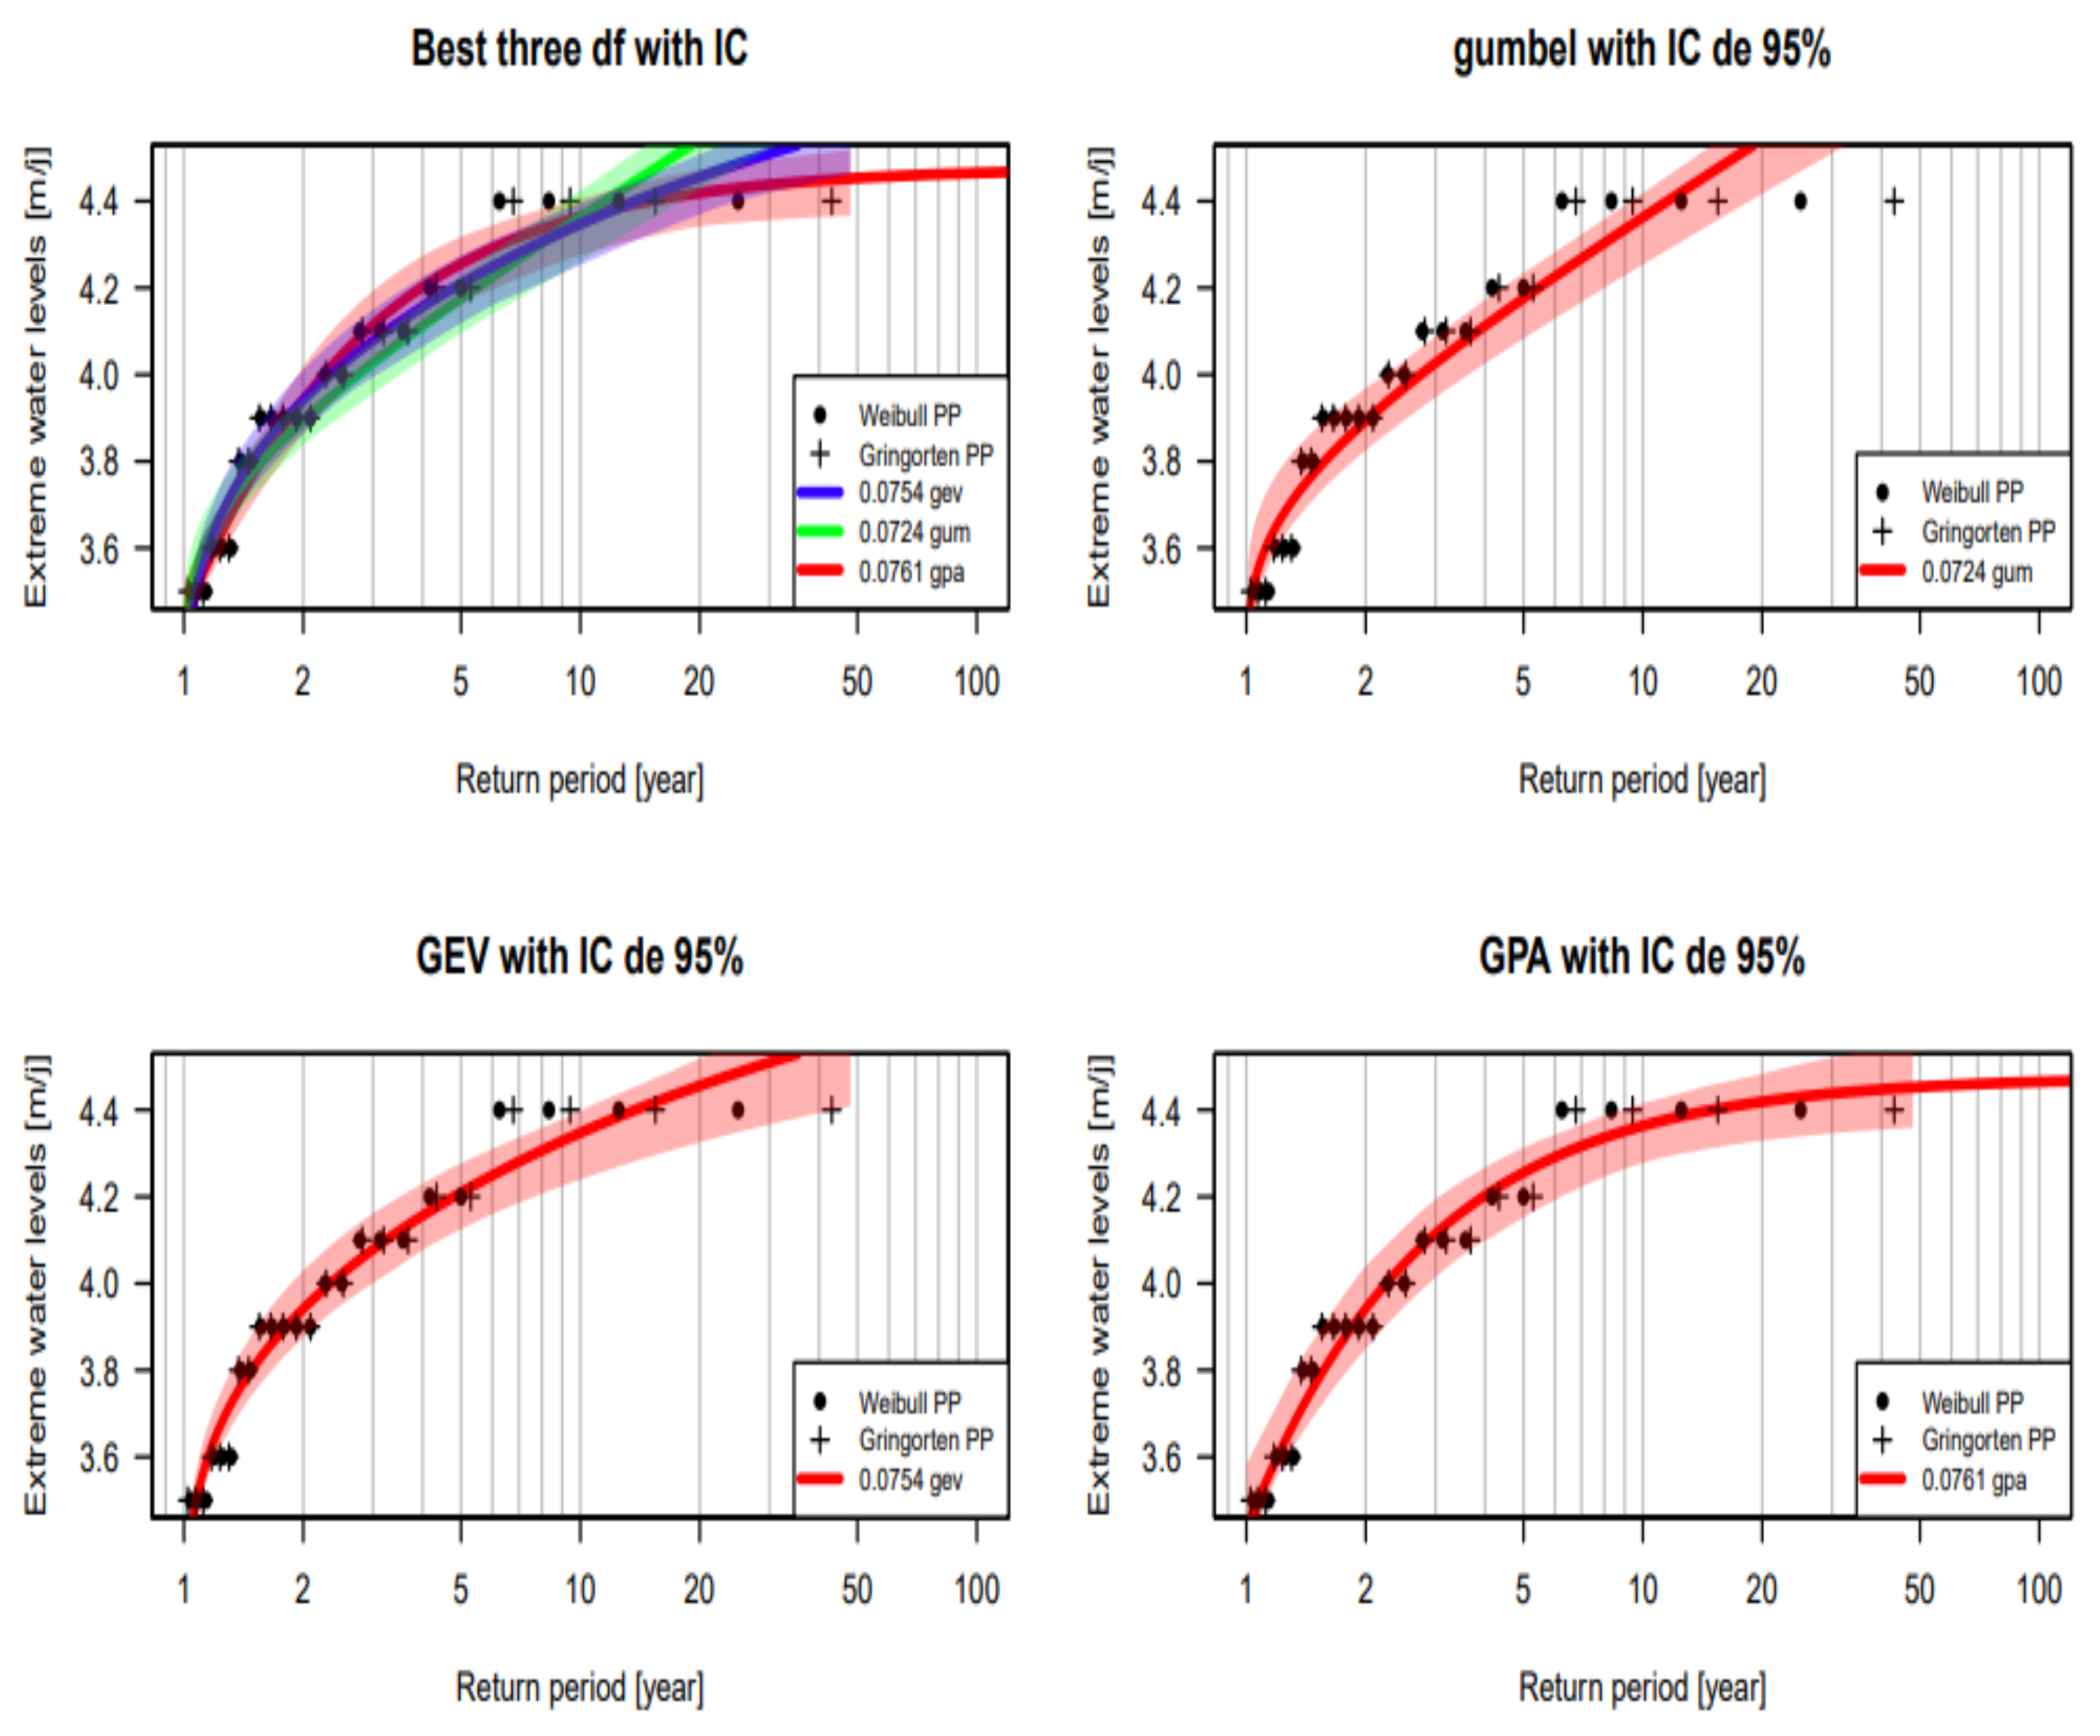
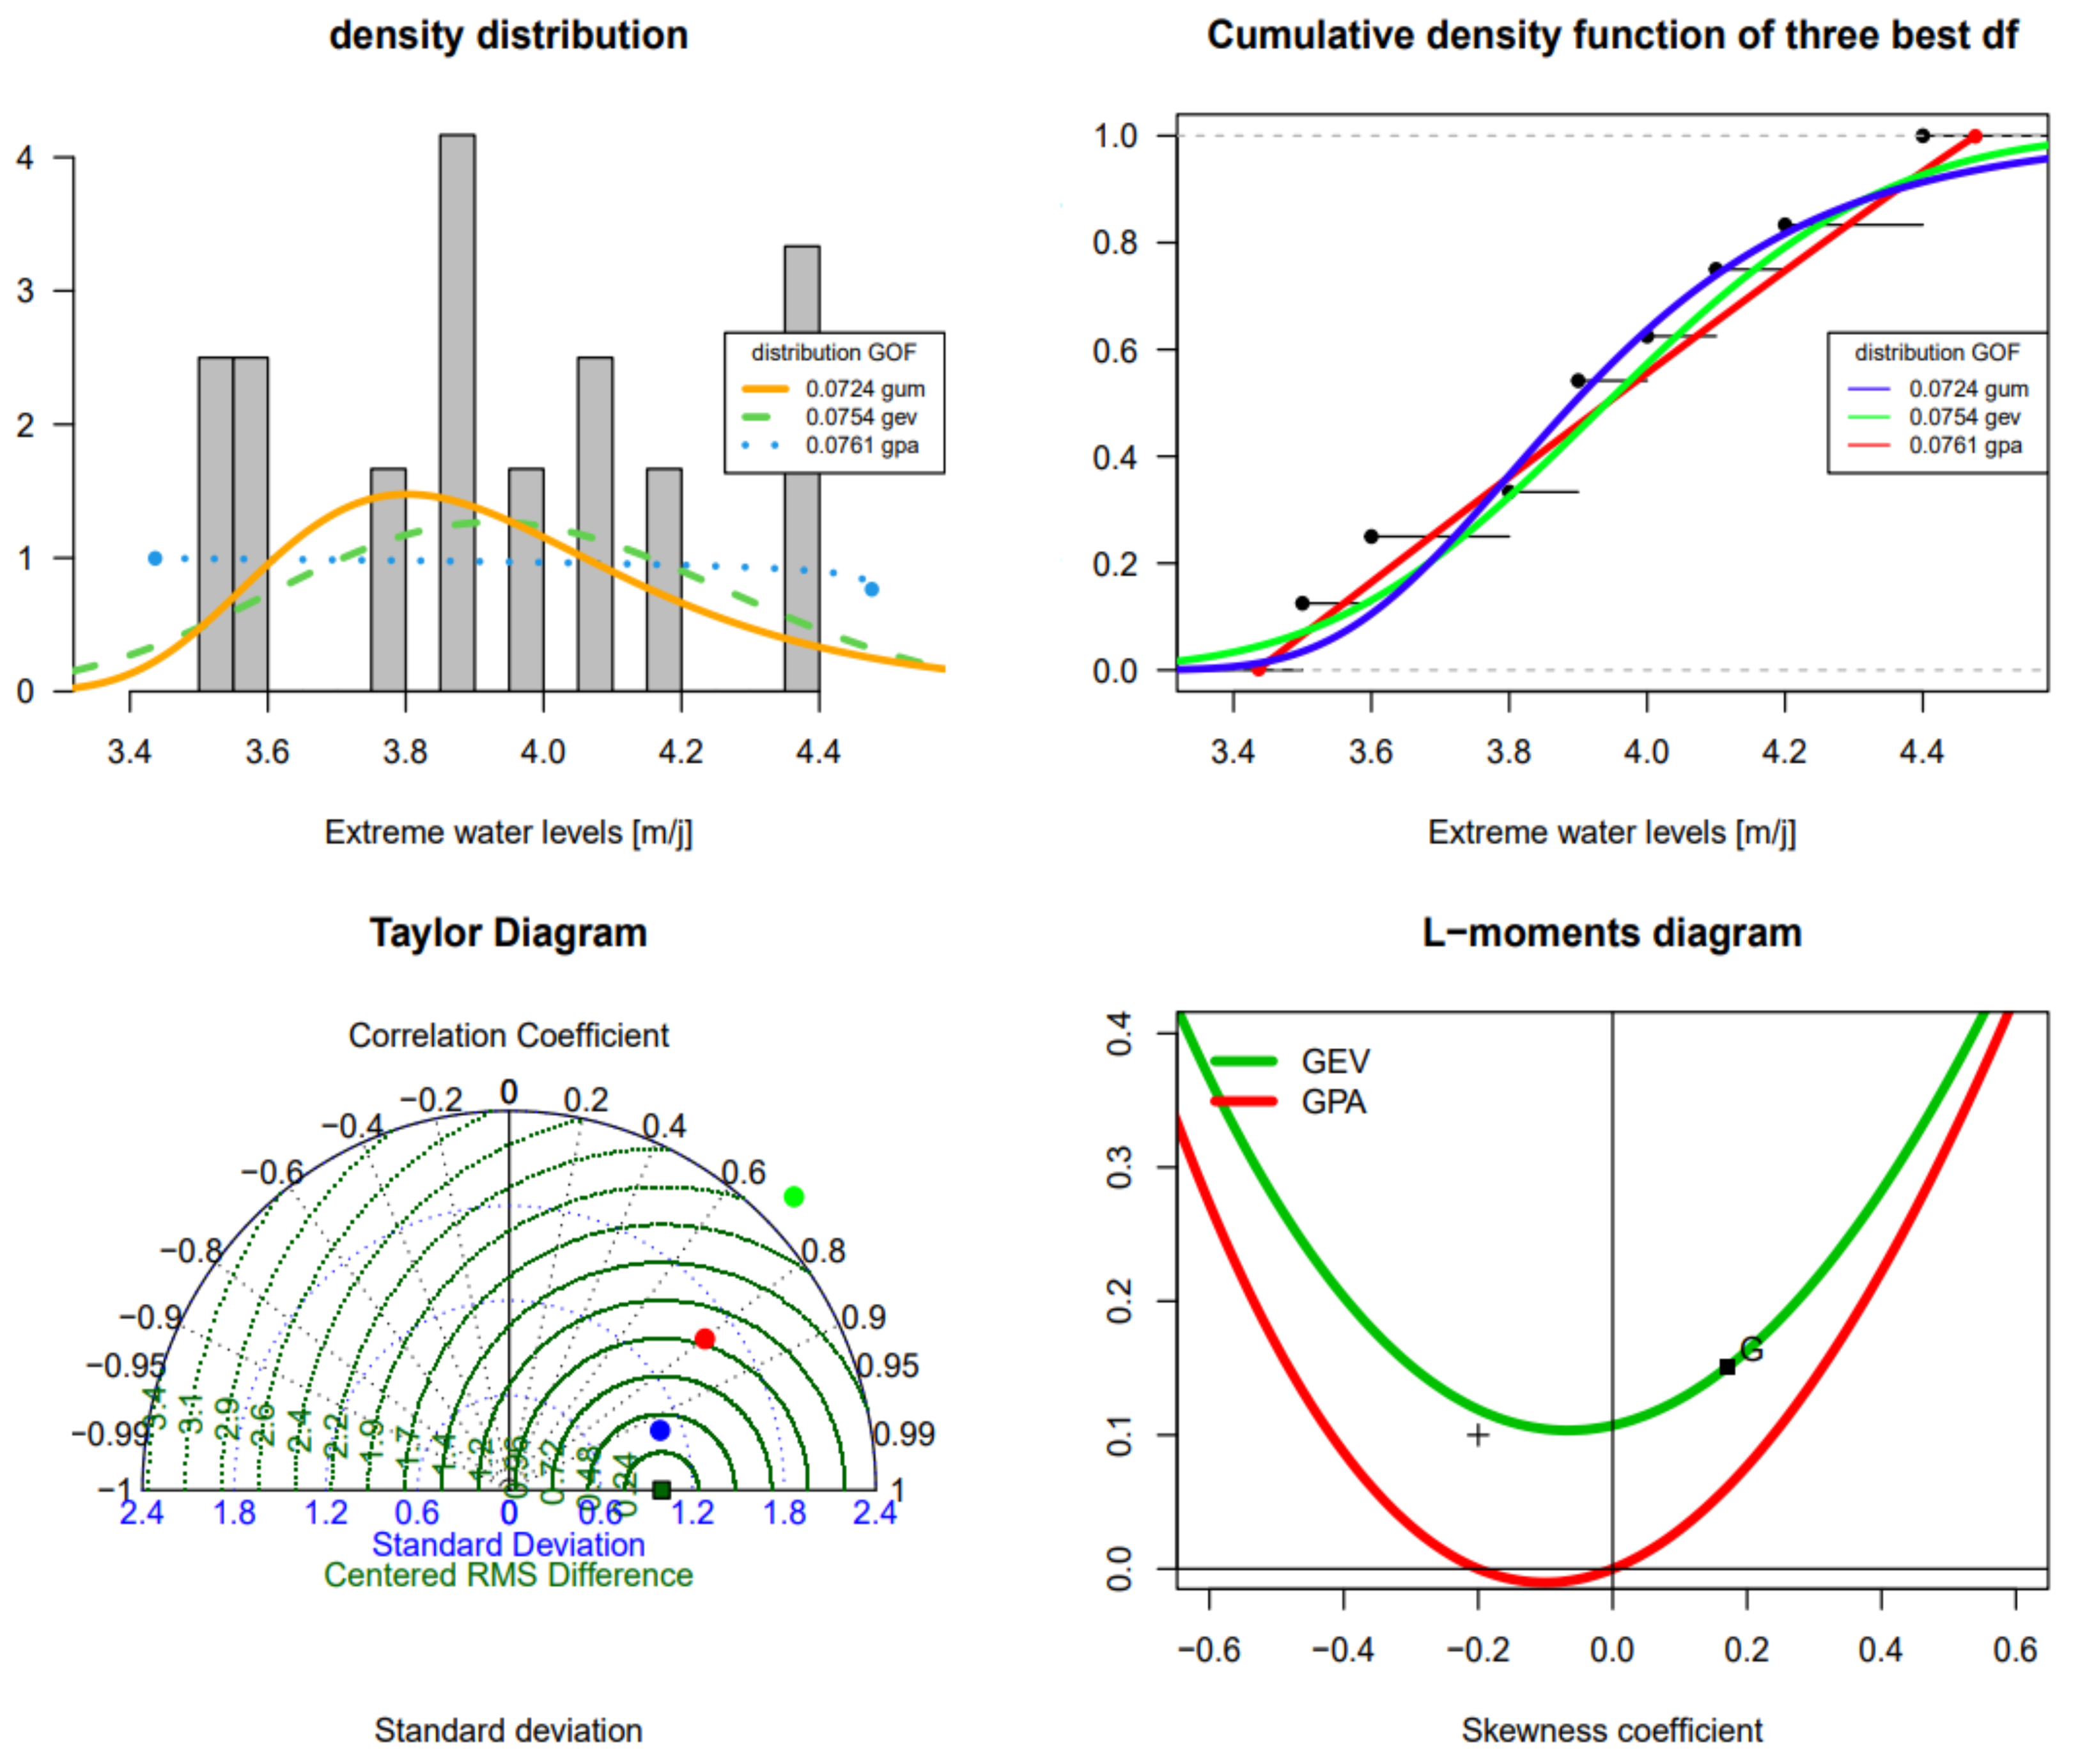
3.3. Results of the fitting to statistical distributions
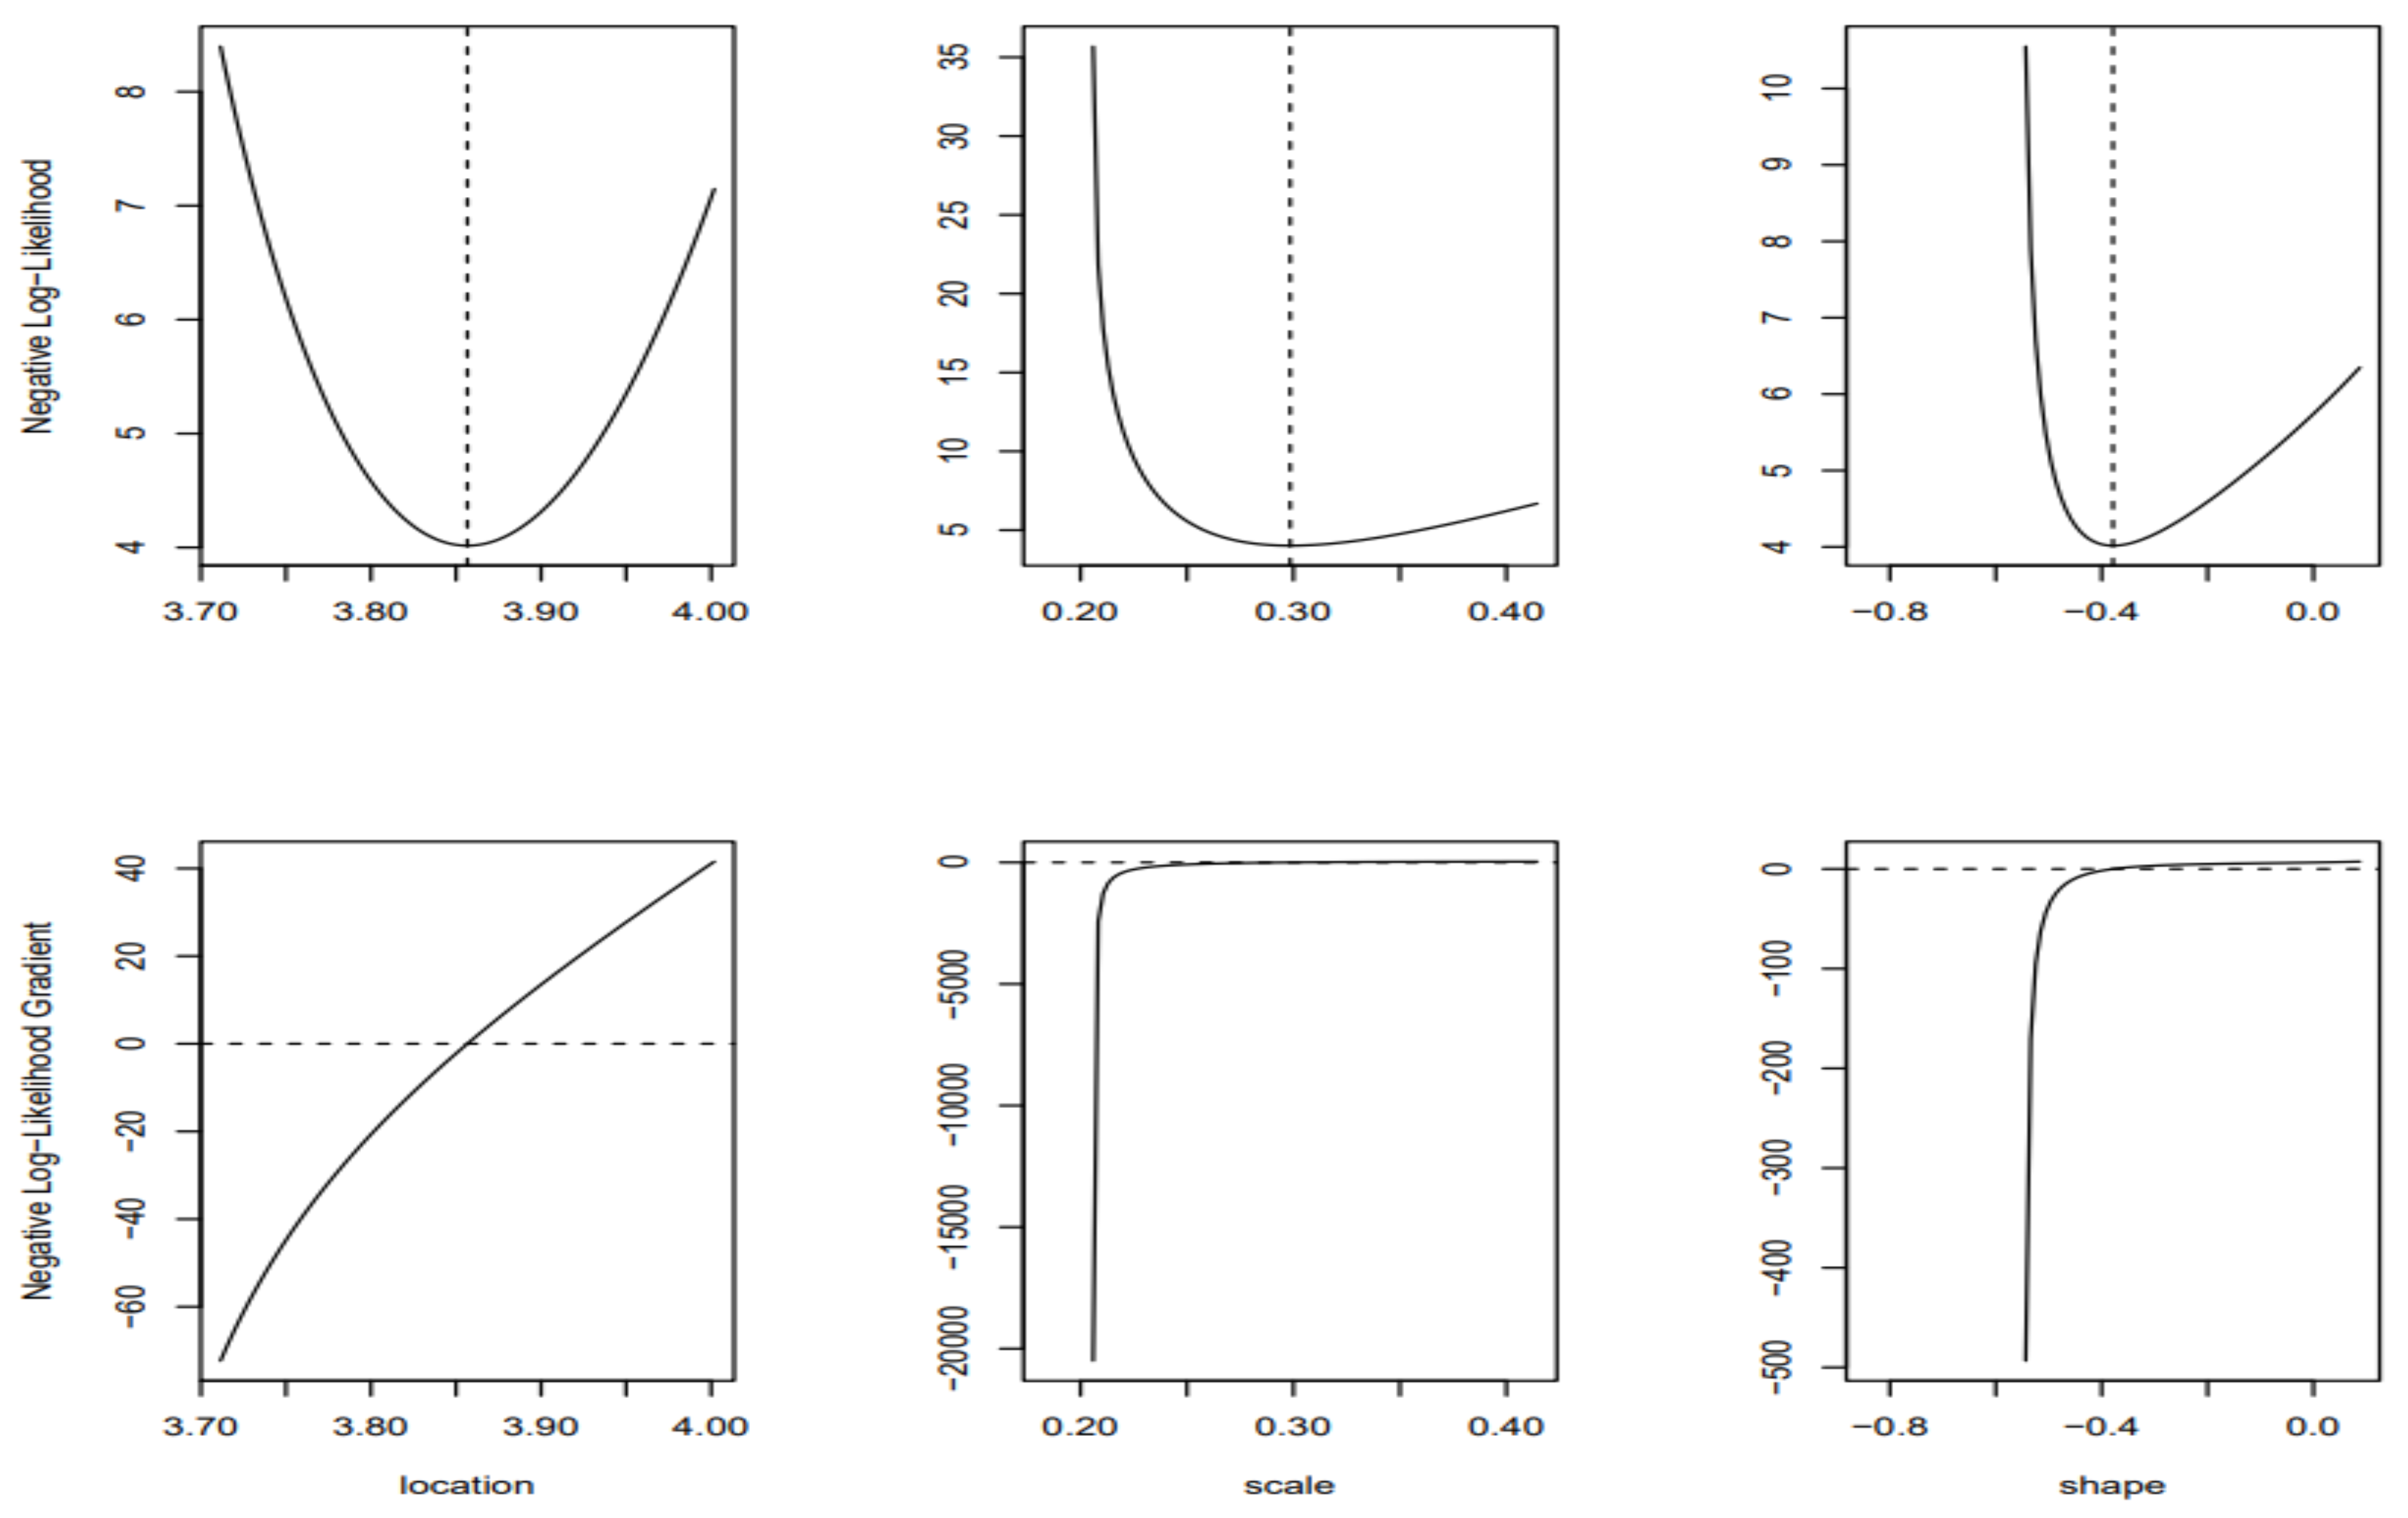
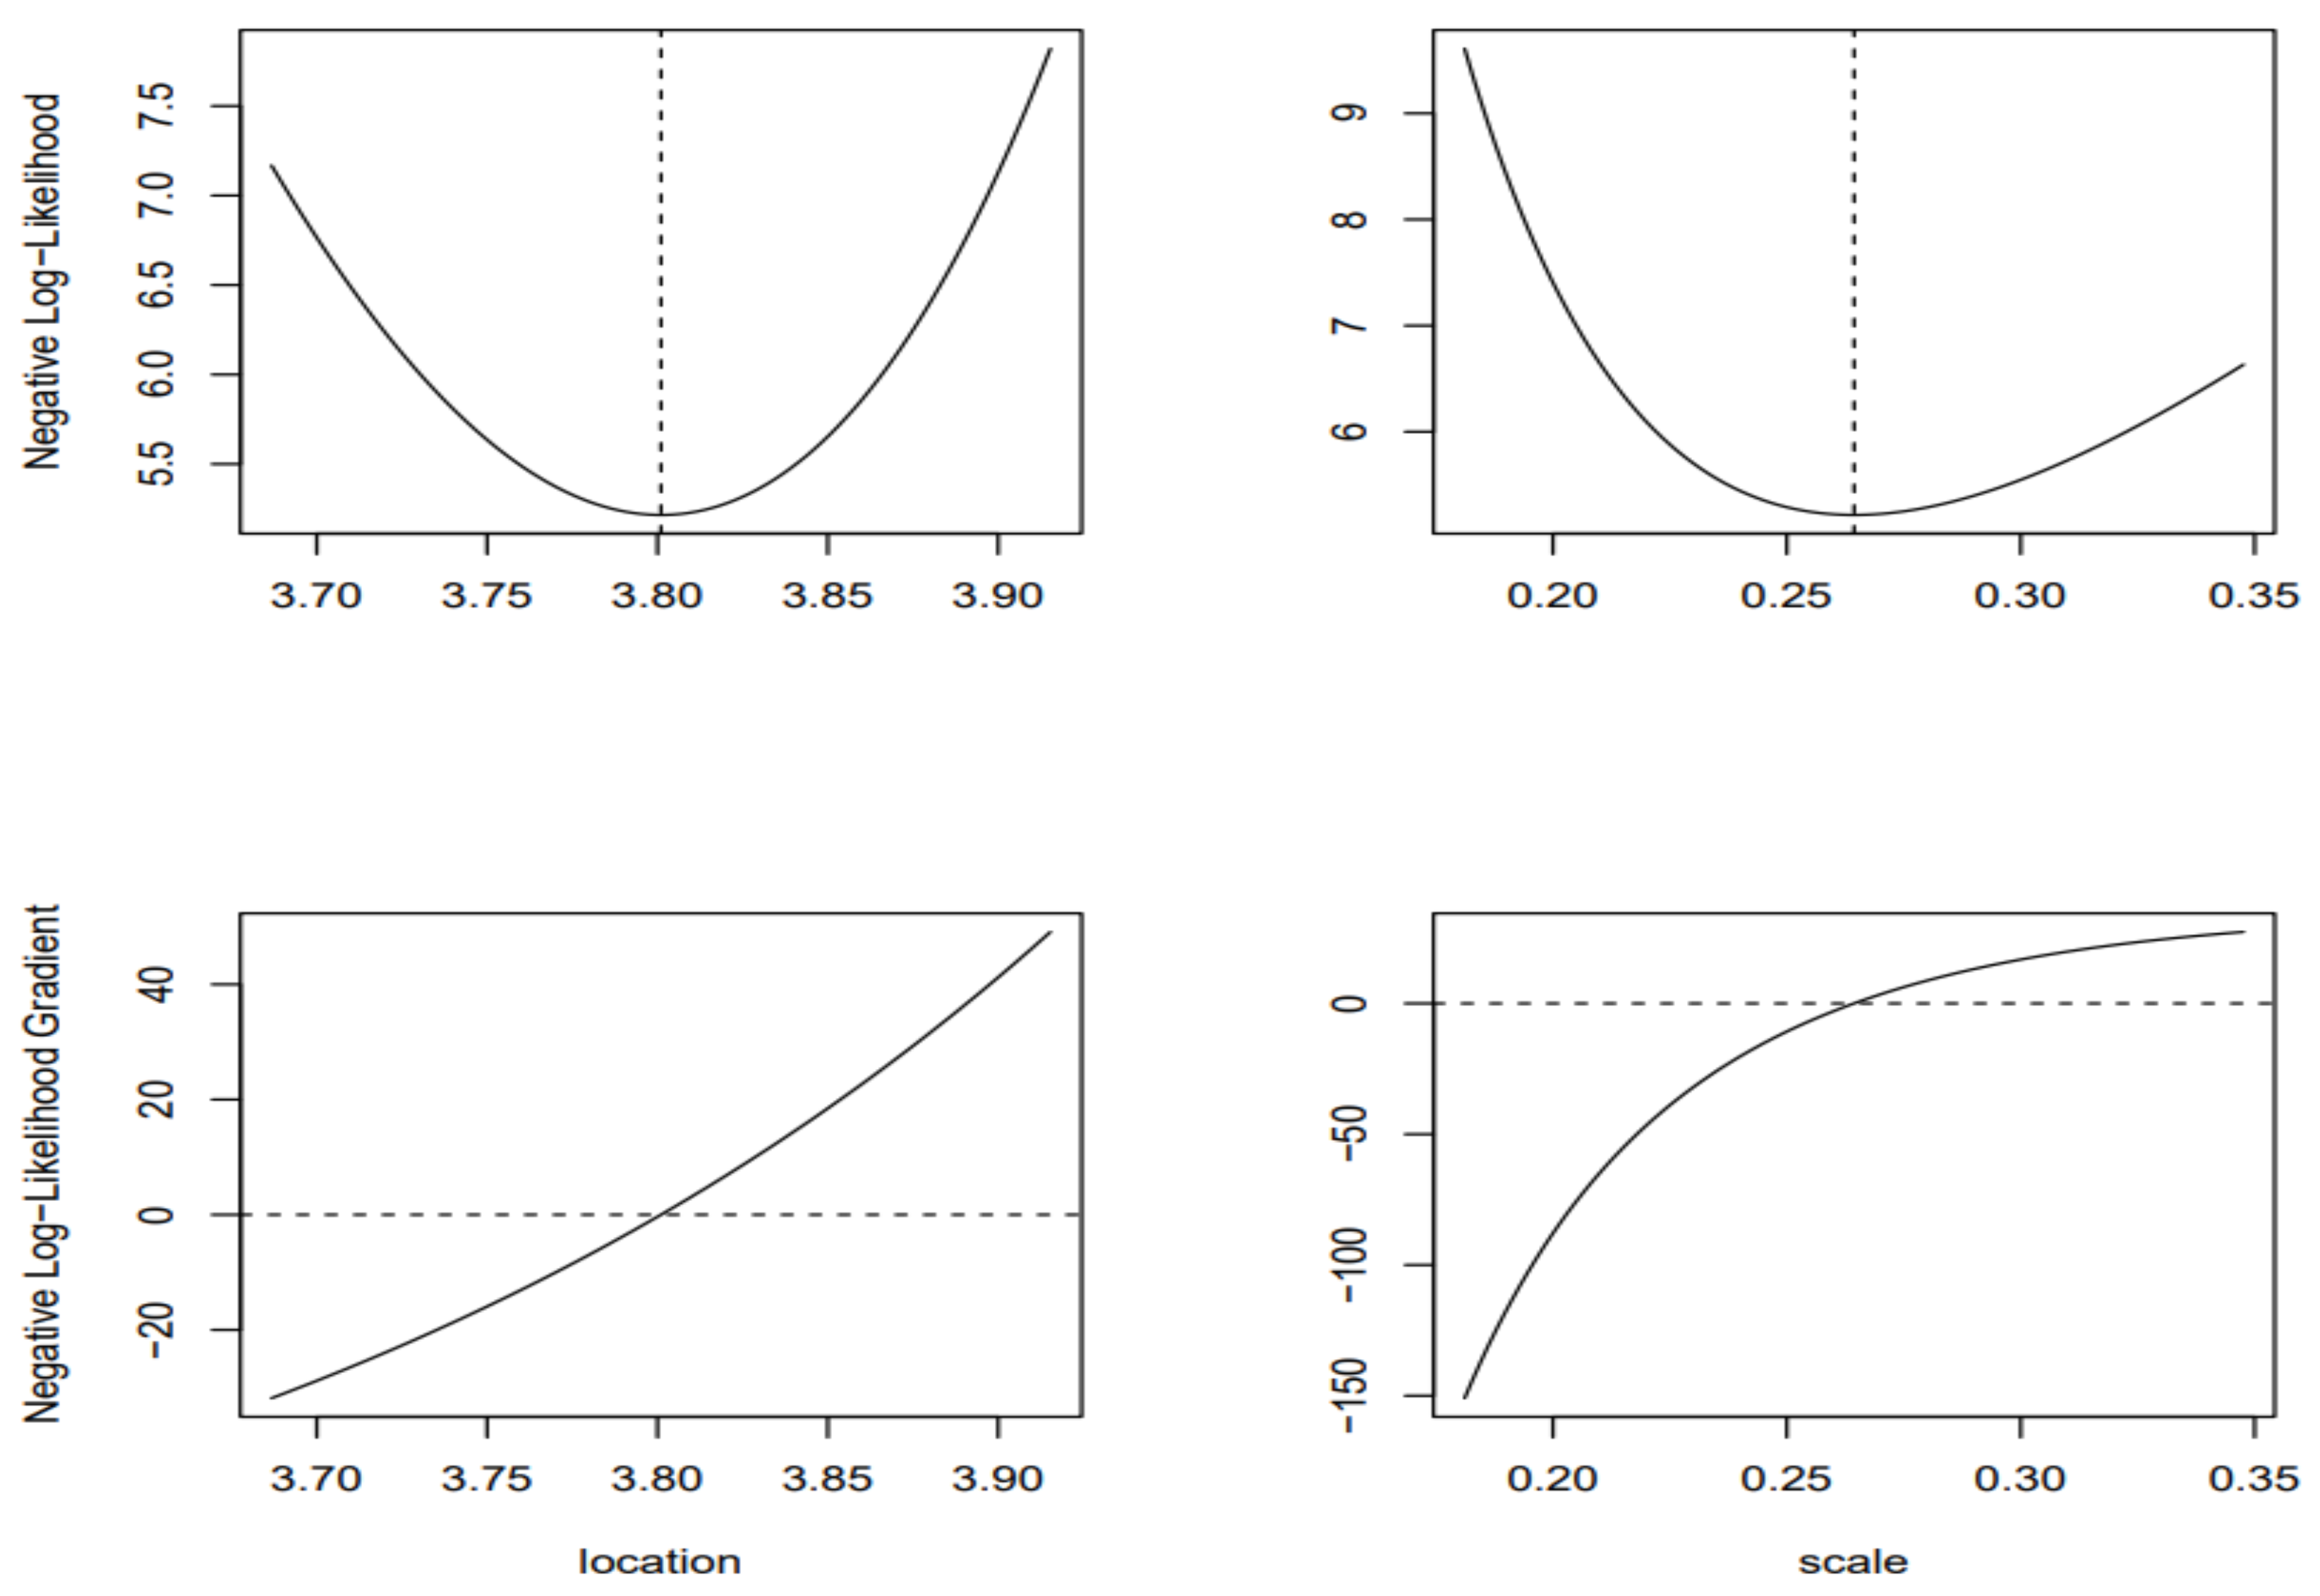
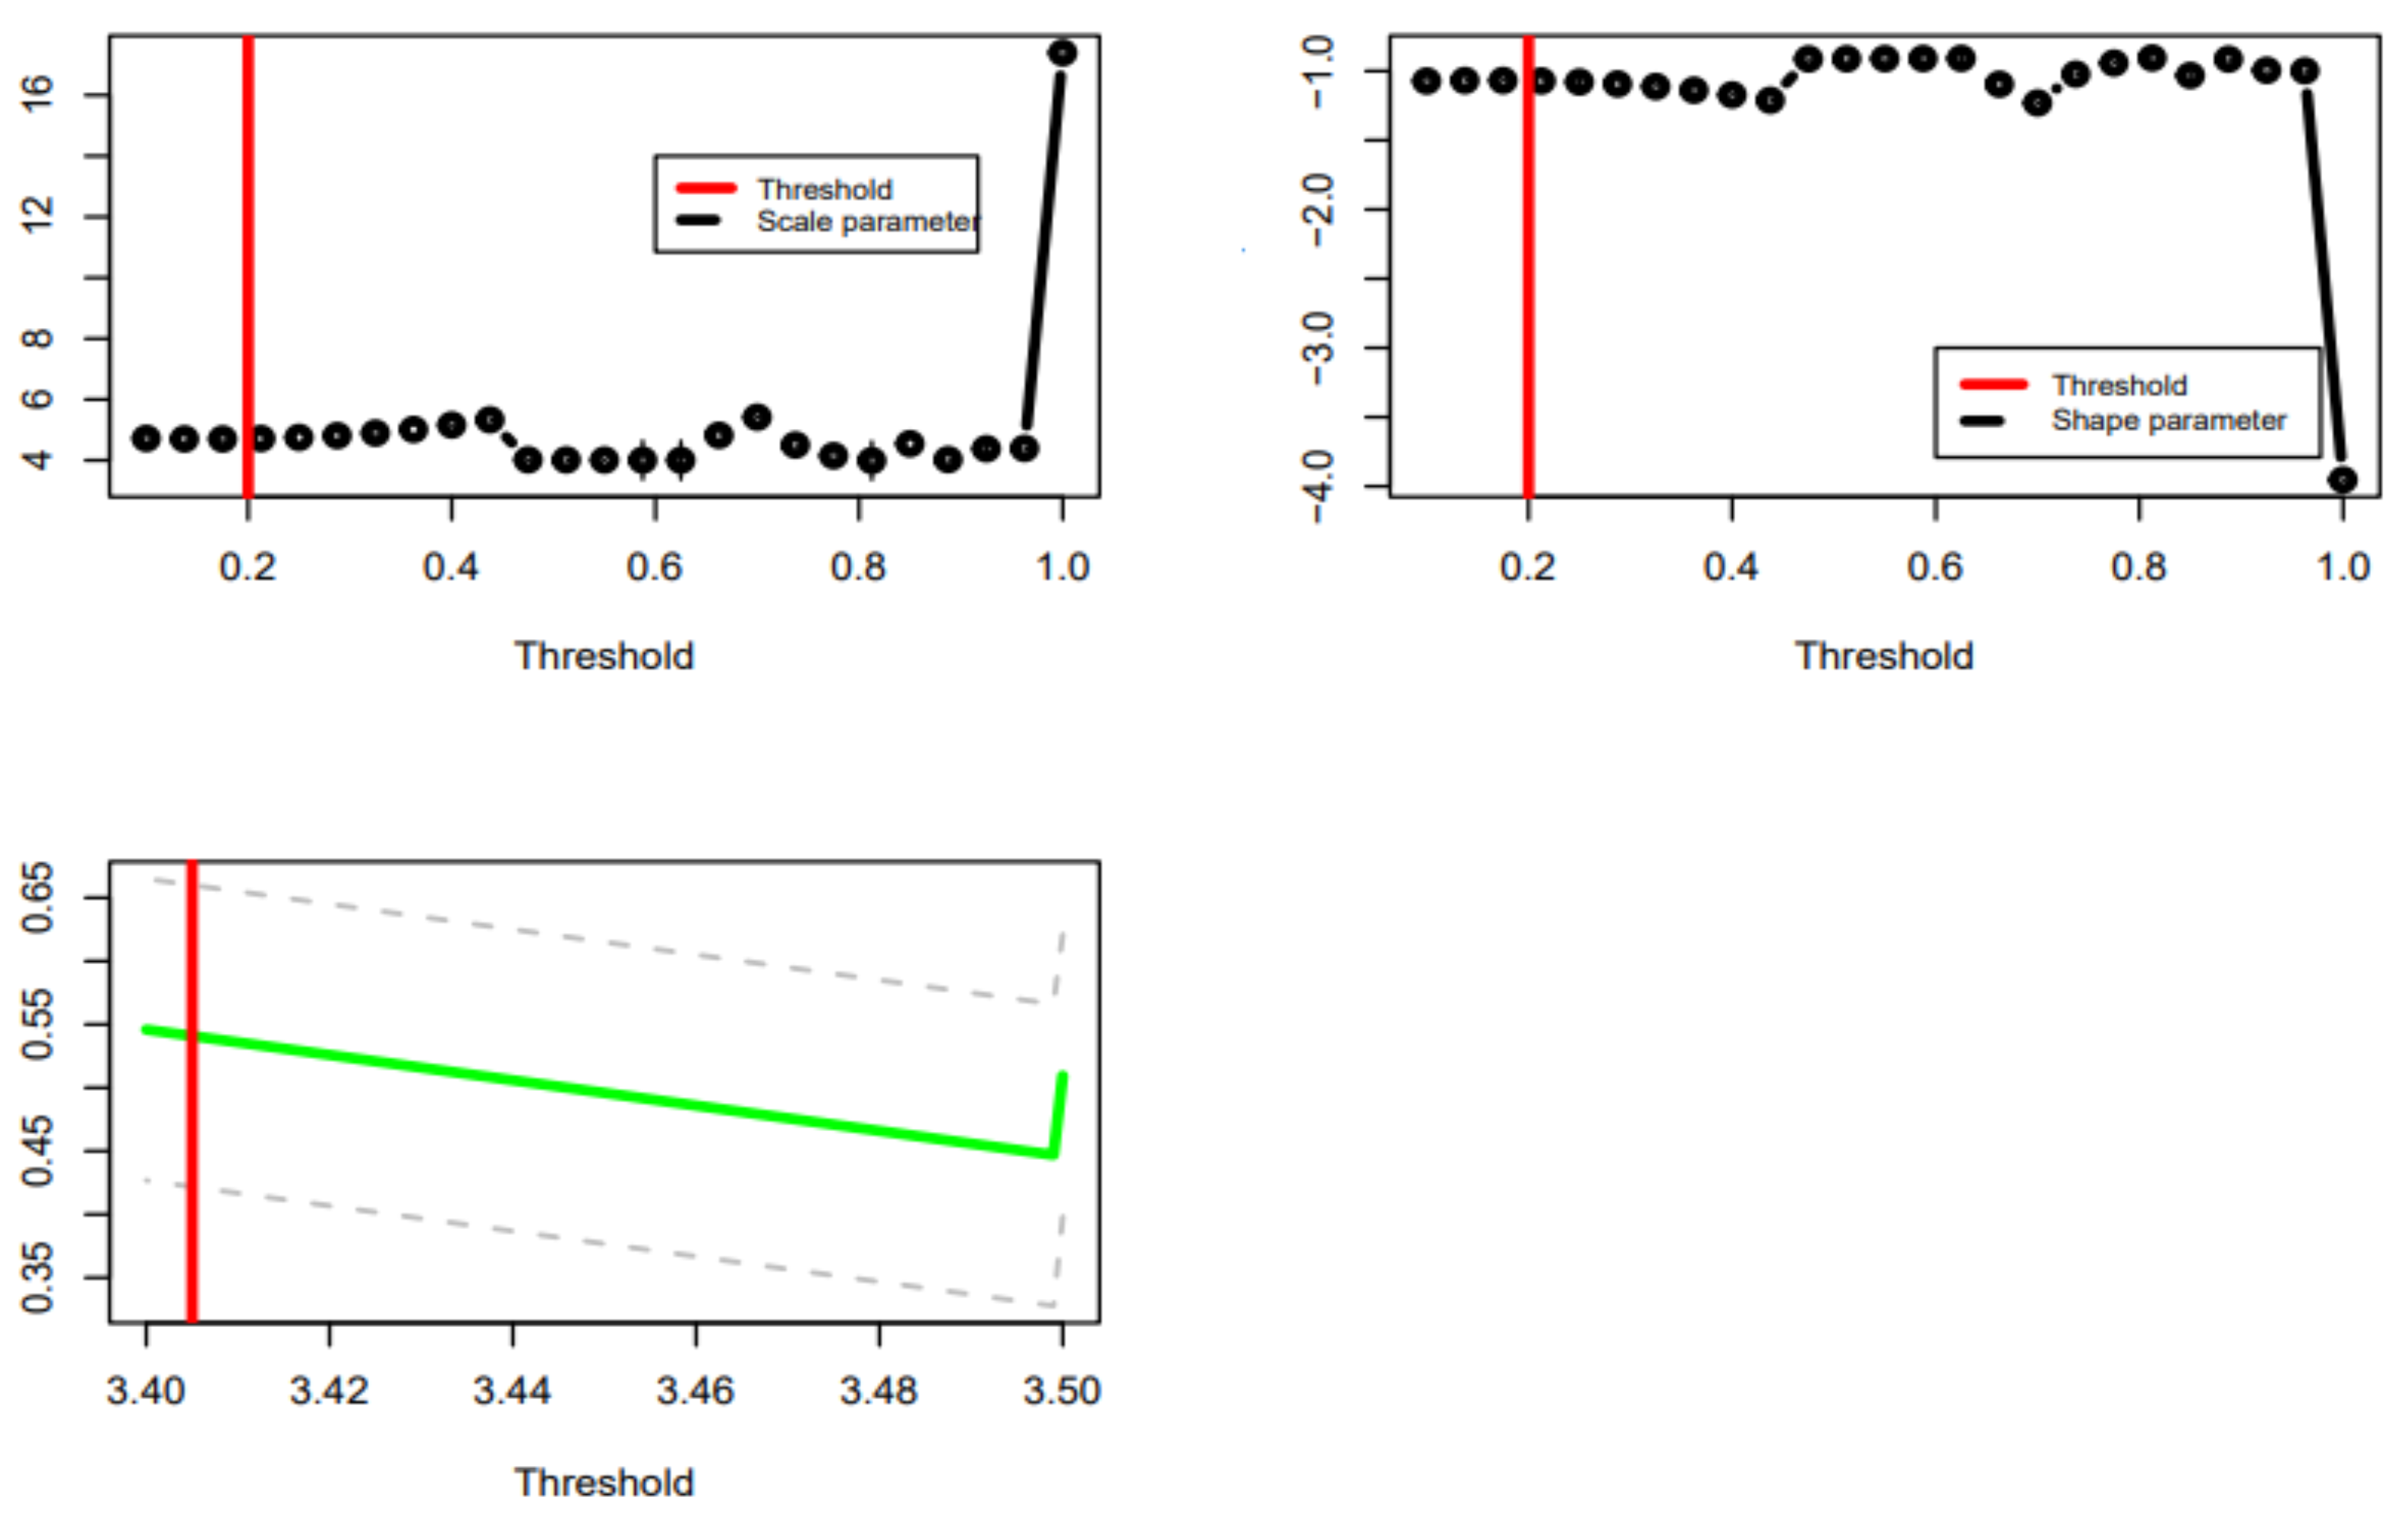
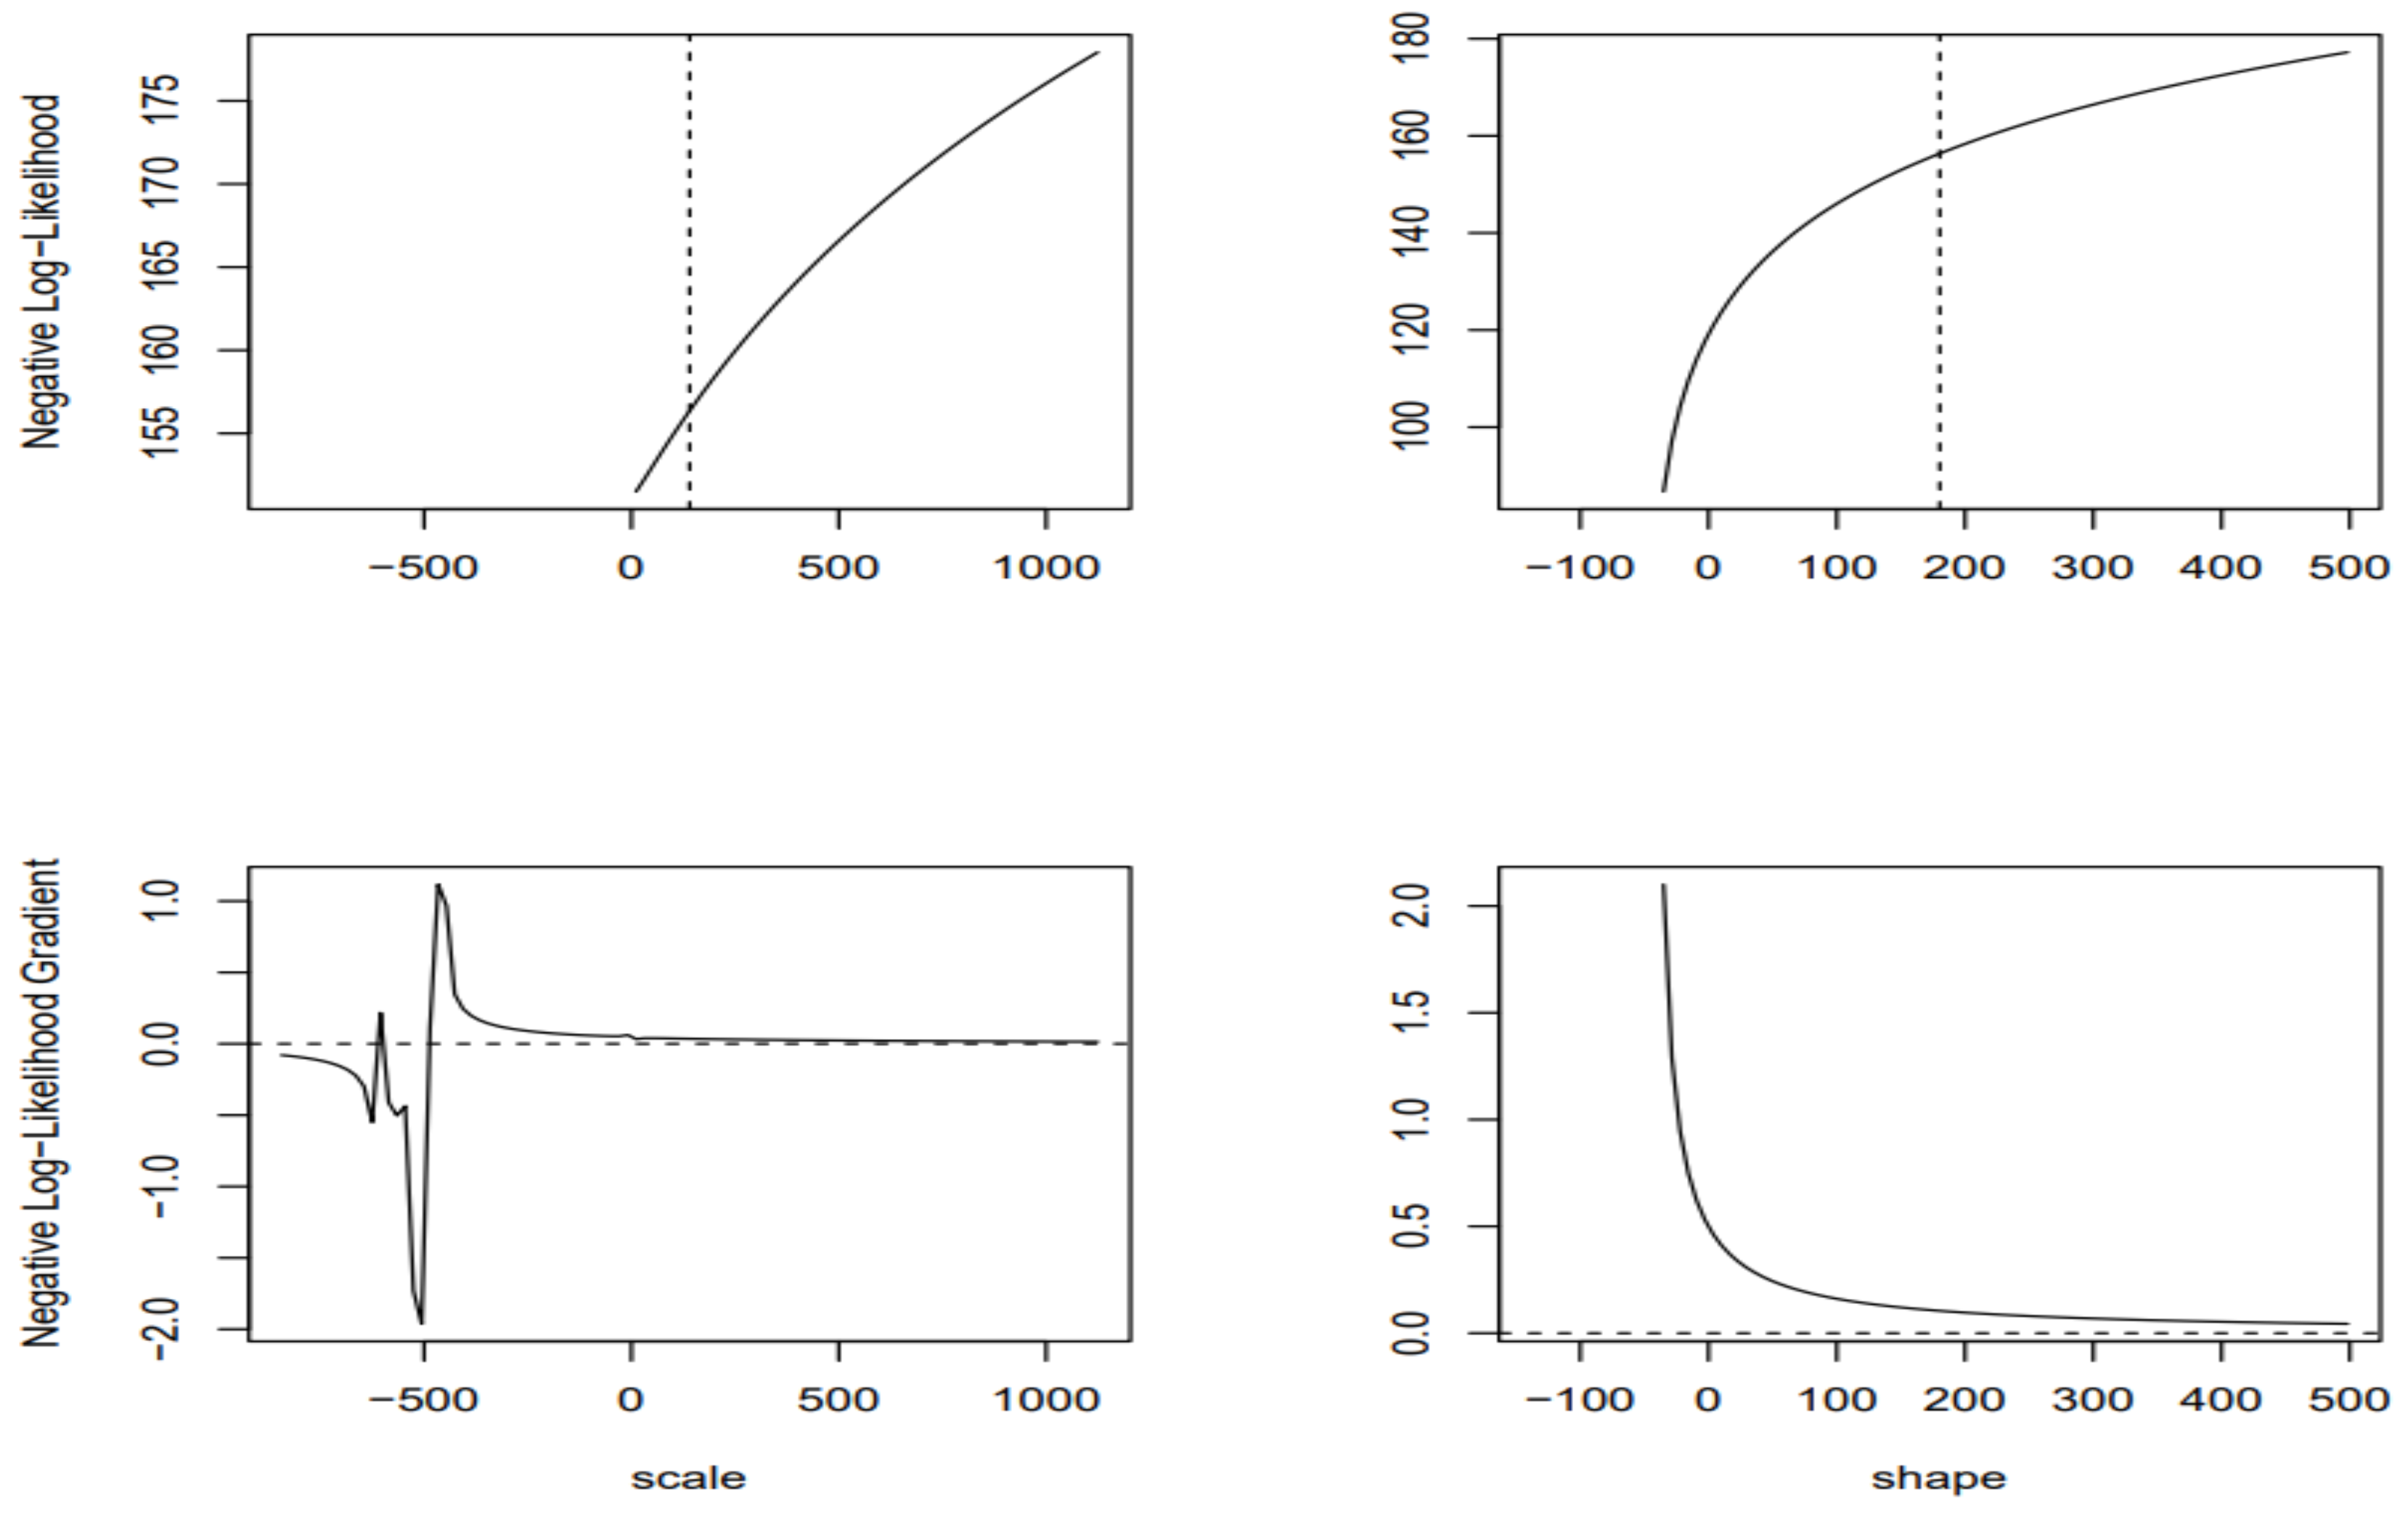
3.4. Results of the quantile estimates for the Gumbel, GEV, and GPA distributions
| Période de retour | Gumbel | GEV | GPA |
|---|---|---|---|
|
100 50 30 20 15 10 5 3 2 |
4.95 4.77 4.65 4.54 4.47 4.36 4.18 4.03 3.89 |
4.64 4.57 4.51 4.46 4.41 4.35 4.21 4.08 3.94 |
4.47 4.45 4.44 4.42 4.40 4.36 4.25 4.11 3.94 |
4. Discussion
5. Conclusion
Acknowledgments
Conflicts of Interest
References
- S. YUE et P. A. PILON. Comparison of the power of the test, Mann–Kendall and bootstrap tests for trend detection. Hydrol. Sci. J. 2004,49, 1, 21–38.
- Dabire, N.; Ezin, E.C.;Firmin, A.M. Forecasting Lake Nokoue Water Levels Using Long Short-Term Memory Network. Hydrology journal 2024. [CrossRef]
- Namwinwelbere, D., Eugène, E. C., & Firmin, A. M. Current State of Flooding and Water Quality of Nokoue Lake in Benin (Ouest Africa). European Journal of Environment and Earth Sciences 2022, 3(6), 75–81. [CrossRef]
- N. Dabire, E.C. Ezin and A.M. Firmin. Water quality index of lake Nokoue prediction using random forest and artificial neural network Int. J. of Adv. Res 2024, 610-624.
- N. Dabire, E. C. Ezin and A. M. Firmin, “Water Quality Assessment Using Normalized Difference Index by Applying Remote Sensing Techniques: Case of Lake Nokoue,” 2024 IEEE 15th Control and System Graduate Research Colloquium (ICSGRC), Shah Alam, Malaysia, 2024, pp. 1-6. [CrossRef]
- Meylan, P. et Musy, A., 1999. Hydrologie fréquentielle. Editions H.G.A Bucarest, p.413.
- Paturel J. E. et Servat E. Variabilité du régime pluviométrique de l’Afrique de l’Ouest non sahélienne entre 1950 et 1989 : Hydrological Sciences Journal 1998, 43, 921-935.
- Liang Peng and A.H. Welsh. Robust estimation of the generalized pareto distribution. Extremes 2001, 4(1), 53–65. [CrossRef]
- Smith R. L 1994. Multivariate Threshold Methods. Kluwer, Dordrecht.
- Meylan, P., Favre, A.C, Musy, A. Hydrologie fréquentielle : Une science prédictive. Presses Polytechniques et Universitaires Romandes, 2008, 168. Édition : Édition du millénaire, p.265.
- Coles S. An Introduction to Statistical Modelling of Extreme Values. Springers Series in Statistics, 2001, London.
- Laborde J.P. Eléments d’hydrologie de surface. L’Université de Nice-Sophia Antipolis, Edition Centre National de la Recherche Scientifique (C.N.R.S), 2000, 8- 137.
- Hosking J.R.M. and J.R. Wallis. Parameter and quantile estimation for the generalized pareto distribution. Technometrics 1987, 29(3), 339–349.
- Kluppelberg C. and A. Bivariate extreme value distributions based on polynomial dependence ¨ functions. Math Methods Appl Sci, 2006, 29(12),1467–1480. [CrossRef]
- B. T. Goula, A. Konan, T. Brou, Y. Issiaka, S. V. Fadika et B Srohourou. Estimation des pluies exceptionnelles journalières en zone tropicale: cas de la Côte d’Ivoire par comparaison des lois log normale et de Gumbel. Hydrological sciences journal, 2007, 52 (1), 49 -67.
- Habibi, M. Meddi et A. Boucefiane. Analyse fréquentielle des pluies journalières maximales : Cas du Bassin Chott-Chergui. Nature et Technology 2013, (8), 41.
- N. Soro, T. Lasm, B. H. Kouadio, G. Soro, K. E. Ahoussi. Variabilité du régime pluviométrique du Sud de la Côte d’Ivoire et son impact sur l’alimentation de la nappe d’Abidjan. Rev. Sud Sciences et technologies 2006, (14), 30-40.
- Mises, R., von. La distribution de la plus grande de n valeurs. Selected papers, 1954,2, 271-294.
- Bortot P. and S. Coles. The multivariate gaussian tail model: An application to oceanographic data. Journal of the Royal Statistical Society. Series C: Applied Statistics 2000, 49(1), 31–49. [CrossRef]
- Coles, J. Heffernan, and J. Tawn. Dependence measures for extreme value analyses. Extremes 1999, 2(4), 339–365.
- Fisher R.A. and L.H. Tippett. Limiting forms of the frequency distribution of the largest or smallest member of a sample. In Proceedings of the Cambridge Philosophical Society 1928, 24, 180–190. [CrossRef]
- Fréchet M. Sur la loi de probabilité de l’écart maximum. Annales de la Société polo-naise de Mathématique 1927, 6. Cracovie.
- Gumbel É.J. Statistical theory of extreme values and some practical applications. National Bureau of Standards 1954, Washington. [CrossRef]
- Jenkinson A. F. The frequency distribution of the annual maximum (or minimum) values of meteorological events. Quaterly Journal of the Royal Meteorological Society 1955, 81,158–172.
- Jowitt, P.W. The extreme-value type 1 and the principal of maximums entropy. J. Hydrol 1979, 42, 23-38.
- Ju’arez S.F. and W.R. Schucany. Robust and efficient estimation for the generalized pareto distribution. Extremes 2004, 7(3),237–251. [CrossRef]
- Pickands J 1981. Multivariate extreme value distributions. In Proceedings 43rd Session International Statistical Institute.
- Pickands J. III 1975. Statistical inference using extreme order statistics. Annals of Statistics, 3:119–131.
- CIEH. Courbes hauteur de pluie-fréquence Afrique de l‘Ouest et Centrale pour des pluies de durée 5 mn à 24 h. 1984.
- Christophe Ancey. Risques hydrologiques et aménagement du territoire. École Polytechnique Fédérale de Lausanne, Ecublens, CH-1015 Lausanne, Suisse 2011.
- Cunnane C. Note on the poisson assumption in partial duration series model. Water Resour Res, 1979, 15(2), 489–494. [CrossRef]
- Matthew J. Purvis, Paul D. Bates, Christopher M. Hayes. A probabilistic methodology to estimate future coastal flood risk due to sea level rise,Coastal Engineering 2008, 55, 12, 1062-1073. [CrossRef]
- Courtney M. Thompson, Tim G. Frazier, Deterministic and probabilistic flood modeling for contemporary and future coastal and inland precipitation inundation, Applied Geography 2014, 50, 1-14. [CrossRef]
- Roman Krzysztofowicz. Probabilistic flood forecast: Exact and approximate predictive distributions, Journal of Hydrology 2014, 517, 643-651. [CrossRef]
- Pascal Lardet, Charles Obled. Real-time flood forecasting using a stochastic rainfall generator, Journal of Hydrology 1994, 162, 3–4, 391-408. [CrossRef]
- Shien-Tsung Chen, Pao-Shan Yu. Real-time probabilistic forecasting of flood stages, Journal of Hydrology 2007, 340, 12, 63-77. [CrossRef]
- Roman Krzysztofowicz. The case for probabilistic forecasting in hydrology, Journal of Hydrology 2001, 249, 14, 2-9. [CrossRef]
- Kupfer, S., MacPherson, L. R., Hinkel, J., Arns, A., & Vafeidis, A. T. A comprehensive probabilistic flood assessment accounting for hydrograph variability of ESL events. Journal of Geophysical Research: Oceans, 2024 ,129. [CrossRef]
- Karl-Erich Lindenschmidt, Prabin Rokaya, Apurba Das, Zhaoqin Li, Dominique Richard.
- A novel stochastic modelling approach for operational real-time ice-jam flood forecasting, Journal of Hydrology 2019, 575, 381-394.
| Risk Level | Standardized Water Height Index |
| Critical | Catastrophique Index ≥ 2.0 |
| Significant | 1.5 ≤ Index < 1.99 |
| Moderate | 1 ≤ Index < 1.49 |
| Limited | -∞≤ Index < 0.99 |
| Statistical tests | p-value |
|---|---|
| independance | 0.2 |
| homogeneity | 0.4 |
| stationarity | 0.4 |
| Statistical distributions | Parameters | ||
|---|---|---|---|
| xi alpha | kappa | ||
| lois de Gumbel | 3.80 0.25 | ||
| lois GEV | 0.30 0.3 | 0.27 | |
| Lois GPA | 3.43 1.003 | 0.96 | |
Disclaimer/Publisher’s Note: The statements, opinions and data contained in all publications are solely those of the individual author(s) and contributor(s) and not of MDPI and/or the editor(s). MDPI and/or the editor(s) disclaim responsibility for any injury to people or property resulting from any ideas, methods, instructions or products referred to in the content. |
© 2024 by the authors. Licensee MDPI, Basel, Switzerland. This article is an open access article distributed under the terms and conditions of the Creative Commons Attribution (CC BY) license (http://creativecommons.org/licenses/by/4.0/).


