Preprint
Article

Using Weight Z-Score Differences Between Birth and Discharge (∆ Z-Score) to Compare and Monitor Nutritional Outcomes in Neonatal Units in Latin America Using the EpicLatino Database. Variables That Are Associated with Poor Growth

Submitted:

27 October 2024

Posted:

28 October 2024

You are already at the latest version

Abstract
Introduction: There are no clear guidelines to support adequate nutrition and growth for our neonates. We have used the difference in weight Z-score medians between birth and discharge (∆ Z-score) to assess the nutritional outcomes in EpicLatino. The ∆ Z-score is often negative, accounting for the desirable fluid contraction at birth that sends the preterm baby usually between 0.5-1 weight Z-score point down the curve. From then on, most researchers accepted a healthy and safe growth parallel to the intrauterine rate. No consensus on the optimal timing for assessment or the ideal growth monitoring tool has been achieved, and an ongoing debate persists on the appropriate terminology to express poor postnatal growth.Methods: We analyzed data from the past 8 years (2015-2022) in surviving home to at least 34 weeks corrected age infants with ≤ 32 weeks gestational age at birth (GA). We conducted a series of statistical comparisons with variables that have been mentioned as potential causes of poor nutrition in the literature. We used the weight ∆ Z-score from birth to discharge as a surrogate for nutrition. We obtained the weight median and interquartile range (IQR) from all the EpicLatino units. We also calculated the correlation between weight ∆ Z-score and gestational age and head circumference (HC) at discharge.Results: There were 480 cases that meet the established criteria. Gestational age at birth, necrotizing enterocolitis (NEC), unit of origin, rupture of membranes (ROM) > 24 hours, temperature at admission, and intraventricular hemorrhage (IVH) were significantly different. There was a negative correlation between ∆ Z-score and corrected gestational age at discharge. Head circumference at discharge also correlated with weight ∆ Z-score.Discussion: There is an important variability in the different units of origin. Also, when looking for risk factors, we confirmed that the characteristics of the study population are determinant to extrauterine growth restriction (EUGR) at discharge. As is known, these associations do not establish causality, some of these variables may identify the challenge of nourishing a sick or very small preterm infant, but the unit of origin variable identifies nutrition policies and practices that can be modified through a quality improvement program.
Keywords: 
Subject: 
Medicine and Pharmacology  -   Pediatrics, Perinatology and Child Health
Food Security and Healthy Nutrition

Introduction

There are no clear guidelines to support adequate nutrition and growth for our neonates. For 9 years, we have used the difference in Weight ∆ Z-score [1] medians between birth and discharge to assess the nutritional outcomes in EpicLatino, [2] a network of 32 NICUs in Latin American and Caribbean (Table 1). The difference between birth and discharge is often negative accounting for the desirable fluid contraction [3,4,5] at birth that sends the preterm baby usually between 0.5-1 Weight z-score point down the curve. From then on, most researchers accepted a healthy and safe growth parallel to the intrauterine rate. In a recent article [6] extrauterine growth restriction (EUGR) has been used in the literature and clinical practice to describe inadequate growth in preterm infants. Moreover, it highlights that no consensus on the optimal timing for assessment or the ideal growth monitoring tool has been achieved, and an ongoing debate persists on the appropriate terminology to express poor postnatal growth. Early mothers milk fortification [7] soon after birth do not increase fat-free mass accretion at 36 weeks' post menstrual age (PMA), but they may increase length gain velocity and reduce declines in head circumference-for-age Weight ∆ Z-score from birth to 36 weeks' PMA.
There are two primary ways to define extrauterine growth restriction (EUGR): cross-sectional and longitudinal. Additionally, several growth charts are available to track postnatal growth, each yielding varying outcomes. According to a reviewed study, [8] the prevalence of EUGR differs across growth charts, with INeS 40.9%, Intergrowth-21 23.8% and Fenton reporting 33.5%. When assessed longitudinally (defined as a loss of 1 SDS), the rates were, 20.4% for INeS, 4% for Intergrowth-21 and 15% for Fenton (p < 0.001). Cross-sectional EUGR, based on a discharge weight below the 10th percentile, showed similar variability: 40.9%, 23.8% and 33.5%, respectively (p < 0.001).

Materials and Methods

We analyzed data from the past 8 years (2015-2022) in surviving home to at least 34 weeks corrected age infants with ≤ 32 weeks gestational age at birth (GA). To identify the variables that need to be controlled to measure the risk of poor nutrition [9,10] unrelated to outdated or unvalidated unit policies, we conducted a series of statistical comparisons with variables that have been mentioned as potential causes of poor nutrition in the literature, if available in our database. We used the Weight ∆ Z-score from birth to discharge as a surrogate for nutrition. The first risk variable is gestational age. We also included necrotizing enterocolitis (NEC), intraventricular hemorrhage (IVH), and the time (before/during-after 2020, pandemic). We added small for gestational age (SGA), temperature at admission, sex, presentation, inborn/outborn, oxygen at 36 weeks post-menstrual age (PMA), delivery type, antenatal corticosteroids, premature rupture of membranes (PROM) more than 24 hours, suspected chorioamnionitis, and the unit of origin. Only inborn surviving patients who were discharged home beyond 34 weeks corrected gestational age were included. We also obtained the weight ∆ Z-score median and interquartile range (IQR) from all the EpicLatino units. We performed a non-parametric median logistic regression adjusted for the mentioned variables and included the different units of origin as well. We also calculated the correlation between Weight ∆ Z-score and gestational age and head circumference (HC) at discharge to see if change in Weight z-score affects the gestational age at discharge or the HC also at discharge and calculated a regression analysis corrected by gestational age at birth, unit of origin and SGA. We used Stata 18, StataCorp LLC, Texas, USA.

Results

There were 480 cases that met the established criteria. The statistical significance of the different variables used in the non-parametric median regression model is shown in Table 2. Gestational age at birth, NEC, unit of origin, PROM > 24 hours, temperature at admission, and IVH were significant.
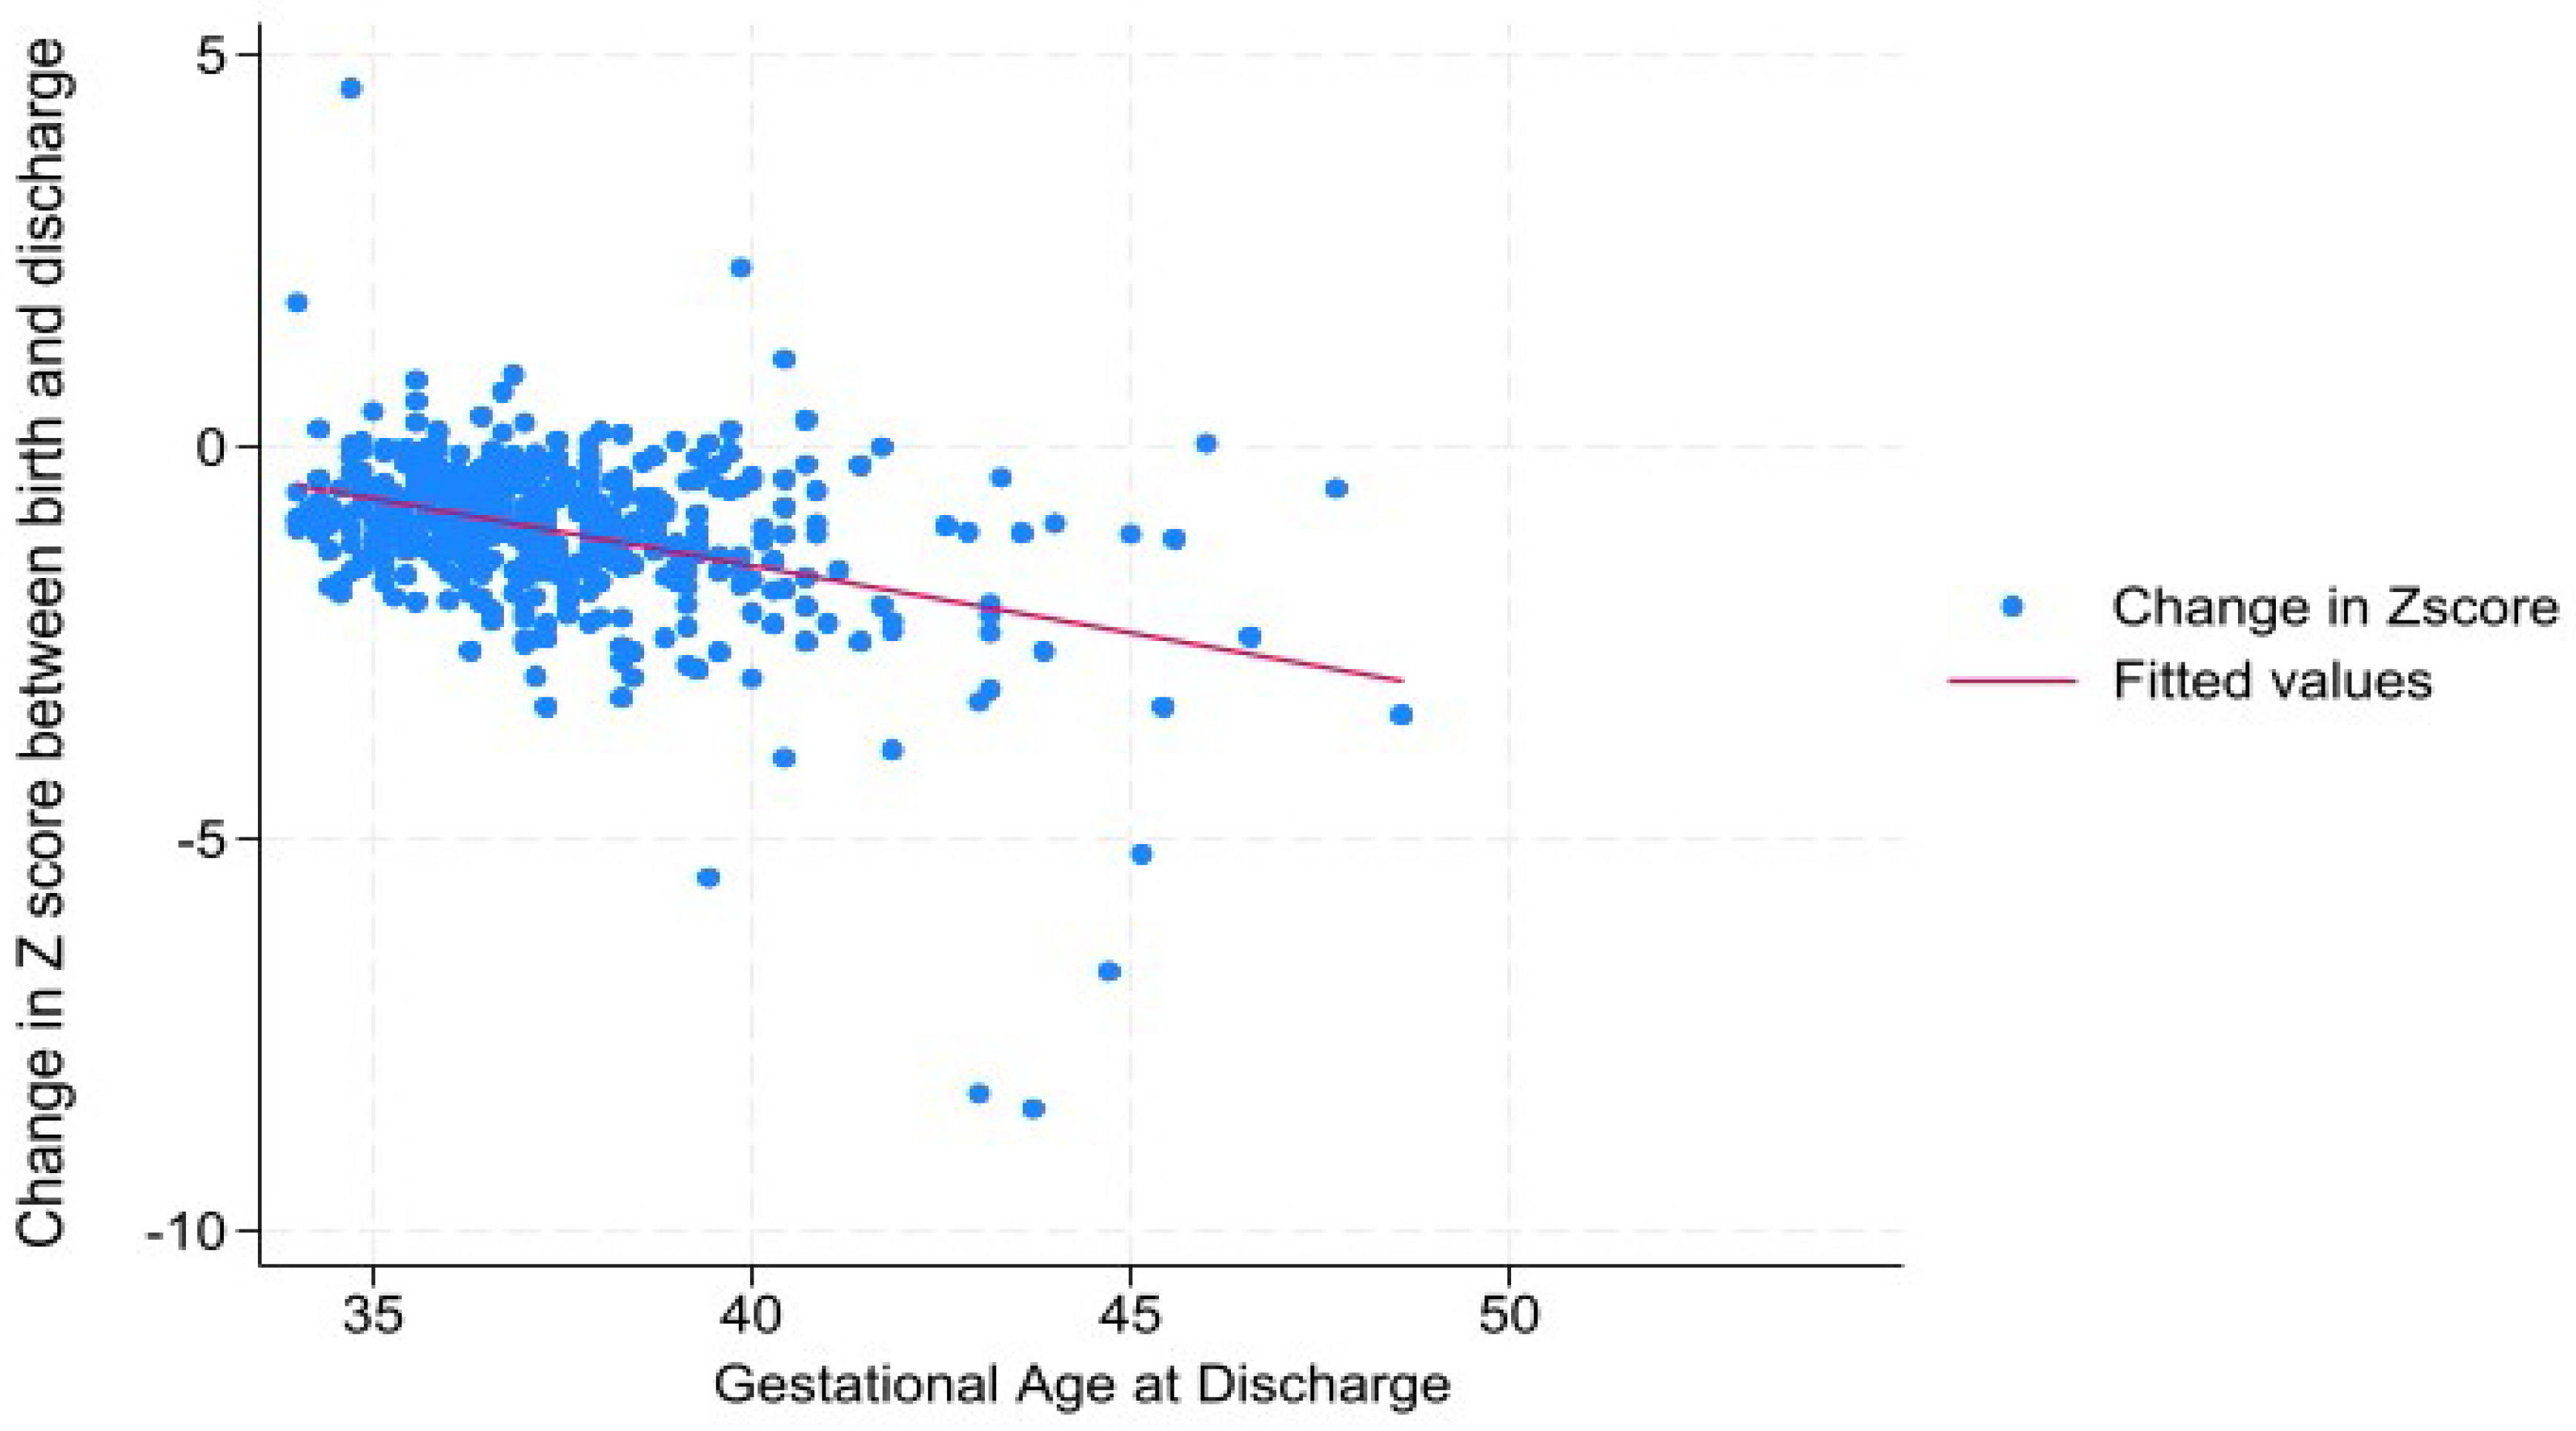
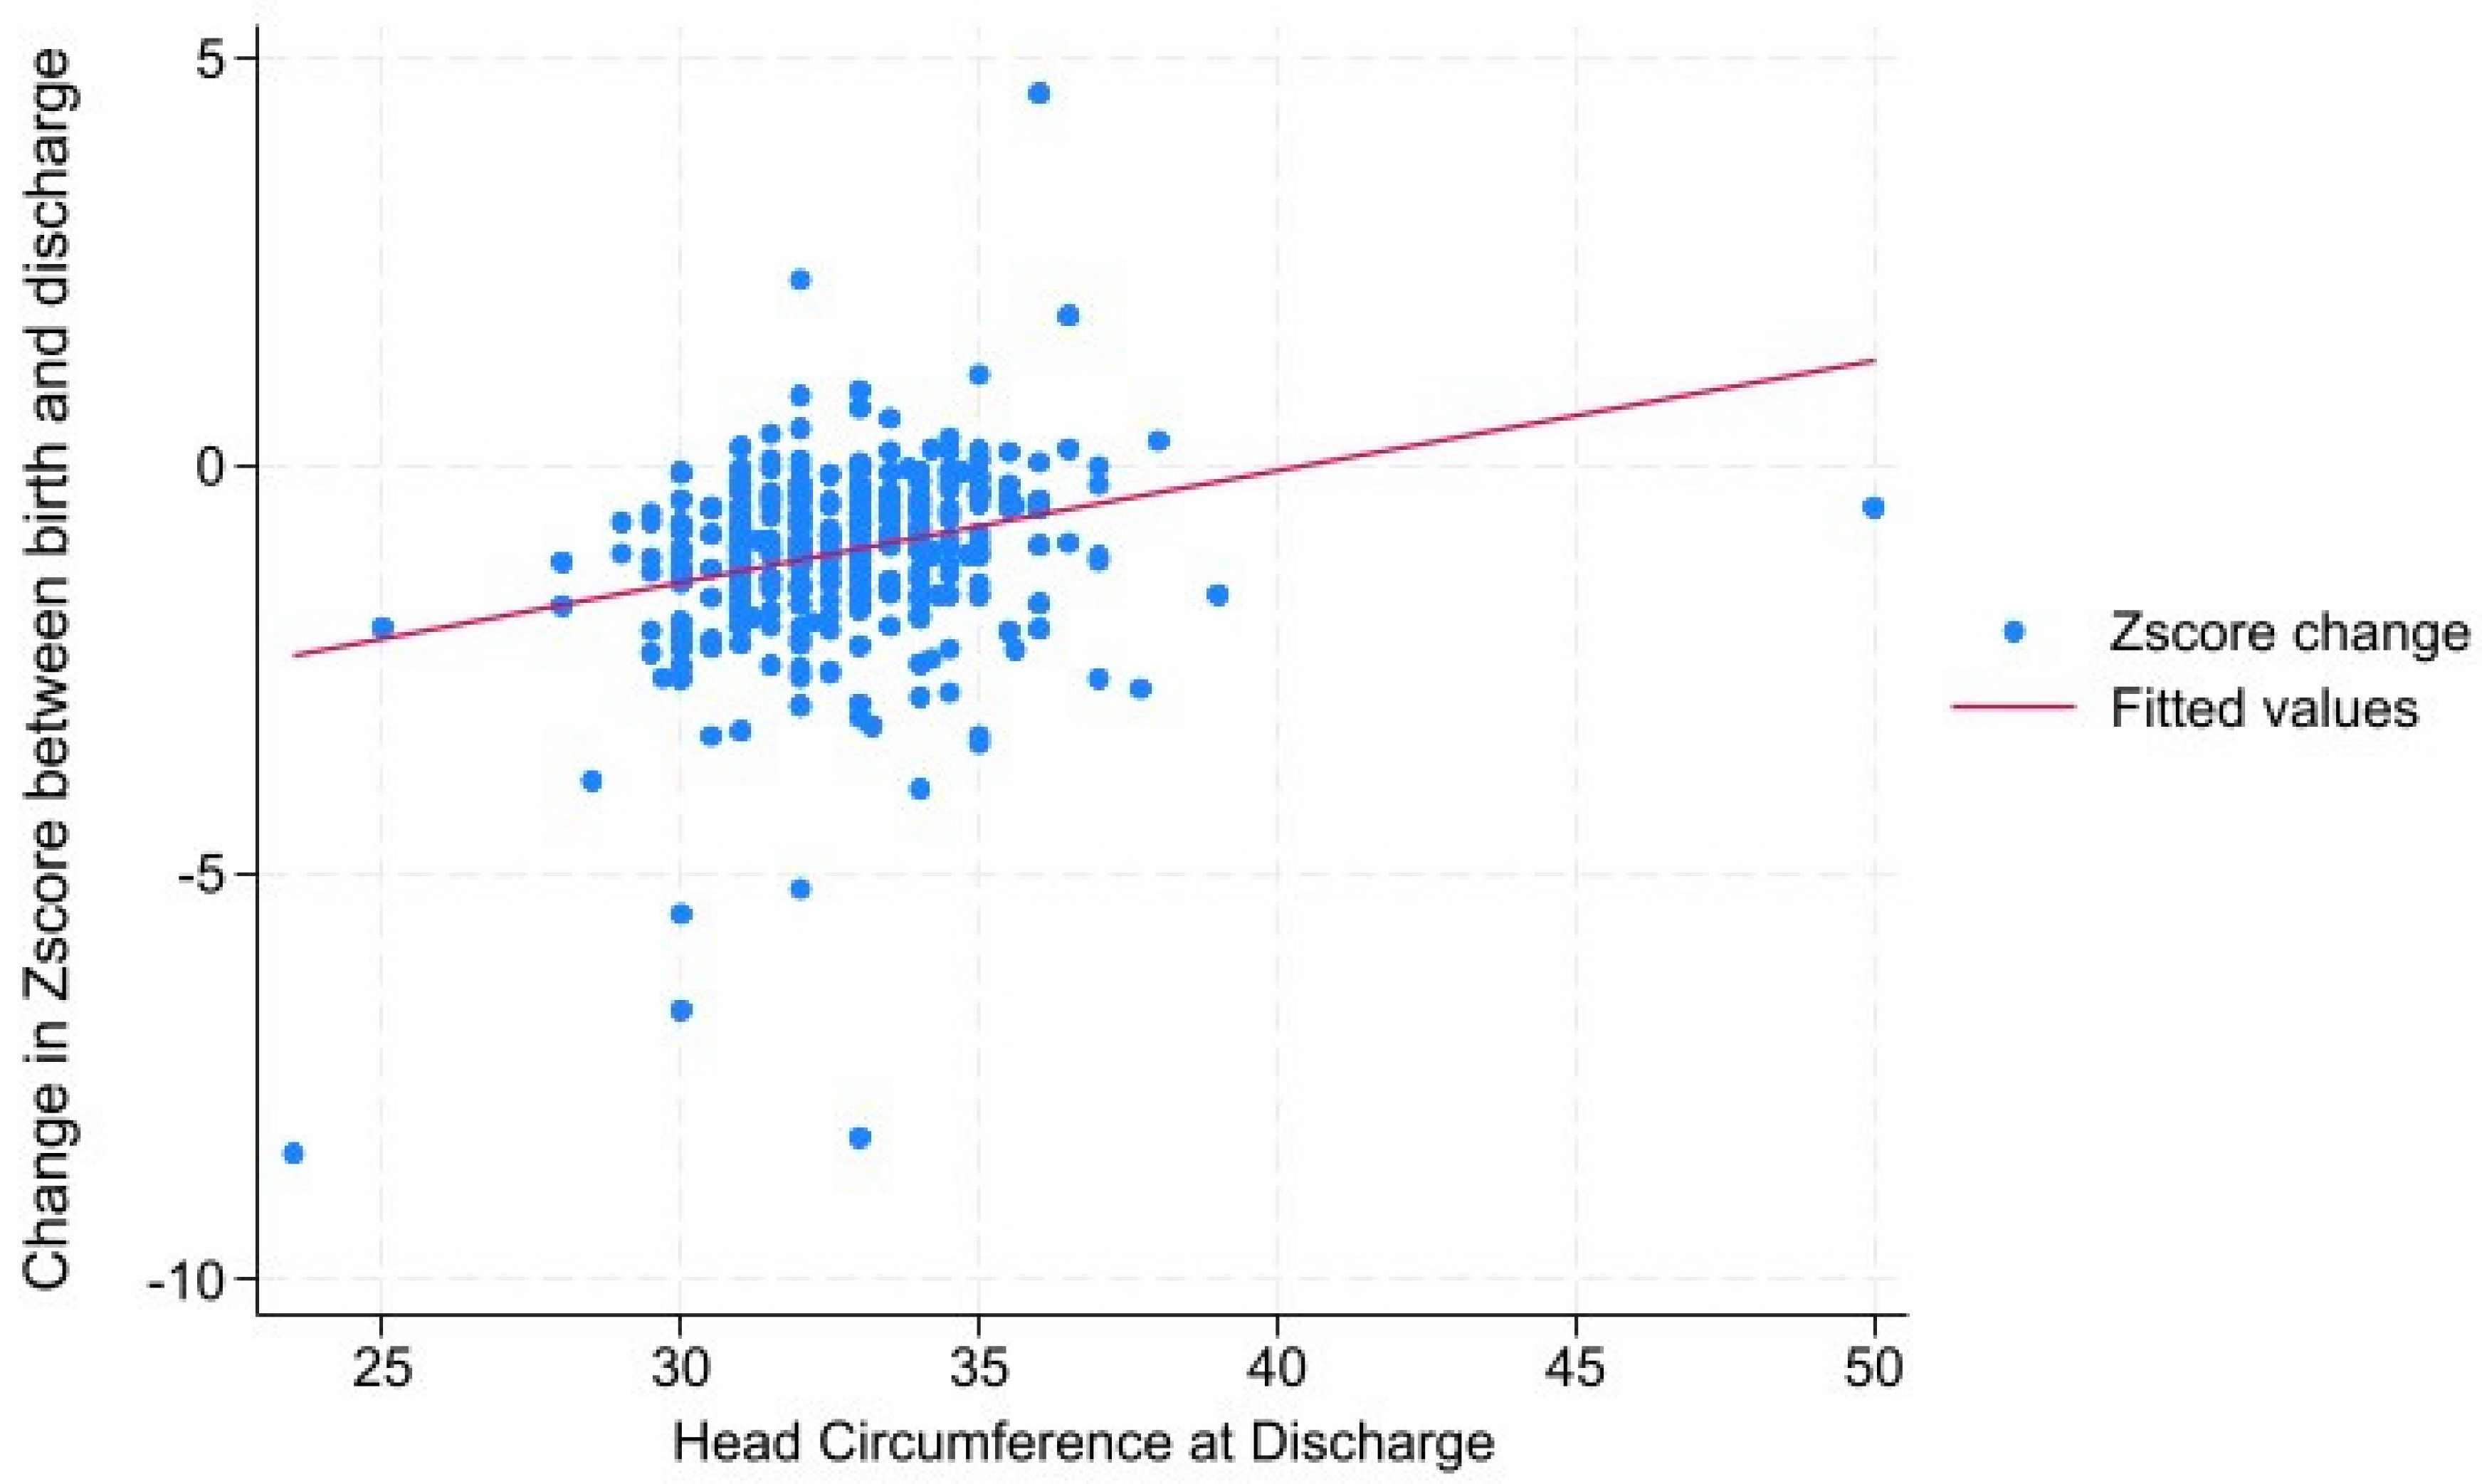
The box plot results from the different units of origin (median and IQR) are presented in Figure 1. There was a negative correlation between Weight ∆ Z-score and corrected gestational age at discharge of -0.38 with a p<0.0001 (Figure 2). The regression analysis of Weight ∆ Z-score versus gestational age at discharge was significant when adjusted by gestational age at birth and unit of origin but not with SGA. Head circumference at discharge also correlated with Weight ∆ Z-score Spearman's rho = -0.2657, p <0.00001 also adjusted by the same variables (Figure 3) and was found to be statistically significant.

Discussion

There is an important variability in the different units of origin. Regarding risk factors, as shown in Table 2, only gestational age, NEC, unit of origin, PROM, temperature at admission, and IVH were significant. When looking for risk factors, we confirmed that the characteristics of the study population are determinant to EUGR at discharge. The degree of longitudinal EUGR is influenced by birth weight Z-score: the lower the birthweight centile, the lower the probability of losing 1 or 2 SDS. [11] As known, these associations do not establish causality. Some of these variables may identify the challenge of nourishing a sick or very small preterm infant, but the unit of origin variability identifies nutrition policies and practices that can be modified through a quality improvement program; the wide variability of results in Figure 1 confirms this.
The correlation between change in Weight z-score and corrected age al discharge suggests that babies with less drop in Weight z-score go home with lower gestational age, it also suggests shorter length of stay at the different gestational age at birth. The correlation of less drop in Weight z-score with HC size in Figure 3 suggests a larger size at discharge. [12,13] The larger size of HC at discharge have been associated with better neurodevelopment, specially before full term. [12,14,15,16,17]
Limitations of our study are inherent to the retrospective observational nature of the study and the use of database cases. Another limitation may lie in the choice of discharge as a time point for assessing EUGR, as there is a wide range of time of evaluation and a long time passes between birth and discharge.
Our study was done because knowing and monitoring the prevalence of EUGR in our Units, is considered to be a quality measure of care for preterm infants. [11] There are no management guidelines that can precisely determine which parameters should be maintained in the units but aiming to prevent Weight ∆ Z-score drop beyond -1 could be a reasonable goal.

References

  1. Fenton, T. Z Score calculation using 2013 growth chart. https://www.ucalgary.ca/fenton/2013chart: Calgary University, Calgary, Canada; 2013.
  2. EpicLatino. EpicLatino Network Database. 2024.
  3. Rutledge A, Murphy HJ, Harer MW, Jetton JG. Fluid Balance in the Critically Ill Child Section: "How Bad Is Fluid in Neonates?". Front Pediatr 2021, 9, 651458. [Google Scholar] [CrossRef] [PubMed]
  4. Segar, JL. A physiological approach to fluid and electrolyte management of the preterm infant: Review. J Neonatal Perinatal Med 2020, 13, 11–19. [Google Scholar] [CrossRef] [PubMed]
  5. Selewski DT, Gist KM, Nathan AT, et al. The impact of fluid balance on outcomes in premature neonates: a report from the AWAKEN study group. Pediatr Res 2020, 87, 550–557. [Google Scholar] [CrossRef] [PubMed]
  6. González-López C, Solís-Sánchez G, Lareu-Vidal S, et al. Variability in Definitions and Criteria of Extrauterine Growth Restriction and Its Association with Neurodevelopmental Outcomes in Preterm Infants: A Narrative Review. Nutrients 2024, 16. [Google Scholar] [CrossRef]
  7. Salas AA, Gunawan E, Nguyen K, et al. Early Human Milk Fortification in Infants Born Extremely Preterm: A Randomized Trial. Pediatrics 2023, 152. [Google Scholar] [CrossRef]
  8. Starc M, Giangreco M, Centomo G, Travan L, Bua J. Extrauterine growth restriction in very low birth weight infants according to different growth charts: A retrospective 10 years observational study. PLoS One 2023, 18, e0283367. [Google Scholar] [CrossRef]
  9. Bracken JM, Pappas L, Wilkins J, Tracy K, Al-Rajabi TR, Abdelhadi RA. Measuring growth in critically ill neonates and children. Nutr Clin Pract. Oct 2023, 38 (Suppl 2), S28–S38. [Google Scholar] [CrossRef]
  10. Goldberg DL, Becker PJ, Brigham K, et al. Identifying Malnutrition in Preterm and Neonatal Populations: Recommended Indicators. J Acad Nutr Diet 2018, 118, 1571–1582. [Google Scholar] [CrossRef] [PubMed]
  11. Lin Z, Green RS, Chen S, et al. Quantification of EUGR as a Measure of the Quality of Nutritional Care of Premature Infants. PLoS One 2015, 10, e0132584. [Google Scholar] [CrossRef]
  12. Selvanathan T, Guo T, Kwan E, et al. Head circumference, total cerebral volume and neurodevelopment in preterm neonates. Arch Dis Child Fetal Neonatal Ed 2022, 107, 181–187. [Google Scholar] [CrossRef] [PubMed]
  13. Tan MJ, Cooke RW. Improving head growth in very preterm infants--a randomised controlled trial I: neonatal outcomes. Arch Dis Child Fetal Neonatal Ed 2008, 93, F337–F341. [Google Scholar] [CrossRef] [PubMed]
  14. Belfort MB, Rifas-Shiman SL, Sullivan T, et al. Infant growth before and after term: effects on neurodevelopment in preterm infants. Pediatrics 2011, 128, e899–e906. [Google Scholar] [CrossRef] [PubMed]
  15. Ehrenkranz RA, Dusick AM, Vohr BR, Wright LL, Wrage LA, Poole WK. Growth in the neonatal intensive care unit influences neurodevelopmental and growth outcomes of extremely low birth weight infants. Pediatrics 2006, 117, 1253–61. [Google Scholar] [CrossRef] [PubMed]
  16. Neubauer V, Griesmaier E, Pehböck-Walser N, Pupp-Peglow U, Kiechl-Kohlendorfer U. Poor postnatal head growth in very preterm infants is associated with impaired neurodevelopment outcome. Acta Paediatr 2013, 102, 883–8. [Google Scholar] [CrossRef] [PubMed]
  17. Power VA, Spittle AJ, Lee KJ, et al. Nutrition, Growth, Brain Volume, and Neurodevelopment in Very Preterm Children. J Pediatr 2019, 215, 50–55.e3. [Google Scholar] [CrossRef] [PubMed]
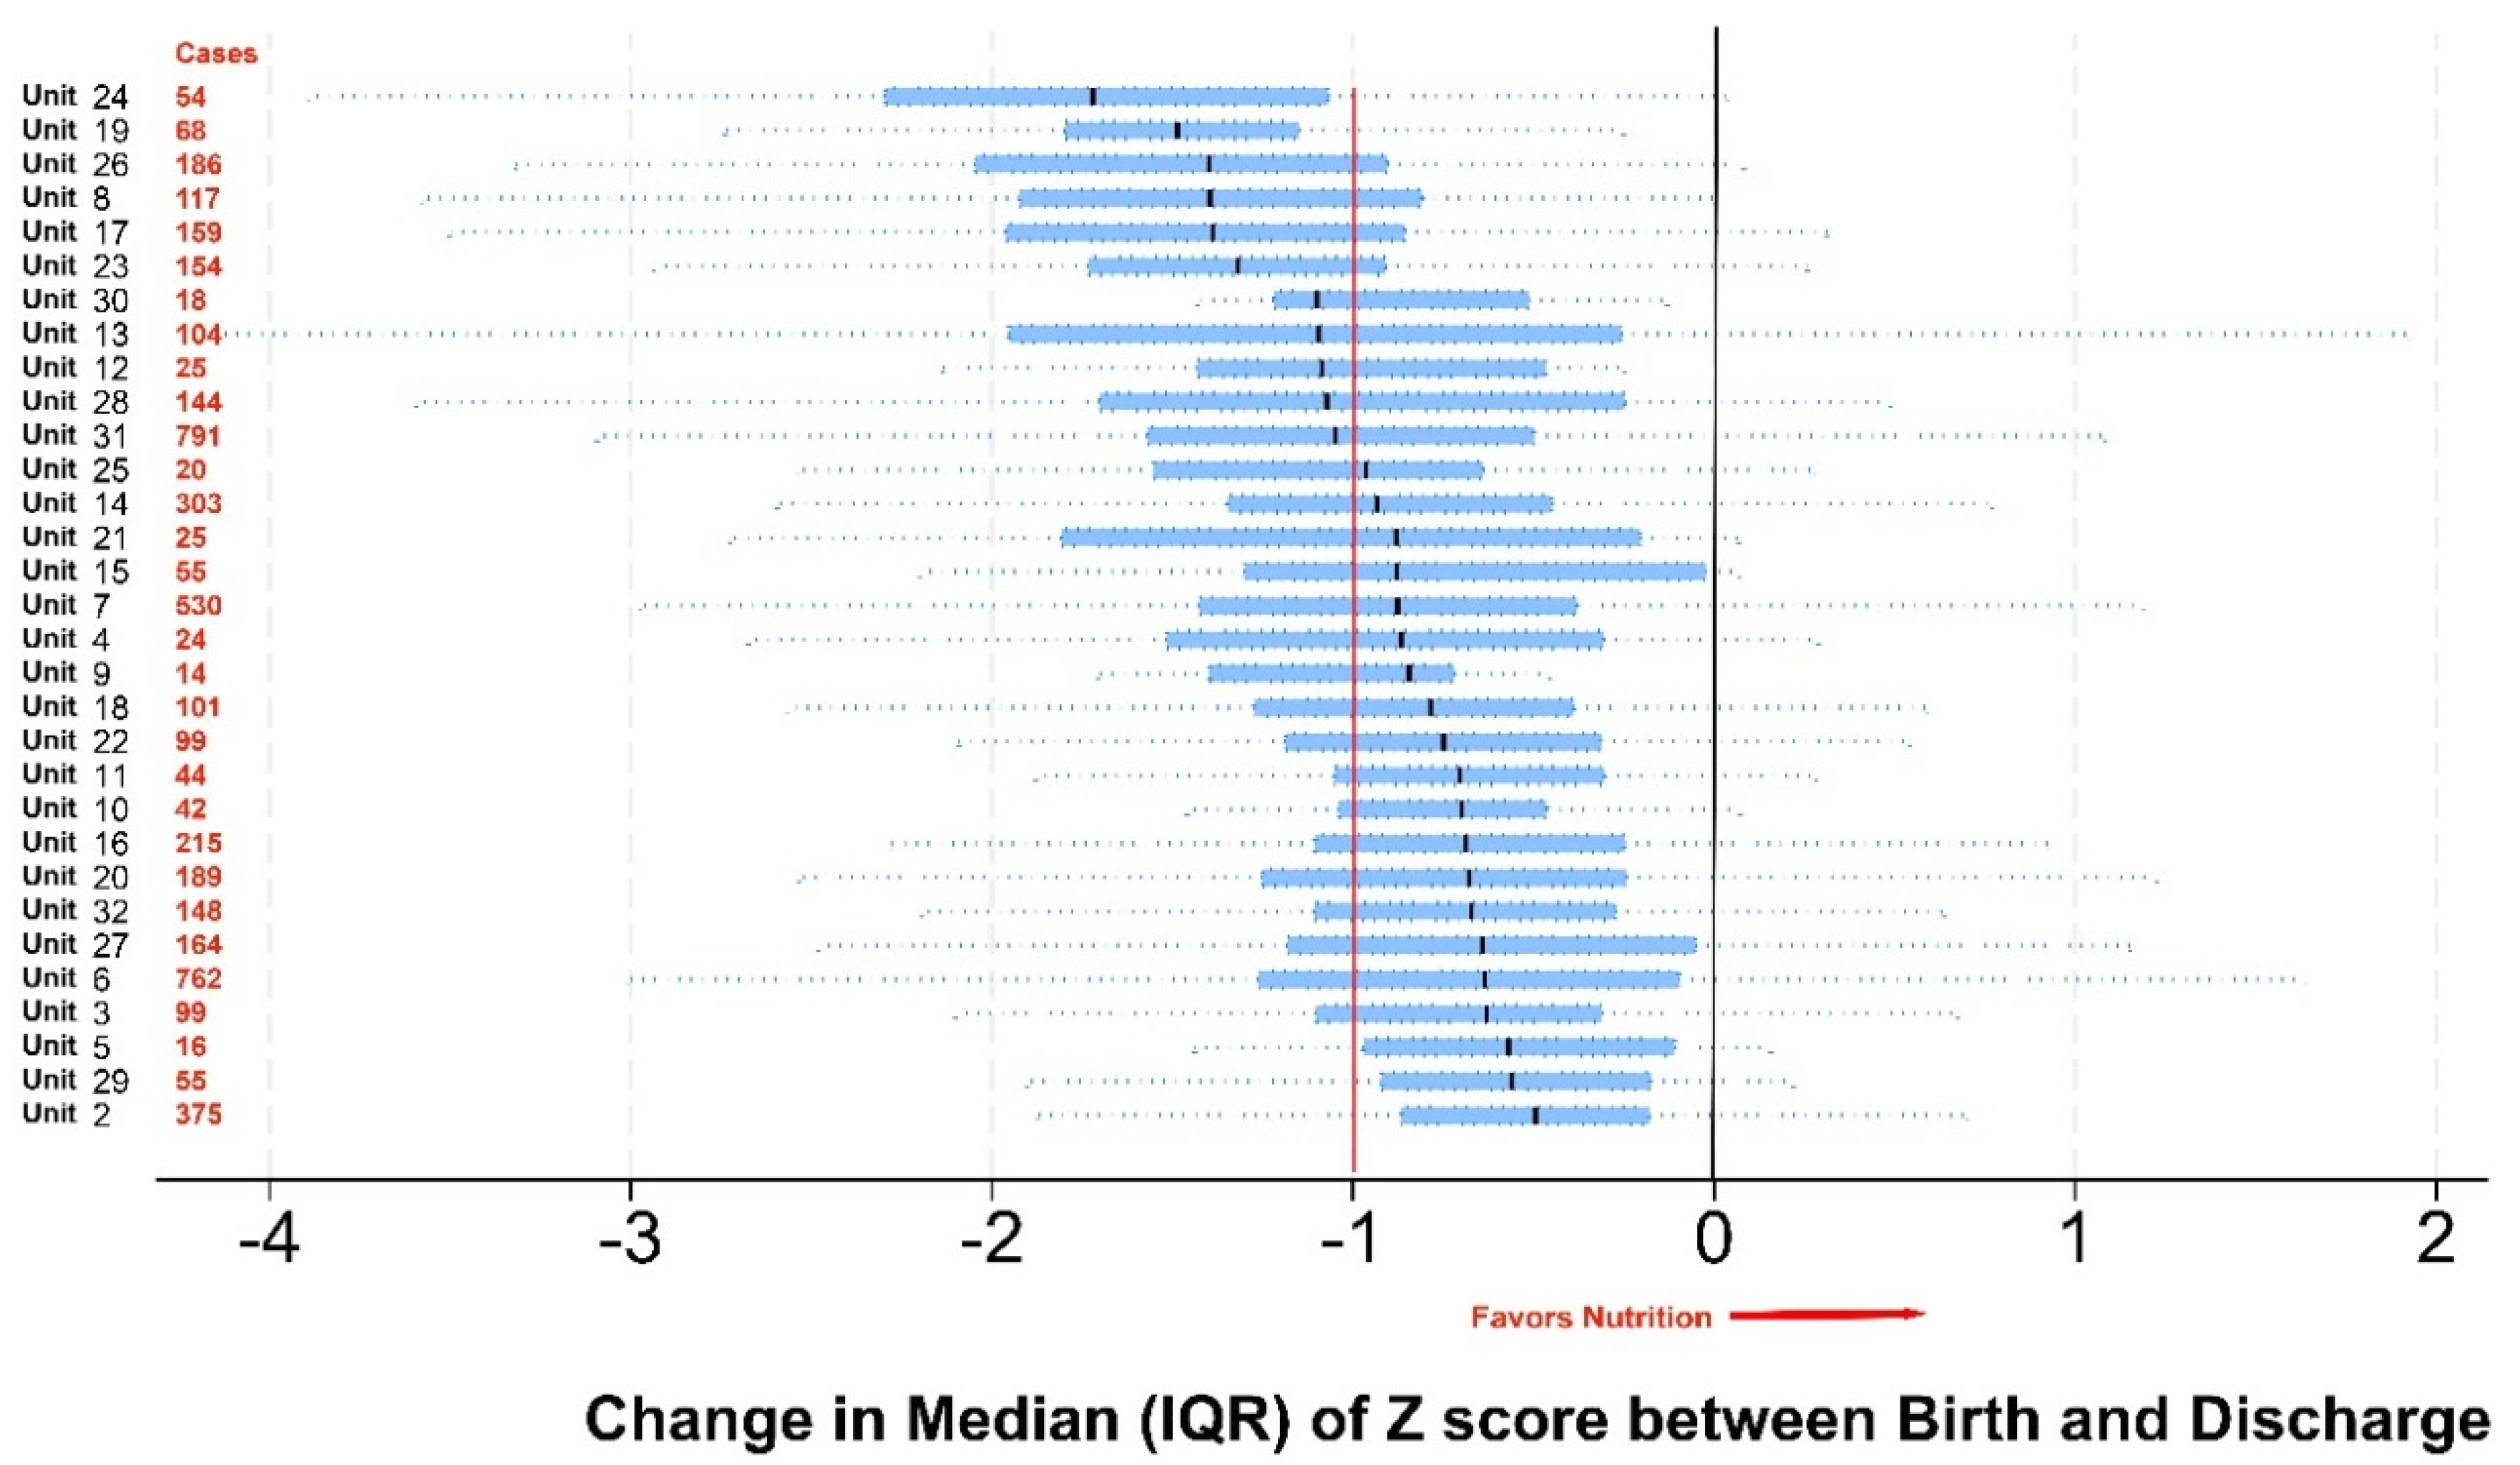
Figure 1. Changes of median and interquartile rage (IQR) of ∆ Z-score between birth and discharge arrange in ascending order. Unit 1 excluded for only one case. Number in red represent cases in each unit (only cases with complete information). 8 year (2015-2022).
Preprints 137617 g001
Figure 2. Changes of median ∆ Z-score between Birth and Discharge (Y axis) in cases discharged home at ≥34 weeks corrected gestational age in babies born at ≤ 32 weeks, correlation with corrected gestational age at discharge. 8 year (2015-2022).
Preprints 137617 g002
Figure 3. Changes of median ∆ Z-score between Birth and Discharge (Y axis) in cases discharged home at ≥34 weeks corrected gestational age in babies born at ≤ 32 weeks, correlation with head circumference at discharge. 8 year (2015-2022).
Preprints 137617 g003
Table 1. Units belonging to the EpicLatino network.
UNITS CITY/COUNTRY
Centenario H. de Esp. Miguel Hidalgo Aguascalientes, Mexico
Clínica Dávila Santiago, Chile
Clínica de Santa María de Santiago Santiago, Chile
Clínica del Country Bogotá, Colombia
Clínica la Colina Bogotá, Colombia
Clínica Materno Infantil San Luis Bucaramanga, Colombia
Clínica San Felipe Lima, Perú
Clínica Santa Bárbara Quito, Ecuador
Clínica Somer Rio Negro, Colombia
Clínica Universitaria Colombia Bogotá, Colombia
Clínica Vespucio Santiago, Chile
Colsanitas – Clínica Pediátrica UCI Neonatal Bogotá, Colombia
Curaçao Medical Center Willemstad, Curaçao
H Regional DR Rafael Pascacio Gamboa Tuxtla Gutiérrez, México
Hospital Central Dr. Ignacio Morones Prieto San Luis Potosí, México
Hospital Civil de Ipiales E.S.E Ipiales, Colombia
Hospital de los Valles Quito, Ecuador
Hospital Departamental San Vicente de Paul Garzón, Huila, Colombia
Hospital Dr. Florencio Escardó Tigre, Argentina
Hospital Español de Mendoza Mendoza, Argentina
Hospital General EISS de Manta Manta, Ecuador
Hospital Italiano de La Plata La Plata, Argentina
Hospital Luis Lagomaggiore Mendoza, Argentina
Hospital Metropolitano Quito, Ecuador
Hospital Militar Central Bogotá, Colombia
Hospital Regional Universitario de Colima Colima, México
Hospital San Francisco de Quito Quito, Ecuador
Hospital San José Bogotá, Colombia
Hospital Santísima Trinidad Asunción, Paraguay
Los Cobos Medical Center Bogotá, Colombia
Maternidad Nuestra Sra. de las Mercedes Tucumán, Argentina
S.E.S. Hospital de Caldas Manizales, Colombia
Table 2. Variables, their impact (percent of normal), and the results of the nonparametric median logistic regression results.
VARIABLE % Normal or Mean p
Gestational Age at Birth 29.6 ± 2.3 weeks <0.0000
No NEC 93% <0.0000
Unit of origin 32 units <0.0000
No ROM > 24 hours 87% 0.0190
Temperature at Admission 36.0oC ± 1 0.0350
No IVH pathology 71% 0.0350
Sex M 55% 0.056
Presentation (cephalic) 71% 0.072
Inborn 89% 0.091
No Oxygen at 36w 79% 0.095
Vaginal delivery 22% 0.146
Receive Antenatal Corticosteroids 72% 0.218
AGA 89% 0.234
No Suspected Chorioamnionitis 91% 0.346
Period (before/after 2020) 45% 0.636
NEC: Necrotizing enterocolitis, ROM: premature rupture of membranes, IVH: intraventricular hemorrhage, M: masculine, w weeks, AGA: appropriate for gestational age. Statistically significant in bold.
Disclaimer/Publisher’s Note: The statements, opinions and data contained in all publications are solely those of the individual author(s) and contributor(s) and not of MDPI and/or the editor(s). MDPI and/or the editor(s) disclaim responsibility for any injury to people or property resulting from any ideas, methods, instructions or products referred to in the content.
Copyright: This open access article is published under a Creative Commons CC BY 4.0 license, which permit the free download, distribution, and reuse, provided that the author and preprint are cited in any reuse.
Alerts
Prerpints.org logo

Preprints.org is a free preprint server supported by MDPI in Basel, Switzerland.

Subscribe

© 2025 MDPI (Basel, Switzerland) unless otherwise stated