Submitted:
28 October 2024
Posted:
28 October 2024
You are already at the latest version
Abstract
Keywords:
1. Introduction
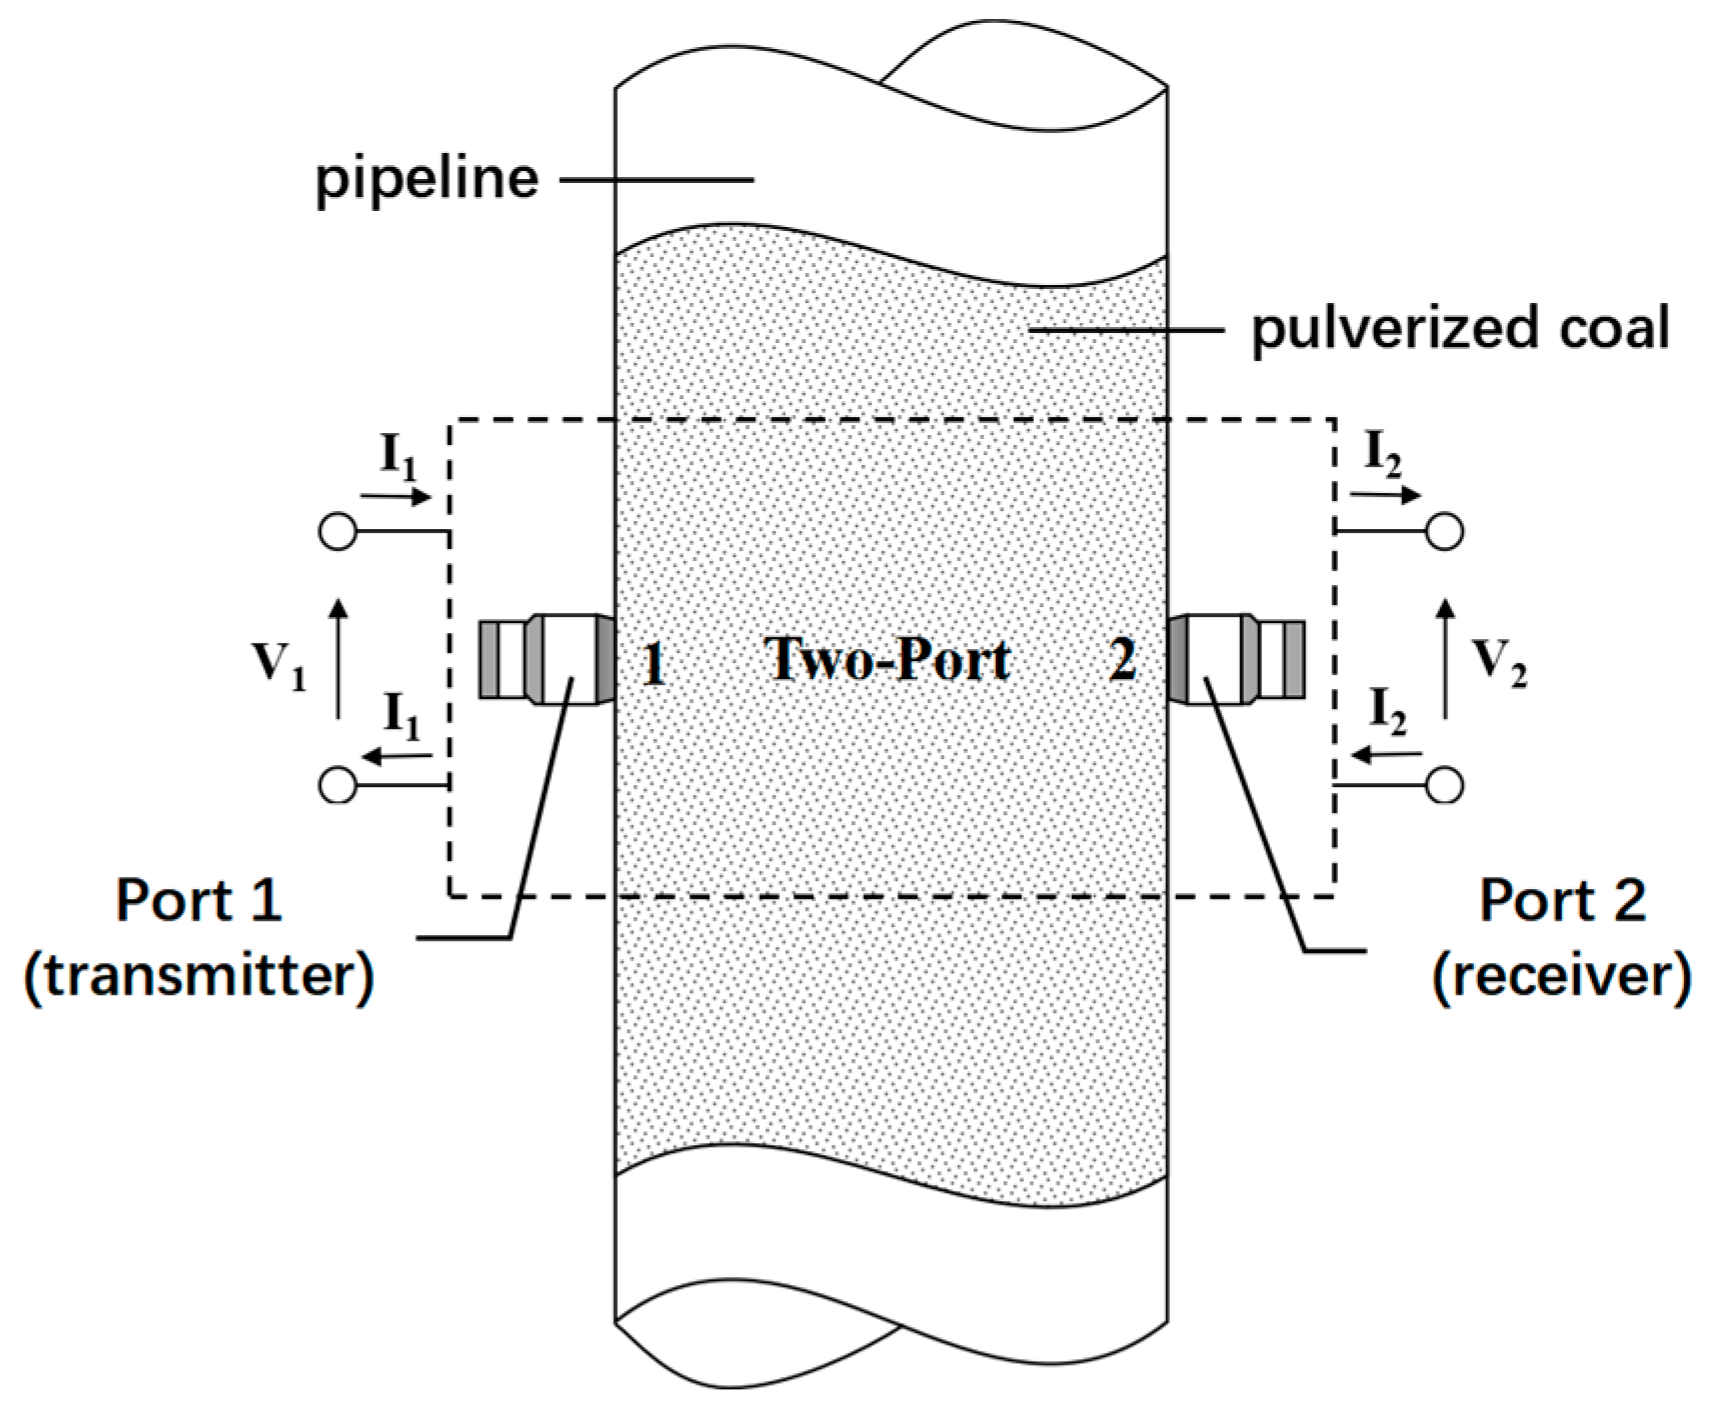
2. PCC-Sensing Mechanism
3. Materials and Methods
3.1. Design of Microwave Sensor
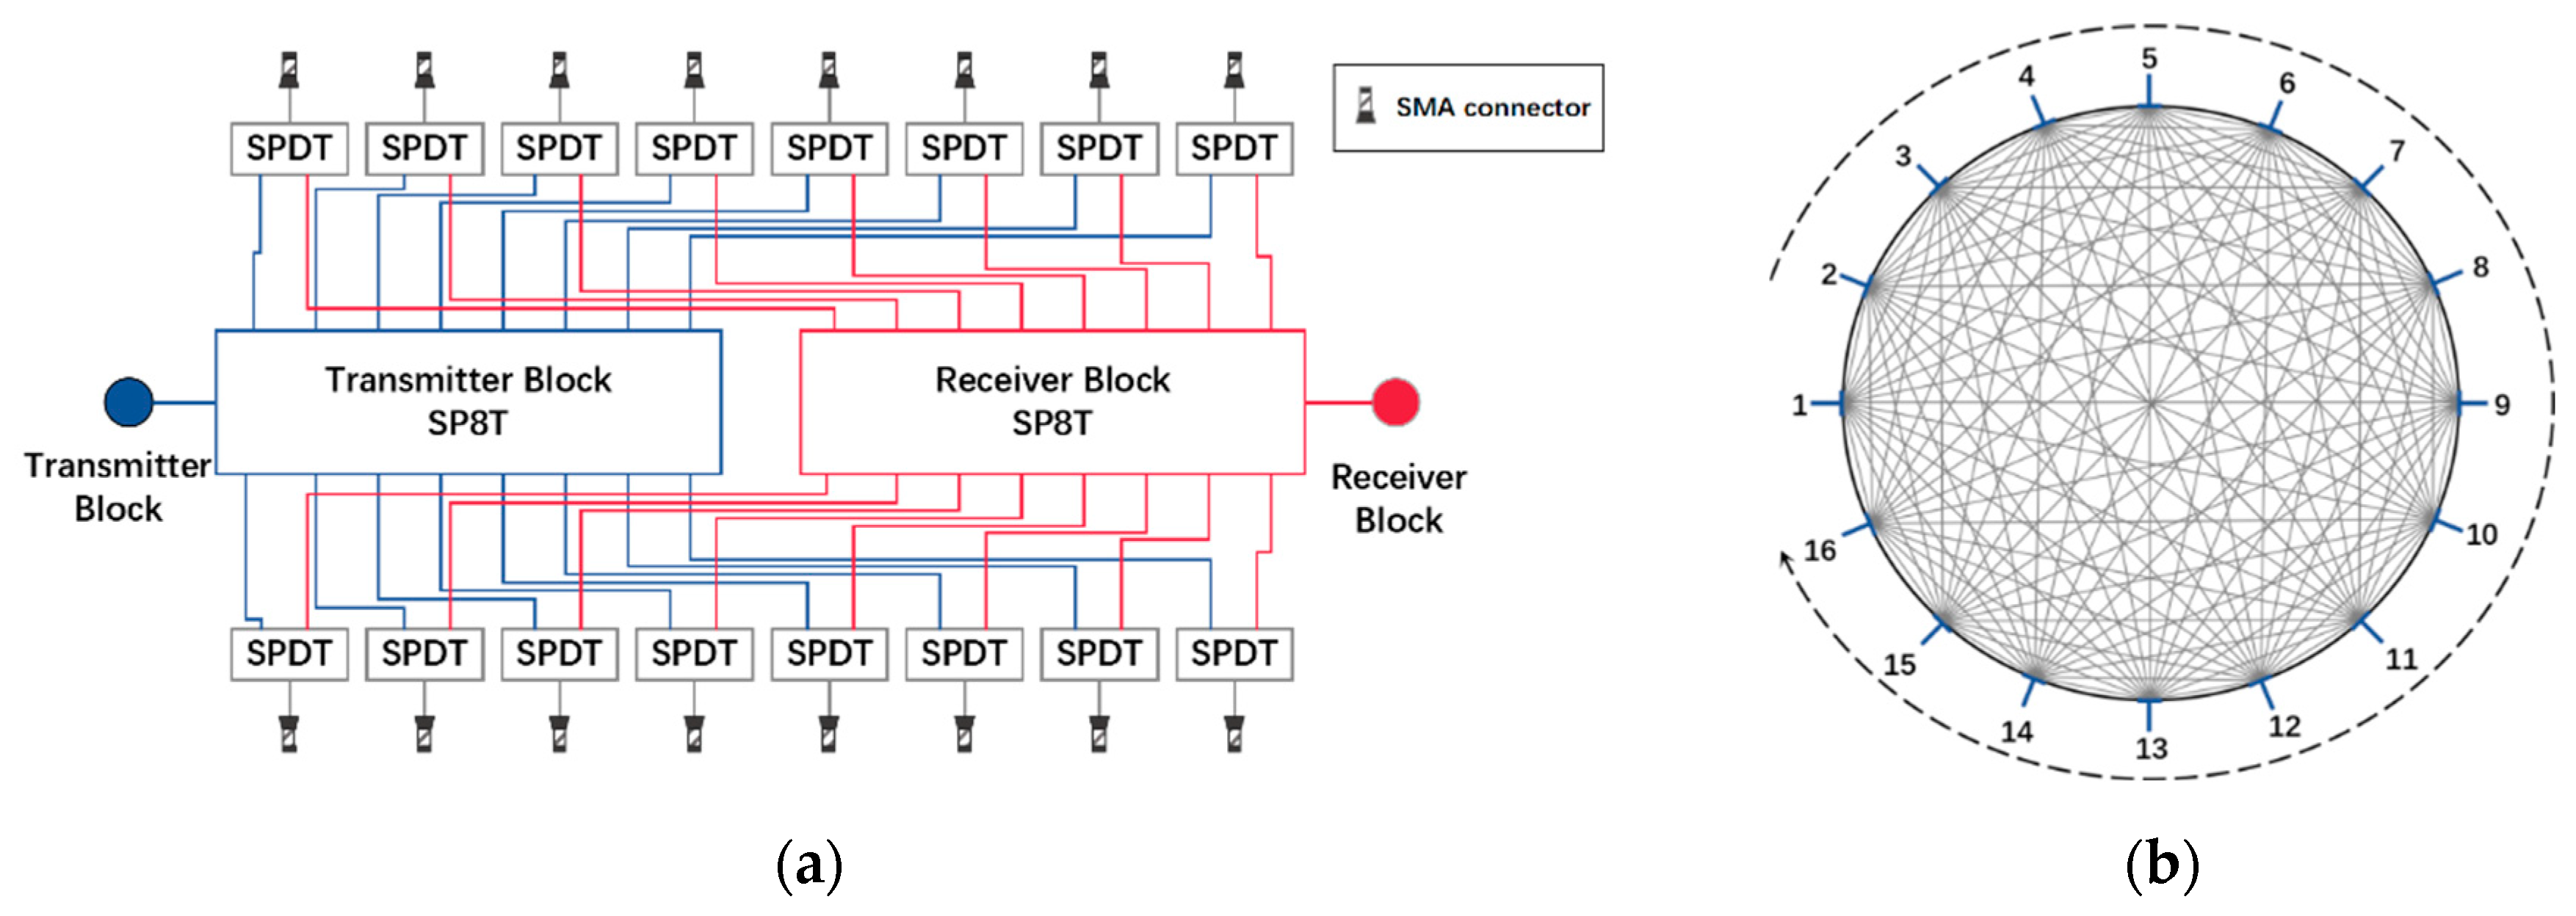
3.2. High-Speed Microwave Signal Routing Module
3.3. Programmable Frequency and Signal Path Control Module
4. Experiments and Results
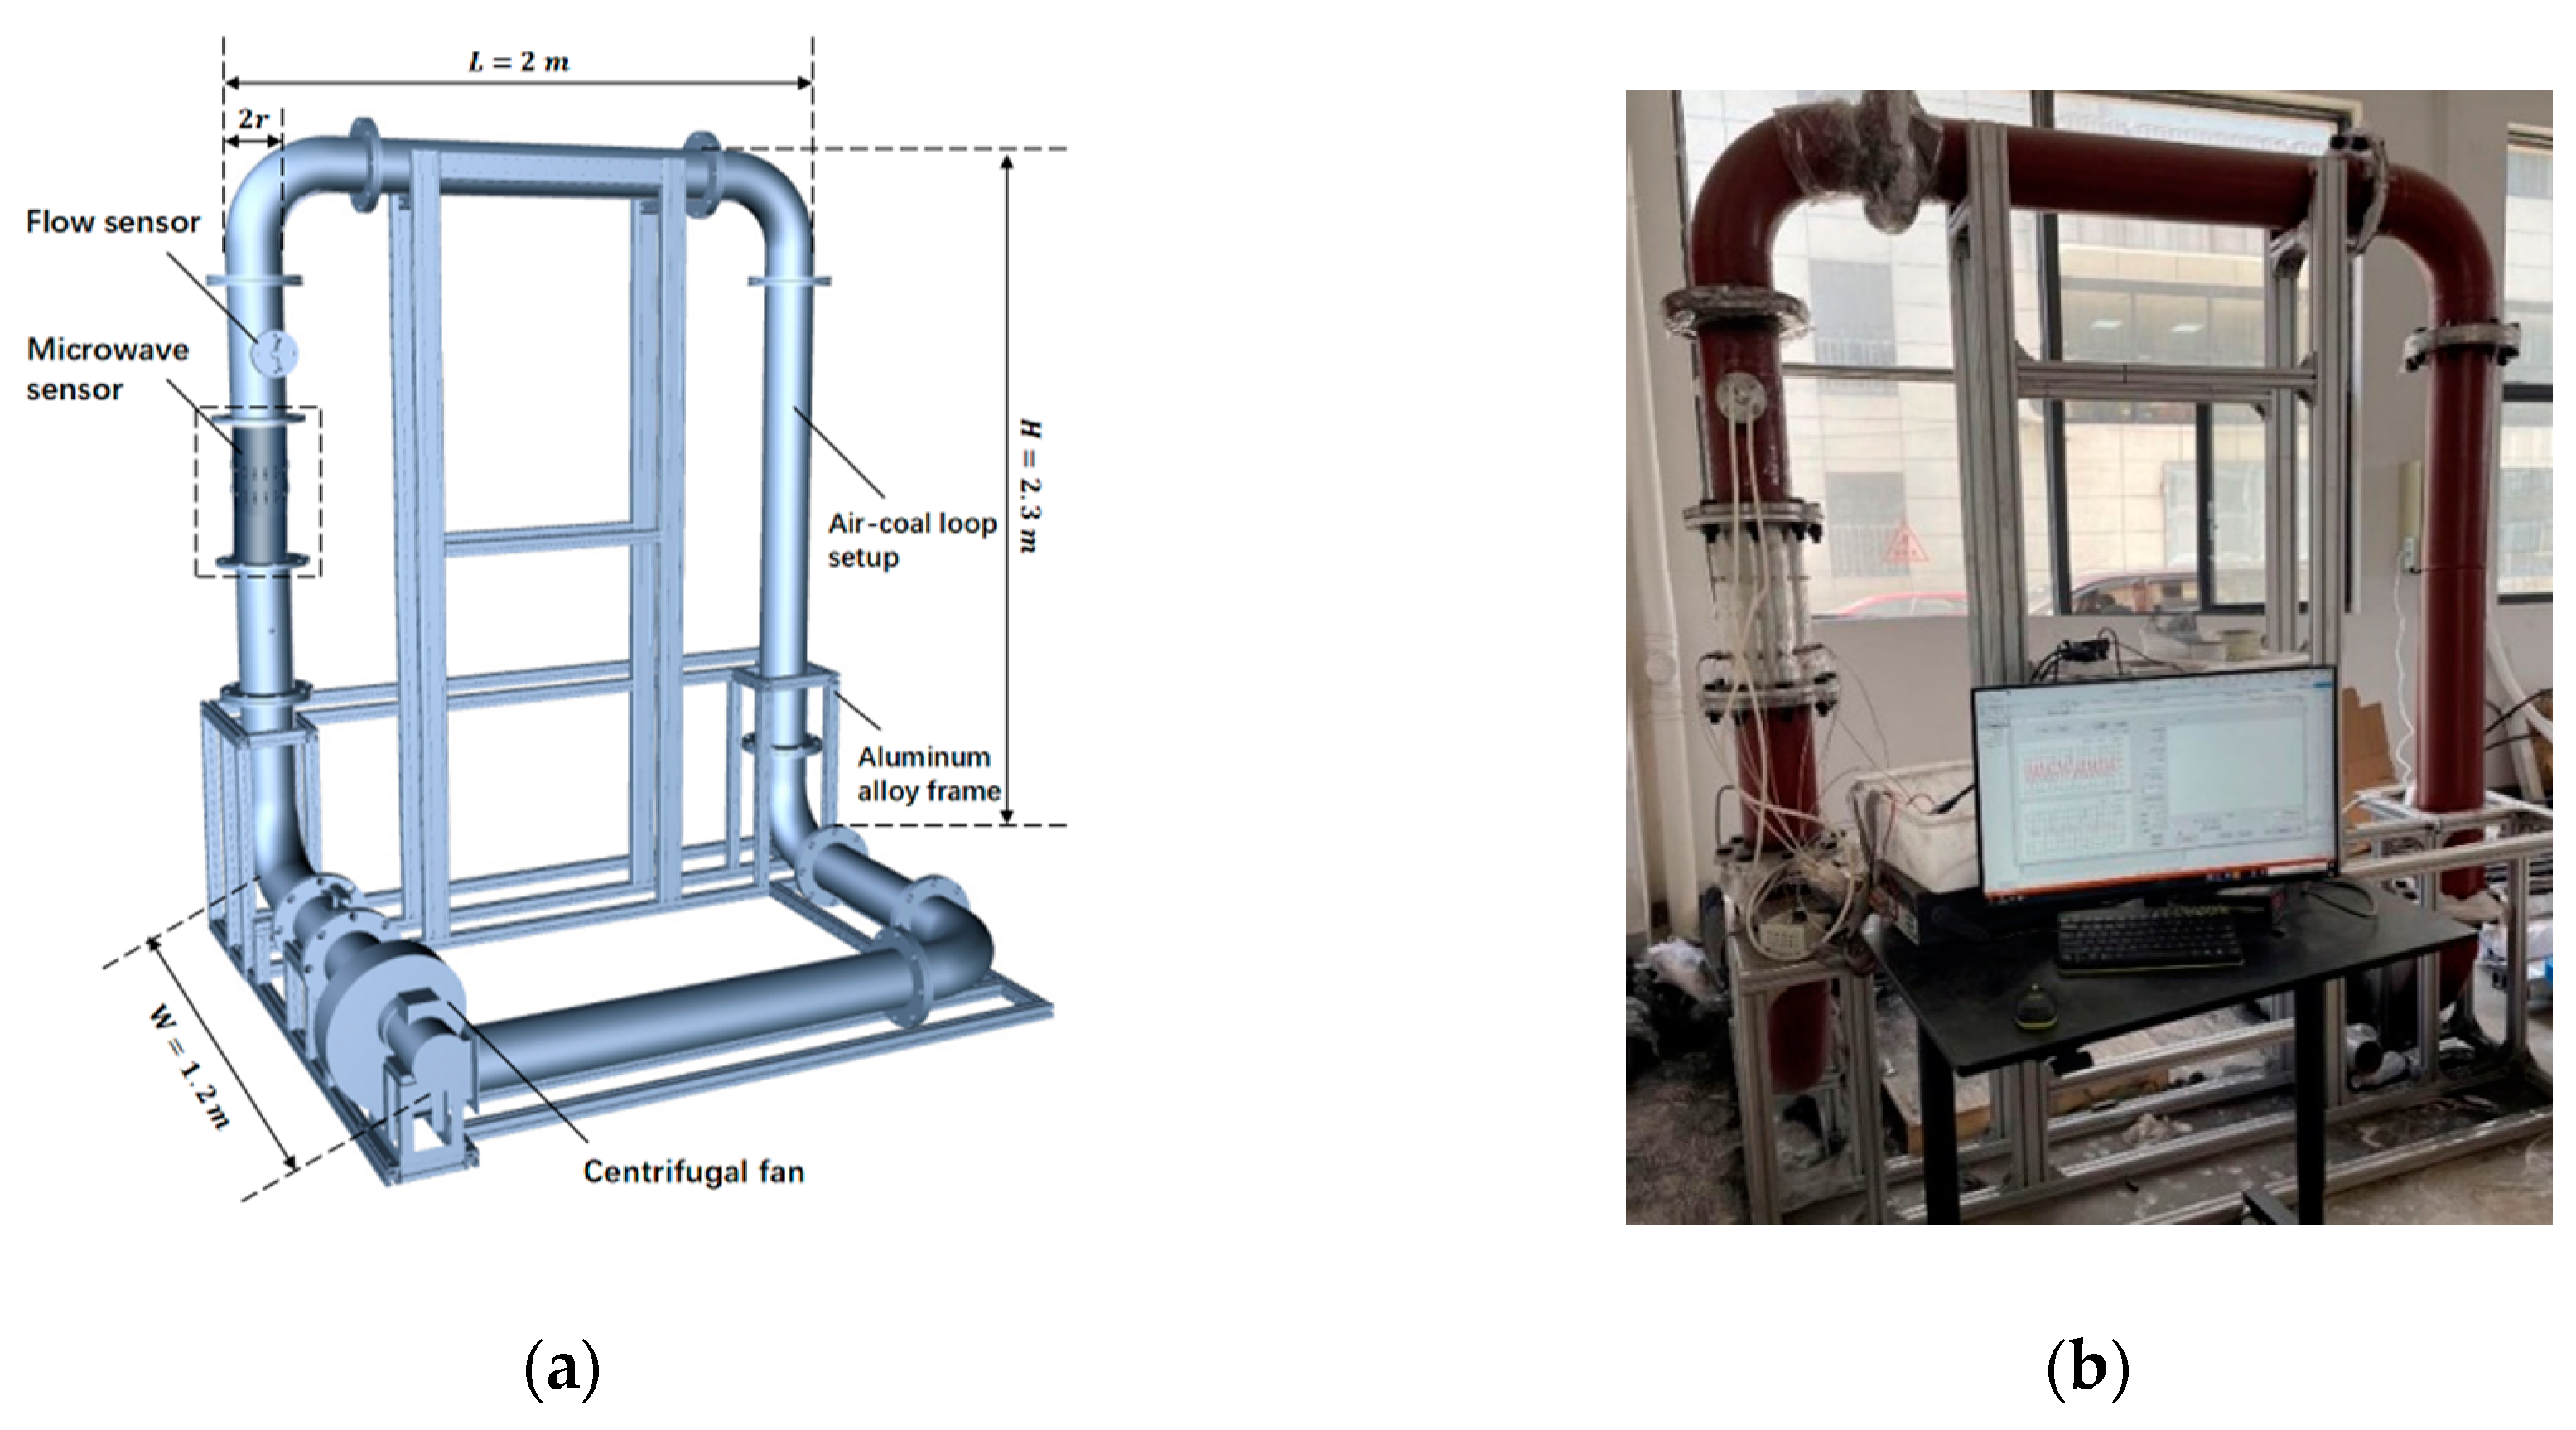
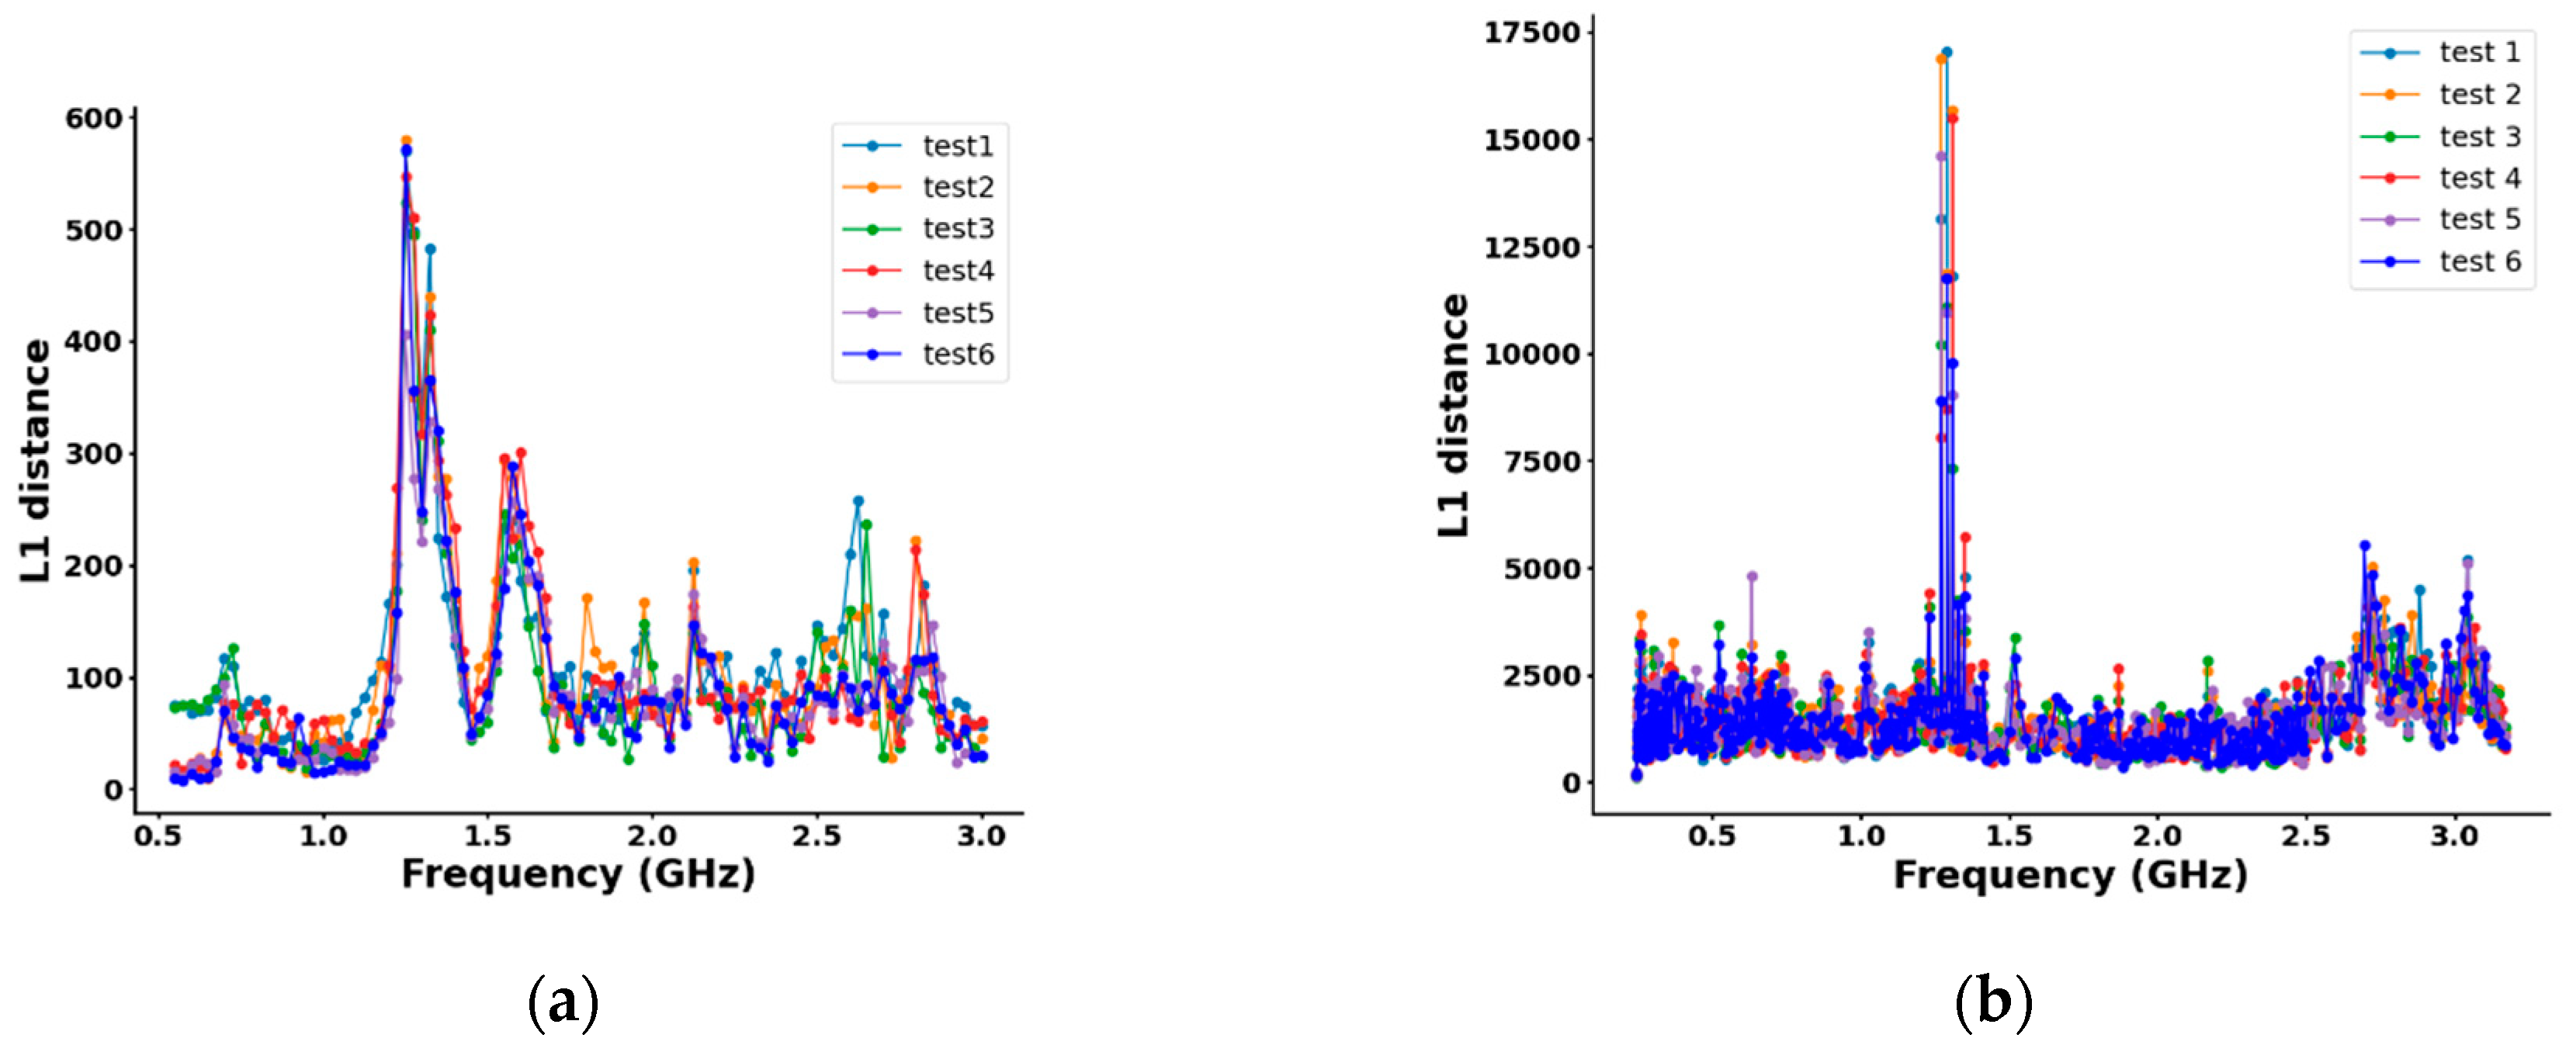
4.1. Prototype Experiments
4.2. Field Experiments
| Experiments Scenario | Sensor Diameter(mm) | Outer Wall Material | Substrate Layer Material |
|---|---|---|---|
| Prototype Experiments | 150 | Aluminium | Epoxy Resin |
| Field Experiments | 508 | Carbon Steel | PTFE |
| A# | B# | C# | D# | E# | |
|---|---|---|---|---|---|
| Mean Absolute Error(%) | 1.46 | 1.58 | 2.07 | 1.41 | 1.55 |
| Correlation coefficient | 0.57 | 0.31 | 0.98 | 0.85 | 0.66 |
5. Conclusions
Author Contributions
Funding
Institutional Review Board Statement
Informed Consent Statement
Data Availability Statement
Conflicts of Interest
References
- Liakos, H.H.; Theologos, K.N.; Boudouvis, A.G.; Markatos, N.C. Pulverized Coal Char Combustion: The Effect of Particle Size on Burner Performance. Applied Thermal Engineering 1998. [Google Scholar] [CrossRef]
- Zheng, Y.; Liu, Q. Review of Certain Key Issues in Indirect Measurements of the Mass Flow Rate of Solids in Pneumatic Conveying Pipelines. Measurement 2010, 43, 727–734. [Google Scholar] [CrossRef]
- Baucum, W.E. Evaluation of a Coriolis Mass Flow Meter for Pulverized Coal Flows; 1979; p. DOE/ET/10815-T2, 5228038. [Google Scholar]
- Gu, J.; Su, M.; Cai, X. In-Line Measurement of Pulverized Coal Concentration and Size in Pneumatic Pipelines Using Dual-Frequency Ultrasound. Applied Acoustics 2018, 138, 163–170. [Google Scholar] [CrossRef]
- Wang, X.X.; Hu, H.L.; Liu, X.; Zhang, Y.Y. Concentration Measurement of Dilute Pulverized Fuel Flow by Electrical Capacitance Tomography. Instrumentation Science & Technology 2015, 43, 89–106. [Google Scholar]
- Cai, X.; Li, J.; Ouyang, X.; Zhao, Z.; Su, M. In-Line Measurement of Pneumatically Conveyed Particles by a Light Transmission Fluctuation Method. Flow Measurement and Instrumentation 2005, 16, 315–320. [Google Scholar] [CrossRef]
- Yan, Y.; Wang, L.; Wang, T.; Wang, X.; Hu, Y.; Duan, Q. Application of Soft Computing Techniques to Multiphase Flow Measurement: A Review. Flow Measurement and Instrumentation 2018, 60, 30–43. [Google Scholar] [CrossRef]
- Wang, X.; Hu, H.; Liu, X. Multisensor Data Fusion Techniques With ELM for Pulverized-Fuel Flow Concentration Measurement in Cofired Power Plant. IEEE Trans. Instrum. Meas. 2015, 64, 2769–2780. [Google Scholar] [CrossRef]
- Wang, X.; Hu, H.; Zhang, A. Concentration Measurement of Three-Phase Flow Based on Multi-Sensor Data Fusion Using Adaptive Fuzzy Inference System. Flow Measurement and Instrumentation 2014, 39, 1–8. [Google Scholar] [CrossRef]
- Jin, Q.; Zeng, L.; Chen, X.; Li, P.; Fu, H.; Zhou, Y.; Wu, Y.; Wu, X. Portable Digital Holographic Particle Analyzer (DHPA) for Pneumatically Conveyed Fuel Monitoring: Design and Validation. Powder Technology 2023, 430, 119030. [Google Scholar] [CrossRef]
- Sheila-Vadde, A.C.; Melapudi, V.; Suma, M.N.; Kumar, K.M.M.; Ward, J. Non-Intrusive Microwave System for Multiphase Flow Metering. In Proceedings of the 2018 IEEE International Instrumentation and Measurement Technology Conference (I2MTC); IEEE: Houston, TX, 2018; pp. 1–6. [Google Scholar]
- Guo, Z.; Zhang, G. Application of a Microwave Mass Flow Meter in a Dense Phase Pneumatic Conveying System of Pulverized Coal. In Proceedings of the 2018 IEEE 3rd Advanced Information Technology, Electronic and Automation Control Conference (IAEAC); IEEE: Chongqing, 2018; pp. 2547–2551. [Google Scholar]
- Cen, K.; Ma, B.; Qiu, K.; Zhou, H. On-Line Electromagnetic Wave Based Coal Concentration Monitoring Technique for Pipe Flow. In Proceedings of the AIP Conference Proceedings; AIP: Macau (China), 2007; Vol. 914, pp. 262–267. [Google Scholar]
- Penirschke, A.; Jakoby, R. Microwave Mass Flow Detector for Particulate Solids Based on Spatial Filtering Velocimetry. IEEE Trans. Microwave Theory Techn. 2008, 56, 3193–3199. [Google Scholar] [CrossRef]
- Wang, D.; Liu, X.; Wang, Y.; Zhu, Z.; Chen, D.; Xie, Z. Measurement of Solid Concentration in Gas–Solid Flows Using a Microwave Resonant Cavity Sensor. IEEE Trans. Instrum. Meas. 2024, 73, 1–9. [Google Scholar] [CrossRef]
- Rahiman, M.H.F.; Wan Kiat, T.T.; Ping Jack, S.; Abdul Rahim, R. Microwave Tomography Application and Approaches – A Review. Jurnal Teknologi 2015, 73. [Google Scholar] [CrossRef]
- Wu, Z. Developing a Microwave Tomographic System for Multiphase Flow Imaging: Advances and Challenges. Transactions of the Institute of Measurement and Control 2015, 37, 760–768. [Google Scholar] [CrossRef]
- Pang, L.; Shao, Y.; Geng, C.; Zhong, W.; Liu, G.; Liu, L.; Tian, W. Measurement of Solid Mass Flow Rate by a Non-Intrusive Microwave Method. Powder Technology 2018, 323, 525–532. [Google Scholar] [CrossRef]
- Stuchly, S.S.; Sabir, M.S.; Hamid, A. Advances in Monitoring of Velocities and Densities of Particulates Using Microwave Doppler Effect. IEEE Trans. Instrum. Meas. 1977, 26, 21–24. [Google Scholar] [CrossRef]
- Chen, L.; Wang, Y.; Su, C. Simulation Study on Measuring Pulverized Coal Concentration in Power Plant Boiler. Journal of Information Processing Systems 2019, 15, 189–202. [Google Scholar]
- Gilmore, C.; Mojabi, P.; Zakaria, A.; Ostadrahimi, M.; Kaye, C.; Noghanian, S.; Shafai, L.; Pistorius, S.; LoVetri, J. A Wideband Microwave Tomography System With a Novel Frequency Selection Procedure. IEEE Trans. Biomed. Eng. 2010, 57, 894–904. [Google Scholar] [CrossRef]
- Zhang, J.; Bao, Y.; Du, D.; Wang, J.; Wei, Z. OM2S2: On-Line Moisture-Sensing System Using Multifrequency Microwave Signals Optimized by a Two-Stage Frequency Selection Framework. IEEE Trans. Ind. Electron. 2021, 68, 11501–11510. [Google Scholar] [CrossRef]
- Gladstone, J.; Dale, T. Researches on the Refraction, Dispersion, and Sensitiveness of Liquids. Phil. Trans. R. Soc. 1863, 153, 317–343. [Google Scholar]
- Huang, S.M.; Plaskowski, A.B.; Xie, C.G.; Beck, M.S. Tomographic Imaging of Two-Component Flow Using Capacitance Sensors. J. Phys. E: Sci. Instrum. 1989, 22, 173–177. [Google Scholar] [CrossRef]
- Zaatar, O.; Zakaria, A.; Qaddoumi, N. A Novel Switch for Microwave Imaging Systems. IEEE Access 2024, 12, 26978–26990. [Google Scholar] [CrossRef]
- Tong, H.; Gao, F.; Yuan, C.; Jin, Z.; Tian, B.; Tian, H. Experimental Investigation on Microwave Switch Matrix System for Real-Time Microwave Tomography Imaging Applications. In Proceedings of the 2022 IEEE 9th International Symposium on Microwave, Antenna, Propagation and EMC Technologies for Wireless Communications (MAPE); IEEE: Chengdu, China, 2022; pp. 415–418. [Google Scholar]
- Cai, T.T.; Wang, L. Orthogonal Matching Pursuit for Sparse Signal Recovery With Noise. IEEE Trans. Inform. Theory 2011, 57, 4680–4688. [Google Scholar] [CrossRef]
- Tian, H.; Zhong, Y.; Zheng, X.; Gao, F.; Song, G.; Wang, Z. Airflow Concentration Sensing for Pulverized Coal: System Design and Validation. In Proceedings of the 2023 4th International Conference on Computer Engineering and Application (ICCEA); IEEE: Hangzhou, China, 2023; pp. 436–439. [Google Scholar]


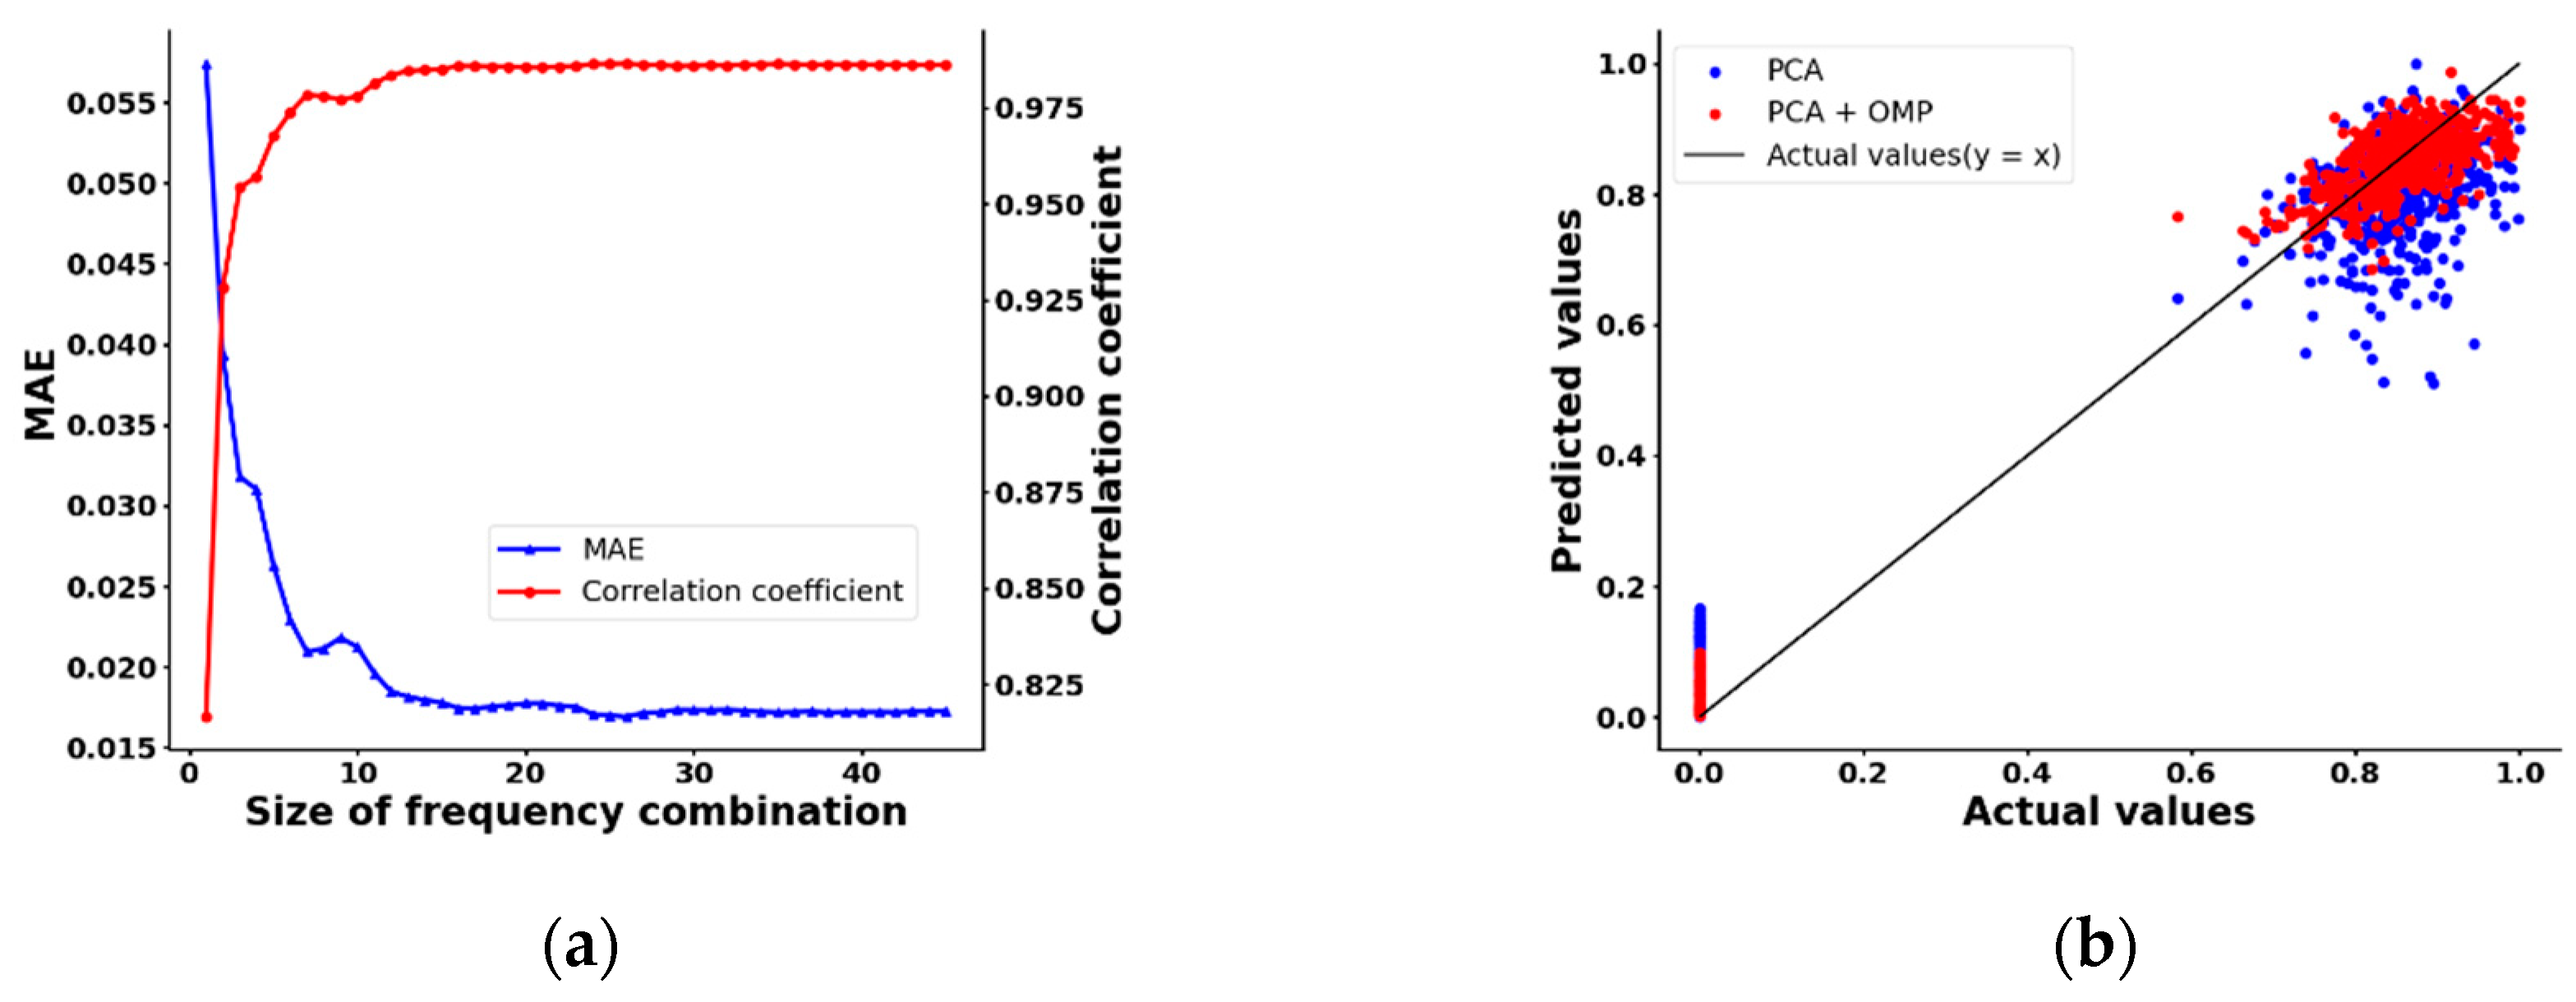
| Ref. | Method | Frequency Range (GHz) | Selection Method | Pros | Cons | Application |
|---|---|---|---|---|---|---|
| [15] | Resonant Cavity Methods | 1.5~1.8 | Sweep range of Vector Network Analyzer(VNA) | -Strong interpretability-Low environmental impact | -Calibration required-Narrow bandwidth | Industrial: gas-solid two-phase flow |
| [21] | MWT Methods | 3~6 | Compare single antenna vs. co-located measurements; choose frequency with minimal coupling difference | -Strong interpretability-Simple Calibration | -Additional measurements required-High hardware requirements | Biomedical: dielectric phantoms |
| [22] | Transmission Methods | 2~10 | Random Forest-Recursive Feature Elimination (RF-RFE) + Majority Voting Method (MVM) | -Data-driven | -Lack of interpretability-High data dependency | Agriculture: corn moisture |
| This Work | Transmission Methods | 1.5~2.5 | Principal Component Analysis (PCA)+Orthogonal Matching Pursuit (OMP) | -Data-driven | -High data dependency-Narrow bandwidth | Industrial: Pulerized Coal Concentration(PCC) |
| Device Type | Part # | Switching Time(ns) |
|---|---|---|
| SPDT RF Switch | M3SWA2-63DRC+ | 6 |
| 3 TO 8 Line Decoder Demultiplexer | 74HC138 | 12 |
Disclaimer/Publisher’s Note: The statements, opinions and data contained in all publications are solely those of the individual author(s) and contributor(s) and not of MDPI and/or the editor(s). MDPI and/or the editor(s) disclaim responsibility for any injury to people or property resulting from any ideas, methods, instructions or products referred to in the content. |
© 2024 by the authors. Licensee MDPI, Basel, Switzerland. This article is an open access article distributed under the terms and conditions of the Creative Commons Attribution (CC BY) license (http://creativecommons.org/licenses/by/4.0/).


