1. Introduction
Antenna arrays are considered one of the key technologies for 5G and 6G communication systems, and, undoubtedly, any forthcoming communication system will employ ever larger and sophisticated arrays to achieve higher and higher performance [
1,
2,
3]. The reason behind this success is their capability to focus the electromagnetic field radiation in a specific direction, improving the received power and enabling sophisticated multiplexing communication schemes that allow multiplying the available system throughput by a factor that can be proportional to the number of radiators employed [
4].
Unfortunately, even if the cost of high-frequency hardware has significantly been lowered in the last decades, the use of large antenna arrays for civil applications is still cautious because of the direct relationship between performance improvement and implementation and maintenance costs.
For this reason, the requirement for efficient antenna systems has accelerated the research of innovative, non-expensive architectures that could guarantee the requested specifications. The critical factor is the reduction of the number of transceivers [
5], the number of T/R modules that are effectively connected to one (or more) antennas, also referred to as “active elements”.
One of these architectures is represented by clustered arrays [
6,
7,
8,
9,
10], or arrays employing subarrays (
Figure 1a). Using subarrays allows exploiting a good directivity using a limited number of control points. However, this improvement is paid for by reducing the scanning capability, which for some applications may become limiting.
Another possibility is represented by the use of sparse [
11,
12,
13,
14,
15,
16,
17,
18,
19,
20,
21,
22,
23,
24,
25], non-regular architectures (
Figure 1b), since they can provide a good directivity, thanks to the improved overall antenna aperture, but differently from clustered arrays, the performance of the radiated beams remain stable for significant scanning ranges [
26].
Among the sparse antenna architectures, the thinned one is particularly appealing. In thinned architectures, the position of the radiators is obtained by selecting some elements from a regular grid (
Figure 1c). This kind of array shows some advantages in the realization process, and they are appealing also for radar applications [
27]; moreover, it could be possible to easily reconfigure the same antenna grid activating the elements that enable the wanted service, which is in general impossible to realize with sparse antennas.
It is well known that the synthesis of sparse antenna arrays, in its most general formulation, is challenging to solve; this difficulty is mainly due to the non-linear relationship between the array factor and the positions of the radiators, but this problem is also true for thinned arrays for which the choice of the elements to turn on/off shares the limitations of NP-hard problems.
Because of these difficulties, thinned array synthesis has been largely investigated in the last decades; in particular, several deterministic techniques have been developed for their synthesis. Some examples are the quantization of a continuous aperture distribution [
28], the use of difference sets [
29,
30,
31], Minimax inspired approaches [
32], Fourier Transform based methods [
33,
34,
35], convex programming [
36], fractal approach [
37], Quantum Fourier Transform method [
38].
The use of evolutionary algorithms has also been demonstrated to be effective, and many approaches have been tested [
39,
40,
41,
42,
43,
44,
45,
46,
47,
48], also exploiting hybrid techniques [
49,
50,
51,
52] or machine learning methods [
53].
Unfortunately, to the best knowledge of the authors, the problem of antenna array thinning has not been eviscerated satisfactorily from its multi-objective nature. Several parameters describe the quality of a radiation pattern (directivity, beamwidth, side-lobe level, number of employed elements and so on), but only a few studies, like [
54,
55,
56,
57,
58] have investigated these aspects properly.
In particular, no studies have deeply analyzed the performance realizable when a fixed number of active elements is employed. The focus on a specific number of elements is crucial since antenna engineers are often interested in evaluating the advantages of substituting a standard regular array with a different architecture, and one of the most effective ways to perform a comparison is considering a fixed cost, i.e., a fixed number of control points.
In this paper, we propose a methodology based on a specifically designed multi-objective optimization algorithm to face this problem, and several design curves will be also provided to help the antenna engineers perform a preliminary dimensioning and benchmarking of the system to design.
The paper is organized in the following way. In
Section 2, the antenna model will be discussed together with the calculation of pattern parameters. In
Section 3, a novel algorithm, the Multi-Objective Pareto Evolution for Thinning (MOPET) will be presented and discussed. In
Section 4, several results and design curves obtained with MOPET will be provided and discussed. Conclusions and future developments will follow.
2. Numerical Model
In this section, we will discuss the numerical model for antenna arrays employed in the paper. In particular, we will focus on synthesizing pencil beams with planar antenna arrays - linear arrays can be considered a sub-case. We will mainly evaluate the array factor since it is equivalent to employing an isotropic element pattern, and this choice has the advantage of simplifying the reproducibility of the results provided.
Let now
f be the working frequency,
the free-space wavelength, and
the free space wavenumber. With reference to
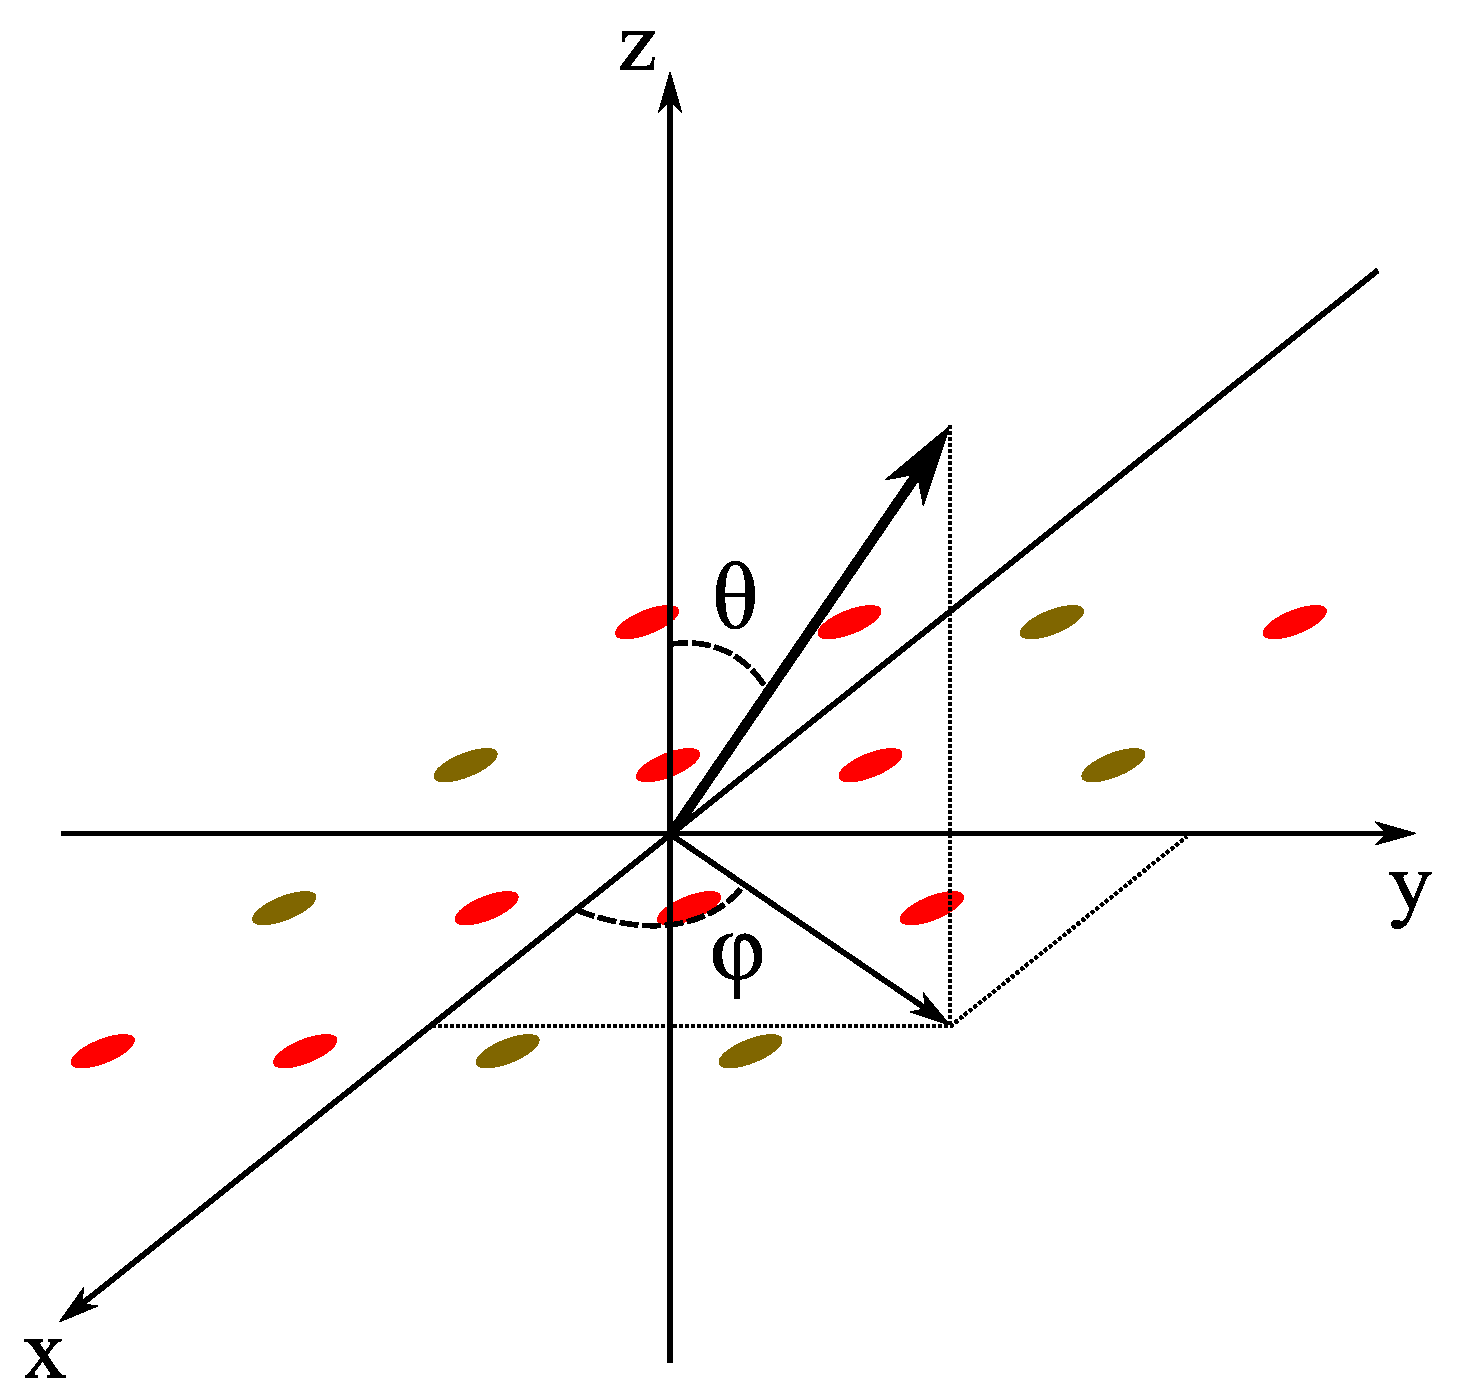
Figure 2, the position of the
N radiating elements of the array on the
plane will be given by the vectors
and
. For each element, the relative excitation will be stored in the vector
. The array factor can then be calculated as follows:
where
are the coordinates in the spherical coordinate system of
Figure 2. Suppose the vector of the excitations contains only real positive numbers. In that case, the array factor will show a pencil-like behavior, with a maximum in the
direction, also known as broadside direction.
As it is well-known, it is particularly convenient to introduce the two spatial variables
and
, and to write the array factor
); the directions
will represent the visible range of the array. This choice is particularly convenient when considering a linear-phase scanning of the array [
59]; if the excitations are modified according to
, the resulting array factor will show its maximum in the direction
, since the pattern will be translated in the
plane. It is then generally appropriate to calculate and optimize the array factor for a range larger than the visible one to obtain an antenna array that can radiate a pattern that behaves well when scanned. In this paper, we will consider in most cases a portion of the
plane such that
, where
takes into account the maximum scanning angle
with respect to the broadside direction.
2.1. Main Pattern Parameters
The choice of the position and excitation of all the elements will influence the width of the radiated beam, the resulting directivity, and the amplitude/direction of secondary lobes.
One of the most common approaches regarding the main beam width is finding the angles for which the pattern is reduced by 3 dB with respect to its maximum. For planar arrays, in general, this corresponds to the identification of the shape of the footprint.
The directivity represents the capability of the array to focus energy in the main beam direction. For the broadside beam of an array of isotropic elements, it can be calculated as:
where
is the Hermitian operator, and
is a square matrix that depends on the type of employed elements; for isotropic elements, its entries are:
with
the distance between two elements. The relationship (
3) can be obtained from the well-known formula of the directivity for linear arrays [
60], taking into account the symmetry of isotropic radiating pattern with respect to rotations of the coordinate system.
Finally, the side-lobe level (SLL) is calculated as the ratio of the main beam array factor with respect to the maximum in the other spatial directions:
where
is chosen to contain the main lobe on the
plane. The verification of the SLL condition on a certain region of the
plane allows to verify that the side-lobe pattern requirements are verified for the wanted scanning angles; in (
4) a circularly symmetric scanning capability with respect to the broadside direction is requested, but different choices could be made according to the overall system specifications.
2.2. An Observation on the Beam-Width
Some considerations on the relationship between beam width and directivity are now needed. From a practical point of view, the problem of the minimization of the beamwidth and the maximization of the directivity lead to very similar patterns, but while a directive pattern is always a pattern with a small beamwidth, the opposite may not be true because we can have a pattern with small beamwidth and a limited directivity, since some power can be wasted in non-focused directions, by side lobes or grating lobes.
Moreover, the evaluation of the beamwidth is easily applicable with linear arrays or with factorable arrays
1, since the resulting pattern will show an elliptical
dB footprint with the principal axes on the orthogonal
directions, but may lead to ambiguities and difficulties in performing comparisons between different layouts when sparse or thinned architectures are employed. On the contrary, directivity is an unambiguously defined parameter.
For this reason, in the following, we will opt to focus on the optimization of directivity only and check the beam width only when specific comparisons will be needed.
2.3. Antenna Array Synthesis
The array synthesis problem can be formulated as finding the positions and excitations of the radiating elements of an antenna array to radiate a beam with the wanted directivity and an SLL below a prescribed threshold for the wanted scanning region.
The previously described procedure is inherently a multi-objective optimization problem that is, in general, more hard to handle with respect to single-objective ones. In multi-objective problems, we have a set of competitive objectives that we would like to improve. Even if it is possible to use sophisticated weighting functions to reduce a multi-objective problem into a single-objective one [
61,
62,
63], to face this kind of problem without a-priori choices, we should identify the so-called “Pareto boundary” (PB). This term refers to the set of optimal solutions where no solution can be improved in one objective without sacrificing performance in another.
3. Multi-Objective Pareto Evolution for Thinning
The identification of the PB can be achieved in several ways, but the most efficient one consists of using one of the algorithms that explicitly seek the PB [
64]. In particular, some evolutionary algorithms have been developed to solve this task, and some popular ones are the SPEA [
65] and NSGA-II [
66]. These algorithms have already been fruitfully applied to the antenna array thinning problem [
56,
67], but in most cases, the number of radiating elements is considered one of the optimization parameters.
In this paper, we would like to focus on the achievable performance when a specific number of equal amplitude (or isophoric) radiators is employed. This approach is exciting from a practical point of view since it allows us to directly quantify the performance improvement when passing from a regular array architecture to a thinned array one.
To better solve this specific task, we have developed a novel evolutionary algorithm that takes inspiration from NSGA-II but is specifically tailored to the problem of finding the Pareto boundaries of thinned arrays, Multi-Objective Pareto Evolution for Thinning (MOPET).
The key point of MOPET is to achieve the evolution of the PB of the population of individuals; its main steps are described in the following:
Identify Grid: a grid of
antennas is defined, fixing its type (rectangular or triangular [
68]) the number of rows
, the number of columns
, as well as the vertical spacing
and horizontal spacing
.
Generate Starting Population: a population of individuals is randomly generated. Each individual is represented by a binary string containing exactly ones so that the thinning rate is the same for each individual.
Remove duplicate members: the population is checked for the presence of duplicated elements, and if found, they are removed.
Evaluate Population: the elements of the population are evaluated, and the PB is identified.
Weakly Dominated (WD) identification: the elements not belonging to the PB are sorted according to the number of individuals that dominate them, then a set of the same size as the PB is selected.
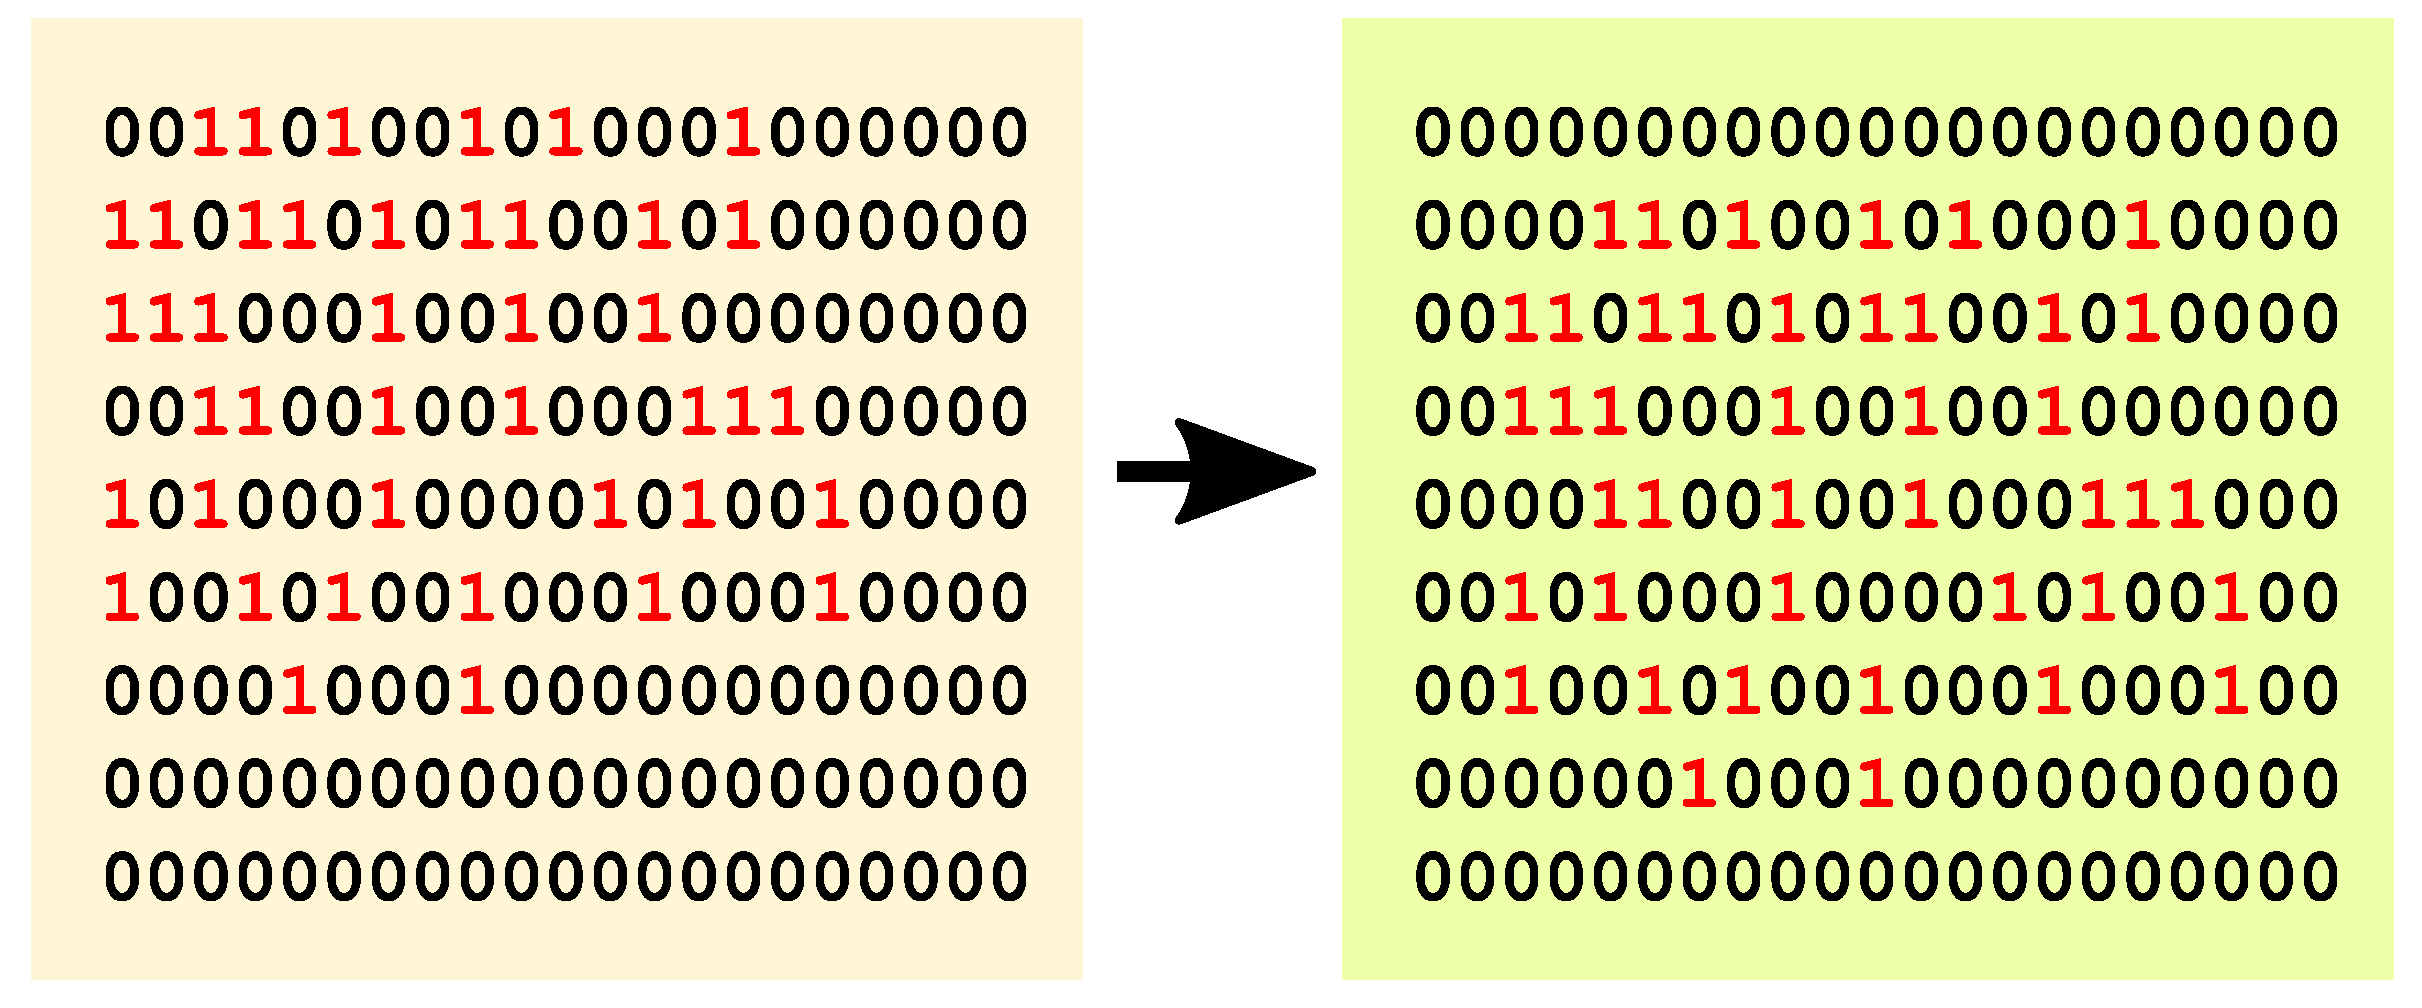
Grid centering of PB: To reduce the issue of multiple equivalent solutions, the individuals belonging to the PB and WD are modified in order to have the “ones” centered on the grid (see
Figure 3).
Immigrant population (IP) generations: A set of novel random “immigrating population” individuals is generated, in order to avoid stagnation of the algorithm.
Crossover realization: The individuals of PB, WD and IP are randomly selected to generate
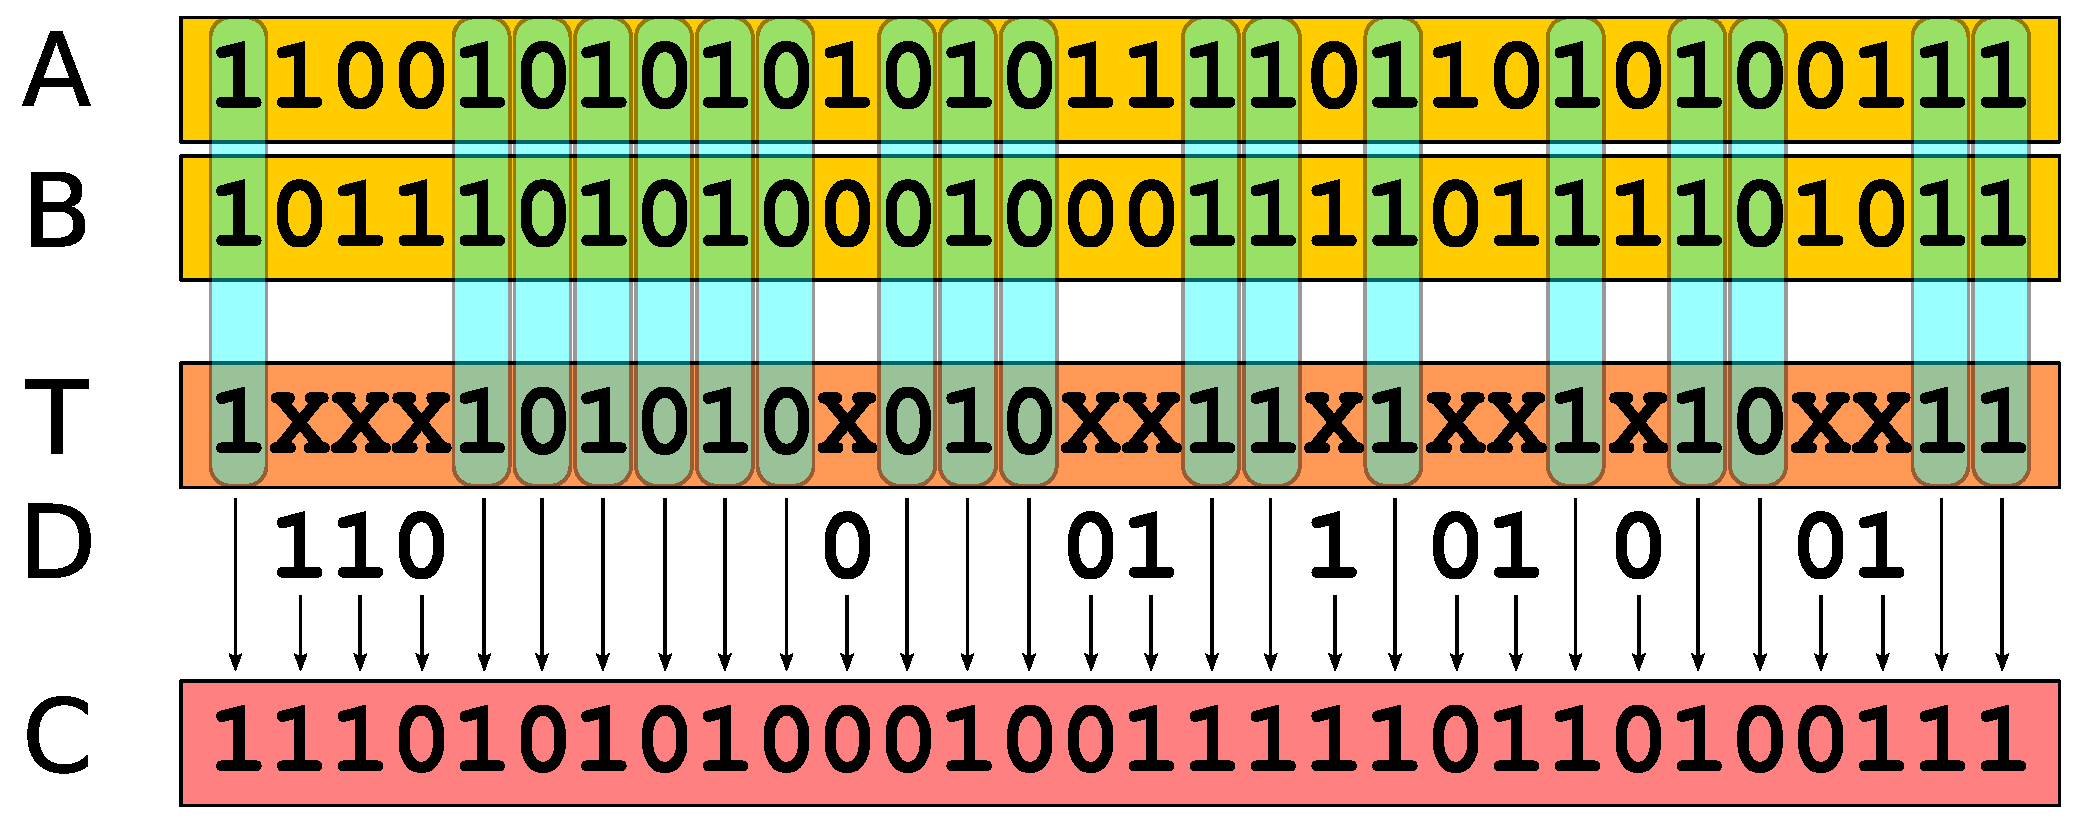
Crossover Individuals (CI), using the Thinning-Rate-Preserving Crossover (TRPC) function described in
Figure 4, that maintains the number of ones
in the generated vectors.
Perform Mutations: The individuals of the PB and WD are subject to mutation, generating Mutated Individuals (MI). For each MI, elements of the group of “ones” of the individual are exchanged with elements of the group of “zeros”.
Iteration: a new population is formed joining the PB, WD, IP, CI and MI, and the algorithm returns to step 3., unless the maximum number of iterations is reached.
Some considerations on the algorithm are now in order. First, the algorithm employs “elitism”, so the PB from a previous generation is always passed to the successive one. This feature guarantees that the PB can only improve in the course of the algorithm without the need for external storage of solutions.
Second, only the non-previously evaluated individuals are required to be calculated. This means that there is no particular penalty for the algorithm if the size of the PB becomes very large; moreover, differently from other algorithms like NSGA-II, there is no selection of the elements belonging to the PB according to a “crowding” principle.
Third, the duplicate element check and the use of an immigrated population help prevent the algorithm from getting stuck around some local solutions.
4. Results and Discussion
In this section, we will present some results that validate the approach analyzed in the previous sections and provide some design curves that may help design thinned and sparse array systems. The MOPET used to achieve the results in this section will employ the following parameters: , , , , and . For the calculation of directivity, we have considered isotropic elements; the use of more directive radiators would slightly increase the directivity (of an amount approximately equal to the radiator’s directivity), but the array factor essentially dominates the pattern shape, so the proposed results can be used as a reference also when non-isotropic elements are employed.
4.1. A Preliminary Case Study
First, we will analyze a case study discussed in [
34]. In particular, we will focus on a thinned antenna array of
elements able to radiate a pencil beam in the horizontal range
and a vertical range
. To achieve this task, a rectangular grid of
elements (
), with
, has been selected. It is worth underlining that, from a combinatorial point of view, the overall number of different layouts of 128 elements from a grid of 288 is around
; even if some of these layouts are equivalent (because of symmetries and translations), the overall number of possibilities is huge and the synthesis problem cannot be solved by means of an exhaustive search.
In
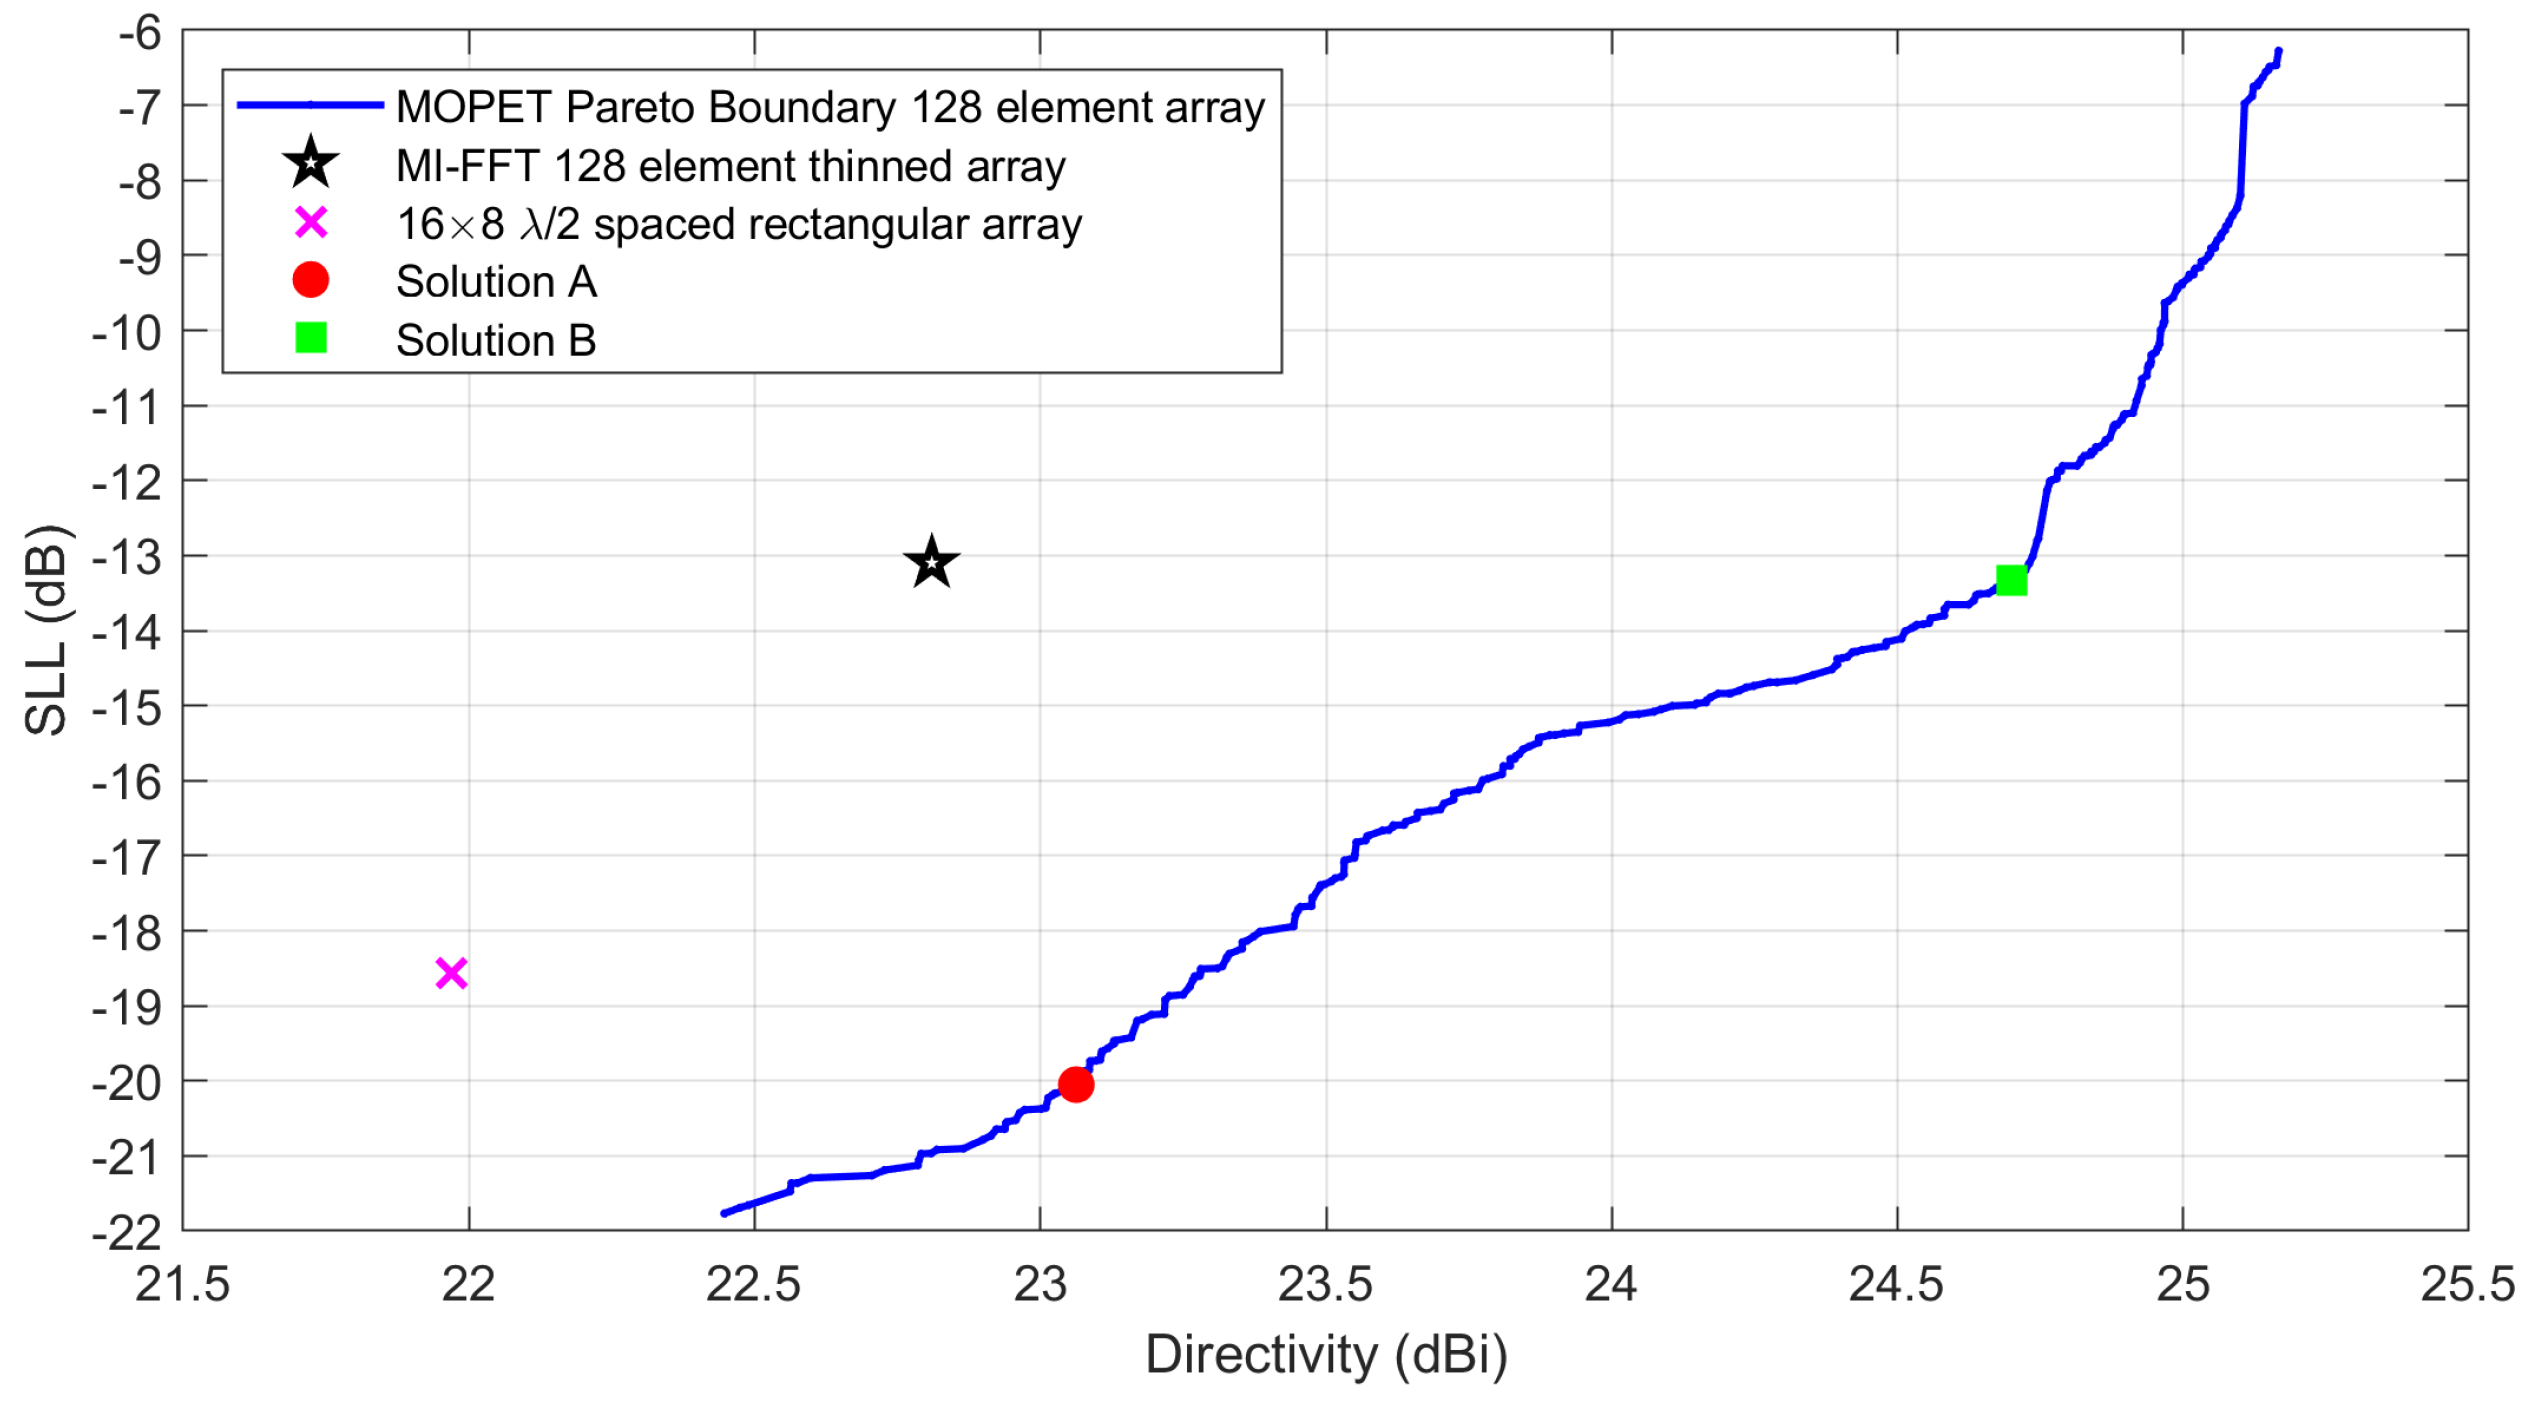
Figure 5 we can see the Pareto Boundary made of
different arrays found with MOPET for the considered case. In the plot, it is also possible to see the comparison with the thinned solution presented in [
34], as well as the comparison with the “standard”
equispaced rectangular array of 16 columns and 8 rows. It is clearly visible that both these solutions are on the left side of the Pareto curve, meaning that the identified Pareto boundary contains several solutions that dominate both the reference ones.
To better understand this result, we will focus on analyzing a couple of solutions belonging to the identified PB. In
Figure 6, we can see “Solution A”. In this case, the synthesized array shows a broadside directivity of
dBi and an SLL lower than
dB for all beams considered in the scanning range.
In
Figure 7, we can see “Solution B”. In this case, the synthesized array shows a broadside directivity of
dBi and an SLL lower than
dB for all beams considered in the scanning range.
It is worth noting that the choice of the simulation parameters has been made to improve the identification of the Pareto Boundary curve. In particular, running the algorithm for iterations required about ten hours of calculation on an Intel 14900k based office PC; this choice has been done to achieve a “smooth” and well-converged Pareto curve, but Pareto curves close to the final one were also achieved after just 3000 iterations. It has finally to be reminded that the antenna array synthesis task is an off-line task, and in most cases, the ability to explore the search space delivering quality solutions is much more important than the pure speed. Moreover, the 10 hours of calculation allowed us to generate not a single solution, like in other optimization algorithms, but optimal different arrays, so the amount of time is acceptable.
4.2. Design Curves for Variable Grid and Number of Control Points
We will now investigate the synthesis of a pencil beam considering two different cases: the radiation of a single broadside beam without scanning and the synthesis of a beam capable of scanning up to an angle of (deg) with respect to the broadside direction. The analysis will be then repeated for different numbers of active radiating elements (). Moreover, we will analyze the effect of employing different types of grids (rectangular and triangular). The inter-element distance for the elements of the starting grid will be always .
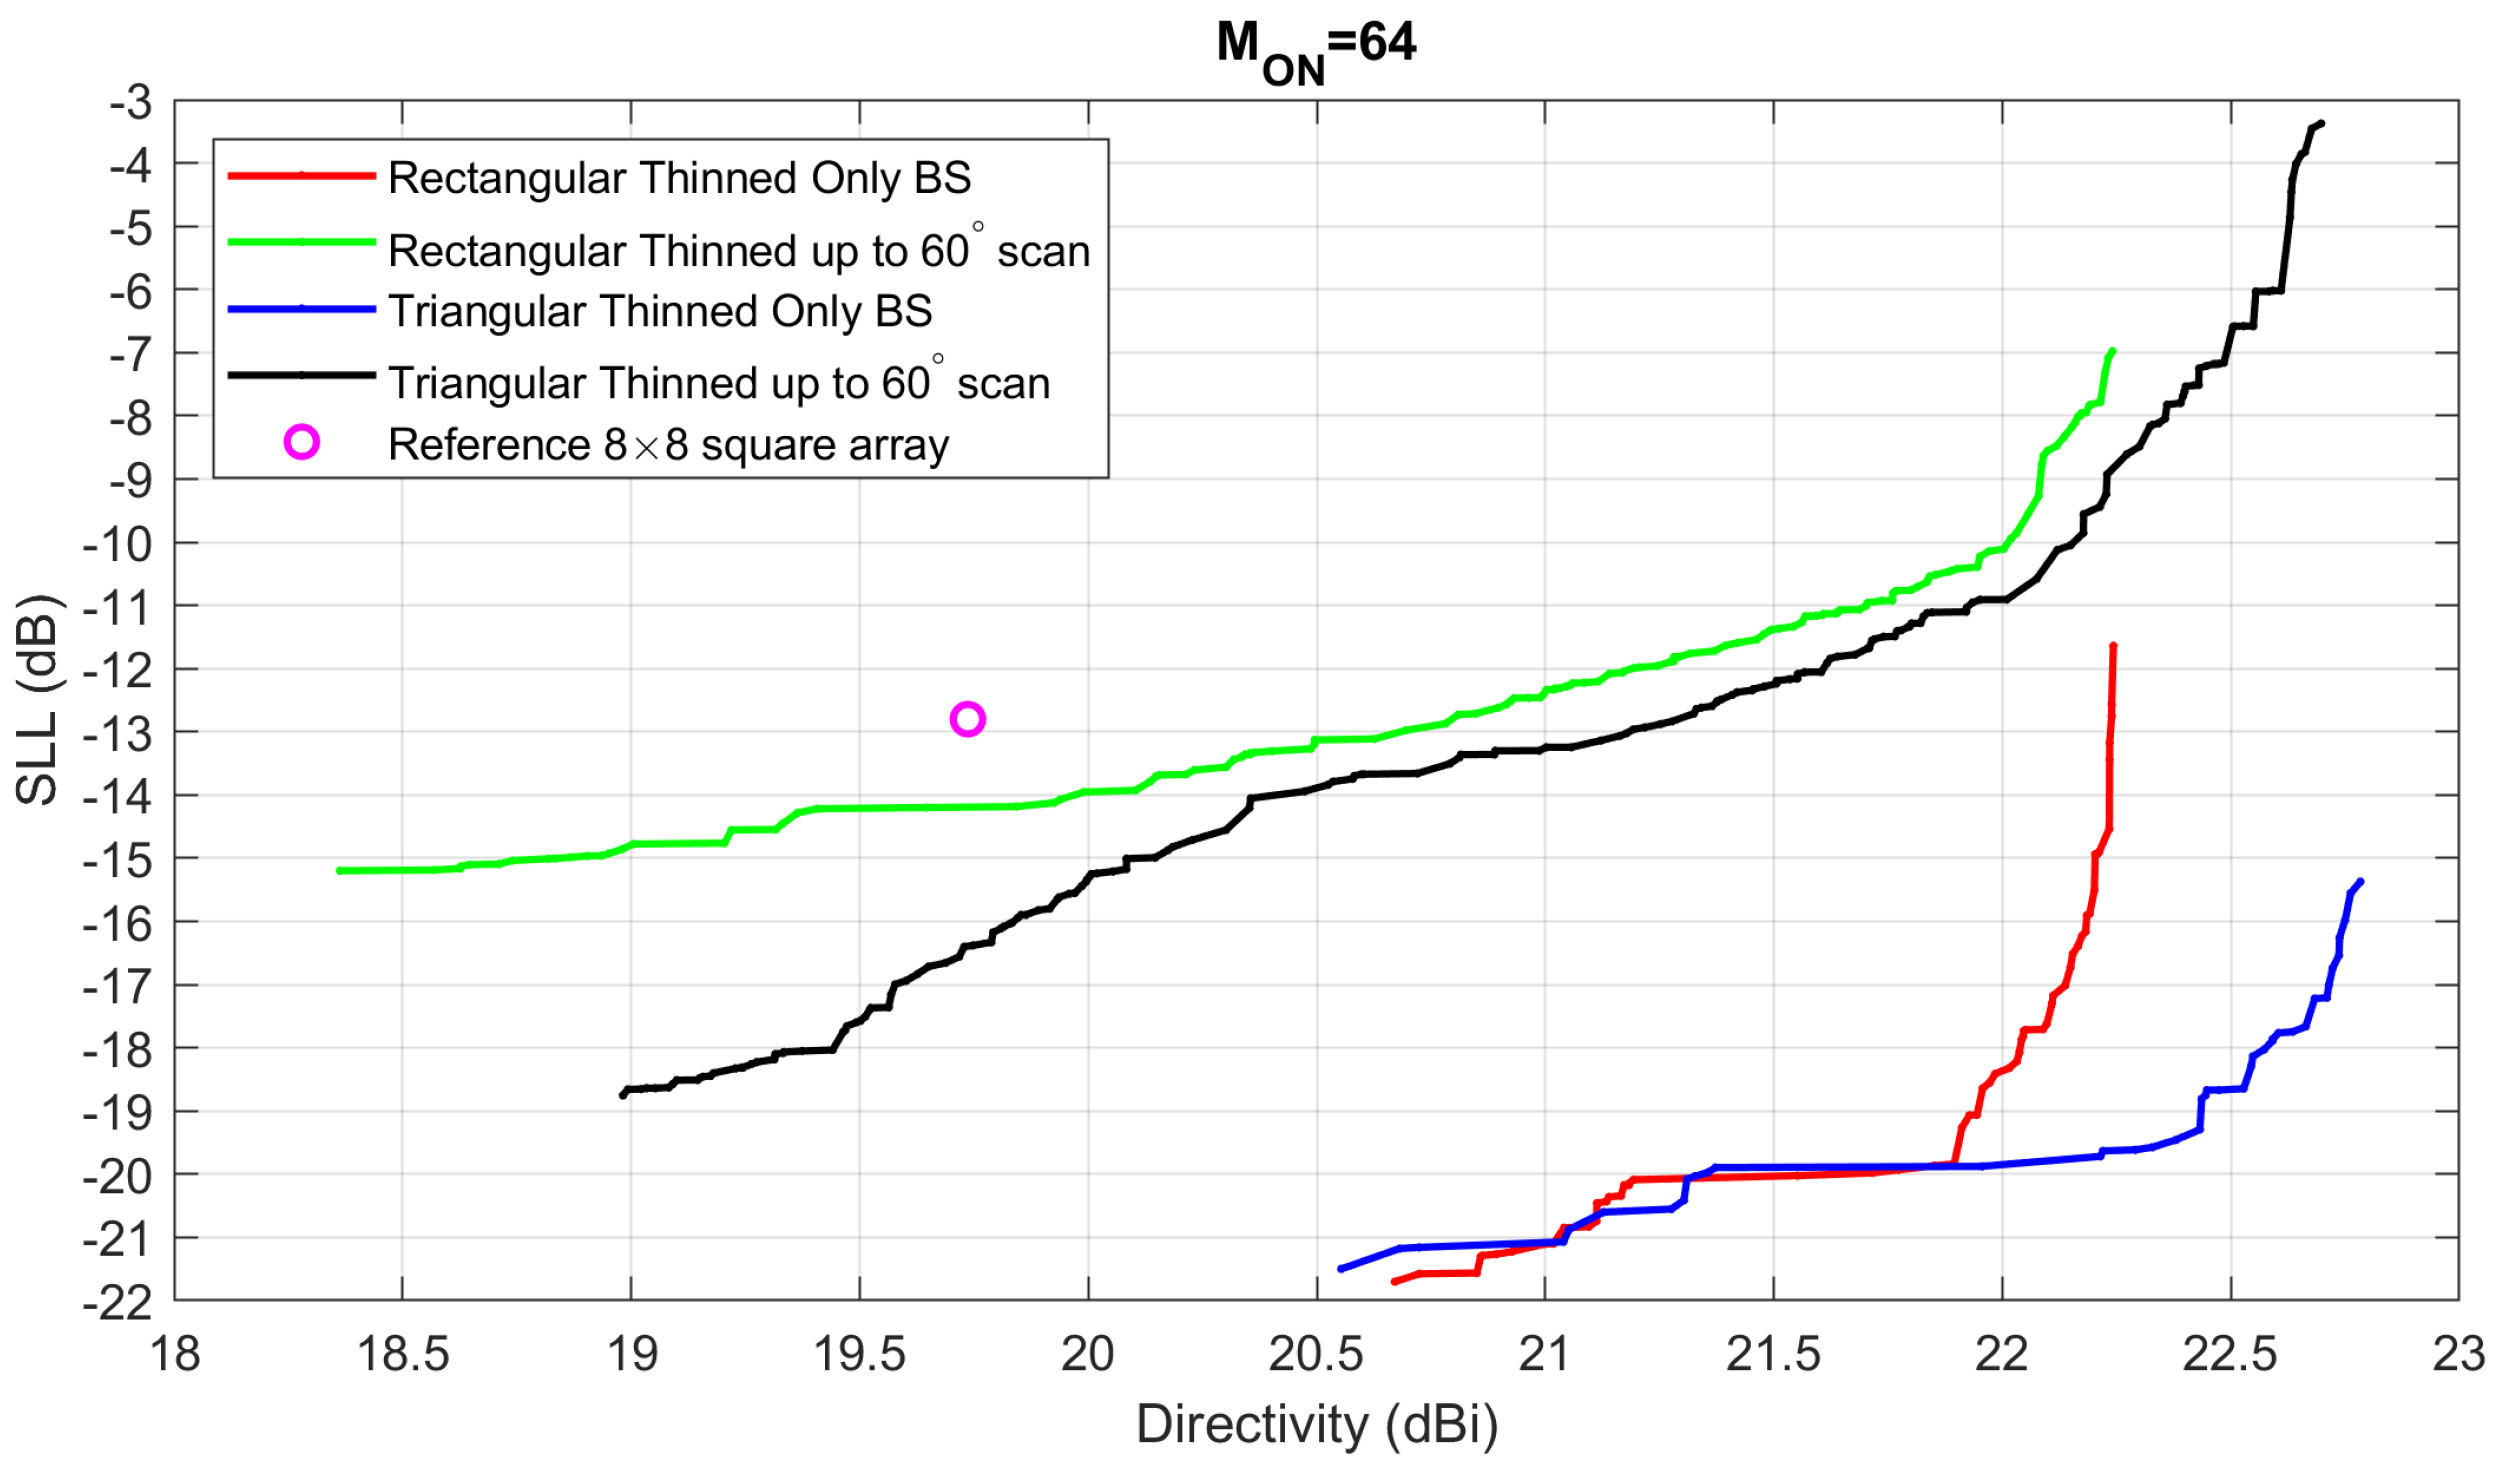
In
Figure 8, we can see the 4 Pareto Boundaries found with MOPET for the case of
, compared to the reference case, the
square planar array of
isotropic elements. For the rectangular beam, we used a starting grid of
elements to be used in the thinning optimization, while for the triangular case, a grid of
elements has been employed so that the overall starting layout is approximately square. It is visible that the requirement of a significant scanning range enormously lowers the achievable SLL for the same level of directivity; moreover, the triangular lattice seems to perform better than the rectangular one: the two lattices are practically equivalent only in the case of the synthesis of a broadside only beam with the lowest SLL.
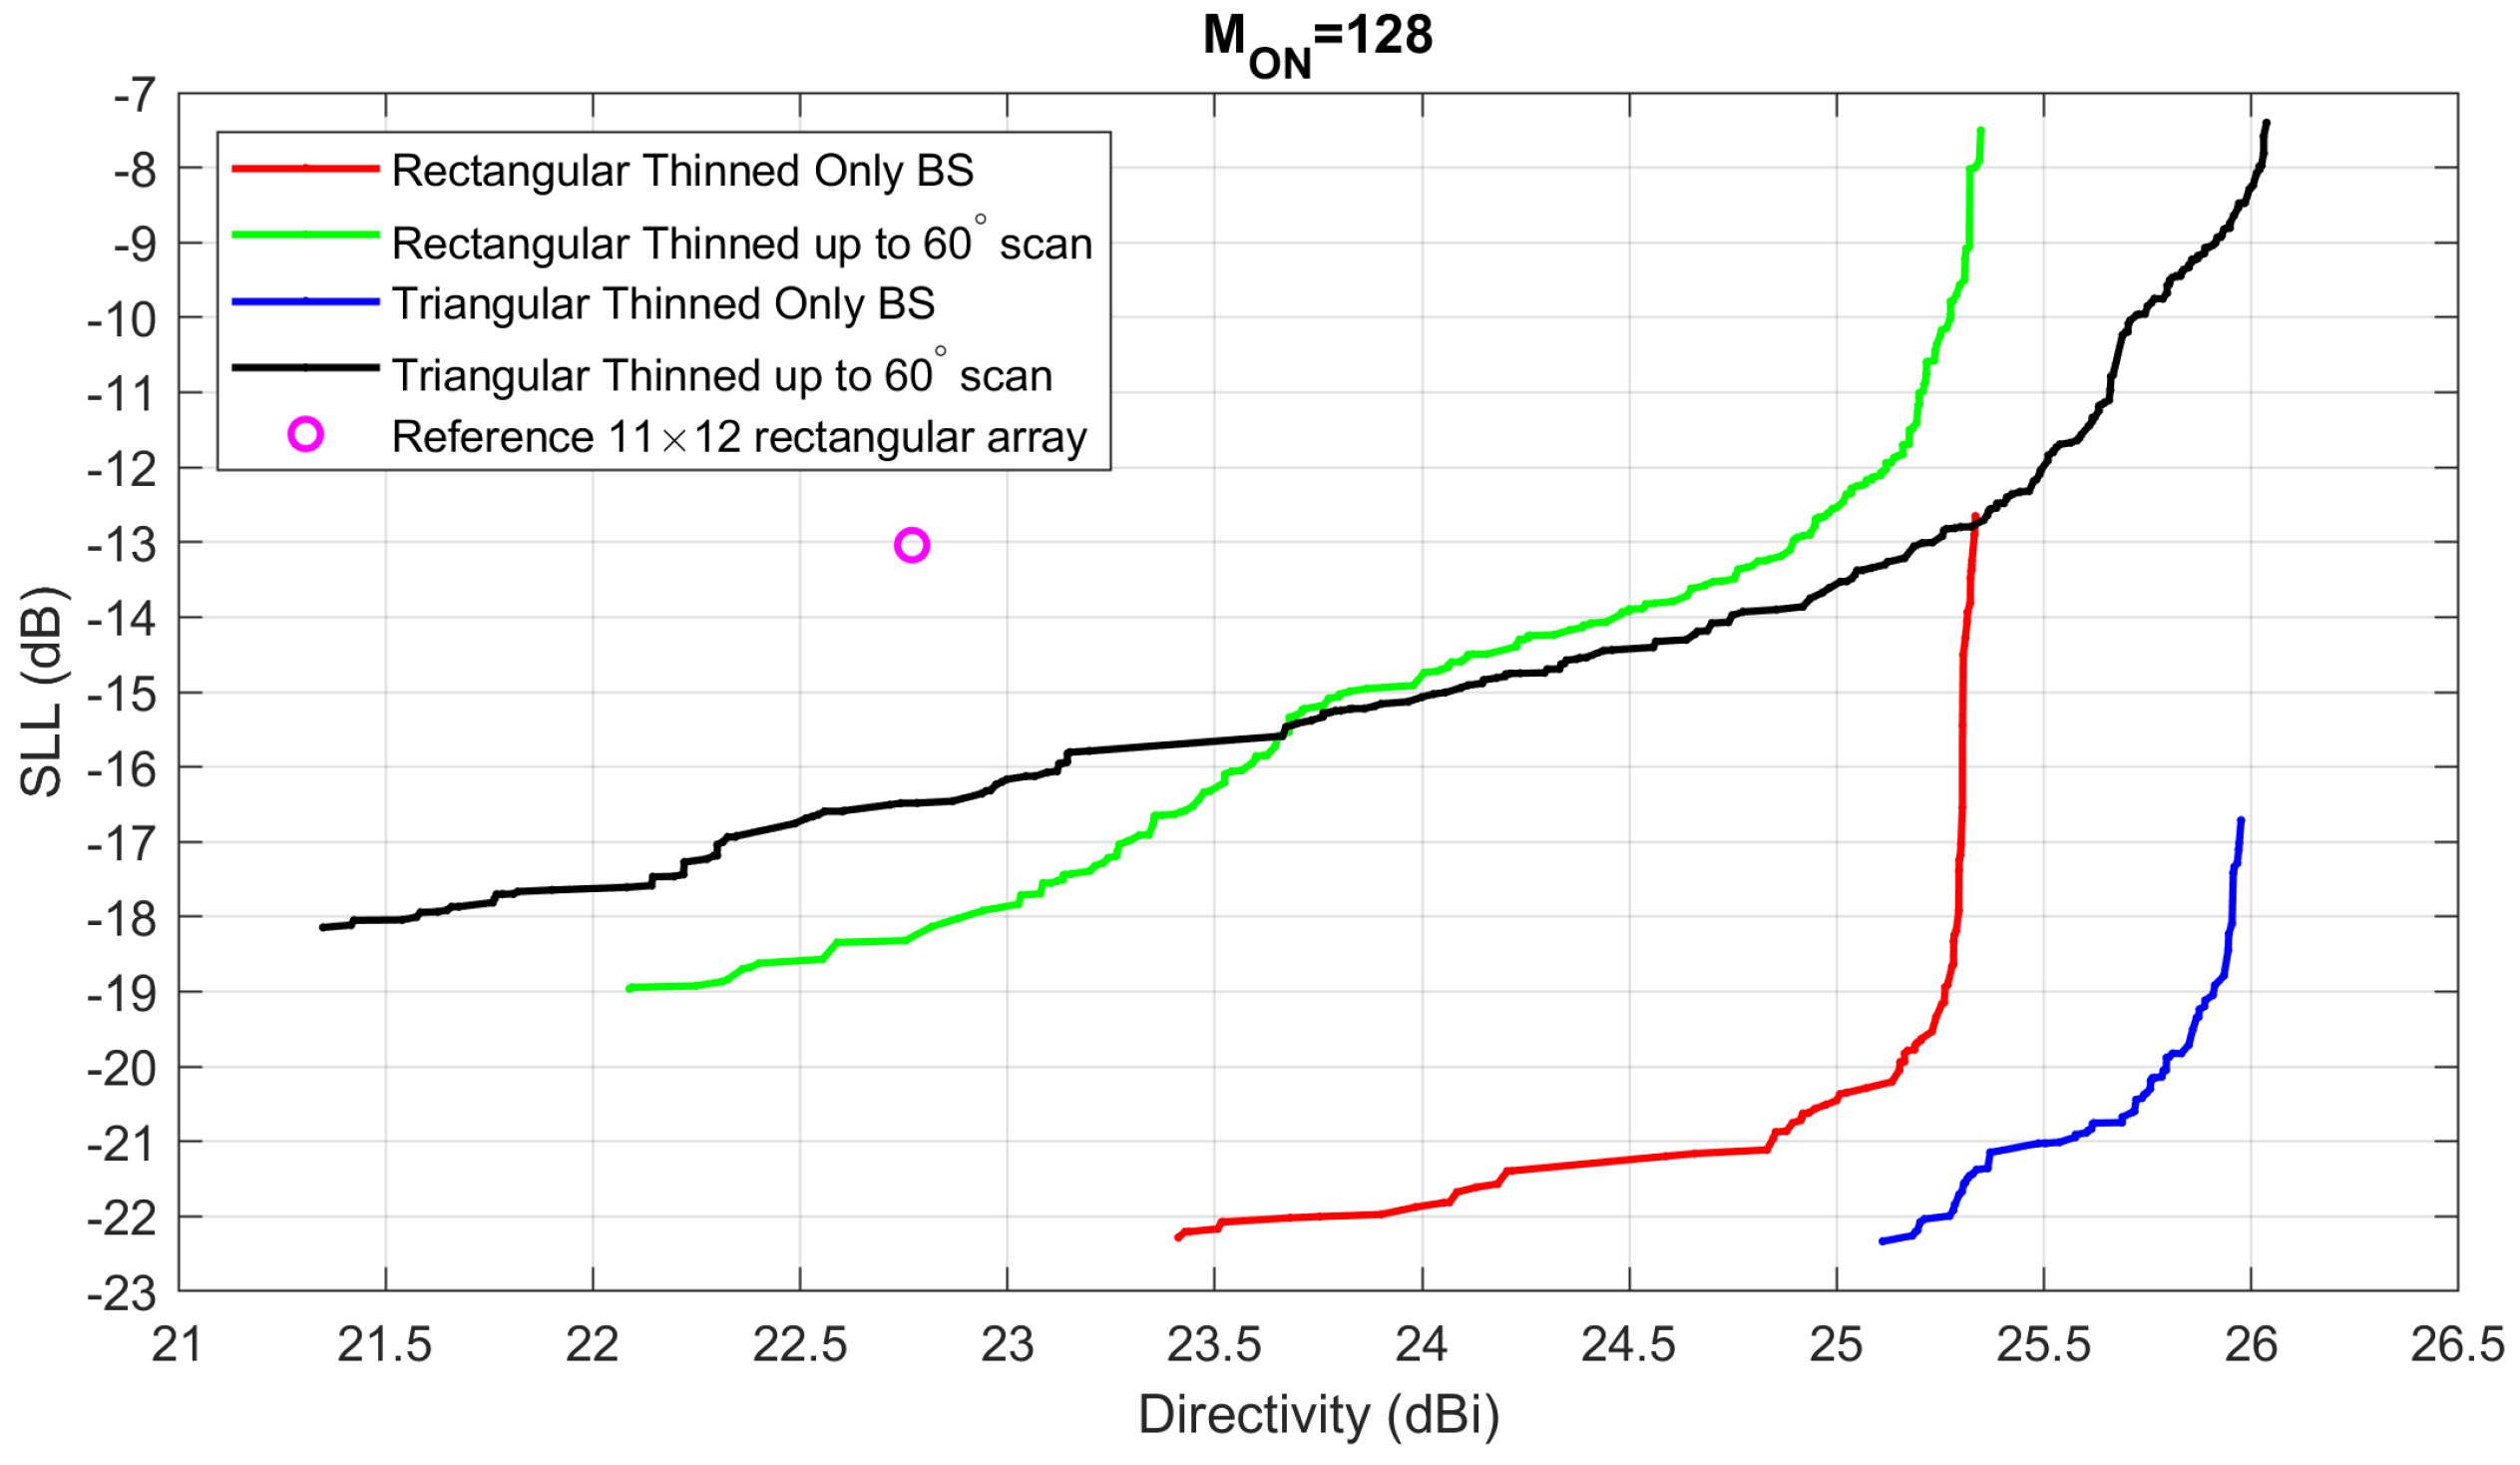
In
Figure 9 we can see the 4 Pareto Boundaries found with MOPET for the case of
, compared to the reference case, the
“almost square” planar array of
isotropic elements (the four corner elements of the regular grid have been removed to obtain exactly 128 elements). For the rectangular beam, we used a search grid of
elements, while for the triangular case, a search grid of
elements has been employed so that the overall starting layout is approximately square. Again, we can see that the requirement of a significant scanning range strongly lowers the achievable SLL for the same level of directivity; in this case, the triangular lattice seems to perform better than the rectangular one only in the “broadside only” case; when considering a significant scanning the triangular lattice is superior for the higher directivity layouts, while the rectangular lattice provides the lowest SLL.
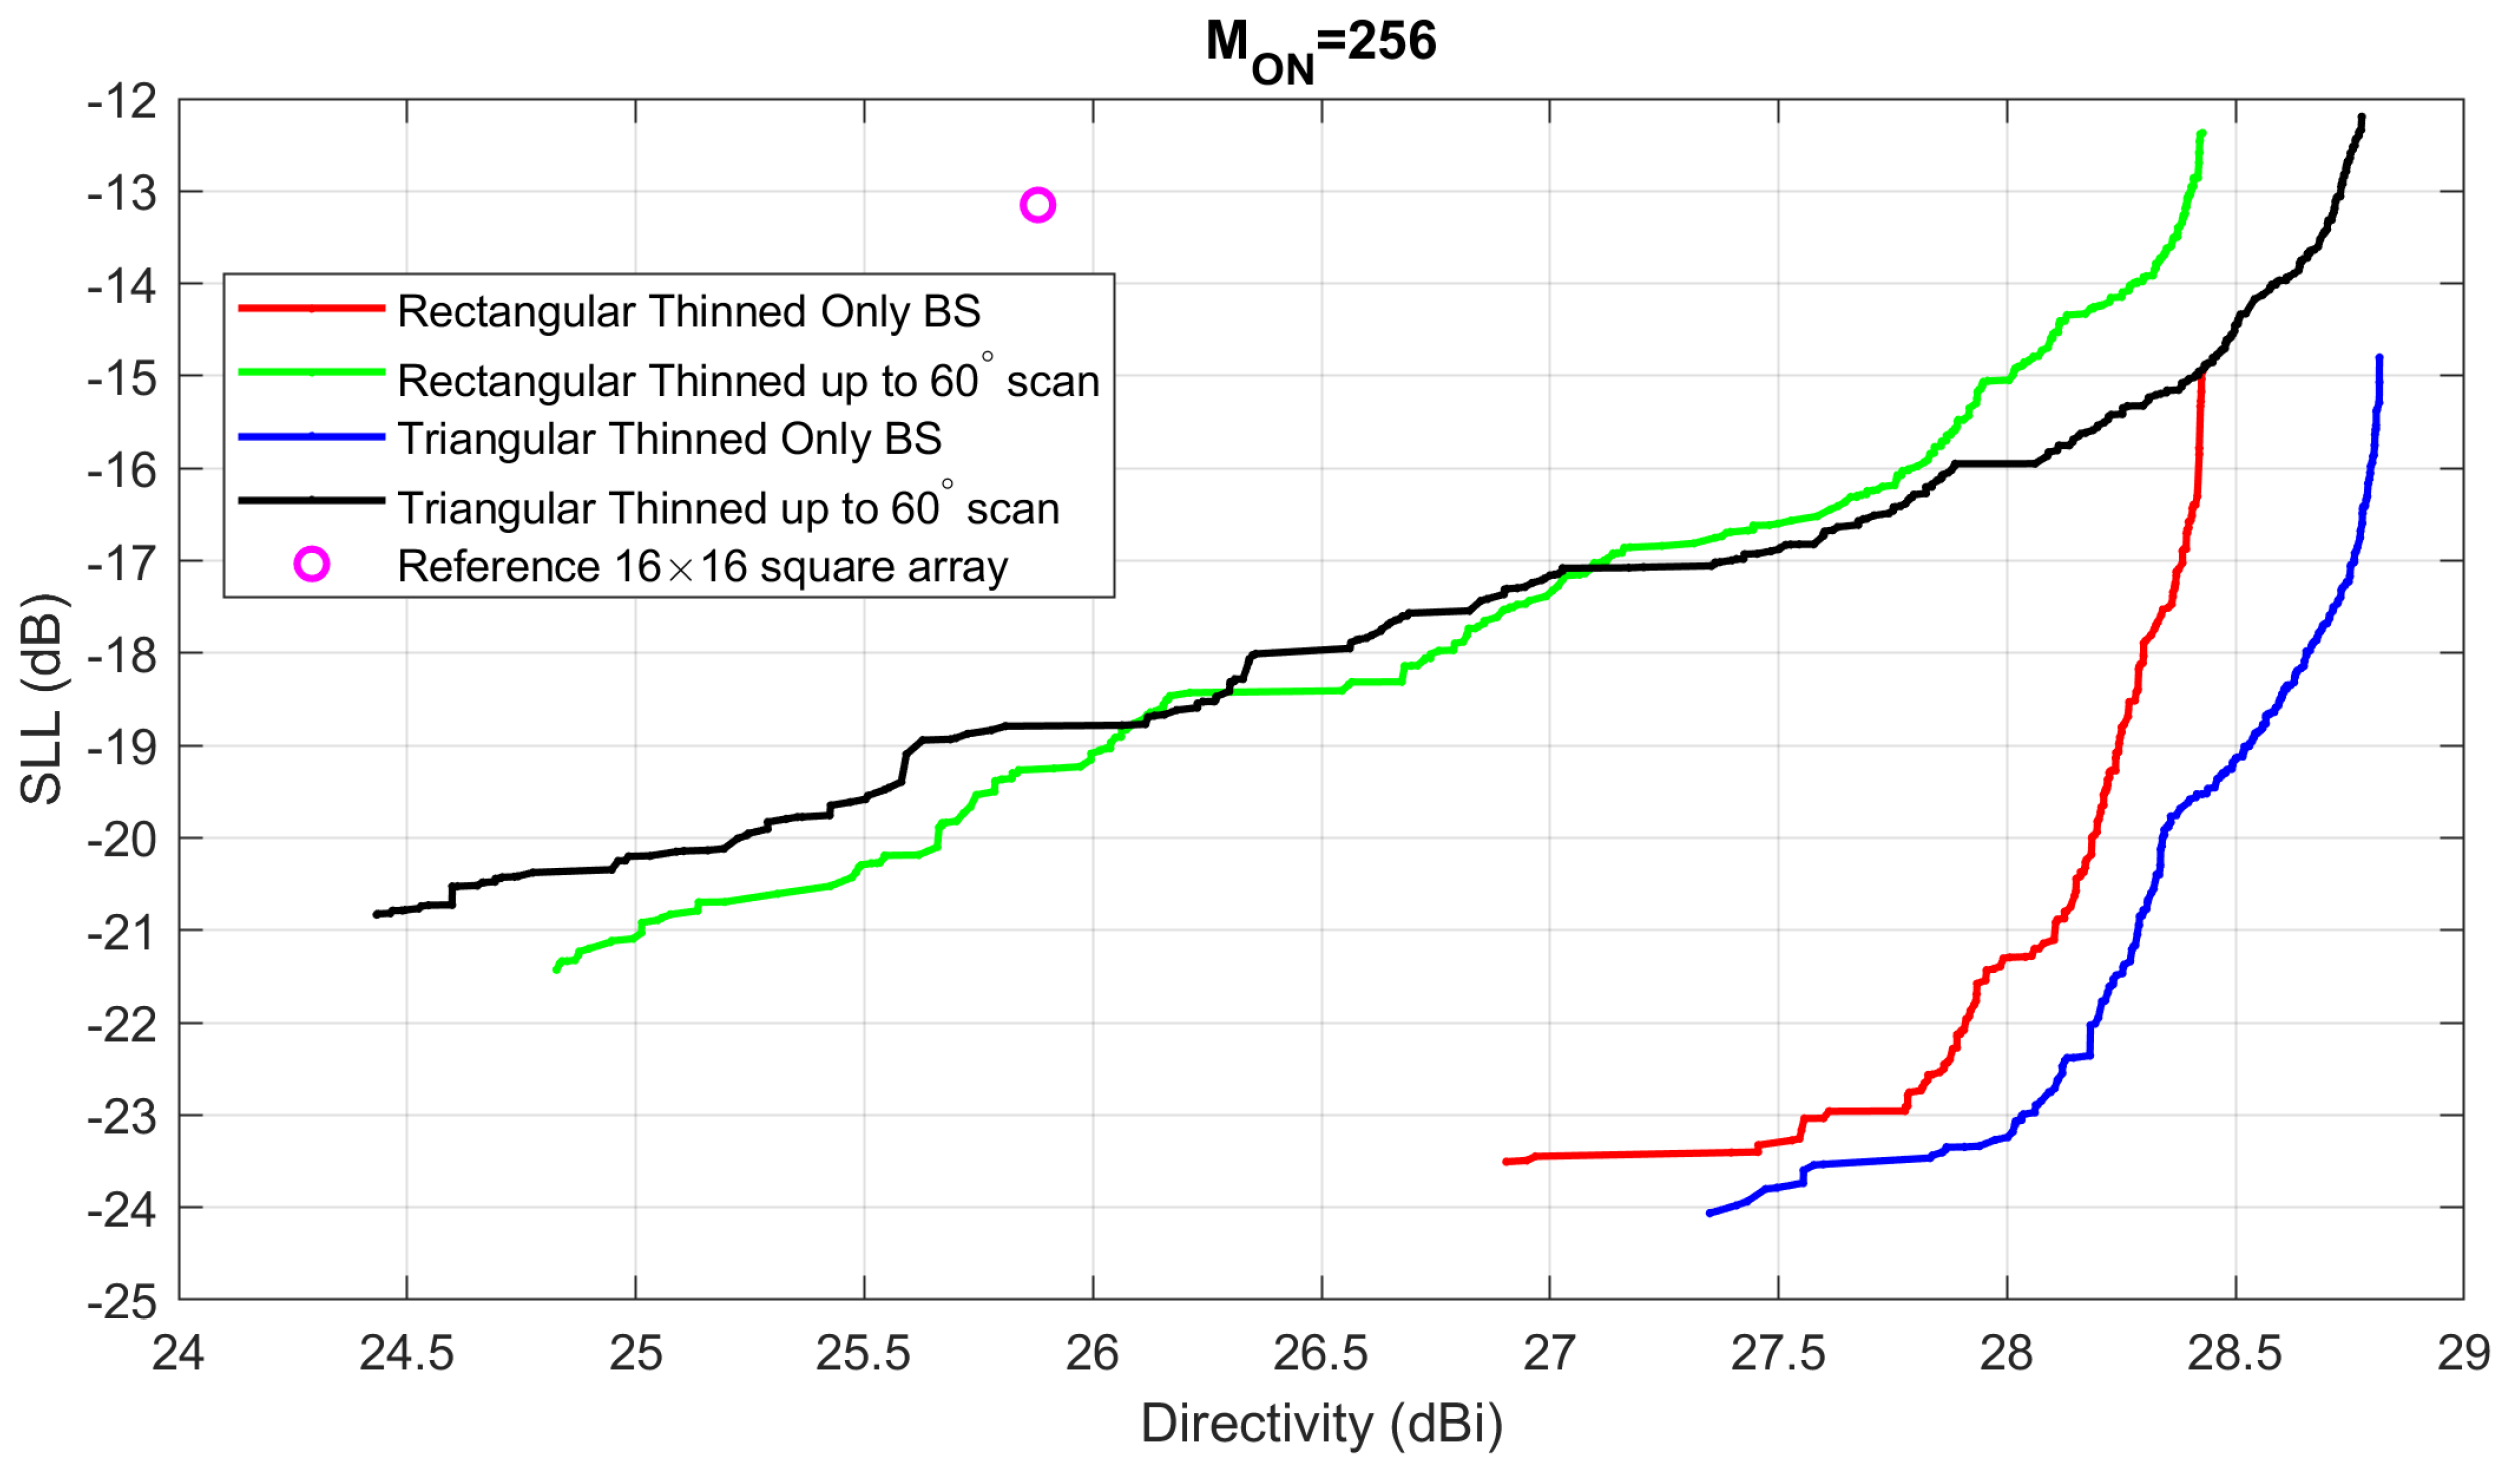
In
Figure 10, we can see the 4 Pareto Boundaries found with MOPET for the case of
, compared to the reference case, the
square planar array of
isotropic elements (the four corner elements of the regular grid have been removed to obtain exactly 128 elements). For the rectangular beam, we used a search grid of
elements, while for the triangular case, a search grid of
elements has been employed so that the overall starting layout is approximately square. Also in this case the request of a significant scanning range lowers the achievable SLL for the same level of directivity. As happened for the
elements, the triangular lattice seems to perform better than the rectangular one only in the “broadside only” cases, and in the scanning cases, the triangular lattice seems to be superior for the higher directivity layouts, while the rectangular lattice provides the lowest SLL.
From the results of
Figure 8,
Figure 9 and
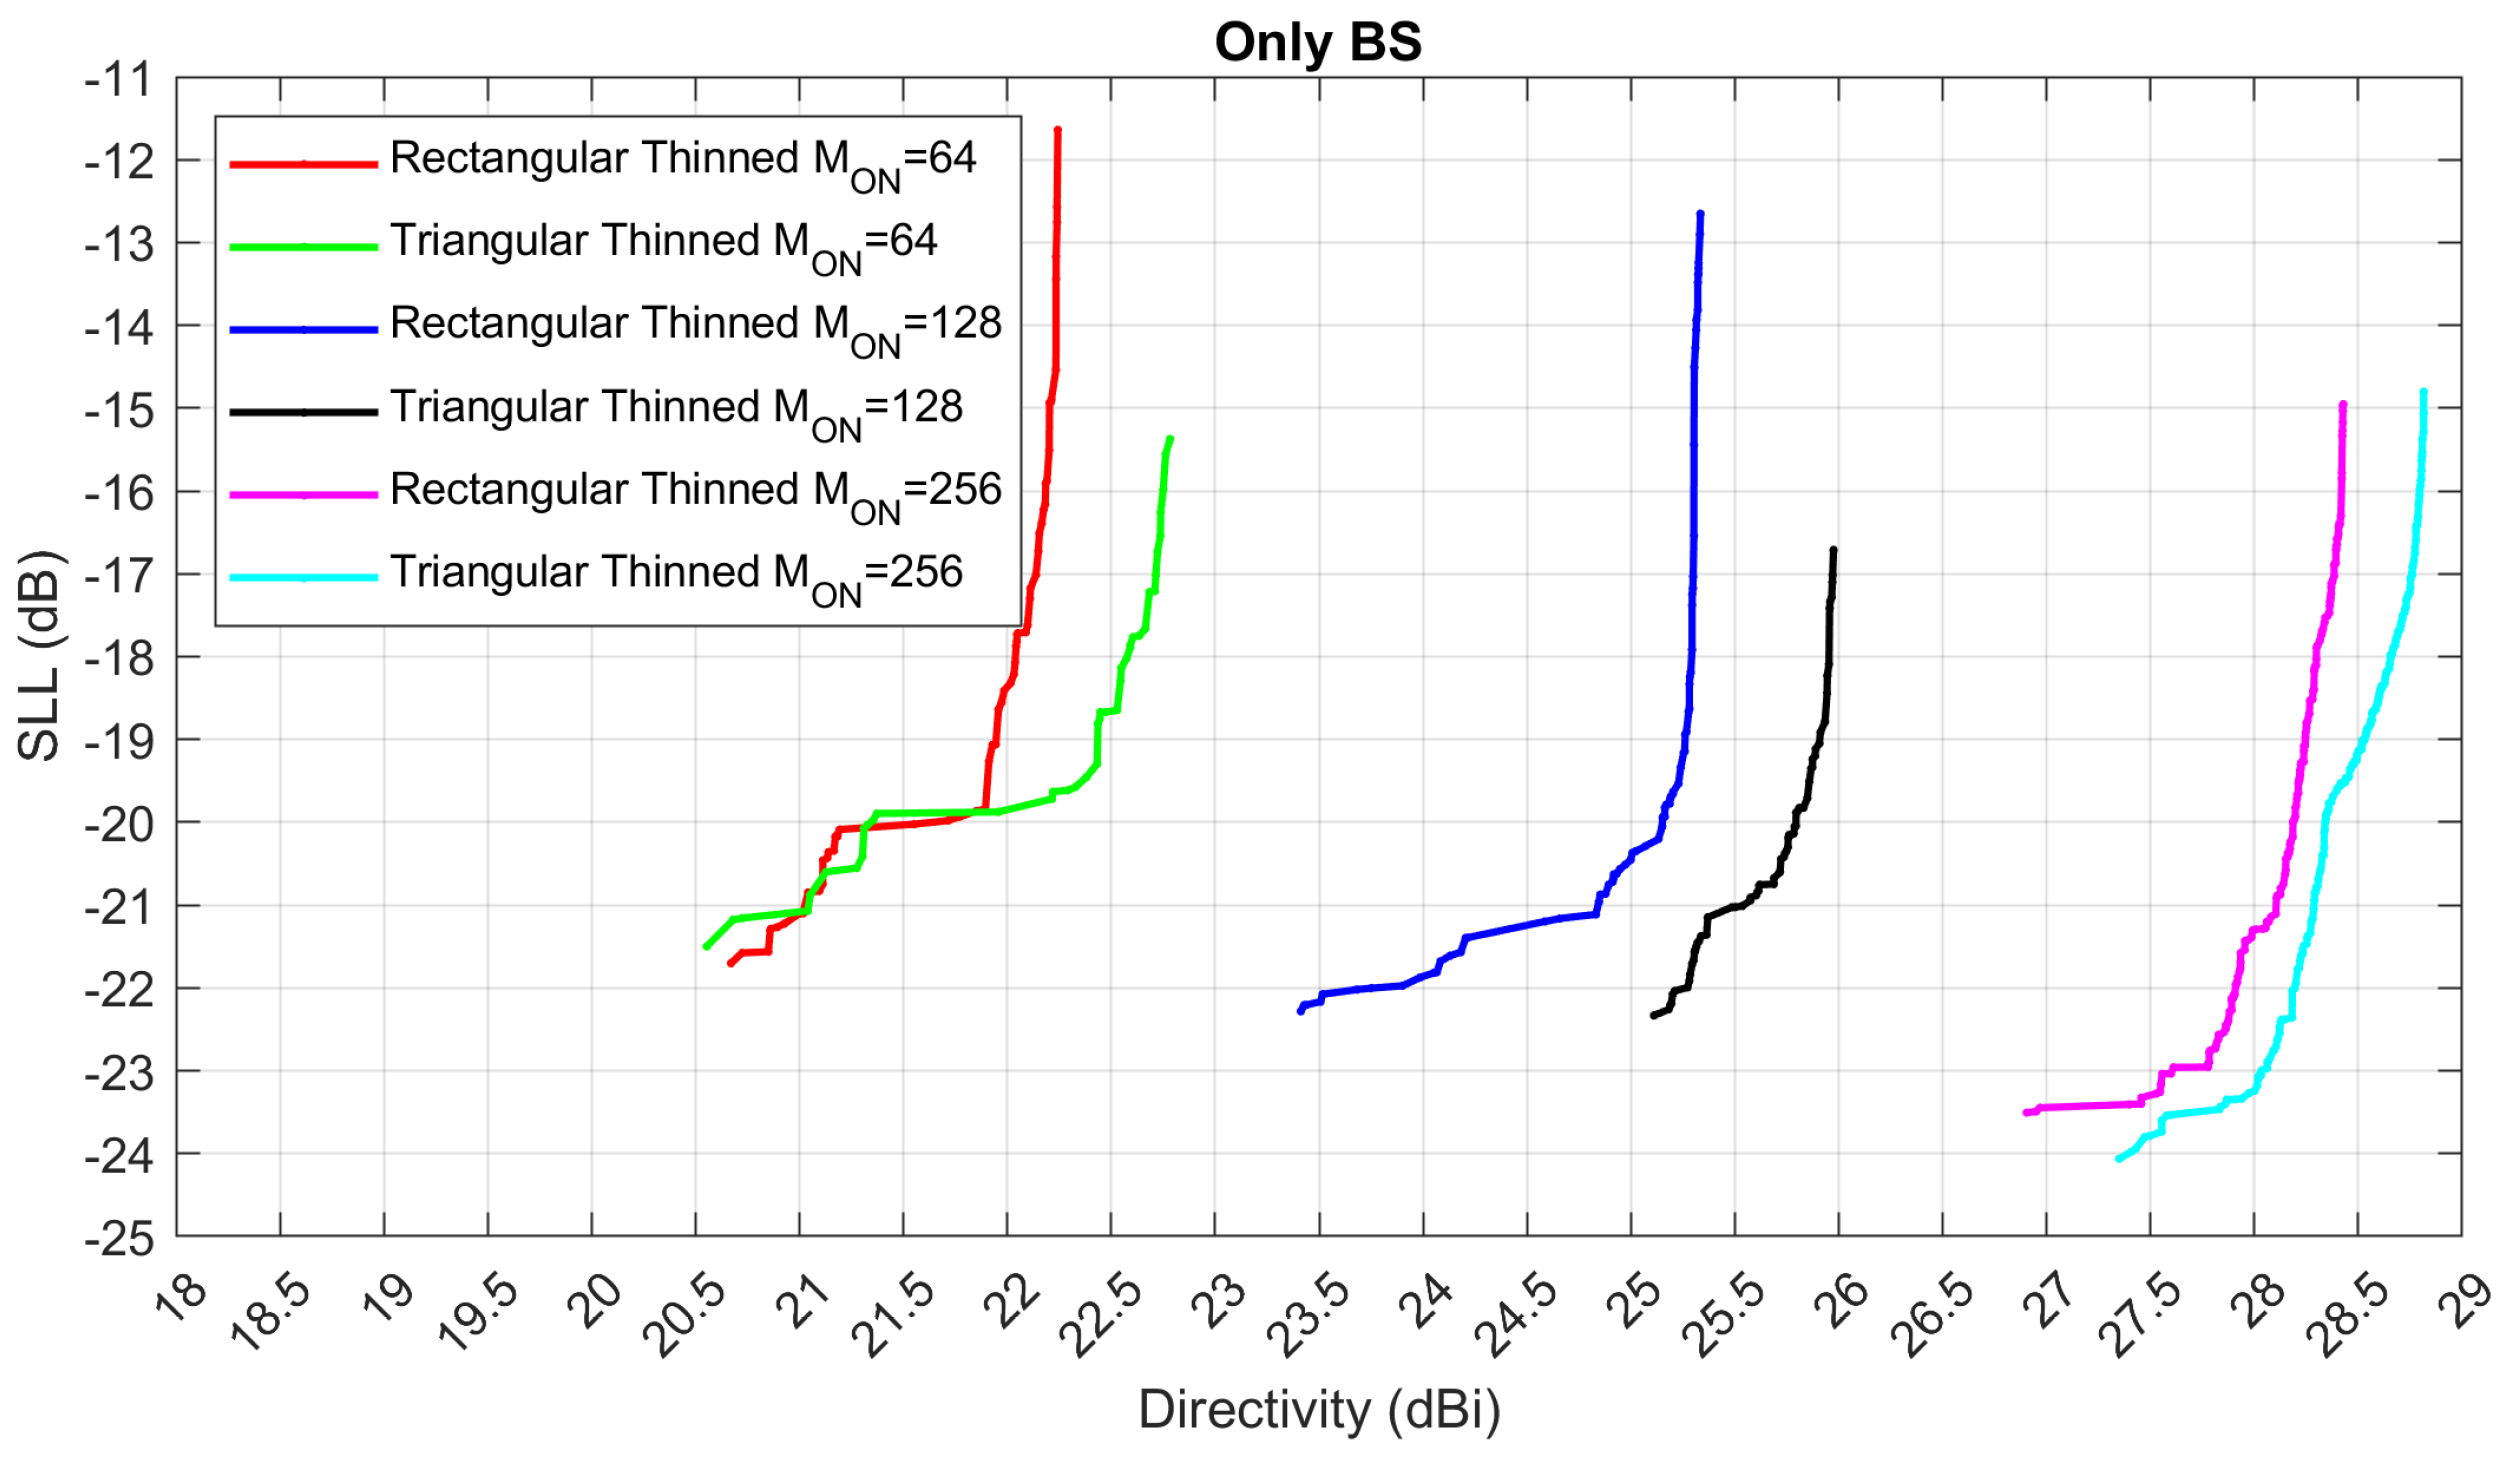
Figure 10, it seems that the advantage of the thinned arrays with respect to the reference solutions increases when considering a greater number of elements: the more the active elements, the more the thinned solution becomes advantageous. To better emphasize the overall behavior of the thinned solutions with a variable number of elements, in
Figure 11 and
Figure 12 we have compared the results achieved for the broadside only cases and large scanning cases.
4.3. Very Large Planar Array Synthesis
As a last example, we will consider the synthesis of a very large planar array of elements able to radiate a pencil beam for any scanning angle within , specifically focusing on achieving low side lobe levels. According to the results of the previous subsection, we have selected a rectangular grid of elements (), with .
In
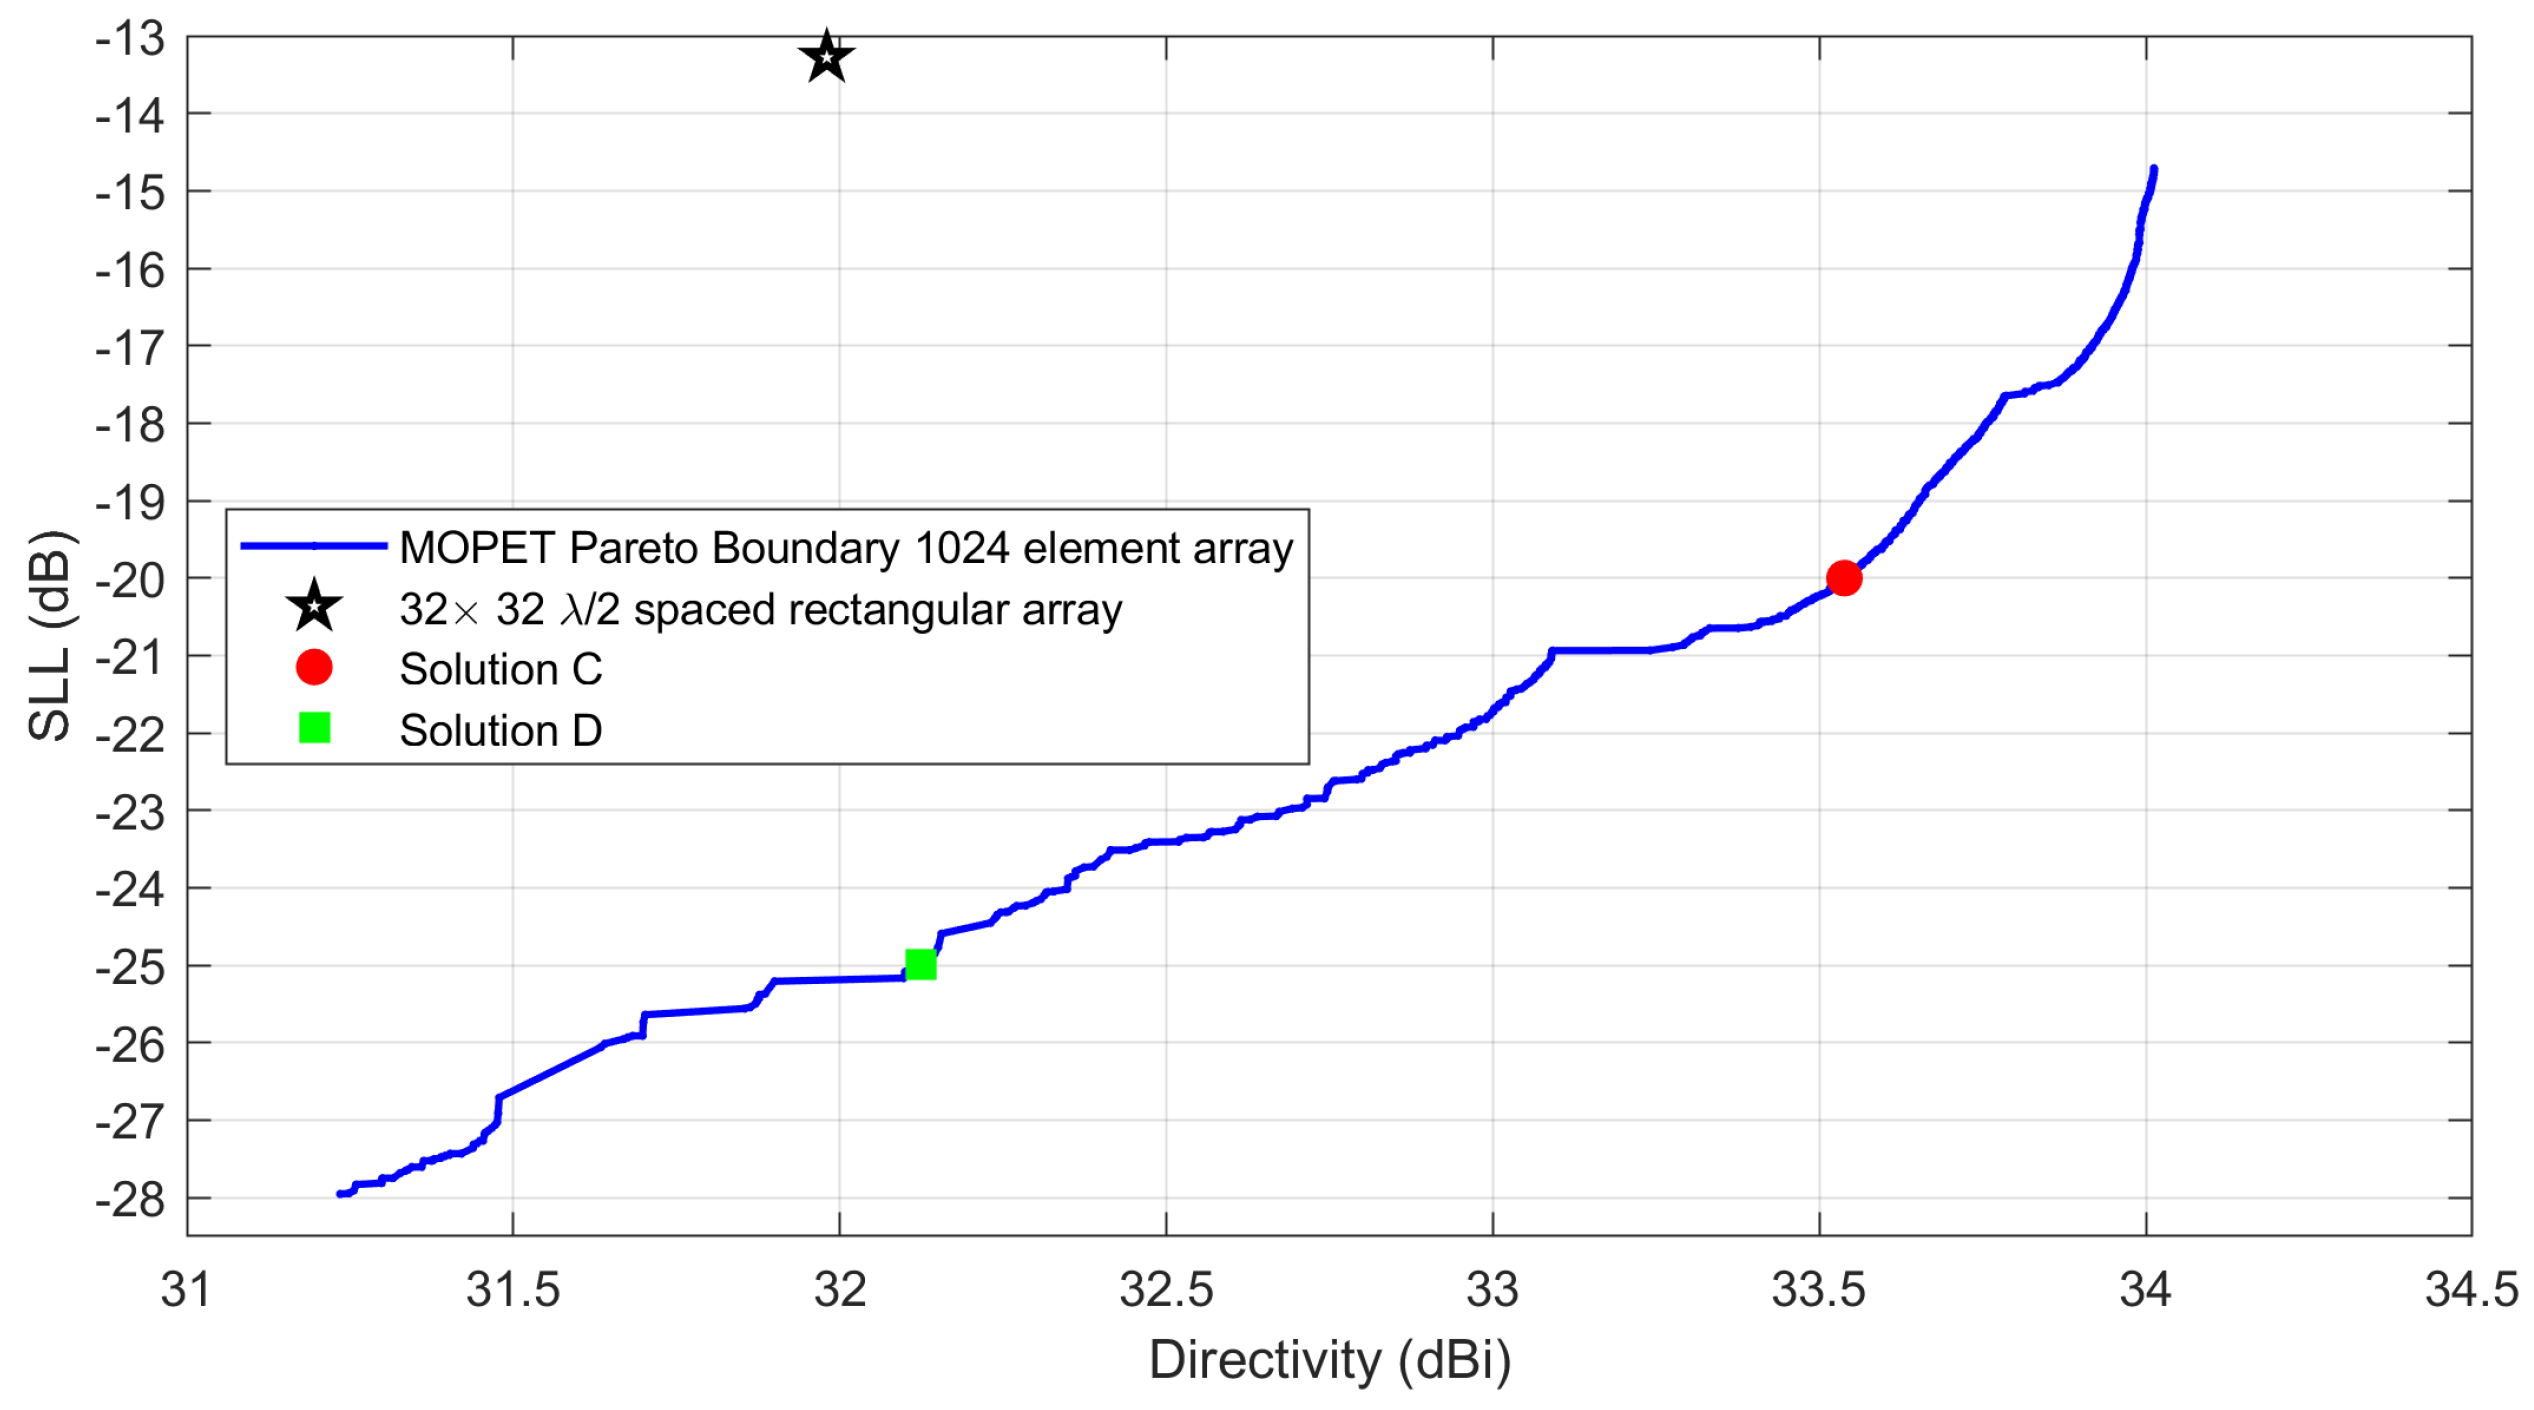
Figure 13, we can see the Pareto Boundary made of
different arrays found with MOPET for the considered case. In the plot, it is also possible to see the comparison with the “standard”
equispaced rectangular array of 32 columns and 32 rows. It is visible that a large portion of the solutions belonging to the PB dominate the reference equispaced array.
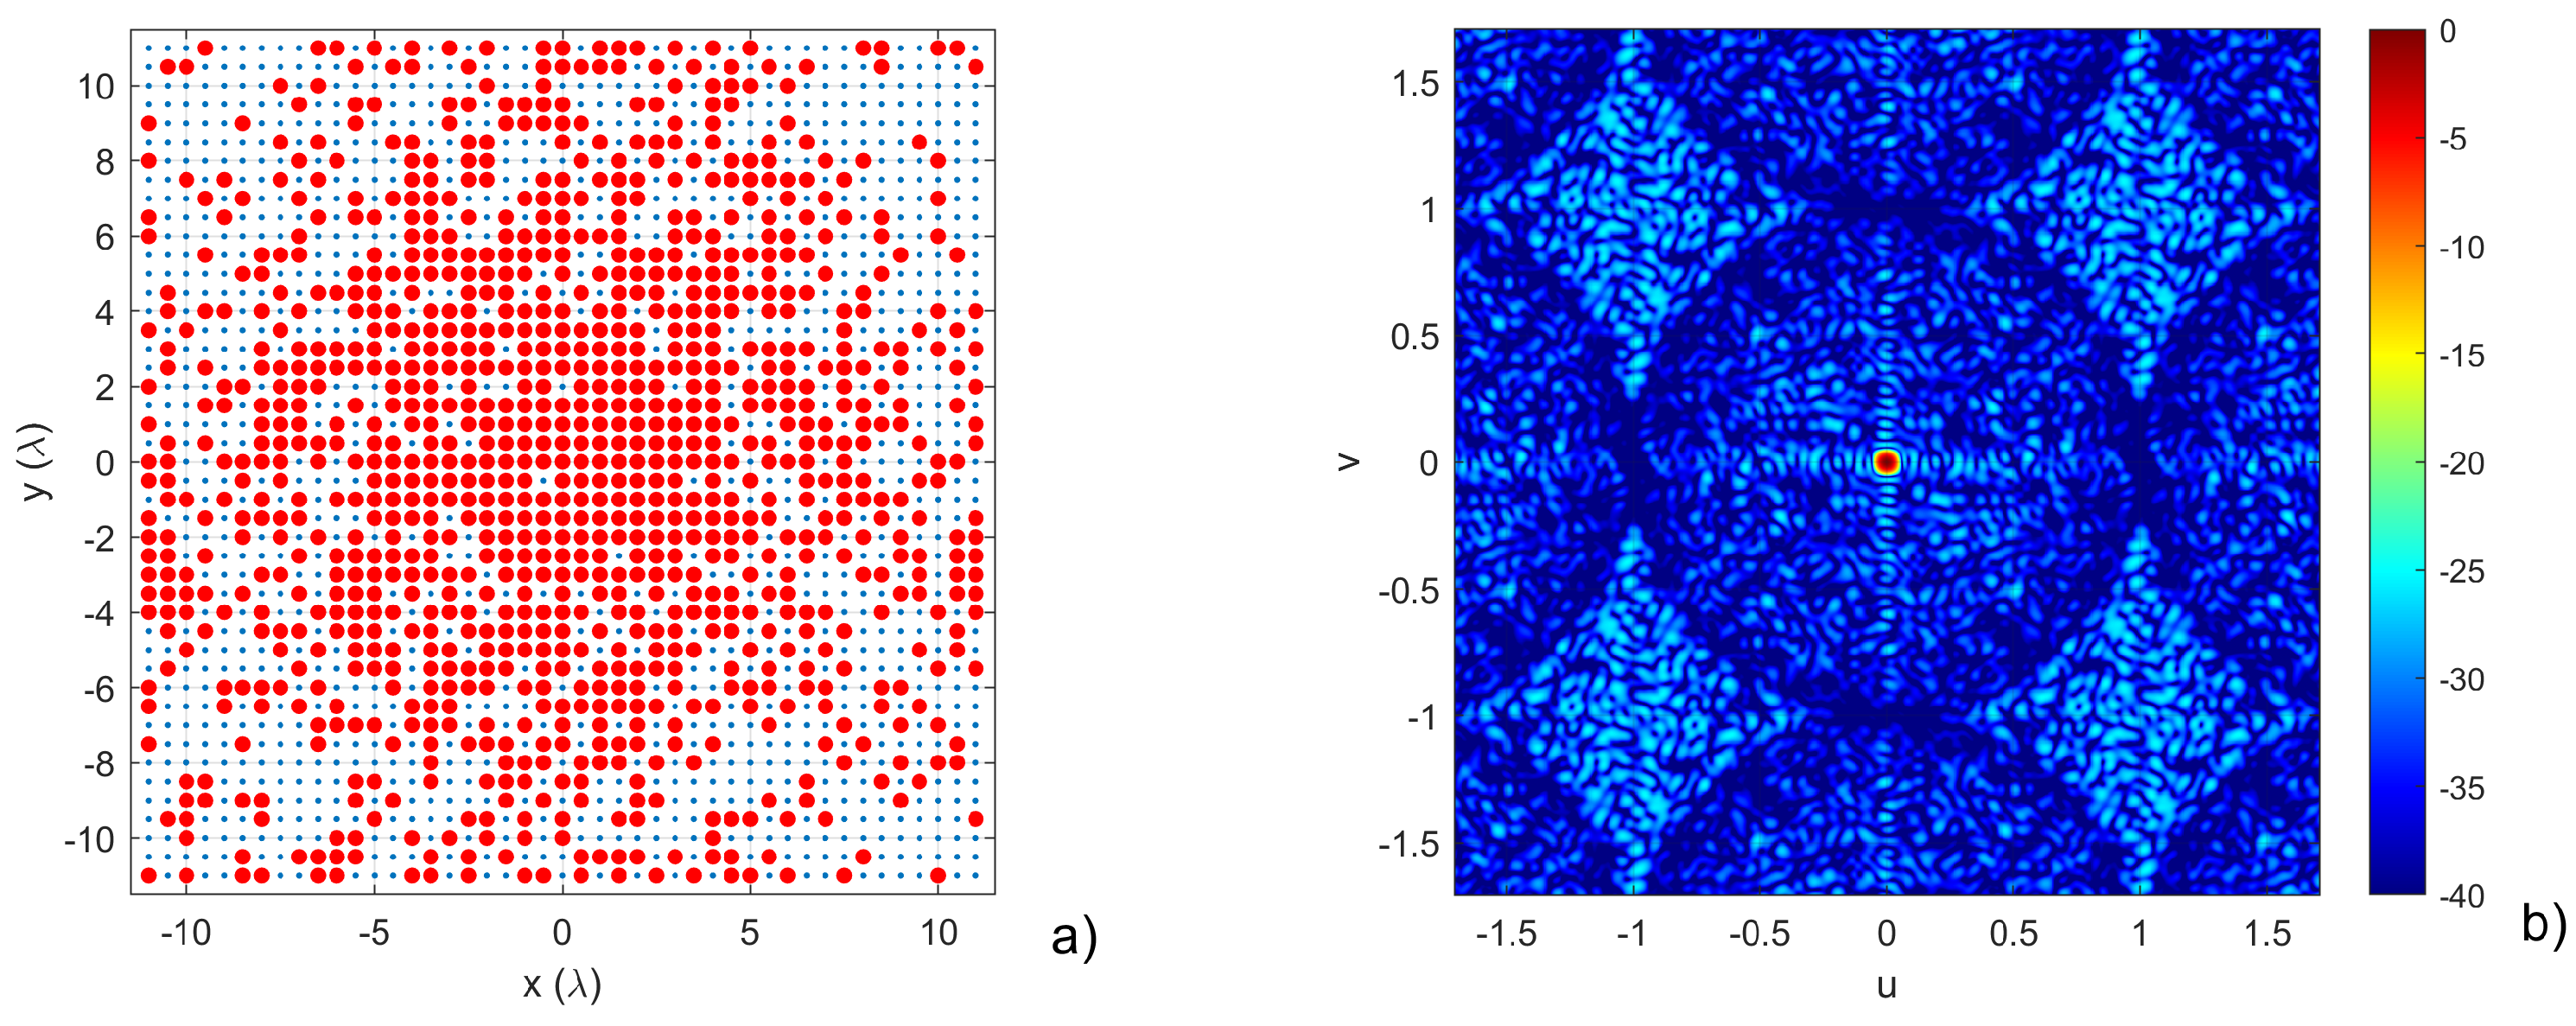
We will analyze some solutions to the identified PB to better understand this result. In
Figure 14, we can see “Solution C”. In this case, the synthesized array shows a broadside directivity of
dBi and an SLL lower than
dB for all beams considered in the scanning range. In
Figure 15, we can see “Solution D”. In this case, the synthesized array shows a broadside directivity of
dBi and an SLL lower than
dB for all beams considered in the scanning range. Both the results in
Figure 14 and
Figure 15 show that the advantage of thinned arrays with respect to equispaced arrays is increased when lots of radiators are employed.
5. Conclusions
In this paper, we have investigated the thinned antenna array synthesis problem from a multi-objective perspective. In particular, a novel multiobjective evolutionary algorithm has been developed to achieve trustable results and investigate the specific case of fixed rate thinning. This algorithm, called MOPET, allows one to obtain the Pareto boundary curves in a relatively limited time, and hundreds of different solutions - yet optimal from a Pareto perspective - can be achieved in a single run.
Using the introduced method, we first analyzed a case study, confirming the effectiveness of the MOPET in achieving good solutions; after validating the approach, several optimizations employing rectangular and triangular lattices were tested. The achieved curves can be used “as is” to compare the results obtained from other synthesis methods or to achieve a rough benchmark of other arrays, but allow us to obtain some general design rules.
First, when limited scanning is required, the triangular lattice seems to be in general superior with respect to the rectangular one; when a large scanning is required, the rectangular array is instead superior when the lowest SLL is required, while the triangular lattice allows achieving slightly larger gains.
Moreover, the results show that nonregular architectures become more and more beneficial, both in directivity and side-lobe level, when many radiators are employed. To verify this hypothesis, we have investigated the case of a very large planar array of 1024 active elements, exploiting the considerations of the previous tests.
It is worth recalling that the achieved results have been obtained for the case of isophoric arrays, so no amplitude control of the excitations has been considered. Furthermore, the thinned solutions achieved can be used as a starting point for other optimization algorithms that may move the radiators out of the positions of the lattice to achieve a better directivity and/or a lower side-lobe level.
As a future development of the present research, we are currently working on using the MOPET also for the optimization of flexible or reconfigurable arrays [
69,
70,
71]; we are also investigating the possibility to use deep-learning methods to improve the synthesis procedure and achieve quicker convergence.
Author Contributions
“Conceptualization, D.P.; methodology, D.P. and M.D.M.; software, D.P.; validation, F.S., M.L. and G.C.; formal analysis, M.D.M.; investigation, F.S. and M.L.; resources, M.D.M.; data curation, G.C.; writing—original draft preparation, D.P.; writing—review and editing, F.S. and M.D.M.; visualization, G.C.; supervision, M.D.M.; project administration, M.D.M. and F.S.; funding acquisition, M.D.M. and F.S. All authors have read and agreed to the published version of the manuscript.”
Funding
This work was partially supported by the European Union - Next Generation EU under the Italian National Recovery and Resilience Plan (NRRP), Mission 4, Component 2, Investment 1.3, CUP D43C22003080001, partnership on “Telecommunications of the Future” (PE00000001 - program “RESTART”)
Data Availability Statement
Data of all the synthesized layouts belonging to the presented Pareto boundaries will be provided on the Journal website upon publication of the paper.
Conflicts of Interest
The authors declare no conflicts of interest. The funders had no role in the design of the study; in the collection, analyses, or interpretation of data; in the writing of the manuscript; or in the decision to publish the results.
References
- Guo, Y.J.; Ziolkowski, R.W. Advanced antenna array engineering for 6G and beyond wireless communications; John Wiley & Sons, 2021.
- Xiao, Z.; Han, Z.; Nallanathan, A.; Dobre, O.A.; Clerckx, B.; Choi, J.; He, C.; Tong, W. Antenna array enabled space/air/ground communications and networking for 6G. IEEE Journal on Selected Areas in Communications 2022, 40, 2773–2804. [Google Scholar] [CrossRef]
- Pinchera, D.; Migliore, M.D.; Schettino, F. Optimizing antenna arrays for spatial multiplexing: Towards 6G systems. IEEE Access 2021, 9, 53276–53291. [Google Scholar] [CrossRef]
- Nam, J.; Ahn, J.Y.; Adhikary, A.; Caire, G. Joint spatial division and multiplexing: Realizing massive MIMO gains with limited channel state information. In Proceedings of the 2012 46th annual conference on information sciences and systems (CISS). IEEE; 2012; pp. 1–6. [Google Scholar]
- Toso, G.; Mailloux, R. Guest editorial for the special issue on innovative phased array antennas based on non-regular lattices and overlapped subarrays. IEEE Transactions on Antennas and Propagation 2014, 62, 1546–1548. [Google Scholar]
- Spence, T.G.; Werner, D.H. Design of broadband planar arrays based on the optimization of aperiodic tilings. IEEE Transactions on Antennas and Propagation 2008, 56, 76–86. [Google Scholar] [CrossRef]
- Bucci, O.M.; Pinchera, D. A Generalized Hybrid Approach for the Synthesis of Uniform Amplitude Pencil Beam Ring-Arrays. IEEE Transactions on Antennas and Propagation 2012, 60, 174–183. [Google Scholar] [CrossRef]
- Rocca, P.; D’Urso, M.; Poli, L. Advanced strategy for large antenna array design with subarray-only amplitude and phase control. IEEE Antennas and wireless propagation letters 2014, 13, 91–94. [Google Scholar] [CrossRef]
- Rocca, P.; Anselmi, N.; Polo, A.; Massa, A. Modular design of hexagonal phased arrays through diamond tiles. IEEE Transactions on Antennas and Propagation 2020, 68, 3598–3612. [Google Scholar] [CrossRef]
- Akbar, F.S.; Ligthart, L.P.; Hendrantoro, G. A toolbox of subarrays for optimizing wide-angular scanning arrays using trade-offs between scan loss and side lobe level. IEEE Access 2021, 9, 16337–16359. [Google Scholar] [CrossRef]
- Bucci, O.M.; Isernia, T.; Perna, S.; Pinchera, D. Isophoric sparse arrays ensuring global coverage in satellite communications. IEEE Transactions on Antennas and Propagation 2013, 62, 1607–1618. [Google Scholar] [CrossRef]
- Chen, K.; Chen, H.; Wang, L.; Wu, H. Modified real GA for the synthesis of sparse planar circular arrays. IEEE Antennas and Wireless Propagation Letters 2015, 15, 274–277. [Google Scholar] [CrossRef]
- Salas-Sánchez, A.; Fondevila-Gomez, J.; Rodriguez-Gonzalez, J.; Ares-Pena, F. Parametric synthesis of well-scanning isophoric pencil beams. IEEE Transactions on Antennas and Propagation 2017, 65, 1422–1427. [Google Scholar] [CrossRef]
- Pinchera, D.; Migliore, M.D.; Schettino, F.; Lucido, M.; Panariello, G. An effective compressed-sensing inspired deterministic algorithm for sparse array synthesis. IEEE Transactions on Antennas and Propagation 2017, 66, 149–159. [Google Scholar] [CrossRef]
- Yan, C.; Yang, P.; Xing, Z.; Huang, S.Y. Synthesis of planar sparse arrays with minimum spacing constraint. IEEE Antennas and Wireless Propagation Letters 2018, 17, 1095–1098. [Google Scholar] [CrossRef]
- Pinchera, D.; Migliore, M.D.; Panariello, G. Synthesis of large sparse arrays using IDEA (inflating-deflating exploration algorithm). IEEE Transactions on Antennas and Propagation 2018, 66, 4658–4668. [Google Scholar] [CrossRef]
- Wang, R.Q.; Jiao, Y.C. Synthesis of wideband rotationally symmetric sparse circular arrays with multiple constraints. IEEE Antennas and Wireless Propagation Letters 2019, 18, 821–825. [Google Scholar] [CrossRef]
- Gu, P.; Wang, G.; Fan, Z.; Chen, R. An efficient approach for the synthesis of large sparse planar array. IEEE Transactions on Antennas and Propagation 2019, 67, 7320–7330. [Google Scholar] [CrossRef]
- Pinchera, D.; Migliore, M.D.; Lucido, M.; Schettino, F.; Panariello, G. Efficient large sparse arrays synthesis by means of smooth re-weighted l1 minimization. Electronics 2019, 8, 83. [Google Scholar] [CrossRef]
- Zhao, D.; Wei, Y.; Miao, J. Adaptive gradient search for synthesis of planar array with arbitrary aperture shape. In Proceedings of the 2019 IEEE International Symposium on Phased Array System &, 2019, Technology (PAST). IEEE; pp. 1–5.
- Miao, Y.; Liu, F.; Lu, J.; Li, K. Synthesis of unequally spaced arrays with uniform excitation via iterative second-order cone programming. IEEE Transactions on Antennas and Propagation 2020, 68, 6013–6021. [Google Scholar] [CrossRef]
- Cui, C.; Li, W.T.; Ye, X.T.; Rocca, P.; Hei, Y.Q.; Shi, X.W. An effective artificial neural network-based method for linear array beampattern synthesis. IEEE Transactions on Antennas and Propagation 2021, 69, 6431–6443. [Google Scholar] [CrossRef]
- Pinchera, D.; Migliore, M.D.; Panariello, G. Isophoric inflating deflating exploration algorithm (I-IDEA) for equal-amplitude aperiodic arrays. IEEE Transactions on Antennas and Propagation 2022, 70, 10405–10416. [Google Scholar] [CrossRef]
- Miao, K.; Zhang, Y.; Wang, S.; Yao, C.; Zhao, G.; Sun, H. Synthesis of Sparse Planar Antenna Arrays Using A Matrix Constraints Method. IEEE Transactions on Antennas and Propagation 2024. [Google Scholar] [CrossRef]
- Zeng, Y.; Ding, X.; Shao, W. Perturbation Theory-Based Method for Initial Arrangement of Large-Spacing Aperiodic Scanning Arrays. IEEE Transactions on Antennas and Propagation 2024. [Google Scholar] [CrossRef]
- Buonanno, G.; Costanzo, S.; Solimene, R. Broadband statistically designed thinned-binned array antennas. IEEE Transactions on Antennas and Propagation 2023, 71, 2454–2466. [Google Scholar] [CrossRef]
- Zhang, Z.; Schalch, J.S.; Yin, Y.; Rebeiz, G.M. Thinned Randomized 27–29 GHz TX and RX Arrays With Low Sidelobe Levels for Radars and 5G Communications. IEEE Transactions on Microwave Theory and Techniques 2023. [Google Scholar] [CrossRef]
- Numazaki, T.; Mano, S.; Katagi, T.; Mizusawa, M. An improved thinning method for density tapering of planar array antennas. IEEE transactions on antennas and propagation 1987, 35, 1066–1070. [Google Scholar] [CrossRef]
- Leeper, D.G. Isophoric arrays-massively thinned phased arrays with well-controlled sidelobes. IEEE Transactions on Antennas and Propagation 1999, 47, 1825–1835. [Google Scholar] [CrossRef]
- Oliveri, G.; Manica, L.; Massa, A. ADS-based guidelines for thinned planar arrays. IEEE Transactions on Antennas and Propagation 2010, 58, 1935–1948. [Google Scholar] [CrossRef]
- Oliveri, G.; Gottardi, G.; Hannan, M.A.; Anselmi, N.; Poli, L. Autocorrelation-driven synthesis of antenna arrays—The case of DS-based planar isophoric thinned arrays. IEEE Transactions on Antennas and Propagation 2019, 68, 2895–2910. [Google Scholar] [CrossRef]
- Chang, B.K.; Ma, X.; Sequeira, H. Minimax-maxmini algorithm: a new approach to optimization of the thinned antenna arrays. In Proceedings of the Proceedings of IEEE Antennas and Propagation Society International Symposium and URSI National Radio Science Meeting.; pp. 19941514–517.
- Keizer, W.P. Amplitude-only low sidelobe synthesis for large thinned circular array antennas. IEEE Transactions on Antennas and Propagation 2011, 60, 1157–1161. [Google Scholar] [CrossRef]
- Liu, Y.; Zheng, J.; Li, M.; Luo, Q.; Rui, Y.; Guo, Y.J. Synthesizing beam-scannable thinned massive antenna array utilizing modified iterative FFT for millimeter-wave communication. IEEE Antennas and Wireless Propagation Letters 2020, 19, 1983–1987. [Google Scholar] [CrossRef]
- Chen, J.; Yin, Y. Novel thinning computation approach for phased only rectangular array pattern synthesis. IEICE Electronics Express 2024, 21, 20240157–20240157. [Google Scholar] [CrossRef]
- Tumolo, R.M.; D’Urso, M.; Prisco, G.; Buonanno, A. Fast synthesis of planar, maximally thinned arrays. Progress In Electromagnetics Research Letters 2017, 68, 47–52. [Google Scholar] [CrossRef]
- El-Khamy, S.E.; Eltrass, A.S.; El-Sayed, H.F. Adaptive beamforming synthesis for thinned fractal antenna arrays. In Proceedings of the 2017 XXXIInd general assembly and scientific symposium of the international union of radio science (URSI GASS). IEEE; 2017; pp. 1–4. [Google Scholar]
- Rocca, P.; Anselmi, N.; Oliveri, G.; Polo, A.; Massa, A. Antenna array thinning through quantum Fourier transform. IEEE Access 2021, 9, 124313–124323. [Google Scholar] [CrossRef]
- Bae, J.H.; Kim, K.T.; Pyo, C.S.; Chae, J.S. Design of Scannable Non-uniform Planar Array Structure for Maximum Side-Lobe Reduction. ETRI journal 2004, 26, 53–56. [Google Scholar] [CrossRef]
- Donelli, M.; Caorsi, S.; De Natale, F.; Franceschini, D.; Massa, A. A versatile enhanced genetic algorithm for planar array design. Journal of Electromagnetic Waves and Applications 2004, 18, 1533–1548. [Google Scholar] [CrossRef]
- Spence, T.; Werner, D. Thinning of aperiodic antenna arrays for low side-lobe levels and broadband operation using genetic algorithms. In Proceedings of the 2006 IEEE Antennas and Propagation Society International Symposium. IEEE; 2006; pp. 2059–2062. [Google Scholar]
- Jain, R.; Mani, G. Solving “Antenna Array Thinning Problem” Using Genetic Algorithm. Applied Computational Intelligence and Soft Computing 2012, 2012, 946398. [Google Scholar] [CrossRef]
- Gangwar, V.; Singh, A.; Thomas, E.; Singh, S. Side lobe level suppression in a thinned linear antenna array using particle swarm optimization. In Proceedings of the 2015 International Conference on Applied and Theoretical Computing and Communication Technology (iCATccT). IEEE; 2015; pp. 787–790. [Google Scholar]
- Cheng, Y.F.; Shao, W.; Zhang, S.J.; Li, Y.P. An improved multi-objective genetic algorithm for large planar array thinning. IEEE Transactions on Magnetics 2015, 52, 1–4. [Google Scholar] [CrossRef]
- Ortiz, M.; Uddin, M.N.; Guerra, M.R.; Alwan, E.A. Enhancing Gain Through Optimal Antenna Element Distribution in a Thinned Array Configuration. IEEE Open Journal of Antennas and Propagation 2023, 4, 1176–1186. [Google Scholar] [CrossRef]
- Gayatri, A.; Kumar, M.S.; Prasad, A. Multiobjective Optimization Using Modified Binary PSO for Reduction of Sidelobe Level of the Thinned Array Antenna. Revista Geintec-Gestao Inovacao E Tecnologias 2021, 11, 2715–2725. [Google Scholar] [CrossRef]
- Li, P.F.; Qu, S.W.; Yang, S.; Hu, J. Low-scattering-cross section thinned phased array antenna based on active cancellation technique. IEEE Transactions on Antennas and Propagation 2022, 70, 5481–5490. [Google Scholar] [CrossRef]
- Sun, Y.; Sun, J.; Ye, L. Synthesis of thinned planar concentric circular antenna arrays using a modified artificial bee colony algorithm. International Journal of Antennas and Propagation 2023, 2023, 7735267. [Google Scholar] [CrossRef]
- Epcacan, E.; Ciloglu, T. A hybrid nonlinear method for array thinning. IEEE Transactions on Antennas and Propagation 2018, 66, 2318–2325. [Google Scholar] [CrossRef]
- Wang, L.; Wang, X.K.; Wang, G.; Jia, J.K. A two-step method for the low-sidelobe synthesis of uniform amplitude planar sparse arrays. Progress In Electromagnetics Research M 2019, 86, 153–162. [Google Scholar] [CrossRef]
- Qi, Z.; Bai, Y.; Zhang, X. Synthesis of linear and planar arrays via sequential convex optimizations. IEEE Access 2019, 8, 6717–6728. [Google Scholar] [CrossRef]
- Abdulqader, A.J.; Mahmood, A.N.; Mohammed Ali, Y.E. A Multi-Objective Array Pattern Optimization via Thinning Approach. Progress in Electromagnetics Research C 2022, 127. [Google Scholar] [CrossRef]
- Lecci, M.; Testolina, P.; Rebato, M.; Testolin, A.; Zorzi, M. Machine learning-aided design of thinned antenna arrays for optimized network level performance. In Proceedings of the 2020 14th European Conference on Antennas and Propagation (EuCAP). IEEE; 2020; pp. 1–5. [Google Scholar]
- Jin, N.; Rahmat-Samii, Y. Advances in particle swarm optimization for antenna designs: Real-number, binary, single-objective and multiobjective implementations. IEEE transactions on antennas and propagation 2007, 55, 556–567. [Google Scholar] [CrossRef]
- Petko, J.S.; Werner, D.H. Pareto optimization of thinned planar arrays with elliptical mainbeams and low sidelobe levels. IEEE Transactions on Antennas and Propagation 2011, 59, 1748–1751. [Google Scholar] [CrossRef]
- Pappula, L.; Ghosh, D. Sparse antenna array synthesis using multi-objective optimization. In Proceedings of the 2013 IEEE Applied Electromagnetics Conference (AEMC). IEEE; 2013; pp. 1–2. [Google Scholar]
- Pappula, L.; Ghosh, D. Synthesis of thinned planar antenna array using multiobjective normal mutated binary cat swarm optimization. Applied Computational Intelligence and Soft Computing 2016, 2016, 4102156. [Google Scholar] [CrossRef]
- Vankayalapati, S.; Pappula, L. Machine Learning Assisted Multi-Objective Planar Antenna Array Synthesis for Interference Mitigation in Next Generation Wireless Systems. Progress in Electromagnetics Research M 2023, 119. [Google Scholar] [CrossRef]
- Hansen, R.C. Phased array antennas; John Wiley & Sons, 2009.
- Mailloux, R.J. Phased array antenna handbook; Artech house, 2017.
- Marler, R.T.; Arora, J.S. The weighted sum method for multi-objective optimization: new insights. Structural and multidisciplinary optimization 2010, 41, 853–862. [Google Scholar] [CrossRef]
- Pinchera, D.; Perna, S.; Migliore, M.D. A lexicographic approach for multi-objective optimization in antenna array design. Progress In Electromagnetics Research M 2017, 59, 85–102. [Google Scholar] [CrossRef]
- Lai, L.; Fiaschi, L.; Cococcioni, M. Solving mixed Pareto-Lexicographic multi-objective optimization problems: The case of priority chains. Swarm and Evolutionary Computation 2020, 55, 100687. [Google Scholar] [CrossRef]
- Liang, J.; Ban, X.; Yu, K.; Qu, B.; Qiao, K.; Yue, C.; Chen, K.; Tan, K.C. A survey on evolutionary constrained multiobjective optimization. IEEE Transactions on Evolutionary Computation 2022, 27, 201–221. [Google Scholar] [CrossRef]
- Zitzler, E.; Thiele, L. Multiobjective evolutionary algorithms: a comparative case study and the strength Pareto approach. IEEE transactions on Evolutionary Computation 1999, 3, 257–271. [Google Scholar] [CrossRef]
- Deb, K.; Pratap, A.; Agarwal, S.; Meyarivan, T. A fast and elitist multiobjective genetic algorithm: NSGA-II. IEEE transactions on evolutionary computation 2002, 6, 182–197. [Google Scholar] [CrossRef]
- Panduro, M.A.; Covarrubias, D.H.; Brizuela, C.A.; Marante, F.R. A multi-objective approach in the linear antenna array design. AEU-International Journal of Electronics and Communications 2005, 59, 205–212. [Google Scholar] [CrossRef]
- Pinchera, D. On the trade-off between the main parameters of planar antenna arrays. Electronics 2020, 9, 739. [Google Scholar] [CrossRef]
- Bai, Y.Y.; Xiao, S.; Tang, M.C.; Ding, Z.F.; Wang, B.Z. Wide-angle scanning phased array with pattern reconfigurable elements. IEEE Transactions on Antennas and Propagation 2011, 59, 4071–4076. [Google Scholar]
- Pinchera, D.; Lucido, M.; Chirico, G.; Schettino, F.; Migliore, M.D. Controllable local propagation environment to maximize the multiplexing capability of massive MIMO systems. Electronics 2023, 12, 2022. [Google Scholar] [CrossRef]
- Meng, C.; Zhang, Y.; Temiz, M.; El-Makadema, A. A Multiobjective Array Beamforming Method for Arrays of Flexible Shape. Electronics 2024, 13, 752. [Google Scholar] [CrossRef]
| 1 |
Arrays in which the elements belong to a regular grid, and the excitation of the element of the grid . |
Figure 1.
Scheme of some popular antenna array architectures. a) Clustered/subarray architecture, where groups (marked in yellow) of radiators (marked in red) are fed by a single T/R module. b) Sparse architectures, where the position of the radiators on the plane is freely selectable. c) Thinned architectures, where the position of the radiators is selected starting from a regular grid.
Figure 2.
Scheme of the planar antenna array on the plane and of the coordinate systems employed. Ellipses with different colors represent the radiators according to their activation.
Figure 2.
Scheme of the planar antenna array on the plane and of the coordinate systems employed. Ellipses with different colors represent the radiators according to their activation.
Figure 3.
Graphical representation of the grid centering. The group of “1” of the binary grid representing the turned-on elements is shifted in order to have such elements centered on the overall grid.
Figure 3.
Graphical representation of the grid centering. The group of “1” of the binary grid representing the turned-on elements is shifted in order to have such elements centered on the overall grid.
Figure 4.
Graphical description of the Thinning-Rate-Preserving Crossover: a “XOR” operation is performed between two binary sequences (A,B) to identify their common bits; a temporary trinary vector T is then generated, as well a random binary vector D with the same number of ones and zeros with the same number of “X” of T. The crossover vector C is obtained from T substituting the “X” with the elements of D.
Figure 5.
Pareto boundary found with MOPET for the case of a rectangular antenna with 128 elements. Some reference solutions are compared to the Pareto curve.
Figure 5.
Pareto boundary found with MOPET for the case of a rectangular antenna with 128 elements. Some reference solutions are compared to the Pareto curve.
Figure 6.
Analysis of Solution A from
Figure 5. a) antenna layout, with the red circles representing the 128 used elements. b) normalized radiation pattern represented in the
plane.
Figure 6.
Analysis of Solution A from
Figure 5. a) antenna layout, with the red circles representing the 128 used elements. b) normalized radiation pattern represented in the
plane.
Figure 7.
Analysis of Solution B from
Figure 5. a) antenna layout, with the red circles representing the 128 used elements. b) normalized radiation pattern represented in the
plane.
Figure 7.
Analysis of Solution B from
Figure 5. a) antenna layout, with the red circles representing the 128 used elements. b) normalized radiation pattern represented in the
plane.
Figure 8.
Pareto boundaries for the square case, compared to the reference solution.
Figure 8.
Pareto boundaries for the square case, compared to the reference solution.
Figure 9.
Pareto boundaries for the square case, compared to the reference solution.
Figure 9.
Pareto boundaries for the square case, compared to the reference solution.
Figure 10.
Pareto boundaries for the square case, compared to the reference solution.
Figure 10.
Pareto boundaries for the square case, compared to the reference solution.
Figure 11.
Pareto boundary curves for the broadside beam only cases.
Figure 11.
Pareto boundary curves for the broadside beam only cases.
Figure 12.
Pareto boundary curves for the large scanning cases.
Figure 12.
Pareto boundary curves for the large scanning cases.
Figure 13.
Pareto boundary found with MOPET for the case of a rectangular antenna with 1024 elements. Some reference solutions are compared to the Pareto curve.
Figure 13.
Pareto boundary found with MOPET for the case of a rectangular antenna with 1024 elements. Some reference solutions are compared to the Pareto curve.
Figure 14.
Analysis of Solution C from
Figure 13. a) antenna layout, with the red circles representing the 1024 used elements. b) normalized radiation pattern represented in the
plane.
Figure 14.
Analysis of Solution C from
Figure 13. a) antenna layout, with the red circles representing the 1024 used elements. b) normalized radiation pattern represented in the
plane.
Figure 15.
Analysis of Solution D from
Figure 13. a) antenna layout, with the red circles representing the 1024 used elements. b) normalized radiation pattern represented in the
plane.
Figure 15.
Analysis of Solution D from
Figure 13. a) antenna layout, with the red circles representing the 1024 used elements. b) normalized radiation pattern represented in the
plane.
|
Disclaimer/Publisher’s Note: The statements, opinions and data contained in all publications are solely those of the individual author(s) and contributor(s) and not of MDPI and/or the editor(s). MDPI and/or the editor(s) disclaim responsibility for any injury to people or property resulting from any ideas, methods, instructions or products referred to in the content. |
© 2024 by the authors. Licensee MDPI, Basel, Switzerland. This article is an open access article distributed under the terms and conditions of the Creative Commons Attribution (CC BY) license (http://creativecommons.org/licenses/by/4.0/).


