Preprint
Article

Three-Dimensional Pulsating Flow Simulation in a Multi-Point Gas Admission Valve for Large Bore CNG Engines

Altmetrics

Downloads

44

Views

16

Comments

0

A peer-reviewed article of this preprint also exists.

This version is not peer-reviewed

Submitted:

29 October 2024

Posted:

30 October 2024

You are already at the latest version

Alerts
Abstract
This study examines the dynamic fluid behavior of a PWM-controlled Solenoid-Operated Gas Admission Valve (SOGAV) for large-bore CNG engines using 3D CFD simulations with dynam-ic mesh techniques. The research focuses on the influence of orifice geometry variations in the multi-hole restrictor and pressure differentials between the inlet and outlet on flow stability, turbulence, and valve performance. Results demonstrate that multi-hole restrictors with differ-ent-sized orifices improve flow uniformity and reduce turbulence, thereby mitigating flow re-sistance. Transient simulations further reveal standing wave formation and pressure wave in-terference, emphasizing that steady-state models cannot capture critical transient phenomena, such as accelerated and decelerated jet-like flows and flow separation. These findings provide key insights into SOGAV optimization, contributing to enhanced fuel efficiency and engine re-sponsiveness, meeting the performance requirements of modern gas engines.
Keywords: 
Subject: Engineering  -   Automotive Engineering

1. Introduction

Recent developments in gas admission valves for large LNG vessels, such as the Woodward SOGAV (Solenoid Operated Gas Admission Valve) series [1,2,3] and Bosch's LEGV [4,5], offer advanced capabilities specifically designed to meet the rigorous requirements of marine engines. These valves, typically used in four-stroke, turbocharged, natural gas, or dual-fuel engines, enable highly accurate regulation of gaseous fuel injection into the engine's intake manifold. Engineered to enhance operational safety and fuel efficiency of LNG-powered vessels, they represent the forefront of innovations in marine fuel delivery systems.
The PWM-controlled, solenoid-driven actuation of these valves allows for rapid response times, facilitating real-time control of gas admission into the engine. Notably, only a single valve per engine cylinder is required, which simplifies system design and integration, improving both reliability and maintainability. Additionally, leading manufacturers are advancing these valve technologies to ensure compatibility with emerging e-fuels such as ammonia and hydrogen, aligning with the maritime sector's goals to reduce carbon emissions by 2030 and beyond [4].
The Solenoid-Operated Gas Admission Valve (SOGAV) is an electrically actuated valve that controls the flow of gas into the engine's combustion chamber. This component is critical in gas-fueled internal combustion engines, where precise control of fuel delivery is essential. The PWM-controlled SOGAV operates under the supervision of the Engine Control Unit (ECU), which sends electrical signals to the solenoid actuator to modulate the valve's operation. The ECU adjusts the timing and duration of the valve's opening based on engine load, speed, and other operating parameters to ensure optimal fuel delivery. Once the required amount of gas has been admitted, the valve closes promptly, preventing any excess gas flow into the combustion chamber.
However, the use of PWM-controlled SOGAVs introduces nonlinearity and discontinuity in the flow due to the on/off nature of the PWM driving signal. The rapid opening and closing of the valve multiple times per engine cycle, combined with precise gas metering, significantly impacts combustion efficiency, emissions control, and power output. Electromagnetic actuators, known for their millisecond-range response times, are well-suited for high-speed engine operations. Recent advancements in magnetic circuit optimization of the solenoid have further improved valve dynamics, achieving an opening time of approximately 1 millisecond. This enhancement enables more precise gas admission control, improving engine responsiveness during load transitions [5].
Figure 1 provides a cross-sectional view of the GOGAV 105, developed by Woodward, illustrating the timing of valve opening and closing. The arrows in the diagram indicate the direction of gas flow. This valve plays a critical role in gas admission systems for turbocharged, four-stroke, natural gas, or dual-fuel engines. One notable feature highlighted in the diagram is the use of a multi-hole restrictor (moving plate), which modulates gas flow based on the engine’s operating conditions [6].
The moving plate functions as a flow control device, utilizing multiple small holes to regulate fluid flow within the system. By forcing the gas through several smaller openings, this design increases resistance, helping to reduce flow rates and manage pressure drops in a controlled manner. A significant advantage of the multi-perforated plate is its ability to accurately and uniformly transport high volumes of gas, even at high on/off frequencies, without requiring large valve lifts. Additionally, the small holes suppress aerodynamic noise and vibrations caused by turbulent flow and high velocities.
As shown in the diagram, the complex flow path around the moving plate and the steep pressure gradients require careful consideration of compression wave behavior. This is essential for maintaining precise control over both pressure and flow rate, particularly since the moving plate operates at high frequencies.
Despite the significance of these design factors, experimentally investigating the complex three-dimensional fluid dynamic phenomena occurring within the SOGAV is nearly impossible. Consequently, advanced computational models are typically employed to accurately capture these intricate flow characteristics.
Over the years, Computational Fluid Dynamics (CFD) has been widely utilized to analyze three-dimensional flow behavior within valves with relatively simple geometric configurations. Numerous studies [7,8,9] have examined flow coefficients, pressure drops, and turbulent flow behavior. For example, Amirante et al. investigated the fluid dynamics within a commercial hydraulic proportional valve, focusing on optimizing the design by reducing the forces required to maintain the valve in the open position. They employed a dynamic computational grid, regenerating it every 0.1 mm of spool displacement while keeping the rest of the mesh unchanged [7]. Similarly, Wu et al. conducted a comprehensive analysis of a spring-loaded pressure control valve used in automotive fuel systems, employing CFD to evaluate flow-pressure characteristics [8]. Kang et al. explored the flow behavior and cavitation risks in a novel cylinder-in-ball valve, using steady-state simulations to assess flow control under various valve positions [9]. However, these studies primarily focused on steady-state flow analysis, which does not capture the dynamic flow characteristics associated with valve motion. Consequently, such analyses are limited in their ability to accurately predict flow behavior under real-world operating conditions.
Many commercial CFD programs employ sliding and dynamic mesh techniques to handle cases involving rotating machinery or moving boundaries [10]. Recently, these techniques have been applied to investigate the dynamic behavior of solenoid valves, including solenoid-operated spools [11,12,13], ball valves [14,15,16], and check valves [17,18,19,20] used in mobility applications. These studies leverage the linear motion of spools and the rotational motion of ball valves to examine transient flow dynamics and pressure wave behavior during opening and closing processes. Cao et al. used CFD simulations to explore the dynamic characteristics of a solenoid valve under various duty cycles, employing a dynamic mesh to model the spool's movement [11]. Zhang et al. analyzed the dynamic and transient behavior of a high-pressure pneumatic pilot valve, using a sliding mesh technique with a 6 Degrees of Freedom (DOF) dynamic mesh to simulate the spool’s motion [13]. Similarly, Shu et al. utilized a sliding mesh approach to capture the rapid rotation of a ball valve, achieving accurate representation of transient flow [14]. In recent work, Jeong et al. analyzed the fluid dynamics of a five-way electric coolant control valve (Penta-Control Coolant Valve, PCCV), which is used in a 100 kW fuel cell vehicle. Their study applied dynamic mesh techniques to simulate the valve's rotation and accurately model its opening and closing phases [16].
Although sliding and dynamic mesh techniques are essential for addressing complex problems involving rotating or moving boundaries, they introduce challenges such as mesh quality degradation, stability issues during rapid motion, interpolation errors, and high computational costs. To mitigate these challenges, careful mesh design, smaller time steps, and advanced numerical methods are necessary, albeit at the expense of longer simulation times, increased model complexity, and greater computational resource demands.
The Solenoid Operated Gas Admission Valve (SOGAV), illustrated in Figure 1, differs from other valve designs due to its highly complex flow path and the inclusion of a moving plate with intricate geometry, capable of very fast opening and closing speeds. Additionally, since the working fluid is gaseous fuel, jet streams are generated as the gas flows through the multi-hole restrictor in the moving plate, leading to strong pressure gradients as well as compression and expansion phenomena. This results in three-dimensional compressible, pulsating flow characteristics and generates complex pressure wave patterns within the inlet and outlet pipes.
These dynamic flow characteristics significantly impact engine performance, including power output, combustion efficiency, emissions, and aerodynamic noise, making them a critical area of study. However, due to the geometric and physical complexity of the SOGAV, no previous studies have thoroughly analyzed the three-dimensional dynamic flow characteristics within the valve.
To address this gap, this research conducted a three-dimensional CFD analysis to investigate the dynamic and transient flow behavior inside the SOGAV, accounting for the rapid motion of the moving plate. A dynamic mesh technique was employed to model the movement of the plate in three dimensions. Using the developed transient CFD model, detailed analyses were performed at representative engine operating points. The study examined how variations in pressure difference between the inlet and outlet, as well as changes in the valve’s operating frequency, influence the internal flow behavior. Furthermore, the impact of geometrical modifications to the moving plate on key performance parameters, such as pulsating mass flow rate and pressure, was thoroughly investigated. The findings of this study provide valuable foundational data for the design and optimization of SOGAV systems, contributing to efforts to meet the increasing demand for improved cycle-to-cycle variation control and load-change behavior in near-zero emission, large-bore CNG engines.

2. Method and Modelling

2.1. Physical Model

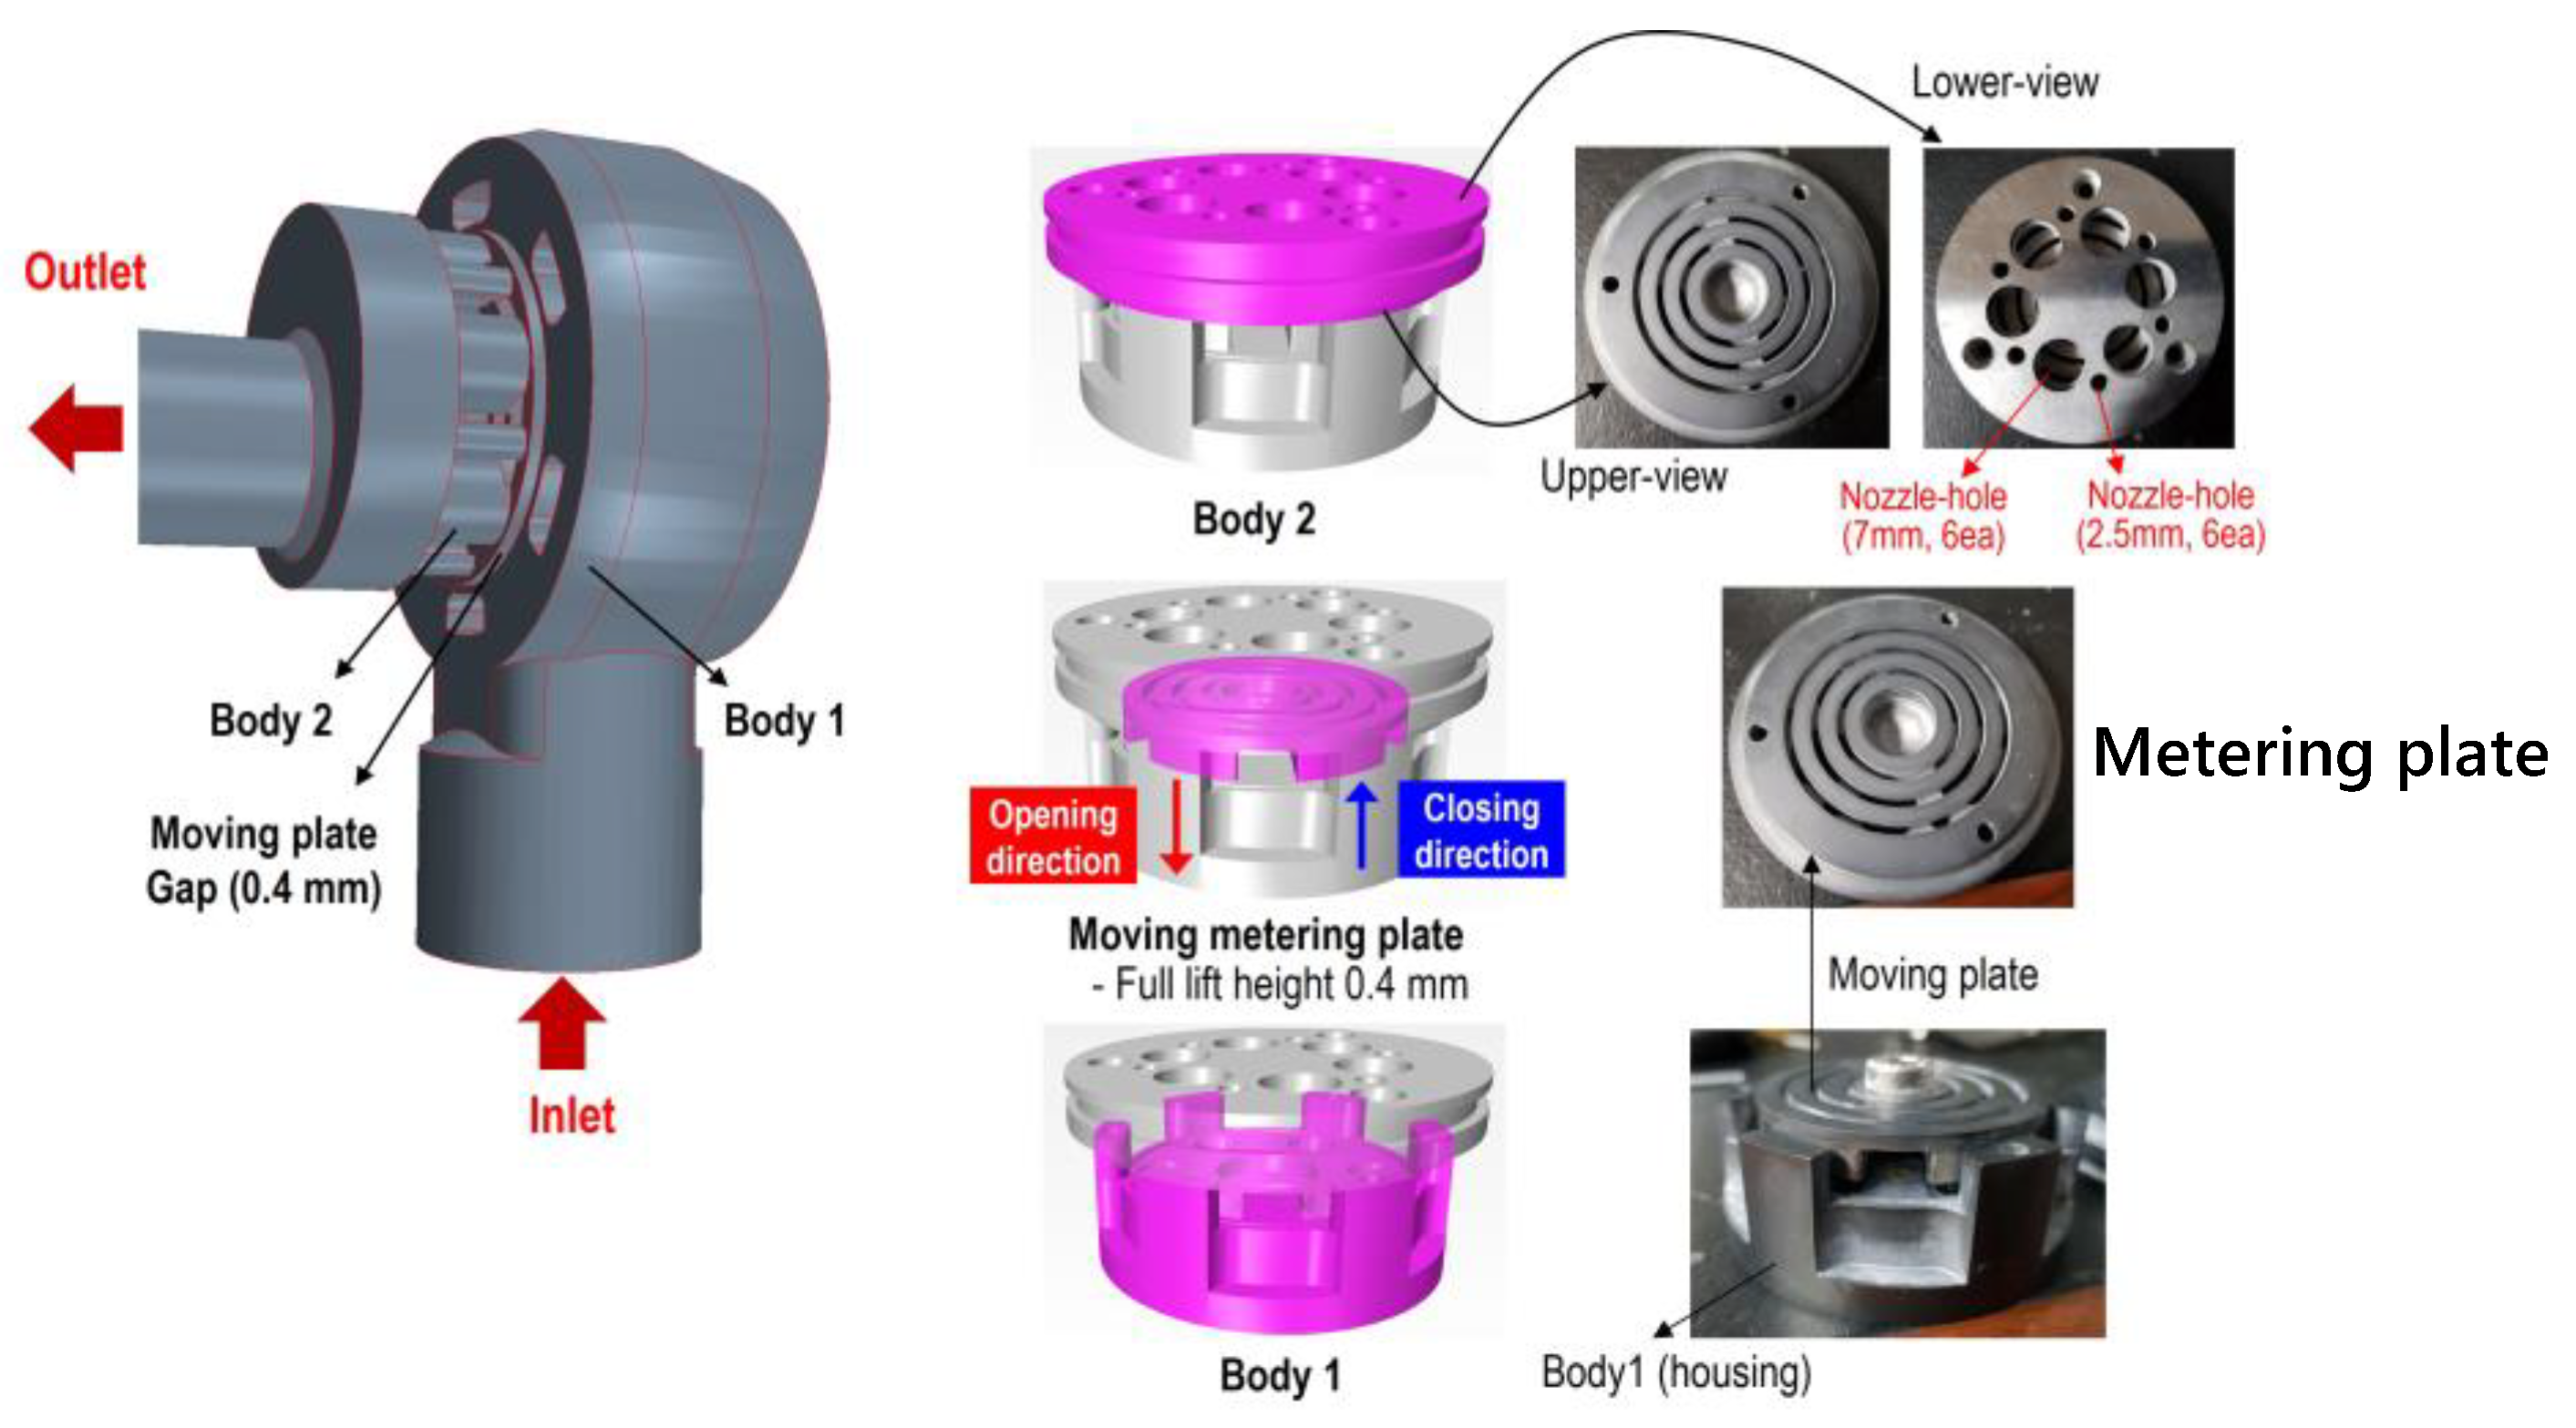
The gas admission valve investigated in this study is capable of delivering natural gas to the intake ports of a turbocharged engine with a specific output of 190 kW per cylinder and a displacement of 11.4 liters per cylinder, as illustrated in Figure 2. The SOGAV (Solenoid-Operated Gas Admission Valve) examined in this research consists of three main subsystems (highlighted in purple) located beneath the solenoid assembly’s E-core.
The leftmost figure in Figure 2 presents the CAD surface data of the SOGAV assembly analyzed in this study. The middle section shows the upper plate (Body 1), the moving plate, and the moving metering plate (Body 2). Body 1 supports the E-core and creates a flow path that channels high-pressure gas from the valve inlet to the moving plate. The moving plate travels 0.4 mm in a linear stroke from fully closed to fully open. This short stroke, coupled with high actuation forces, ensures rapid and consistent response during opening and closing cycles.
Body 2 serves as a multi-hole restrictor, which reduces the flow velocity and ensures a more uniform distribution of gas. This design helps to weaken the intensity of jet streams generated as the gas flows through the restrictor’s holes, thereby playing a crucial role in minimizing aerodynamic noise and vibration. In high-pressure systems such as the SOGAV, multi-hole restrictors like Body 2 are essential for suppressing turbulence and stabilizing the flow.
The core concept of the valve design is to maximize flow area while minimizing opening movement. Additionally, when the stroke length is sufficiently small, the response time of the valve can be significantly reduced. As a result, the high On/Off frequency of the SOGAV enables precise control of flow rate. The SOGAV features a short travel distance, with the moving valve plate opened by solenoid force and closed by a combination of spring force and gas pressure.
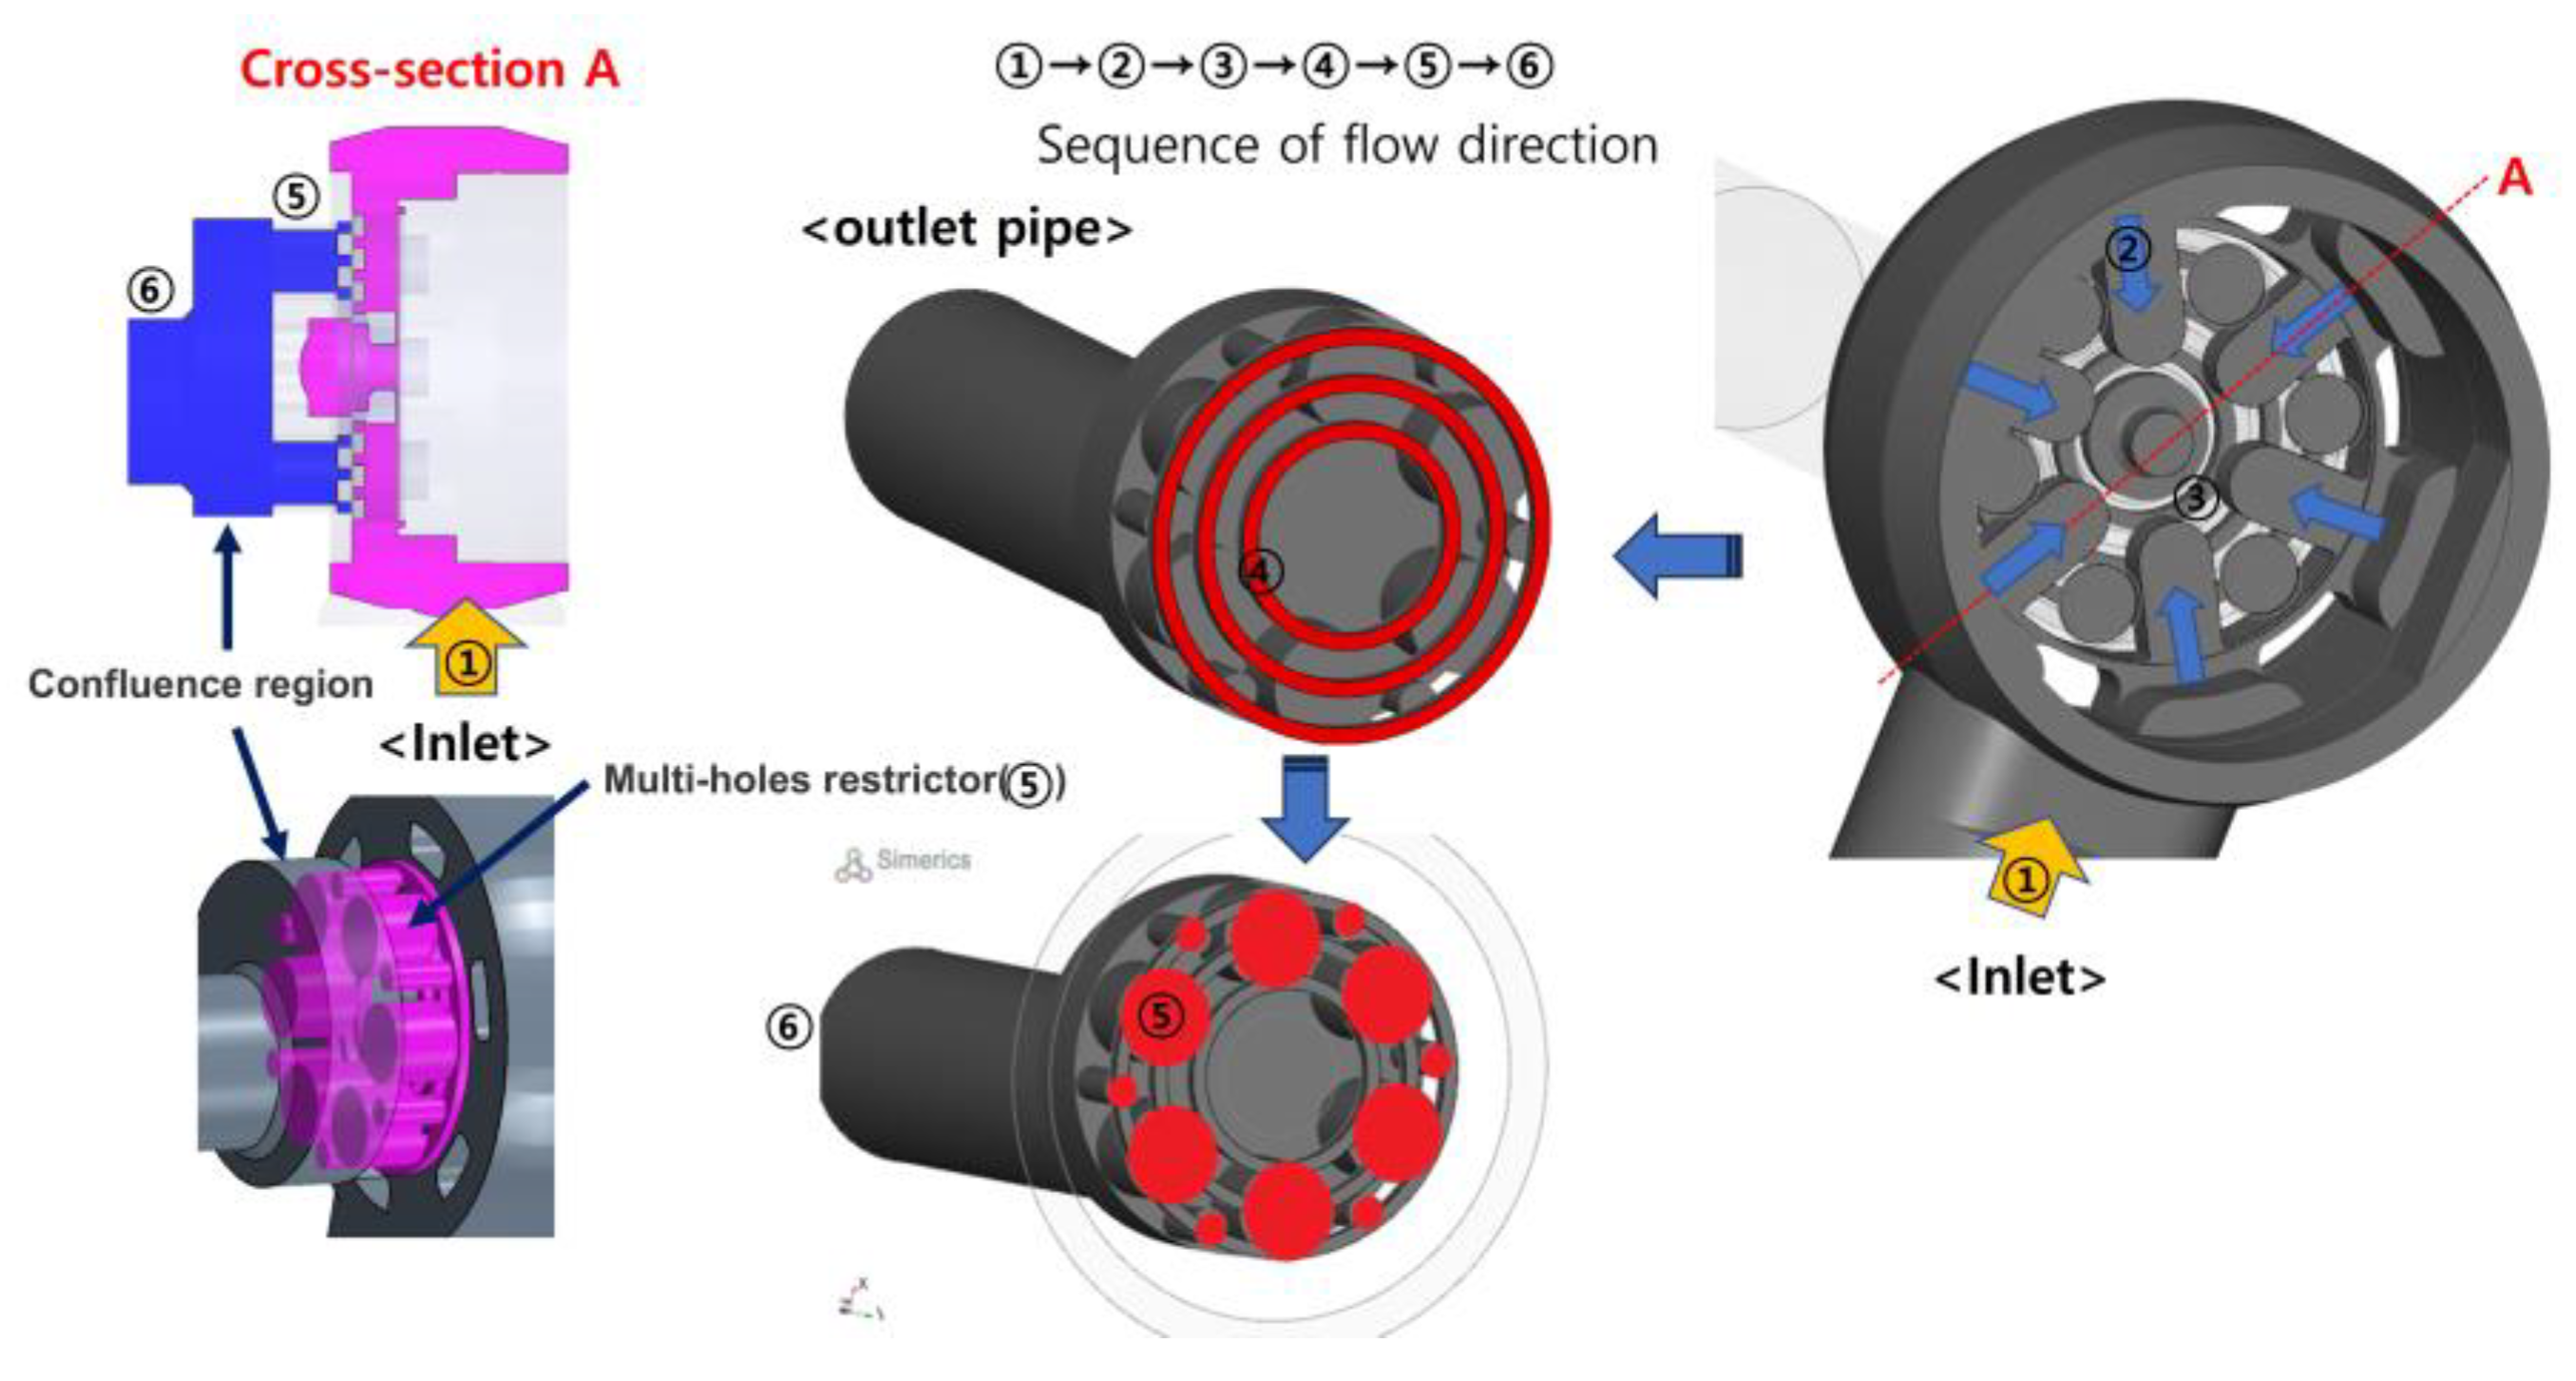
To implement this design concept, the SOGAV incorporates a complex flow path, as illustrated in Figure 3. Compressed gas enters the system through the inlet pipe (①) connected to Body 1, as shown in Figure 1, and flows through six evenly spaced connecting pipes (②) arranged circumferentially. The gas then reaches the multi-ring-shaped groove (③). At this stage, the flow region is highlighted in red in the cross-sectional view (Section A).
When the ECU commands the valve to open, the electromagnetic actuator moves the valve from its closed to open position. In the open state, the gas from the groove flows into the three radial rings (④), also indicated in red. From these rings, the gas enters the orifices (⑤) of the multi-hole restrictor (Body 2). After passing through the orifices, the flow mixes within the confluence region and is then discharged through the outlet (⑥).

2.2. Mathematical Model

As mentioned above, PWM-controlled SOGAV model should comprise three primary subsystems: electromagnetic, mechanical, and fluid subsystems. During valve operation, all three subsystems are fully coupled, interacting with each other dynamically. Consequently, performing Computational Fluid Dynamics (CFD) simulations to capture the dynamic characteristics of these valves presents a significant challenge due to the complexity of this coupling.
In this study, the SOGAV was modeled using the commercial 3D CFD software Simerics-MP+®, developed by Simerics Inc.® [17]. This software numerically solves the conservation equations of mass and momentum, while incorporating precise physical models to accurately simulate turbulence. In a SOGAV, the flow is highly compressible, and the three-dimensional transient turbulent flow is considered in this study.
It is important to note that although the energy equation is not incorporated into the governing equations for this simulation, meaning the simulation is conducted in isothermal mode, certain material properties, such as the gas density in the ideal-gas state equation, exhibit temperature dependence.
Turbulent jet flows through small openings, typical in valves like SOGAV, are sensitive to turbulence generation, entrainment, and diffusion. Hence, the selection of an appropriate turbulence model is crucial in the numerical analysis of internal valve flows with jet formations and large pressure gradients [20,21,22,23]. If an inappropriate turbulence model is chosen, the numerical solver may fail to capture critical flow features like turbulent kinetic energy dissipation, leading to inaccurate predictions of flow velocity, pressure drops, and vortices. The software utilizes well-established turbulence models, including the standard k-ε model and the RNG k-ε model [25]. These models have been in use for over a decade and have consistently demonstrated reliable performance in producing accurate engineering results. For the simulations conducted in this study, the RNG k-ε model has been applied because the RNG k-ε model is generally more suitable than the standard k-epsilon model for flow simulations involving large pressure gradients or jet flow[1,2]. As mentioned above, A significant flow characteristic of the SOGAV is the presence of sharp pressure gradients and jet flows generated as fluid passes through small holes in the moving plate. The RNG k-ε model incorporates the constant C of the production term in the RNG k-ε model’s dissipation rate(ε) equation [23,24,25]. As a result, the RNG k-ε model is beneficial for simulations involving complex flow features such as swirling flows, recirculating flows, and flows with high strain rates, making it suitable for strong jet-like flows and complex industrial applications in which the velocity gradients are significant, causing intense mixing and variations in velocity. [21,22,23,24,25,26,27]. The governing equations applied for the flow analysis in this study have been omitted for the sake of brevity. Further details concerning the governing equations can be referred to in [13,16,18,29].

2.3. Dynamic Mesch Technique, Initial and Boundary Condition Setting

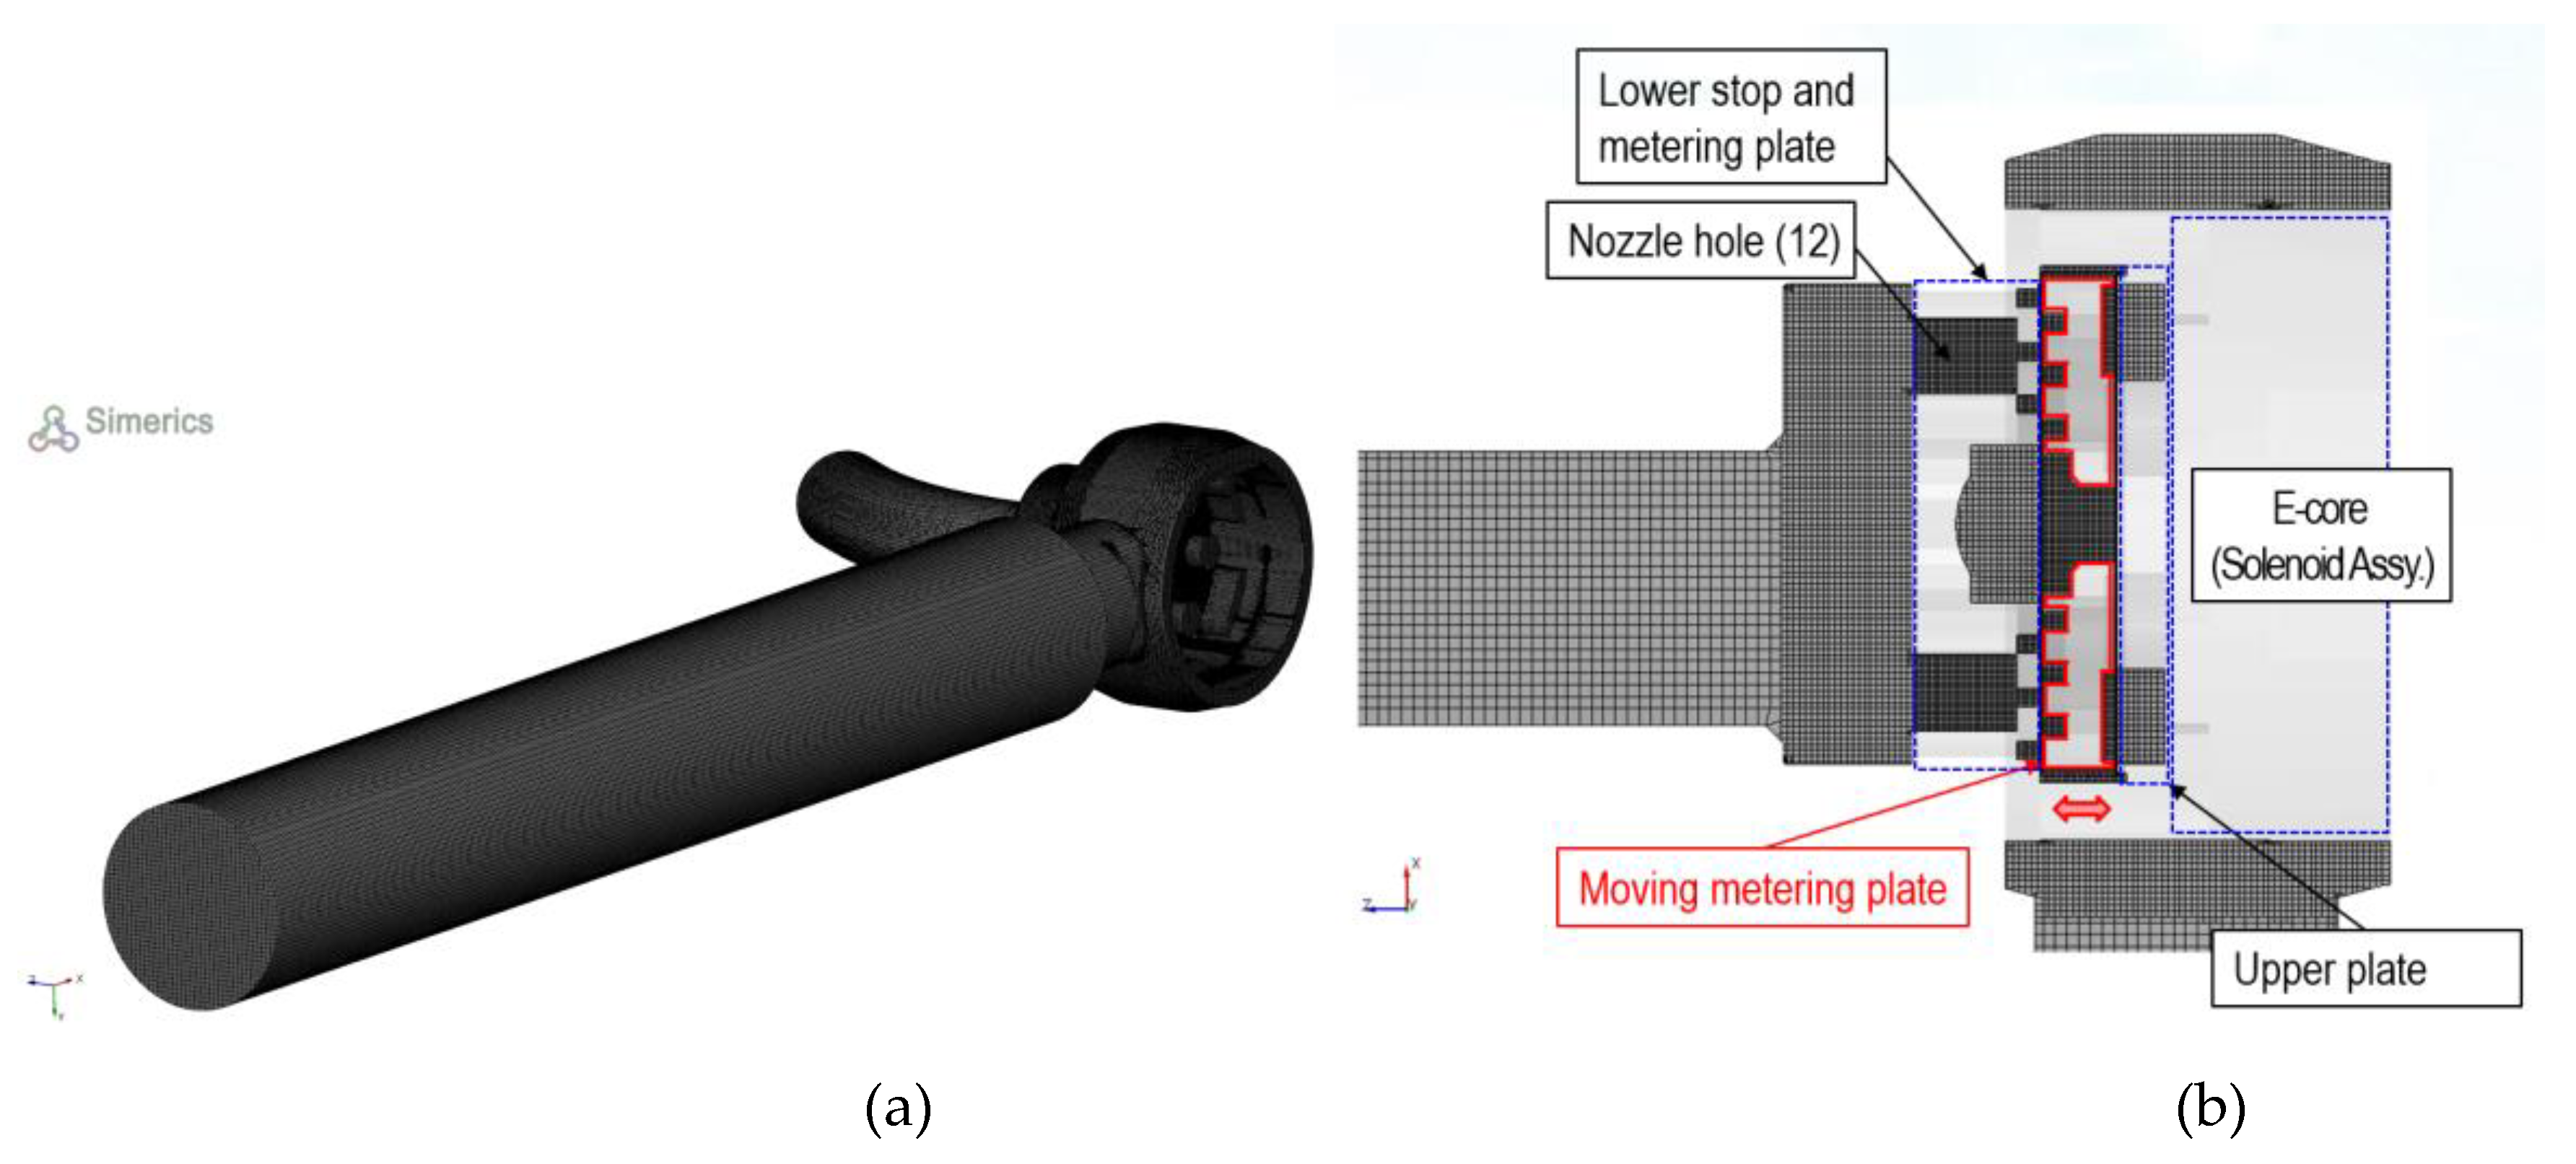
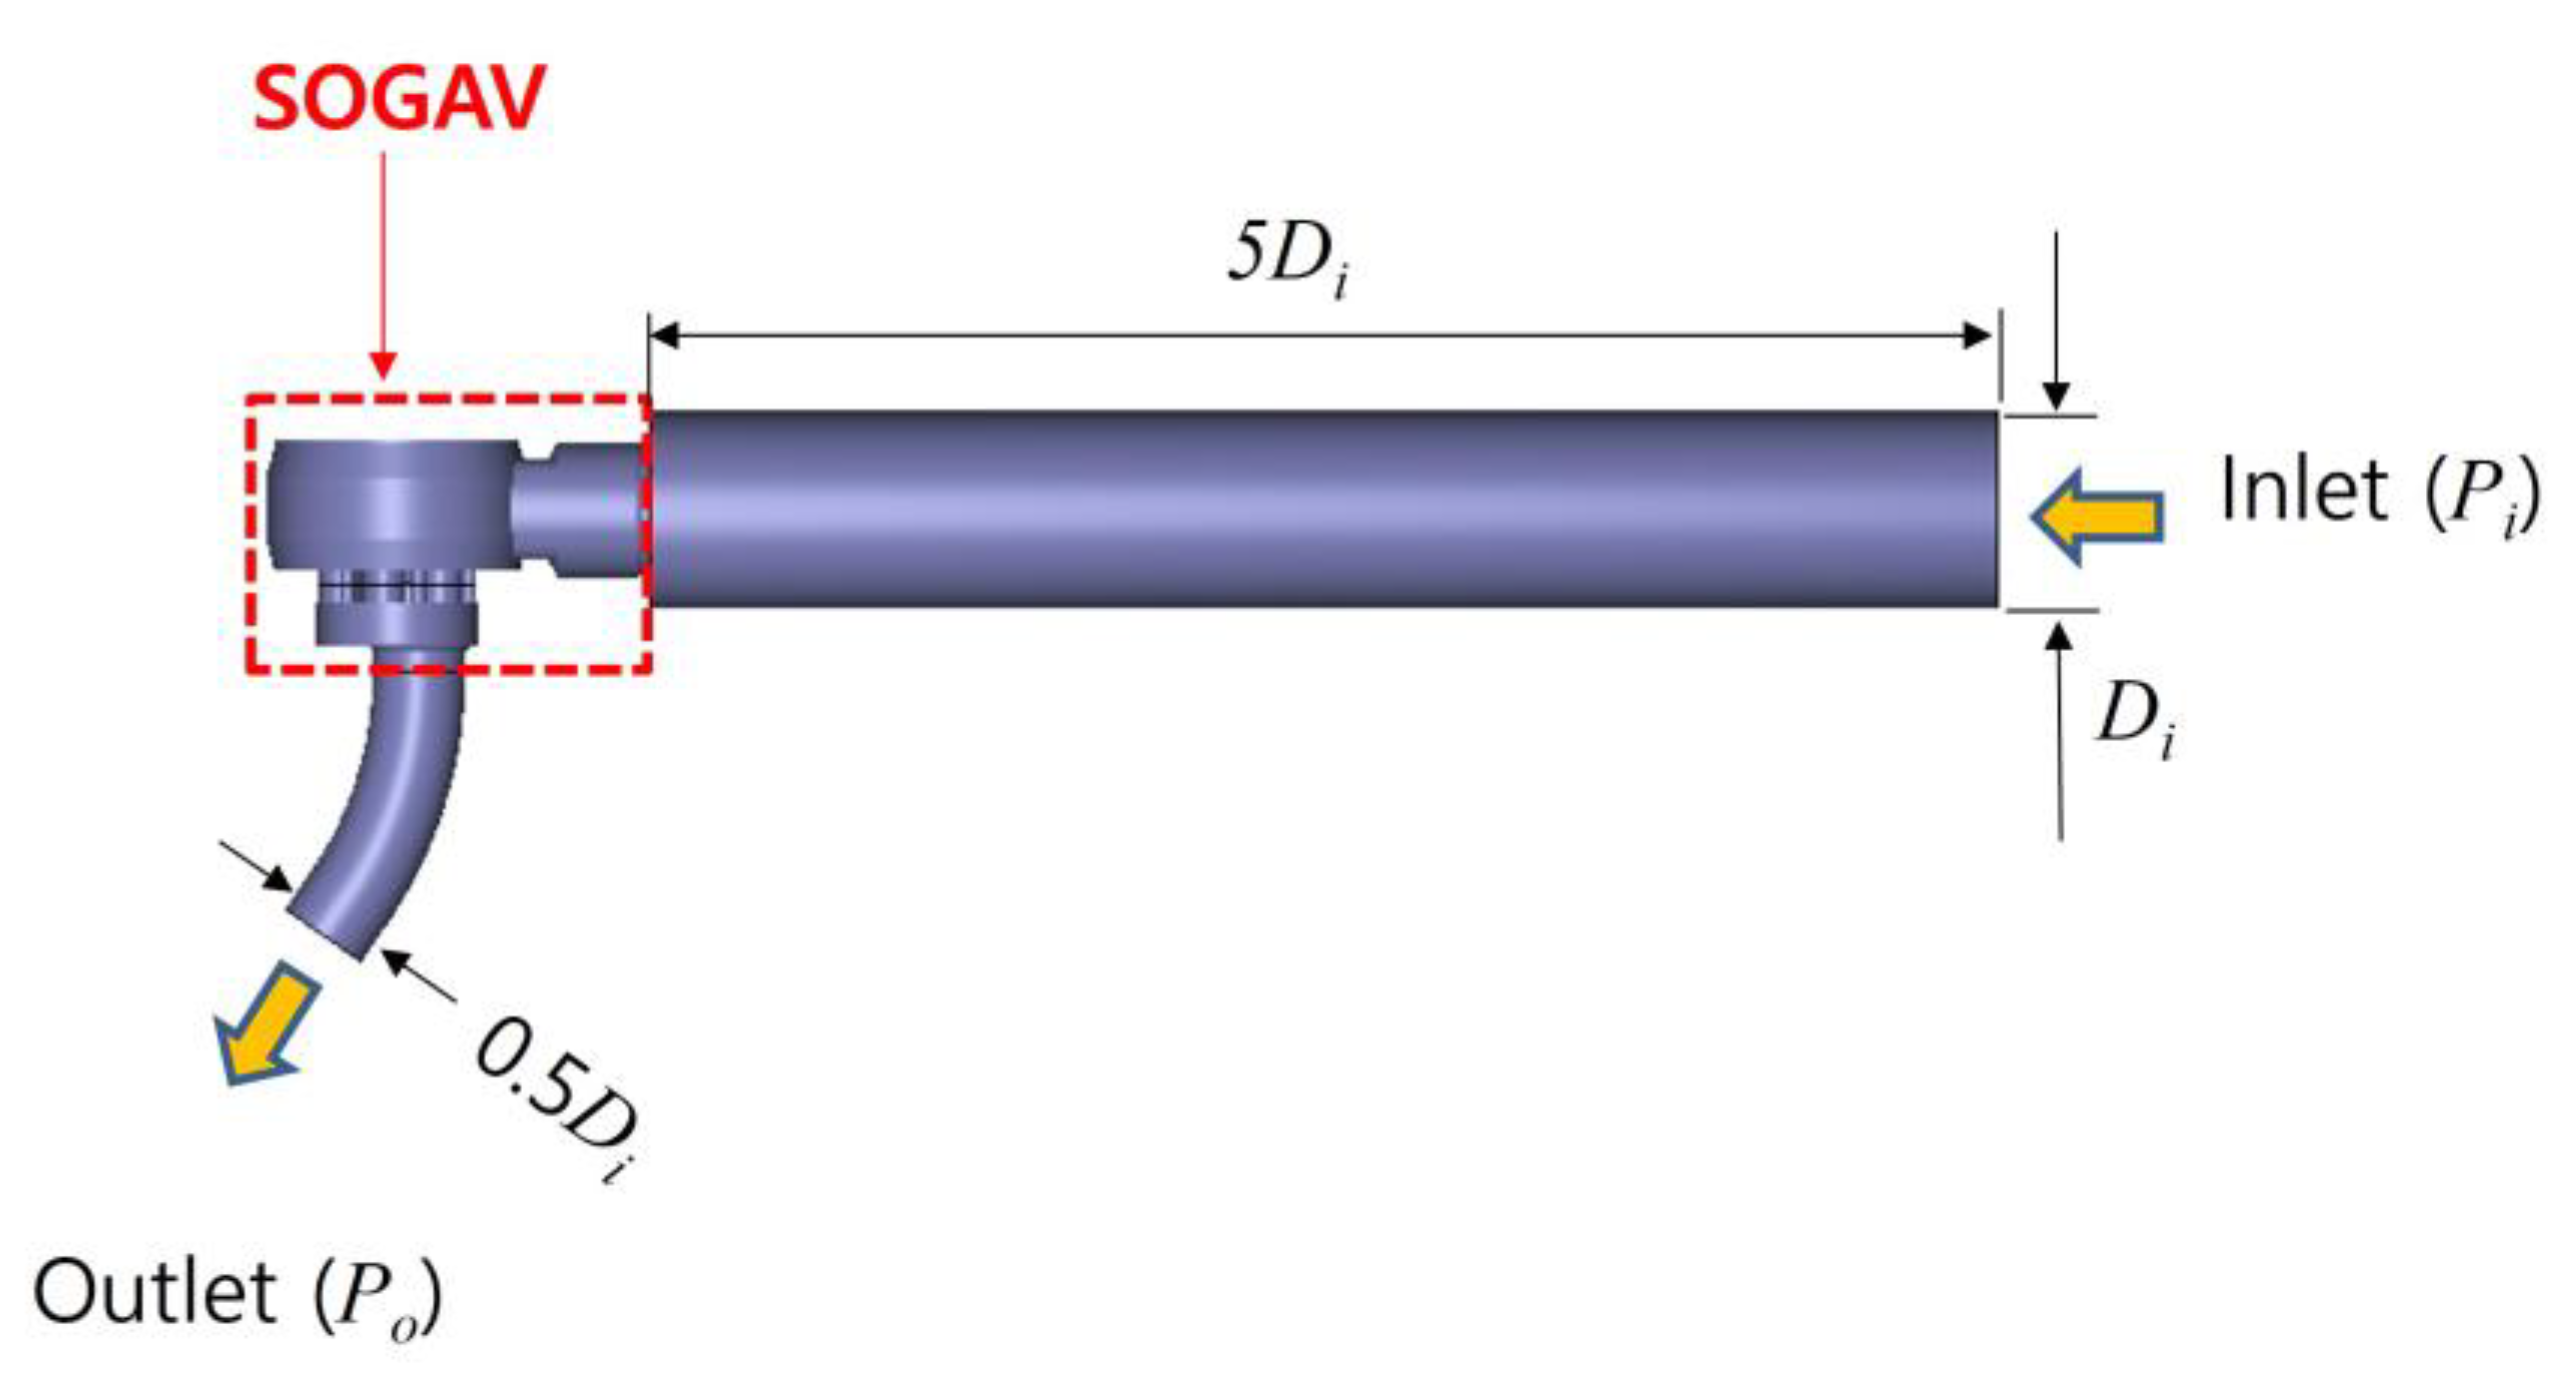
The fluid domain of the SOGAV was derived from its Computer-Aided Design (CAD) model, provided by the industrial collaborator, STX Engine, as depicted in Figure 2. The geometry was imported into Simerics MP+ for further analysis. A high-quality mesh was generated for the entire fluid domain using structured hexahedral cells within Simerics MP+. Figure 5(a) presents the 3D mesh model with the moving plate region removed to enhance visibility. As shown in the figure, the inlet face was positioned upstream at a distance five times the inlet diameter to ensure the development of a fully developed velocity profile and to minimize the influence of boundary conditions.
Hexahedral meshes were applied to the entire flow domain, with refined meshes near the multi-hole restrictor of the moving plate to capture the flow field with greater accuracy. The mesh model consists of approximately 2.4 million cells, and the mesh quality was thoroughly validated. To efficiently mesh complex areas—such as highly curved or narrow-cut regions—a binary tree unstructured mesh methodology [17] was employed to generate hexahedral cells.
Figure 5(b) illustrates the 2D mesh structure at cross-section A of Figure 3, effectively showing the mesh structure around the moving plate. Only the fluid domain is depicted, and the region marked by the red line indicates where the dynamic mesh technique is applied to enable axial motion of the moving plate.
In this study, the dynamic mesh technique is adopted because the computational domain changes due to the transient position of the moving plate. The dynamic layering method is used to split or merge cells adjacent to the moving boundaries. This methodology effectively captures the transient internal flow dynamics including wave transmission within the SOGAV, where the moving plate gap(=0.4mm) between moving plate and multi-hole restrictor experience continuous changes in shape and volume during operation. The dynamic mesh technique enables the simulation to resolve these variations accurately, providing detailed insights into the flow characteristics and performance of the system.
Various methods exist for handling dynamic meshes (also referred to as a sliding mesh or moving mesh) technique. In the case of SOGAV, a moving/sliding mesh approach is required, where the stationary and moving domains are meshed independently and a sliding interface allows for relative motion between these regions. Each moving domain interfaces with adjacent domains through a shared boundary, which is updated at every time step to account for deformation and motion. Simerics MP+ employs the mesh reconstruction method of remeshing (layering method) and smoothing techniques to handle deforming geometries that change shape over time. The remeshing and smoothing algorithm ensures that mesh quality is maintained during deformation, preventing excessive distortion and preserving numerical accuracy [17,30]. Simerics MP+ applies a spring-based smoothing algorithm [29,30,31,32] in its dynamic mesh technique to adjust mesh node positions during small deformations, maintaining mesh quality without changing topology. In this approach, mesh edges are treated as springs with stiffness inversely proportional to their length. The governing equation is:
f i j = k i j ( u j u i ) · n i j · n i j
Where:
-
f i j   is the force exerted on node i by node j.
-
k i j is the spring stiffness (inversely proportional to edge length)
-
u i and u j are displacements of nodes i and j
When boundaries move, the internal nodes reposition to achieve a new equilibrium, ensuring mesh deformation follows the boundary movement without altering mesh connectivity.
The equilibrium for a node i is determined by:
j = 1 n f i j = 0
The displacement of mesh nodes is solved through a system of linear equations, maintaining computational stability even under moderate deformation. This method efficiently preserves mesh quality while managing dynamic changes within simulations​ [30,31,32]. When the dynamic mesh technique is used, the meshes split or merge near the moving wall. However, at least one layer of the meshes between the moving wall and the stationary walls should exist for the dynamic mesh. Accordingly, the minimum distance is set to 0.005 mm, which is equivalent to the valve being closed [29].
On the other hand, the Remeshing method employed Conformal Adaptive Binary-tree (CAB) algorithm [17,33]. This method generates Cartesian hexahedral cells to maintain high accuracy with minimal computational overhead. The CAB algorithm is designed to adaptively refine the mesh by dividing cells progressively, which makes it suitable for capturing fine geometrical details and ensuring mesh conformity with complex boundaries like SOGAV.
When modeling wave transmission due to rapid moving plate motion in intake and outlet pipe using 3D CFD, careful selection of boundary conditions is essential to accurately capture pressure wave behavior. The boundary conditions used in this study include fixed pressure conditions at the inlet and outlet surfaces, along with a no-slip wall condition, which is assumed to be adiabatic. A standard wall function was employed to accurately compute turbulent quantities near the wall. A schematic representation is provided in Figure 6 to illustrate the locations of the boundary conditions clearly.
For simulations where the inlet and outlet of the pipe open directly to the atmosphere, boundary conditions that correctly represent atmospheric pressure while allowing smooth wave propagation without causing reflections are necessary. Hence, the static pressure at both the inlet and outlet is set to atmospheric pressure:
P i n l e t , o u t l e t = P a t m = 10,325 P a
In this study, where pressure waves travel towards the inlet and outlet, a non-reflecting boundary condition was imposed to prevent unrealistic interference patterns inside the domain. A Neumann boundary condition was applied as follows:
u n = v n = w n = 0
This ensures that the velocity gradient in the direction normal to the boundary is zero, implying that the fluid leaves the domain without any resistance. No-slip and adiabatic conditions were applied at the walls to ensure accurate interaction between the flow and the pipe boundary:
u = v = w = T n = 0
This study investigates two operational scenarios: the first corresponds to the engine running at 1000 rpm under full-load conditions, with an inlet-outlet pressure differential of 1.02 bar and an operating frequency of 8.3 Hz. Under this operating condition, the valve opening duration is 8.1 ms. The second scenario represents 585 rpm at 20% partial-load conditions, with a pressure differential of 0.8 bar and an operating frequency of 4.9 Hz. Under this operating condition, the valve opening duration is 7.1 ms. Additionally, the study explores the impact of varying pressure differentials at a fixed operating frequency. A summary of the operational conditions analyzed in this study is presented in Table 1.
As shown in the top right corner of Figure 2, the multi-hole restrictor plate contains six holes with a diameter of 7 mm and six holes with a diameter of 2.5 mm, distributed across the plate. A multi-hole restrictor serves as a flow control device that utilizes multiple small openings to regulate the flow of fluid through the system. By forcing the fluid to pass through several smaller holes rather than a single larger one, this design introduces resistance, effectively reducing flow rate and managing pressure drops in a controlled manner. Additionally, it helps mitigate the formation of jets or high-velocity regions, which could otherwise generate noise and vibration.
As illustrated in Figure 2, the use of a multi-hole restrictor with non-uniform hole sizes enhances noise attenuation and increases the internal peak frequency compared to a restrictor with uniformly sized holes. The variation in hole diameters disrupts coherent jet formations and promotes localized turbulence at smaller scales. This modification shifts the acoustic energy to higher frequency ranges, rendering the noise less perceptible to human hearing. However, aerodynamic noise-related issues are beyond the scope of this study.
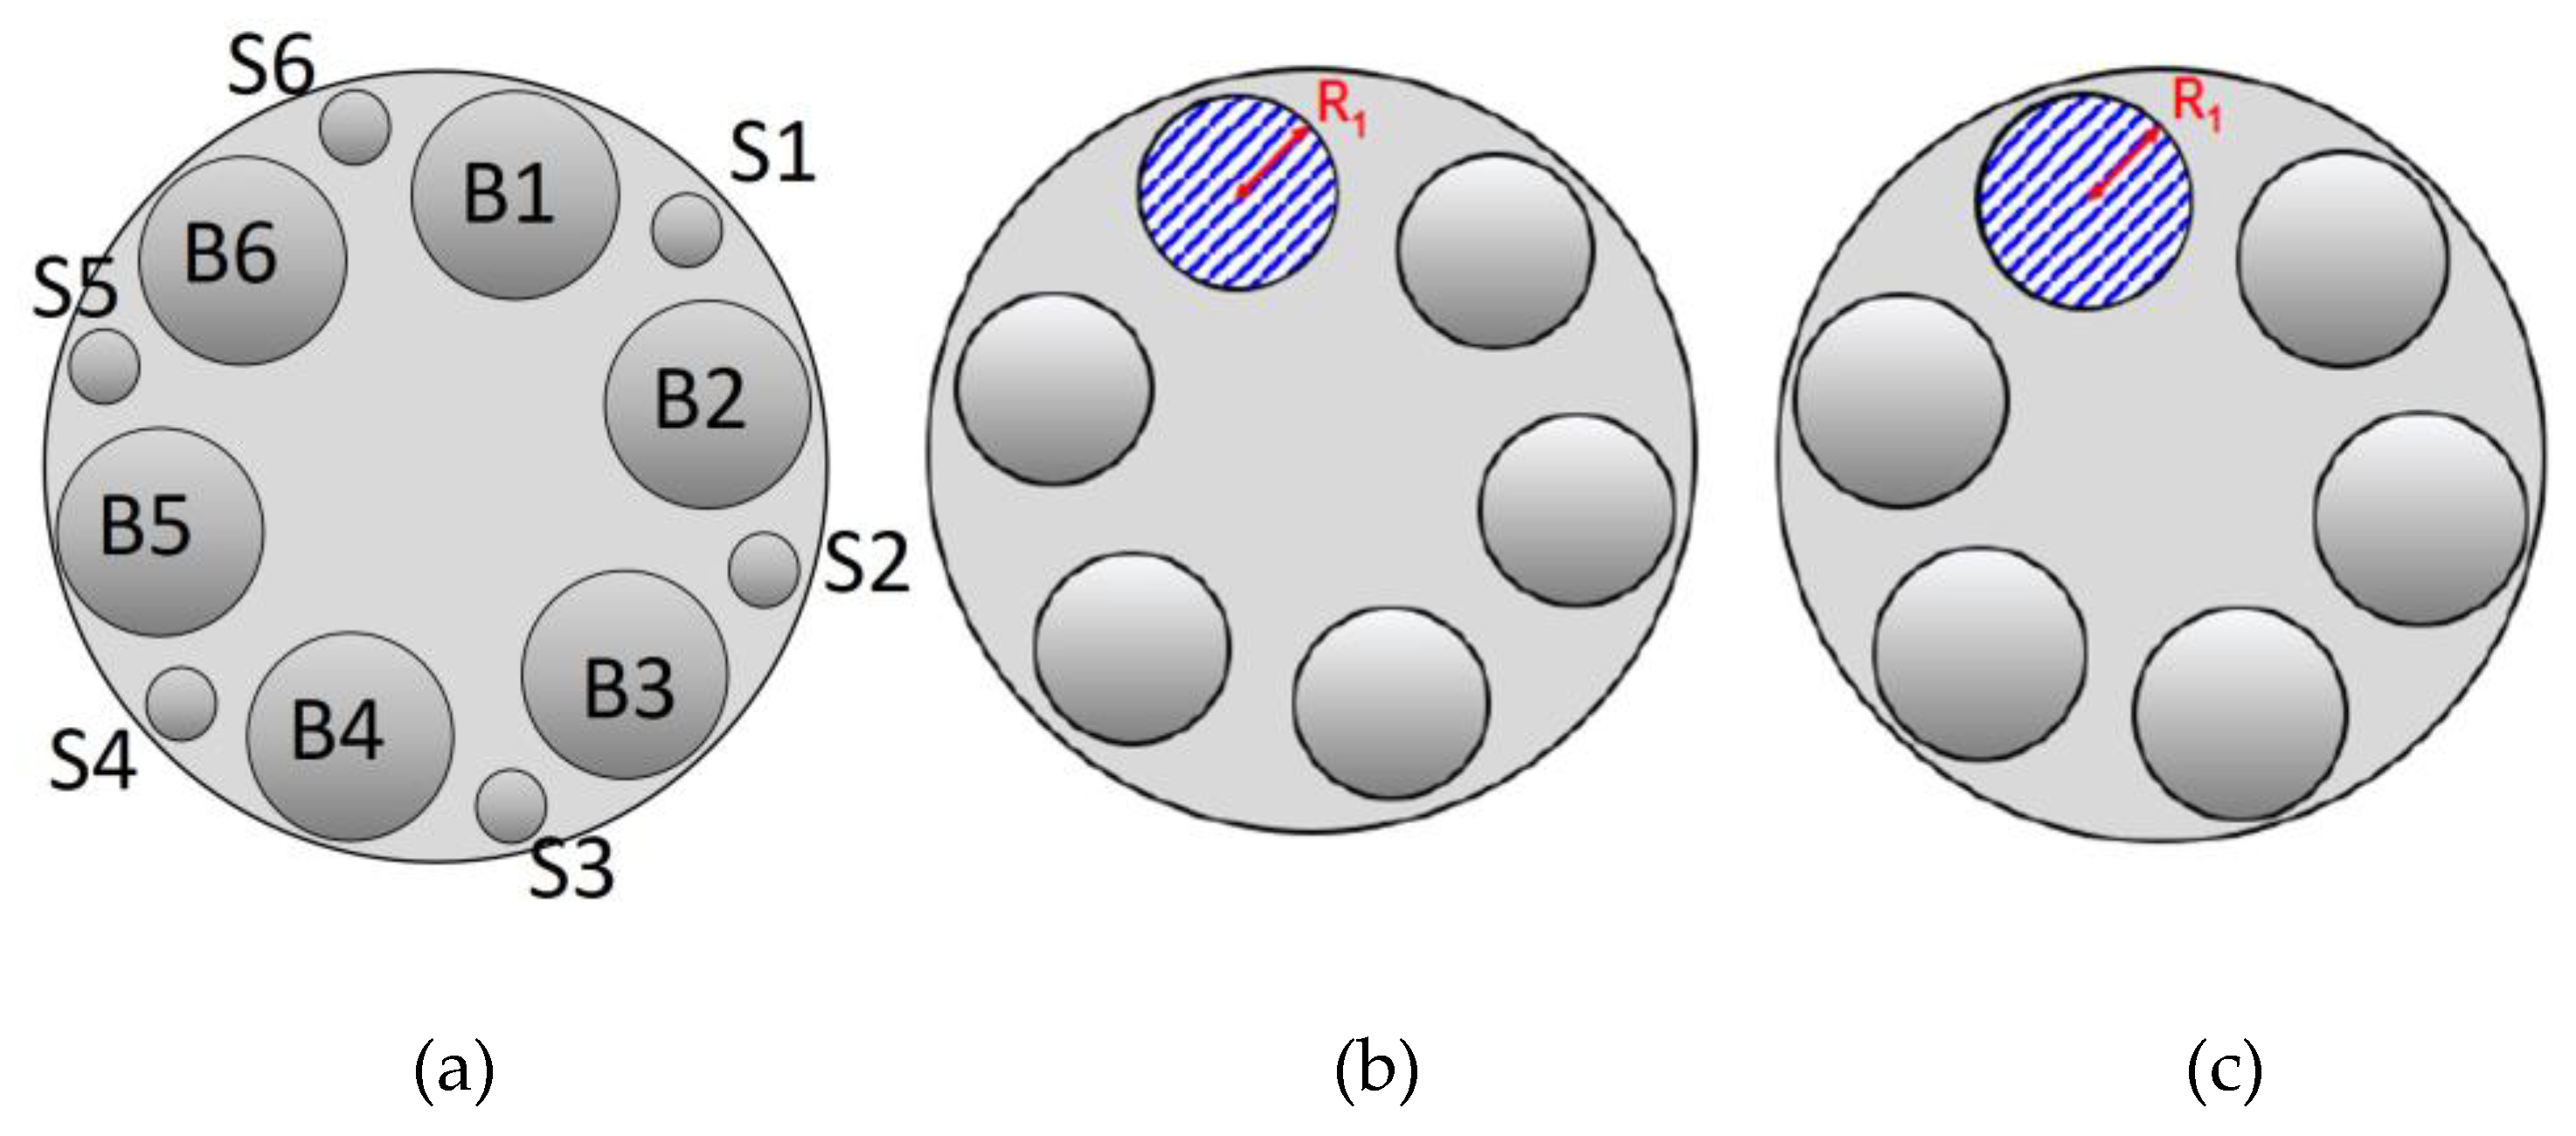
To evaluate the impact of different hole arrangements in multi-hole restrictors on the dynamic transient flow characteristics within the SOGAV system, dynamic transient flow simulations were conducted for three distinct geometric configurations, as presented in Figure 7.
The first configuration, (a), corresponds to the multi-hole restrictor with different-sized holes, as depicted in Figure 2. The second configuration, (b), is derived from (a) by removing the smaller holes, resulting in a 11.27% reduction in the total flow cross-sectional area. Finally, configuration (c) eliminates the smaller holes and increases the diameter of the six larger holes by 4 mm to restore the total flow cross-sectional area to that of configuration (a).
Simulations were conducted for these three configurations under four distinct conditions, as summarized in Table 3, with the numbers in parentheses indicating the number of holes. For case 1, the simulation was carried out under an inlet-outlet pressure differential of 1.02 bar using the restrictor with different-sized holes (configuration (a), as shown in Figure 2). Case 2 involved removing the smaller holes from configuration (a) and conducting the simulation under a pressure differential of 0.8 bar. Lastly, configuration (c) was simulated under pressure differentials of 1.02 bar and 0.8 bar for case 3 and case 4, respectively.
In previous studies [11,12,13,18,20,30], kinematic models were developed to simulate the linear motion of spools or the rotational movement of ball valves during valve opening and closing cycles, in order to control the movement of the dynamic mesh. However, due to various sources of error inherent in these models, this study determined the time-dependent behavior of the moving plate experimentally and applied it to the dynamic mesh control. Accordingly, the opening and closing processes were modeled as uniformly accelerated motion.
The position of the moving plate over time for two different operating frequencies is illustrated in Figure 8. The motion of the moving plate is governed by the interaction between the internal pressure of the SOGAV system, the mass of the moving plate, the spring stiffness coefficient, and the magnetic force. As shown in the figure, the experimentally measured lift curves exhibit slight bouncing immediately after opening and closing, attributed to mechanical and dynamic factors such as the inertia of the valve, the spring dynamics, mechanical clearance, and the mass of other components. However, for the sake of simplifying numerical simulations, these effects were neglected.
Unlike traditional camshaft-driven valves that exhibit a parabolic lift profile, SOGAV valves achieve nearly instantaneous lift upon actuation, reaching full lift within a few milliseconds. In this study, the valve reaches maximum lift within 0.12 ms and 0.2 ms for operating frequencies of 8.3 Hz and 4.9 Hz, respectively. Consequently, SOGAV valves remain at full lift for a larger proportion of the opening period compared to mechanically actuated valves, resulting in a more rectangular lift profile.
In this study, the percentage of time spent at full lift was significantly higher than that of mechanically actuated valves—93.3% and 96.5% of the total valve opening period for operating frequencies of 8.3 Hz and 4.9 Hz, respectively.
In this study, the steady-state simulation results under full valve lift conditions were used as initial conditions for the transient simulation. Therefore, the starting point of the dynamic transient simulation is designated as point C, marking the end of the full-lift phase, as depicted in Figure 8(b).
The motion of the moving plate is divided into three distinct phases. The interval between points A and B is defined as the opening phase, the interval between points B and C as the full-lift phase, and the interval between points C and D as the closing phase. Additionally, the midpoints of these phases are labeled as follows: the midpoint of the opening phase is denoted as “MOO,” the midpoint of the full-lift phase as “MOF,” and the midpoint of the closing phase as “MOC.”
To achieve transient stability, all cases were simulated for up to six cycles to evaluate the temporal variations in pressure at the outlet face. The results confirmed that the system remained synchronized and stable after three cycles.

2.4. Solver Setting

The upwind scheme was employed for spatial discretization, while a fully implicit scheme was used for time discretization. The time step must be sufficiently small to accurately capture the rapid changes in flow variables (velocity, pressure, density). For this simulation, a time step of 1.2 × 10⁻⁴ seconds was selected to effectively handle the fast dynamics and to satisfy the Courant–Friedrichs–Lewy (CFL) condition. The choice of time step was also influenced by the numerical solvers and algorithms used in the study. Specifically, the SIMPLE algorithm was employed to handle velocity-pressure coupling, as it is well-suited for transient and compressible flow simulations.
The algorithm’s ability to efficiently manage pressure–velocity coupling further influenced the selection of the time step size. Convergence criteria were defined by the reduction of scaled residuals for the continuity equation, momentum equations (x, y, and z directions), and RNG k-ε turbulence model equations to below 10⁻⁶.
The transient dynamic CFD model was computed using an AMD Ryzen Threadripper 3960X 24-Core Processor, operating at 3.79 GHz. On average, 96.6 hours were required to complete three cycles for each simulation case.
The detailed CFD solver settings used in the simulation are summarized in Table 4.

3. Results and Discussion

This section may be divided by subheadings. It should provide a concise and precise description of the experimental results, their interpretation, as well as the experimental conclusions that can be drawn.

3.1. Effects of Different Pressure Differences Between the Inlet and Outlet on Staedy-State CFD Simulation Results

In this study, as an initial step toward investigating the dynamic transient flow characteristics of the SOGAV, a steady-state simulation of the internal flow of SOGAV was conducted under a full valve lift condition (4 mm). The boundary conditions applied are as specified in Table 2. The results from this analysis serve as the initial conditions for subsequent unsteady flow simulations and will be compared with the dynamic unsteady flow results to identify key differences.
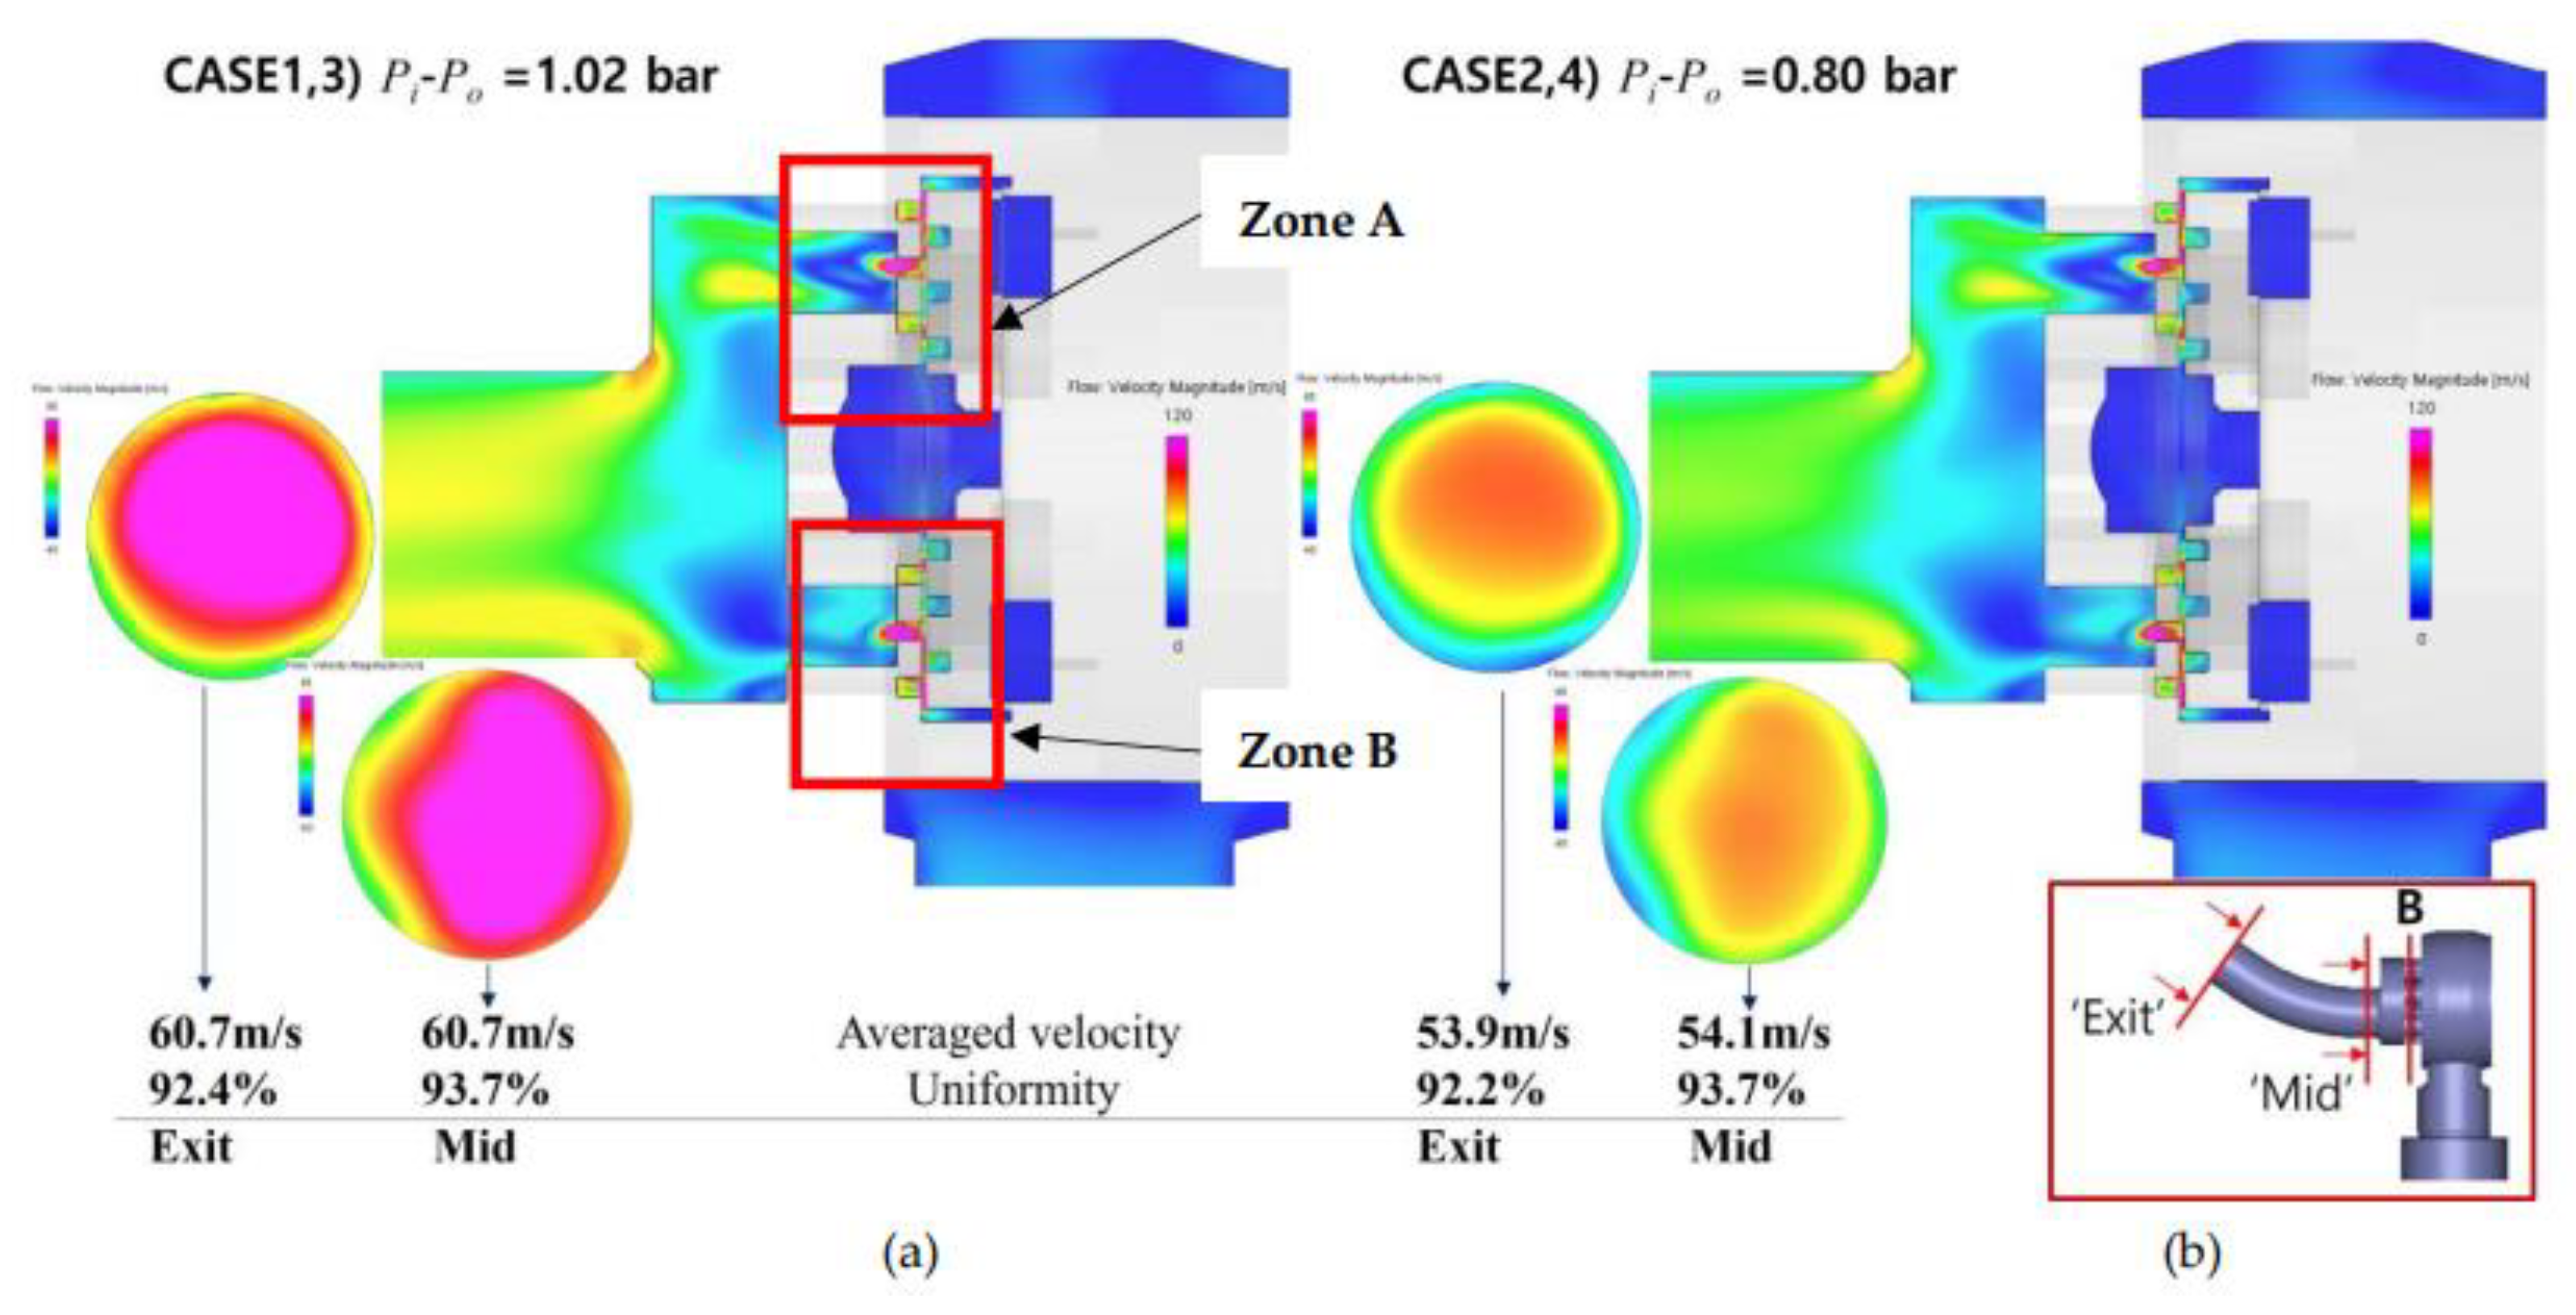
Figure 9 presents the velocity distribution across section A, as defined in Figure 3, along with the velocity profiles and uniformity of flow calculated at the centerline and terminal points of the outlet pipe. In this study, the following Equation (6) was used to calculate the uniformity at each cross-section. In this equation, v represents the velocity, and a denotes the cross-sectional area of each computational cell.
γ u n i f o r m i t y = 1 S V × 100 ( % )
Where, S = 1 A ( v V ¯ ) 2 d a , V ¯ = 1 A v d a , A=∑a
As the moving plate retracts, a small gap forms between the circular hoops of the moving plate and those of the metering plate located in the lower top region. Through this gap, the high-pressure gas, initially charged in Body 1, infiltrates the enclosed space of the circular hoops and flows into the interior of the multi-hole restrictor. In these regions (Zone A and B), a significant velocity gradient develops due to the abrupt change in the flow cross-sectional area. The flow entering through the restrictor holes exhibits a jet-like behavior. Subsequently, the flows from each hole converge and mix within the confluence region before exiting through the outlet pipe. It is noted that the velocity uniformity at both the middle and end of the outlet pipe remains above 90%. As the flow progresses downstream, the velocity distribution gradually mixes, forming a more circular profile at its peak. Additionally, the pressure difference between the inlet and outlet has minimal impact on the velocity distribution within the SOGAV, influencing only the magnitude of the velocity.
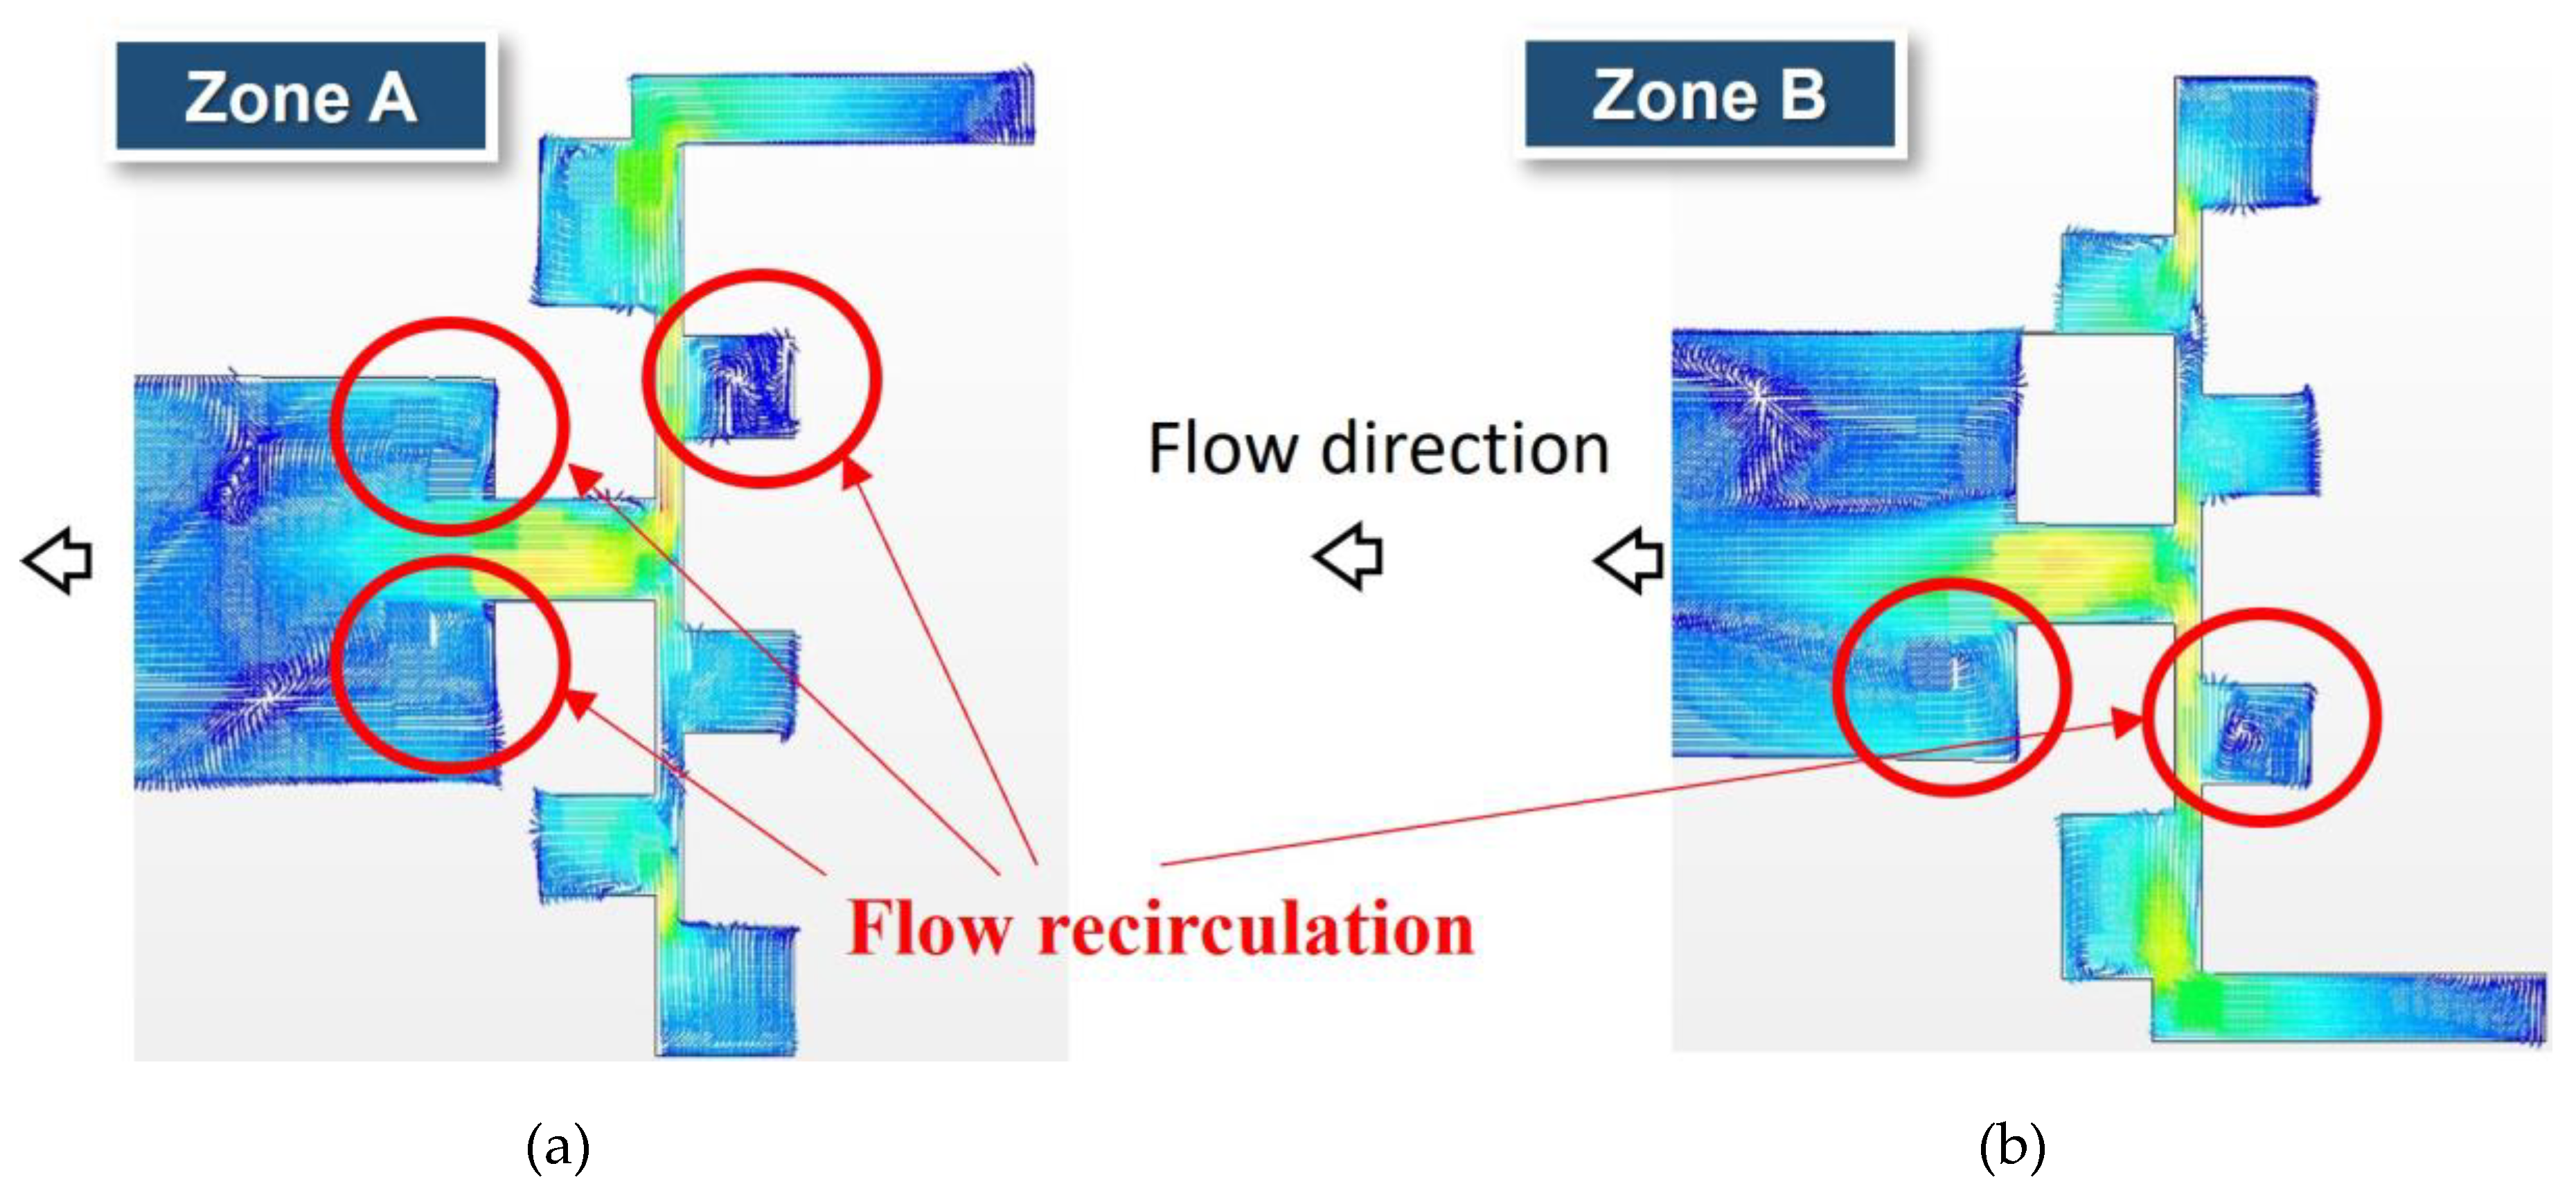
Figure 10 shows an enlarged view of the velocity vector fields in Zones A and B from Figure 9. In these regions, abrupt expansions and contractions of the flow path are present, and multiple recirculation zones induced by flow separation are observed in sudden changes in flow area especially near corners or narrow sections. These patterns increase drag and reduce the precision of fluid control, making it difficult to achieve desired flow rates. Notably, stagnant flows due to flow separation and vortex formation are identified at several points as the fluid flows through the multi-hole restrictor. These flow patterns disrupt smooth fluid movement and reduce valve efficiency, potentially complicating precise flow control under operating conditions involving frequent velocity variations.
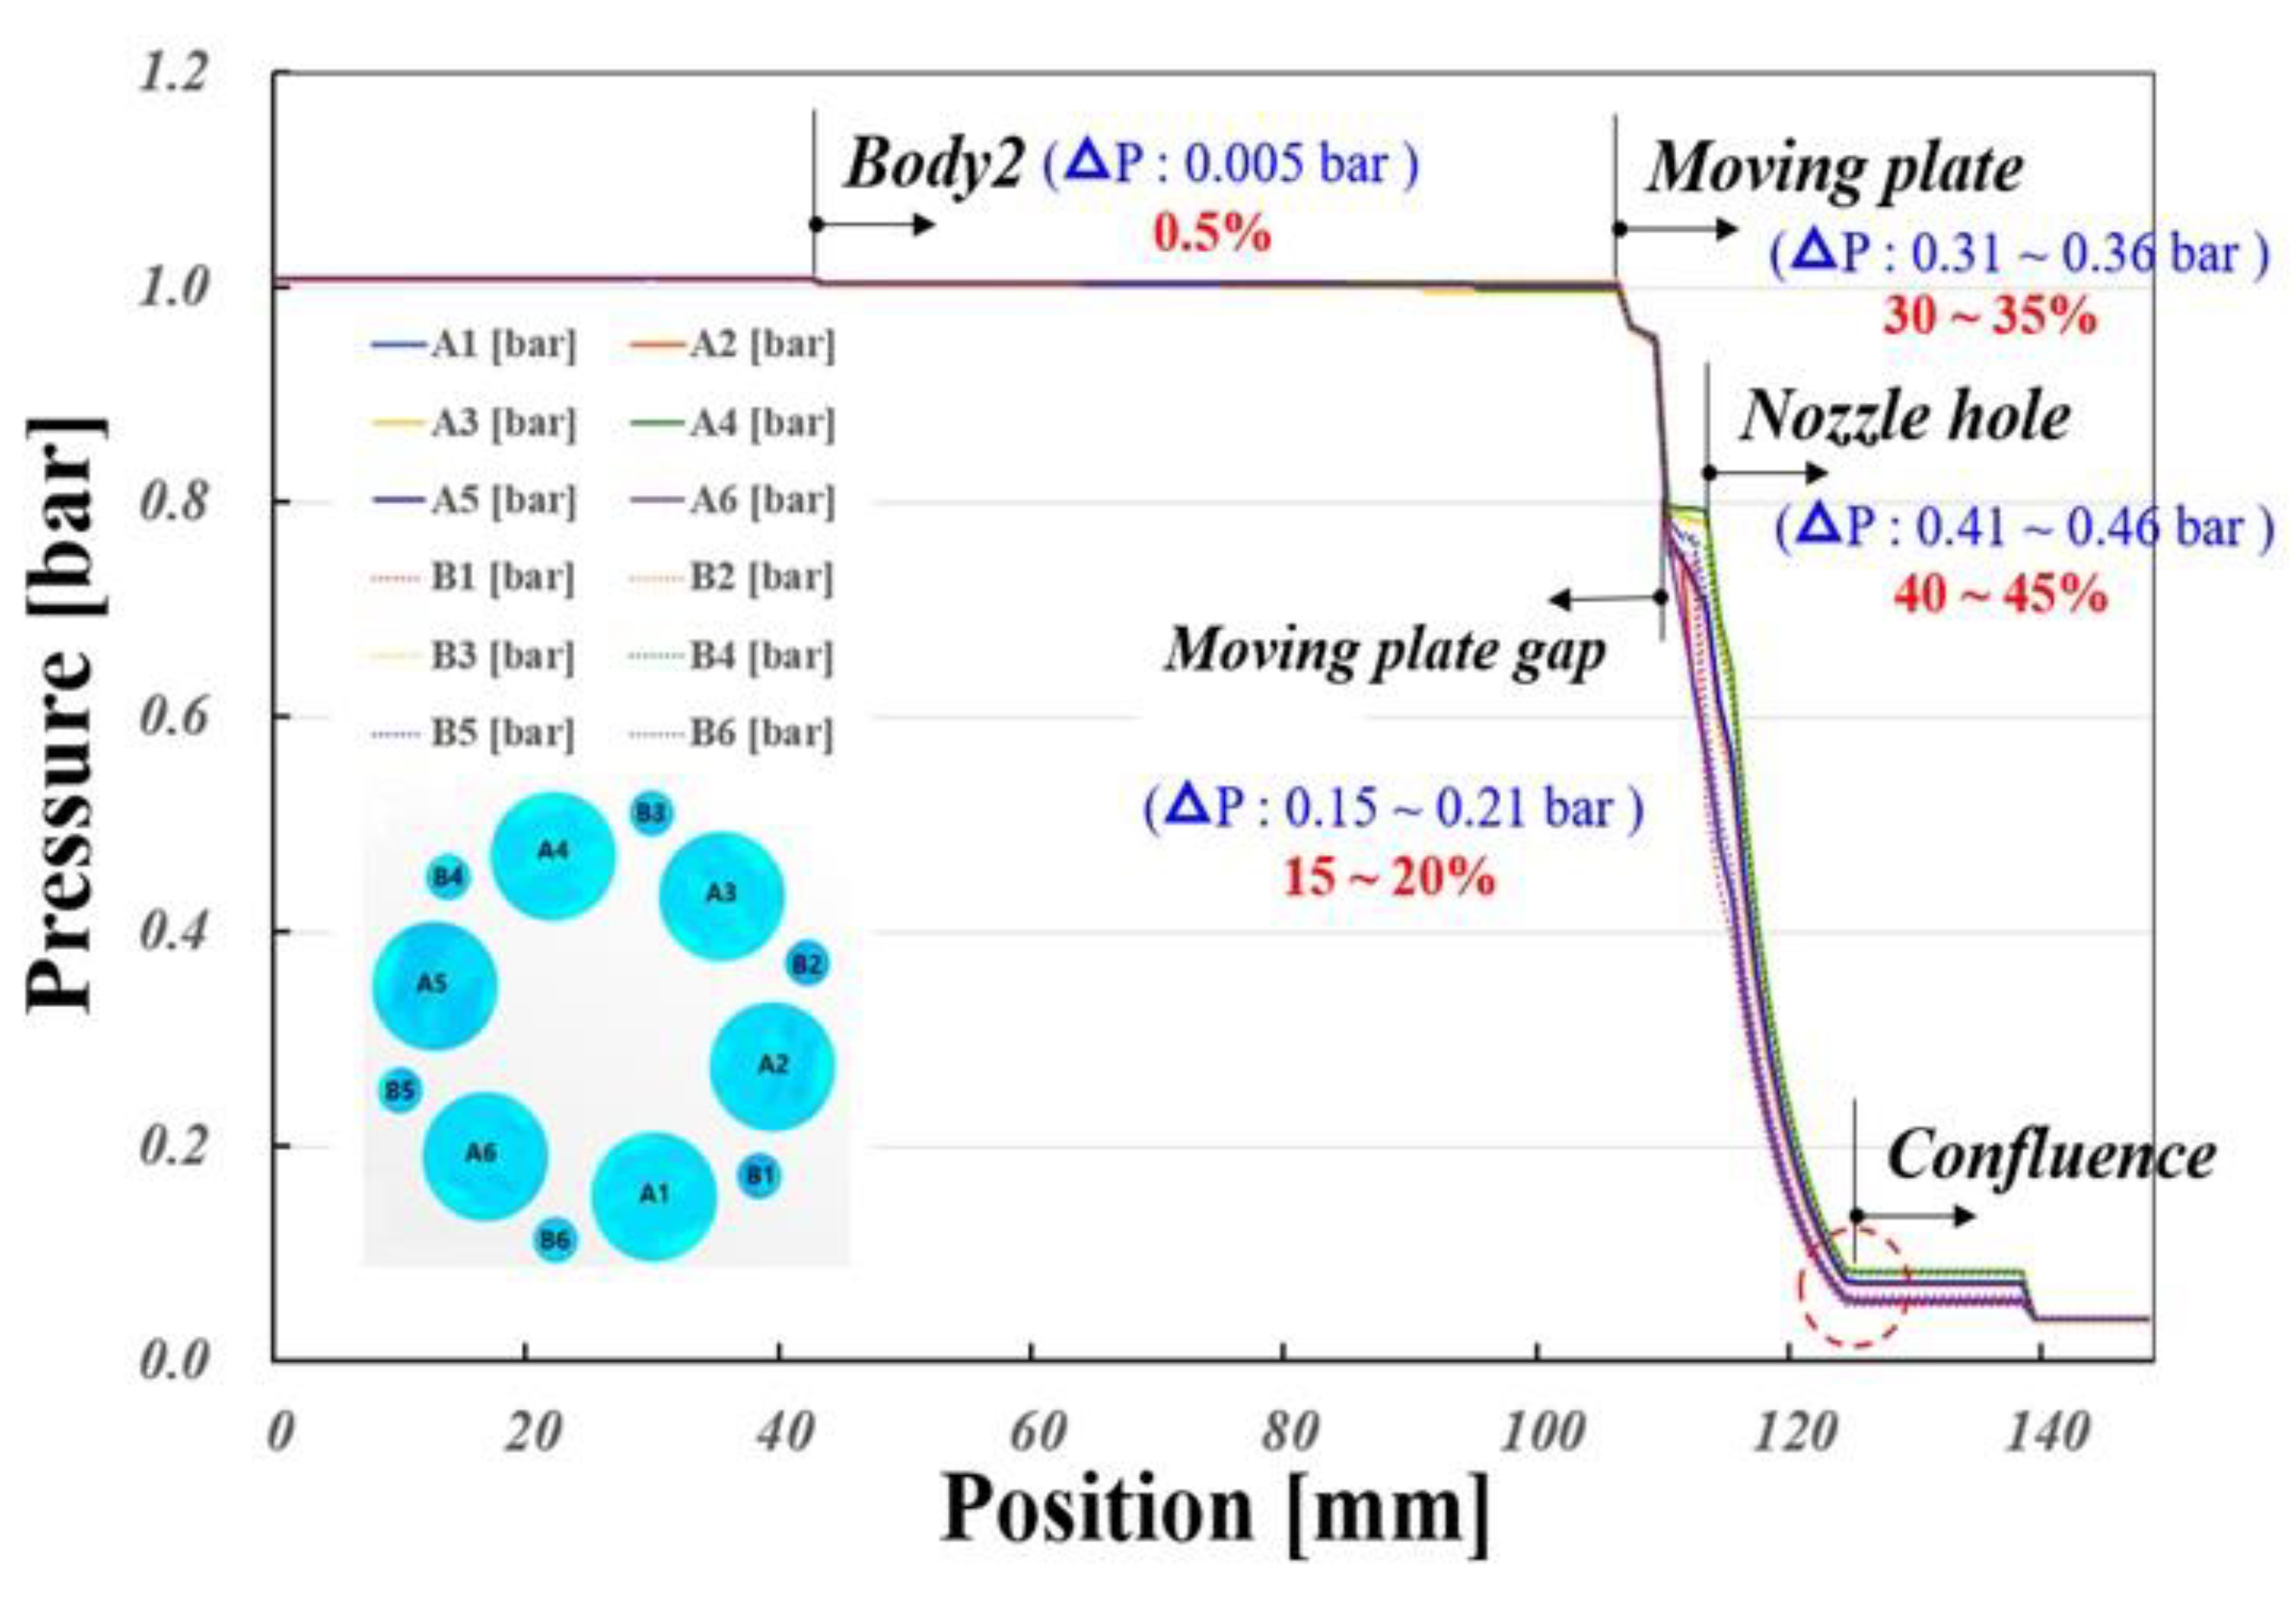
Figure 11 presents the average pressure along the axial direction for each cross-section, from Body 1 to the end of the outlet pipe, as indicated by the red box in the lower-right corner of Figure 9, for Cases 1 and 3. The pressure drops across each of the 12 orifice holes in the multi-hole restrictor are shown from the beginning of the moving plate gap to the confluence region. The results indicate that the pressure drop across the multi-hole restrictor accounts for 40–45% of the total pressure drop across the SOGAV, making it the most significant contributor. The next largest pressure drop, amounting to 30–35%, occurs as the flow passes through the moving plate. These findings highlight that, from a fluid dynamics perspective, the moving plate and the multi-hole restrictor are critical components in the design of the SOGAV.

3.2. Dynamic Transient Flow Characteristics of a SOGAV Under Various Operating Conditions

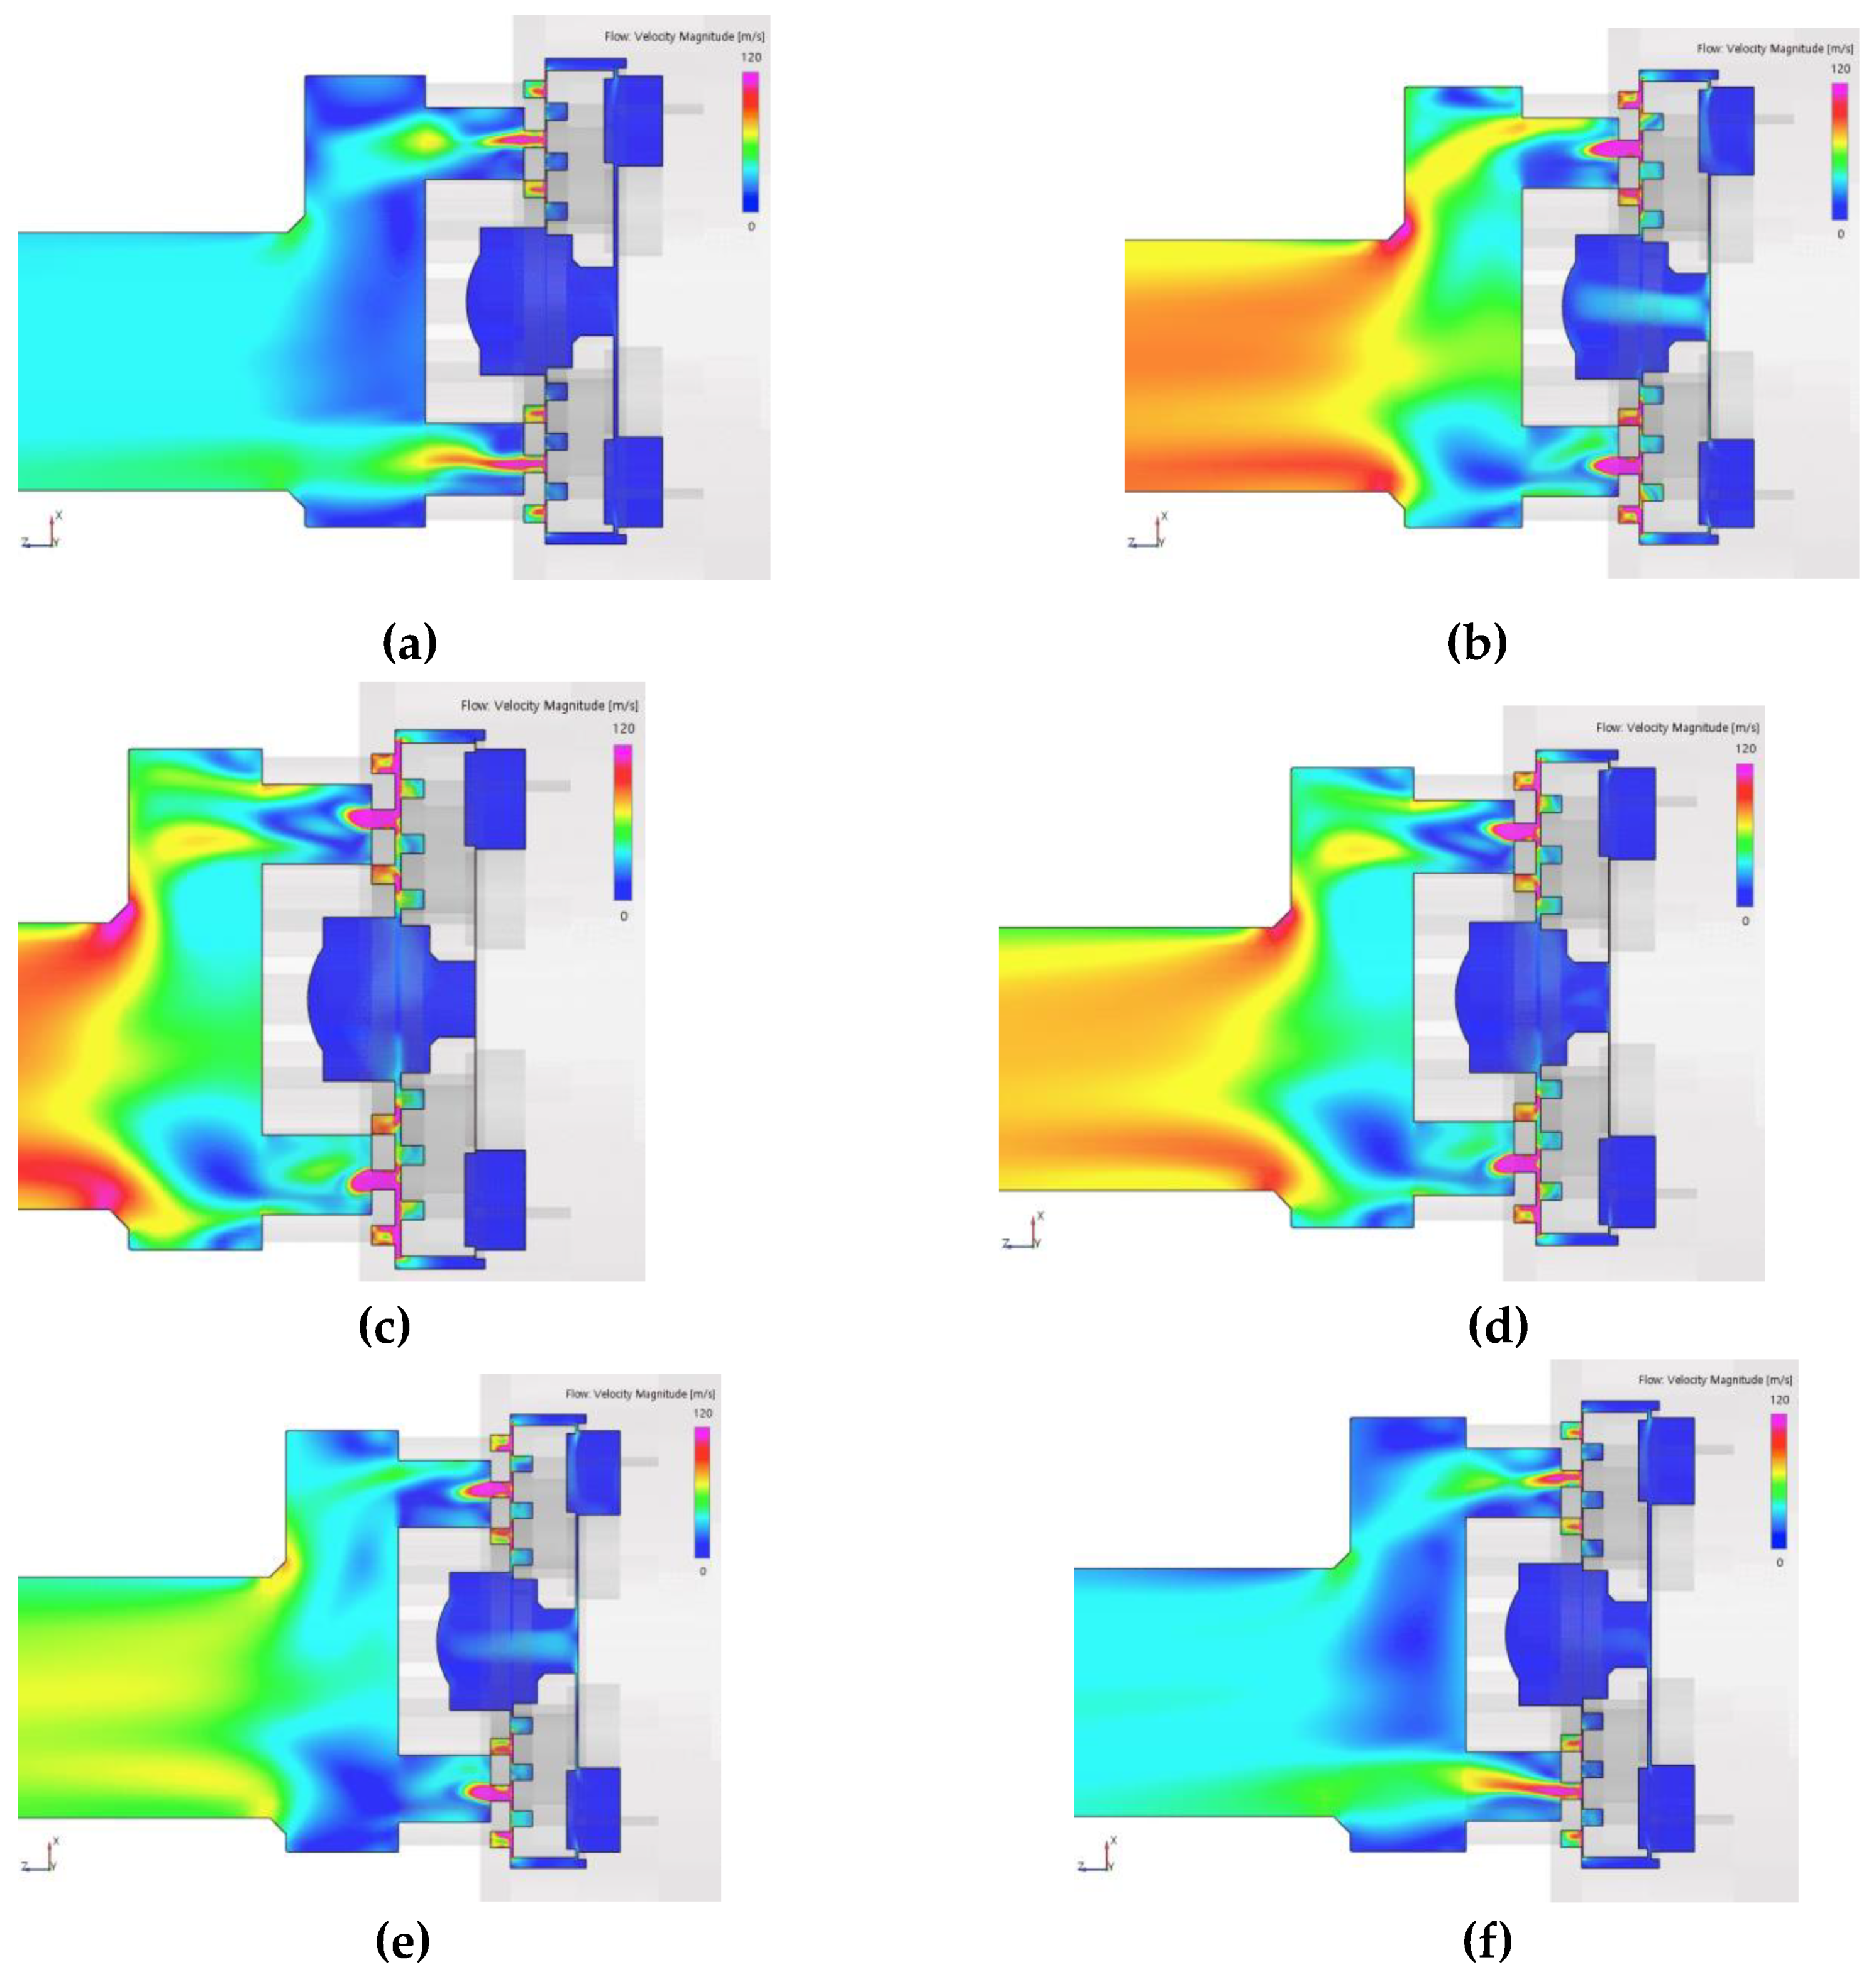
In systems with rapid movement of a moving plate, such as SOGAV, predicting the flow dynamics and time-dependent behavior associated with valve motion is crucial for ensuring valve efficiency, stability, and precise fluid control. Accordingly, dynamic transient analysis was performed under the operating conditions of Case 1 listed in Table 2, with the resulting velocity distributions at six valve lift positions shown in Figure 12 for cross-section A. The results clearly demonstrate that the transient analysis captures additional inertial effects caused by fluid responding to valve motion. Furthermore, the continuous changes in the velocity field, as described by the velocity field is constantly changing due to the valve’s movement, leading to transient flow patterns, can be observed. The velocity distribution is highly complex due to transient phenomena such as vortex shedding or flow oscillations that may occur, making the velocity distribution more complex.
In Figure 12(a), the valve is at 1/4 lift, representing the initial stage of the opening process. At this point, high-pressure gas flows through the narrow gap between the moving plate and the metering plate, exiting through the openings between the circular hoops of the metering plate in the form of a strong jet flow directed toward the multi-hole restrictor orifices. Hence, a highly non-uniform velocity distribution is observed. As shown in Figures 12(b) and 12(c), as the valve lift increases toward full lift, a greater volume of gas flows through the multi-hole restrictor orifices and mixes within the confluence region. This mixture exits the outlet pipe at higher velocities. The full valve lift state persists for a period until Point C, where the velocity distribution is depicted in Figure 12(d). A key observation here is that, compared to the steady-state results in Figure 9(a), a significantly higher velocity is observed in the outlet pipe. This outcome highlights the impact of inertia and momentum effects from the rapid motion of the moving plate, allowing the gas to enter at very high speeds—an effect that steady-state analysis fails to capture. From these results, it is evident that steady-state CFD analysis cannot predict the acceleration and deceleration of the fluid caused by the moving plate's motion. Thus, dynamic transient analysis is essential for accurately capturing flow overshoots and unsteady velocity distributions that occur during the opening and closing processes. As the closing process progresses, the incoming velocity of fluids through orifices of multi-hole restrictor decreases, leading to fluid deceleration, and a rapid drop in outlet velocity is clearly visible in Figures 12(e) and 12(f).
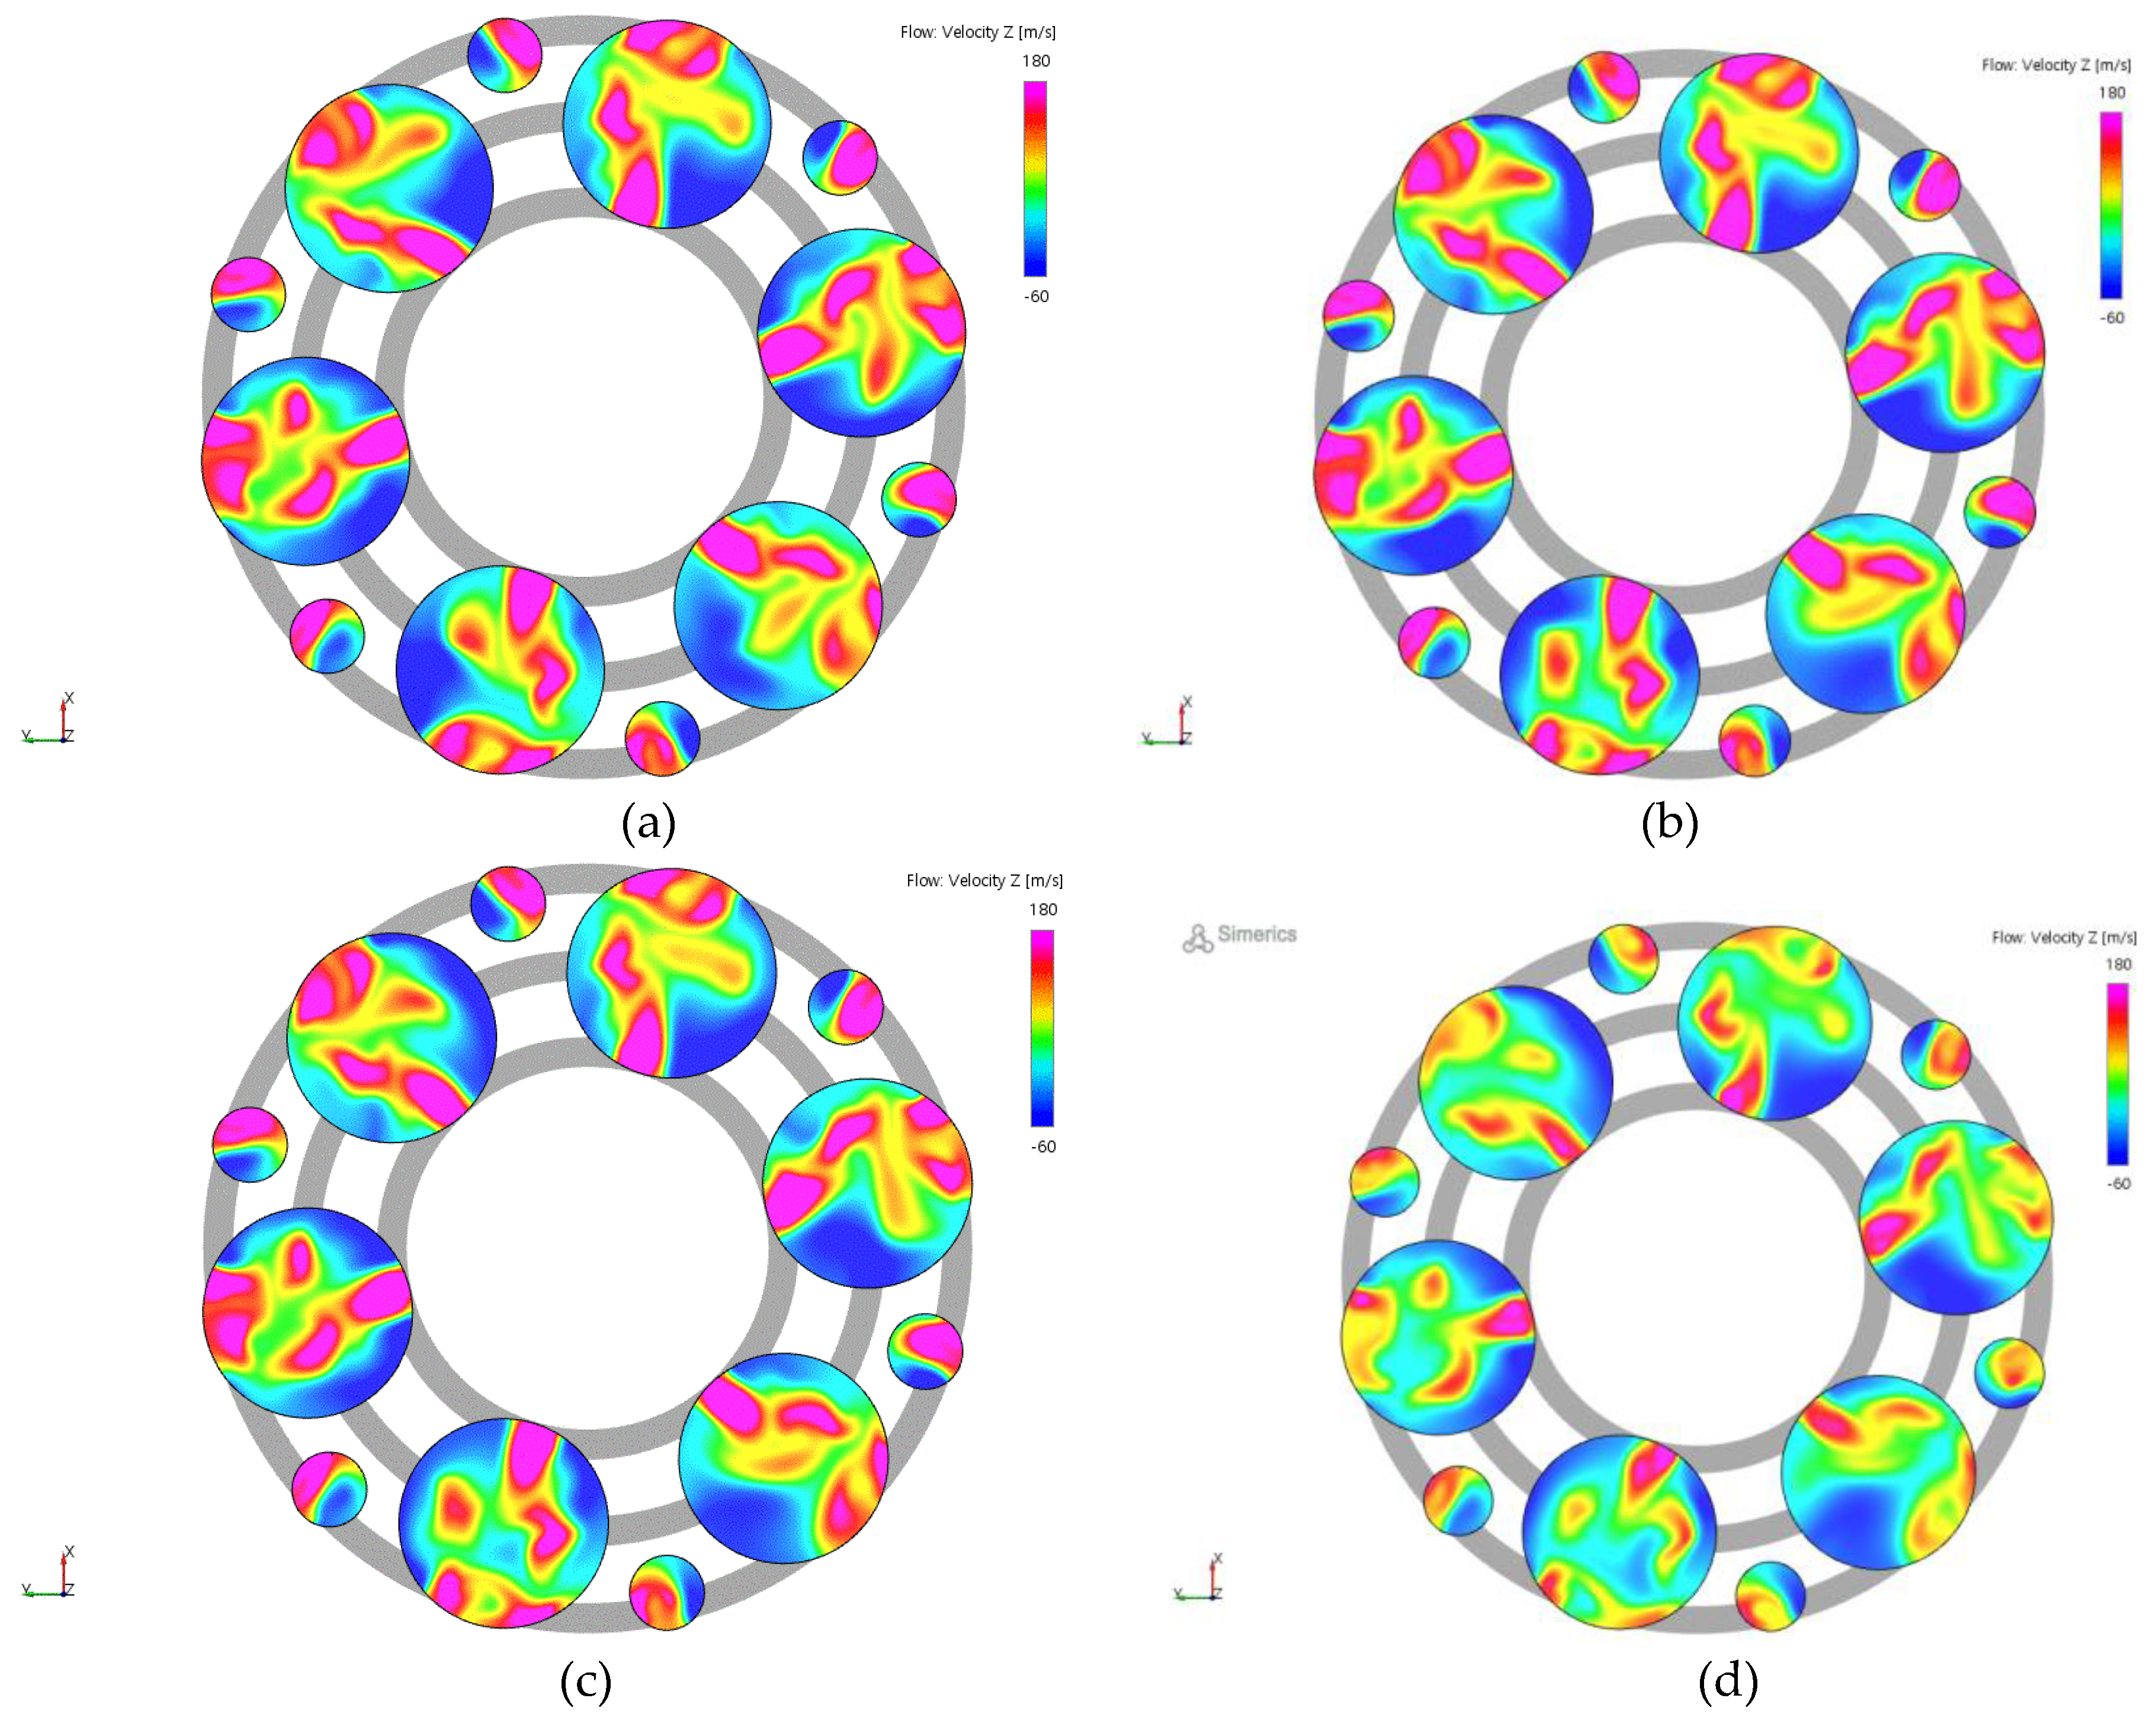
Figure 13 presents the velocity distribution at cross-section B as a function of the moving plate’s lift variations. For clarity, the flow cross-sectional areas through which the gas enters from the metering plate are highlighted in gray and overlaid in the background. Specifically, the gray regions between the white rings represent the flow cross-sectional areas through which the fluid flows into the orifices of the multi-hole restrictor.
The inlets of the orifices within the multi-hole restrictor correspond to the gray rings indicated in Figure 13, through which high-pressure gas penetrates. As observed from the figure, the velocity distribution inside the orifices is highly non-uniform. This non-uniformity arises because the gas only enters through a portion of the orifice inlet area. Consequently, reverse flow occurs in the regions marked in blue contours. Due to this effect, the velocity uniformity at the orifice cross-section remains highly uneven, regardless of the moving plate's lift position. However, the gas streams passing through individual orifices converge downstream in the confluence region, where they are thoroughly mixed before exiting through the outlet pipe. As a result, high flow uniformity is achieved at the outlet cross-section.
Table 5 presents the time-averaged velocity and velocity uniformity at the outlet for one complete cycle, as calculated for the operating conditions listed in Table 2. In terms of outlet flow uniformity, the steady-state case shown in Figure 9 achieves more than 90% uniformity, whereas the dynamic transient simulation shows uniformity levels in the 80% range. This discrepancy arises due to the rapid acceleration and deceleration occurring during the opening and closing phases of the moving plate, which leads to abrupt pressure fluctuations and changes in flow direction.
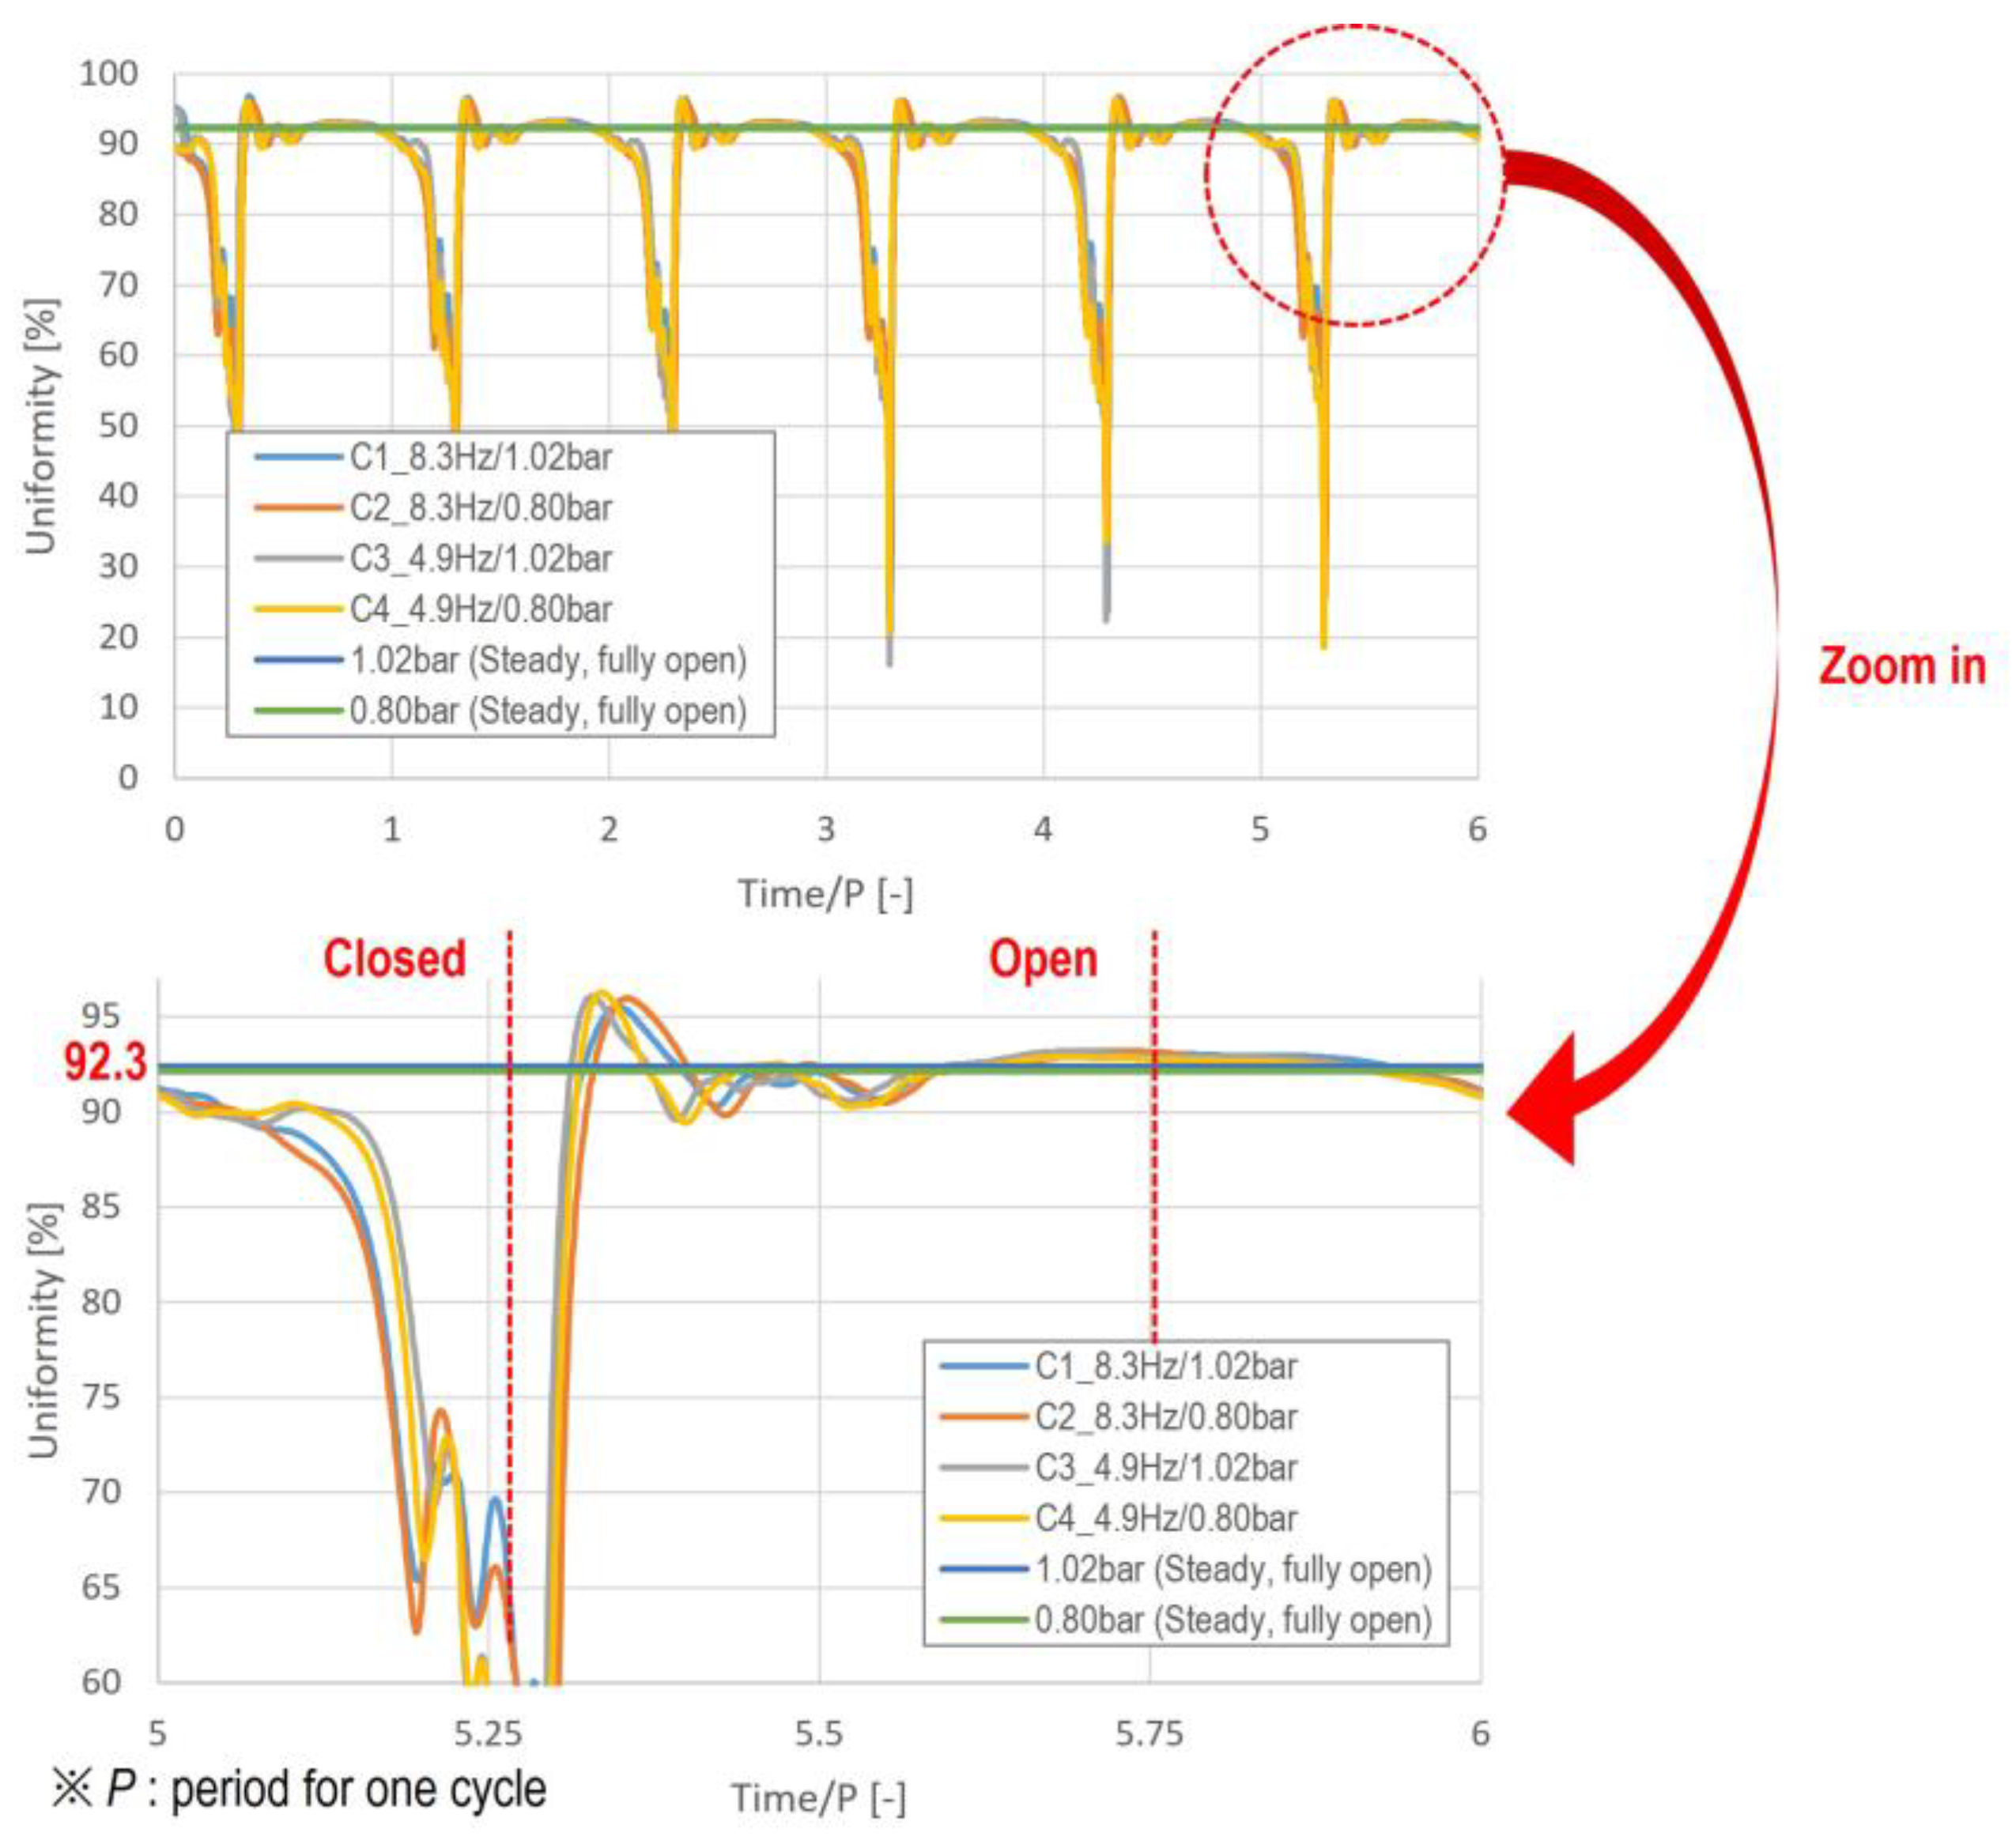
Figure 14 illustrates the flow uniformity at the outlet over six cycles for each operating condition. A noticeable sharp drop in uniformity is observed during each cycle. A closer look at the sixth cycle, shown in the zoomed view, reveals that the temporary flow deceleration occurring during the closing process results in a significant reduction in uniformity. These results underscore the importance of accounting for inertia effects of the fluid and insufficient flow adaptation time caused by the moving plate’s motion. Therefore, employing dynamic CFD simulations that capture fluctuating velocity and pressure is essential for achieving accurate optimization during the design of SOGAV systems.
The rapid axial movement of the moving plate generates compression waves inside the valve, which propagate toward the inlet and outlet at the speed of sound and reach the end of the pipe. Since the pipe terminates at an open end exposed to the atmosphere, the incident pressure wave reflects with reversed polarity and travels back upstream. This reflection causes a 180-degree phase shift, leading to destructive interference. Meanwhile, the vibration of the moving plate continuously generates compression waves, which propagate downstream, resulting in complex wave interactions and reflections with the reflected pressure waves. Figure 15 shows the pressure pulsations at a mid-point of the outlet pipe cross-section, plotted alongside the moving plate’s lift curve. The results indicate that the shape of the pressure waves is more significantly influenced by the vibration frequency of the plate and the lift curve profile than by the pressure difference between the inlet and outlet. A key observation is that a rarefaction wave reaches the outlet just as the moving plate closes. In this scenario, the negative pressure from the rarefaction wave causes backflow of gas inside the pipe. The fact that this rarefaction wave arrives precisely at the closing moment suggests that the diameter and length of the outlet pipe connected to the SOGAV system have been appropriately tuned for optimal performance. Another significant observation is that strong compression waves form immediately after the valve closes, causing surging, as confirmed by the simulation results. Following the valve’s closure, pressure waves reflect between the closed and open ends of the system, generating interference patterns. Over time, friction within the pipe dissipates the wave energy, gradually reducing the amplitude until the waves completely diminish.
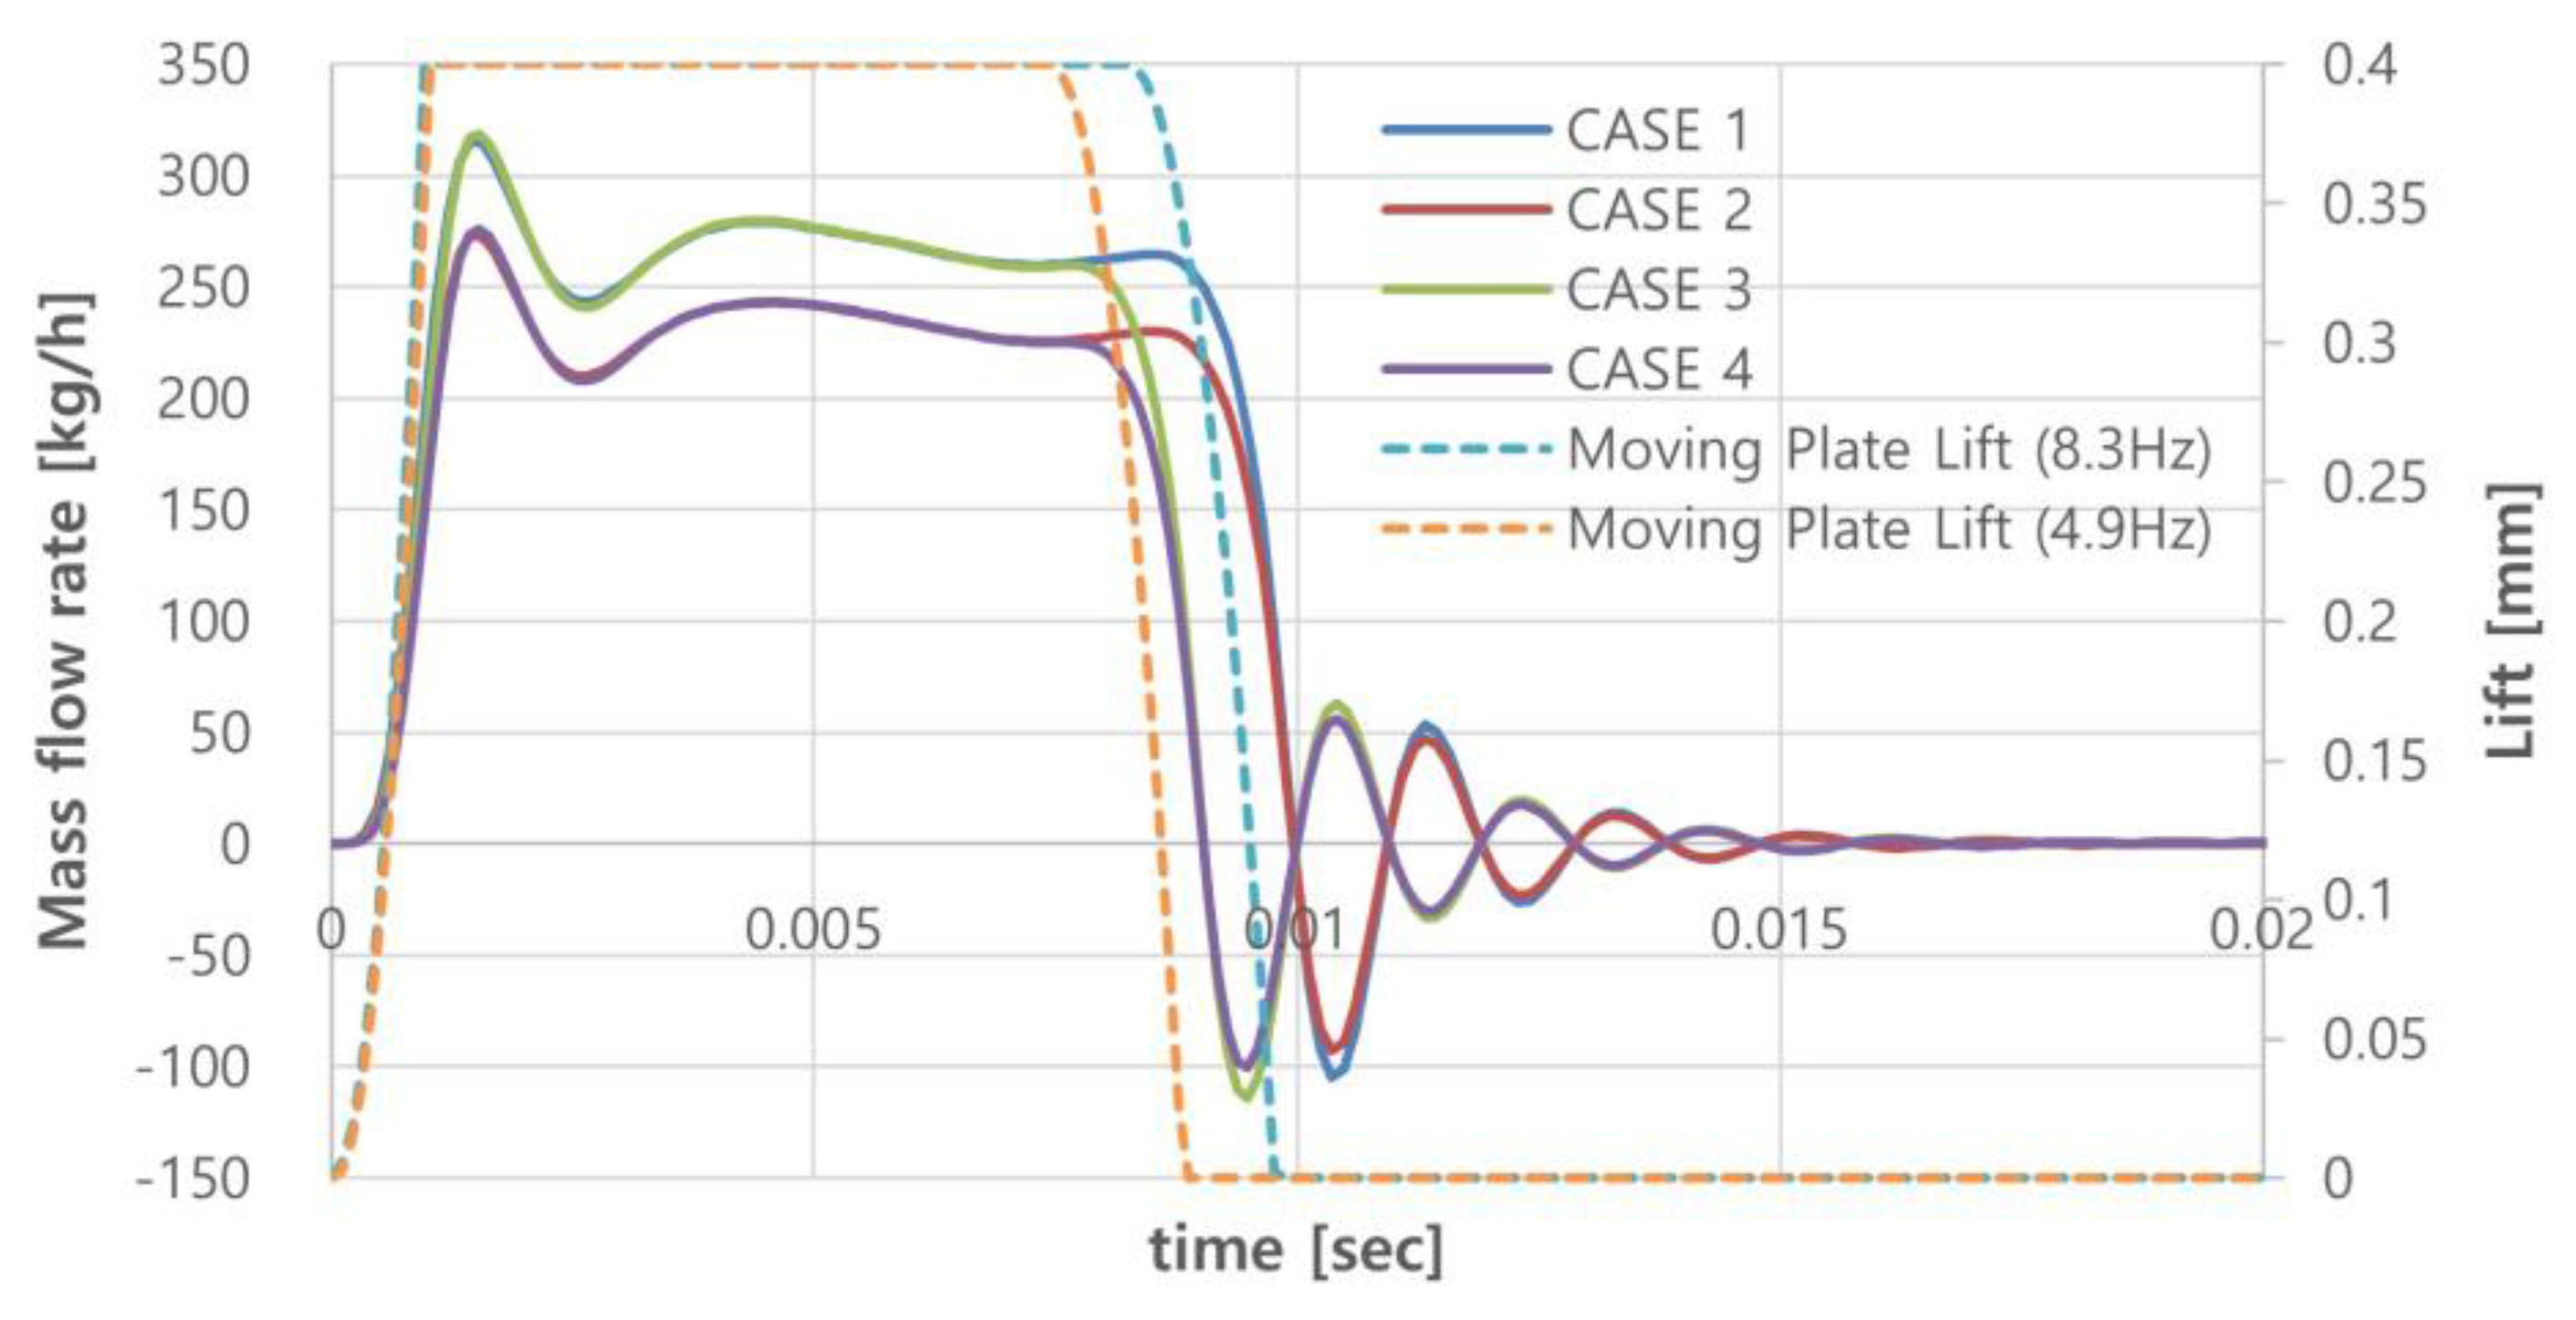
Figure 16 presents the variation in mass flow rate at the outlet for different operating conditions as a function of the moving plate's lift changes. Although the pressure difference between the inlet and outlet contributes to an increase in the outflow during the opening period, it has limited influence on the temporal profile of the mass flow rate variation curve. The dominant factors influencing the shape of the mass flow rate curve are the frequency and the lift curve profile. A key observation from the results is that backflow occurs immediately after the valve closes under all operating conditions. As explained in Figure 15, this backflow results from the arrival of a rarefaction wave reflected from the open end at the outlet at this point in time. These findings indicate that the reflection and interference behavior of pressure waves, caused by the rapid movement of the moving plate, significantly impact the outflow characteristics. Therefore, the dynamic pressure wave action is closely related to the flow control performance of the SOGAV system.

3.3. Dynamic Transient CFD Simulation for the Shape Optimization of a Moving Plate

The multi-hole restrictor is a critical component in the design of SOGAV systems, especially in conjunction with the moving plate. Unlike a single large opening, a multi-hole restrictor contains multiple small orifices that help to distribute the flow more evenly and reduce fluid velocity. Additionally, by forcing the fluid to pass through small, restricted openings, the multi-hole restrictor induces a significant pressure drop while also reducing turbulence and stabilizing the flow. This feature is advantageous in applications where precise control of pressure and flow rate is essential. Furthermore, the multi-hole restrictor plays a role in the reduction of turbulence-induced low-frequency noise, as aerodynamic noise in valves is primarily generated by turbulent flow, leading to the occurrence of low-frequency noise. Adjusting the peak sound frequency to a higher range can often be achieved through minor design modifications to the valve trim or the internal flow path. For example, incorporating multiple smaller holes or serrated edges can have a considerable impact on noise characteristics without significantly altering the valve’s overall structure or functionality. Therefore, the size and arrangement of the holes in the multi-hole restrictor, including configurations with different diameters, are closely related not only to the fluid dynamic performance of the SOGAV but also to its aerodynamic noise reduction capabilities. However, since aerodynamic noise reduction lies beyond the scope of this study, the focus here is limited to analyzing the dynamic transient fluid behavior across three variations of orifice geometries, as illustrated in Figure 7.
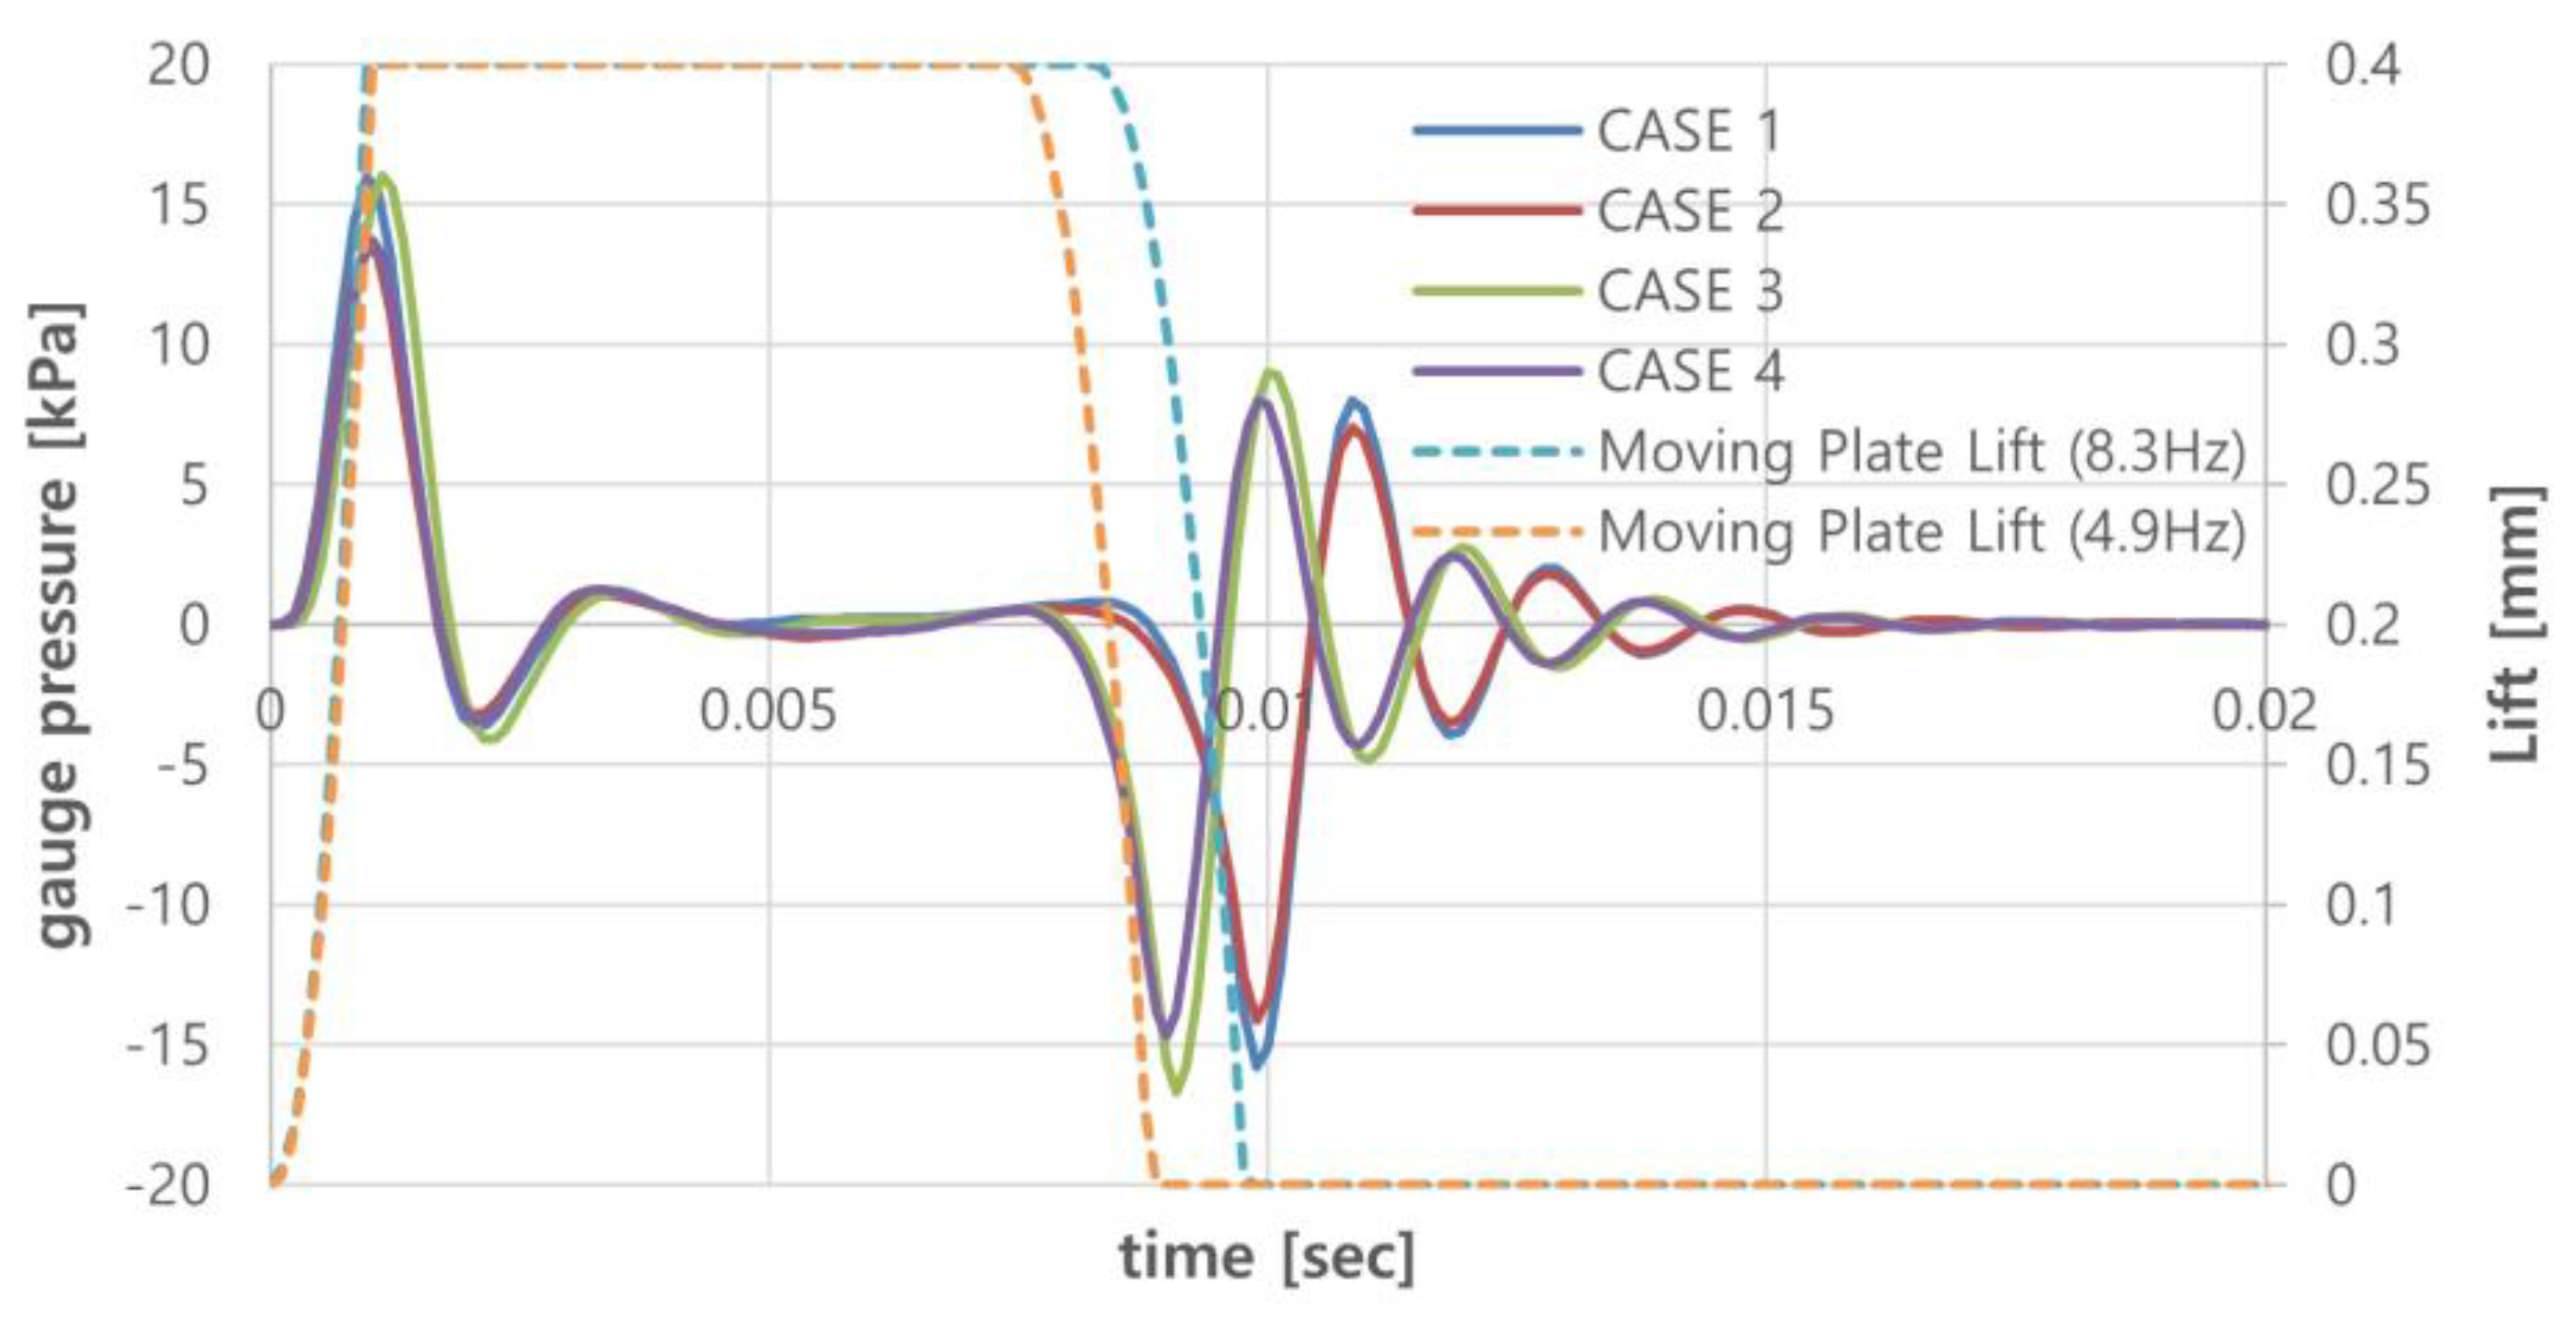
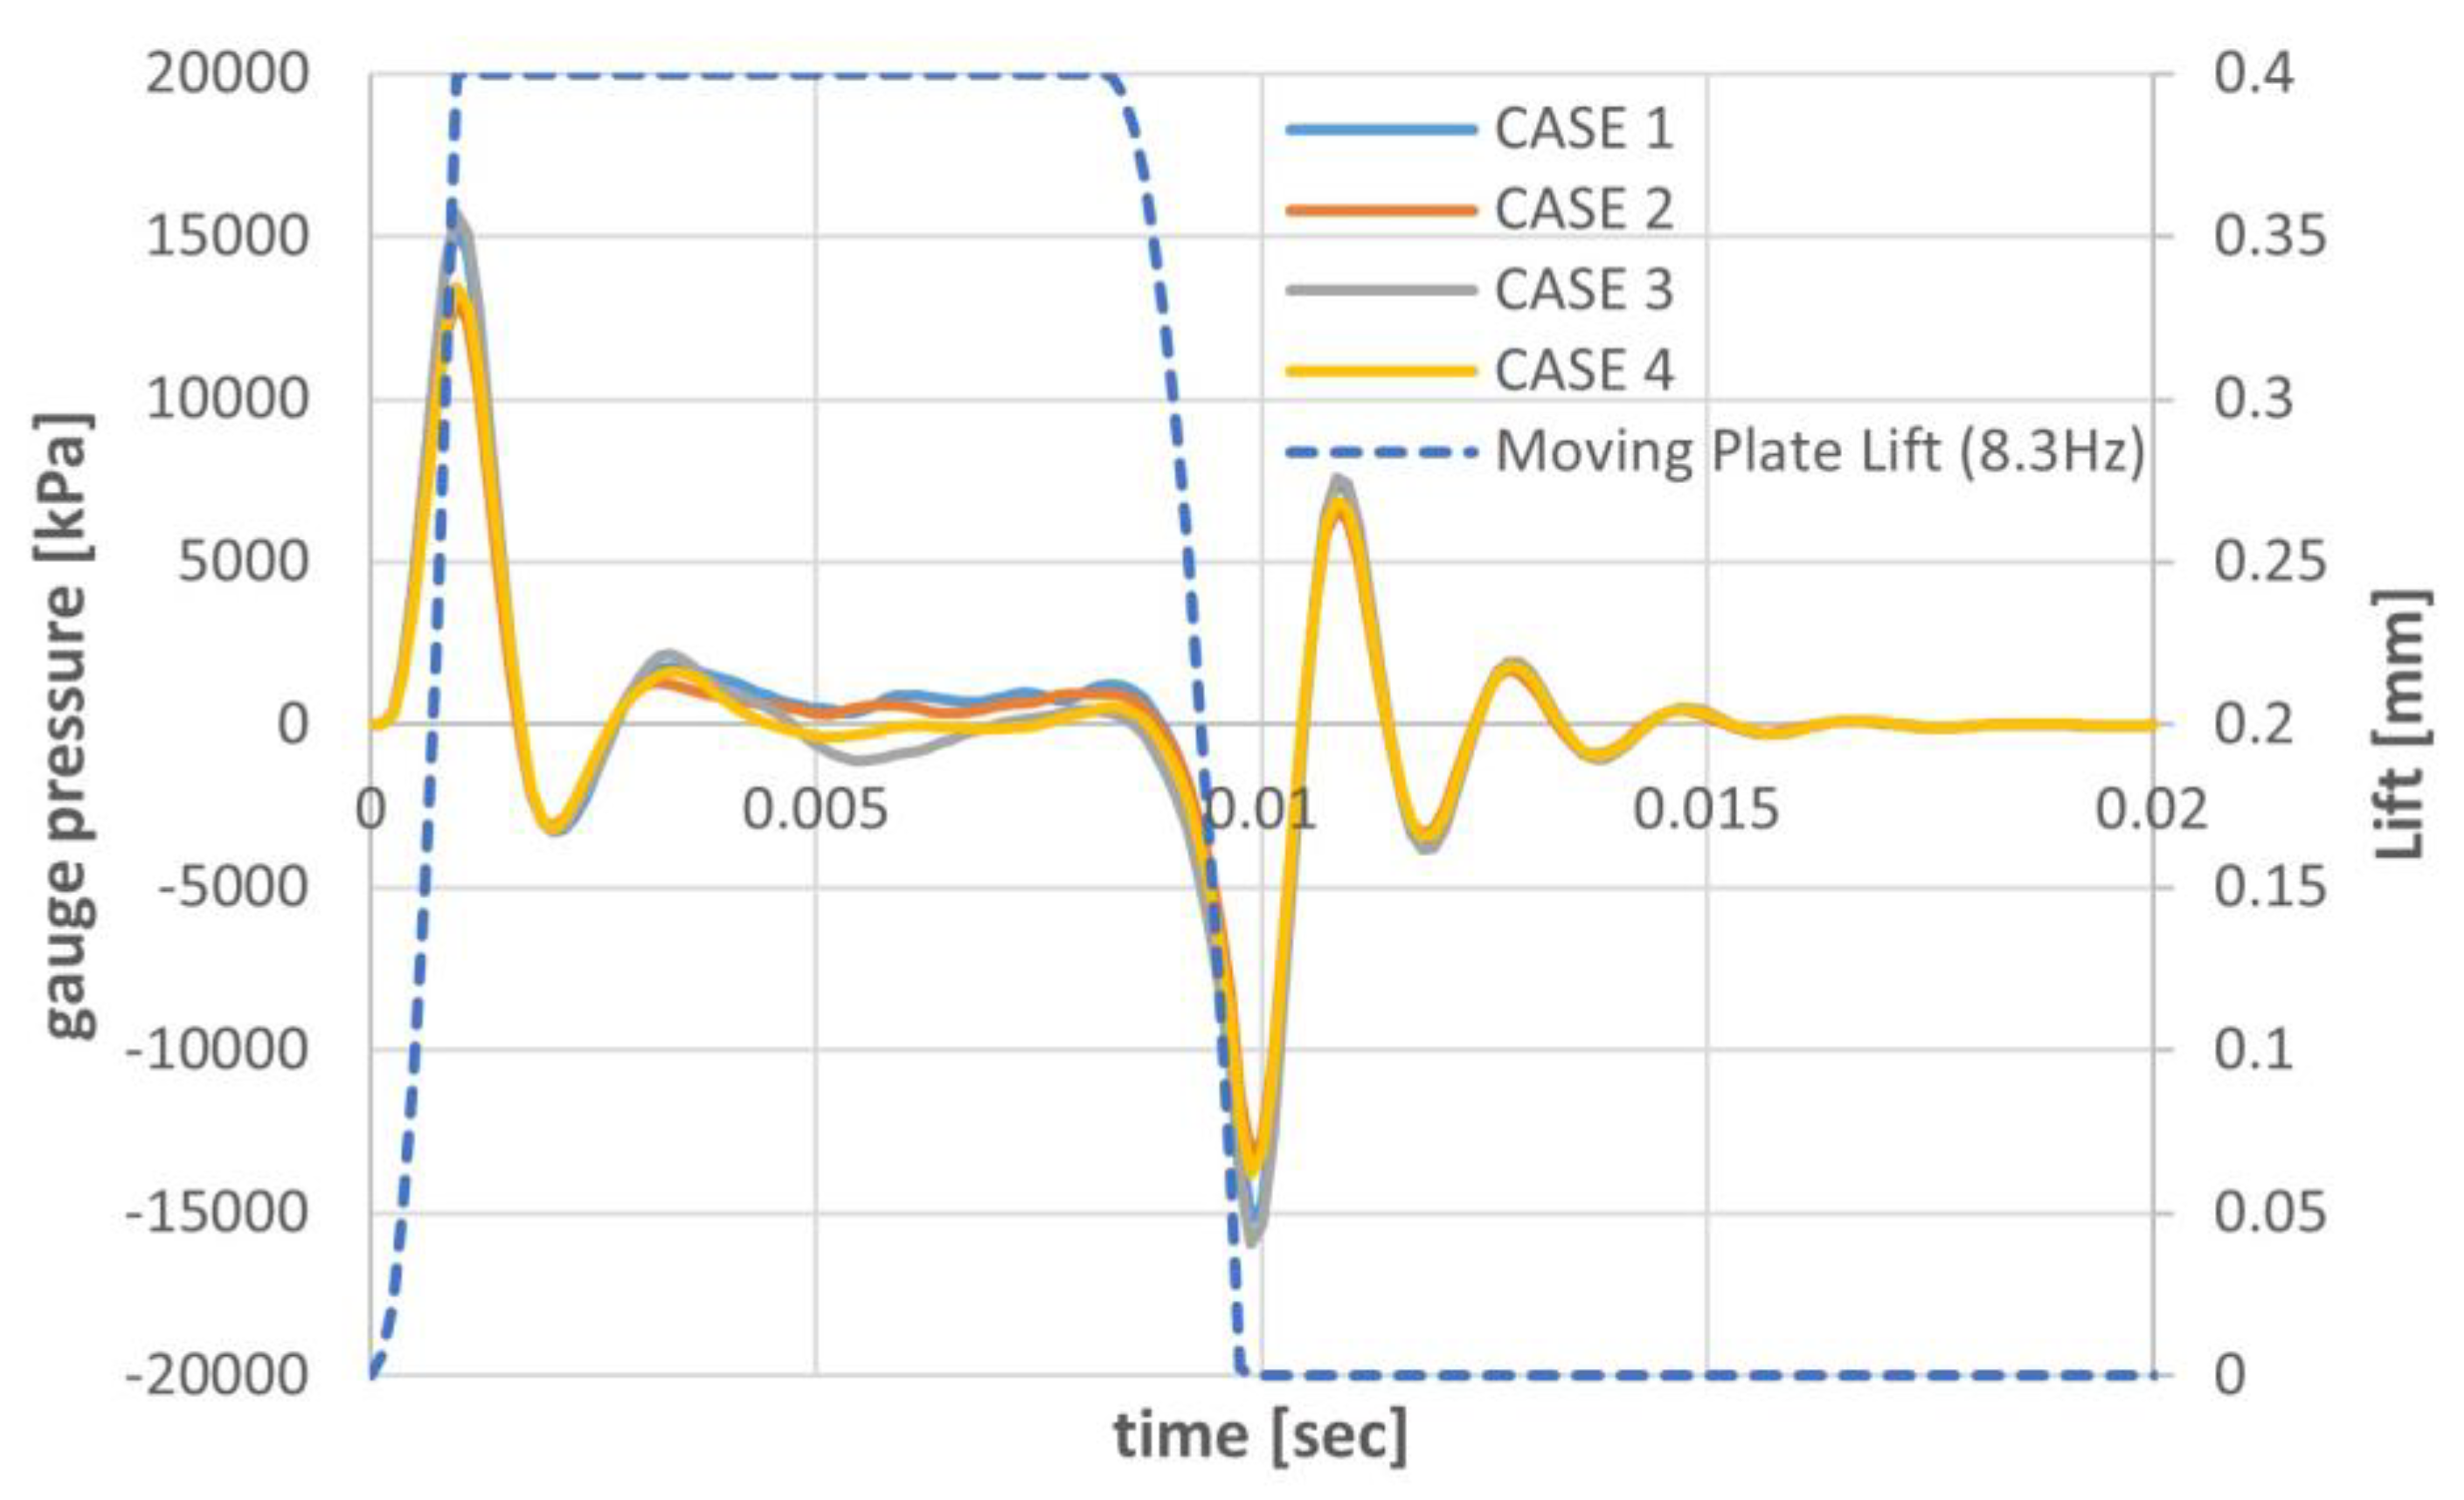
In this study, simulations were conducted for a total of four cases, as summarized in Table 3, based on the geometries presented in Figure 7. Figure 17 illustrates the behavior of the pressure wave at the midpoint of the outlet pipe for these four cases. The results of this study reveals that the overall shape of the pressure wave remains largely unchanged across different orifice geometries. However, the amplitude of the pressure wave varies significantly, depending on the pressure difference between the inlet and outlet.
Additionally, during the full lift phase of the moving plate, slight pressure fluctuations were observed, varying with the orifice geometry.
Additionally, slight variations in the pressure waveforms during the full-lift phase can be observed across the different cases. These differences arise from the changes in turbulent flow characteristics caused by the modifications to the orifice geometry of the multi-hole restrictor, which significantly impact the interaction between turbulent flow and pressure waves within valves. This interaction plays a crucial role in the generation, propagation, and attenuation of pressure waves. Moreover, the phenomenon that the interaction between the reflected and incident waves can lead to constructive or destructive interference, further influencing the dynamic behavior of the pressure waves, contributes to the subtle changes in the complex pressure wave profiles observed, as shown in Figure 17. These intricate variations highlight the sensitivity of the pressure wave behavior to even small modifications in the orifice geometry
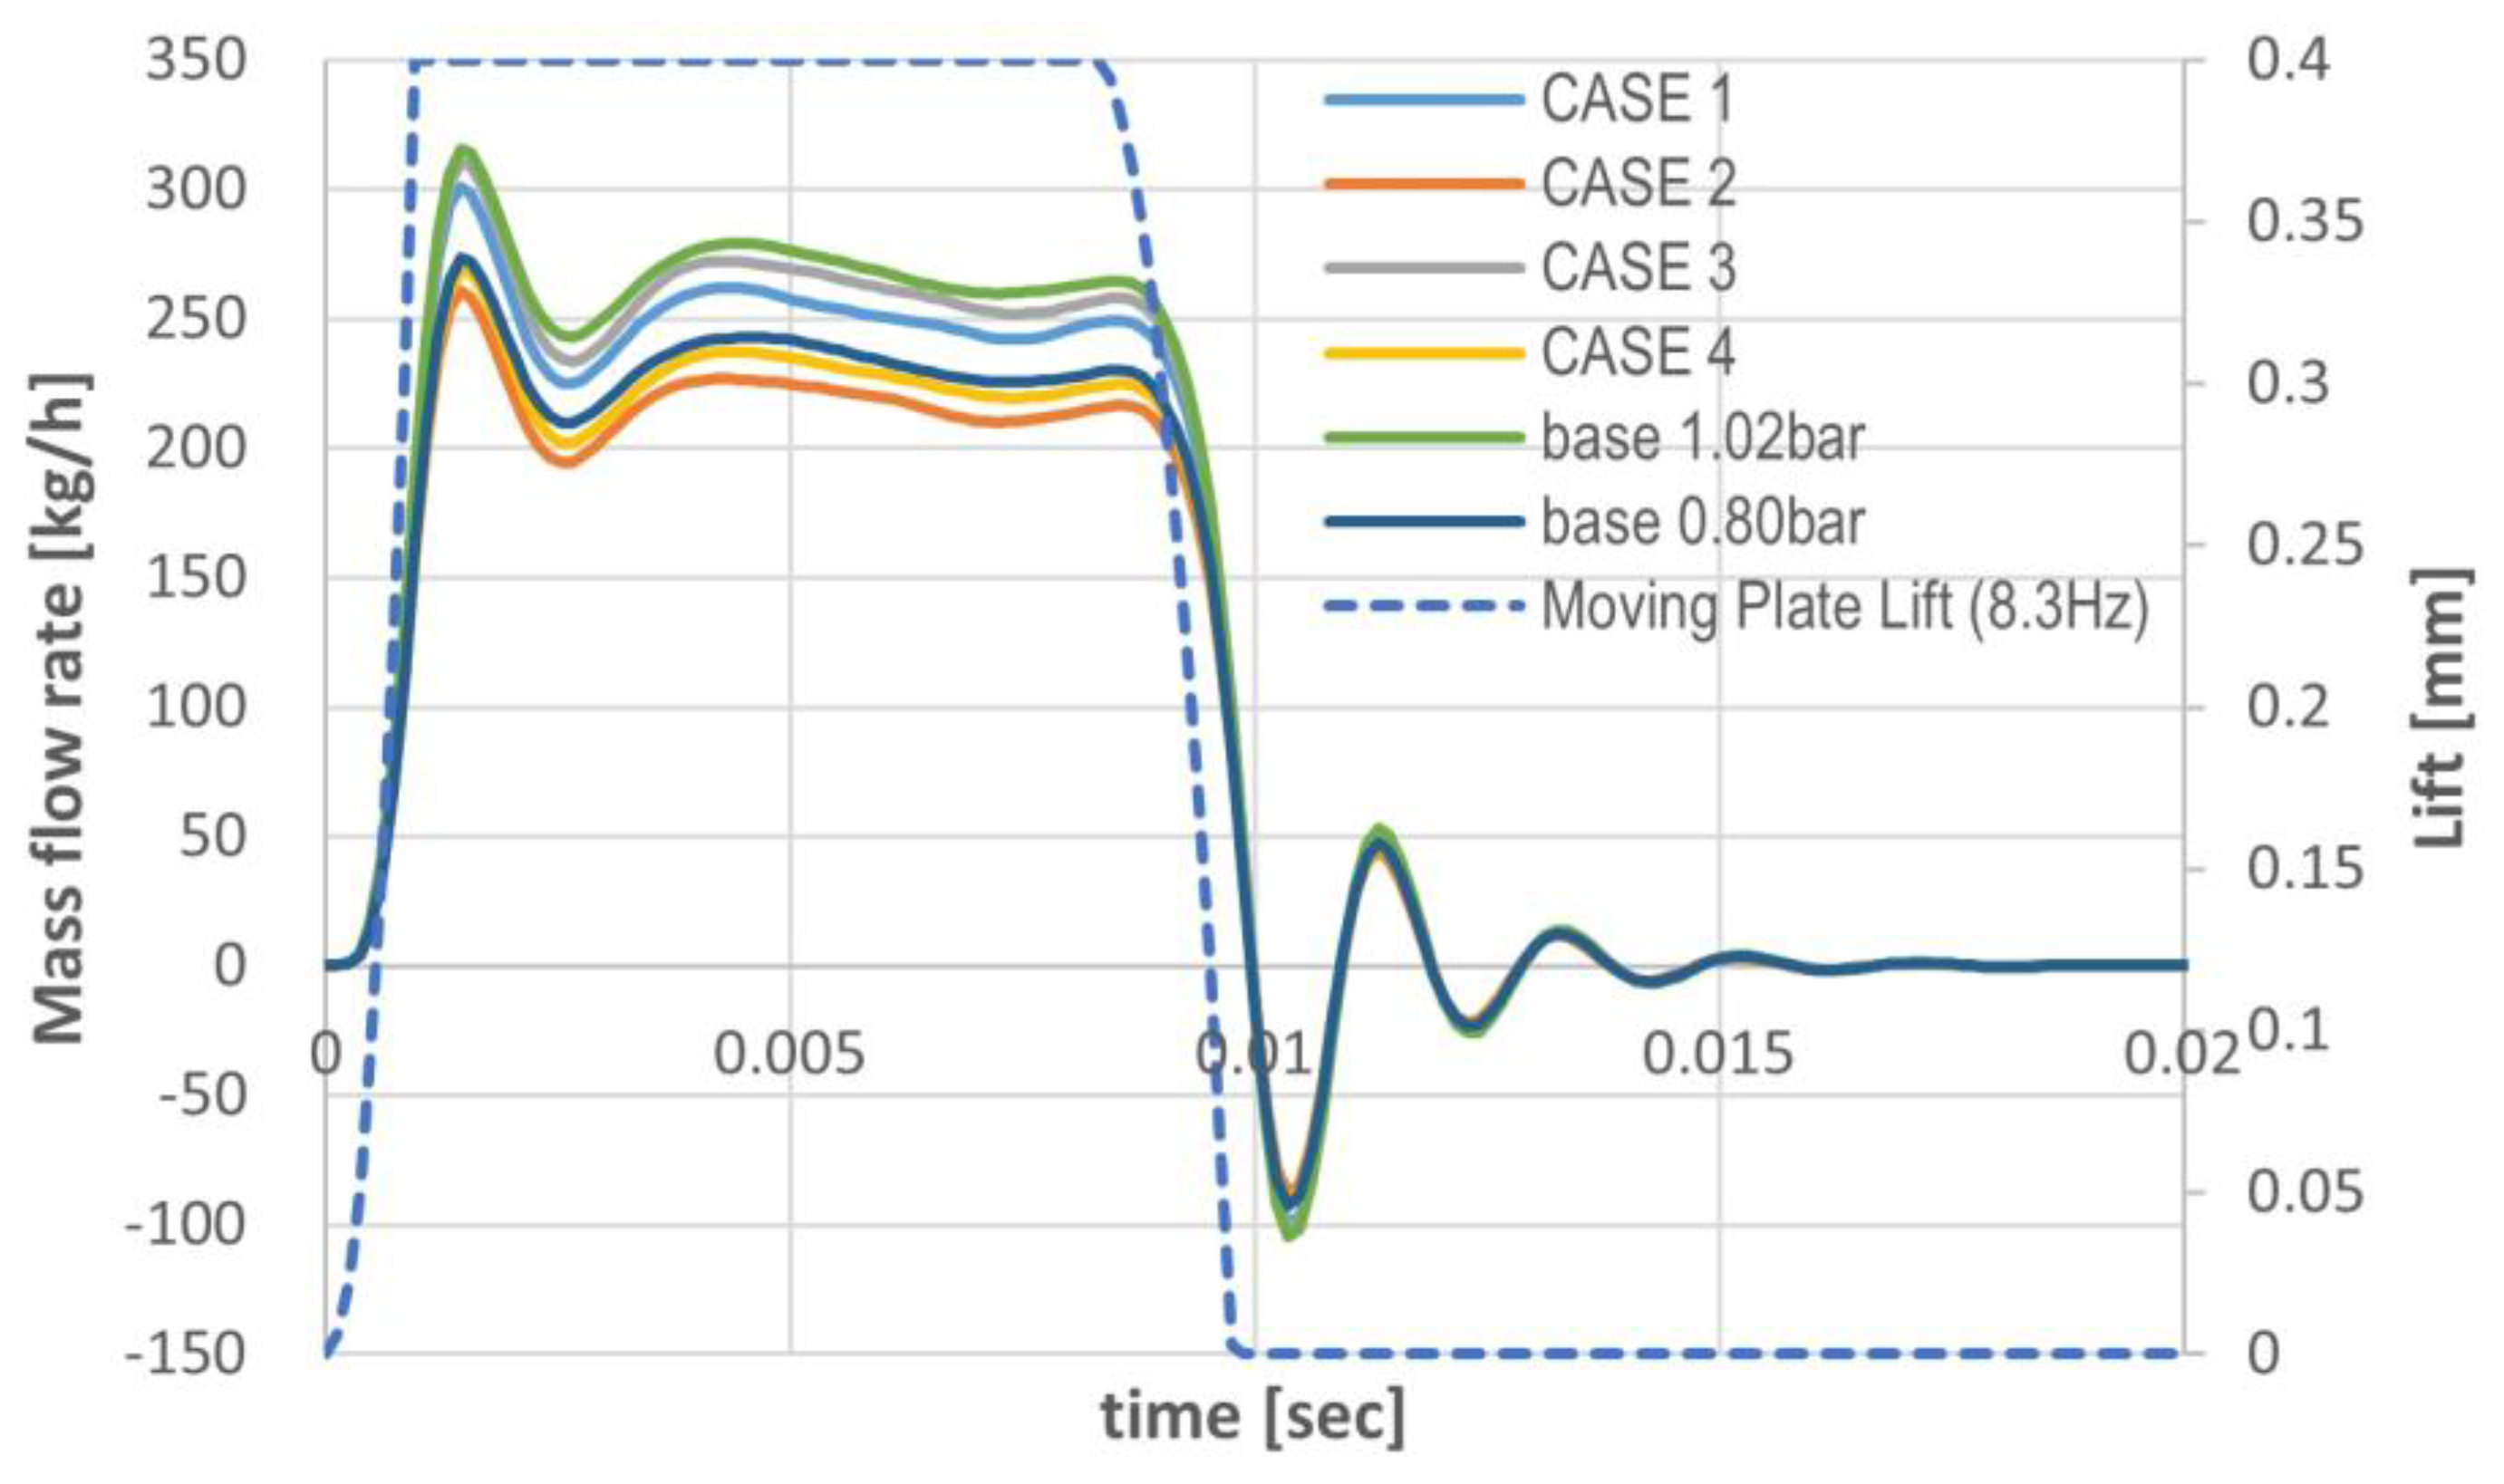
Figure 18 presents the mass flow rate at the outlet surface of the pipe as a function of the moving plate’s lift for the base model and two different geometric configurations. The results indicate that Cases 3 and 4, which have the smallest total flow cross-sectional area among the designs, exhibit the lowest outlet mass flow rates during full lift period.
An important observation emerges when comparing the base model with Cases 1 and 2, which have identical total flow areas: the base model achieves a slightly higher outlet mass flow rate during full lift period. This result can be attributed to the arrangement of large and small holes in the base model, which promotes more uniform flow distribution. Additionally, the configuration helps reduce fluid velocity, thereby lowering the overall flow resistance. The findings from Figure 18 confirm that a multi-hole restrictor with different-sized holes can achieve more uniform flow distribution and effectively disrupt large, coherent turbulent structures, which are primary contributors to low-frequency aerodynamic noise and flow resistance. In contrast, multi-hole restrictors with identical-sized holes tend to generate more coherent turbulent structures and produce stronger jets from individual holes, resulting in higher flow resistance.
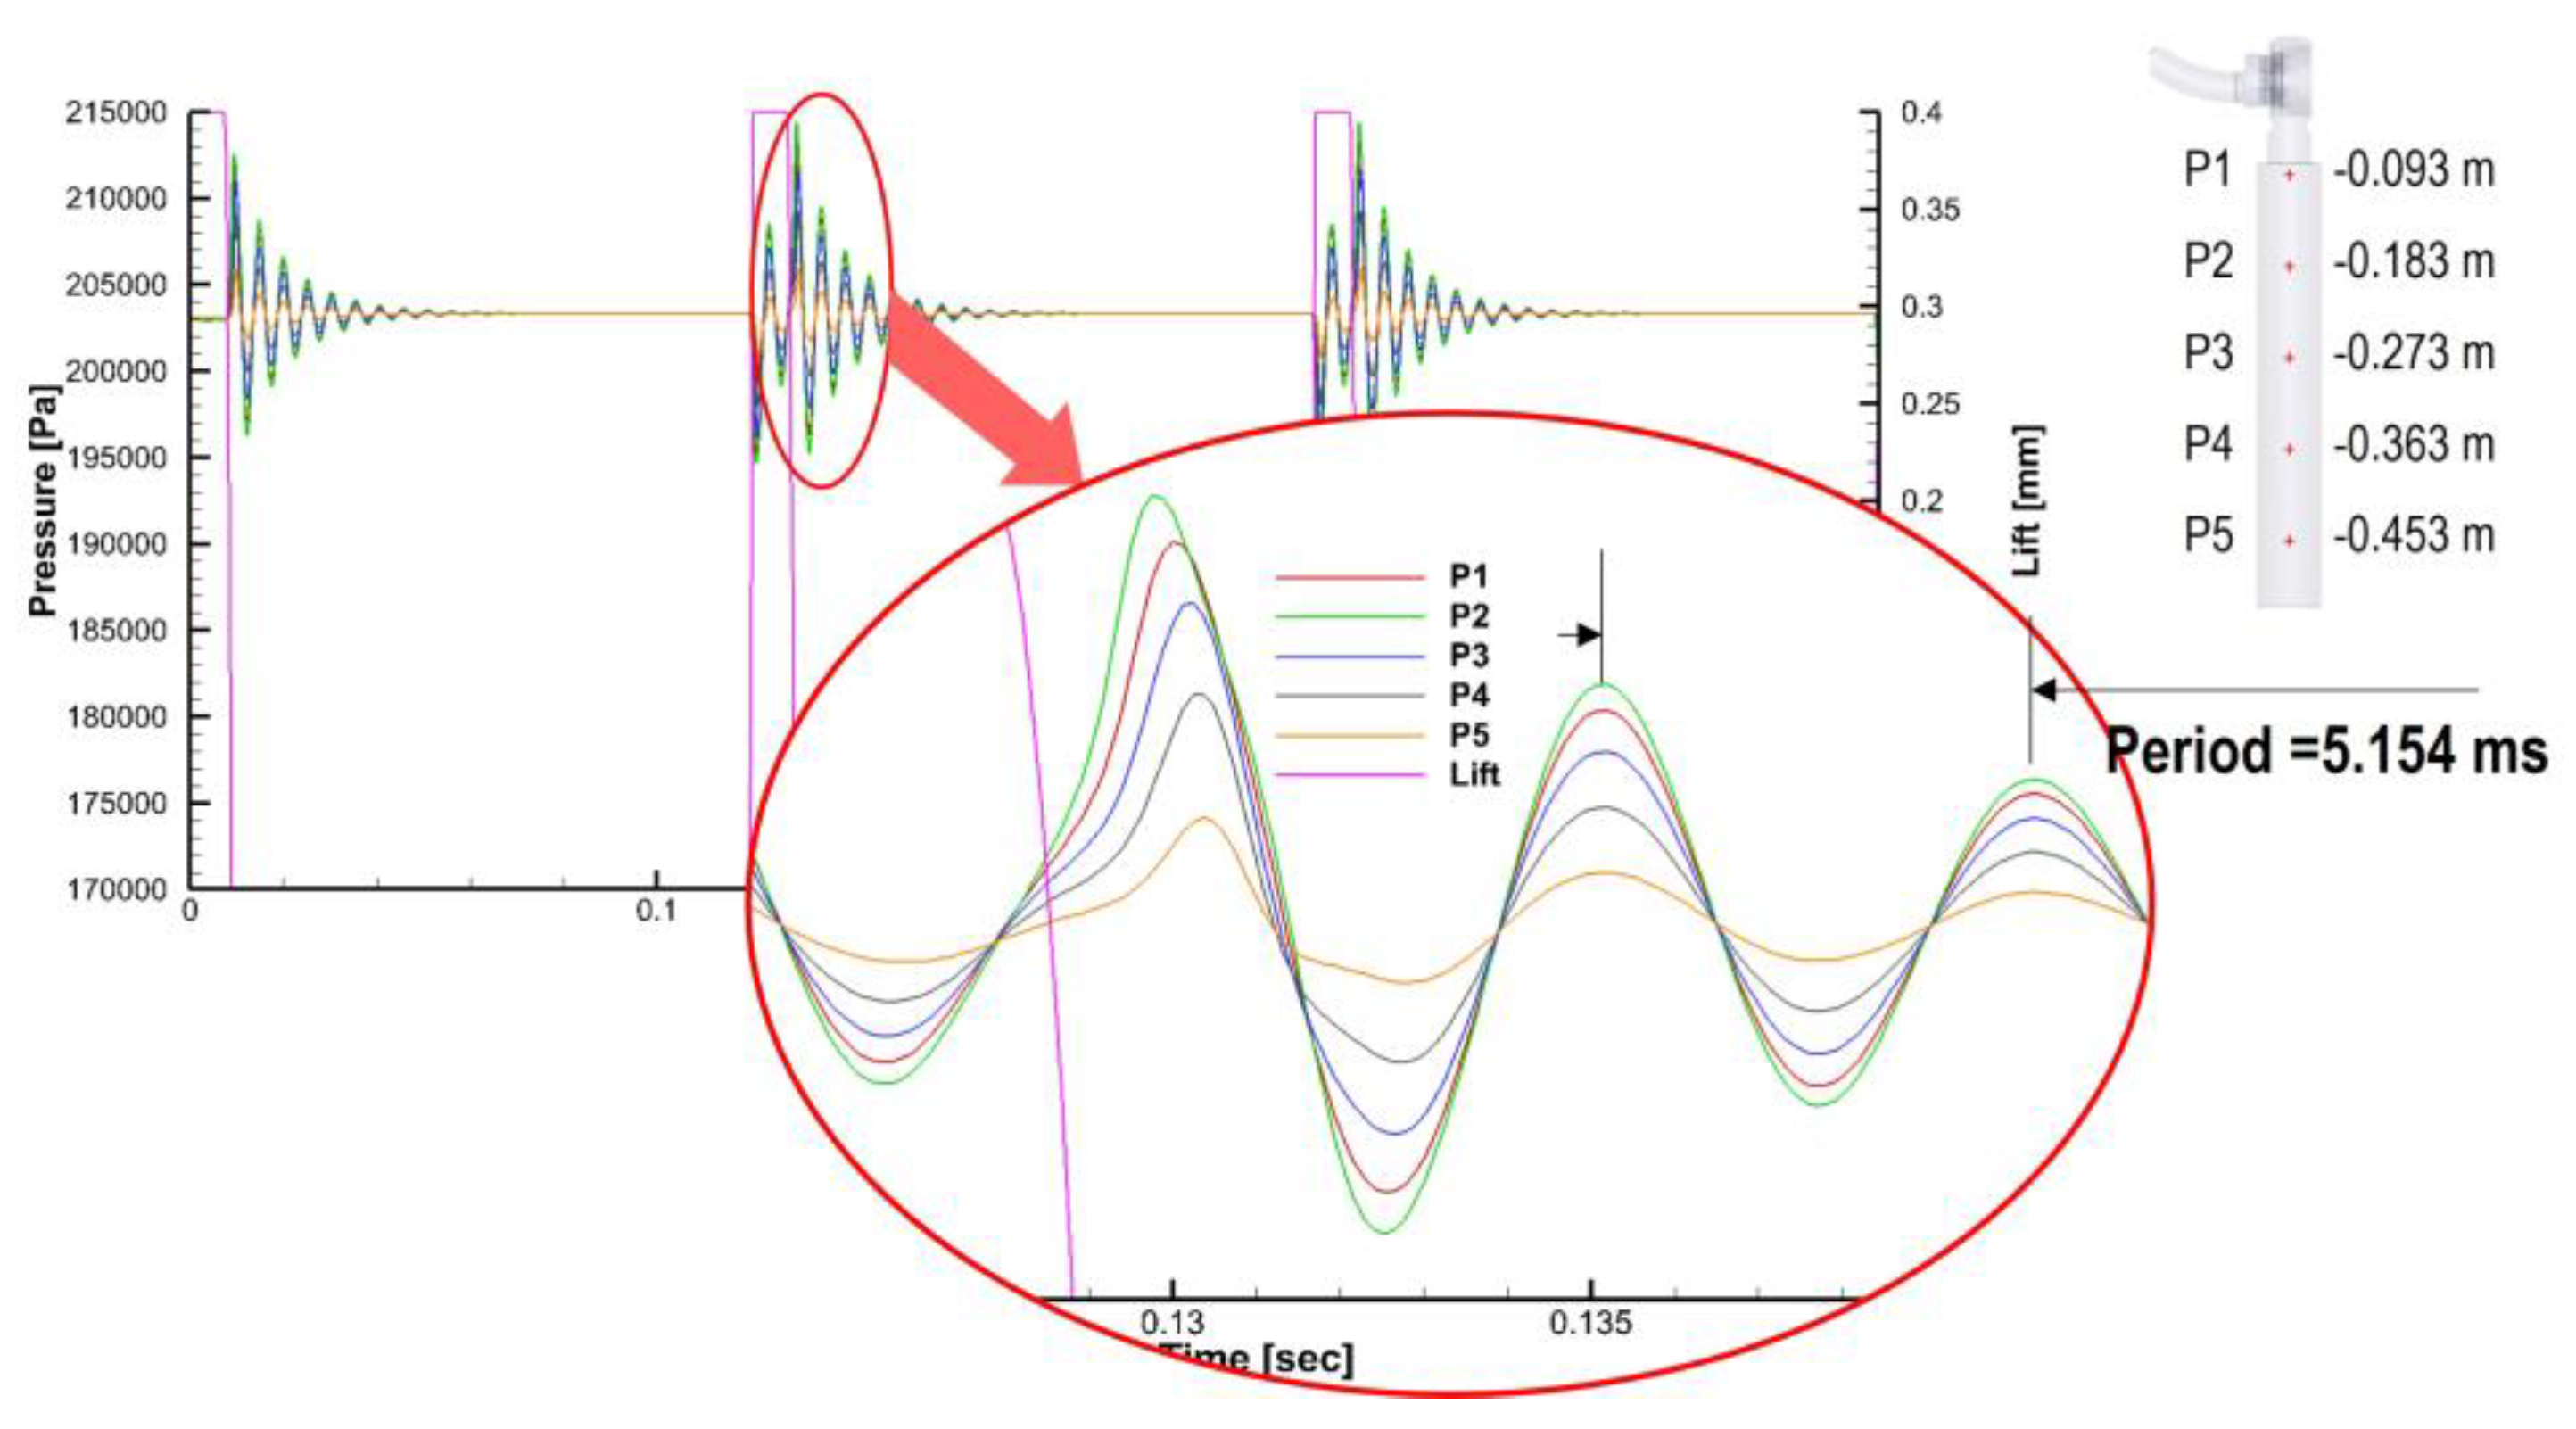
To examine the effect of orifice geometry variations in the multi-hole restrictor on the behavior of pressure waves within the intake pipe, Figure 19 presents pulsating pressure curves recorded at five evenly spaced locations along the intake pipe for Case 1. These curves illustrate how the pressure wave evolves over time with respect to changes in the lift of the moving plate. The results show that as the measurement location moves farther from the moving plate, the amplitude of the pressure wave gradually decreases due to frictional losses within the pipe. Additionally, the period of the pressure wave, as derived from the figure, is calculated to be 5.154 ms, corresponding to a frequency of 194 Hz. In this study, the speed of sound is set to c=385.1 m/s, and the pipe length, L is 0.5 m. Substituting these values into the standing wave formation equation for a pipe with one open end and one closed end, as expressed in Equation (7), yields a theoretical frequency that matches the observed value.
f n = 2 n 1 c 4 L ,   ( n = 1,2 , 3 , )
This agreement confirms that the model accurately captures the standing wave phenomenon, which occurs when the incident and reflected waves interact constructively or destructively, resulting in the formation of stable wave patterns. Thus, it is validated that the pressure wave transmission pattern within the intake pipe of the GOGAV system can be predicted using the standing wave formation model described by Equation (7).

4. Conclusions

This study provides a detailed numerical analysis of the dynamic fluid flow characteristics within a Solenoid-Operated Gas Admission Valve (SOGAV), with a particular focus on transient and compressible flow behavior. The use of a dynamic mesh technique proved essential in accurately capturing the interaction between the moving plate and the multi-hole restrictor, as well as the formation of jet streams and pressure waves under various operating conditions.
Key findings from this study are as follows:
  • This study demonstrated that orifice configurations with different-sized holes promote more uniform flow distribution and help reduce fluid velocity, thereby minimizing flow resistance. This geometry also disrupts large coherent turbulent structures, which are known sources of aerodynamic noise and flow inefficiencies.
  • The transient analysis of this study revealed that rapid motion of the moving plate induces significant inertial effects, leading to pressure wave generation and backflow patterns. Such dynamic behaviors are difficult to capture using steady-state analysis alone, underscoring the importance of employing dynamic simulations to model real-world valve operations accurately.
  • It was confirmed that standing wave patterns form within the intake pipe due to the constructive and destructive interference of incident and reflected waves. The alignment of simulation results with the theoretical predictions for standing waves validated the accuracy of the CFD model.
  • This study explored the effect of varying pressure differentials and valve lift profiles on mass flow rate and pressure wave patterns. It was observed that orifice geometries with reduced cross-sectional areas exhibited lower mass flow rates, highlighting the importance of geometric optimization for performance enhancement.

Author Contributions

Conceptualization, S.-J. J. ; methodology, S.-J. J.; software, S.-J. J. and S.-J.M.; validation, S.-J.J.; formal analysis, S.-J.J. ; investigation, S.-J.J.; resources, S.-J.J.; writing—original draft preparation, S.-J.J.; writing—review and editing, S.-J.J.; visualization, S.-J.J., S.-J.M.; supervision, S.-J.J.; project administration, S.-J.J.; funding acquisition, S.-J.J. All authors have read and agreed to the published version of the manuscript.

Funding

This work was supported by the Material and Parts Technology Development Project of the Korea Evaluation Institute of Industrial Technology, funded by the Korean government (Grant No. 20004900).

Data Availability Statement

Most of the data presented in this study are available on request from the corresponding author.

Acknowledgments

The authors would like to express their sincere gratitude to STX Engine Co., LTD. and KWT Solution Inc. for their invaluable technical support and collaboration, which greatly contributed to the success of this research.

Conflicts of Interest

The authors declare no conflicts of interest.

References

  1. Peurala, J. Model-based Design, Modelling and Simulation of Digital Hydraulic Gas Admission Valve. Master of Science Thesis, Tampere University of Technology, Finland, 6 March 2014. [Google Scholar]
  2. Woodward's Innovative SOGAV Gas Admission Valve for Marine Engines Awarded IGF Code Compliance. Available online: https://www.marinebusinessworld.com/news/258925/SOGAV-gas-valve-awarded-IGF-Code-compliance (accessed on 3 October 3, 2024).
  3. Woodward’s Gas Admission Valve for Marine Engines Awarded IGF Code. Compliance. Available online: https://www.powertransmission.com/articles/9113-woodwards-gas-admission-valve-for-marine-engines-awarded-igf-code-compliance (accessed on 1 February 2024).
  4. Gas Admission Valve for Large Engines. Available online: https://www.bosch-mobility.com/en/solutions/valves/gas-injector-valve/ (accessed on 3 October 3, 2024).
  5. Christiner, P.; Gasselsdorfer, C.; Schmitzberger, M. Development of gas valves for multi-point admission. MTZ Industrial 2017, 7, 27–35. [Google Scholar] [CrossRef]
  6. SOGAV™ 43 and SOGAV 105. Available online: https://www.pmcontrol.com/attachments/PMControl/products/46/SOGAV%2043%20&%20105.pdf (accessed on 31 July 2024).
  7. R. Amirante; P.G. Moscatelli; L.A. Catalano, Evaluation of the flow forces on a direct (single stage) proportional valve by means of a computational fluid dynamic analysis. Conversion and Management 2007, 48, 942–953. [Google Scholar] [CrossRef]
  8. Wu, G.; Li, S.; Wu, P. CFD Simulation of Flow-Pressure Characteristics of a Pressure Control Valve for Automotive Fuel Supply System. Energy Conversion and Management 2015, 48, 658–665. [Google Scholar] [CrossRef]
  9. Kang, H-L. ; Park, H.-J.; Han, S-H. Investigation of the Flow Characteristics for Cylinder-in-Ball Valve Due to a Change in the Opening Rate. Appl. Sci. 2022, 12, 8930–8941. [Google Scholar] [CrossRef]
  10. Srikanth, C.; Bhasker, C. Flow Analysis in Valve with Moving Grids through CFD Techniques. Advances in Engineering Software 2009, 40, 193–201. [Google Scholar] [CrossRef]
  11. Li, S.; Wu, P.; Cao, L.; Wua, D.; She, Y. CFD Simulation of Dynamic Characteristics of a Solenoid Valve for Exhaust Gas Turbocharger System. Applied Thermal Engineering 2017, 213–222. [Google Scholar] [CrossRef]
  12. Qian, J.-y.; Wei, L.; Jin, Z.-j.; Wang, J.-k.; Zhang, H.; Lu, A-l. CFD Analysis on the Dynamic Flow Characteristics of the Pilot-Control Globe Valve. Energy Conversion and Management 2014, 87, 220–226. [Google Scholar] [CrossRef]
  13. Zhang, P.; Tao, Y.; Yang, C.; Ma, W.; Zhang, Z. Transient Characteristics Simulation and Flow-Field Analysis of High-Pressure Pneumatic Pilot-Driven On/Off Valve via CFD Method. Flow Measurement and Instrumentation 2024, 97, 102620–102637. [Google Scholar] [CrossRef]
  14. Shu, Z.; Liang, W.; Qin, B.; Lei, G.; Wang, T.; Huang, L.; Che, B.; Zheng, X.; Qian, H. Transient Flow Dynamics Behaviors During Quick Shut-Off of Ball Valves in Liquid Hydrogen Pipelines and Storage Systems. Journal of Energy Storage 2023, 73, 109049. [Google Scholar] [CrossRef]
  15. Hou, J.; Li, S.; Pan, W.; Yang, L. Co-Simulation Modeling and Multi-Objective Optimization of Dynamic Characteristics of Flow Balancing Valve. Machines 2023, 11, 337–351. [Google Scholar] [CrossRef]
  16. Jeong, S.-J.; Kang, J.-h.; Moon, S.-J.; Lee, G.-s. Transient and Dynamic Simulation of the Fluid Flow through Five-Way Electric Coolant Control Valve of a 100 kW Fuel Cell Vehicle by CFD with Moving Grid Technique. Actuators 2024, 13, 110–131. [Google Scholar] [CrossRef]
  17. Simerics-MP+, Simerics, ver. 5.2.15. Available online: https://www.simerics.com (accessed on 3 February 2024).
  18. Zhao, L.; Chang, Z.; Mai, C.; Ran, H.; Jiang, J. Experimental and numerical investigation on dynamic characteristic of.
  19. nozzle check valve and fluid-valve transient interaction. Nuclear Engineering and Design 2024, 416, 112737–112751. [CrossRef]
  20. Kim, N.-S.; Jeong, Y.-H. An investigation of pressure build-up effects due to check valve’s closing characteristics using dynamic mesh techniques of CFD. Annals of Nuclear Energy 2021, 107996–108007. [Google Scholar] [CrossRef]
  21. Sami, N.A.; Turzo, Z. Computational Fluid Dynamic (CFD) Simulation of Pilot Operated Intermittent Gas Lift Valve. Petroleum Research 2020, 5, 254–264. [Google Scholar] [CrossRef]
  22. Koutsourakis, N.; John, G. B.; Markatos, N.C. Evaluation of Reynolds stress, k-ε and RNG k-ε turbulence models in street canyon flows using various experimental datasets. Environmental Fluid Mechanics 2012, 12, 379–403. [Google Scholar] [CrossRef]
  23. Perini, F.; Zha, K.; Busch, S.; Reitz, R. Comparison of Linear, Non-Linear and Generalized RNG-Based k-epsilon Models for Turbulent Diesel Engine Flows; SAE Technical Paper 2017-01-0561; SAE International: Warrendale, PA, USA, 2017. [Google Scholar]
  24. Versteeg, H.K.; Malalasekera, W. An Introduction to Computational Fluid Dynamics, 2nd ed.; Citeseer: Harlow, UK, 2007; pp. 77–176. [Google Scholar]
  25. Chen, C.-J.; Jaw, S.-Y. Fundamentals of Turbulence Modeling; Taylor & Francis: New York, NY, USA, 1998; ISBN 1-56032-405-8. [Google Scholar]
  26. Yakhot, V.; Orszag, S.A.; Thangam, S.; Gatski, T.B.; Speziale, C.G. Development of turbulence models for shear flows by a double expansion technique. Phys. Fluids A 1992, 4, 1510–1520. [Google Scholar] [CrossRef]
  27. Chen, C.-J.; Jaw, S.-Y. Fundamentals of Turbulence Modeling; Taylor & Francis: New York, NY, USA, 1998; ISBN 1-56032-405-8. [Google Scholar]
  28. Davidson, L. Fluid Mechanics, Turbulent Flow and Turbulence Modeling; Chalmers University of Technology: Goteborg, Sweden, 2024. [Google Scholar]
  29. Yin, F.; Zhang, Y.; Nie, S.; Ji, H.; Ma, Z. A system-level CFD simulation model for investigating the energy dissipation mechanism of seawater pump and rotary energy recovery device in SWRO desalination system 2024, 587, 117947–117964.
  30. Samii, D.R.; Hashemabadi, S.H.; Margan, P. CFD based design gas rotameters: Dynamic mesh transient simulation. Flow Measurement and Instrumentation 2024, 95, 102513–102522. [Google Scholar] [CrossRef]
  31. Schmidt, J.; Stoevesandt, B. Dynamic mesh optimization based on the spring analogy. In Proceedings of the ITM Web of Conferences, 2, 2014. [CrossRef]
  32. Lin, T.J.; Guan, Z.Q.; Chang, J.H.; Lo, S.H. Vertex-Ball Spring Smoothing: An efficient method for unstructured dynamic hybrid meshes. Computers and Structures 2014, 136, 24–33. [Google Scholar] [CrossRef]
  33. Karlsso, J. Implementing Anisotropic Adaptive Mesh Refinement in OpenFOAM. Mater’s Thesis, Chalmers university of technology, Göteborg, Sweden, December, 2012.
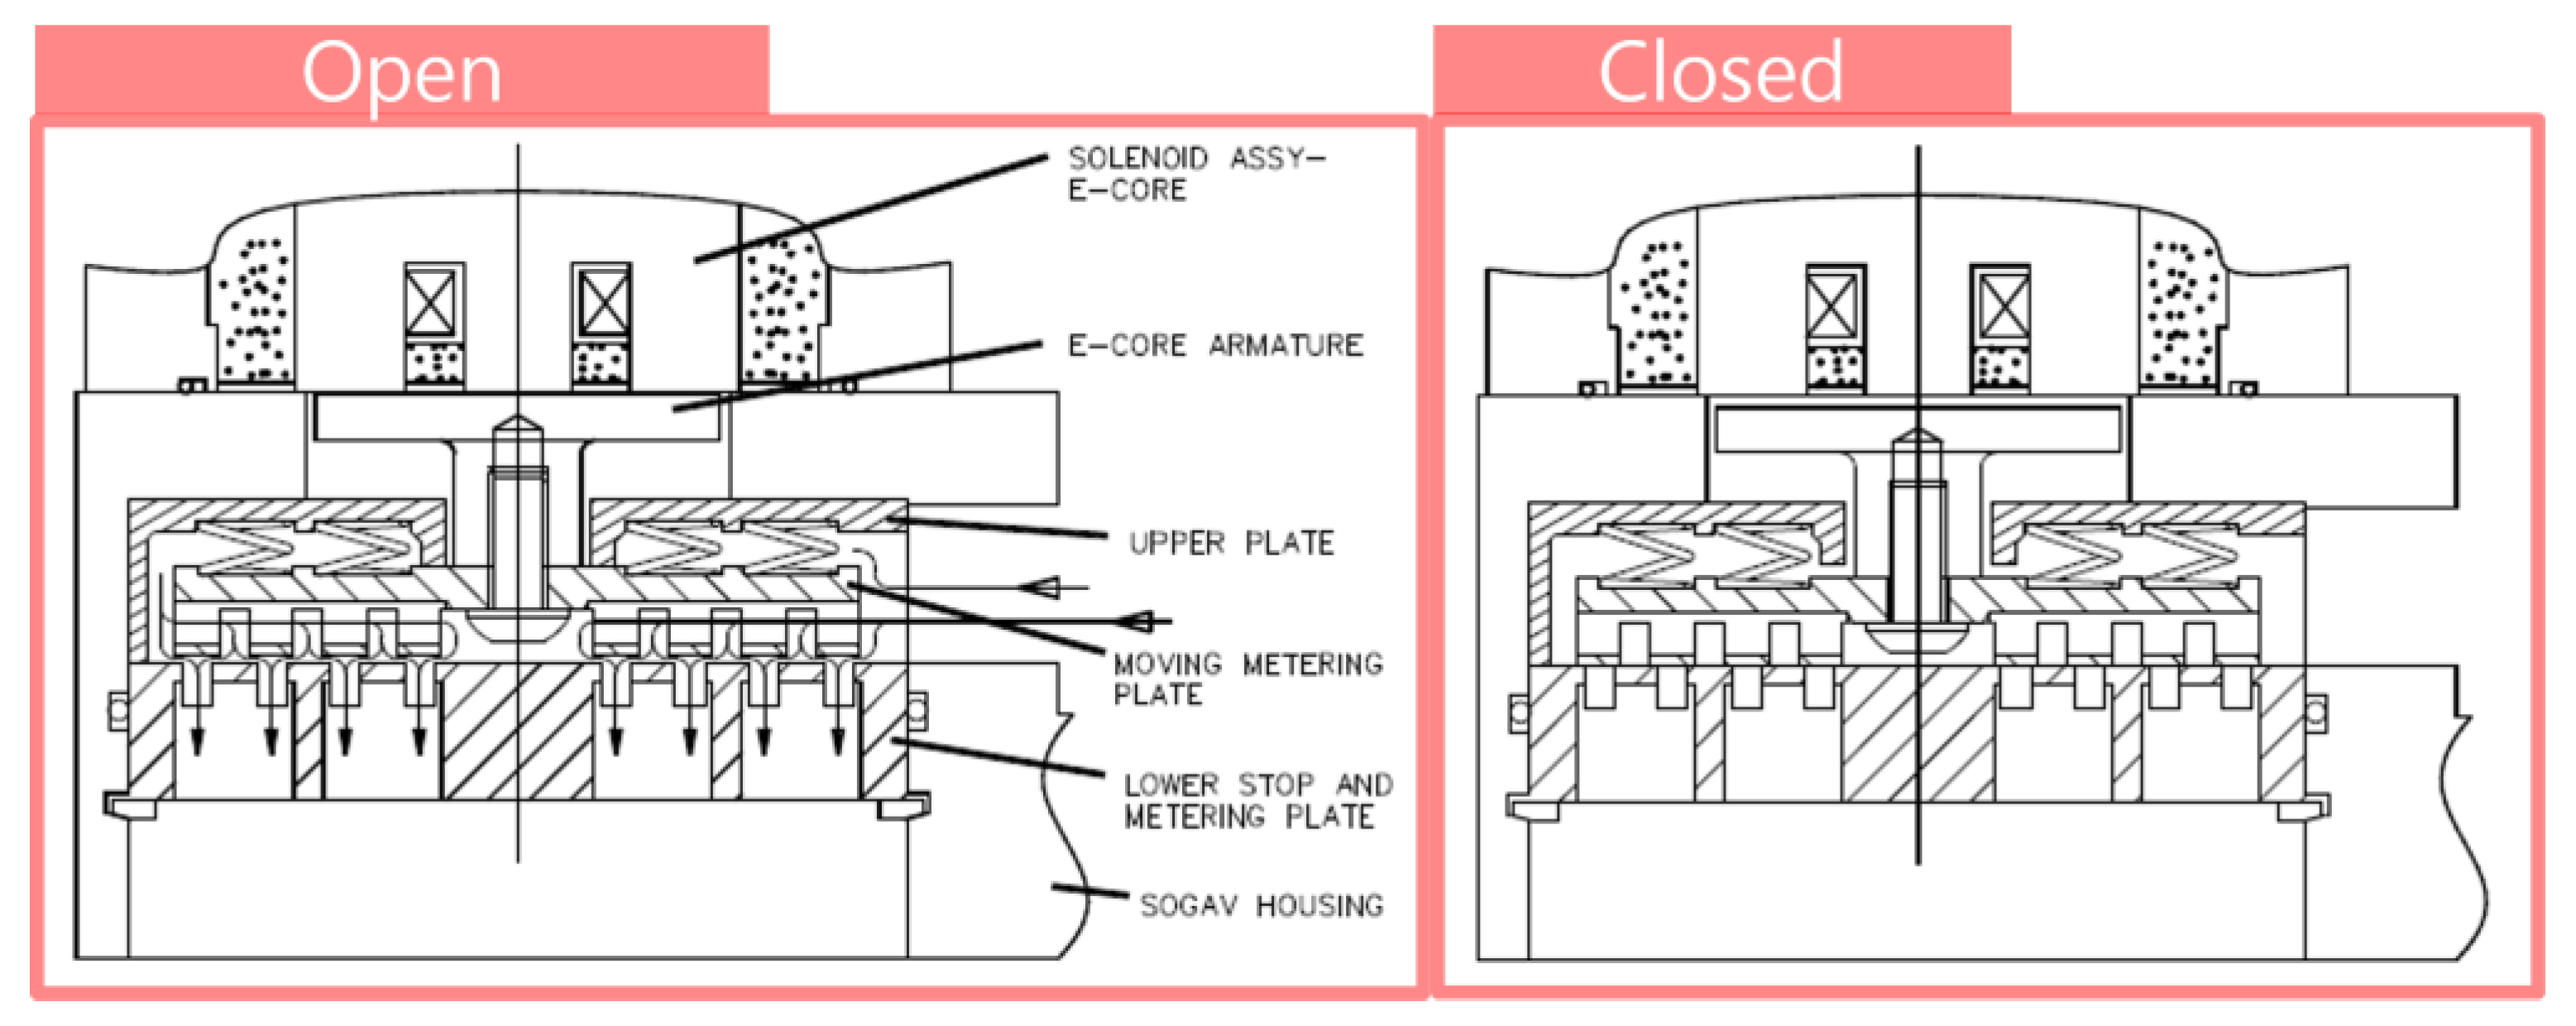
Figure 1. A cross-sectional view of the GOGAV 105, developed by Woodward [6].
Preprints 137781 g001
Figure 2. Structure of the three main components of the SOGAV.
Preprints 137781 g002
Figure 3. Schematic diagram of sequence of flow direction.
Preprints 137781 g003
Figure 5. Hexahedral computational mesh system of flow domain of SOGAV; (a) 3D grid model for the entire computational domain; (b) 2D mesh structure at cross-section A.
Preprints 137781 g004
Figure 6. Schematic diagram of the complete geometric configuration and dimensions of the computational domain, along with the specified locations of the applied boundary conditions.
Preprints 137781 g005
Figure 7. Schematic representation of the hole arrangement configurations for the three multi-hole restrictors evaluated in this study: (a) Base model; (b) Model with only large holes; (c) Model with enlarged large holes.
Preprints 137781 g006
Figure 8. Lift curves of Moving plate with respect to time: (a) Operating frequency of 8.3Hz (b) Operating frequency of 4.9Hz.
Preprints 137781 g007
Figure 9. Sectional plots of velocity distributions and flow uniformities within SOGAV: (a) Case 1 and 3; (b) Case 2 and 4.
Preprints 137781 g008
Figure 10. an enlarged view of the velocity vector fields in Zones A and B: (a) Zone A; (b) Zone B.
Preprints 137781 g009
Figure 11. Graph of axial variations of the cross-sectional average pressure of SOGAV for Case 1 and Case 3.
Preprints 137781 g010
Figure 12. Velocity distribution at cross-section A of the SOGAV as a function of temporal variations in moving plate lift : (a) Point 1/4 lift; (b) Point MOO; (c) Point B; (d) Point C; (e) Point MOC; (f) 1/4 lift.
Preprints 137781 g011
Figure 13. velocity distributions at cross-section B as a function of the moving plate’s lift variations: (a) Point MOO; (b) Point B; (c) Point C; (d) Point MOC.
Preprints 137781 g012
Figure 14. Transient profiles of flow uniformity for different running conditions.
Preprints 137781 g013
Figure 15. Pressure pulsations at the mid-point of the outlet pipe for different running conditions.
Preprints 137781 g014
Figure 16. Temporal variations of mass flow rate at the exit of the outlet pipe for different running conditions.
Preprints 137781 g015
Figure 17. Pressure pulsations at the mid-point of the outlet pipe for different orifice geometries. .
Preprints 137781 g016
Figure 18. Temporal variations of mass flow rate at the exit of the outlet pipe for different orifice geometries.
Preprints 137781 g017
Figure 19. Pressure wave patterns in intake pipe of SOGAV for Case 1.
Preprints 137781 g018
Table 2. Summary of simulation cases under various engine operating conditions.
Parameter Case 1 Case 2 Case 3 Case 4
Frequency [Hz] 8.3 8.3 4.9 4.9
Pi – P0 [bar] 1.02 0.8 1.02 0.8
Table 3. Summary of simulation cases for various different-sized hole arrangement of multi-hole restrictor.
Title 1 Case 1 Case 2 Case 3 Case 4
Pi-Po (Bar) 1.02 0.8 1.02 0.8
Radius of hole(mm) 7(6*)+2.5(6*) 7(6*) 7.4(6*) 7.4(6*)
Operating
Frequency (Hz)
8.3
* Number of holes.
Table 4. CFD solver setting parameters.
Model name Option
Turbulence model RNG k-ε
Discretization for Convective terms Upwind scheme
Time integration method Implicit
Time Discretization method Upwind Scheme
Working Fluid Properties Name CH4
Density(25℃) the ideal-gas state equation
Viscosity(25℃) 11.23×10⁶(Pa∙sec)
Dynamic Mesh Remeshing
Smoothing
a CAB algorithm
a spring-based algorithm
Boundary conditions Inlet Constant Pressure
Outlet Constant Pressure
Wall No-slip, Wall function
Timestep size 1,000 step/cycle
Convergence Criteria 10-6
Total number of computational volumes 2,378,698
Computing number of cycles 6
Computing Resources 12 cores intel i7-8700/3.2 GHz
Computing time/case 96.6 hrs
Table 5. Time averaged velocity and flow uniformity at outlet face of SOGAV for various running conditions.
Time averaged Case 1 Case 2 Case 3 Case 4
Velocity(m/s) 52.93 45.58 50.52 43.39
Uniformity (%) 88.18 87.62 88.26 87.71
Disclaimer/Publisher’s Note: The statements, opinions and data contained in all publications are solely those of the individual author(s) and contributor(s) and not of MDPI and/or the editor(s). MDPI and/or the editor(s) disclaim responsibility for any injury to people or property resulting from any ideas, methods, instructions or products referred to in the content.
Copyright: This open access article is published under a Creative Commons CC BY 4.0 license, which permit the free download, distribution, and reuse, provided that the author and preprint are cited in any reuse.
Prerpints.org logo

Preprints.org is a free preprint server supported by MDPI in Basel, Switzerland.

Subscribe

© 2024 MDPI (Basel, Switzerland) unless otherwise stated