Submitted:
28 October 2024
Posted:
30 October 2024
You are already at the latest version
Abstract

Keywords:
1. Introduction
2. Materials and Methods
2.1. Materials
2.2. Synthesis of PAMAM Dendrimer/CPT Complex
2.3. Synthesis of Biodegradable Polymers
2.4. In Vitro Hydrolytic Degradation of Polymerics
2.5. Synthesis of the Nanosystems Composed of PAMAM Dendrimer/CPT Complex and Biodegradable Polymer
2.6. In Vitro Release Study of CPT from the Developed Nanosystems
2.7. Mathematical Models
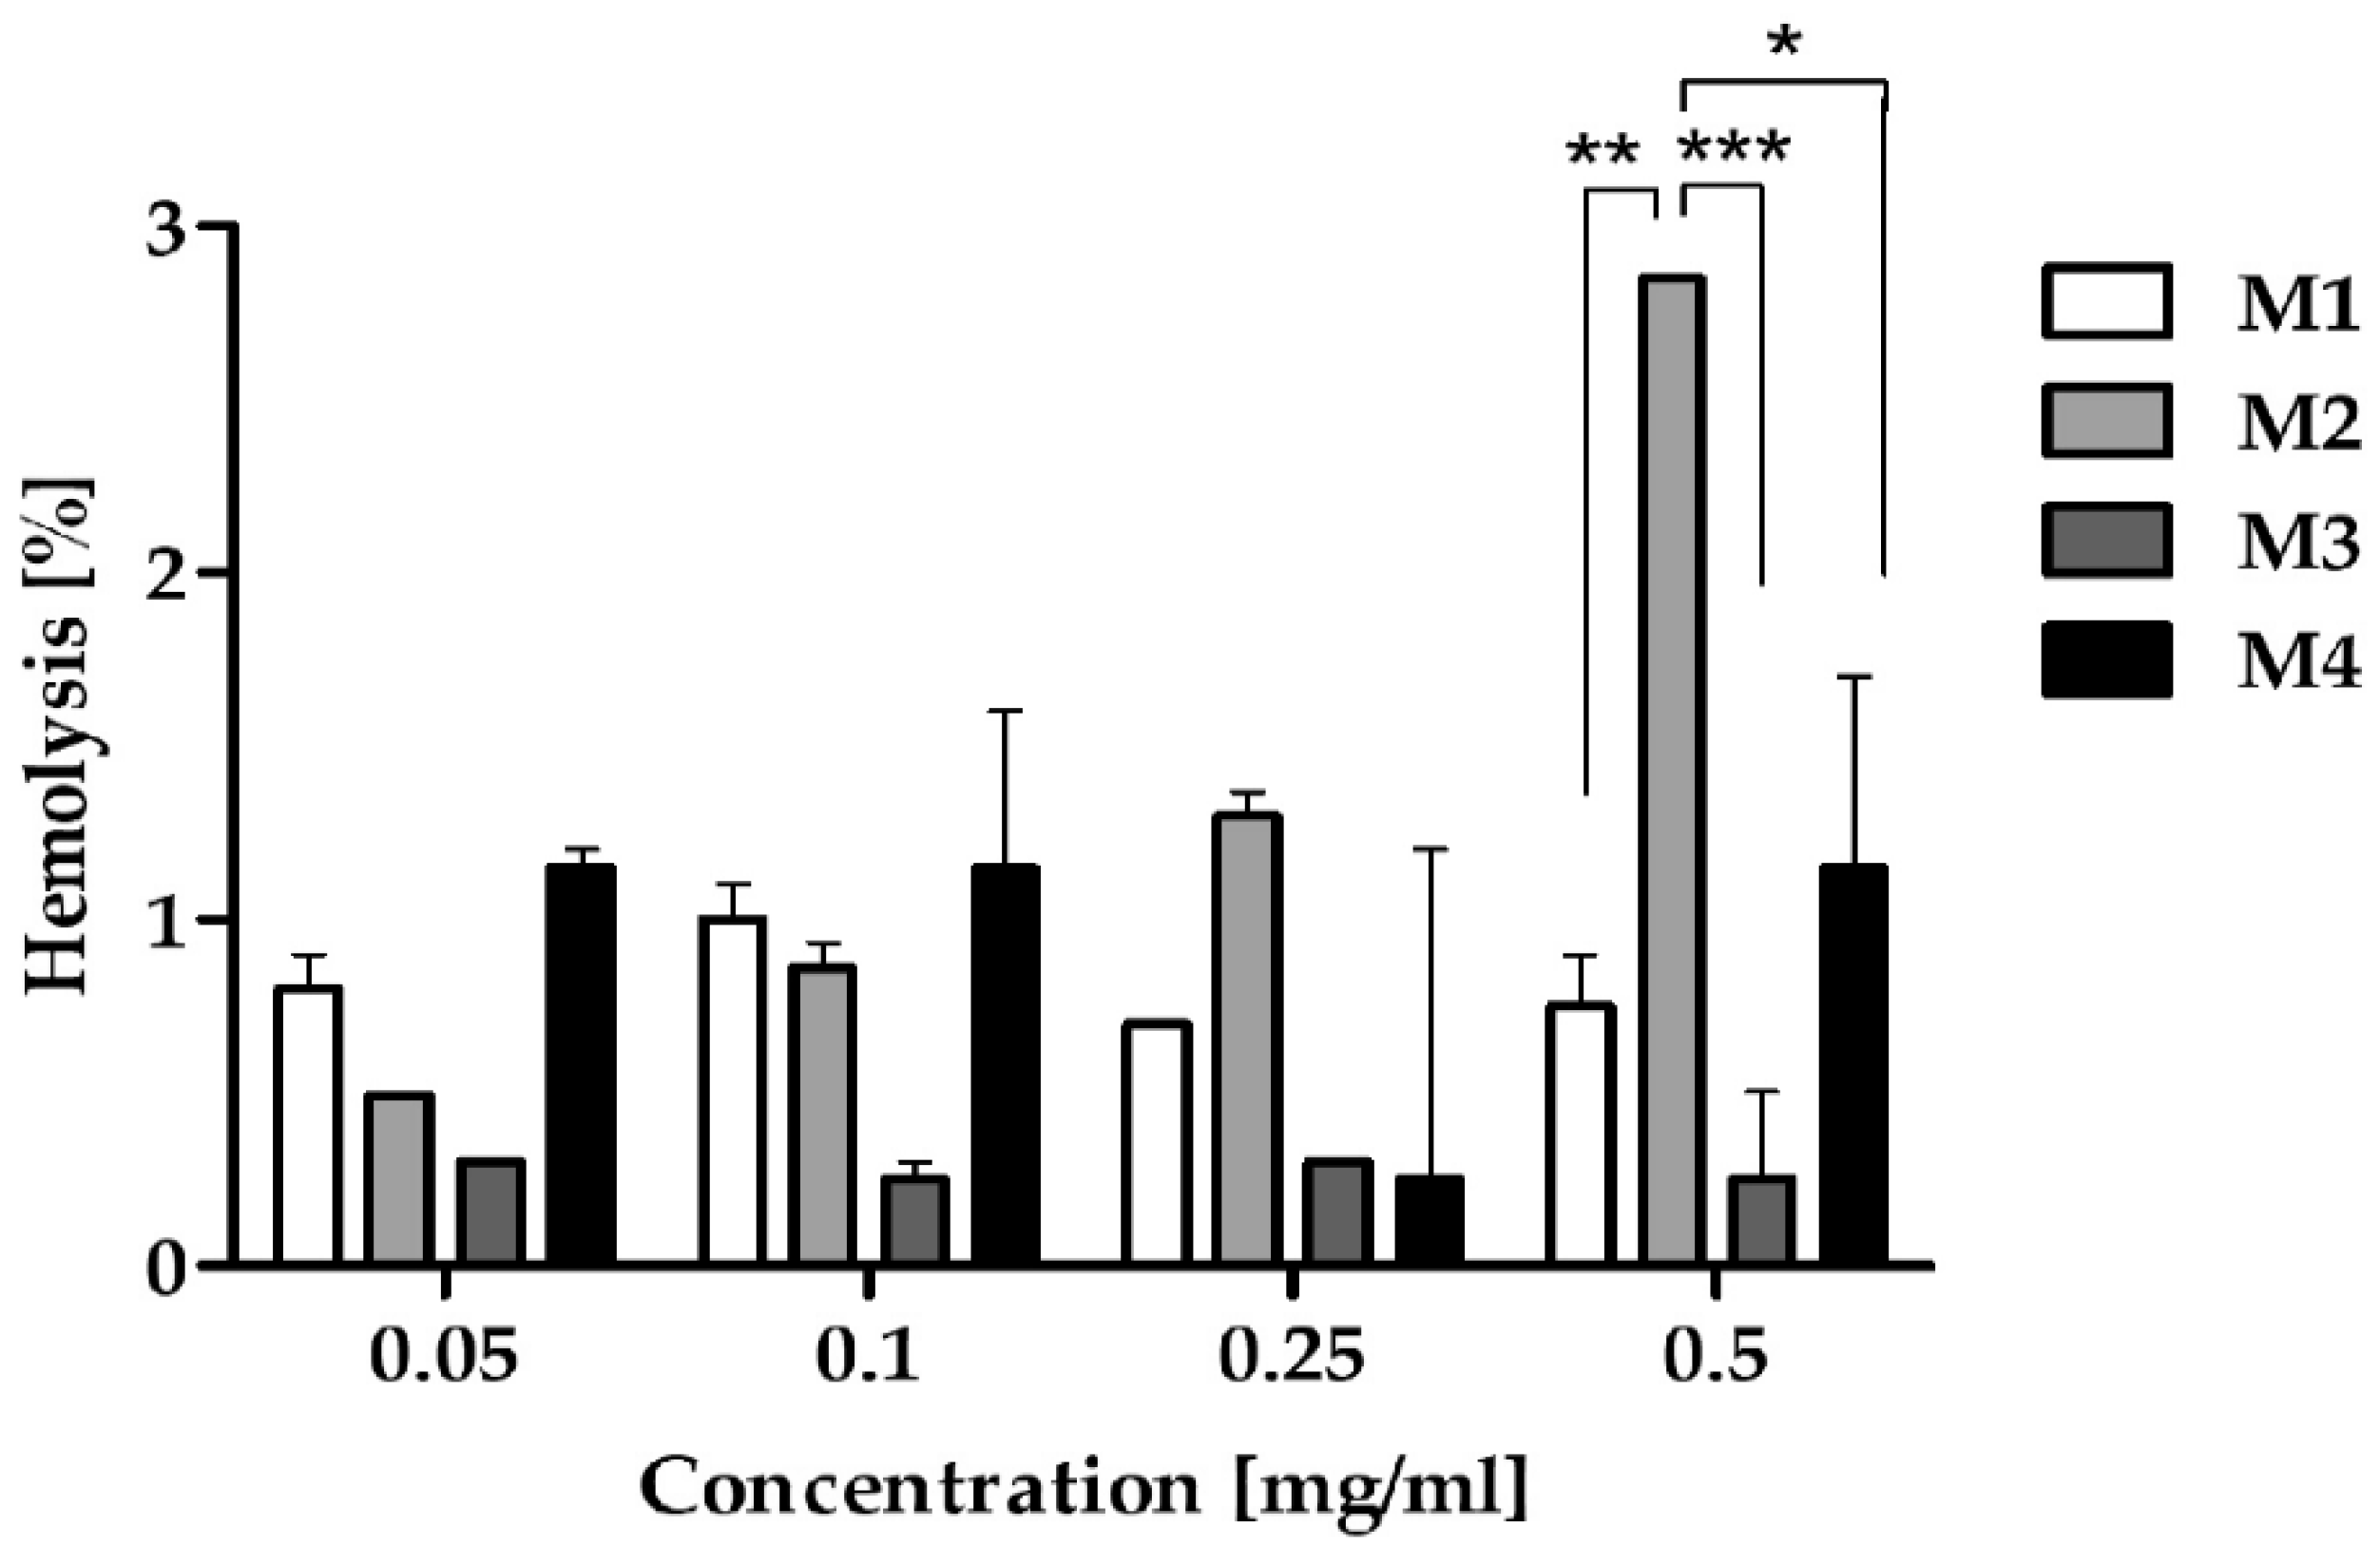
2.8. Hemolysis
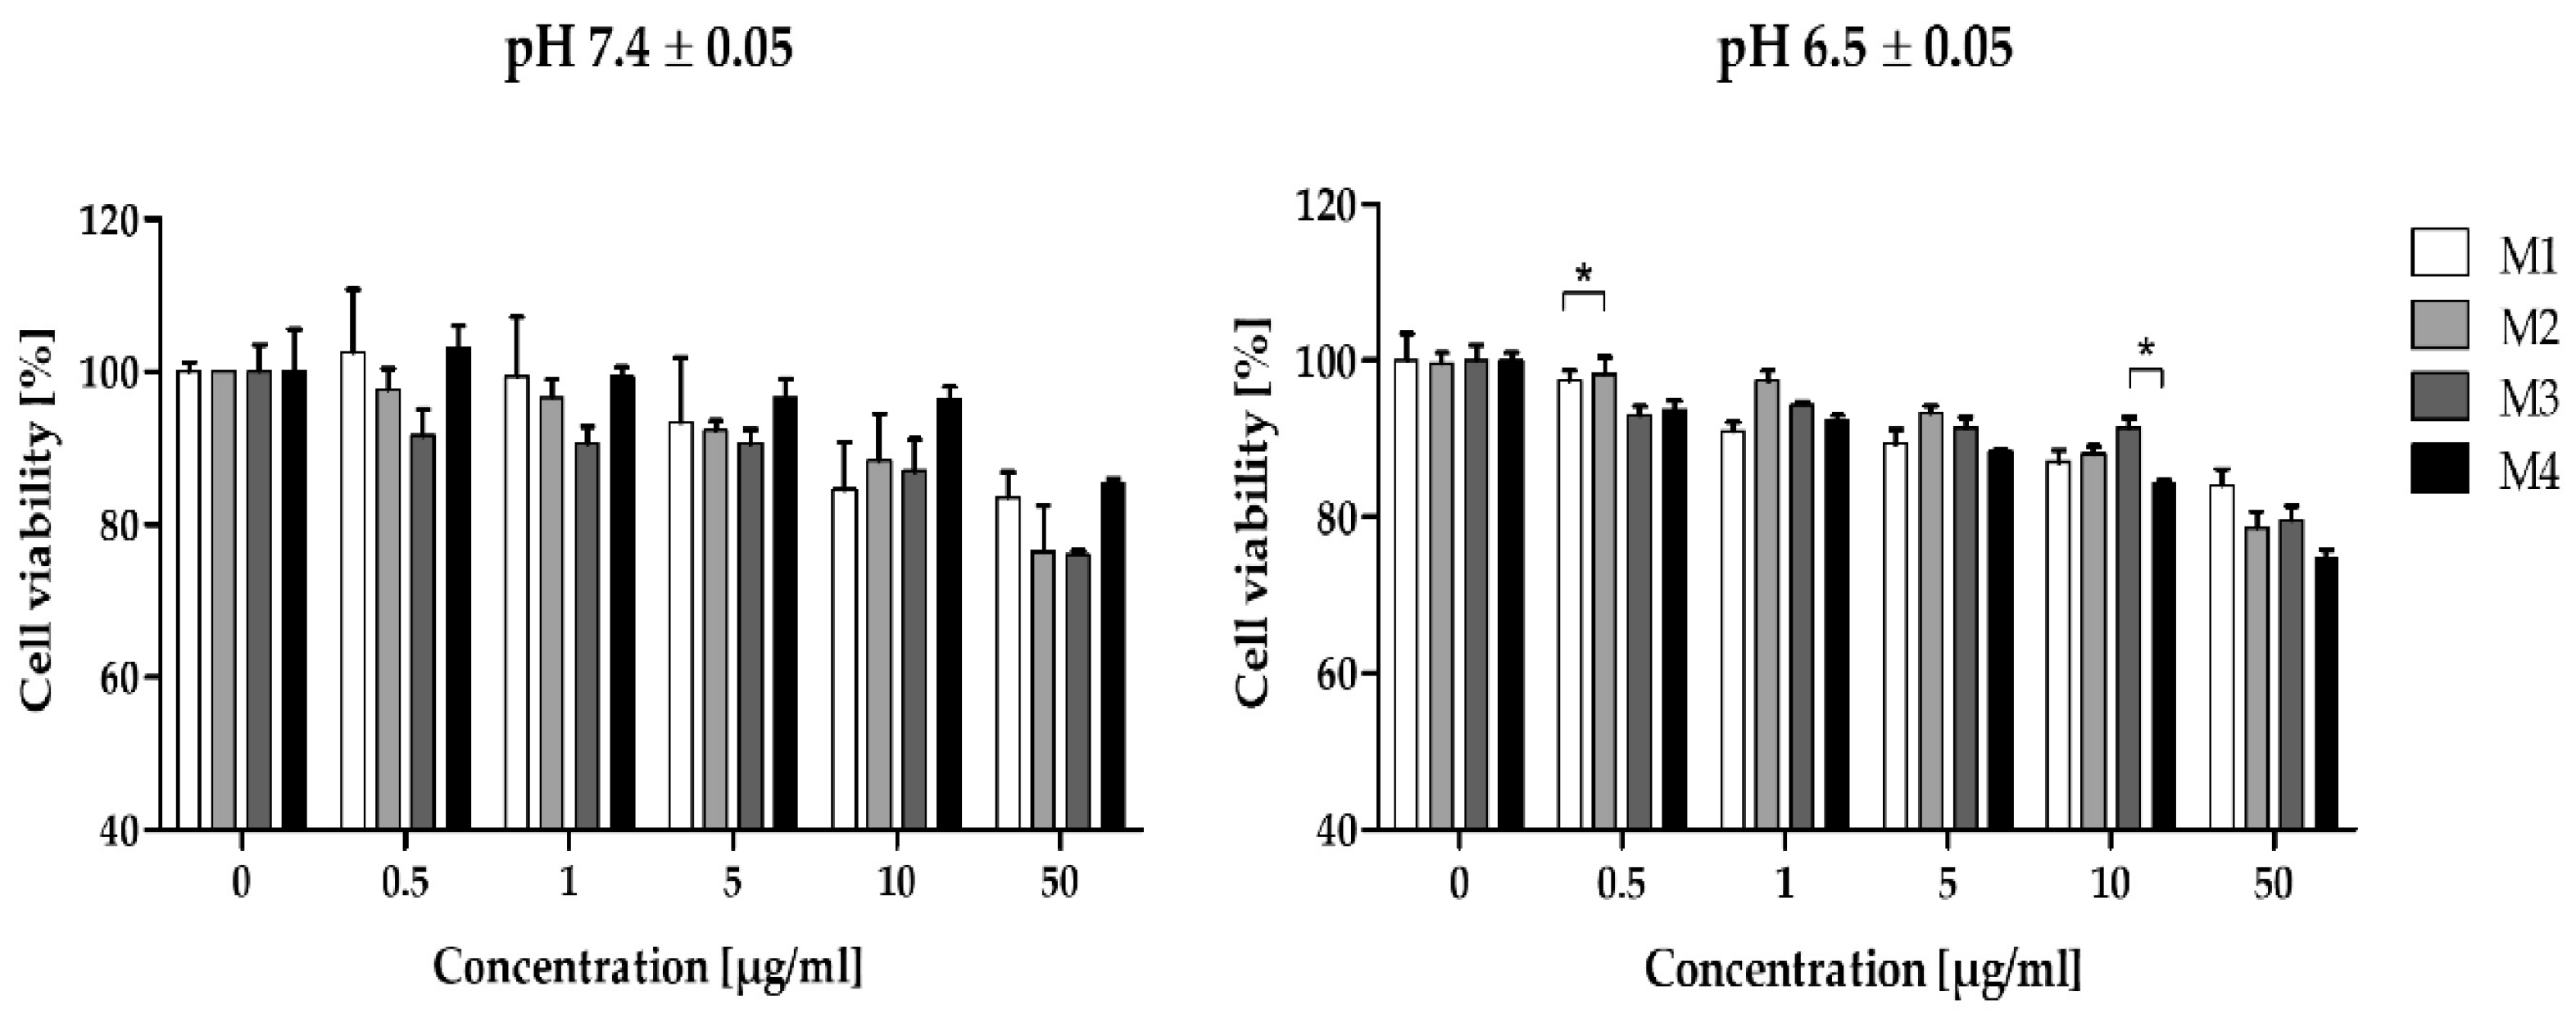
2.9. Cell Culture and Viability Assay
2.10. Statistical Analysis
2.11. Molecular Modelling of the Nanosystems Composed of PAMAM Dendrimer/CPT Complex and Biodegradable Polymer
2.12. Measurements
3. Results and Discussion
3.1. Synthesis and Characterization of Biodegradable Polymers
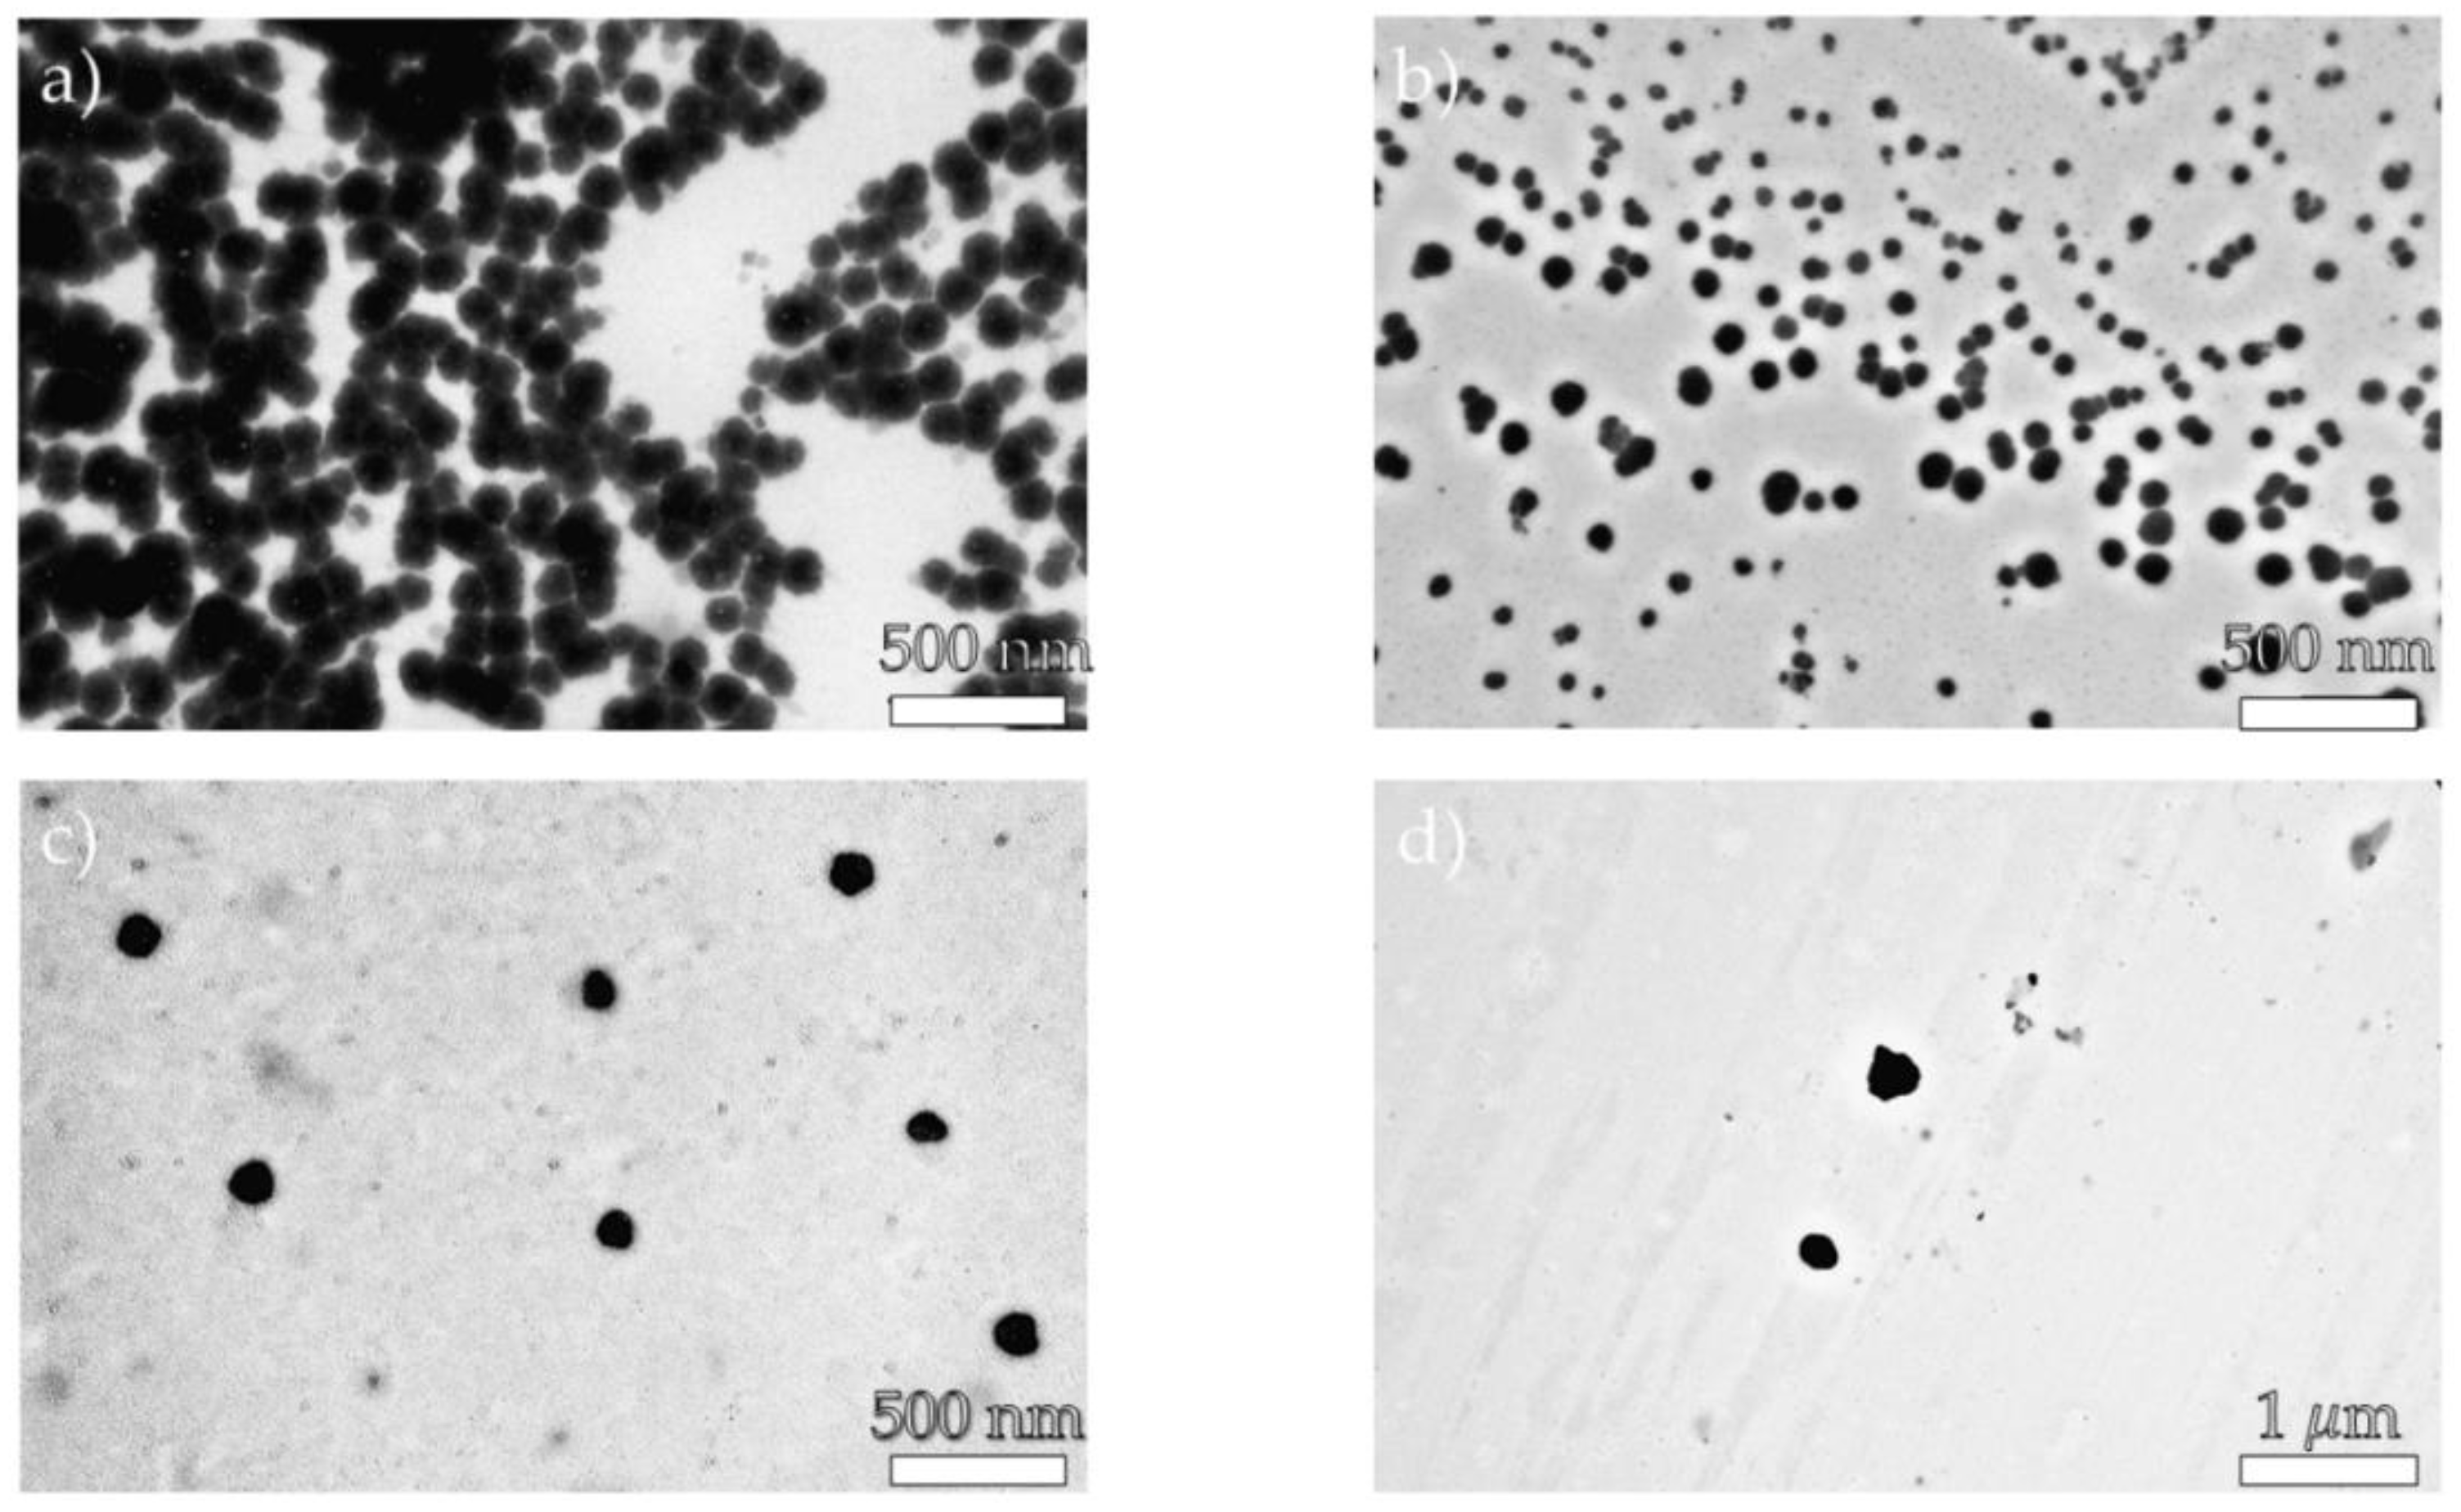
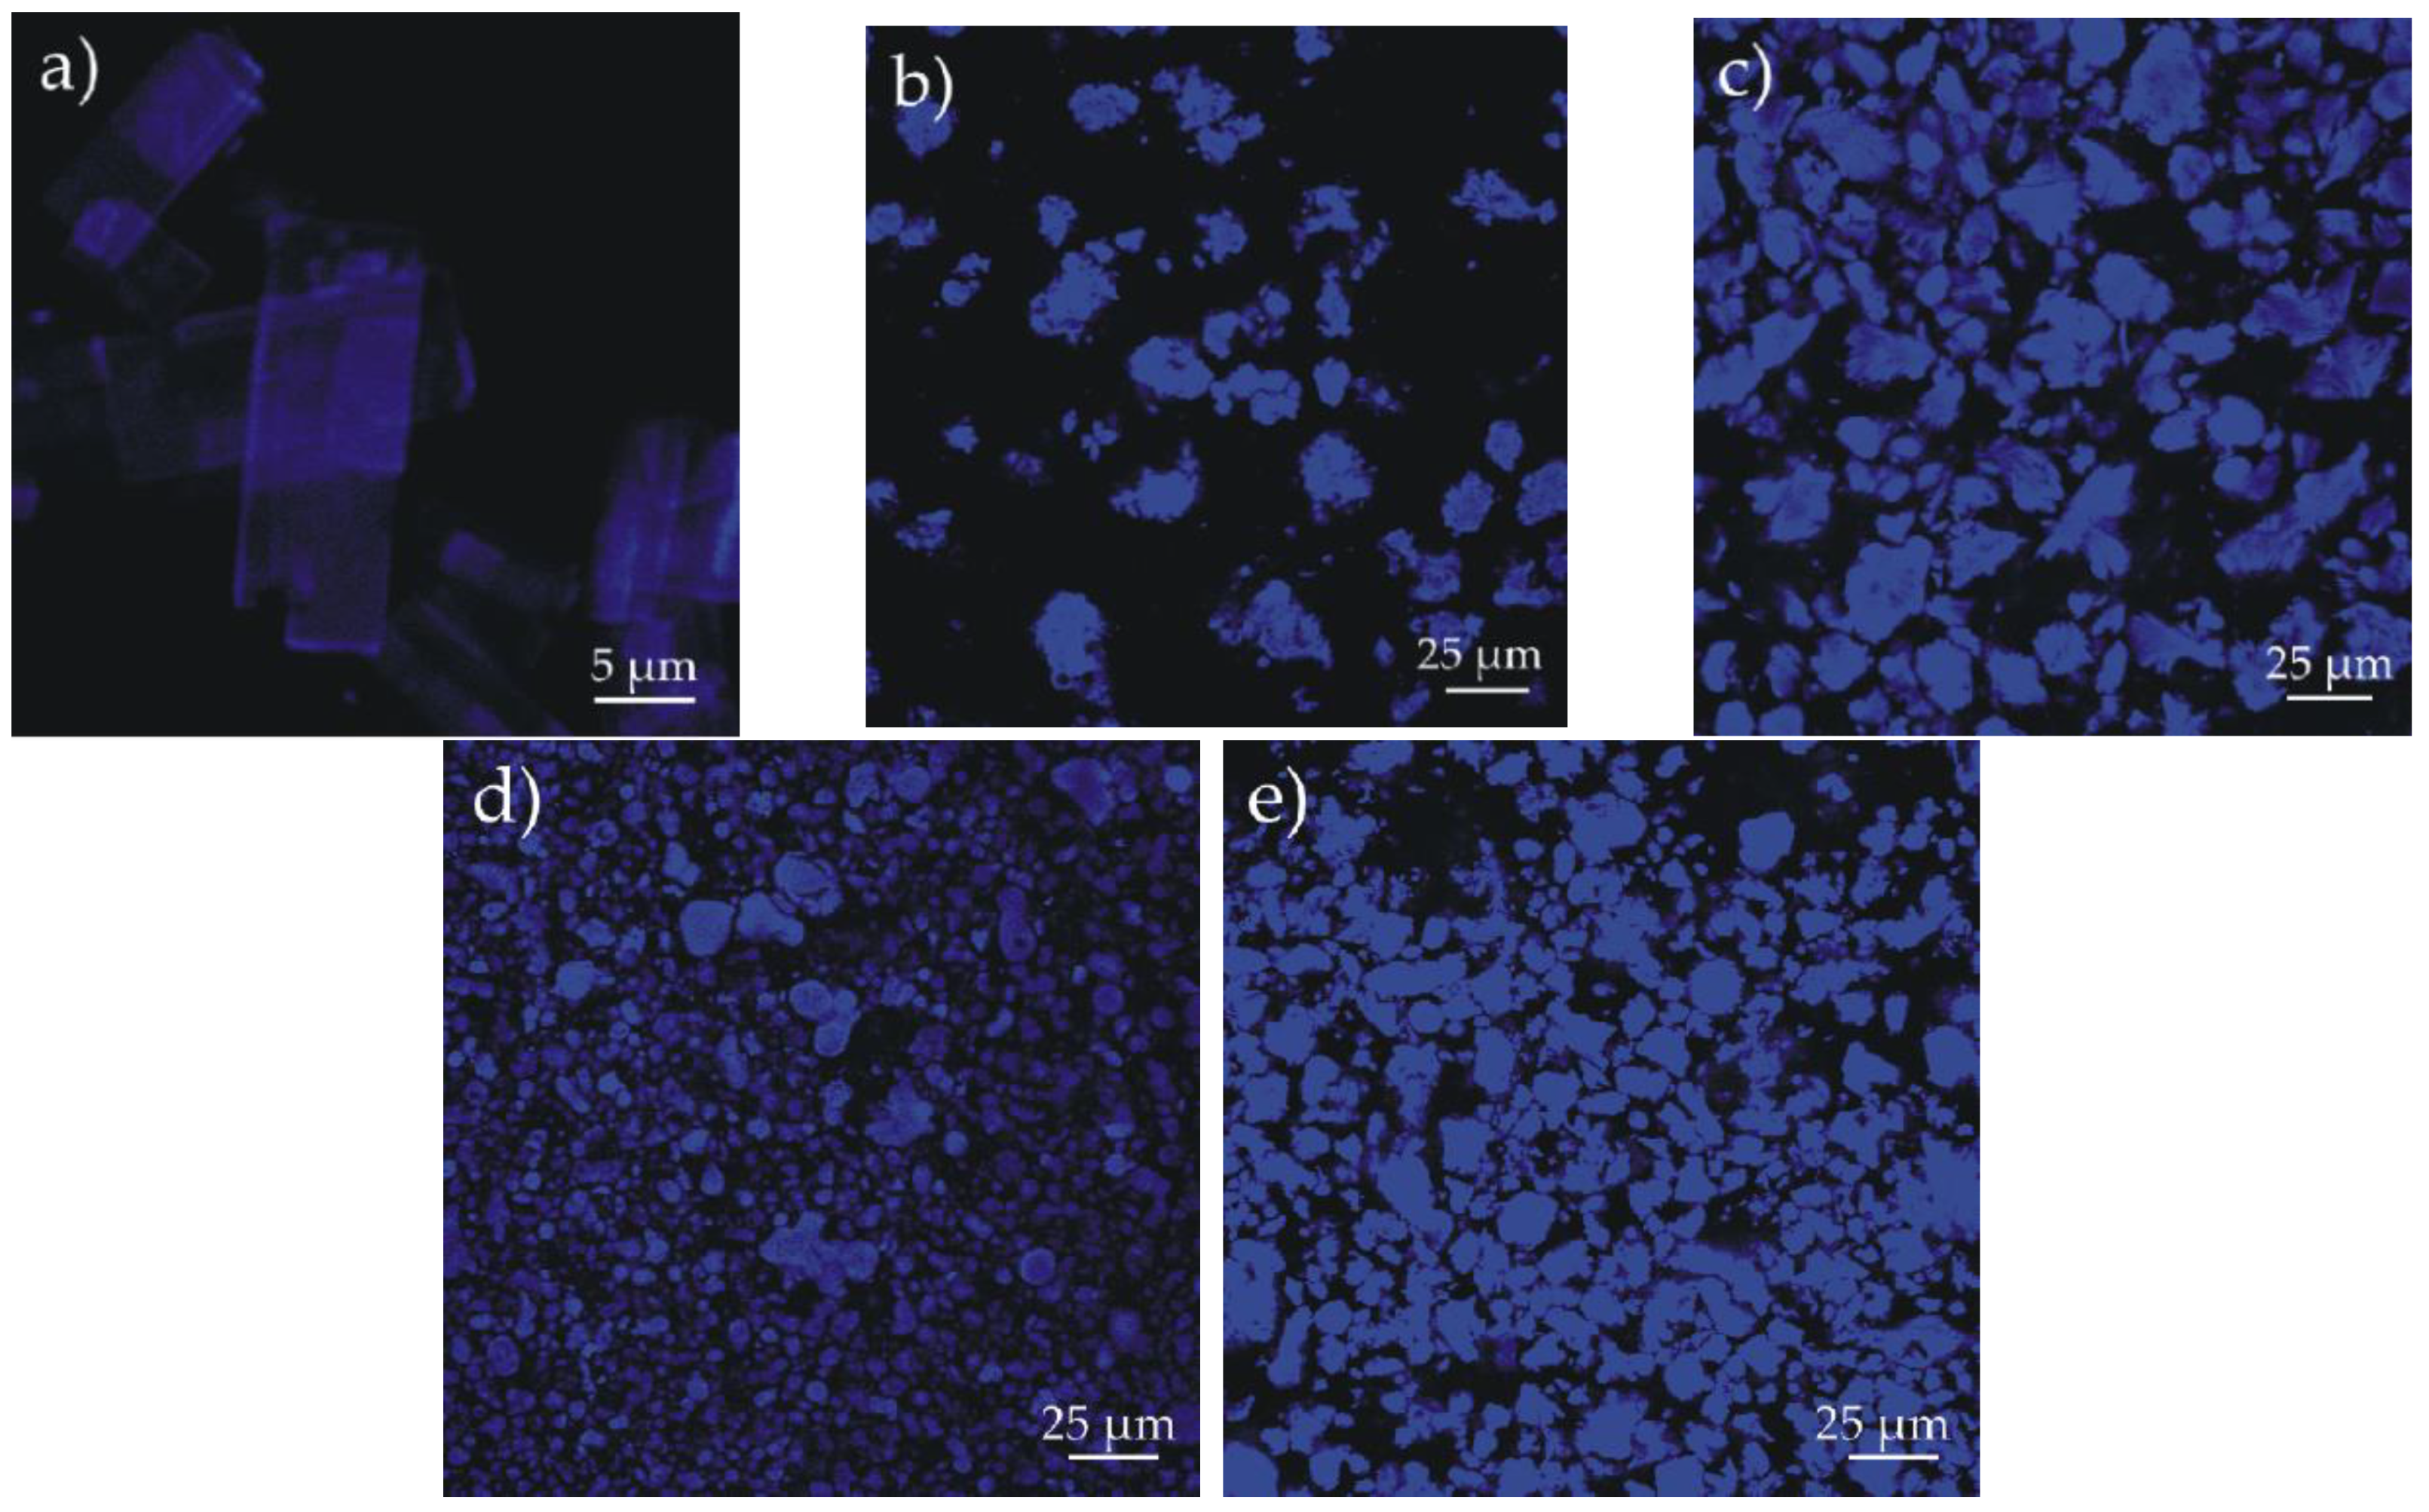
3.2. Synthesis and Characterization of the Nanosystems Composed of PAMAM Dendrimer/CPT Complex and Biodegradable Polymers
| Code | Polymer used |
Entrapment Efficiency (EE)a [%] | Drug Loading (DL)a [%] | Sizeb [nm] | Zeta Potentialb [mV] | PDIb |
|---|---|---|---|---|---|---|
| NP1 | PLLA (M1) | 25 | 16 | 190 | 5.24 ± 2.34 | 0.51 |
| NP2 | PLACL/40:60 (M2) | 27 | 17 | 110 | 34.40 ± 2.14 | 0.52 |
| NP3 | PGACL/15:85 (M3) | 22 | 14 | 284 | 23.43 ± 3.11 | 0.67 |
| NP4 | PGACL/10:90 (M4) | 11 | 7 | 406 | 26.83 ± 1.79 | 0.10 |
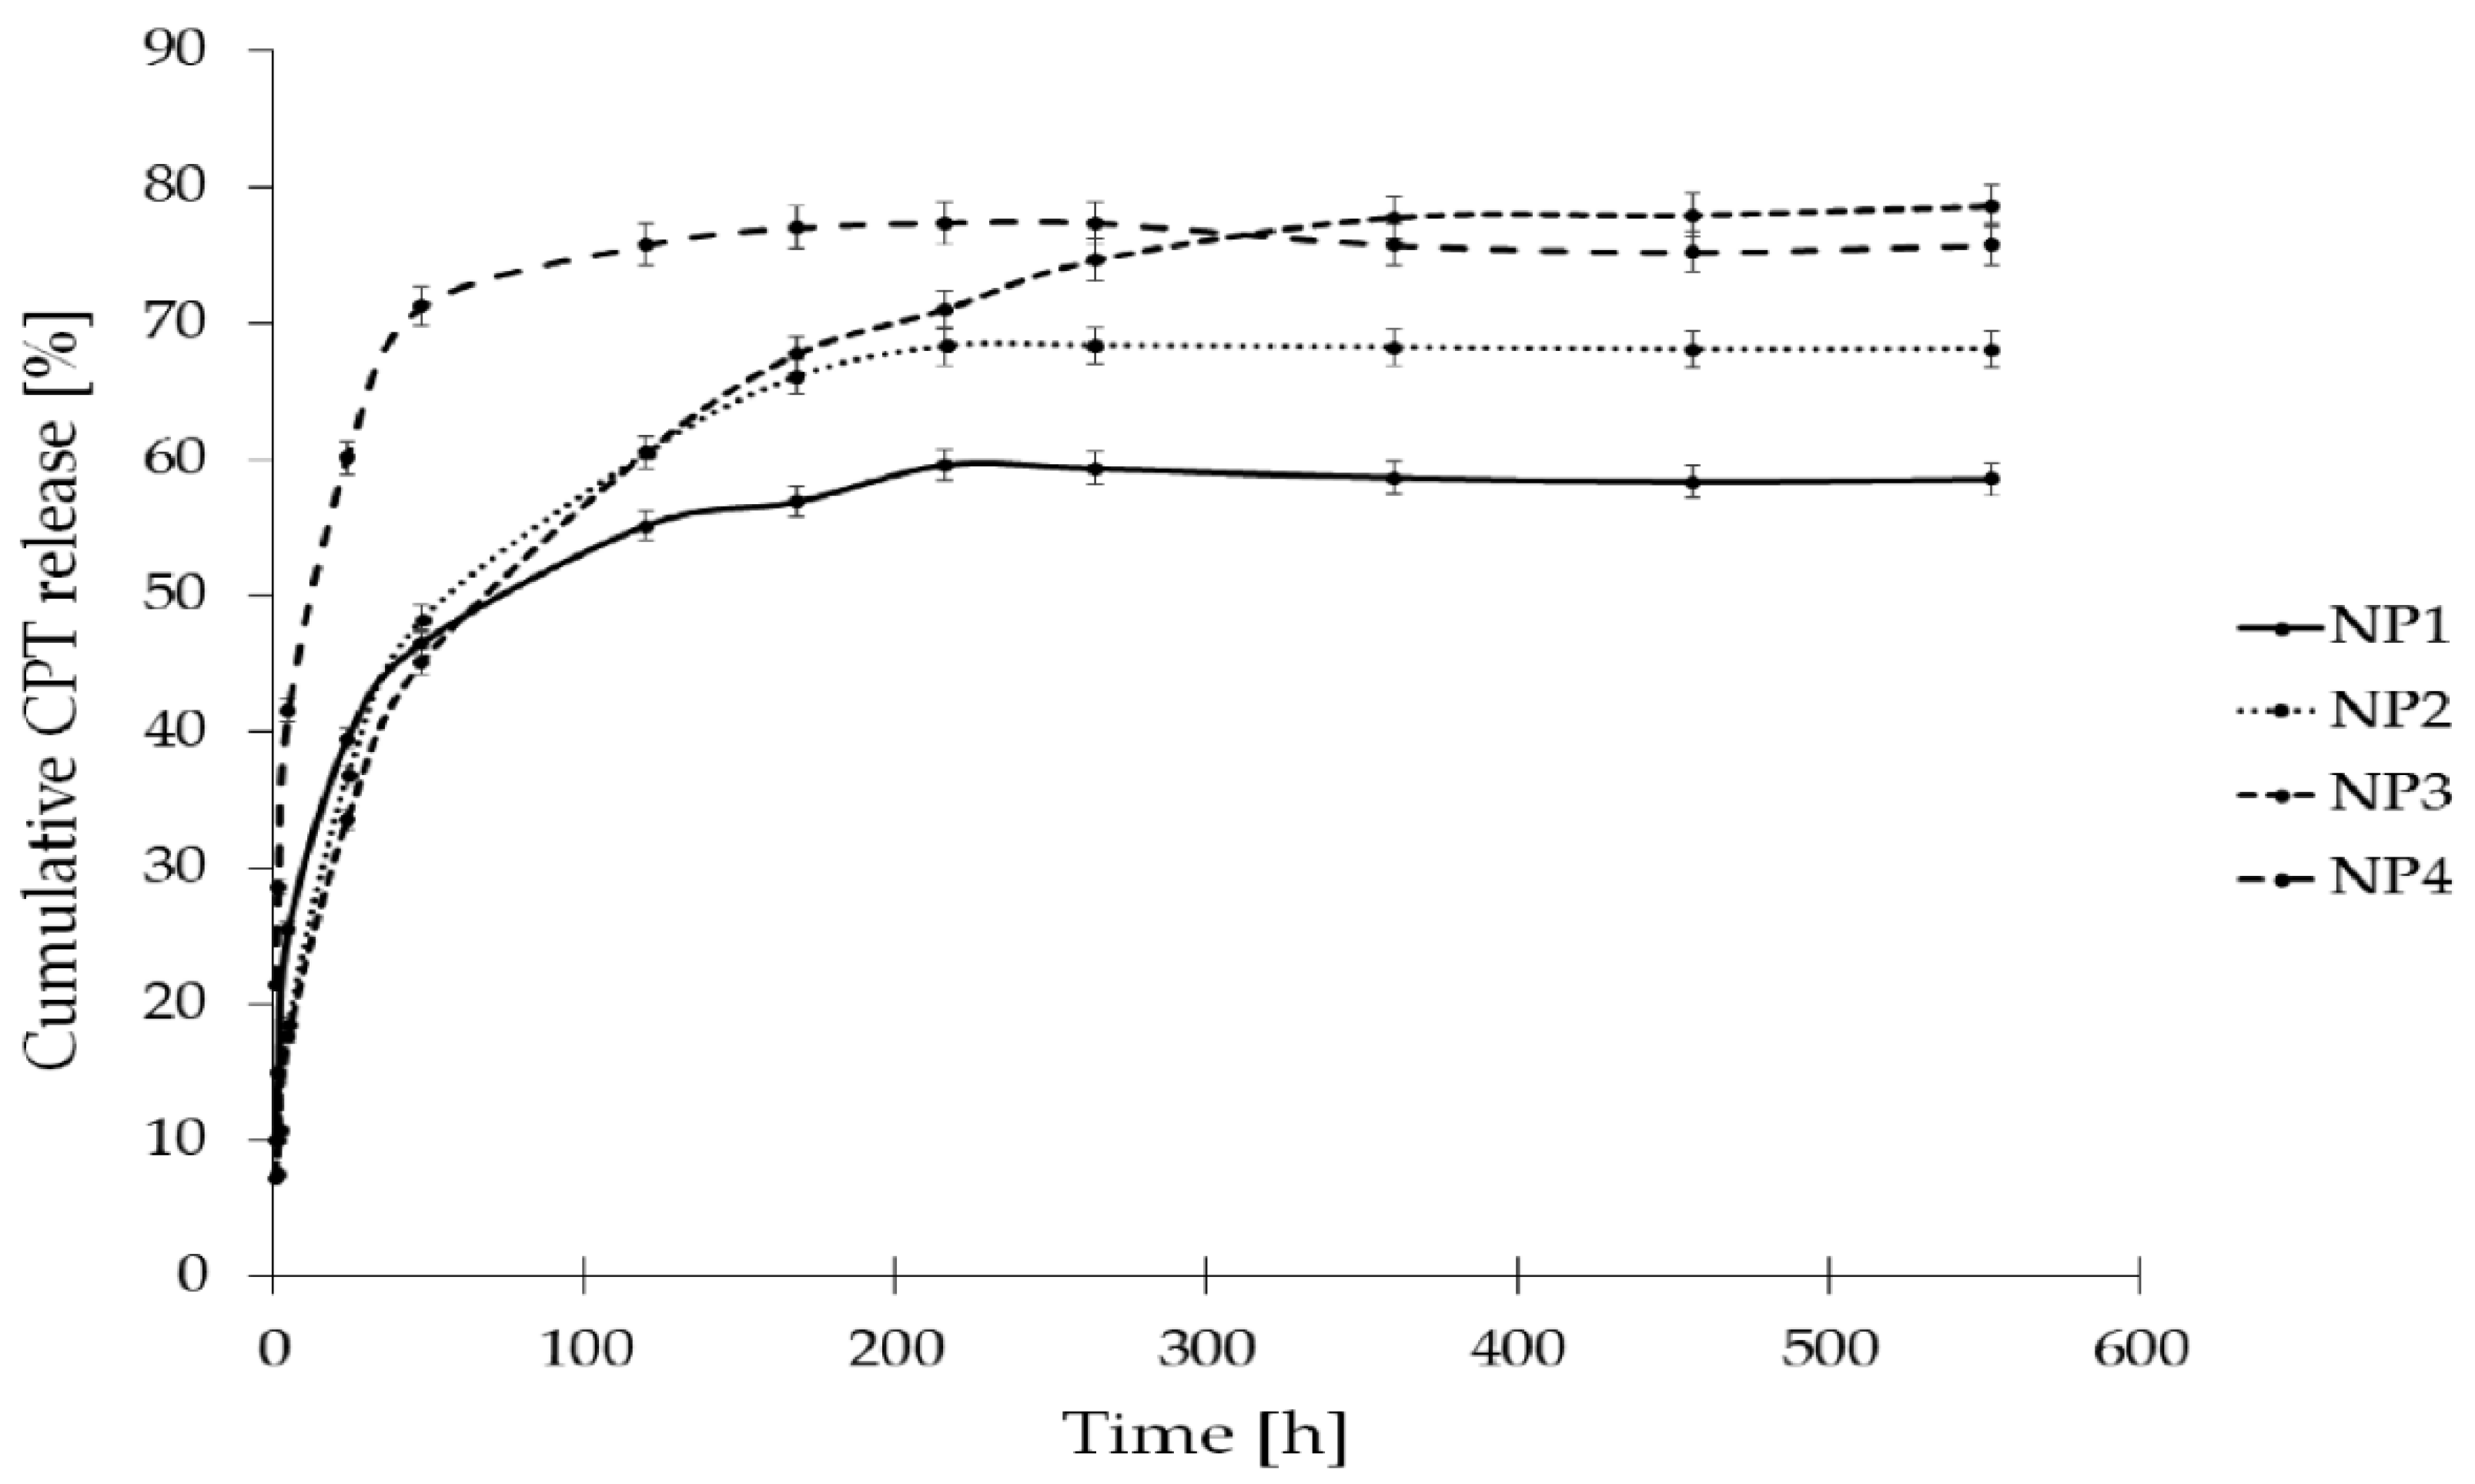
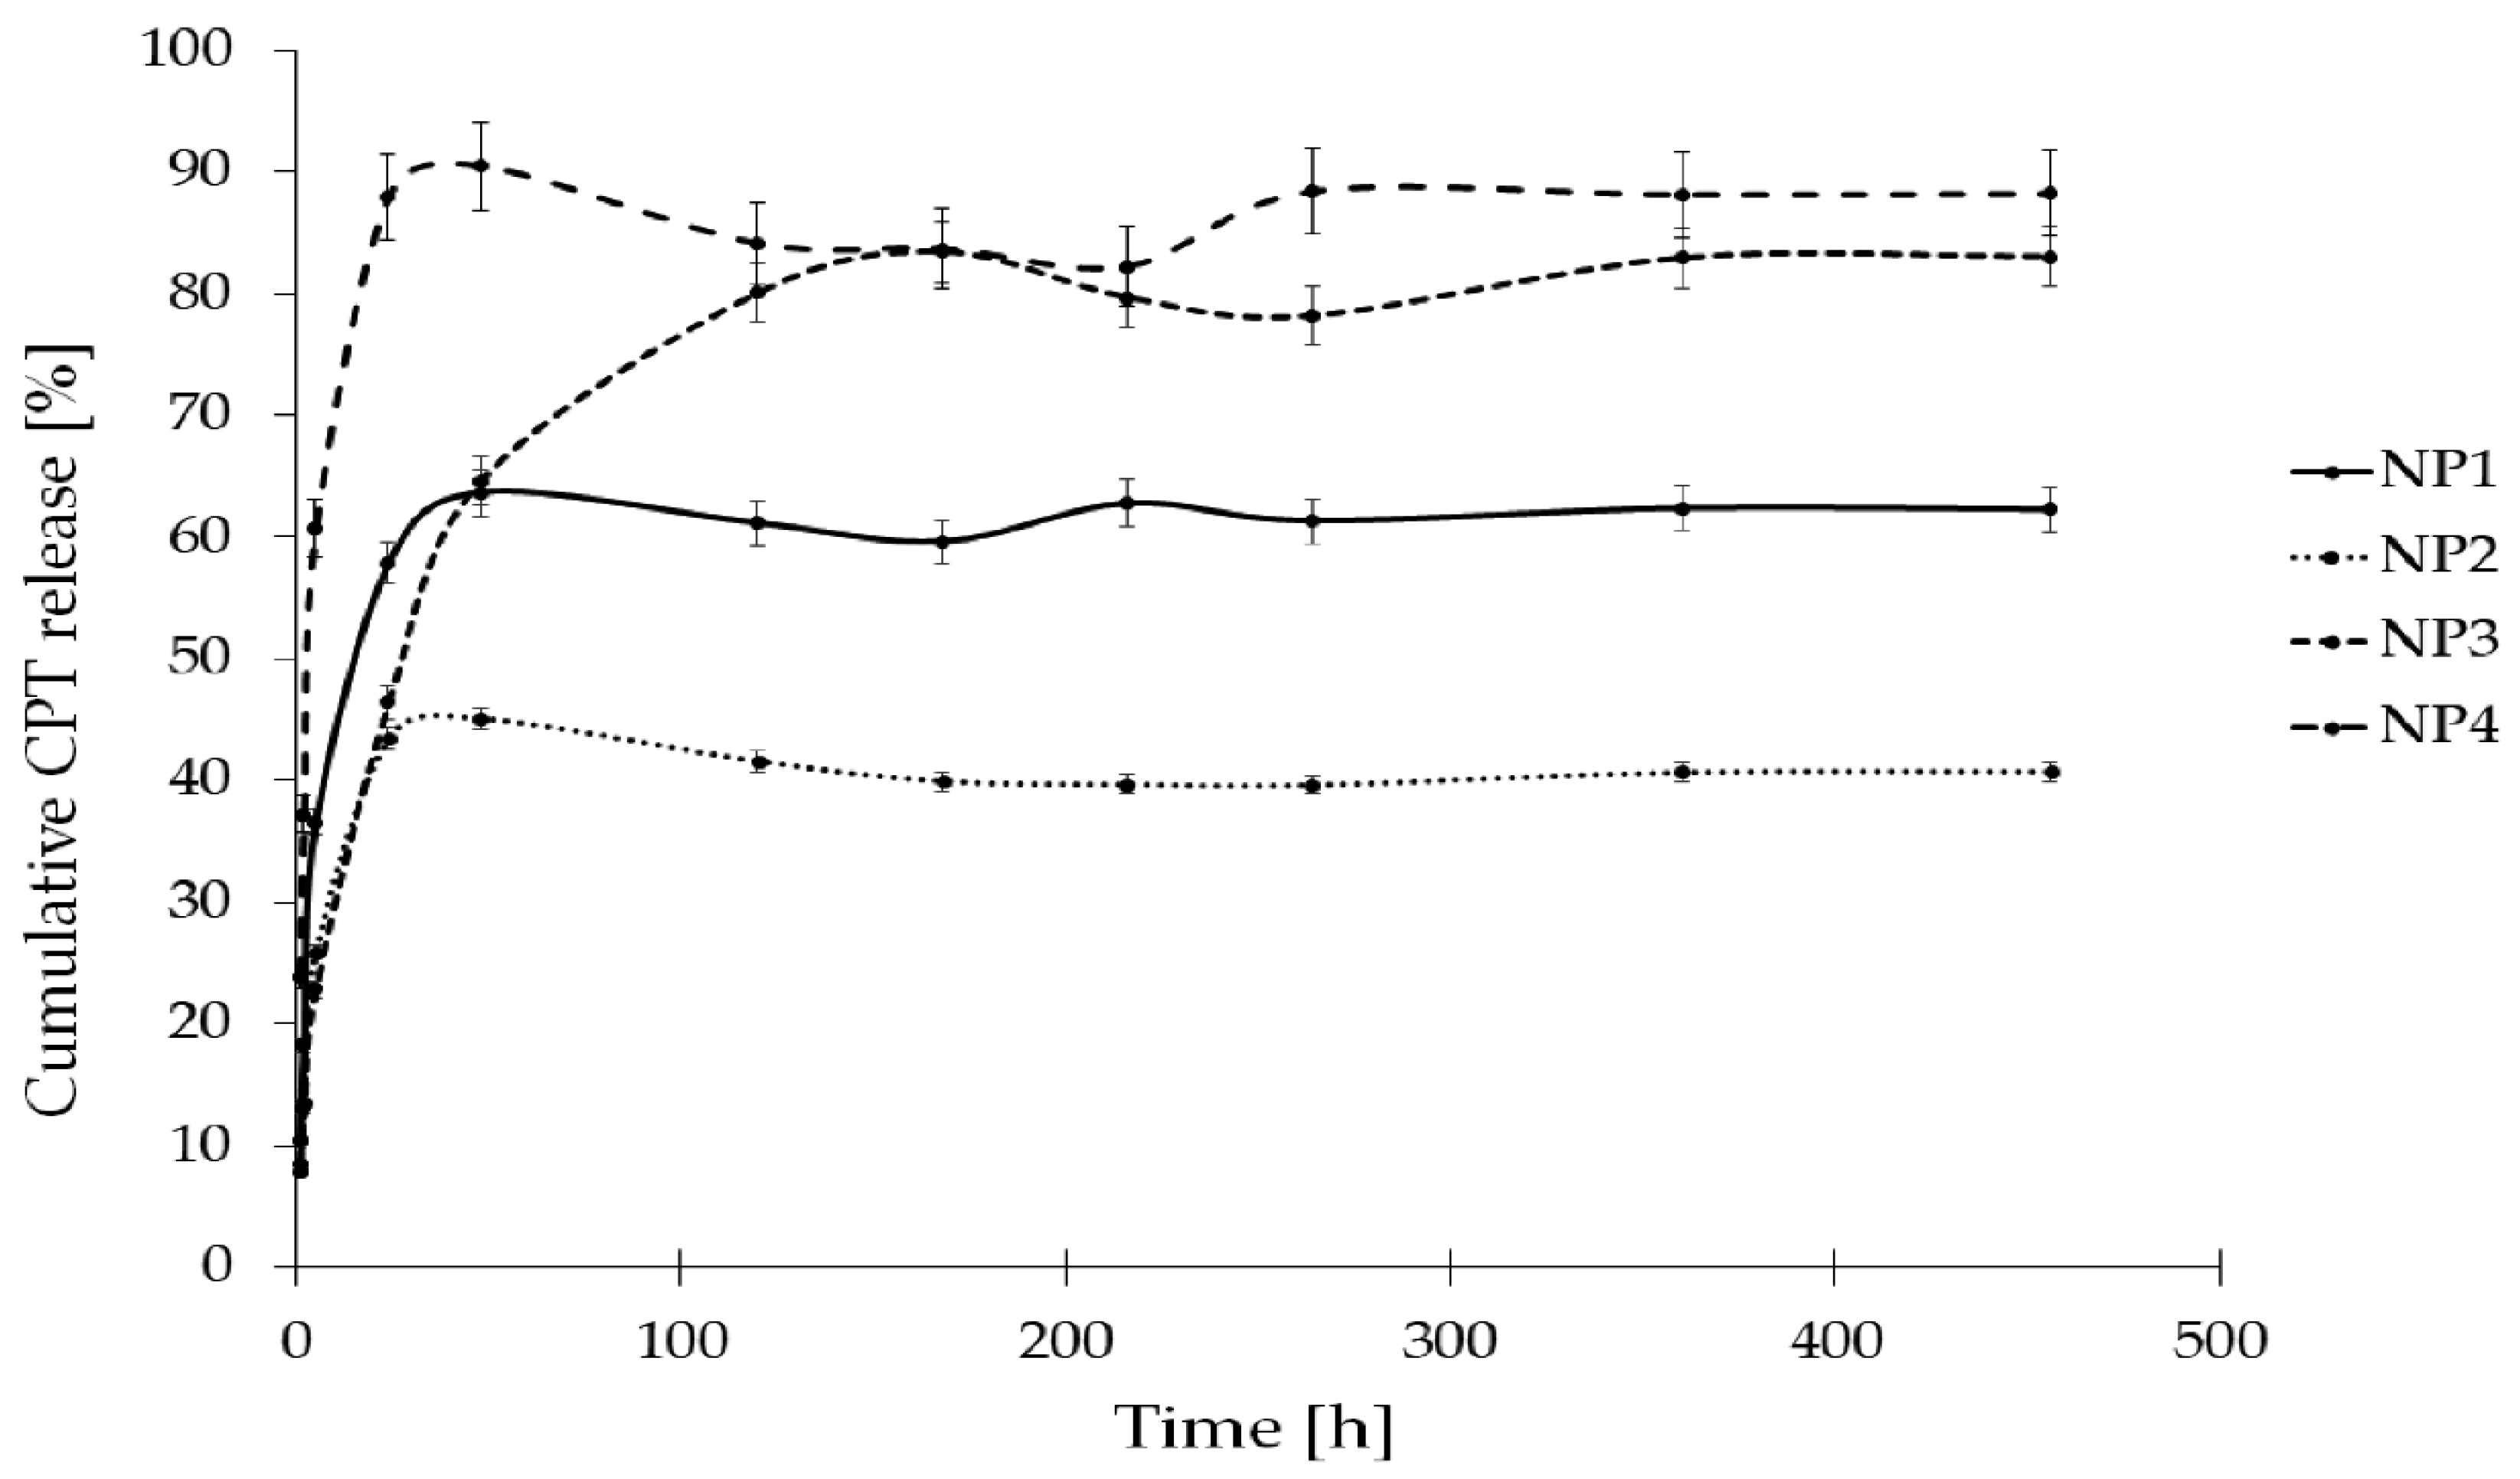
3.3. CPT Release Study from the Nanosystems Composed of PAMAM Dendrimer/CPT Complex and Biodegradable Polymmer
3.4. Molecular Modeling of the Nanosystems Composed of PAMAM Dendrimer/CPT Complex and Biodegradable Polymer
3.4.1. MODELS Preparation
3.4.2. Molecular Dynamics (MD) Simulations
4. Conclusions
Supplementary Materials
Author Contributions
Funding
Institutional Review Board Statement
Informed Consent Statement
Data Availability Statement
Acknowledgments
Conflicts of Interest
References
- Mazayen, Z.M.; Ghoneim, A.M.; Elbatanony, R.S.; Basalious, E.B.; Bendas, E.R. Pharmaceutical Nanotechnology: From the Bench to the Market. Future J. Pharm. Sci. 2022, 8, 12. [Google Scholar] [CrossRef] [PubMed]
- The Emergence of Nanopharmacy: From Biology to Nanotechnology and Drug Molecules to Nanodrugs. In Pharmaceutical Nanotechnology: Innovation and Production; John Wiley & Sons, Ltd, 2017; pp. 43–62 ISBN 978-3-527-80068-1.
- Weissig, V.; Pettinger, T.; Murdock, N. Nanopharmaceuticals (Part 1): Products on the Market. Int. J. Nanomedicine 2014, 4357. [Google Scholar] [CrossRef] [PubMed]
- Afzal, O.; Altamimi, A.S.A.; Nadeem, M.S.; Alzarea, S.I.; Almalki, W.H.; Tariq, A.; Mubeen, B.; Murtaza, B.N.; Iftikhar, S.; Riaz, N.; et al. Nanoparticles in Drug Delivery: From History to Therapeutic Applications. Nanomaterials 2022, 12. [Google Scholar] [CrossRef] [PubMed]
- Haag, R.; Kratz, F. Polymer Therapeutics: Concepts and Applications. Angew. Chem. Int. Ed. 2006, 45, 1198–1215. [Google Scholar] [CrossRef]
- Silverstein, A.M. Paul Ehrlich’s Passion: The Origins of His Receptor Immunology. Cell. Immunol. 1999, 194, 213–221. [Google Scholar] [CrossRef]
- Allen, T.M.; Cullis, P.R. Drug Delivery Systems: Entering the Mainstream. Science 2004, 303, 1818–1822. [Google Scholar] [CrossRef]
- Niemirowicz, K.; Car, H. Nanonośniki jako nowoczesne transportery w kontrolowanym dostarczaniu leków. Chemik 2012, 66, 868–881. [Google Scholar]
- Mukherjee, C.; Varghese, D.; Krishna, J.S.; Boominathan, T.; Rakeshkumar, R.; Dineshkumar, S.; Rao, C.V.S.B.; Sivaramakrishna, A. Recent Advances in Biodegradable Polymers – Properties, Applications and Future Prospects. Eur. Polym. J. 2023, 192, 112068. [Google Scholar] [CrossRef]
- Satchanska, G.; Davidova, S.; Petrov, P.D. Natural and Synthetic Polymers for Biomedical and Environmental Applications. Polymers 2024, 16. [Google Scholar] [CrossRef]
- Chen, J. Design and Synthesis of Biomedical Polymer Materials. Int. J. Mol. Sci. 2024, 25. [Google Scholar] [CrossRef]
- Deb, P.K.; Kokaz, S.F.; Abed, S.N.; Paradkar, A.; Tekade, R.K. Chapter 6 - Pharmaceutical and Biomedical Applications of Polymers. In Basic Fundamentals of Drug Delivery; Tekade, R.K., Ed.; Advances in Pharmaceutical Product Development and Research; Academic Press, 2019; pp. 203–267 ISBN 978-0-12-817909-3.
- Morsada, Z.; Hossain, M.M.; Islam, M.T.; Mobin, M.A.; Saha, S. Recent Progress in Biodegradable and Bioresorbable Materials: From Passive Implants to Active Electronics. Appl. Mater. Today 2021, 25, 101257. [Google Scholar] [CrossRef]
- Nikzamir, M.; Hanifehpour, Y.; Akbarzadeh, A.; Panahi, Y. Applications of Dendrimers in Nanomedicine and Drug Delivery: A Review. J. Inorg. Organomet. Polym. Mater. 2021, 31, 2246–2261. [Google Scholar] [CrossRef]
- Abdou, E.M. PAMAM DENDRIMERS AS DRUG DELIVERY CARRIERS , BENEFITS AGAINST RISKS.; 2017.
- Cheng, Y.; Li, M.; Xu, T. Potential of Poly(Amidoamine) Dendrimers as Drug Carriers of Camptothecin Based on Encapsulation Studies. Eur. J. Med. Chem. 2008, 43, 1791–1795. [Google Scholar] [CrossRef] [PubMed]
- Tripathy, S.; Das, M.K. Dendrimers and Their Applications as Novel Drug Delivery Carriers.; 2013.
- Huang, D.; Wu, D. Biodegradable Dendrimers for Drug Delivery. Mater. Sci. Eng. C 2018, 90, 713–727. [Google Scholar] [CrossRef]
- Siegel, R.L.; Giaquinto, A.N.; Jemal, A. Cancer Statistics, 2024. CA. Cancer J. Clin. 2024, 74, 12–49. [Google Scholar] [CrossRef]
- Wojciechowska, U.; Barańska, K.; Miklewska, M.; Didkowska, J.A. Cancer Incidence and Mortality in Poland in 2020. Nowotw. J. Oncol. 2023, 73, 129–145. [Google Scholar] [CrossRef]
- Cegieła, U.; Janiec, W.; Folwarczna, J.; Janas, A.; Janiec, R.; Kaczmarczyk-Sedlak, I.; Londzin, P.; Nowińska, B.; Podwińska, E.; Pytlik, M.; et al. Kompendium Farmakologii; PZWL, 2021; ISBN 978-83-200-6052-2.
- Strąg-Lemanowicz, A.; Leppert, W. Rola Onkologicznego Leczenia Systemowego u Pacjentów z Zaawansowaną Chorobą Nowotworową. Palliat. Med. Pract. 2014, 8, 11–22. [Google Scholar]
- Ramadori, G.; Cameron, S. Effects of Systemic Chemotherapy on the Liver. Ann. Hepatol. 2010, 9, 133–143. [Google Scholar] [CrossRef]
- Strzelecka, K.; Piotrowska, U.; Sobczak, M.; Oledzka, E. The Advancement of Biodegradable Polyesters as Delivery Systems for Camptothecin and Its Analogues—A Status Report. Int. J. Mol. Sci. 2023, 24. [Google Scholar] [CrossRef]
- Ziomkowska, B.; Kruszewski, S.; Siuda, R.; Cyrankiewicz, M. Deactivation Rate of Camptothecin Determined by Factor Analysis of Steady-State Fluorescence and Absorption Spectra. Opt. Appl. 2006, 36, 137–146. [Google Scholar]
- Pommier, Y. Topoisomerase I Inhibitors: Camptothecins and Beyond. Nat. Rev. Cancer 2006, 6, 789–802. [Google Scholar] [CrossRef] [PubMed]
- Botella, P.; Rivero-Buceta, E.M. Safe Approaches for Camptothecin Delivery: Structural Analogues and Nanomedicines. J. Controlled Release 2017, 247, 28–54. [Google Scholar] [CrossRef] [PubMed]
- Alshammari, M.K.; Alshehri, M.M.; Alshehri, A.M.; Alshlali, O.M.; Mahzari, A.M.; Almalki, H.H.; Kulaybi, O.Y.; Alghazwni, M.K.; Kamal, M.; Imran, M. Camptothecin Loaded Nano-Delivery Systems in the Cancer Therapeutic Domains: A Critical Examination of the Literature. J. Drug Deliv. Sci. Technol. 2023, 79, 104034. [Google Scholar] [CrossRef]
- Min, K.H.; Park, K.; Kim, Y.-S.; Bae, S.M.; Lee, S.; Jo, H.G.; Park, R.-W.; Kim, I.-S.; Jeong, S.Y.; Kim, K.; et al. Hydrophobically Modified Glycol Chitosan Nanoparticles-Encapsulated Camptothecin Enhance the Drug Stability and Tumor Targeting in Cancer Therapy. J. Controlled Release 2008, 127, 208–218. [Google Scholar] [CrossRef]
- Watanabe, M.; Kawano, K.; Toma, K.; Hattori, Y.; Maitani, Y. In Vivo Antitumor Activity of Camptothecin Incorporated in Liposomes Formulated with an Artificial Lipid and Human Serum Albumin. J. Controlled Release 2008, 127, 231–238. [Google Scholar] [CrossRef]
- Kawano, K.; Watanabe, M.; Yamamoto, T.; Yokoyama, M.; Opanasopit, P.; Okano, T.; Maitani, Y. Enhanced Antitumor Effect of Camptothecin Loaded in Long-Circulating Polymeric Micelles. J. Controlled Release 2006, 112, 329–332. [Google Scholar] [CrossRef]
- Martins, S.M.; Sarmento, B.; Nunes, C.; Lúcio, M.; Reis, S.; Ferreira, D.C. Brain Targeting Effect of Camptothecin-Loaded Solid Lipid Nanoparticles in Rat after Intravenous Administration. Eur. J. Pharm. Biopharm. 2013, 85, 488–502. [Google Scholar] [CrossRef]
- Kubiak, M. Dendrymery – fascynujące nanocząsteczki w zastosowaniu w medycynie. Chemik 2014, 68, 141–150. [Google Scholar]
- Oledzka, E.; Paśnik, K.; Domańska, I.; Zielińska-Pisklak, M.; Piotrowska, U.; Sobczak, M.; Szeleszczuk, Ł.; Laskowska, A. Poly(Amidoamine) Dendrimer/Camptothecin Complex: From Synthesis to In Vitro Cancer Cell Line Studies. Molecules 2023, 28, 2696–2717. [Google Scholar] [CrossRef]
- Bero, M.; Kasperczyk, J.; Jedlinski, Z.J. Coordination Polymerization of Lactides, 1. Structure Determination of Obtained Polymers. Makromol. Chem. 1990, 191, 2287–2296. [Google Scholar] [CrossRef]
- Kasperczyk, J.; Bero, M. Coordination Polymerization of Lactides, 2.Microstructure Determination of Poly[(L,L-Lactide)-Co-(ε-Caprolactone)] with 13C Nuclear Magnetic Resonance Spectroscopy. Makromol. Chem. 1991, 192, 1777–1787. [Google Scholar] [CrossRef]
- Bero, M.; Czapla, B.; Dobrzyński, P.; Janeczek, H.; Kasperczyk, J. Copolymerization of Glycolide Andε-Caprolactone, 2. Random Copolymerization in the Presence of Tin Octoate. Macromol. Chem. Phys. 1999, 200, 911–916. [Google Scholar] [CrossRef]
- Dash, S.; Murthy, P.; Nath, L.; Chowdhury, P. Kinetic Modeling on Drug Release from Controlled Drug Delivery Systems. Acta Pol. Pharm. 2010, 67, 217–223. [Google Scholar] [PubMed]
- Singhvi, G.; Singh, M. Review: In Vitro Drug Release Characterization Models. Int. J. Pharm. Stud. Res. 2011, 2, 77–84. [Google Scholar]
- Bialik, M.; Proc, J.; Zgadzaj, A.; Mulas, K.; Kuras, M.; Sobczak, M.; Oledzka, E. Development and Comprehensive Characteristics of Thermosensitive Liquid Suppositories of Metoprolol Based on Poly(Lactide-Co-Glycolide) Nanoparticles. Int. J. Mol. Sci. 2022, 23. [Google Scholar] [CrossRef]
- Bialik, M.; Kurkowski, P.; Strzelecka, K.; Kuras, M.; Sobczak, M.; Mulas, K.; Zgadzaj, A.; Czerwińska, M.E.; Gniadek, M.; Oledzka, E. Dual-Controlled Delivery of Furosemide and Atenolol Using a Biodegradable Nanosystem for Antihypertensive Therapy. J. Drug Deliv. Sci. Technol. 2023, 89, 105006. [Google Scholar] [CrossRef]
- Sæbø, I.P.; Bjørås, M.; Franzyk, H.; Helgesen, E.; Booth, J.A. Optimization of the Hemolysis Assay for the Assessment of Cytotoxicity. Int. J. Mol. Sci. 2023, 24. [Google Scholar] [CrossRef]
- Otto, D.P.; Villiers, M.M. de All-atomistic Molecular Dynamics (AA-MD) Studies and Pharmacokinetic Performance of PAMAM-dendrimer-furosemide Delivery Systems. Int. J. Pharm. 2018, 547, 545–555. [Google Scholar] [CrossRef]
- Sun, H.; Jin, Z.; Yang, C.; Akkermans, R.L.C.; Robertson, S.H.; Spenley, N.A.; Miller, S.; Todd, S.M. COMPASS II: Extended Coverage for Polymer and Drug-like Molecule Databases. J. Mol. Model. 2016, 22, 1–10. [Google Scholar] [CrossRef]
- Wang, L.; Lv, C.; Liu, Z.; Zhang, N.; Zhou, W.; Wang, J. Study on the Mechanism of PAMAM(DETA as the Core) against Silica Scale. J. Mol. Model. 2021, 27, 304. [Google Scholar] [CrossRef]
- Al Ameri, J.; Alsuraifi, A.; Curtis, A.; Hoskins, C. Effect of Poly(Allylamine) Molecular Weight on Drug Loading and Release Abilities of Nano-Aggregates for Potential in Cancer Nanomedicine. J. Pharm. Sci. 2020, 109, 3125–3133. [Google Scholar] [CrossRef] [PubMed]
- Domańska, I.M.; Zgadzaj, A.; Kowalczyk, S.; Zalewska, A.; Oledzka, E.; Cieśla, K.; Plichta, A.; Sobczak, M. A Comprehensive Investigation of the Structural, Thermal, and Biological Properties of Fully Randomized Biomedical Polyesters Synthesized with a Nontoxic Bismuth(III) Catalyst. Molecules 2022, 27, 1139. [Google Scholar] [CrossRef] [PubMed]
- Dobrovolskaia, M.A.; McNeil, S.E. Understanding the Correlation between in Vitro and in Vivo Immunotoxicity Tests for Nanomedicines. J. Controlled Release 2013, 172, 456–466. [Google Scholar] [CrossRef] [PubMed]
- Lu Senlin; Duffin Rodger; Poland Craig; Daly Paul; Murphy Fiona; Drost Ellen; MacNee William; Stone Vicki; Donaldson Ken Efficacy of Simple Short-Term in Vitro Assays for Predicting the Potential of Metal Oxide Nanoparticles to Cause Pulmonary Inflammation. Environ. Health Perspect. 2009, 117, 241–247. [CrossRef]
- Jeong, H.; Hwang, J.; Lee, H.; Hammond, P.T.; Choi, J.; Hong, J. In Vitro Blood Cell Viability Profiling of Polymers Used in Molecular Assembly. Sci. Rep. 2017, 7. [Google Scholar] [CrossRef] [PubMed]
- Weiss, M.; Fan, J.; Claudel, M.; Sonntag, T.; Didier, P.; Ronzani, C.; Lebeau, L.; Pons, F. Density of Surface Charge Is a More Predictive Factor of the Toxicity of Cationic Carbon Nanoparticles than Zeta Potential. J. Nanobiotechnology 2021, 19, 5. [Google Scholar] [CrossRef]
- Li, F.; Jiang, T.; Li, Q.; Ling, X. Camptothecin (CPT) and Its Derivatives Are Known to Target Topoisomerase I (Top1) as Their Mechanism of Action: Did We Miss Something in CPT Analogue Molecular Targets for Treating Human Disease Such as Cancer? Am. J. Cancer Res. 2017, 7, 2350–2394. [Google Scholar]
- Díaz-Celorio, E.; Franco, L.; Rodríguez-Galán, A.; Puiggalí, J. Study on the Hydrolytic Degradation of Glycolide/Trimethylene Carbonate Copolymers Having Different Microstructure and Composition. Polym. Degrad. Stab. 2013, 98, 133–143. [Google Scholar] [CrossRef]
- Memiṣoǧlu, E.; Bochot, A.; Özalp, M.; Şen, M.; Duchěne, D.; Hincal, A.A. Direct Formation of Nanospheres from Amphiphilic β-Cyclodextrin Inclusion Complexes. Pharm. Res. 2004, 20, 117–125. [Google Scholar] [CrossRef]
- Fassberg, J.; Stella, V.J. A Kinetic and Mechanistic Study of the Hydrolysis of Camptothecin and Some Analogues. J. Pharm. Sci. 1992, 81, 676–684. [Google Scholar] [CrossRef]
- Liu, J.; Jiang, Z.; Zhang, S.; Saltzman, W.M. Poly(ω-Pentadecalactone-Co-Butylene-Co-Succinate) Nanoparticles as Biodegradable Carriers for Camptothecin Delivery. Biomaterials 2009, 30, 5707–5719. [Google Scholar] [CrossRef] [PubMed]
- Opitz, A.W.; Wagner, N.J. Structural Investigations of Poly(Amido Amine) Dendrimers in Methanol Using Molecular Dynamics. J. Polym. Sci. Part B 2006, 44, 3062–3077. [Google Scholar] [CrossRef]
- Pourianazar, N.T.; Mutlu, P.; Gunduz, U. Bioapplications of Poly(Amidoamine) (PAMAM) Dendrimers in Nanomedicine. J. Nanoparticle Res. 2014, 16, 1–38. [Google Scholar] [CrossRef]
- Liu, Y.; Bryantsev, V.S.; Diallo, M.S.; Goddard III, W.A. PAMAM Dendrimers Undergo pH Responsive Conformational Changes without Swelling. J. Am. Chem. Soc. 2009, 131, 2798–2799. [Google Scholar] [CrossRef]
- Canetta, E.; Maino, G. Molecular Dynamic Analysis of the Structure of Dendrimers. Nucl. Instrum. Methods Phys. Res. Sect. B Beam Interact. Mater. At. 2004, 213, 71–74. [Google Scholar] [CrossRef]
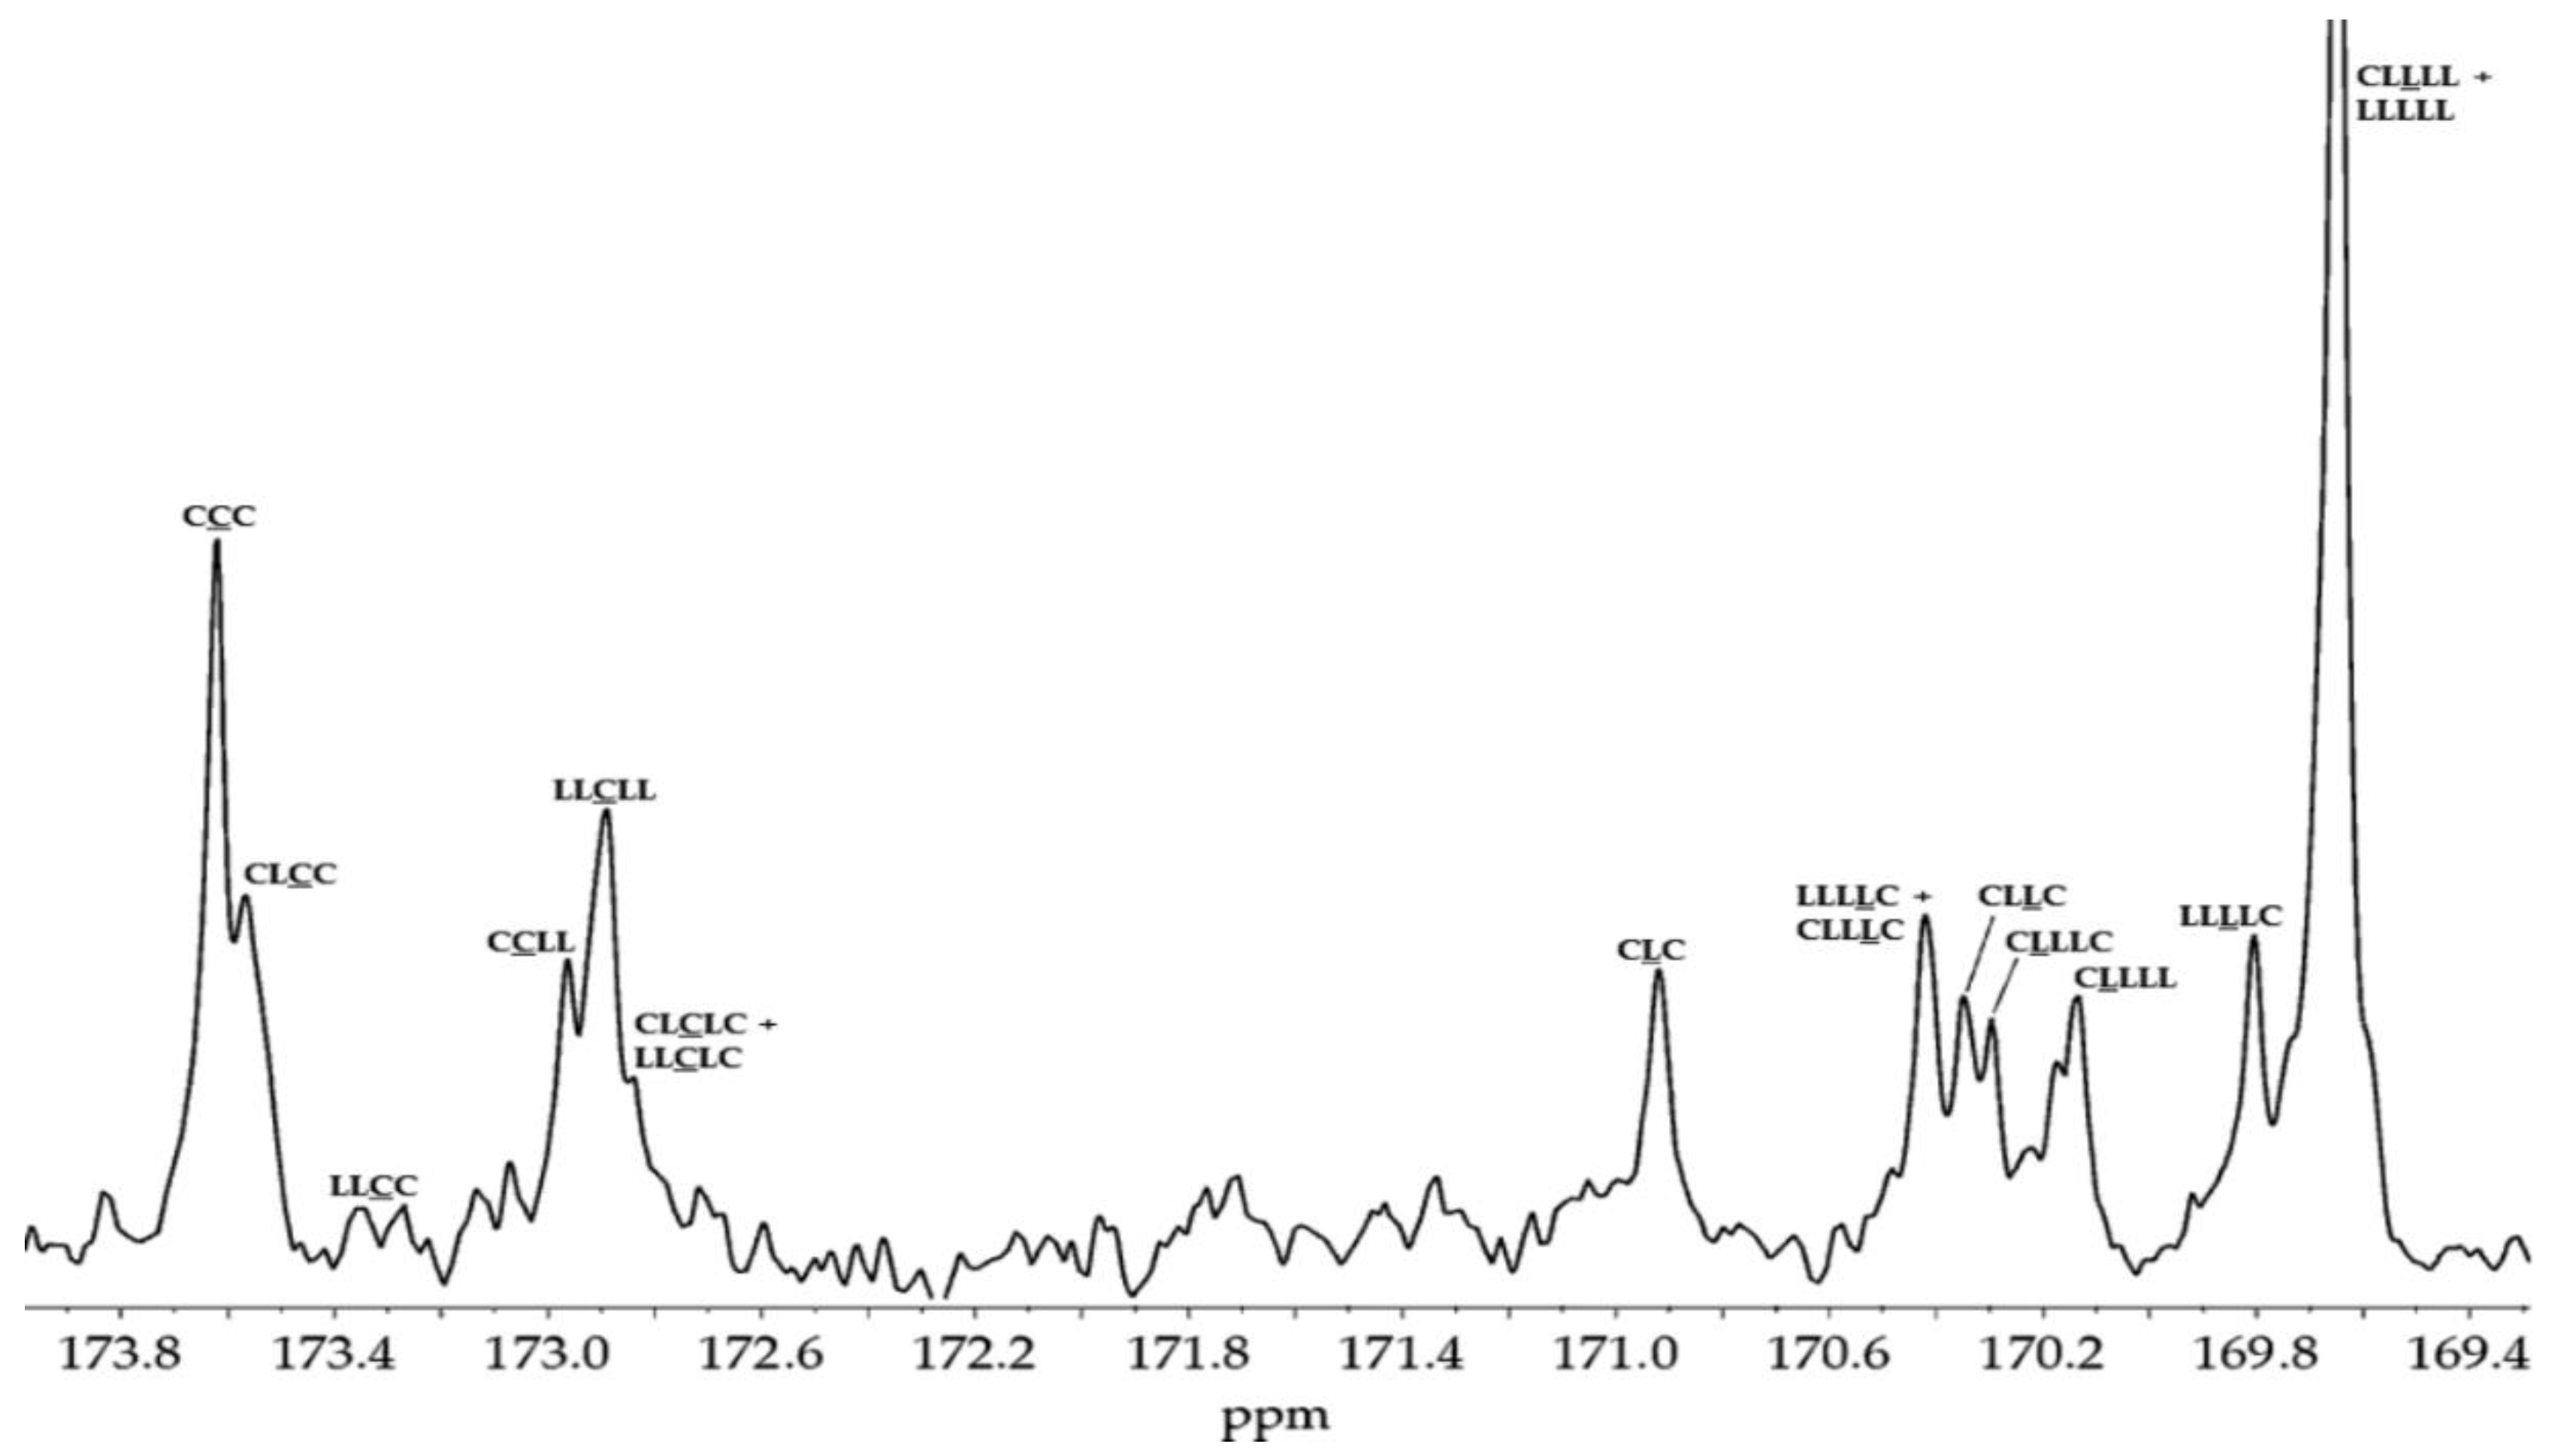
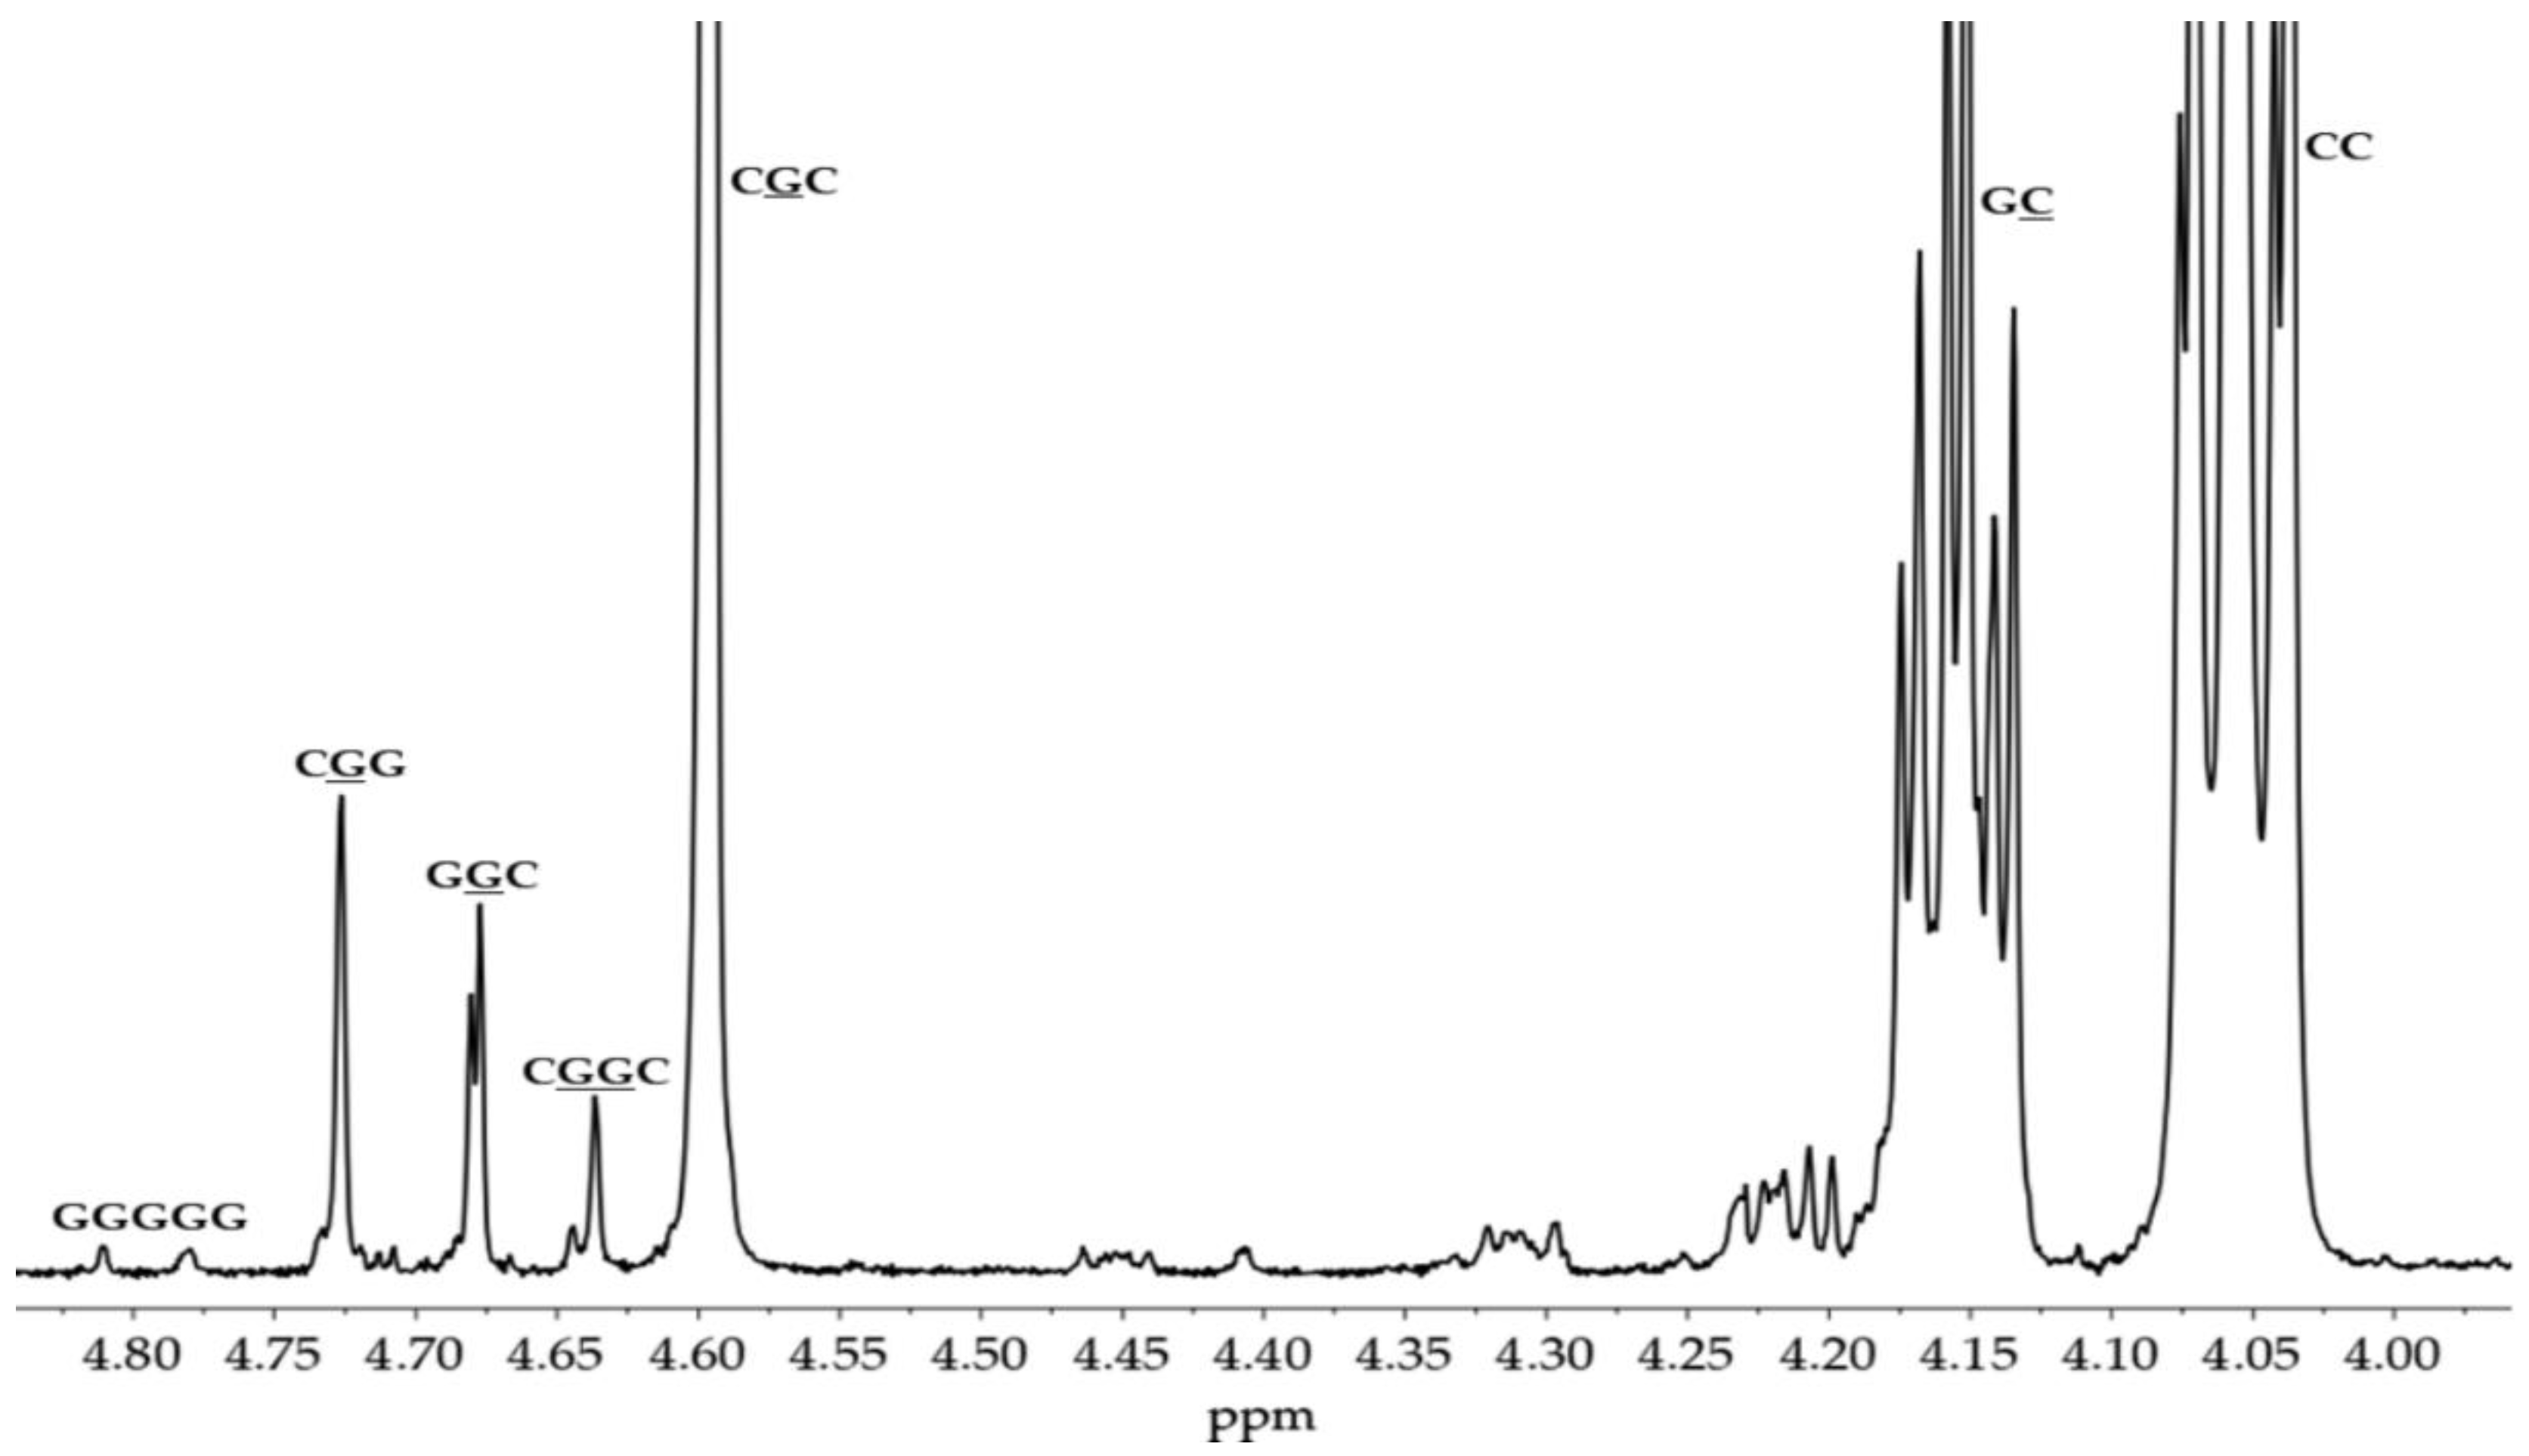
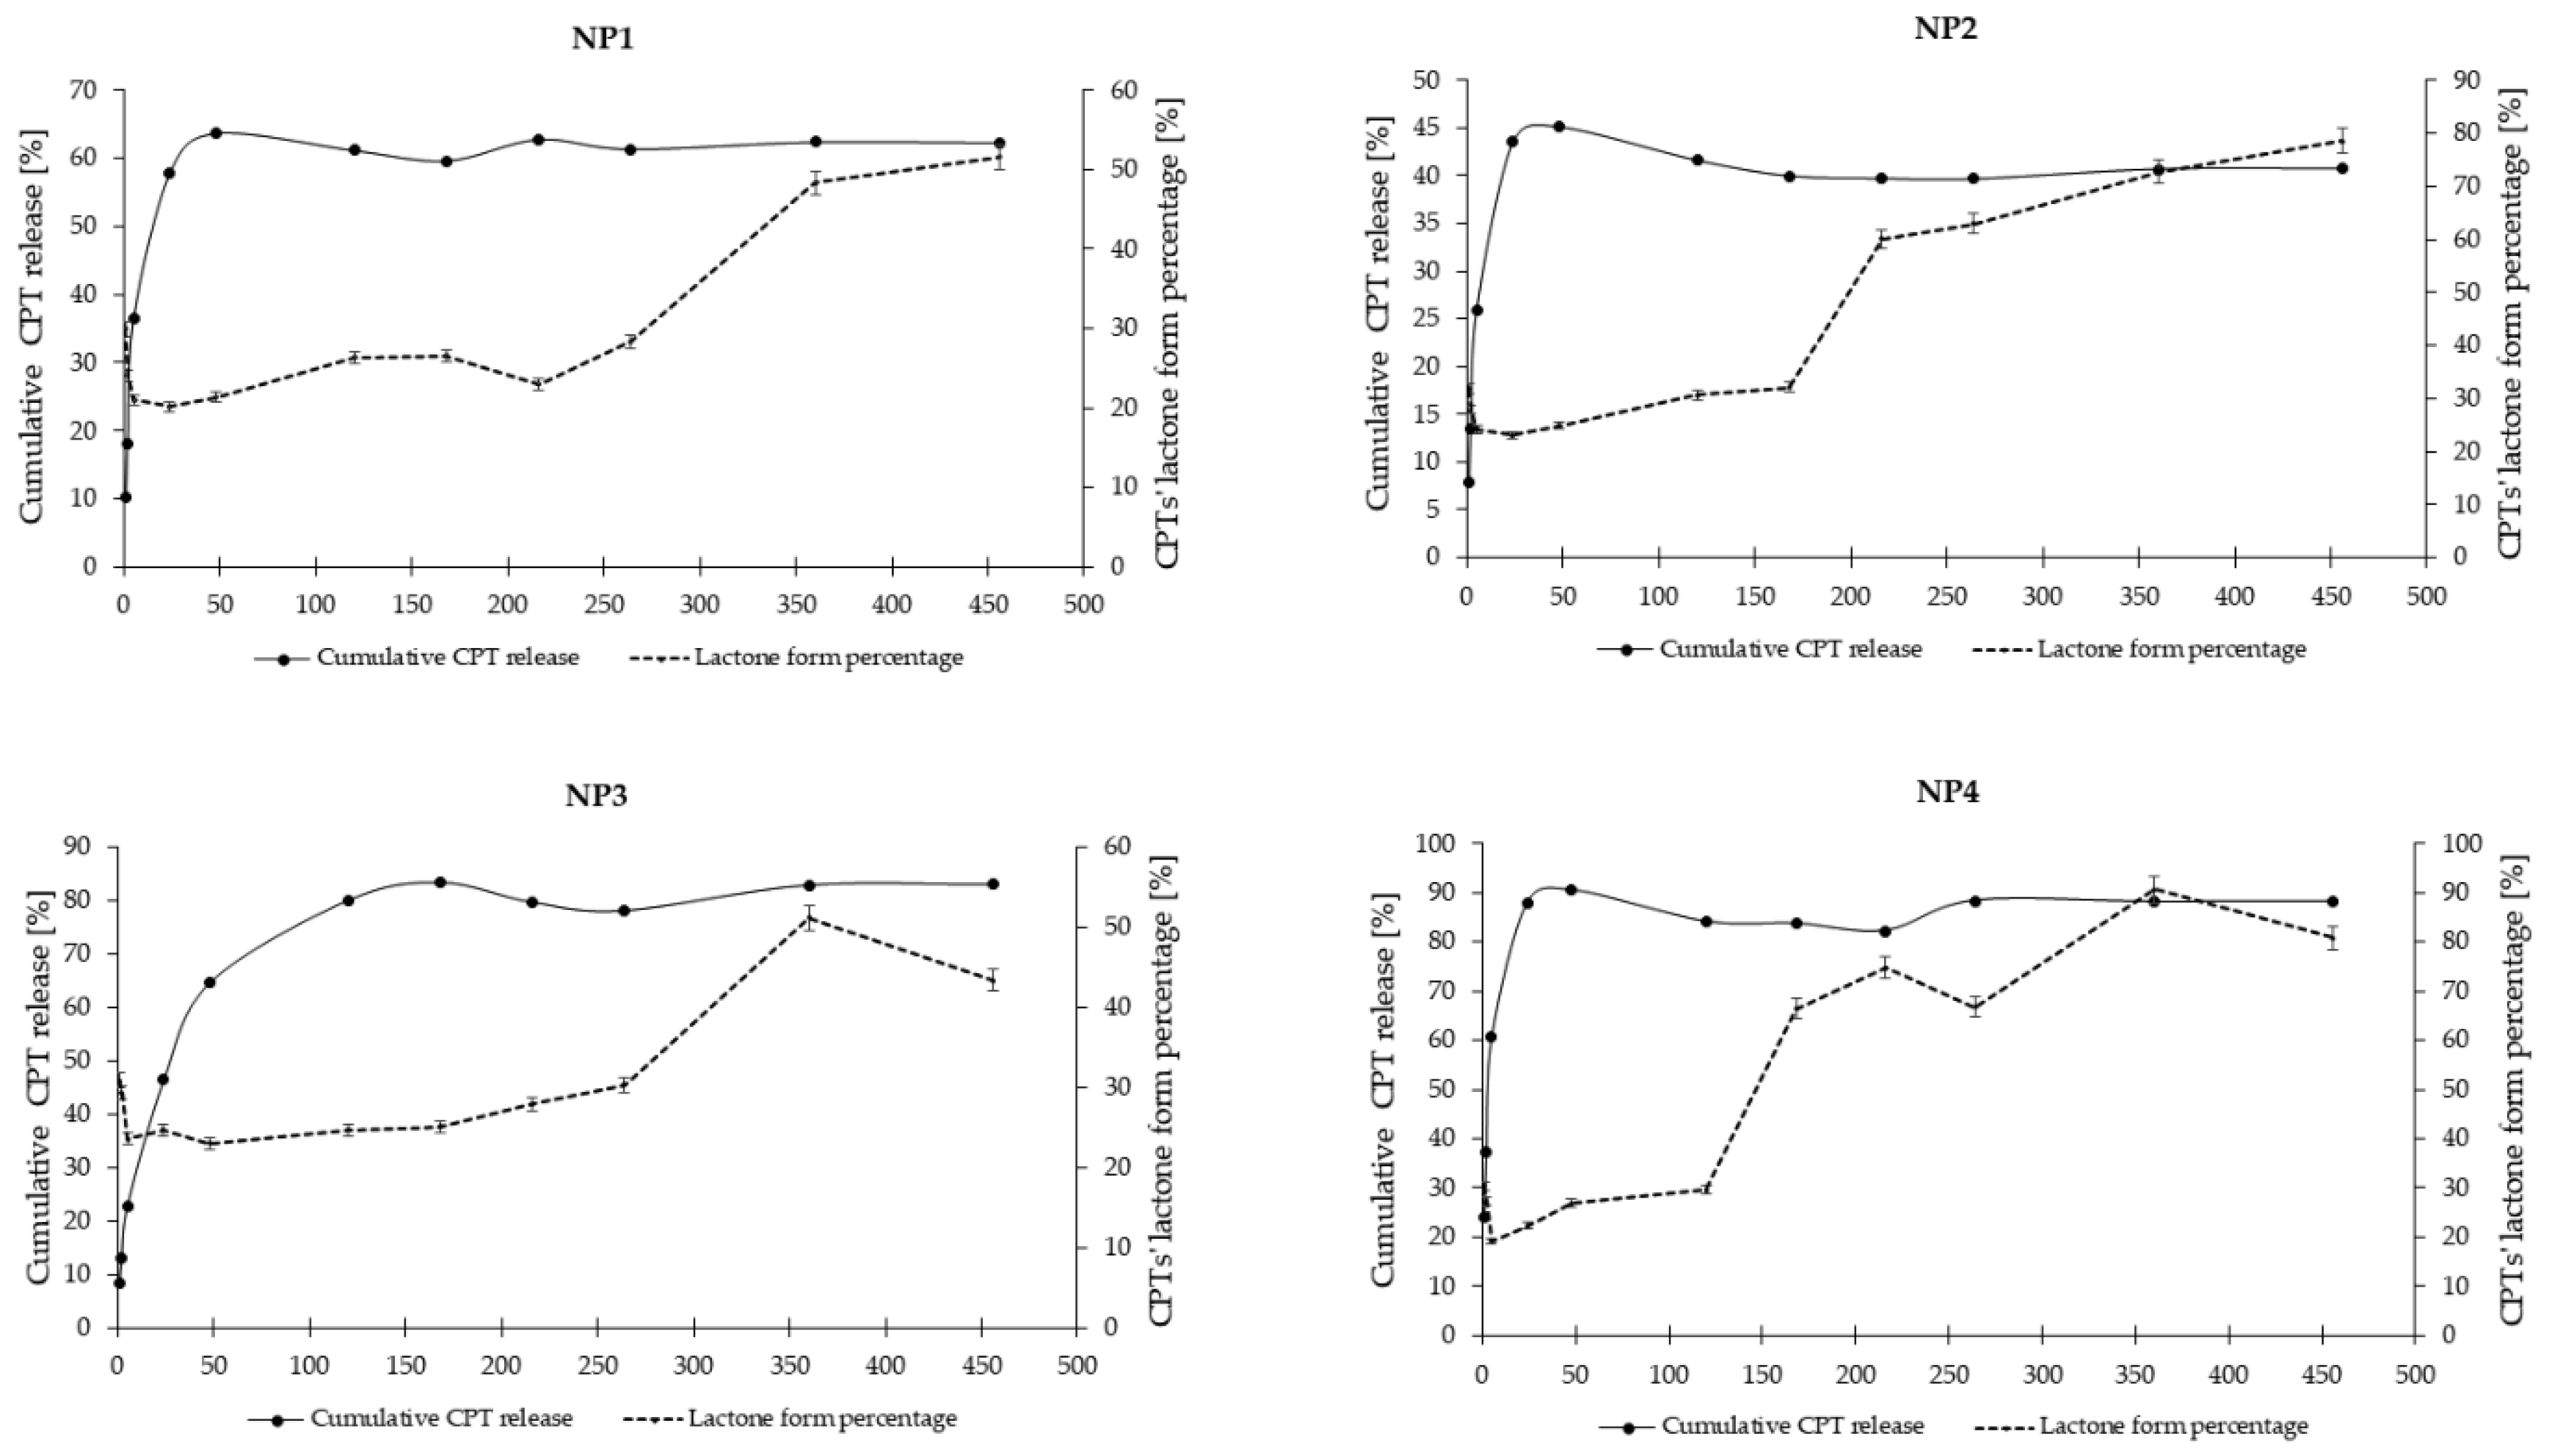
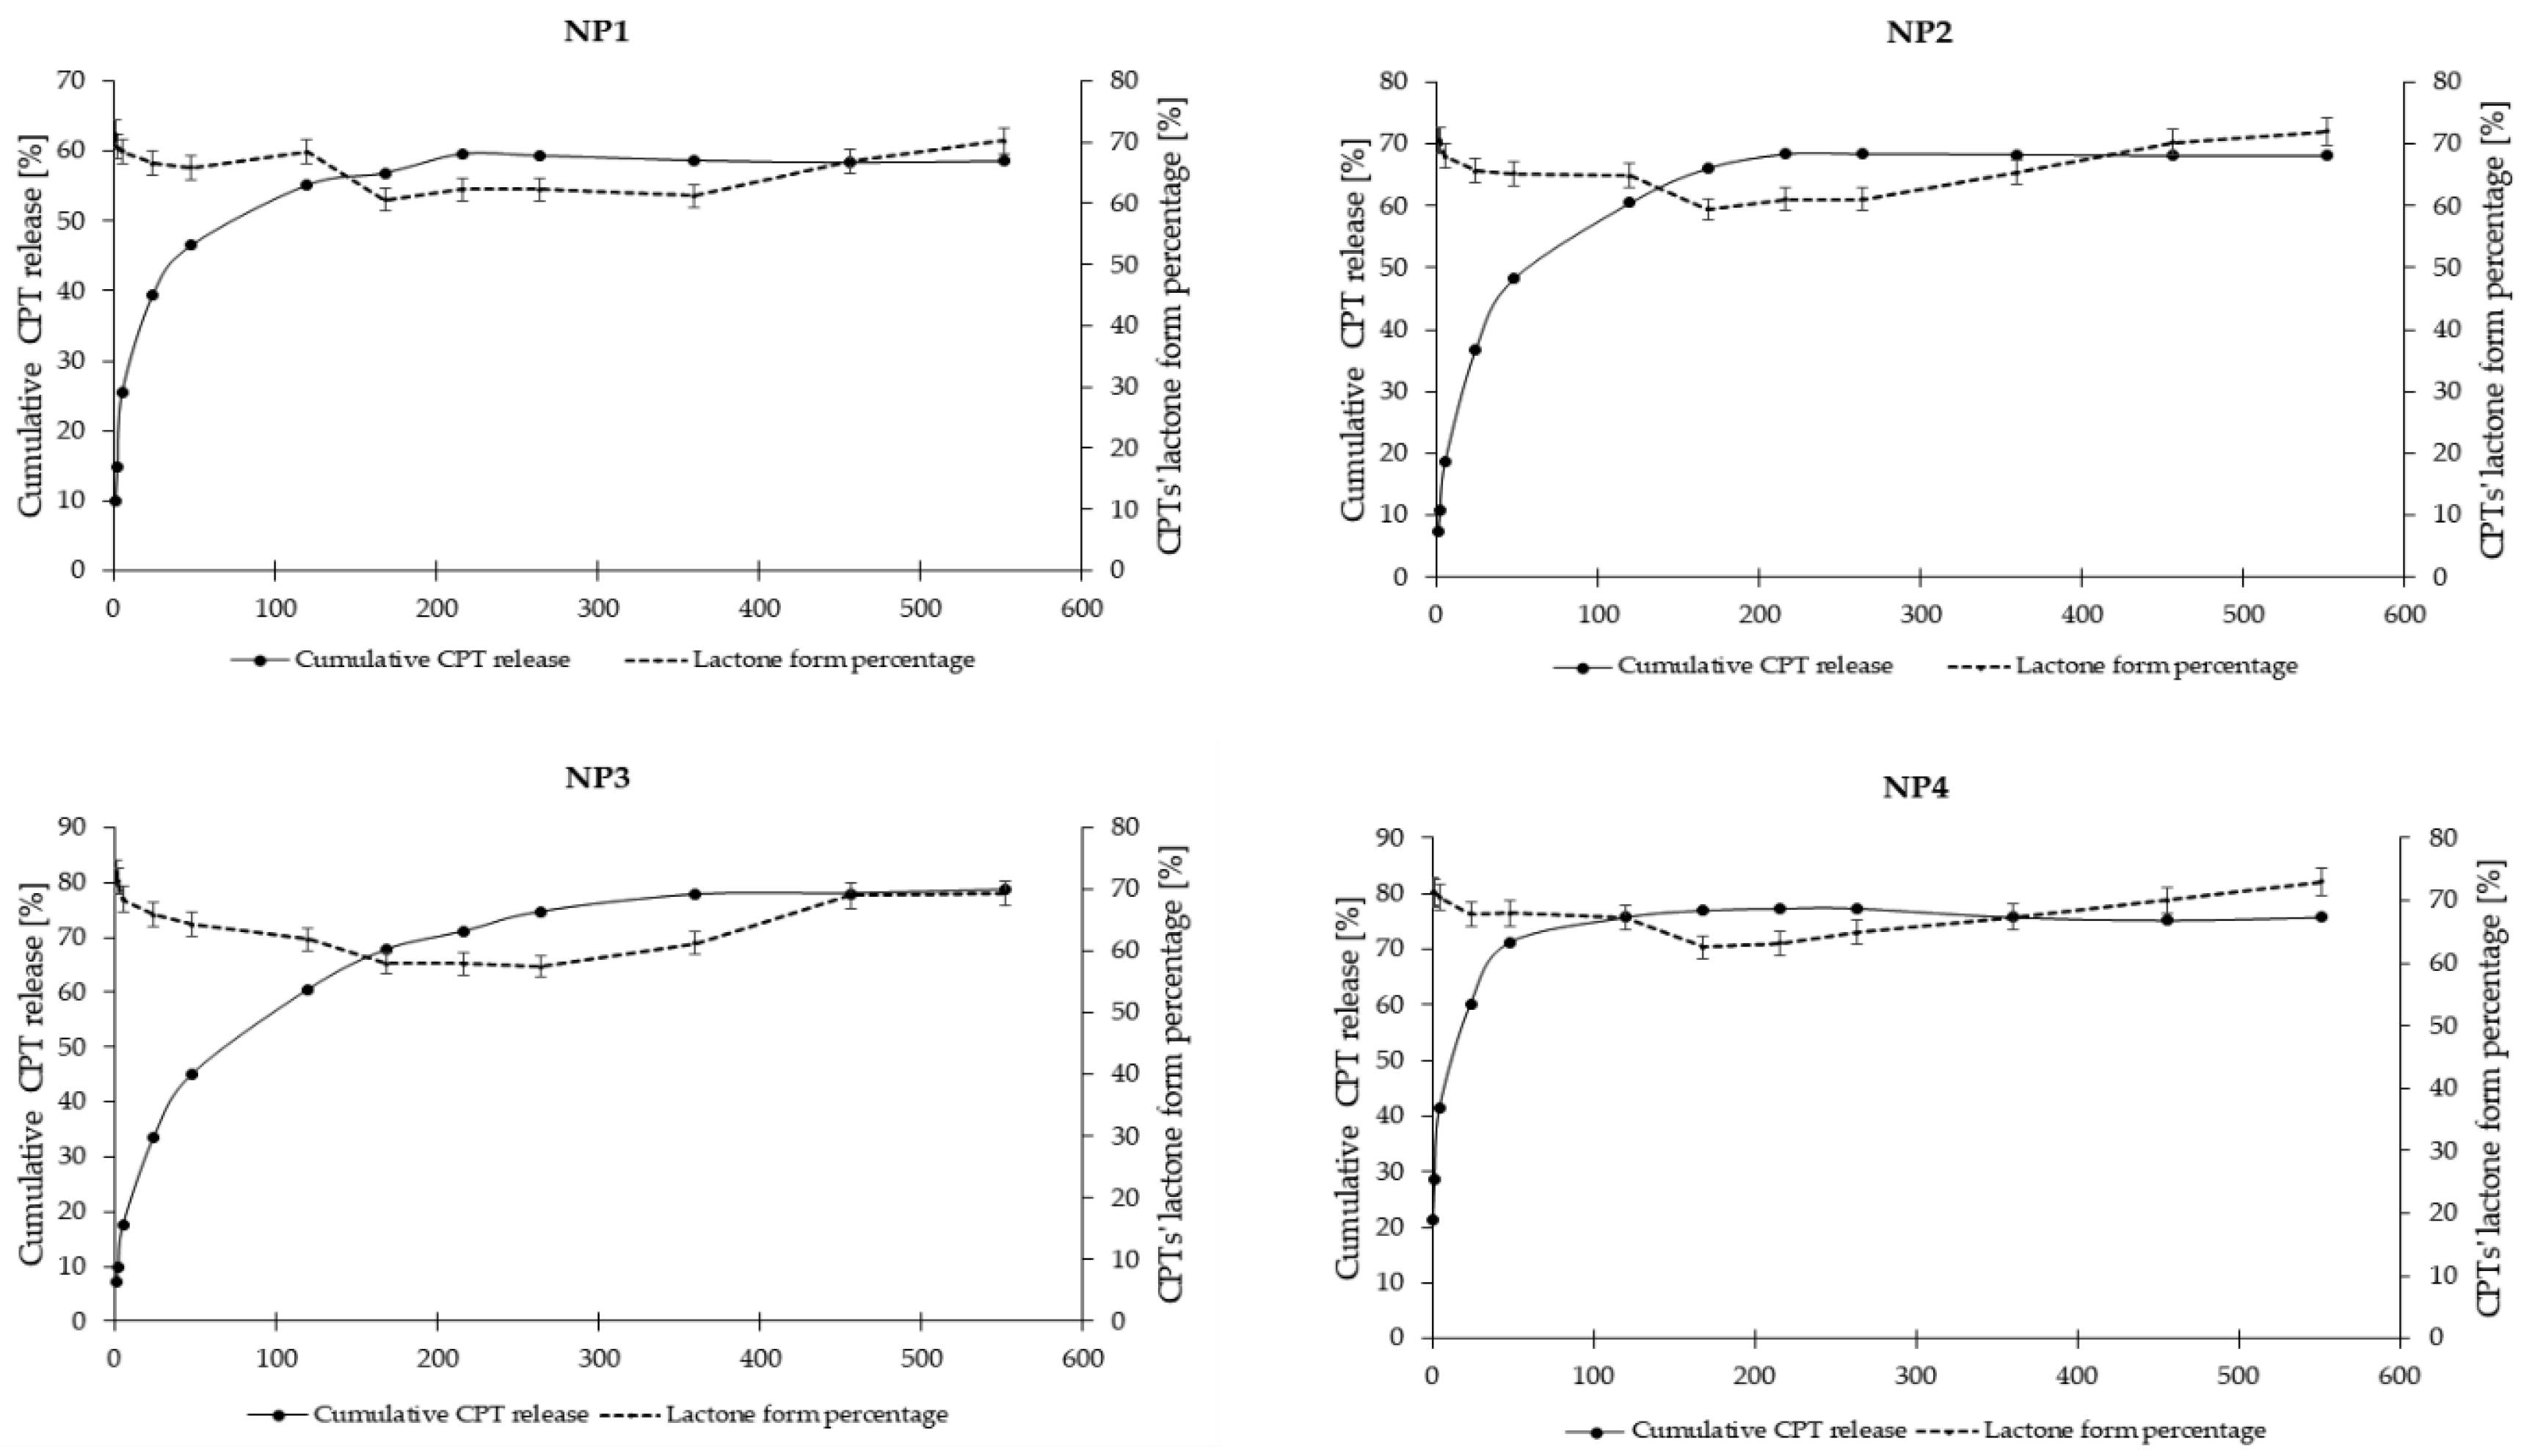
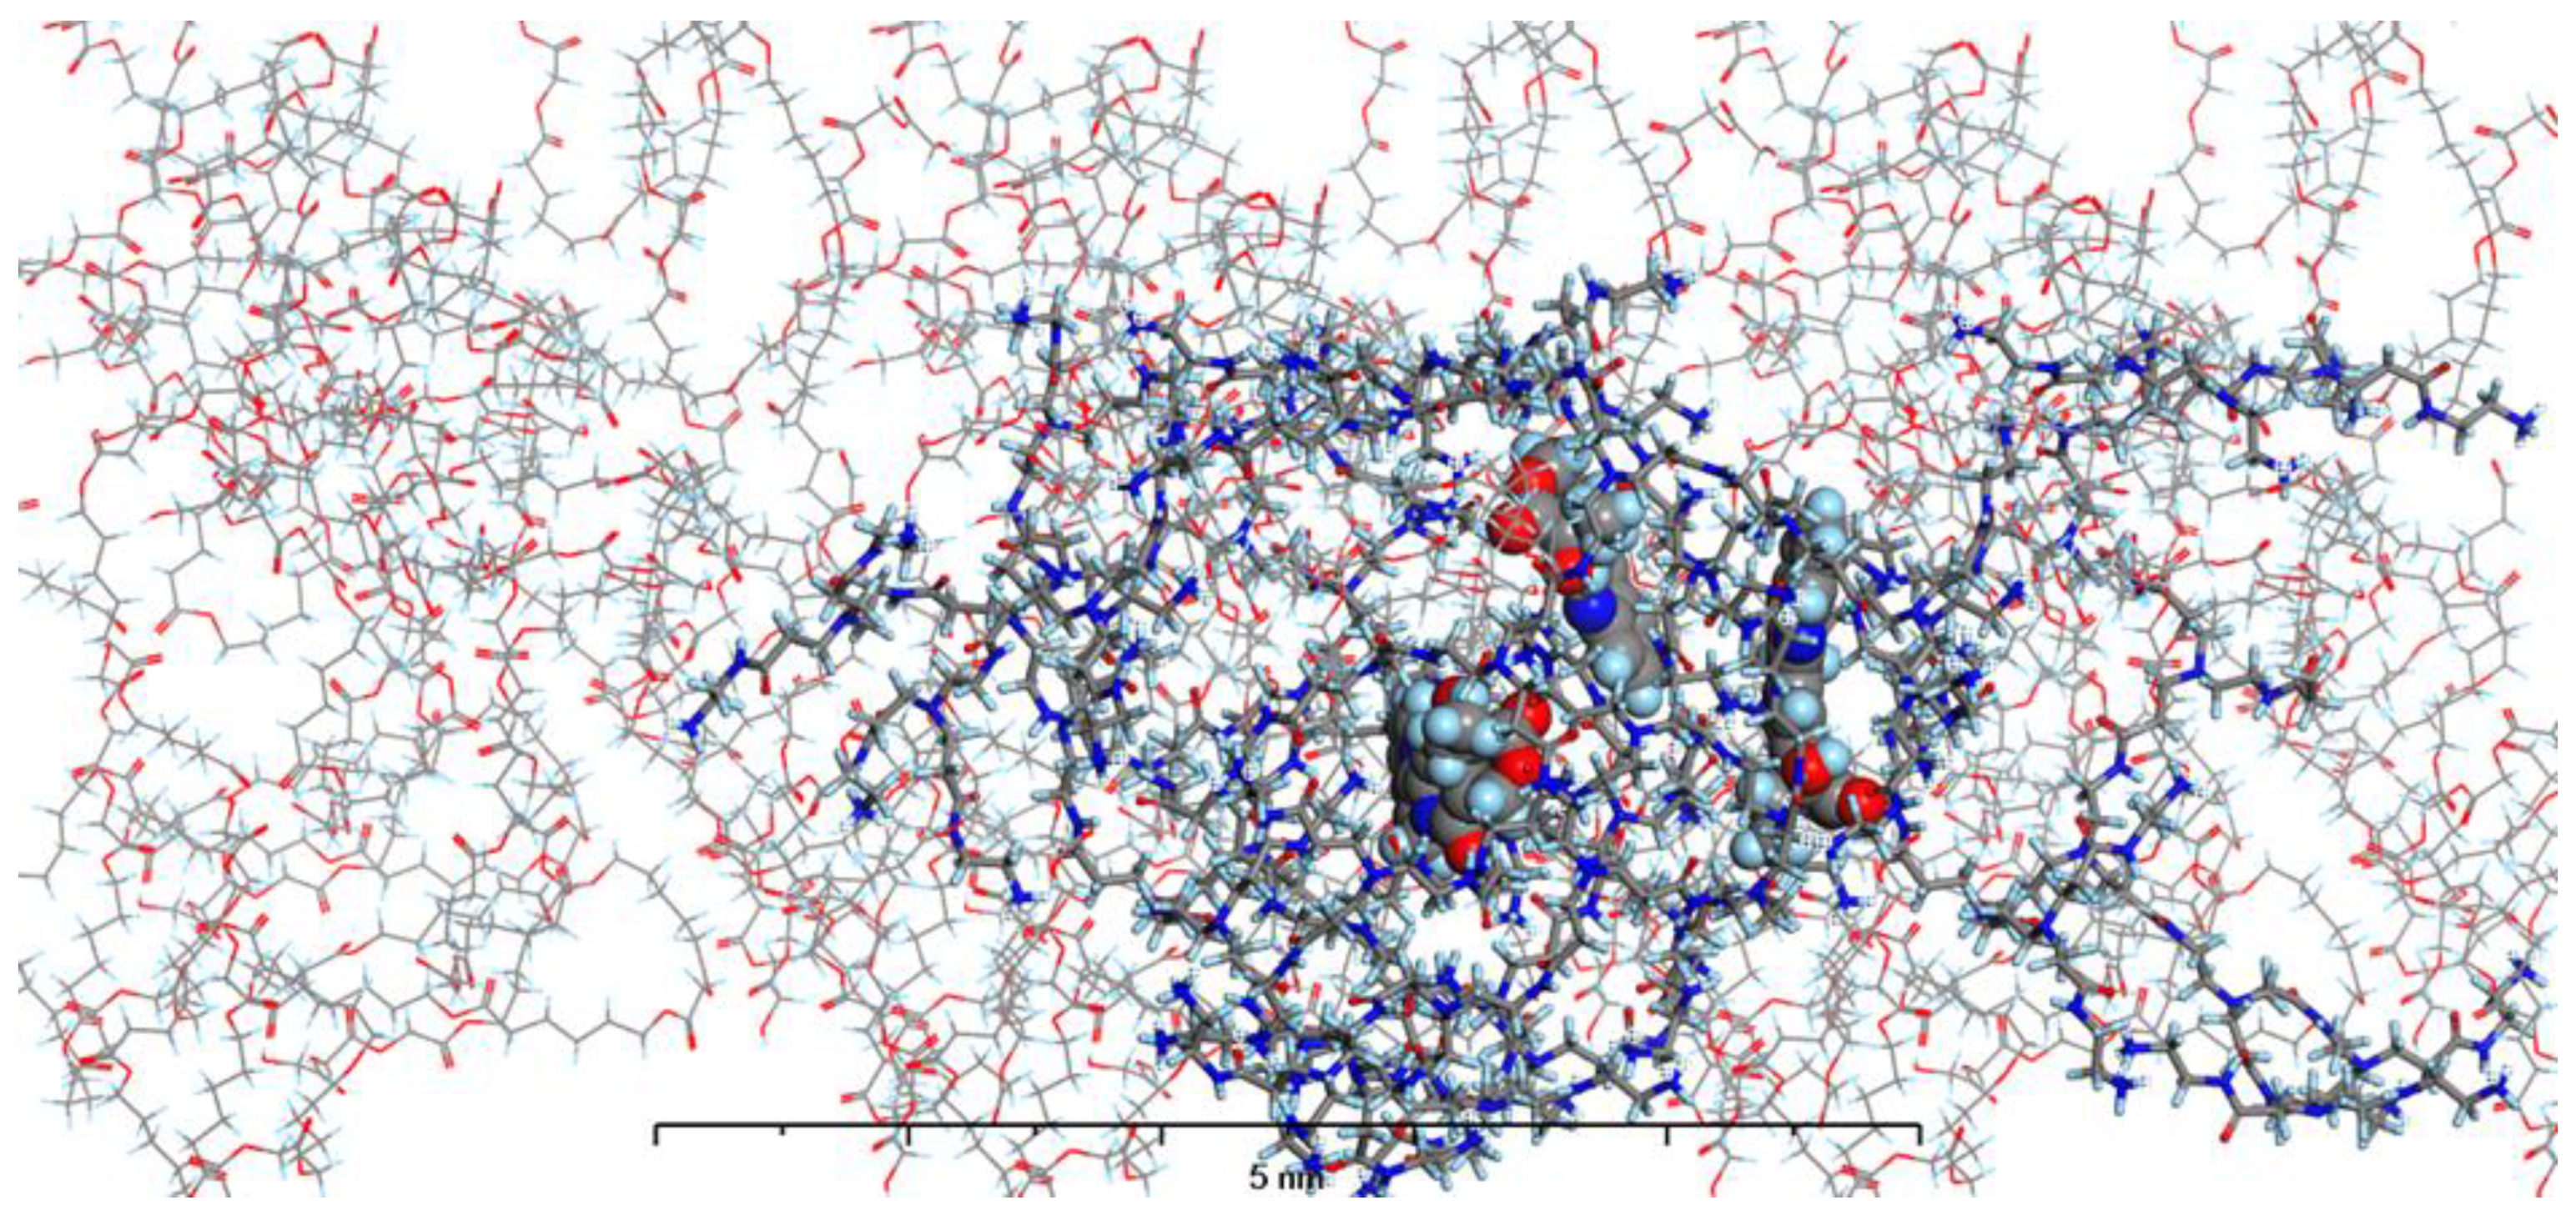
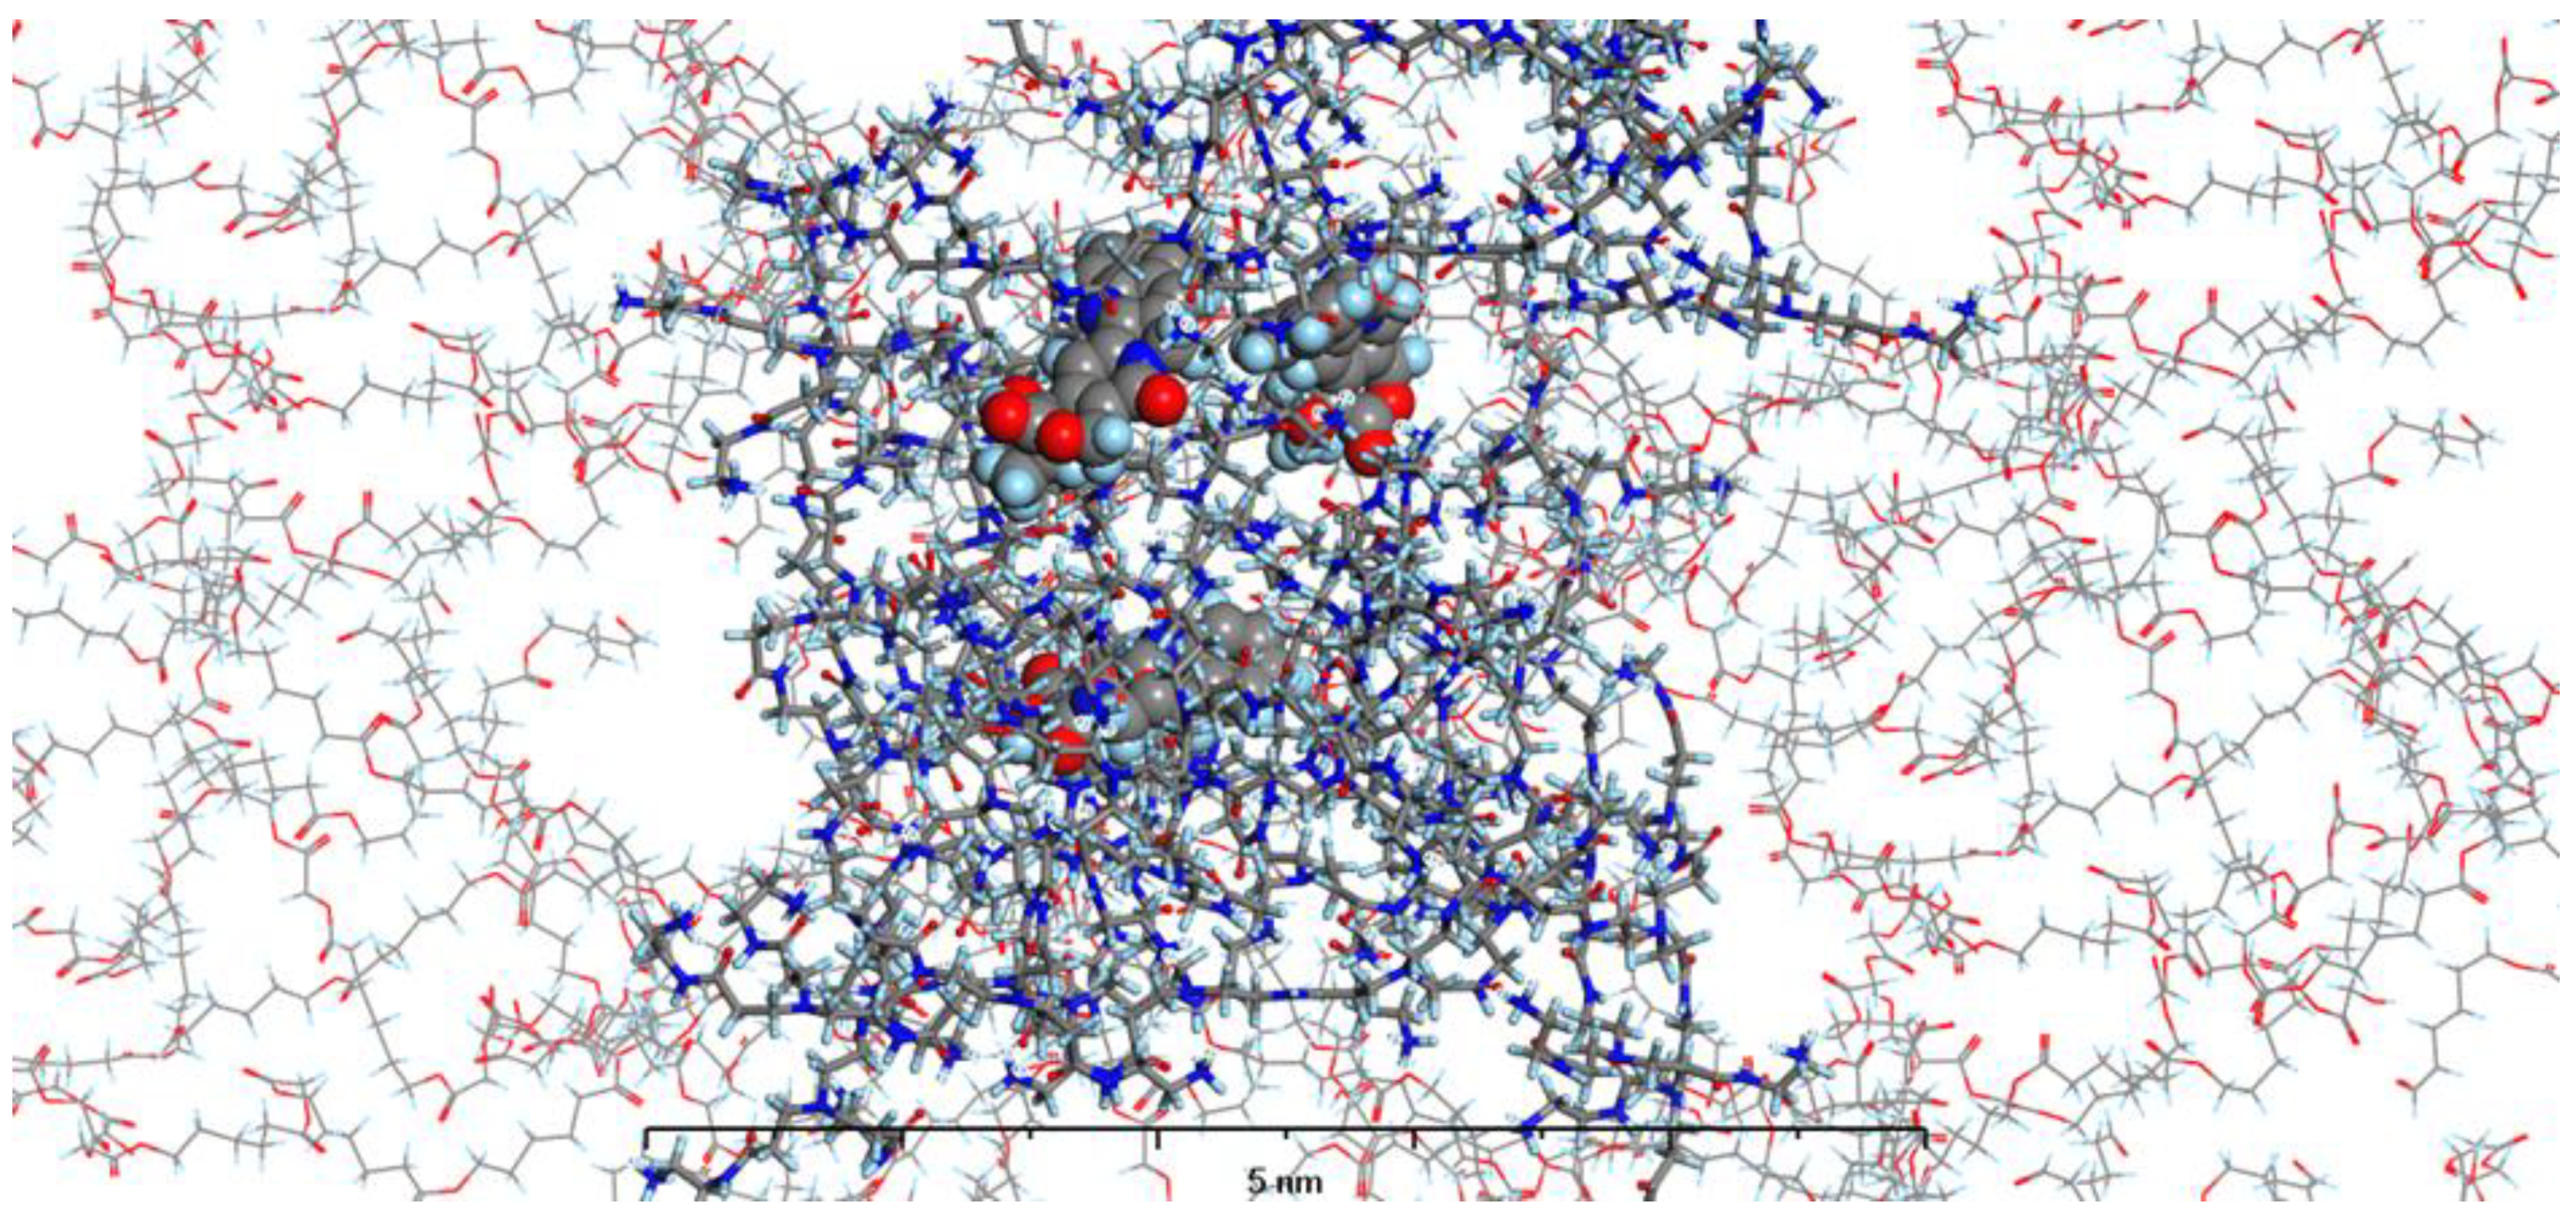
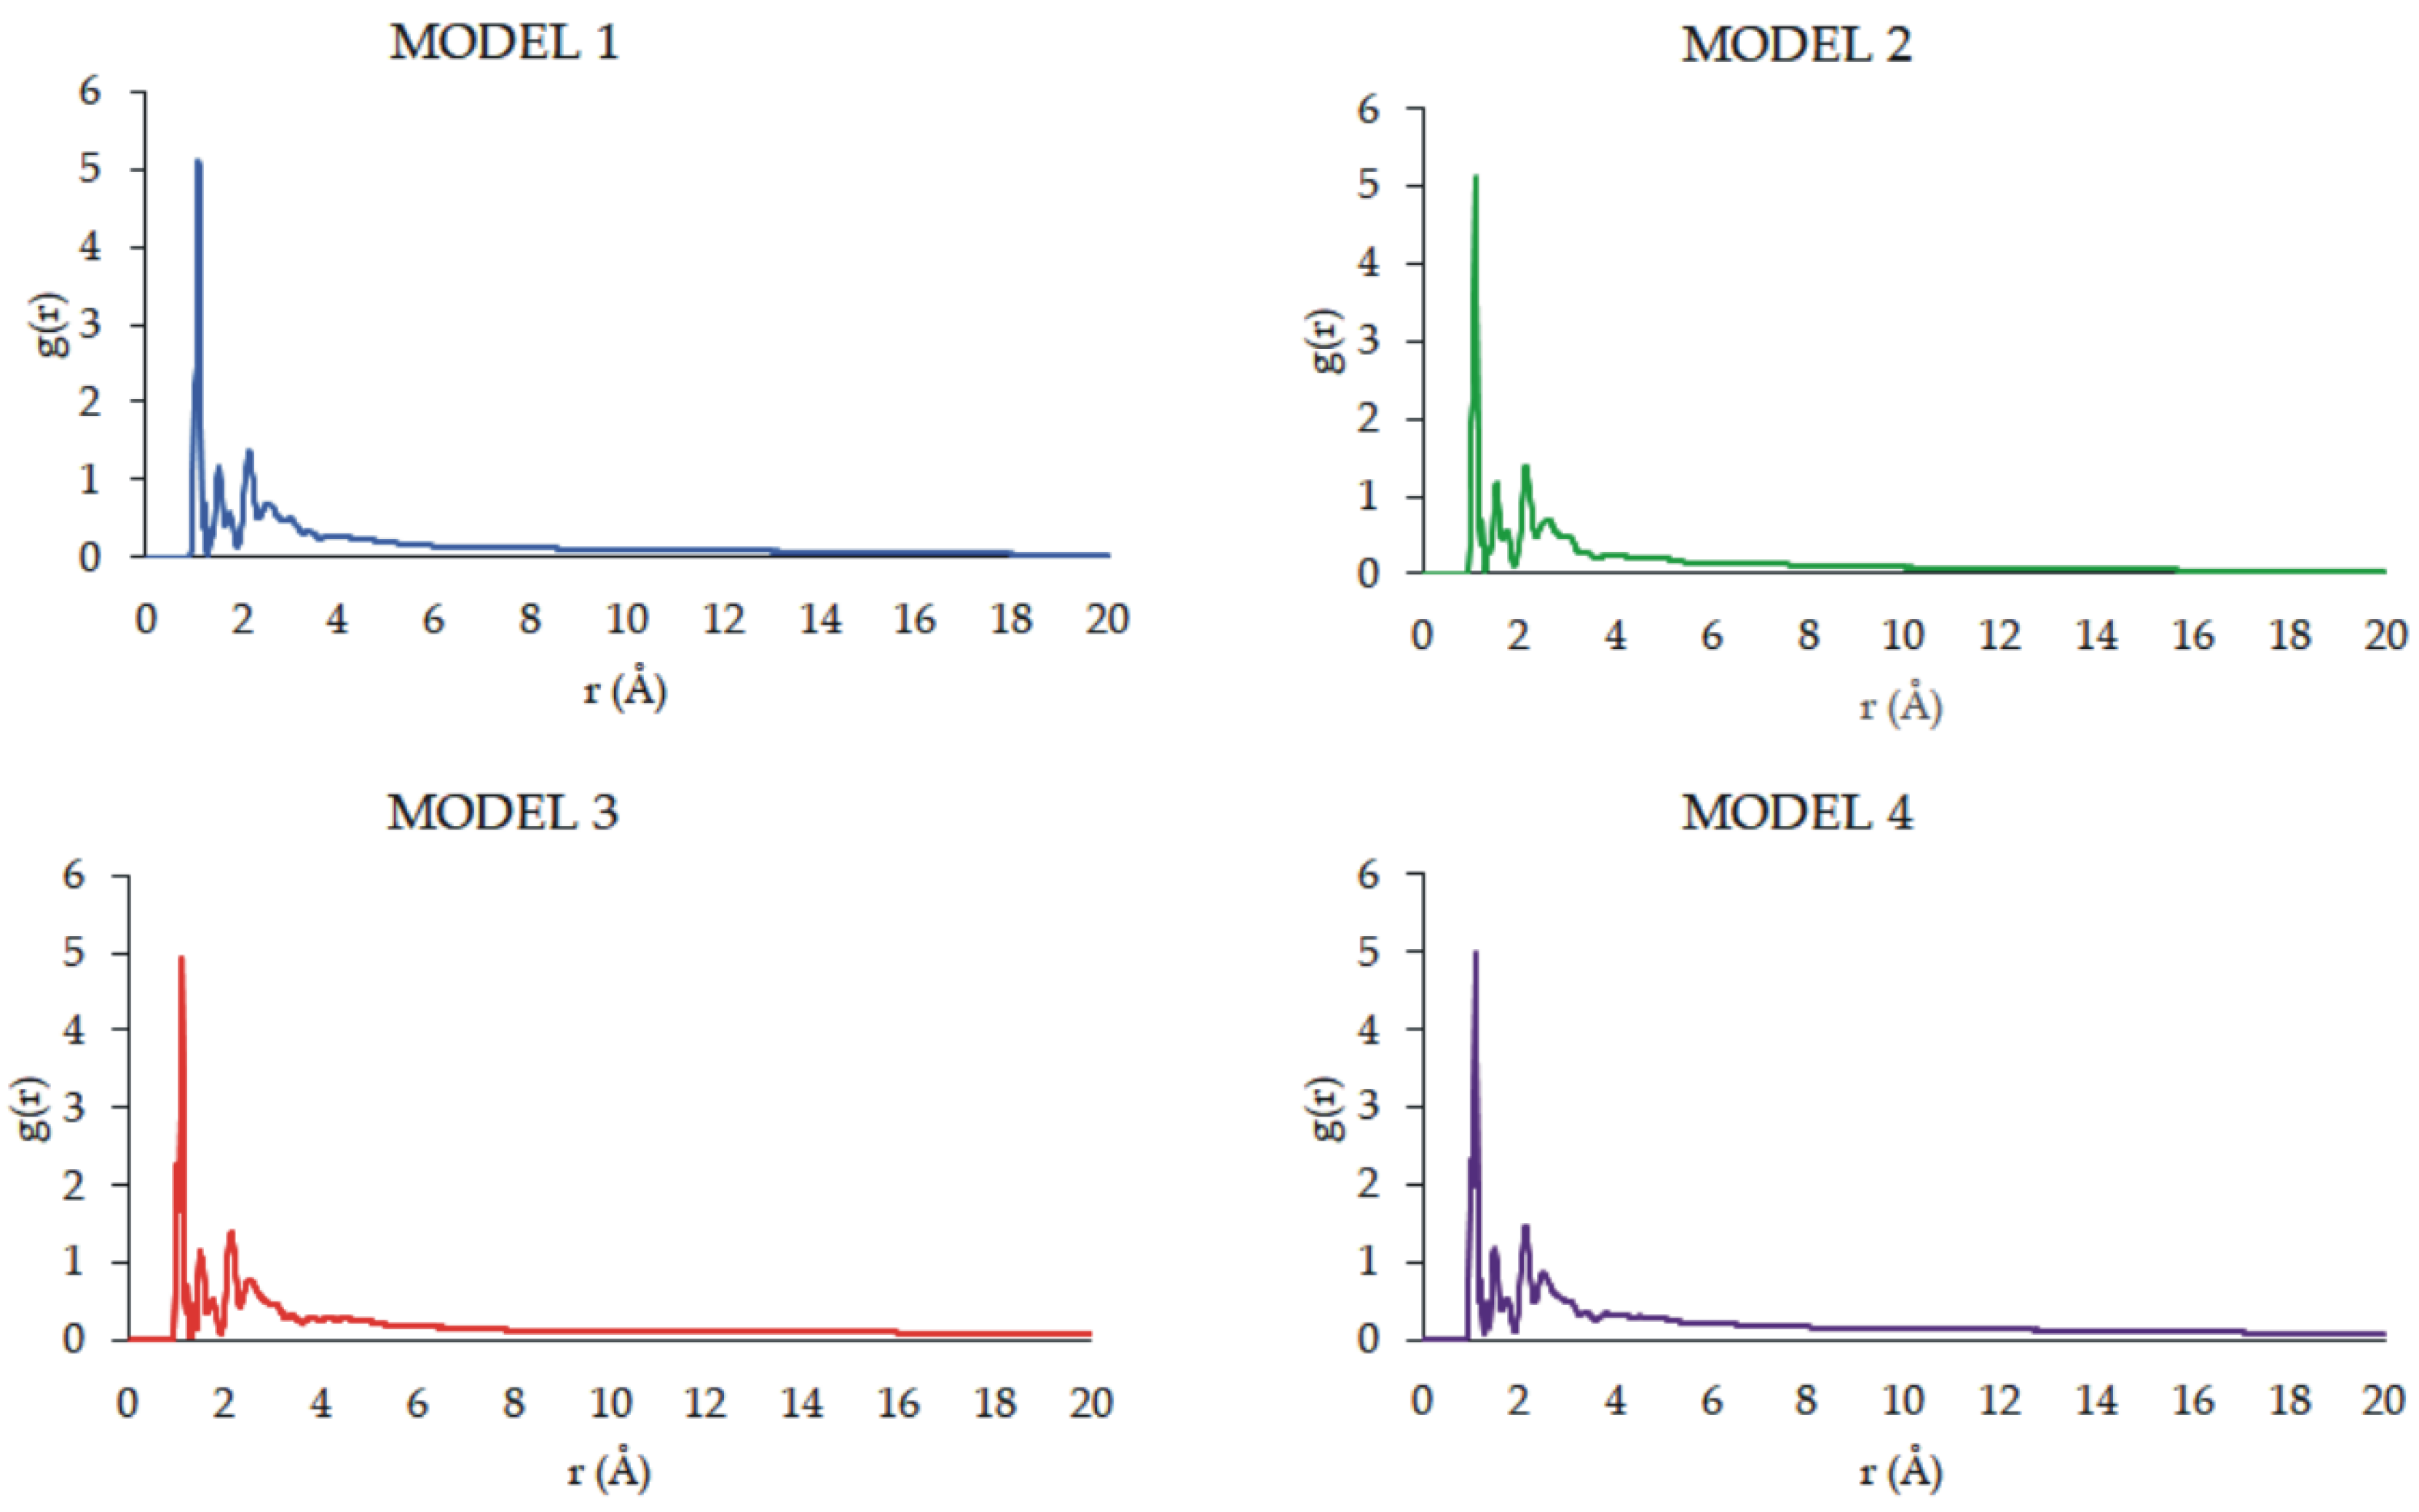
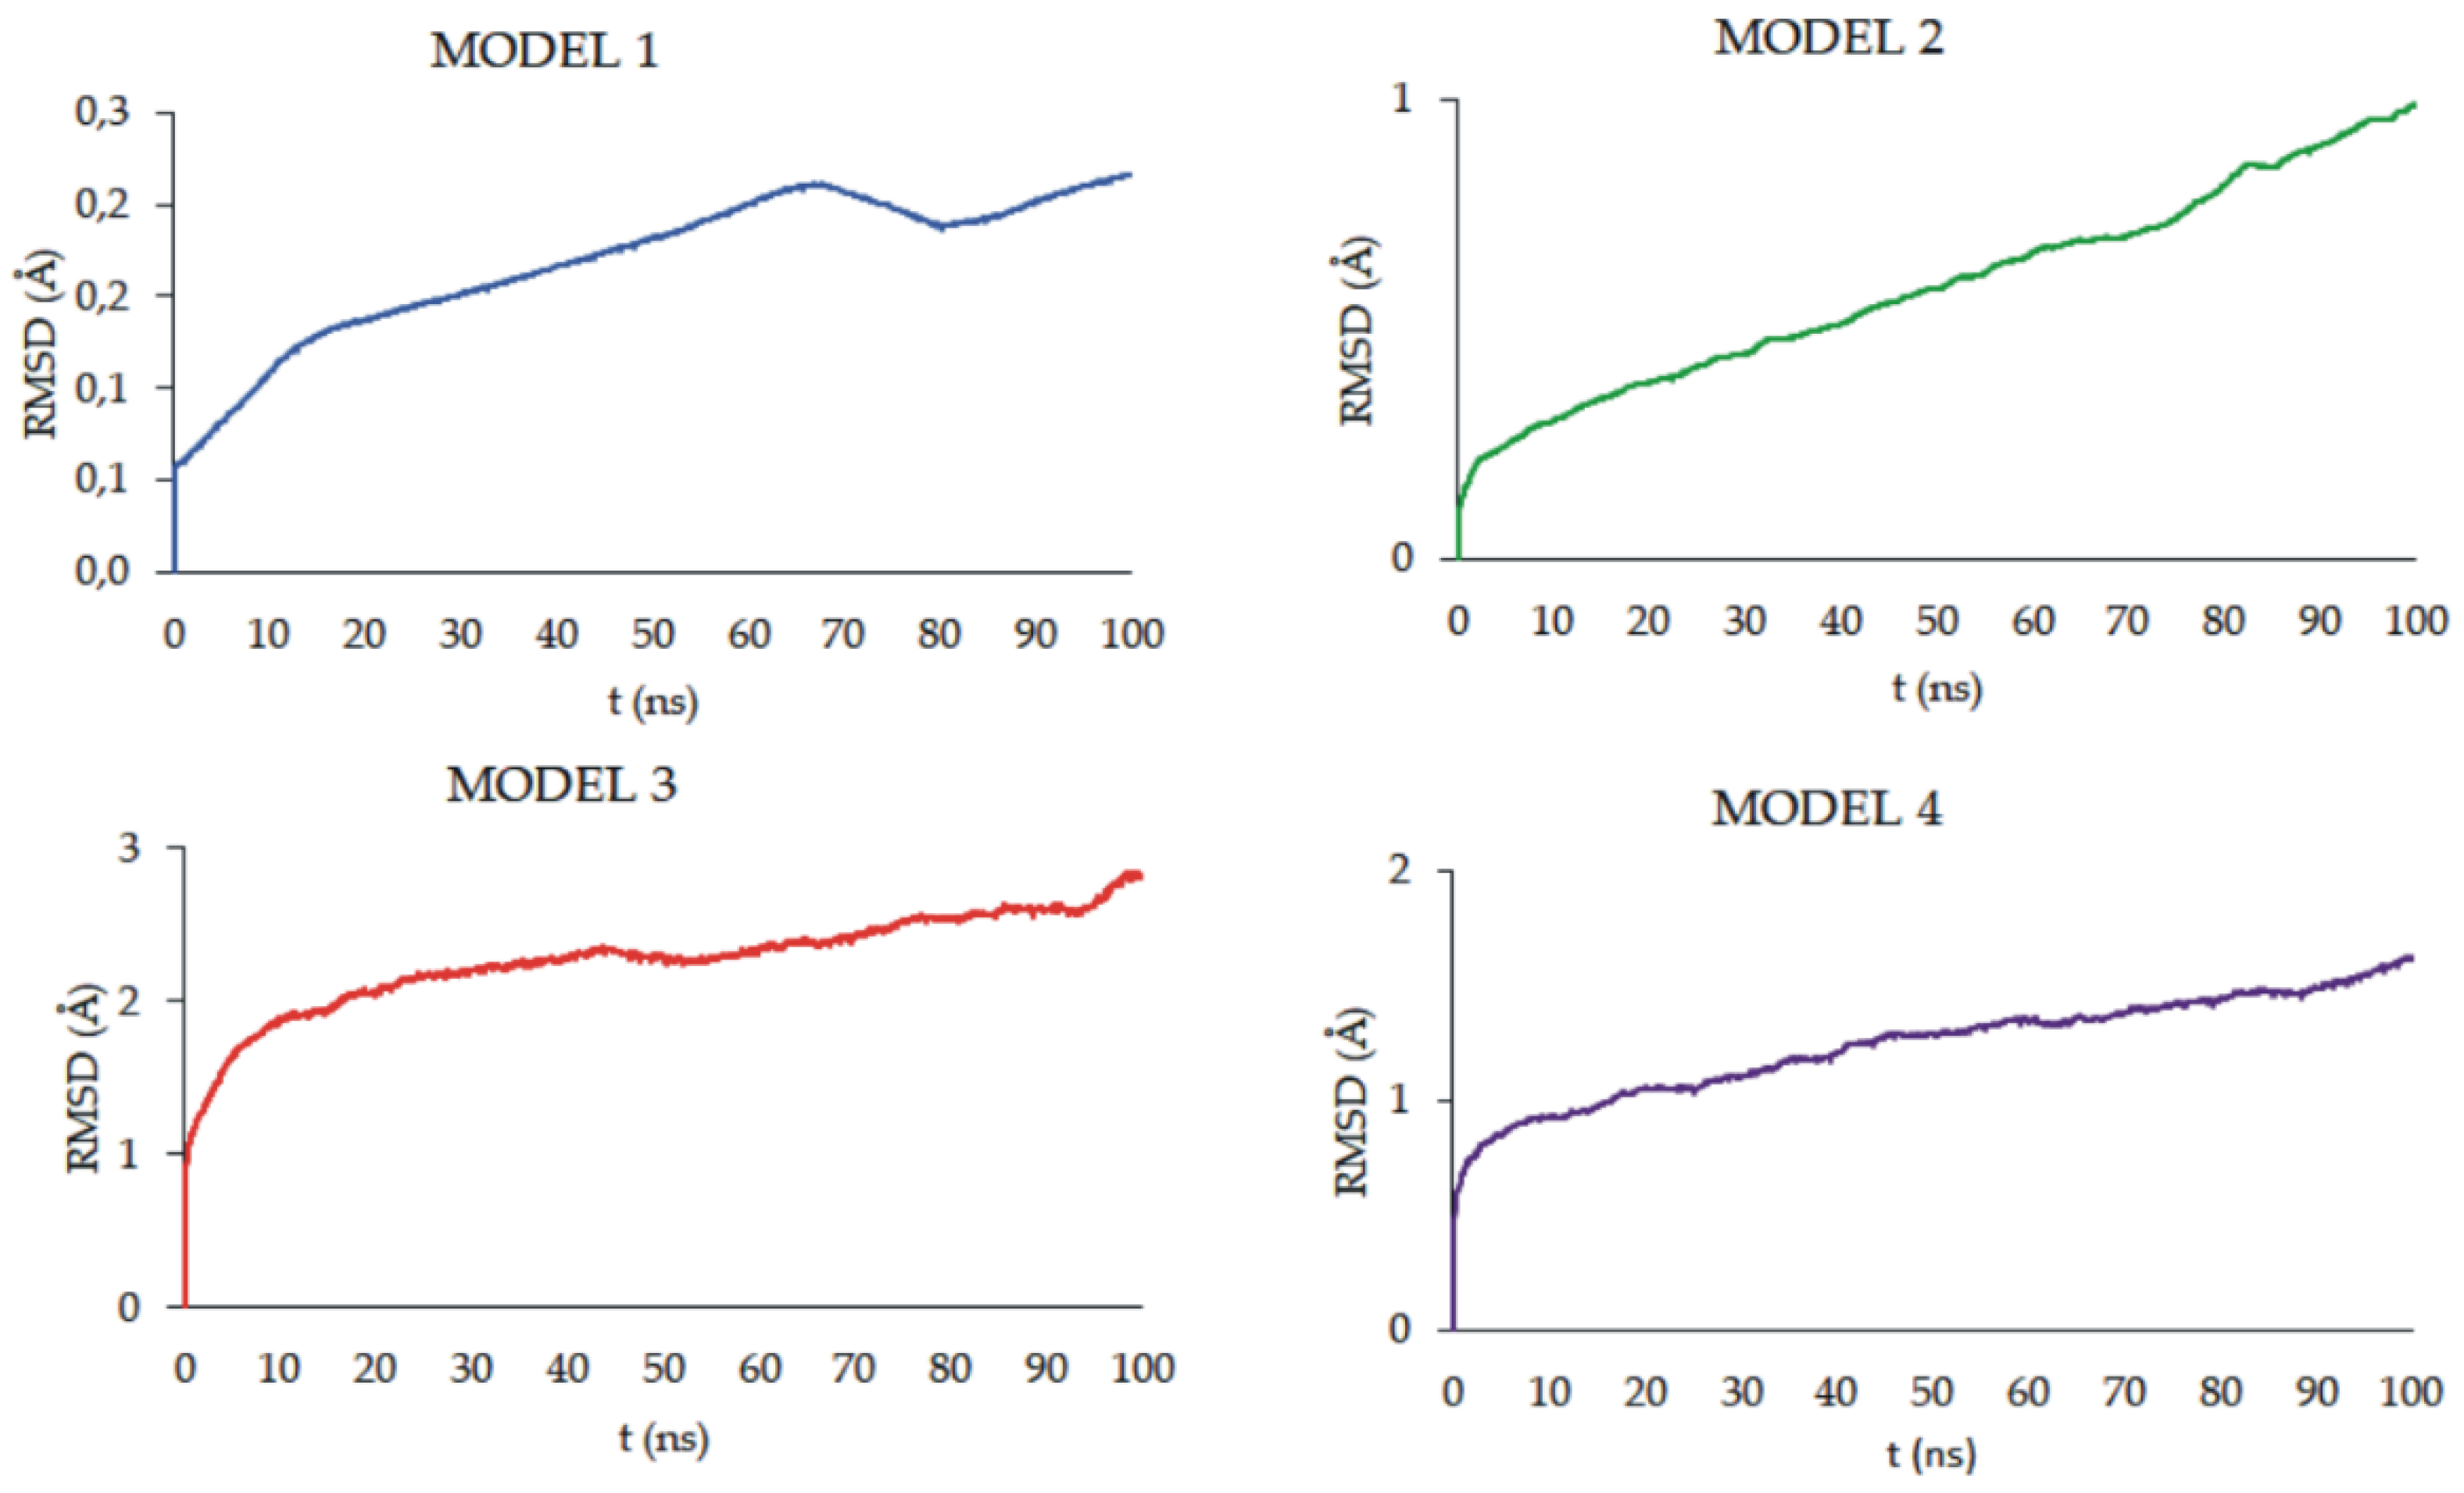
| Code | Matrix | Monomer molar ratio | Yield [%] | Convia [%] | Mnb [g/mol] | Ɖb |
|---|---|---|---|---|---|---|
| M1 | PLLA poly(L-lactide) |
LA = 1.0 | 78 | 97 | 13600 | 1.23 |
| M2 | PLACL poly(L-lactide-co --caprolactone) |
LA = 0.40 CL = 0.60 |
78 | 83 (LA) 82 (CL) |
8700 | 1.77 |
| M3 | PGACL poly(glycolide-co --caprolactone) |
CL = 0.85 GL = 0.15 |
83 | 86 (CL) 74 (GL) |
16100 | 1.57 |
| M4 | CL = 0.90 GL = 0.10 |
90 | 85 (CL) 63 (GL) |
21300 | 1.52 |
| Code | Polymer | Average block length | R | |
|---|---|---|---|---|
| M2 | poly(L-lactide-co --caprolactone) PLACL/40:60 |
= 1.27 = 0.99 |
0.49 | 1.00 |
| M3 | poly(glycolide-co --caprolactone) PGACL/15:85 |
= 1.67 = 4.43 |
0.73 | 0.60 |
| M4 | poly(glycolide-co --caprolactone) PGACL/10:90 |
= 1.46 = 8.81 |
0.94 | 0.68 |
| Sample | pH | Zero-order model |
First- order model |
Higuchi model |
Kosmeyer-Peppas model |
Drug transport mechanism | |
|---|---|---|---|---|---|---|---|
| R2 | R2 | R2 | R2 | n | |||
| NP1 NP2 NP3 NP4 |
7.4±0.05 7.4±0.05 7.4±0.05 7.4±0.05 |
0.465 0.400 0.620 0.401 |
0.542 0.445 0.740 0.575 |
0.688 0.593 0.845 0.616 |
0.915 0.707 0.993 0.999 |
0.45 0.23 0.53 0.62 |
non-Fickian transport Fickian diffusion non-Fickian transport non-Fickian transport |
| NP1 NP2 NP3 NP4 |
6.5±0.05 6.5±0.05 6.5±0.05 6.5±0.05 |
0.628 0.684 0.758 0.517 |
0.717 0.779 0.877 0.653 |
0.844 0.893 0.939 0.744 |
0.952 0.987 0.992 0.978 |
0.32 0.45 0.45 0.32 |
Fickian diffusion non-Fickian transport non-Fickian transport Fickian diffusion |
Disclaimer/Publisher’s Note: The statements, opinions and data contained in all publications are solely those of the individual author(s) and contributor(s) and not of MDPI and/or the editor(s). MDPI and/or the editor(s) disclaim responsibility for any injury to people or property resulting from any ideas, methods, instructions or products referred to in the content. |
© 2024 by the authors. Licensee MDPI, Basel, Switzerland. This article is an open access article distributed under the terms and conditions of the Creative Commons Attribution (CC BY) license (http://creativecommons.org/licenses/by/4.0/).


