
Submitted:
28 October 2024
Posted:
30 October 2024
You are already at the latest version
Abstract
Cardiovascular diseases are one of the leading causes of death in the world. The capability to direct the differentiation of human pluripotent stem cells (hPSCs) into functional cardiomyocytes (CMs) provides excellent opportunities for disease modeling and novel cell-based cardiac therapies. However, current hPSC-derived cardiomyocytes (hPSC-CMs) remain largely immature, limiting experimental and clinical uses. New insights into the maturation process of adult-like hPSC-CMs are critical. In this paper, we developed a data-driven pipeline to quantify cell maturity, based on gene expression input spanning different stages of cardiac development. First, we determined that culture time can serve as a proxy of the maturity level of hPSC-CMs. Second, we selected key heart-related genes whose expression varies with culture time, based on machine learning algorithms that are applied to accurately predict culture time. Our results demonstrate that the average discrepancy between the predicted culture time and the observed culture time can be reduced to 4.461 days. Furthermore, Gene CASQ2 (Calsequestrin 2), whose protein plays a role in the storage and transportation of calcium ions, has been identified as the most important cardiac gene that correlates with the culture duration.
Keywords:
Cardiovascular diseases
; hPSC-CM maturity
; gene expression
; cardiac gene selection
; culture time prediction
1. Introduction
According to the world health organization report, cardiovascular diseases (CVDs) are the leading cause of death worldwide [1]. An estimated 17.9 million people died from CVDs in 2016, representing 31% of all global deaths [2]. In addition, statistical data have shown that one person dies every 36 seconds in the United States from cardiovascular diseases, and heart disease costs the united states about $219 billion each year from 2014 to 2015 [3]. Therefore, it is urgent to find a definitive treatment for heart disease.
The human pluripotent stem cell-derived cardiomyocytes (hPSC-CMs) represent a potential unlimited cell supply for the cell-based cardiac regeneration therapy, drug toxicity screening [4], and cardiovascular disease modeling [5]. However, current hPSC-CMs in vitro resemble a neonatal (immature) stage in cardiac markers, action potential, and morphology, and lag far behind the standard of mature CMs. To improve hPSC-CM maturity and function, researchers have made major efforts to promote the maturation of hPSC-CMs, including mechanical stress stimulation, electrical stimulation, biochemical cues, 3D cardiac tissue remodeling, modification of the substrate stiffness, and combinatorial co-culture to promote paracrine effects [6,7]. Recently, researchers have demonstrated that a focus on mitochondrial proteomics could help develop metabolically matured hPSC-CMs [8].
Since the maturation process of hPSC-CMs is influenced by many factors, developing efficient maturation strategies for hPSC-CMs requires a deep understanding of how each factor or combined factors direct the maturation process. However, the maturity level of hPSC-CMs is currently evaluated by various biological methods spanning different aspects, including cell morphology and structure, electrophysiology, calcium handling, and gene expression [9,10]. The lack of standardized metrics and protocols to quantify the overall maturity level of the cell in vitro impedes an understanding of the cell maturation process and the development of efficient cell maturation strategies.
To address the above challenges, we propose to evaluate the hPSC-CM maturity level with a data-driven approach. A data-driven model is a technology based on the analysis of the data about a specific system that can find the relationship between variables in the system without explicit knowledge of the physical behavior of the system [11,12,13]. With 48804 gene probe data at multiple in vitro culture time points [14], the data-driven model is a promising method for the quantitative evaluation of the hPSC-CM maturity level.
Based on the gene profile data, which span different stages of cardiac development, we have verified that hPSC-CMs can continually mature toward more adult-like hPSC-CMs up to 120 days. Then, by adopting in vitro culture duration as the proxy to estimate the maturity level of hPSC-CMs, these gene probes were ranked based on their importance to predict the culture duration. Five different predictive methods have been proposed and the results showed that the most accurate culture time prediction has an average error of 4.461 days, and the most important cardiac gene that correlates to the culture time is Gene CASQ2 (Calsequestrin 2), whose protein plays a role in the storage and transportation of calcium ions.
The major features of this work are: 1) The existing hPSC-CM maturity quantification schemes mainly focus on deciding whether the hPSC-CMs are mature or not. For the first time, we have proposed a data-driven pipeline that is capable of quantifying the maturity level of the cell in vitro with a finer granularity. 2) The selected dominating cardiac genes can guide the design of more efficient stimulation schemes to promote the hPSC-CM maturation. 3) The data-driven approach opens the door of the hPSC-CM study to multidisciplinary researchers without a strong biology background.
The remaining of the paper is organized as follows. Section 2 introduces existing biological studies on the maturity determination methods for hPSC-CMs. Section 3 verifies the feasibility of adopting in vitro culture duration as the proxy to estimate the maturity level of hPSC-CMs. Section 4 explains the cardiac gene selection and culture duration prediction models. Section 5 discusses the results and Section 6 presents the conclusion.
2. Related Works
As compared to the human adult cardiomyocytes, the current in vitro hPSC-CMs remain largely immature. By the principle of “if you cannot measure it, you cannot improve it” [15], the slowly moving hPSC-CM maturation research is challenged by the lack of a convenient and standard method to assess hPSC-CMs’ degree of maturity quantitatively. Currently, researchers have been using various biological methods to evaluate whether hPSC-CMs are becoming more mature towards adult CMs from various aspects: morphology and structure, calcium handling, contractile function and electrophysiological properties, and gene expression. The differences between immature-CMs and mature-CMs in these four aspects are summarized in Figure 1.
2.1. Morphology and Structure
The process from human fetal CMs to adult phenotype in vivo needs 6 to 10 years [16]. However, hPSC-CMs can be generated within 15 days of in vitro differentiation [17]. To nurture more mature hPSC-CMs, researchers increased culturing time up to 120 days and found key changes in cultured hPSC-CMs [9]. The main difference can be classified into four parts: 1) shape of the cell; 2) sarcomeres: a contractile unit of the muscle fiber; 3) sarcoplasmic reticulum (SR): also a structure found within muscles, and the main function of SR is to store calcium ions Ca2+; and 4) transverse tubules (T-tubules): a cell membrane that penetrates the center of the skeletal and cardiac muscle cell.
Adult cardiomyocytes are well-aligned, rod-like, multinucleated cells. They have highly organized sarcomeres and well-developed SR and T-tubules. In immature hPSC-CMs, those features tend to be lacking. The hPSC-CMs are small, rounded, mononucleated, with disorganized and shorter sarcomeres. Moreover, hPSC-CMs have poorly developed SR and no T-tubules [10].
Data Collection and Processing Methods: During the culturing period of 120 days, the status of hPSC-CMs can be divided into two stages: the early stage (from 20 days to 40 days) and the late stage (from 80 days to 120 days). During the culture process, the hPSC-CMs are observed under the microscope. Cell images are captured and saved into a computer. The parameters of sarcomeres length, cell perimeter, cell area, percentage of multinucleation, and circularity index (ratio between the cell width and length) are obtained with appropriate image analysis software [9].
2.2. Calcium Handling
In adult CMs, T-tubules and SR are well developed to regulate Ca2+ induced Ca release (CICR) and fast excitation-contraction coupling (ECC). The sharp and uniform increase of intracellular Ca2+ concentration in adult CMs is important for the synchronized contraction in multiple sarcomeres. By contrast, in hPSC-CMs, T-tubules are absent and SR is underdeveloped with low expression for the most part of sarcoendoplasmic reticulum calcium ATPase (SERCA) and other key proteins.
Data Collection and Processing Methods: Calcium imaging technology refers to a method for monitoring calcium ion concentration in tissues using calcium ion indicators named dyes. The cultured slip is observed under the microscope after placing the coverslip cultured with hPSC-CMs in a Petri dish containing the dye solution for about 30 minutes at 37 degrees Celsius. Images are captured and quantified with appropriate image analysis software.
2.3. Contractile Function and Electrophysiological Properties
The contractile function is a fundamental status indicator of CMs. 1) The hPSC-CMs and fetal CMs display a comparable force-generation capacity (0.22 ± 0.70 mN/mm2 to 11.8 ± 4.5 mN/mm2 in hPSC-CMs and ∼0.4 mN/mm2 in fetal CMs), while adult CMs generate much larger forces (∼51 mN/mm2) [18]. 2) The hPSC-CMs also show immaturity in their electrophysiological properties, as compared with adult CMs, including reduced electrical excitability, higher resting membrane potential ( to mV v.s.∼ mV), low capacitance (30-50 pF v.s.∼150 pF), smaller upstroke (15–50 V/s v.s. 180–400 V/s) and conduction velocity (2.1–20 cm/s v.s. 41–84 cm/s), and presence of spontaneous beating, which is found in early fetal CMs [19].
Data Collection and Processing Methods: Contractile and electrophysiological data are monitored and collected in real-time by devices such as HEKA EPC-10 patch-clamp amplifier. The changes in contractile and electrophysiological properties are analyzed by appropriate software, e.g., Patchmaster and Igor Pro.
2.4. Gene Expression
During the culturing of hPSC-CMs, several cardiac-specific genes express a more adult heart-like expression level over time, such as CASQ2, CRYAB, MYH6, MYH7, TNNI3, and ACTC1. 1) Gene CASQ2 results in a more mature calcium handling phenotype during culturing [20]. The CASQ2 gene provides instructions for marking a protein called calsequestrin 2 found in myocytes, where it is involved in storing and transporting calcium ions. 2) CRYAB is a part of the small heart protein family and functions as a molecular chaperone that primarily binds misfolded proteins to prevent protein aggregation, inhibit apoptosis, and contribute to in-tricellular architecture. 3) In an adult heart, the genes MYH6 and MYH7 are predominantly expressed in the ventricle and atrium, respectively. As the culture time of hPSC-CMs prolongs, the gene expression level of MYH7 and MYH6 tend to mature toward the adult cardiomyocytes level. Also, MYH7 and MYH6 provide essential instructions to form part of a large protein called type II myosin that generates the mechanical force to pump blood to the rest of the body. 4) The level of TNNI3 expression gradually increases with the culture time. The TNNI3 gene provides instruction for making a protein called cardiac troponin I, which helps coordinate the heart’s contraction. 5) The ACTC1 is the major protein of the thin filament in cardiac sarcomeres. Some other important cardiac-specific genes are listed in Table 1.
Data Collection and Processing Methods: The differentiation protocol is performed over millions of cells. At different culture dates, these cells are removed for RNA sample collection, and total RNA from hPSC-CMs can be isolated using reagent by following the manufacturer’s protocol [21,22]. To obtain the gene expression profiles, 48804 genes are probed with the microarray method, which can determine whether the RNA or DNA from a particular individual contains a gene mutation. The gene expression profile of hPSC-CMs is then compared with adult CMs by conducting statistical tests.
3. The hPSC-CM Maturity Evaluation Proxy
To propose a data-driven model capable of quantifying the maturation stage of hPSC-CMs with fine granularity, we first examine the gene expression data collected during culturing.
3.1. Cardiac-specific Gene Data Collection
The miRNA expressions of hPSC-CMs (Supp_table4 in [22]) are adopted as input data to analyze the maturation process. The gene expression datasets include: (a) The mRNA expression collected for a set of in vitro culture time points in days. (b) Two independent runs of the adult mRNA expression, namely adult 1 sample and adult 2 sample, where the culture time is indicated as , approximately two years.
On day , three million cells were sampled for RNA collection and cardiac genes listed in the Genomic Institute of the Novartis Research Foundation (GNF) expression atlas were probed [23]. For the i-th probed cardiac gene expression, , the fold change value is measured, which is used to describe the degree of change from the initial gene profile of the fetal sample to the gene profile on day t.
where for the i-th gene, indicates the corresponding gene probe profile of the hPSC-CMs on day t, and is the initial profile of the fetal hPSC-CMs. The transformed the ratio to “fold”, i.e., “times”, where means is doubling .
The resulting fold change data set given below will be used to verify whether culture time can serve as the proxy of the maturity level of hPSC-CMs.
(1) A set of fold change values for hPSC-CMs on day , where is the fold change value of the i-th gene. (2) for adult CMs on day , where is the fold change value of the i-th gene.
3.2. Maturation Level v.s. Culture Duration
To compare the fold changes of the heart signature genes between hPSC-CMs on day t and adult CMs on day , the Pearson correlation coefficient has been calculated during the hPSC-CMs differentiation for two random variables and .
where is the covariance and is the standard deviation. is the sample size, which equals to the total number of sample cardiac genes indexed by i. For hPSC-CMs on day t during in vitro differentiation, is the sample mean of the 203 genes. For adult CMs, is the corresponding sample mean.
Pearson correlation coefficient is a measure of the similarity of two random variables between -1 and 1. If and are highly correlated, i.e., is close to 1, it is reasonable to build a model such that can be predicted based on the value of . An example relationship between the response and the predictor can be described as a linear function:
where is the predicted response of . The coefficients and are the intercept and slope, respectively. tells how much the dependent variable is expected to increase when the independent variable increases by one.
For the simple linear regression model in Eq. (3), and are selected to minimize the difference between the predicted response and the measured response . In particular, to quantify how much variance remains after fitting the linear model, the sum of squared error (SSE) is adopted to measure the performance of the predictive model.
where SSE is measured by the squared differences between the predicted and actual target values. To minimize SSE, the coefficients have the following values.
where the above coefficients are derived by setting the partial derivative of SSE to 0. As compared with slop , can be treated as the standardized slope of the simple linear regression model.
Meanwhile, the coefficient of determination, , measures that “ ×100 % of the variation in is reduced by taking into account predictor ”. tells how much of the total variance can be explained by the linear model.
where the sum of squared total (SST) quantifies the total variance of the target outcome as the sum of squared distance between individual data point and the mean of the response variable . Note that for the linear regression model in Eq. (3), .
As illustrated in Table 2, increases with culture time t. In particular, the squared Pearson correlation coefficient shows a moderate positive linear relationship between the gene expression profiles of day 28 hPSC-CMs and adult CMs. Meanwhile, the value of 93.0% in Figure 2 suggests a strong linear relationship between two adult samples, where only 7% of the variation in the adult 2 sample is left to explain after taking into account the adult 1 sample in a linear way. However, knowing the hPSC-CMs are continually becoming mature is not sufficient. The quantification of the mature stage will be discussed next.
4. Data-Driven Maturity Quantification
Aiming for an effective algorithm to quantify the maturity level of hPSC-CMs, the data-driven pipeline in Figure 3 is designed to select cardiac-specific genes and then map those genes to the in vitro culture time t, which is adopted as the proxy of the maturity stage.
4.1. Data-Driven Maturity Quantification Pipeline
Data Collection: We collected two publicly available data sets with gene-specific fold change values across 12 in vitro culture time points in . The first data set has recorded 203 cardiac genes for 1 group of cells (Supp_table4 in [22]), and the second data set has 48804 genes recorded for 3 groups of cells (GSM873339 - GSM873374 in [14]).
Step 1: Since both data sets are collected in the same culturing environment setting, to integrate them and increase the data volume, the gene “ID” (used by data set 2) is mapped to the “ILMN_Gene” (used by data set 1) according to the GPL6884 table in [24], which can translate the “unique identifier for the probe” to the “internal gene symbol”. Since multiple IDs can map to the same ILMN_Gene, we remove the redundant entries in data set 2.
After cleaning data set 2 and taking the intersection of gene symbols in both data sets, the resulting integrated data set has 48 data records: 4 groups cells across 12 in vitro culture time points. For each record, 189 genes listed in Table A1 in Appendix are recorded. For notation simplicity, the genes that are fed into the next steps (feature selection and predictive modeling) are denoted as , where represents the fold change value of the i-th cardiac gene in .
Steps 2-3: With 48 records of , the train-test split in Table 3 separates the total data set into two parts: records for training and the remaining for testing. Based on the training data, a subset of is selected such that regression analysis can be conducted to learn a function f and predict T.
where is the time estimated by the predictive model f.
The purpose of feature selection is to remove unnecessary, irrelevant, and redundant genes. The remaining important cardiac genes in are useful to create an accurate predictive model f, which aims to minimize the root-mean-square error (RMSE).
where for the j-th training record, is the ground truth, and is the corresponding estimated value. is the sum of squared errors of predicting T, which measures the deviation between the observed value and the true value.
Note that after splitting the training data and test data, the standardization of numerical features is performed over training data, such that each gene’s fold change value has zero mean and unit variance.
where is the fold change value of the i-th gene in the j-th collected record. For each cardiac gene, based on all necessary statistics of the training data (mean and standard deviation ), the standardization is also performed on test data. For notation simplicity, we dropped the superscript in the rest of the paper.
With all of the numerical values in the dataset being standardized, no gene can dominate the objective function and make the estimator unable to learn from other features correctly as expected.
Step 4: To verify the performance of the feature selection algorithm and predictive modeling, the standardized data records in the test data set are fed into the model, and the corresponding RMSE and score are adopted as the performance evaluation metrics.
where is the average ground truth culture time of the testing data. is the fraction of the total sum of squares that is explained by the regression, and the closer is to 1, the better the model.
Since Steps 1 and 4 are fixed for the proposed pipeline, to improve the performance of the hPSC-CM culture time prediction, the following feature selection algorithms (Step 2) and predictive modeling (Step 3) are investigated in our study.
- Method 1 (): Filter method and linear regression
- Method 2 (): Wrapper method
- Method 3 (): Embedded method
- Method 4 (): Non-linear feature selection and non-linear regression
- Method 5 (): Non-linear feature selection and linear regression
4.2. — Filter Method (Pearson Correlation) + Linear Regression
To select the dominant cardiac genes in that determine the culture duration T, the univariate feature selection technique examines the linear strength of the relationship (such as Pearson correlation coefficient) between each input feature and the corresponding output variable T. The ranking of input features based on their strength of relationship concerning the output variable can gain a preliminary understanding of the collected data.
The detailed steps of the correlation-based filter method include: (1) the constant and quasi-constant cardiac genes in , which have variance less than the threshold 0.01, i.e., , are removed from . This step can delete the cardiac genes that do not change significantly when the culture time T increases. (2) Irrelevant cardiac genes with the absolute Pearson correlation coefficient less than the threshold 0.5, i.e., are removed as well, as they contain little information to predict the output T. (3) When the correlation coefficient for a pair of cardiac genes is higher than the threshold 0.5, i.e., , only one gene with a higher correlation with the output variable T is kept.
As illustrated by the heatmap in Figure 4, cardiac genes are kept by the filter method, and each selected input feature () has a high correlation to the output T. The correlations among the selected features are less than the predefined threshold.
After the above feature selection steps, the multiple linear regression is applied to the clean data set and the coefficient of each feature in the linear function is obtained as follows:
where the coefficients of the above linear function are selected to minimize RMSE in Eq. (8). 37.67 is the intercept and other coefficients show the change in the output variable for one unit of change in the input cardiac gene while holding other input genes in the model constant. Since , has more impact on the culture time prediction as compared to .
4.3. — Wrapper Method (Recursive Feature Elimination + Linear Regression)
Different from with sequential feature selection and regression modeling, the wrapper method uses the performance of the regression model as evaluation criteria for the feature selection scheme. In particular, the wrapper method can generate different subsets of features, and each subset is used to build a model and train the learning algorithm. The subset yielding the best performance in terms of RMSE is selected as the final features.
During the subset generation process, the recursive feature elimination (RFE) method involves multi-rounds of elimination of the input variables. In each round, RFE specifies the number of input features that should be selected to build the regression model, and then performs recursive feature elimination. The detailed procedure is given below.
Iteration k: the number of features being selected is iterated from to , where means the cardinality of the cardiac genes in set and the cardinality of the training set . Note that the number of features being selected cannot exceed the number of records in the training dataset.
In the k-th iteration, RFE performs the following two steps.
Step : Build a full linear regression model with all of the input features in the cardiac gene set .
where the above model aims to minimize the RMSE in Eq. (8). Note that since we are trying to build a model with coefficients based on records in the training dataset, the full model is not unique because of the small dataset: .
Step : Rank features based on the absolute value of the coefficient. The least important feature is pruned from the current set of cardiac features. Note that since the training dataset has been standardized to unit variance, the importance of a feature increases with increasing . Otherwise, the feature importance ranking has to take account of the standard deviation of each cardiac gene as well: [25].
Ending Condition for the k-th iteration: For each k-th iteration, repeat the feature elimination Steps - over the pruned set until the number of genes left is k.
After all of the iterations are completed (), the subset size that optimizes the performance criteria (smallest RMSE) is used to select the input variables, and the corresponding optimal subset is then used to train the final model. As illustrated in Figure 5, selected features are ranked based on the absolute linear regression coefficient in the final model.
4.4. — Embedded Method (Lasso Regularization)
Embedded methods combine the qualities of the filter and wrapper methods. It is implemented by regression algorithms with built-in feature selection schemes. Regularization is the most commonly used embedded method that introduces additional constraints to bias the regression model toward less input cardiac features. As shown below, the least absolute shrinkage and selection operator (LASSO), i.e., regularization for generalized linear models, has an additional weighted penalty against the complexity of the model.
where . The model complexity is the sum of the absolute coefficients for all the input features. Meanwhile, is adjustable and the higher the value, the more the coefficient is forced to shrink. With this penalty term, if a feature is irrelevant, LASSO penalizes its coefficient and makes it 0, and this feature is then removed from the data set.
To determine the appropriate value for , cross-validation (CV) is adopted and the training dataset is divided into 5 non-overlapping folds. 100 values of are iterated to train Lasso models over 5 folds. As illustrated in Figure 6, the optimal yields the best average performance in terms of the smallest fold average RMSE: . With the chosen optimal , features with non-zero coefficient in the corresponding predictive model are ranked in Figure 7.
4.5. — Non-Linear Feature Selection and Regression (XGBoost Method)
When the regression model f in Eq. (7) represents a non-linear relationship between the input cardiac genes and the output culture time, the tree-based methods, e.g., decision trees, random forest, and extreme gradient boosting (XGBoost) [26], can be applied to perform feature selection with low complexity. They can model non-linear relations well and do not require much tuning.
As illustrated in Figure 8, the decision tree can create a regression model that predicts the culture time T by evaluating a sequence of true/false questions regarding the cardiac features. Although being an effective regression model, the decision tree is very sensitive and small changes to the training set can result in significantly different tree structures.
XGBoost addresses this issue by leveraging the wisdom of crowds wherein a large number of individual trees operating as a committee will outperform any of the individual constituent trees.
where B is the number of trees. is a function in the functional space , and is the set of all possible trees, which can map the data record to the green leaf node. B is a tunable parameter that can be iterated to reduce the training RMSE.
The importance of a feature in the XGBoost can be measured as the number of times a feature is used to split the data across all trees. With this feature ranking mechanism, multiple XGBoost models are trained iteratively by feeding the top k features. As shown in Figure 9, the cross-validation performance shows that the best XGBoost model only needs the top features. When feeding the selected top 27 cardiac genes, various parameters in the XGBoost model are tuned based on the training data, and the resulting feature importance is ranked in Figure 10.
4.6. — XGBoost Method + Linear Regression
adopts the input features selected by (XGBoost) and predicts the output with the linear regression model. This method is introduced to measure the improvement that achieves by capturing nonlinearity among input features and output T. In other words, this method signifies the impact and importance of implied nonlinearity among the input features and between pairs of inputs and output. The coefficients of the selected cardiac genes in the linear regression model are shown in Figure 11.
5. Results and Discussions
The five feature selection and regression model development methods ( to ) are applied to select the most important cardiac-specific genes that are related to the hPSC-CM culture duration. With the selected genes, predictive algorithms are adopted to quantify the maturity level of hPSC-CMs. The resulting performance over the test data is collected.
5.1. Culture Time Prediction
The comparison between the observed culture time T and the predicted culture time over the test dataset is shown in Figure 12. All of the five methods have acceptable test performance in terms of a small discrepancy between T and , as verified by the low RMSE and the score closer to 1 in Table 4.
For the linear regression models, (RFE with 39 features) yields the best performance, which is followed by (Lasso with 40 features), (Pearson correlation with 2 features), and (with 27 features selected by XGBoost). For these 4 linear models, the predictive performance does not strictly grow or decrease with the number of selected cardiac genes. The reason is that on one hand, the predictive performance will improve when the number of important cardiac genes being selected increases. On the other hand, the performance will drop when less important cardiac genes are included in the predictive model.
Moreover, the non-linear model (XGBoost) outperforms all of the four linear models. This is another successful application of XGBoost because it can extract useful predictive information from 27 genes while (RFE) needs 39 cardiac genes. The performance degradation from to verifies that XGBoost can capture the non-linearity correlation among the selected cardiac genes and culture time.
5.2. Cardiac Gene Selection
As illustrated in Table 4, three methods (, , and ) have selected as the top gene in that correlates with the culture duration. The detailed importance level of can be found in Eq. (11), Figure 7, and Figure 10. Although (RFE in Figure 5) ranks as the 8-th important gene, the training dataset is very small (only 40 data records), there is randomness in the 189 coefficients of the full model returned by Eq. (12). Consequently, the ranking of the cardiac genes returned by has randomness as well. When is not ranked as the top cardiac gene, has the worst performance.
It is thus reasonable to conclude that is the most important gene in terms of predicting the culture time of hPSC-CMs. This is a very important observation because it can guide the maturation promotion scheme design for hPSC-CMs. (Gene CASQ2: Calsequestrin 2) triggers muscle contraction and plays a critical role in excitation-contraction coupling in the heart and in regulating the rate of heartbeats.
By stimulating hPSC-CMs such that the fold change value of CASQ2 increases faster, it is likely to promote the maturation of hPSC-CMs into a more adult-like phenotype. Meanwhile, since the cultured cells are destroyed during data acquisition, the existing gene expression-based hPSC-CM maturity quantification schemes are invasive and costly, similar to the morphology and structure-based schemes and calcium handling-based schemes described in Section 2. For non-invasive maturity quantification, the contractile function and electrophysiological property-based approaches have the most potential, because lab-on-chip devices [27] can be designed and fabricated to monitor the properties that correlate with in real-time as the culture duration prolongs.
6. Conclusion
We have proposed a data-driven maturity evaluation pipeline for hPSC-CMs. Based on the public gene expression data that spans various in vitro culture time points, the feasibility of adopting culture time as a proxy for assessing hPSC-CM maturity is verified. The biology domain knowledge and machine learning algorithms have been applied to select dominating cardiac genes that correlate with the culture time, and regression algorithms can further predict the culture time with an average error of fewer than 4.5 days. This work lays the foundation for standardizing the hPSC-CM maturation quantification process and provides insights into promoting the maturation of hPSC-CMs. Since cells may vary randomly in the rate of maturation and develop the same functionalities at different paces, the correlation between the post-differentiation culture time and the maturity level might not be perfect. Our future work will be exploring a more reliable proxy of the maturation level. Moreover, the gene expression data currently available is relatively small, a novel machine learning model will be proposed to uncover the latent maturity level with a relatively small amount of data.
Acknowledgments
This research was supported in part by NSF under grant no. 2327146 and 2327147.
Conflicts of Interest
The authors declare no conflicts of interest.
Appendix A

Table A1.
The mapping between variable name in and cardiac gene ID
| X | Gene | X | Gene | X | Gene | X | Gene | |||
|---|---|---|---|---|---|---|---|---|---|---|
| ABO | ACO2 | ACOT2 | ACOX2 | |||||||
| ACTN2 | AK1 | ANK1 | ANKRD2 | |||||||
| ATP5G1 | ATP5G3 | BAG3 | BRP44L | |||||||
| BSG | C1QA | C1QB | CA4 | |||||||
| CABC1 | CAND2 | CASQ2 | CCL15 | |||||||
| CD151 | CD320 | CFD | CHST7 | |||||||
| CKM | CKMT2 | CLEC3B | CLTB | |||||||
| COQ9 | COX5A | COX5B | COX6A2 | |||||||
| COX7A1 | COX8A | CPT1B | CRIP2 | |||||||
| CRYAB | CRYM | CSDC2 | CSRP3 | |||||||
| CTTN | CYC1 | DCHS1 | DCI | |||||||
| DES | DEXI | DMPK | DSPP | |||||||
| ECHDC3 | ECSIT | EEF1A2 | EFEMP2 | |||||||
| ENDOG | ERCC1 | FABP3 | FAHD2A | |||||||
| FARS2 | FHL2 | FLJ22222 | FLNC | |||||||
| FXYD1 | GADD45GIP1 | GAMT | GATA4 | |||||||
| GATA6 | GOT1 | GPC1 | GYS1 | |||||||
| HOMER3 | HRC | HSPB1 | HSPB2 | |||||||
| HSPB3 | HSPB6 | HSPB7 | HSPB8 | |||||||
| HSPG2 | ICAM2 | IDH2 | IFI27 | |||||||
| IGFBP2 | IGFBP7 | IL11RA | ILVBL | |||||||
| INMT | ITGA7 | ITGB1BP2 | ITGB1BP3 | |||||||
| KCNH2 | LDB3 | LGALS3BP | MAPKAPK3 | |||||||
| MB | MCOLN1 | MRAS | MRPL12 | |||||||
| MRPL34 | MRPL41 | MRPS12 | MSRB2 | |||||||
| MYBPC3 | MYH6 | MYH7 | MYL2 | |||||||
| MYL3 | MYL4 | MYL7 | MYL9 | |||||||
| MYLC2PL | MYOM1 | MYOM2 | MYOZ2 | |||||||
| NDUFA11 | NDUFA7 | NDUFB10 | NDUFB7 | |||||||
| NDUFS7 | NDUFS8 | NKX2-5 | NOL3 | |||||||
| NPPA | NPPB | NRAP | OGDH | |||||||
| OPLAH | PCTK3 | PDE4DIP | PDK2 | |||||||
| PDLIM5 | PGAM2 | PGM1 | PHPT1 | |||||||
| PLA2G5 | PLEKHF1 | PLN | POLR2I | |||||||
| POLRMT | POMGNT1 | POPDC2 | PPAPDC3 | |||||||
| PPP1R13L | PPP1R1A | PPP2R3B | PTGDS | |||||||
| PTP4A3 | PTPLA | PTRF | PXMP2 | |||||||
| RAMP1 | RAMP3 | RASIP1 | RBPMS | |||||||
| RGS3 | RRAS | S100A1 | SEPW1 | |||||||
| SGCG | SH3RF2 | SIVA | SLC25A11 | |||||||
| SLC25A4 | SLC29A1 | SLC4A3 | SMPX | |||||||
| SMTN | SNTA1 | STAB1 | STOML1 | |||||||
| STOML2 | SYNPO2L | TACC2 | TAX1BP3 | |||||||
| TCAP | TIMM8B | TM7SF2 | TMEM159 | |||||||
| TNNC1 | TNNI3 | TNNT2 | TNXA | |||||||
| TNXB | TPM1 | TSPAN4 | UQCR | |||||||
| UQCRC1 | VAMP5 | VEGFB | VWF | |||||||
| WDR13 | ||||||||||
References
- Virani, S.S.; Alonso, A.; Aparicio, H.J.; Benjamin, E.J.; Bittencourt, M.S.; Callaway, C.W.; Carson, A.P.; Chamberlain, A.M.; Cheng, S.; Delling, F.N.; Elkind, M.S.; Evenson, K.R.; Ferguson, J.F.; Gupta, D.K.; Khan, S.S.; Kissela, B.M.; Knutson, K.L.; Lee, C.D.; Lewis, T.T.; Liu, J.; Loop, M.S.; Lutsey, P.L.; Ma, J.; Mackey, J.; Martin, S.S.; Matchar, D.B.; Mussolino, M.E.; Navaneethan, S.D.; Perak, A.M.; Roth, G.A.; Samad, Z.; Satou, G.M.; Schroeder, E.B.; Shah, S.H.; Shay, C.M.; Stokes, A.; VanWagner, L.B.; Wang, N.Y.; Tsao, C.W. Heart Disease and Stroke Statistics – 2021 Update. Circulation 2021, 143, e254–e743. [CrossRef]
- Fryar, C.D.; Chen, T.C.; Li, X. Prevalence of uncontrolled risk factors for cardiovascular disease: United States, 1999-2010. NCHS Data Brief 2012, pp. 1–8.
- Centers for Disease Control and Prevention. Underlying Cause of Death, 1999-2019 Request, accessed August 2021.
- Sinnecker, D.; Laugwitz, K.L.; Moretti, A. Induced pluripotent stem cell-derived cardiomyocytes for drug development and toxicity testing. Pharmacol Ther 2014, 143, 246–252. [CrossRef]
- Jung, G.; Bernstein, D. hiPSC Modeling of Inherited Cardiomyopathies. Curr Treat Options Cardiovasc Med 2014, 16, 320. [CrossRef]
- Nunes, S.S.; Miklas, J.W.; Liu, J.; Aschar-Sobbi, R.; Xiao, Y.; Zhang, B.; Jiang, J.; Massé, S.; Gagliardi, M.; Hsieh, A.; Thavandiran, N.; Laflamme, M.A.; Nanthakumar, K.; Gross, G.J.; Backx, P.H.; Keller, G.; Radisic, M. Biowire: A platform for maturation of human pluripotent stem cell-derived cardiomyocytes. Nature Methods 2013, 10, 781–787. [CrossRef]
- Shah, N.; Morsi, Y.; Manasseh, R. From mechanical stimulation to biological pathways in the regulation of stem cell fate. Cell Biochemistry and Function 2014, 32, 309–325. [CrossRef]
- Venkatesh, S.; Baljinnyam, E.; Tong, M.; Kashihara, T.; Yan, L.; Liu, T.; Li, H.; Xie, L.H.; Nakamura, M.; ichi Oka, S.; Suzuki, C.K.; Fraidenraich, D.; Sadoshima, J. Proteomic analysis of mitochondrial biogenesis in cardiomyocytes differentiated from human induced pluripotent stem cells. Am J Physiol Regul Integr Comp Physiol 2021, 320, R547 – R562.
- Lundy, S.D.; Zhu, W.Z.; Regnier, M.; Laflamme, M.A. Structural and functional maturation of cardiomyocytes derived from human pluripotent stem cells. Stem Cells Dev 2013, 22, 1991–2002. [CrossRef]
- Ahmed, R.E.; Anzai, T.; Chanthra, N.; Uosaki, H. A Brief Review of Current Maturation Methods for Human Induced Pluripotent Stem Cells-Derived Cardiomyocytes. Frontiers in Cell and Developmental Biology 2020, 8, 178. [CrossRef]
- Solomatine, D.P.; Ostfeld, A. Data-driven modelling: some past experiences and new approaches. Journal of Hydroinformatics 2008, 10, 3–22. [CrossRef]
- Ren, Y.; Cui, Q.; Zhao, X.; Wang, Y.; Huang, X.; Ni, W. Data-Driven Intelligent Management of Energy Constrained Autonomous Vehicles in Smart Cities. Cognitive Radio-Oriented Wireless Networks, 2021, pp. 112–125.
- Kamel, E.; Sheikh, S.; Huang, X. Data-driven predictive models for residential building energy use based on the segregation of heating and cooling days. Energy 2020, 206, 118045. [CrossRef]
- Babiarz, J.E.; Ravon, M.; Sridhar, S.; Ravindran, P.; Swanson, B.; Bitter, H.; Weiser, T.; Chiao, E.; Certa, U.; Kolaja, K.L. miRNA expression profiling of differentiating human-induced pluripotent stem cell (hiPSC)-derived cardiomyocytes, accessed July 2021, [https://www.ncbi.nlm.nih.gov/geo/query/acc.cgi?acc=GSE35672].
- Alfons Staerk. What do Lord Kelvin and Peter Drucker have in common?, 2021.
- Peters, N.S.; Severs, N.J.; Rothery, S.M.; Lincoln, C.; Yacoub, M.H.; Green, C.R. Spatiotemporal relation between gap junctions and fascia adherens junctions during postnatal development of human ventricular myocardium. Circulation 1994, 90, 713–725. [CrossRef]
- Laflamme, M.A.; Murry, C.E. Heart regeneration. Nature 2011, 473, 326–335. [CrossRef]
- Jiang, Y.; Park, P.; Hong, S.M.; Ban, K. Maturation of Cardiomyocytes Derived from Human Pluripotent Stem Cells: Current Strategies and Limitations. Mol Cells 2018, 41, 613–621. [CrossRef]
- Denning, C.; Borgdorff, V.; Crutchley, J.; Firth, K.S.A.; George, V.; Kalra, S.; Kondrashov, A.; Hoang, M.D.; Mosqueira, D.; Patel, A.; Prodanov, L.; Rajamohan, D.; Skarnes, W.C.; Smith, J.G.W.; Young, L.E. Cardiomyocytes from human pluripotent stem cells: From laboratory curiosity to industrial biomedical platform. Biochim Biophys Acta 2016, 1863, 1728–1748. [CrossRef]
- Liu, J.; Lieu, D.K.; Siu, C.W.; Fu, J.D.; Tse, H.F.; Li, R.A. Facilitated maturation of Ca2+ handling properties of human embryonic stem cell-derived cardiomyocytes by calsequestrin expression. American journal of physiology. Cell physiology 2009.
- van den Berg, C.W.; Okawa, S.; Chuva de Sousa Lopes, S.M.; van Iperen, L.; Passier, R.; Braam, S.R.; Tertoolen, L.G.; del Sol, A.; Davis, R.P.; Mummery, C.L. Transcriptome of human foetal heart compared with cardiomyocytes from pluripotent stem cells. Development 2015, 142, 3231–3238, [https://journals.biologists.com/dev/article-pdf/142/18/3231/1838606/dev123810.pdf]. [CrossRef]
- Babiarz, J.E.; Ravon, M.; Sridhar, S.; Ravindran, P.; Swanson, B.; Bitter, H.; Weiser, T.; Chiao, E.; Certa, U.; Kolaja, K.L. Determination of the human cardiomyocyte mRNA and miRNA differentiation network by fine-scale profiling. Stem Cells Dev 2012, 21, 1956–1965. [CrossRef]
- Su, A.I.; Wiltshire, T.; Batalov, S.; Lapp, H.; Ching, K.A.; Block, D.; Zhang, J.; Soden, R.; Hayakawa, M.; Kreiman, G.; Cooke, M.P.; Walker, J.R.; Hogenesch, J.B. A gene atlas of the mouse and human protein-encoding transcriptomes. Proceedings of the National Academy of Sciences 2004, 101, 6062–6067. [CrossRef]
- Illumina Inc.. Illumina HumanWG-6 v3.0 expression beadchip, 2021.
- Siegel, A.F. Chapter 12 - Multiple Regression: Predicting One Variable From Several Others. In Practical Business Statistics; Academic Press, 2016; pp. 355–418. [CrossRef]
- Chen, T.; Guestrin, C. XGBoost: A Scalable Tree Boosting System. Proceedings of the 22nd ACM SIGKDD International Conference on Knowledge Discovery and Data Mining, 2016, pp. 785–794. [CrossRef]
- Zhang, X.; Wang, W.; Li, F.; Voiculescu, I. Stretchable impedance sensor for mammalian cell proliferation measurements. Lab Chip 2017, 17, 2054–2066. [CrossRef]
Figure 1.
Existing maturity evaluation methods of hPSC-CMs.
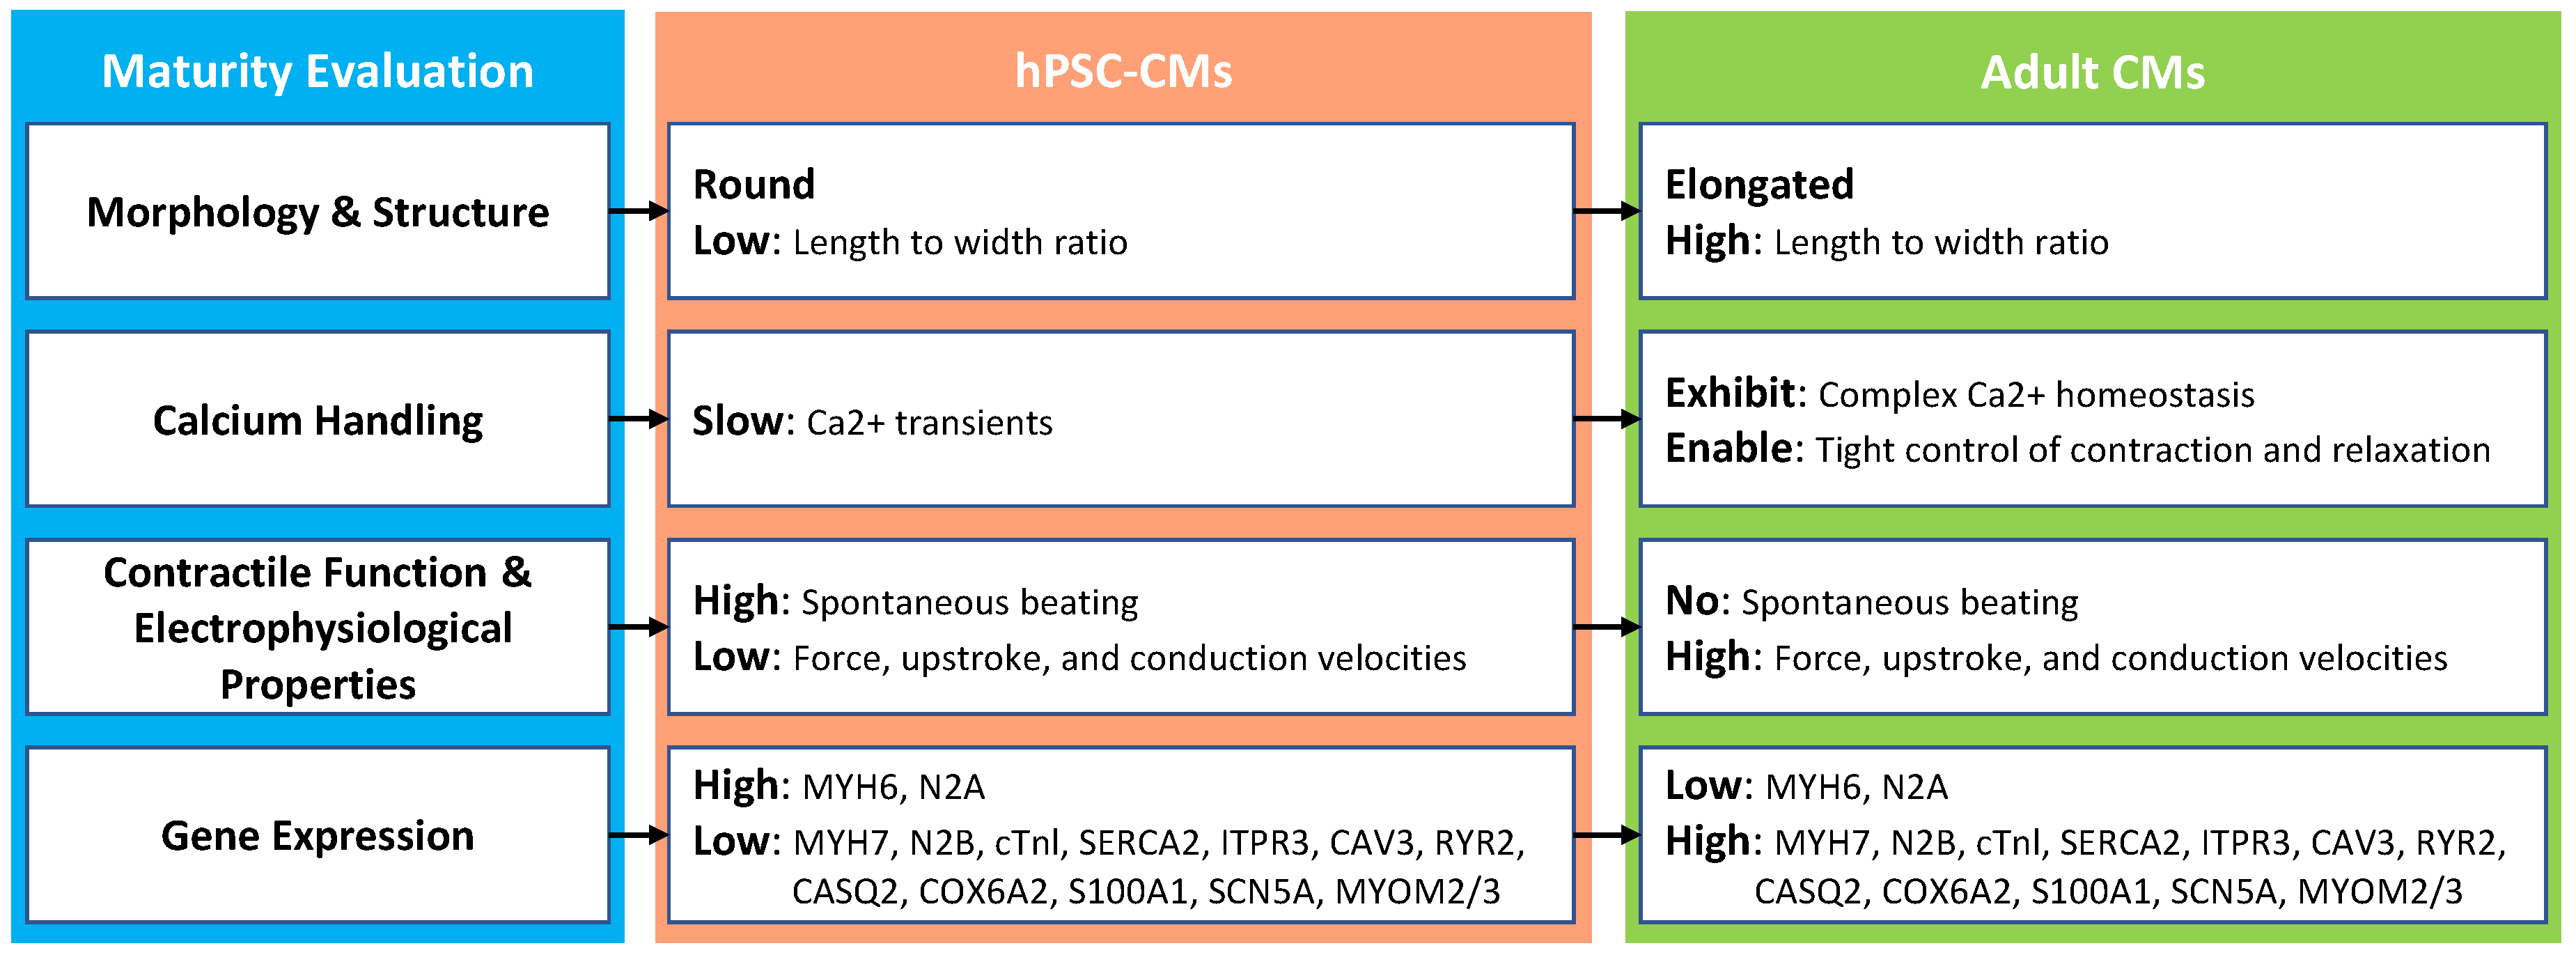
Figure 2.
Comparison of the cardiac-specific genes between adult CMs and hPSC-CMs.
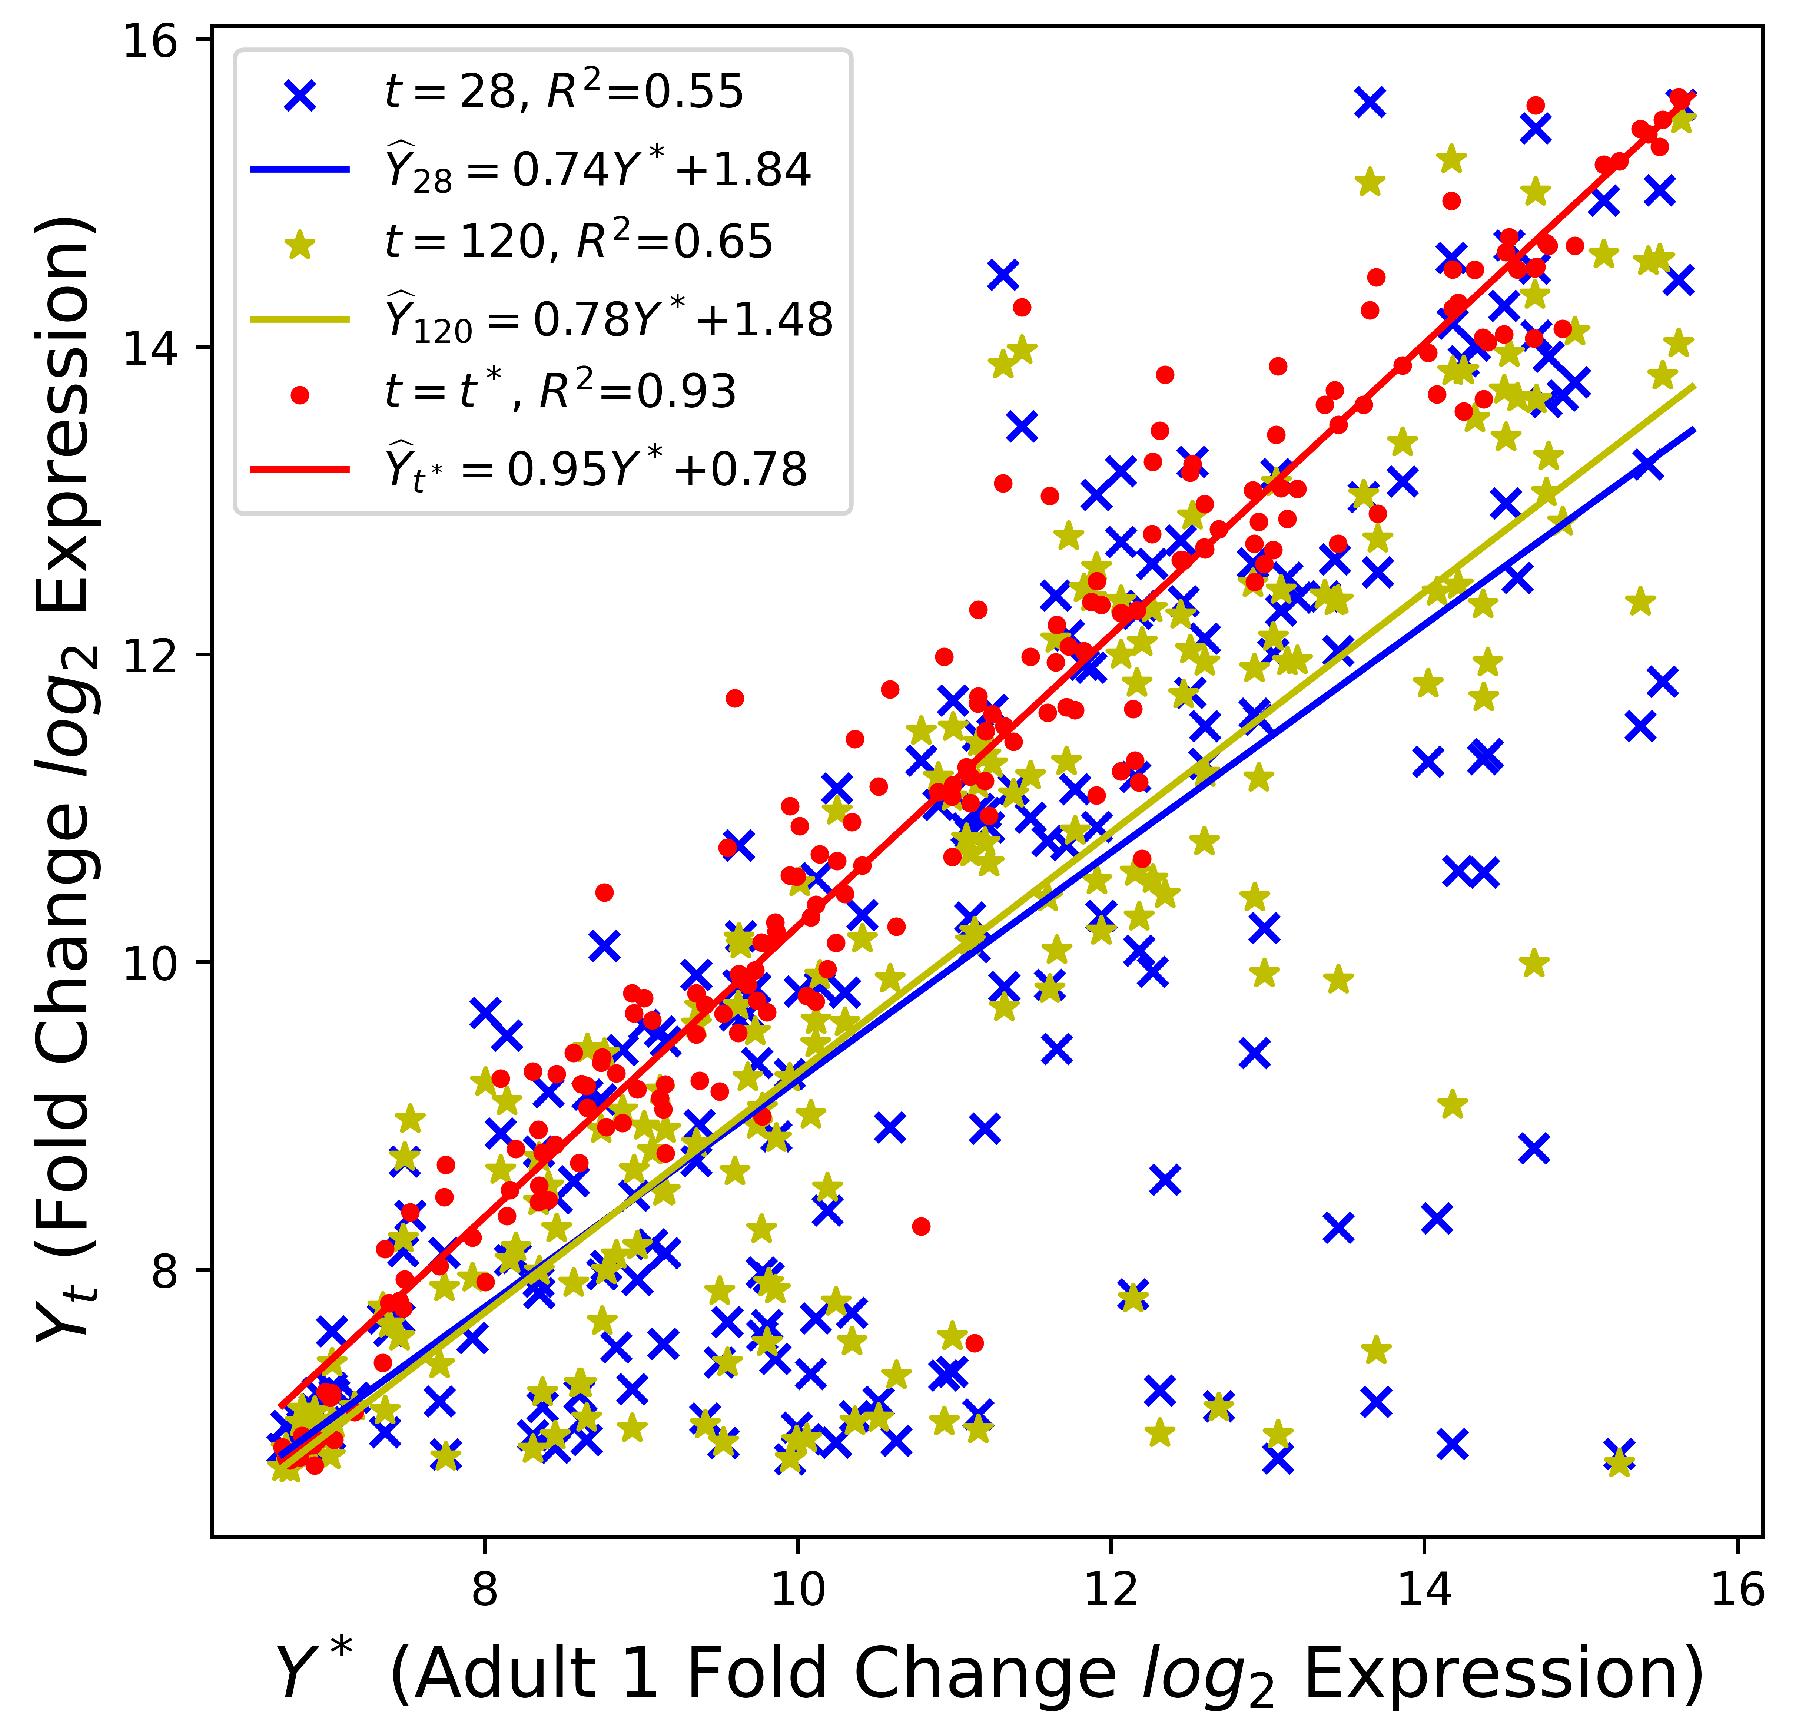
Figure 3.
The data-driven maturation quantification pipeline.
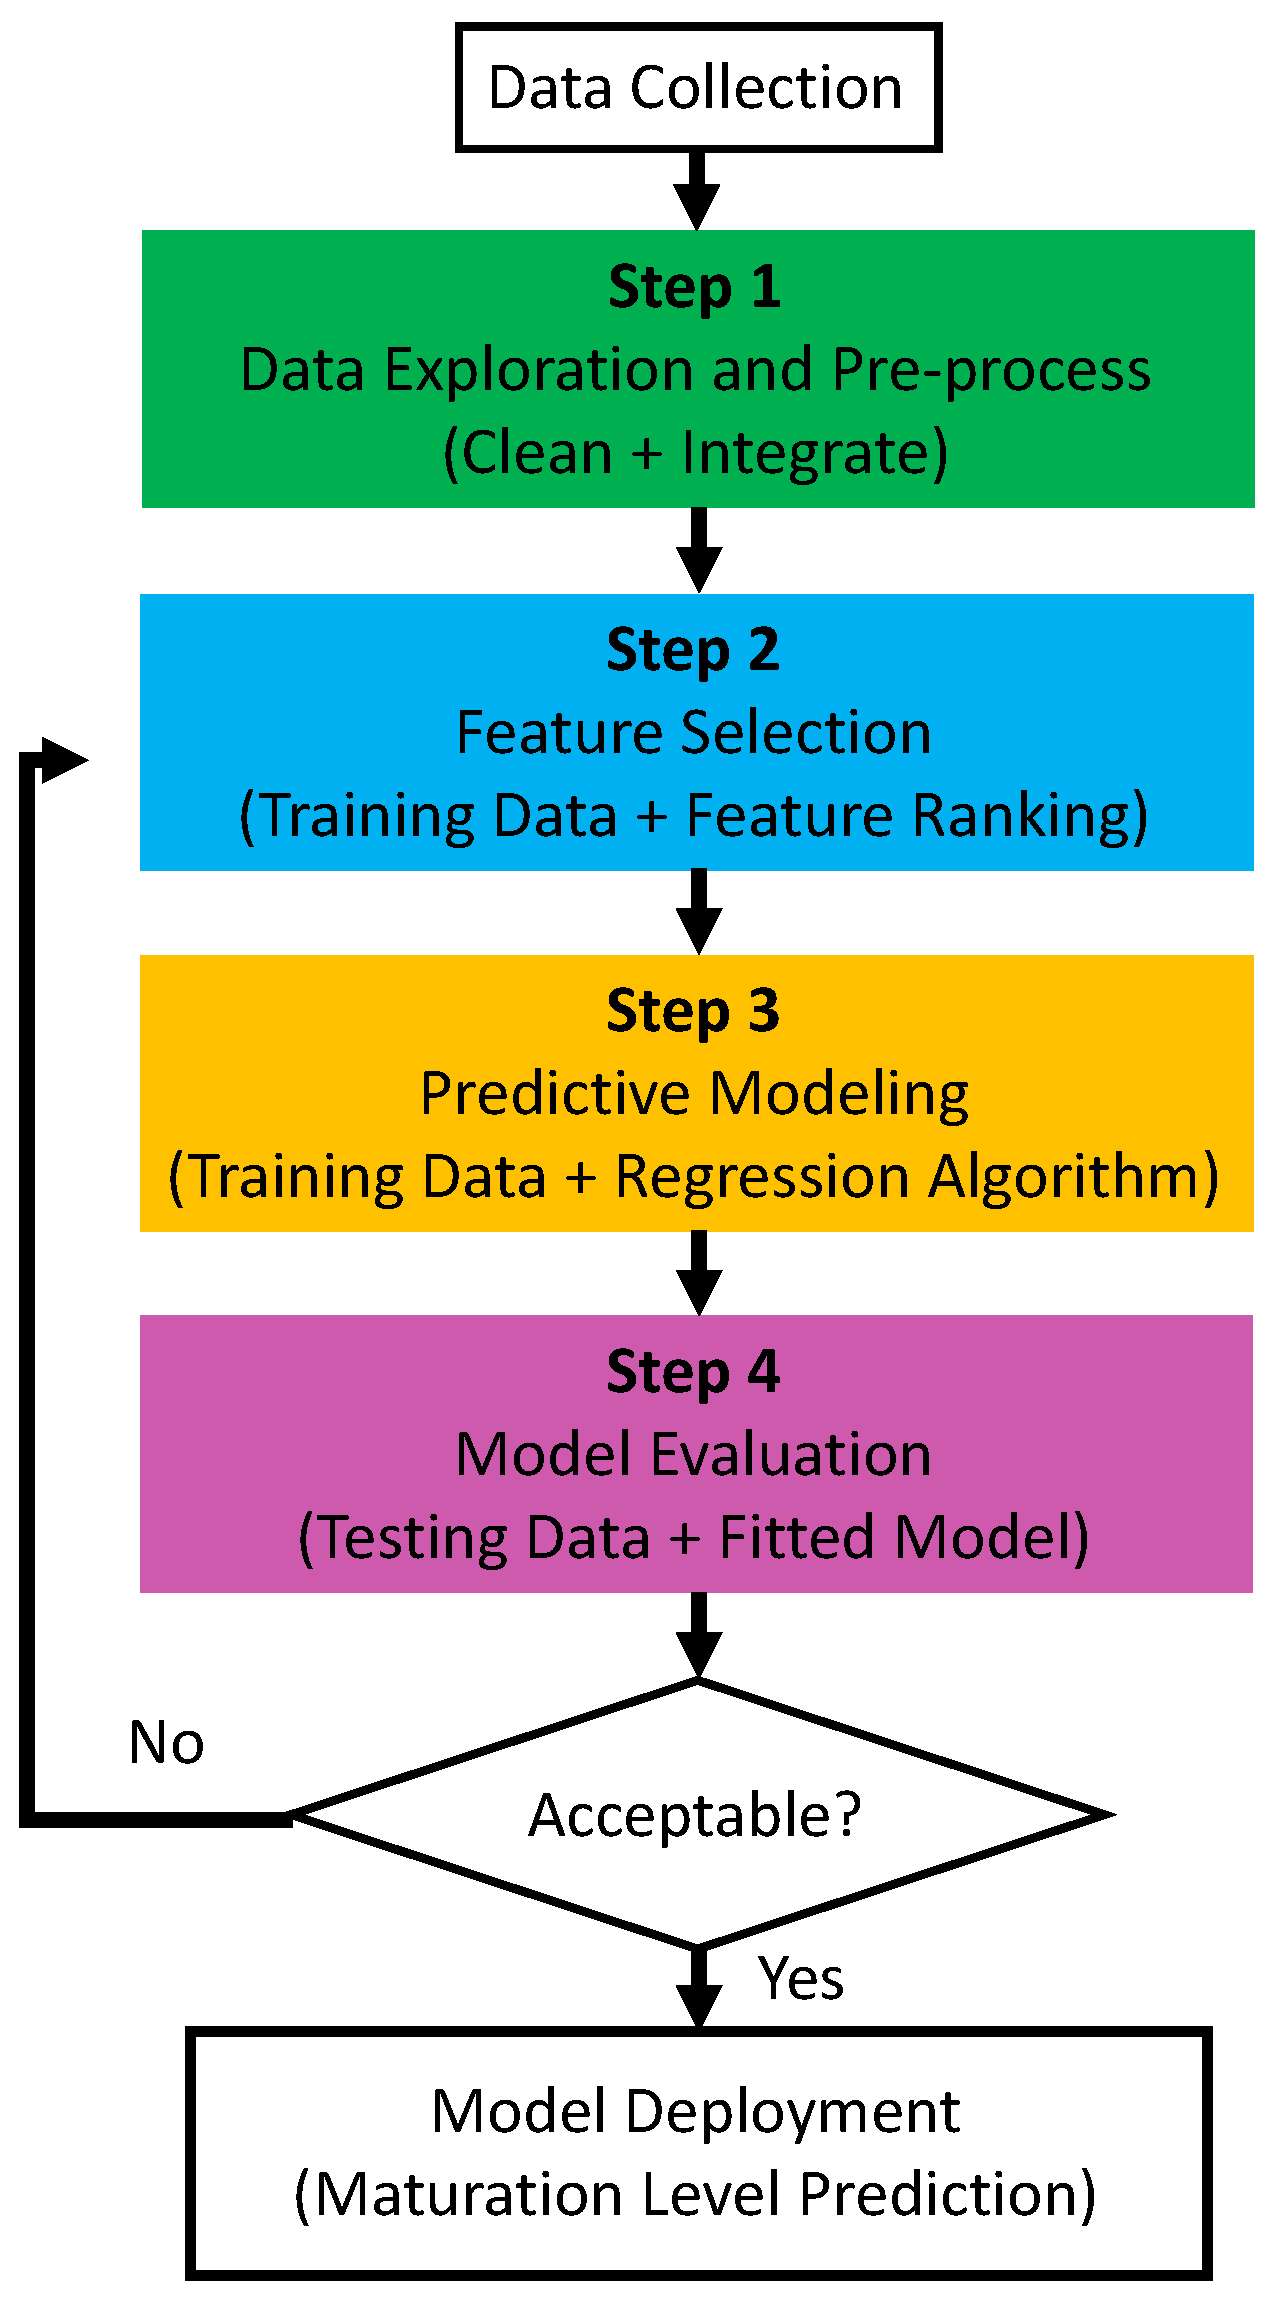
Figure 4.
Pair-wise correlation of the gene selected by .
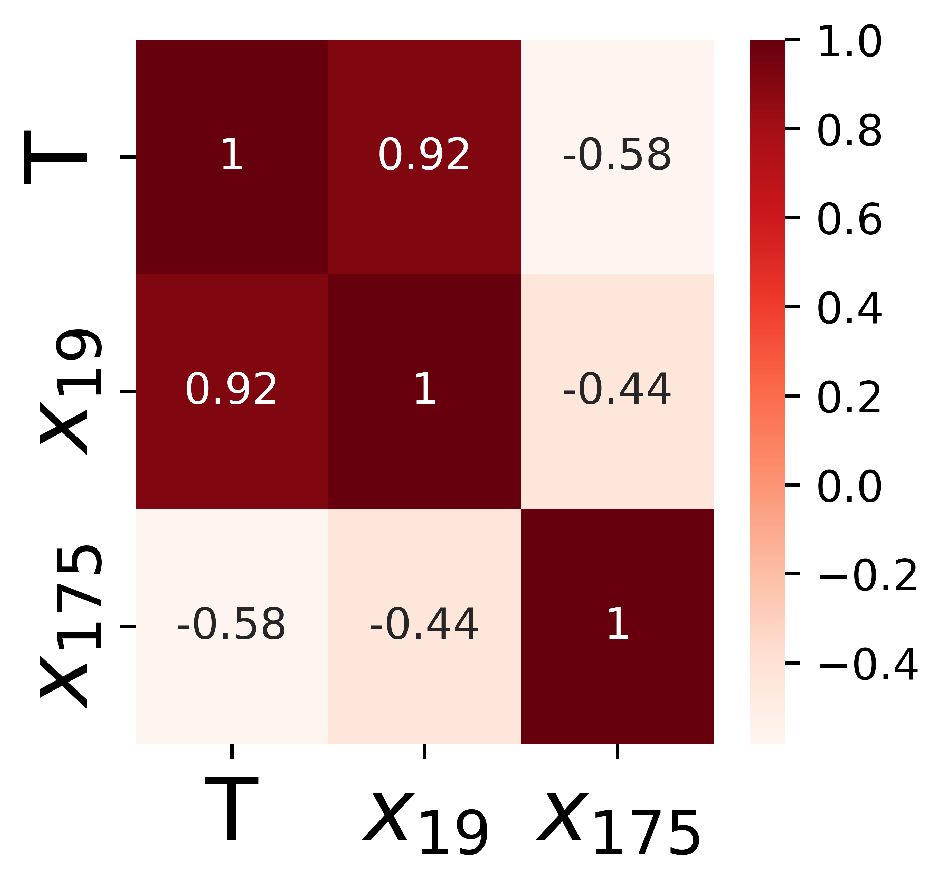
Figure 5.
The ranking of cardiac genes selected by .
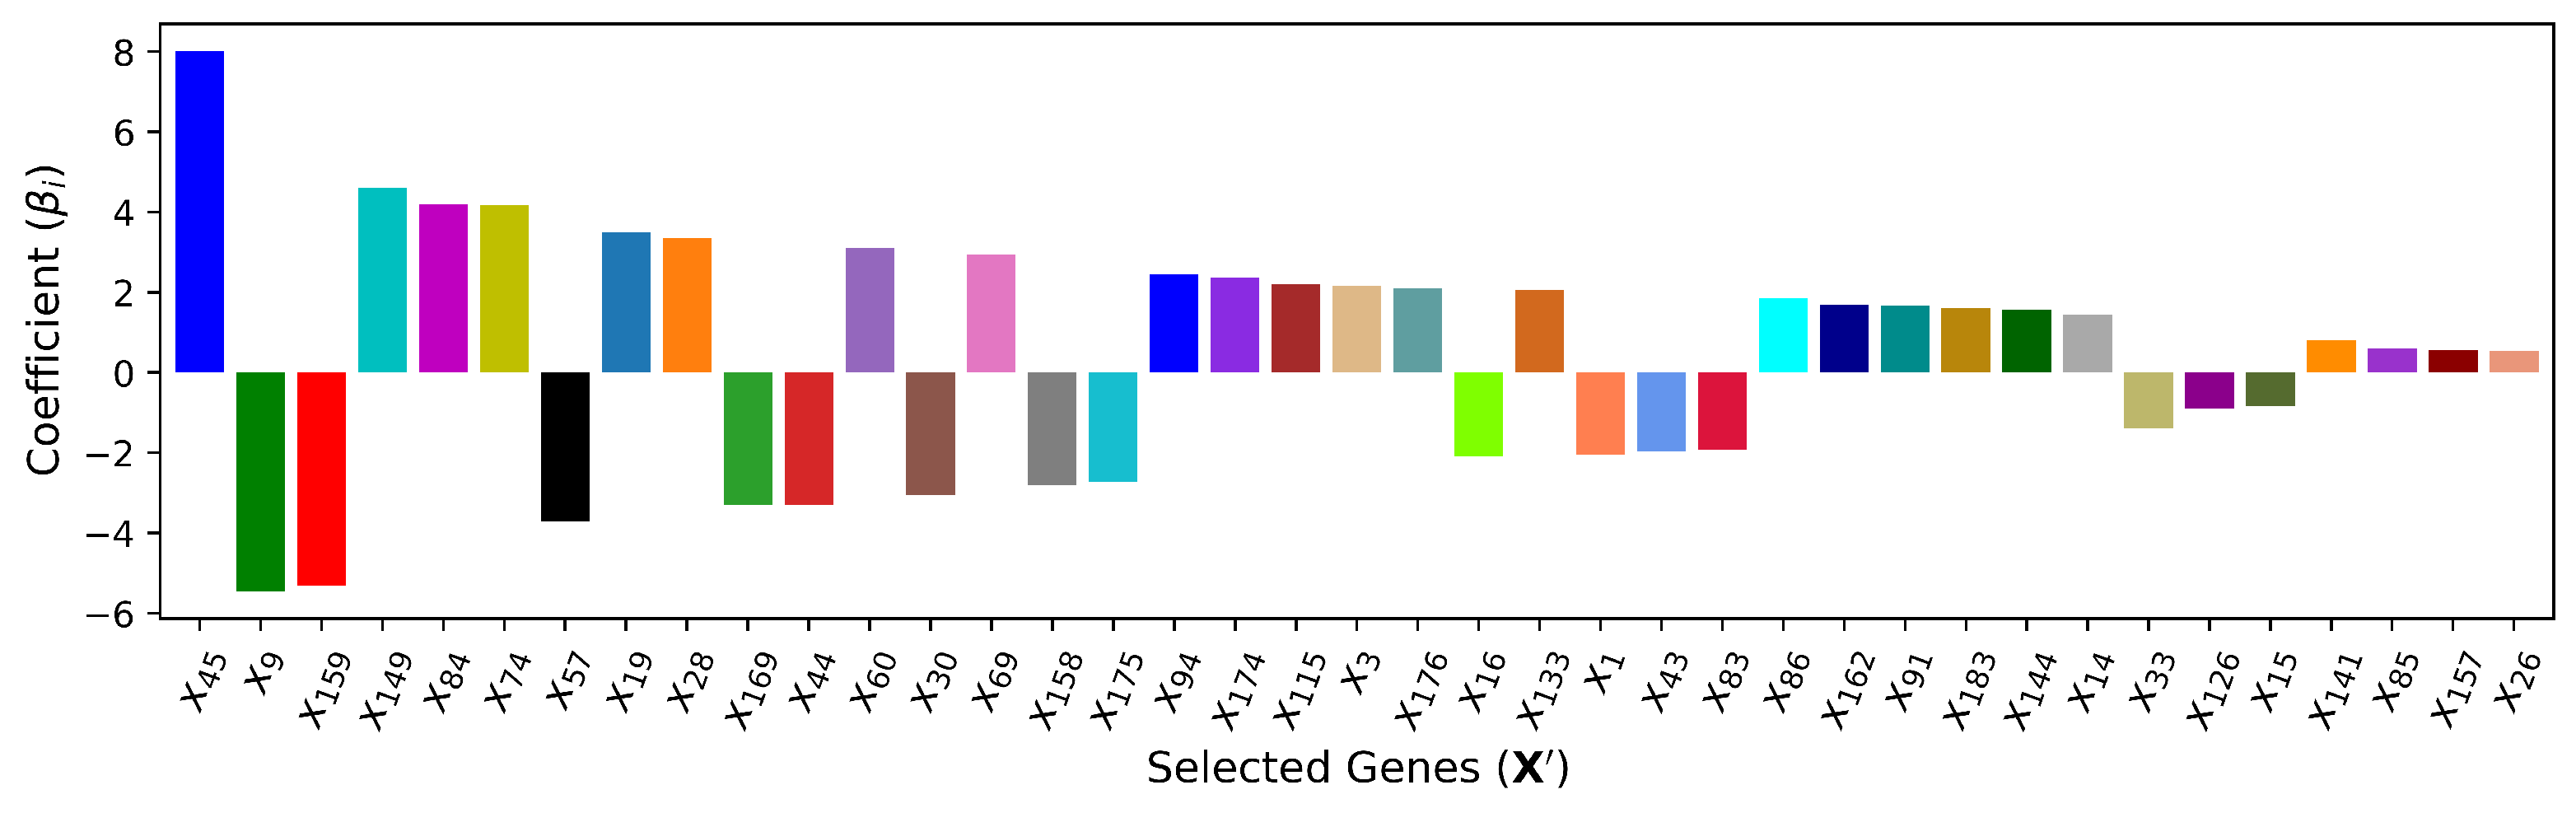
Figure 6.
The tuning of regularization coefficient .
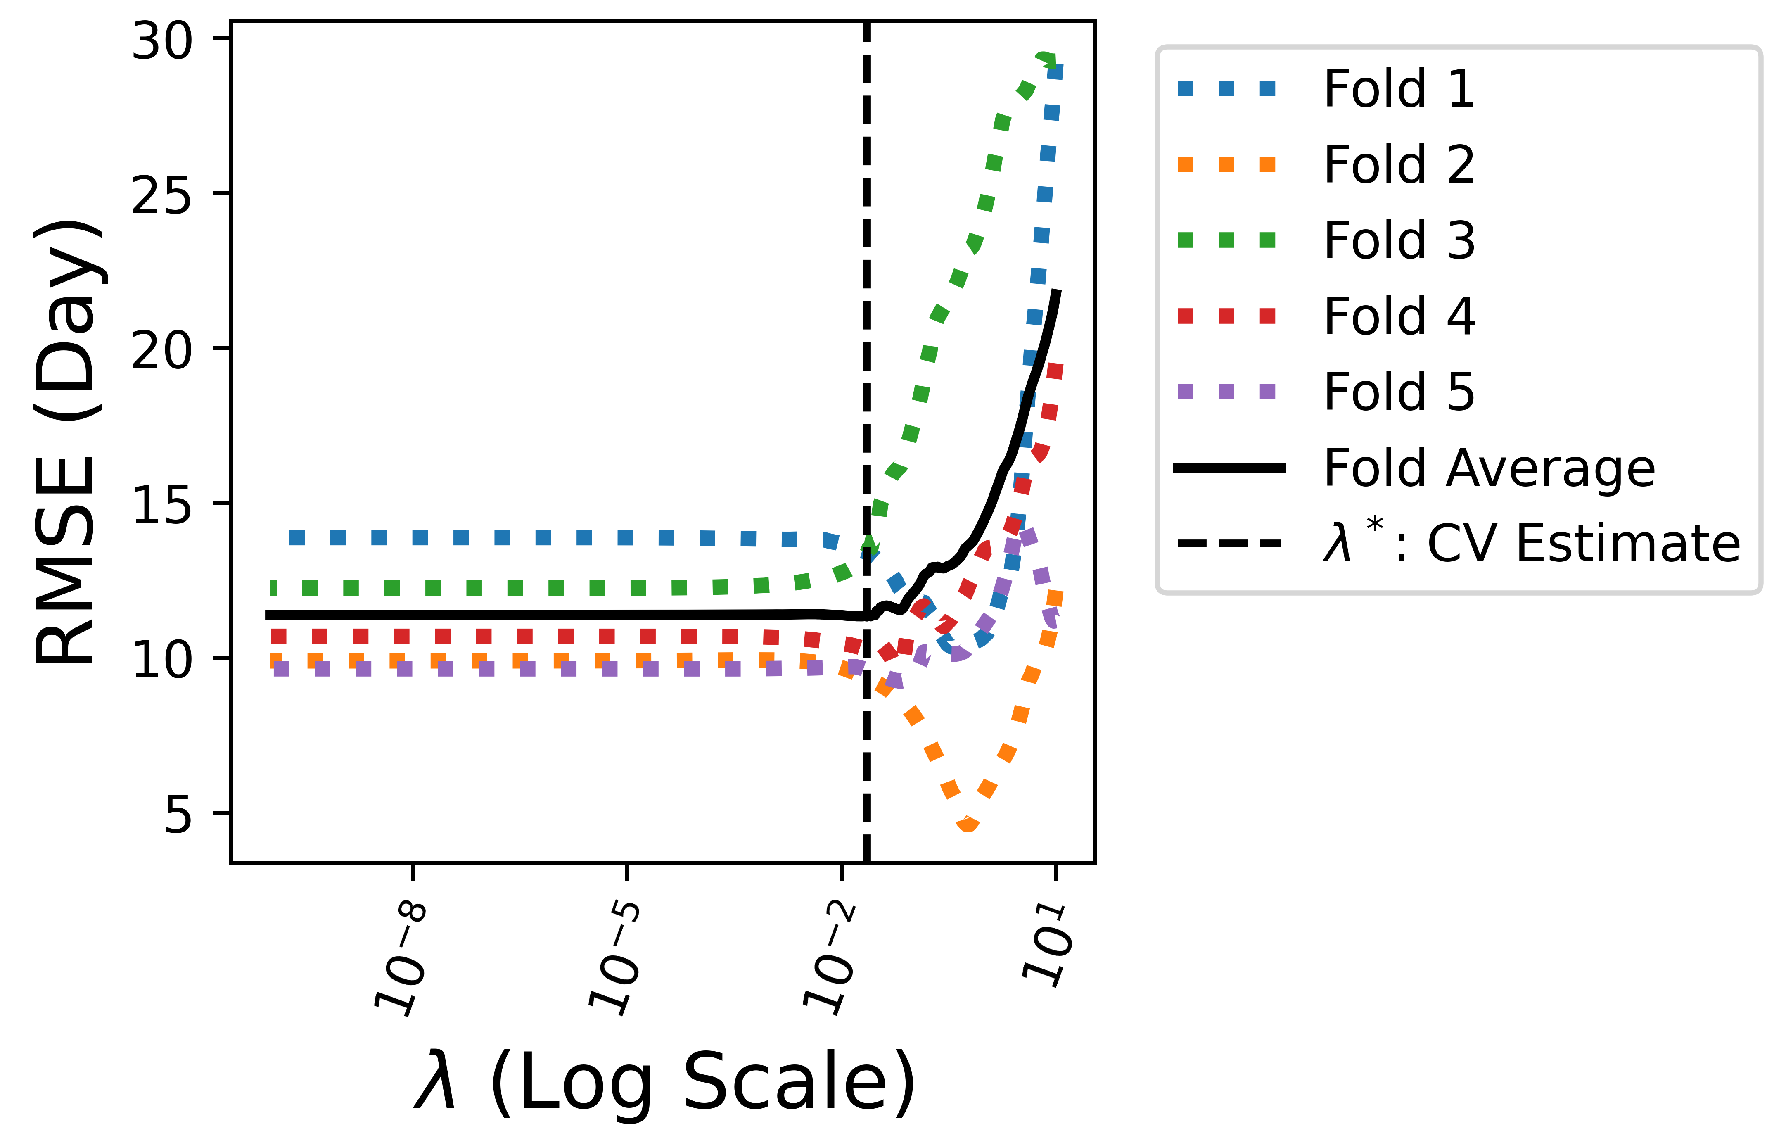
Figure 7.
The ranking of cardiac genes selected by .
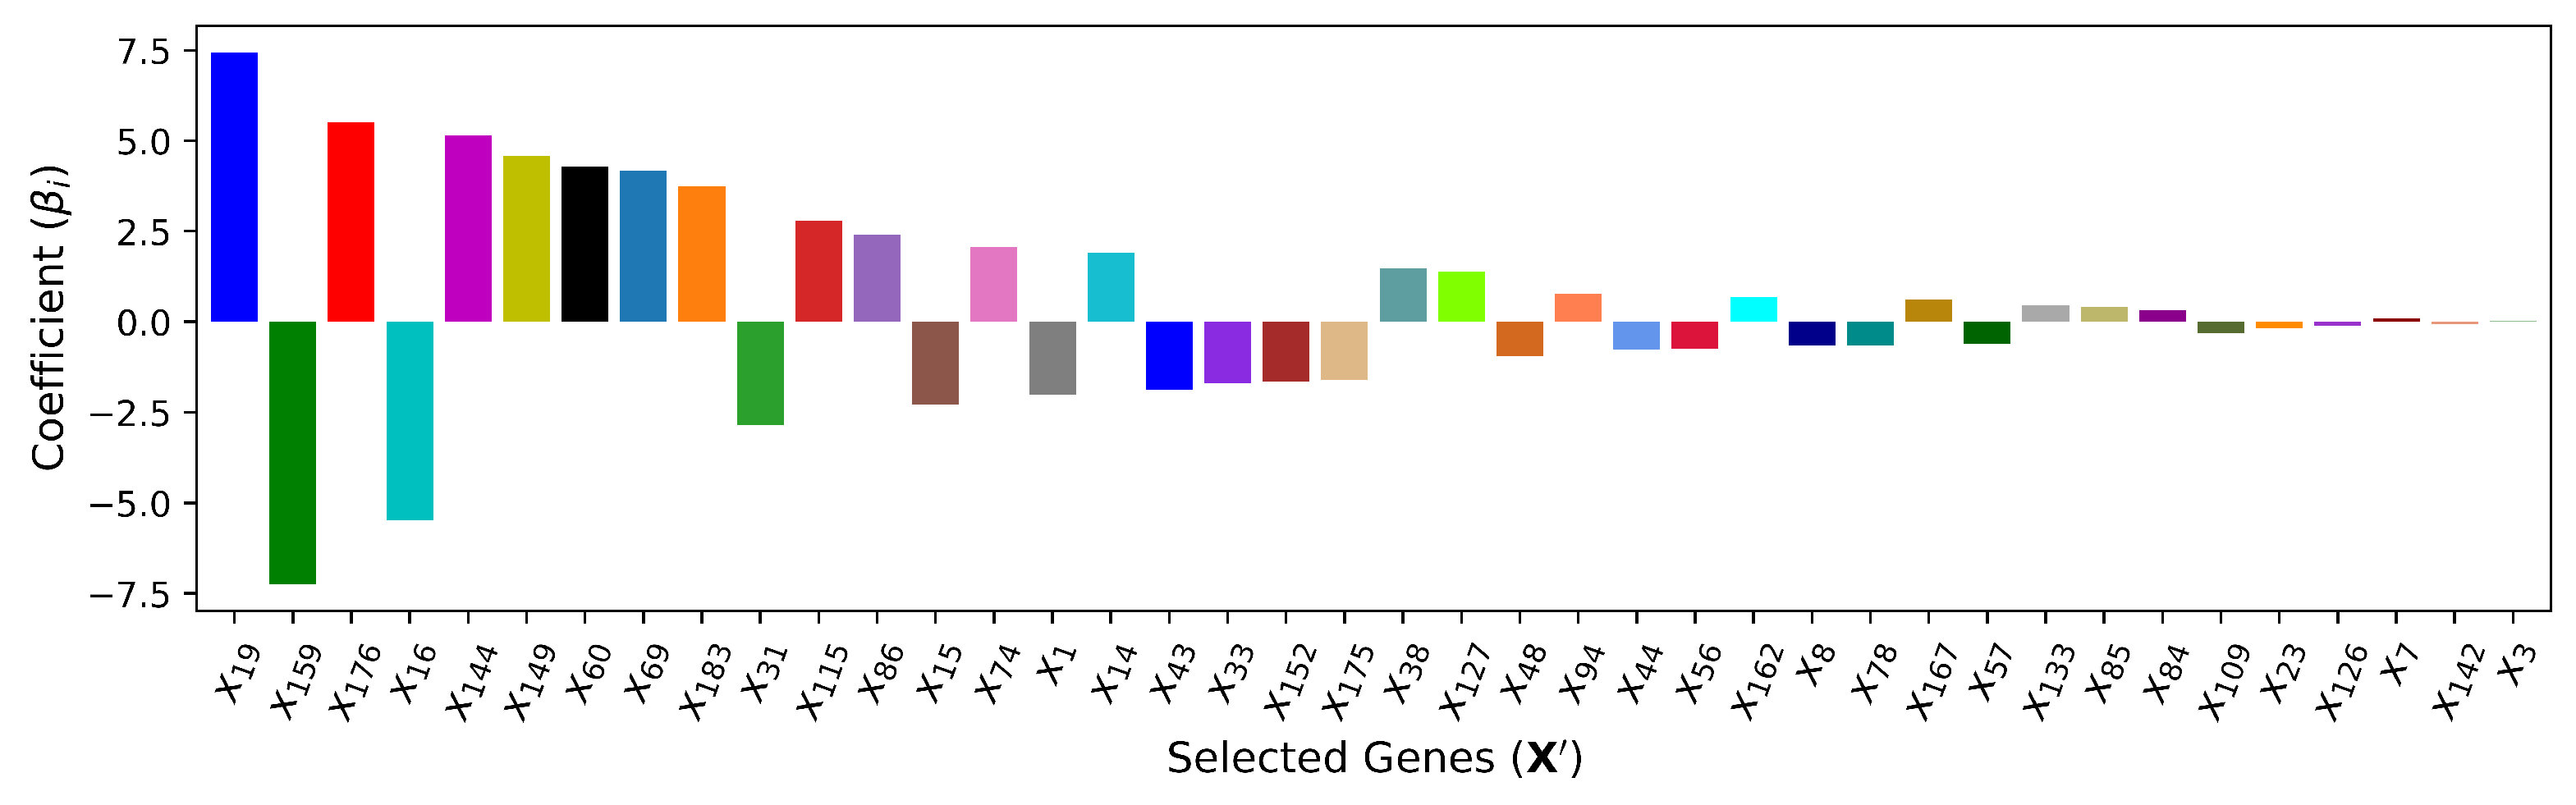
Figure 8.
The first decision tree of XGBoost.
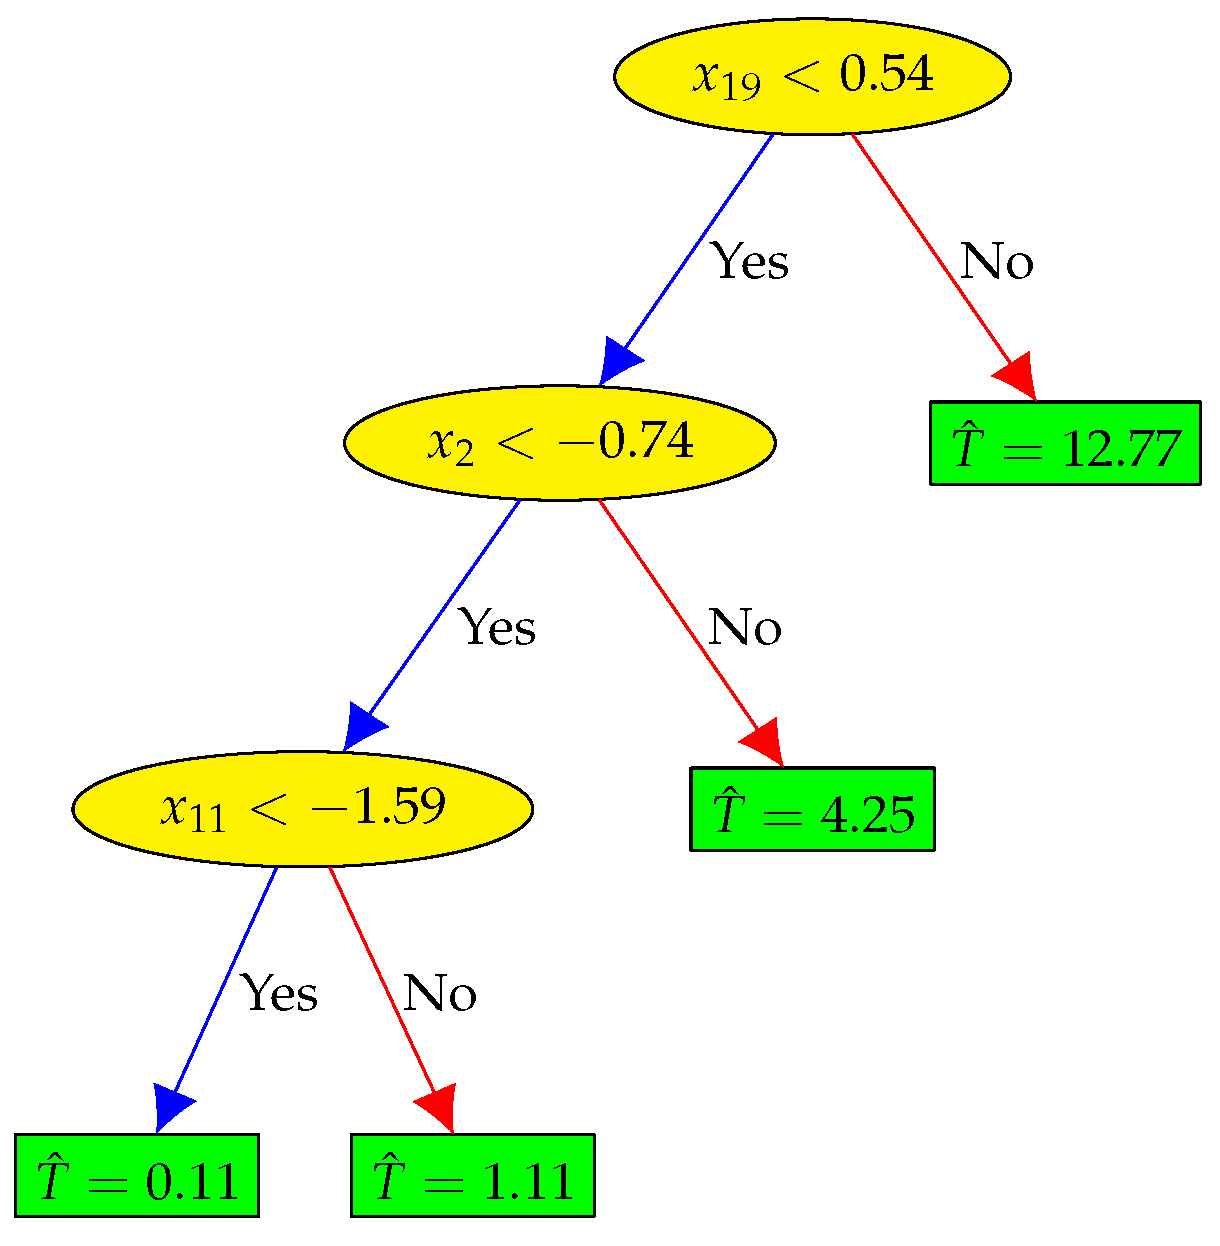
Figure 9.
XGBoost based feature selection.
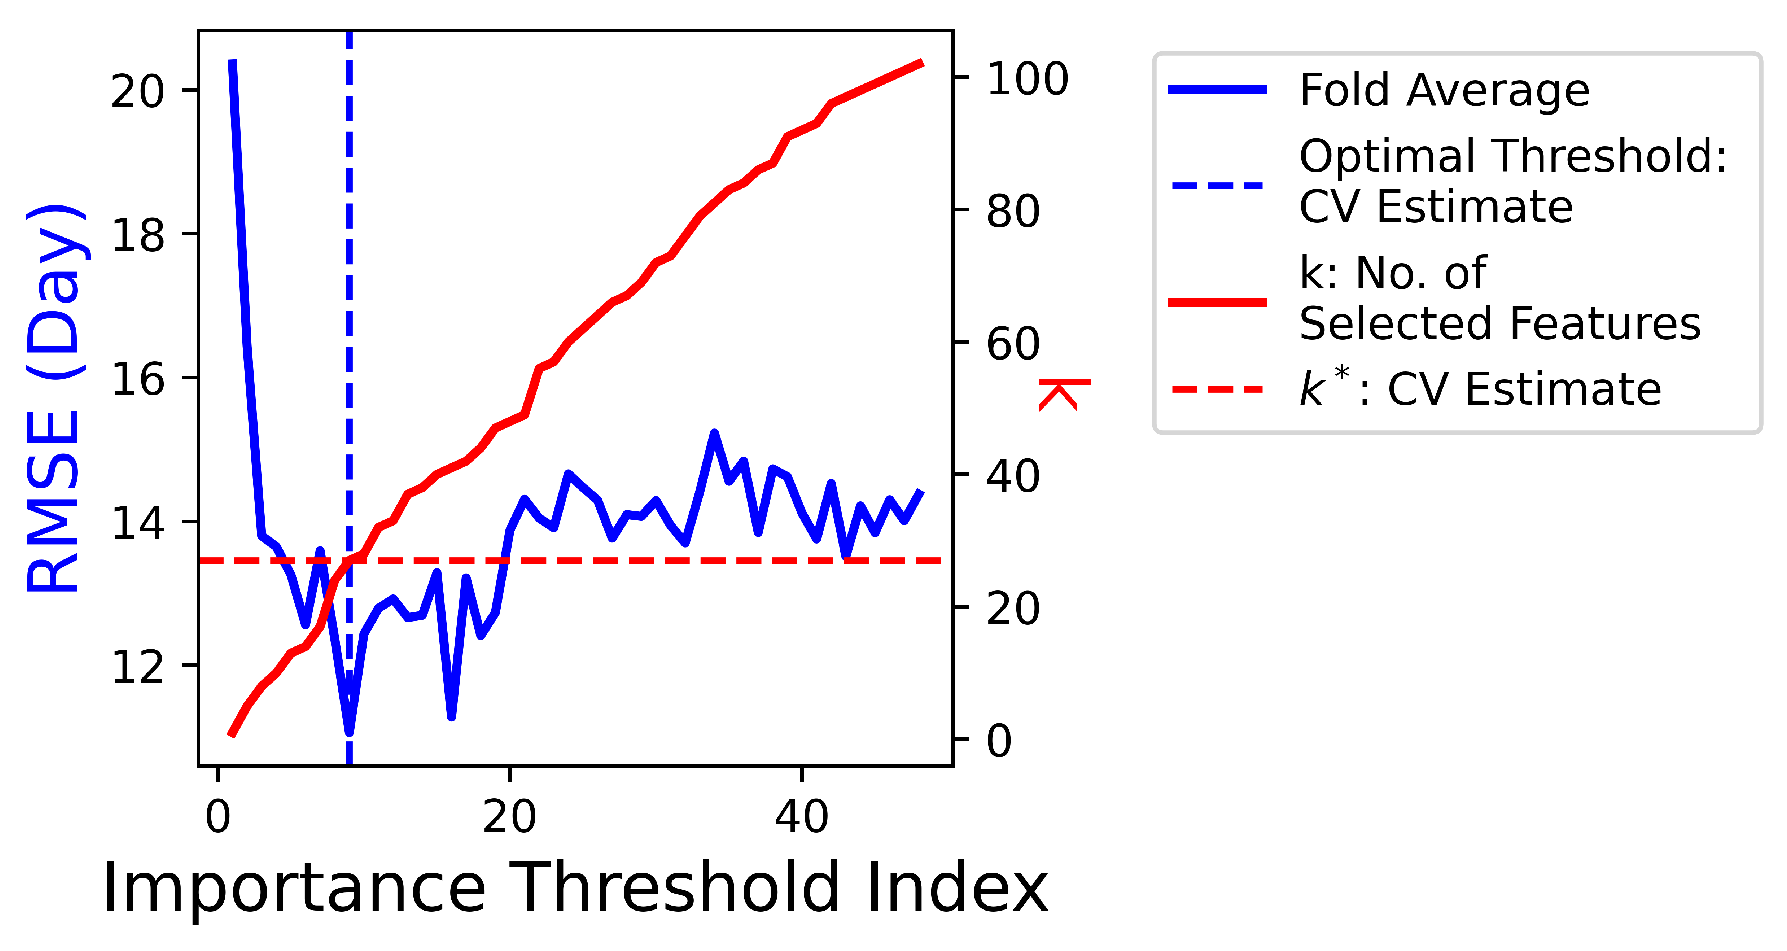
Figure 10.
The ranking of cardiac genes selected by .
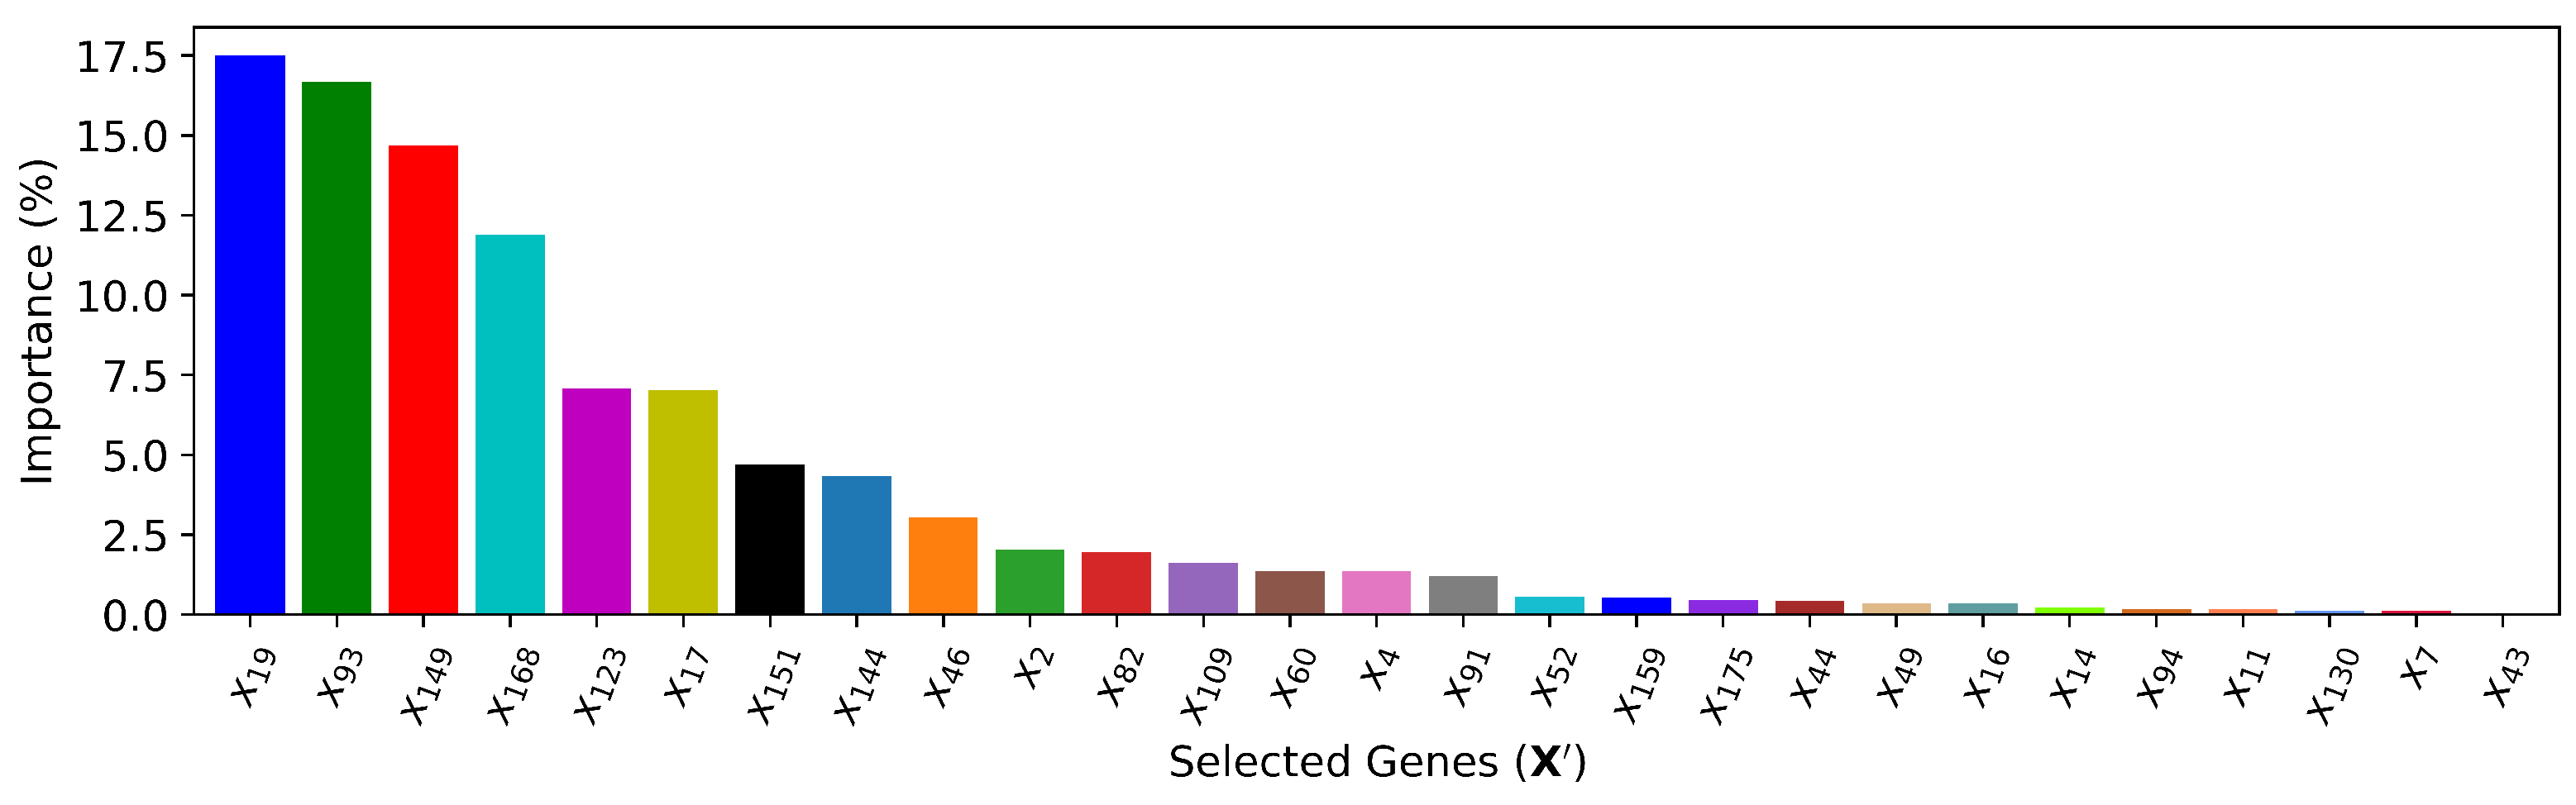
Figure 11.
The ranking of cardiac genes used by .
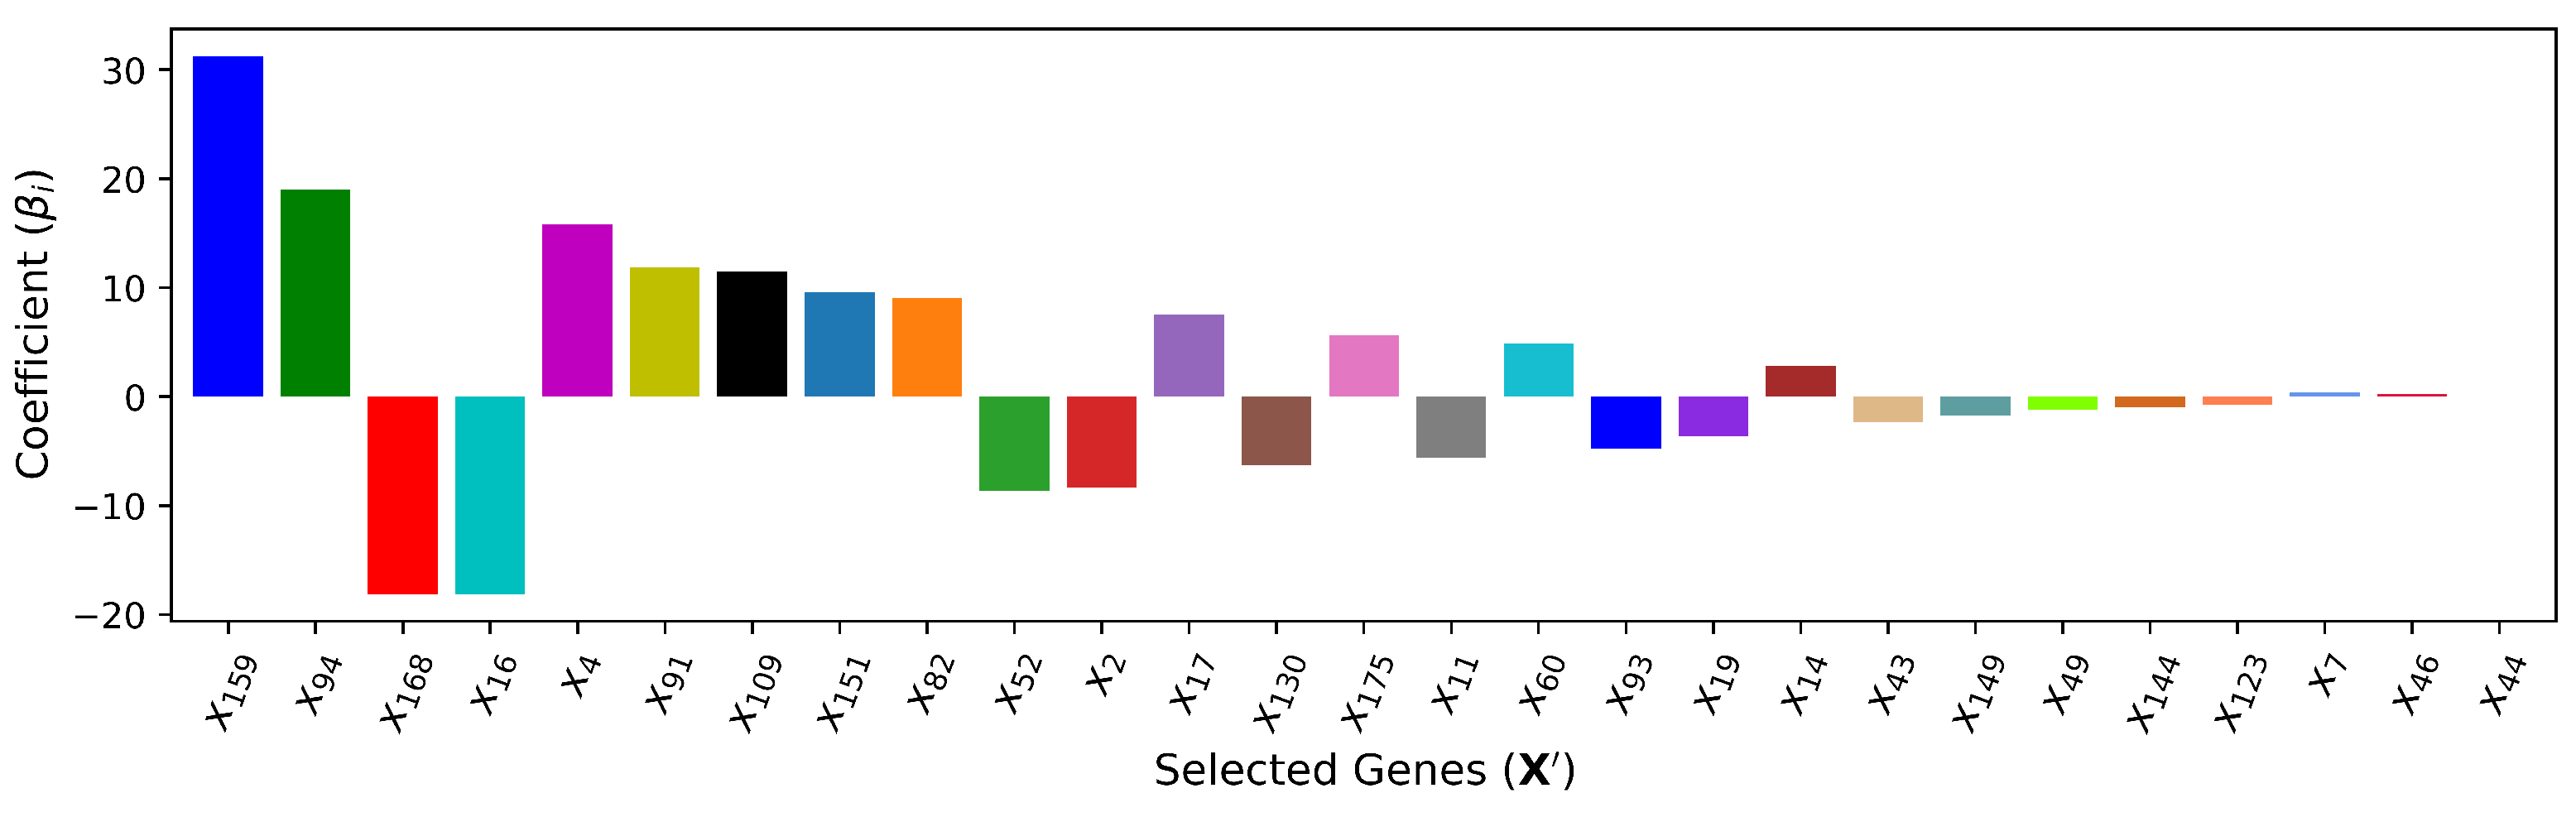
Figure 12.
The predicted maturity level.
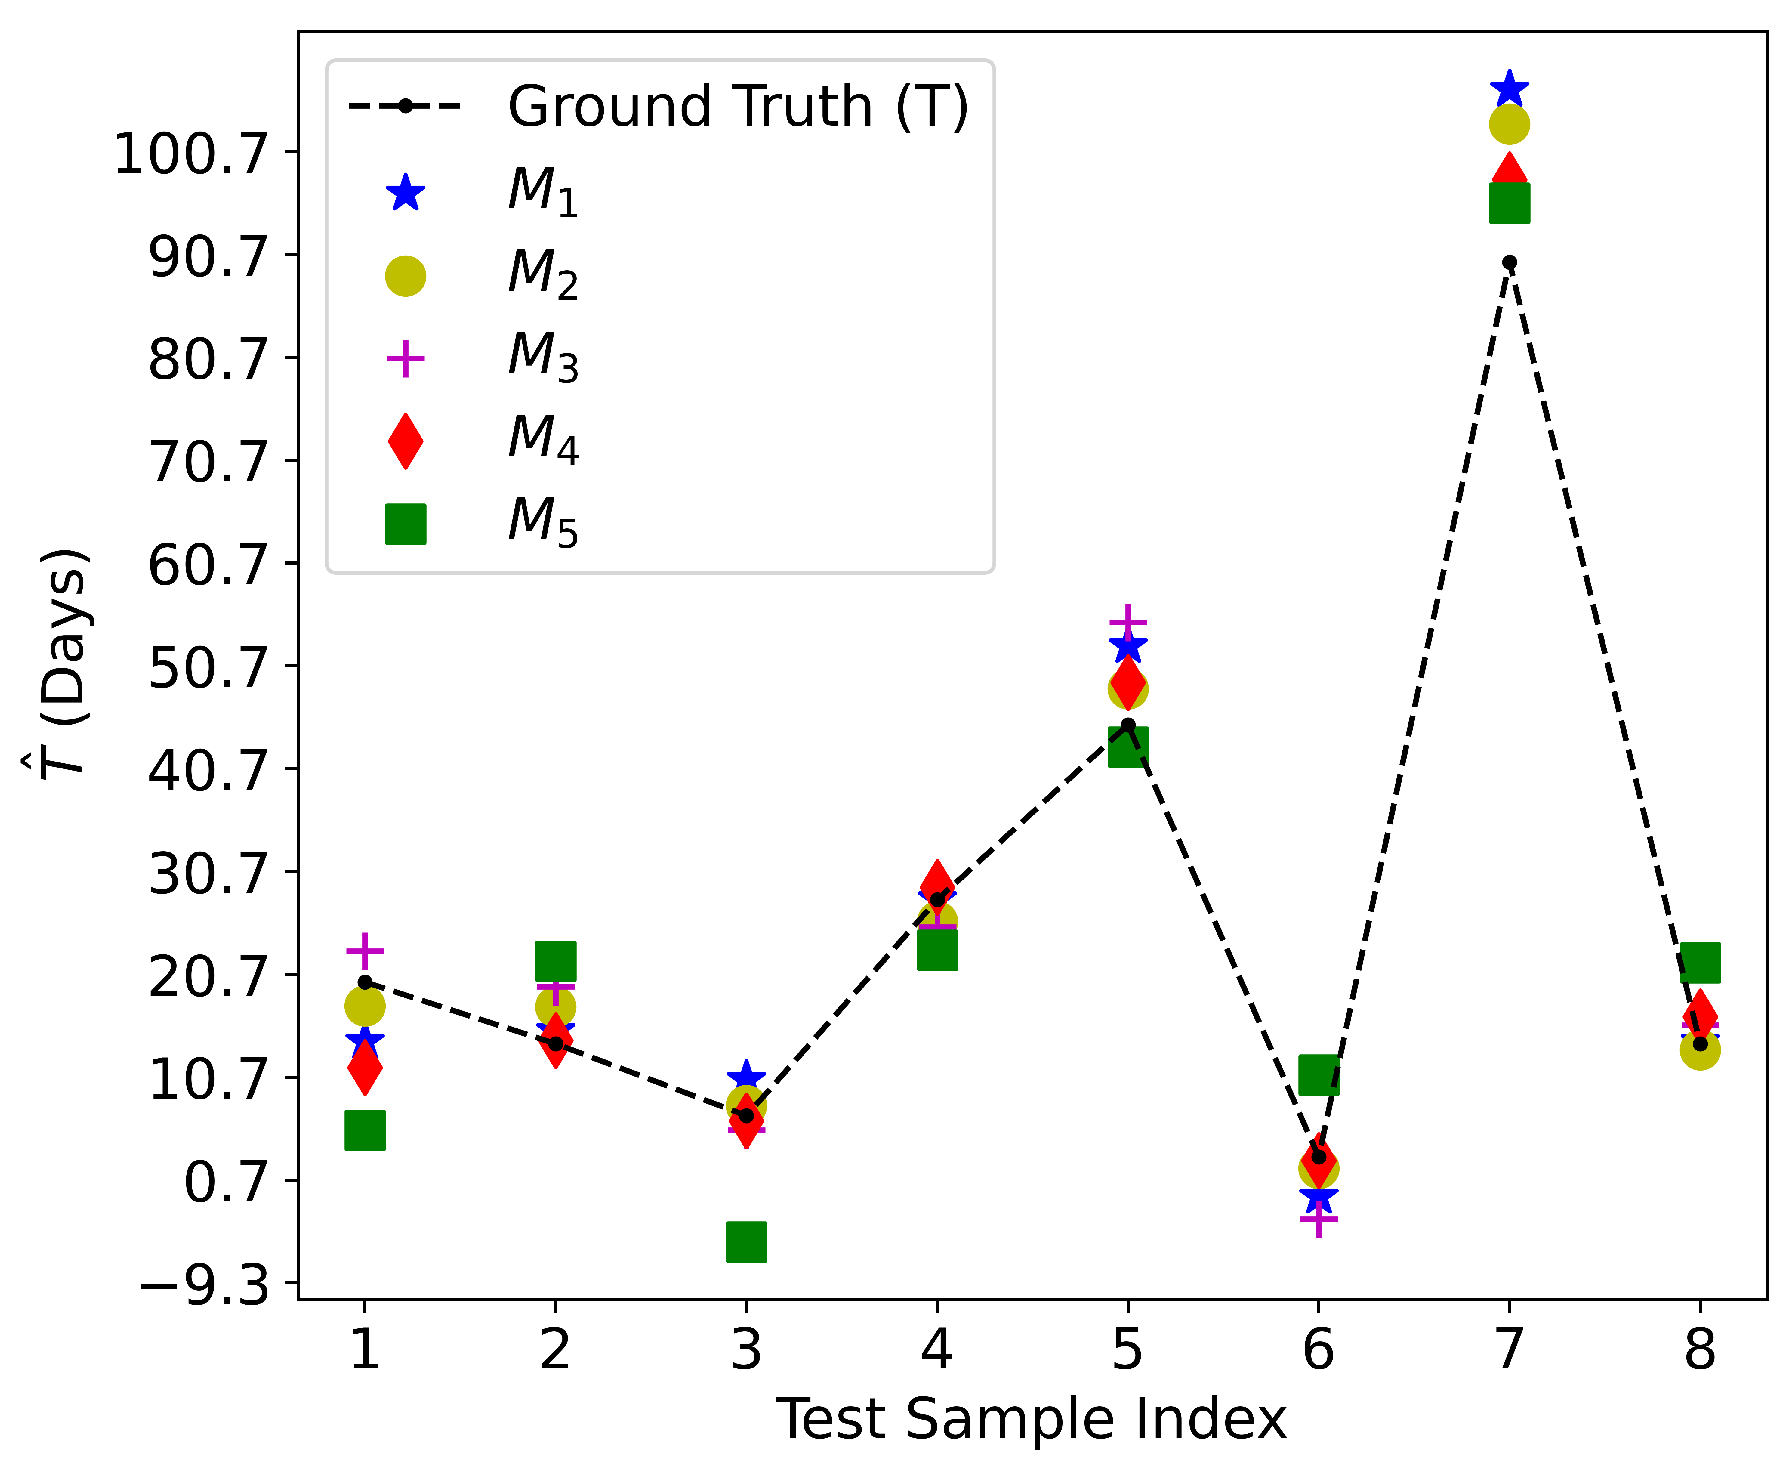
Table 1.
The 21 example cardiac-specific genes and fold change expression
| Gene | Description | Adult 1 | Adult 2 | Day 120 | Day 0 | |||||
|---|---|---|---|---|---|---|---|---|---|---|
| ACTC1 | Actin, alpha, cardiac muscle 1 | 15.64 | 15.60 | 15.48 | 9.74 | |||||
| MYH7 | Myosin light chain 7 | 15.62 | 15.62 | 14.02 | 6.82 | |||||
| CRYAB | Crystallin alpha B | 15.52 | 15.48 | 13.81 | 6.80 | |||||
| TNNC1 | Troponin C1, slow skeletal and cardiac type | 15.50 | 15.30 | 14.57 | 7.46 | |||||
| MYL2 | Myosin light chain 2 | 15.43 | 15.38 | 14.56 | 6.99 | |||||
| MYL3 | Myosin light chain 3 | 15.15 | 15.18 | 14.60 | 6.86 | |||||
| MYH6 | Myosin light chain 6 | 14.71 | 15.57 | 15.01 | 6.99 | |||||
| MB | Myoglobin | 14.59 | 14.50 | 13.67 | 6.90 | |||||
| MYBPC3 | Myosin binding protein C, cardiac | 14.54 | 14.71 | 13.96 | 6.85 | |||||
| TNNT2 | Troponin T2, cardiac type | 14.51 | 14.08 | 13.72 | 7.48 | |||||
| TNNI3 | Troponin I3, cardiac type | 14.37 | 14.06 | 12.32 | 7.95 | |||||
| CKMT2 | Creatine kinase, mitochondrial 2 | 14.22 | 14.29 | 12.45 | 7.16 | |||||
| NPPA | Natriuretic peptide A | 14.17 | 14.95 | 15.22 | 6.84 | |||||
| CASQ2 | Calsequestrin 2 | 14.08 | 13.69 | 12.41 | 6.92 | |||||
| HRC | Histidine rich calcium binding protein | 14.02 | 13.96 | 11.81 | 7.38 | |||||
| MYL7 | Myoslin light chain 7 | 13.65 | 14.24 | 15.07 | 7.11 | |||||
| ACTN2 | Actinin alpha 2 | 12.15 | 11.31 | 10.59 | 7.48 | |||||
| NKX2-5 | NK2 homeobox 5 | 11.10 | 11.03 | 10.71 | 6.76 | |||||
| PLN | Phospholamban | 10.79 | 8.28 | 11.50 | 6.88 | |||||
| LDB3 | LIM domain binding 3 | 9.15 | 8.76 | 8.92 | 6.86 | |||||
| KCNH2 | Potassium voltage-gated channel subfamily H member 2 | 8.16 | 8.52 | 8.07 | 7.10 | |||||
Table 2.
The coefficient of determination
| Time t | Time t | |||
|---|---|---|---|---|
| Day 0 | 0.08 | Day 28 | 0.55 | |
| Day 3 | 0.09 | Day 35 | 0.58 | |
| Day 7 | 0.12 | Day 45 | 0.59 | |
| Day 10 | 0.23 | Day 60 | 0.61 | |
| Day 14 | 0.37 | Day 90 | 0.61 | |
| Day 20 | 0.49 | Day 120 | 0.65 |
Table 3.
Training and testing data sets
| Data Set | Number of Records | Percentage | ||
|---|---|---|---|---|
| Training | 85% | |||
| Testing | 15% |
Table 4.
The performance of various feature selection and regression algorithms
| Method | Genes in Ranked by Importance | RMSE (Day) | Score | |||||
|---|---|---|---|---|---|---|---|---|
| (Linear) | 2 | , | 6.837 | 0.934 | ||||
| (Linear) | 39 | , , , , , , , , , , , , , , , , , , , , , , , , , , , , , , , , , , , , , , | 5.216 | 0.962 | ||||
| (Linear) | 40 | , , , , , , , , , , , , , , , , , , , , , , , , , , , , , , , , , , , , , , , | 5.521 | 0.957 | ||||
| (XGBoost) | 27 | , , , , , , , , , , , , , , , , , , , , , , , , , , | 4.461 | 0.972 | ||||
| (Linear) | 27 | , , , , , , , , , , , , , , , , , , , , , , , , , , | 8.724 | 0.892 | ||||
Disclaimer/Publisher’s Note: The statements, opinions and data contained in all publications are solely those of the individual author(s) and contributor(s) and not of MDPI and/or the editor(s). MDPI and/or the editor(s) disclaim responsibility for any injury to people or property resulting from any ideas, methods, instructions or products referred to in the content. |
© 2024 by the authors. Licensee MDPI, Basel, Switzerland. This article is an open access article distributed under the terms and conditions of the Creative Commons Attribution (CC BY) license (http://creativecommons.org/licenses/by/4.0/).
Copyright: This open access article is published under a Creative Commons CC BY 4.0 license, which permit the free download, distribution, and reuse, provided that the author and preprint are cited in any reuse.


