1. Introduction
Global warming and Arctic atlantification are driving significant changes in the polar regions [
1,
2], with implications for the stability of Arctic tidewater glaciers [
3,
4]. The retreat of these glaciers serves as a critical climate indicator, reflecting the impacts of rising atmospheric and oceanic temperatures [
5,
6,
7,
8,
9].
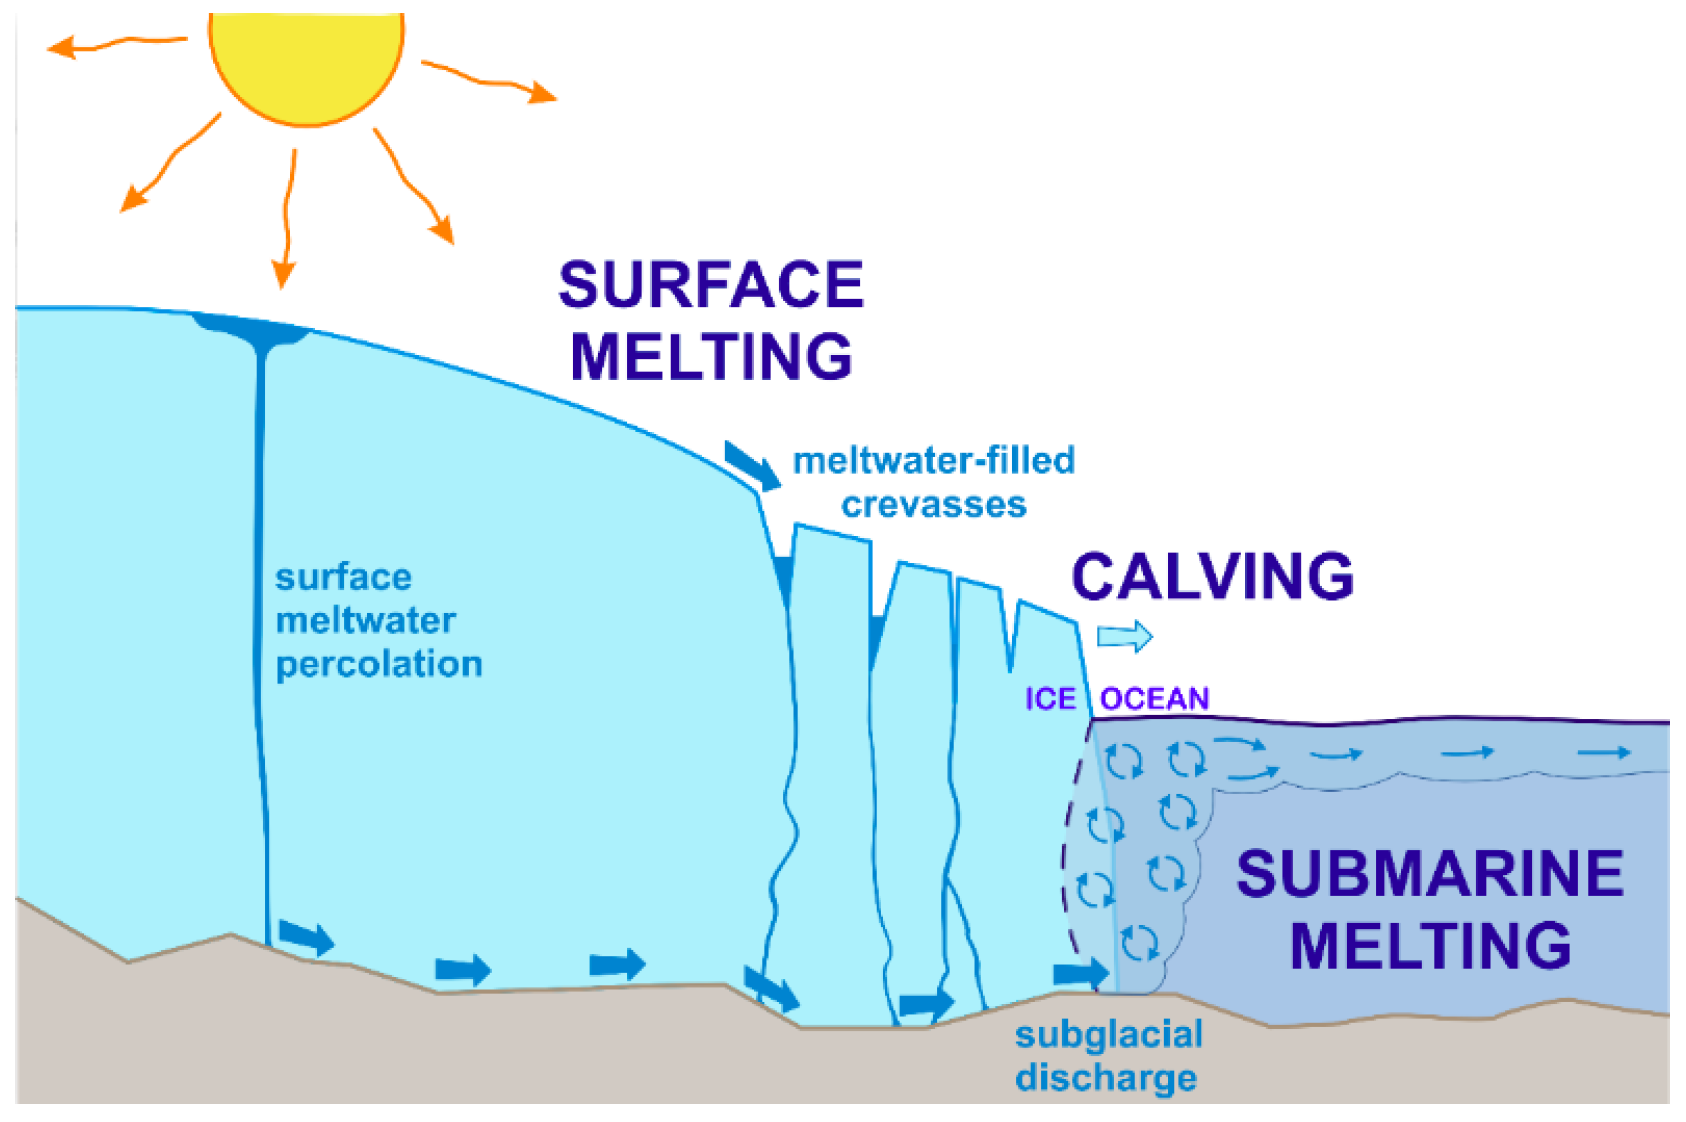
The primary mechanisms of glacier mass loss include surface melting, iceberg calving and submarine melting [
10,
11,
12], all of which interact through different processes to influence glacier dynamics (
Figure 1). During the melt season, positive degree days, characterized by atmospheric temperatures above freezing, lead to surface melting in Arctic tidewater glaciers [
9]. As the glacier surface melts, the resulting meltwater percolates through the ice and reaches the subglacial bedrock, flowing toward the glacier terminus. This meltwater is subglacially discharged into the denser fjord waters, then forming a buoyant plume, which entrains surrounding ambient fjord waters and carries sediments up to the fjord surface [
13,
14,
15]. The rising plume generates overturning circulation within the fjord, effectively drawing warmer out-fjord waters toward the glacier terminus [
16,
17,
18]. The influx of these warmer waters along with the flux of subglacial discharges enhances submarine melting at the glacier terminus [
19,
20,
21,
22,
23], which in turn amplifies calving events [
7,
17,
24,
25,
26,
27] (see schematics in
Figure 1).
The complex interplay between surface melting, subglacial flow, and fjord dynamics, along with their dependence on ambient factors such as atmospheric conditions, ocean temperatures, and bedrock topography, highlights the challenges in identifying the mechanisms driving glacier retreat in response to changing conditions. In this context, we pay special attention to the subglacial hydrology system, which is crucial for determining the number, width, and flow rate of discharging channels [
28,
29,
30], thereby playing a key role in frontal ablation [
31]. Moreover, the flow of meltwater beneath glaciers plays a critical role in influencing ice dynamics, including ice flow velocity and stability [
32]. As the atmosphere warms during the melt season, increased surface melting generates more meltwater, which can accumulate at the glacier base [
33]. This meltwater can lubricate the bedrock, accelerating ice flow toward the terminus [
34,
35,
36], thus favoring calving by shear stress.
The formation of subglacial channels is a dynamic process that evolves throughout the melt season [
37,
38]. As meltwater accumulates on the glacier’s surface, it flows to the bedrock through crevasses and moulins, creating a drainage system [
36,
39,
40,
41]. Initially, water is distributed in thin films or small passageways, but as more meltwater enters, it concentrates along specific flow paths influenced by bedrock topography and pressure gradients [
42]. This flow causes thermal erosion of the ice, creating a positive feedback loop: faster water flow generates heat, melts more ice, and enlarges the channel, leading to the development of larger, more efficient drainage channels over time [
36,
43,
44].
However, despite its potential contribution to glacier retreat, subglacial hydrology represents one of the most significant yet poorly understood components of glacier dynamics. This complexity arises from the challenging access to subglacial environments, which are typically located beneath thick ice masses, making direct observations and measurements exceedingly difficult. The harsh conditions, including extreme cold, high pressure, and the dynamic nature of the ice above, pose substantial logistical challenges to study these hidden systems. The scarcity of observations in subglacial environments has led to a reliance on models to infer the behavior of these systems [
41,
42].
Modeling glacier dynamics is essential for enhancing our understanding of Arctic glacier-fjord interactions by simulating the complex physical processes that govern these systems [
27,
42]. Recent studies have incorporated information of the subglacial system into glacier-ocean coupled models [
45,
46,
47,
48], recognizing its importance in glacier dynamics. However, when it comes to tidewater mass loss, it is crucial to quantify the trade-off between the increased computational cost of solving a subglacial hydrology model and the results obtained from models that simplify or parameterize the subglacial component.
In this study, we aim to assess the impact of subglacial hydrology on glacier front retreat simulations. We focus on the Hansbreen glacier, which offers a rich dataset for model testing, making it an ideal natural laboratory for our research. We use a 3D glacier dynamics-fjord model which accounts for surface mass balance, calving, and submarine melting. We then compare the outputs from two versions of the model: one that resolves the subglacial hydrology model and another that operates under the assumption of a single discharge channel at the flow line. By quantifying the differences in annual front retreat, submarine melting, and calving between these two models, we evaluate the role of subglacial hydrology in understanding glacier dynamics, which can enhance our ability to make more accurate predictions of future changes in response to ongoing atmospheric and oceanic warming.
2. Materials and Methods
2.1. The Glacier-Fjord System of Study: Hansbreen-Hansbukta
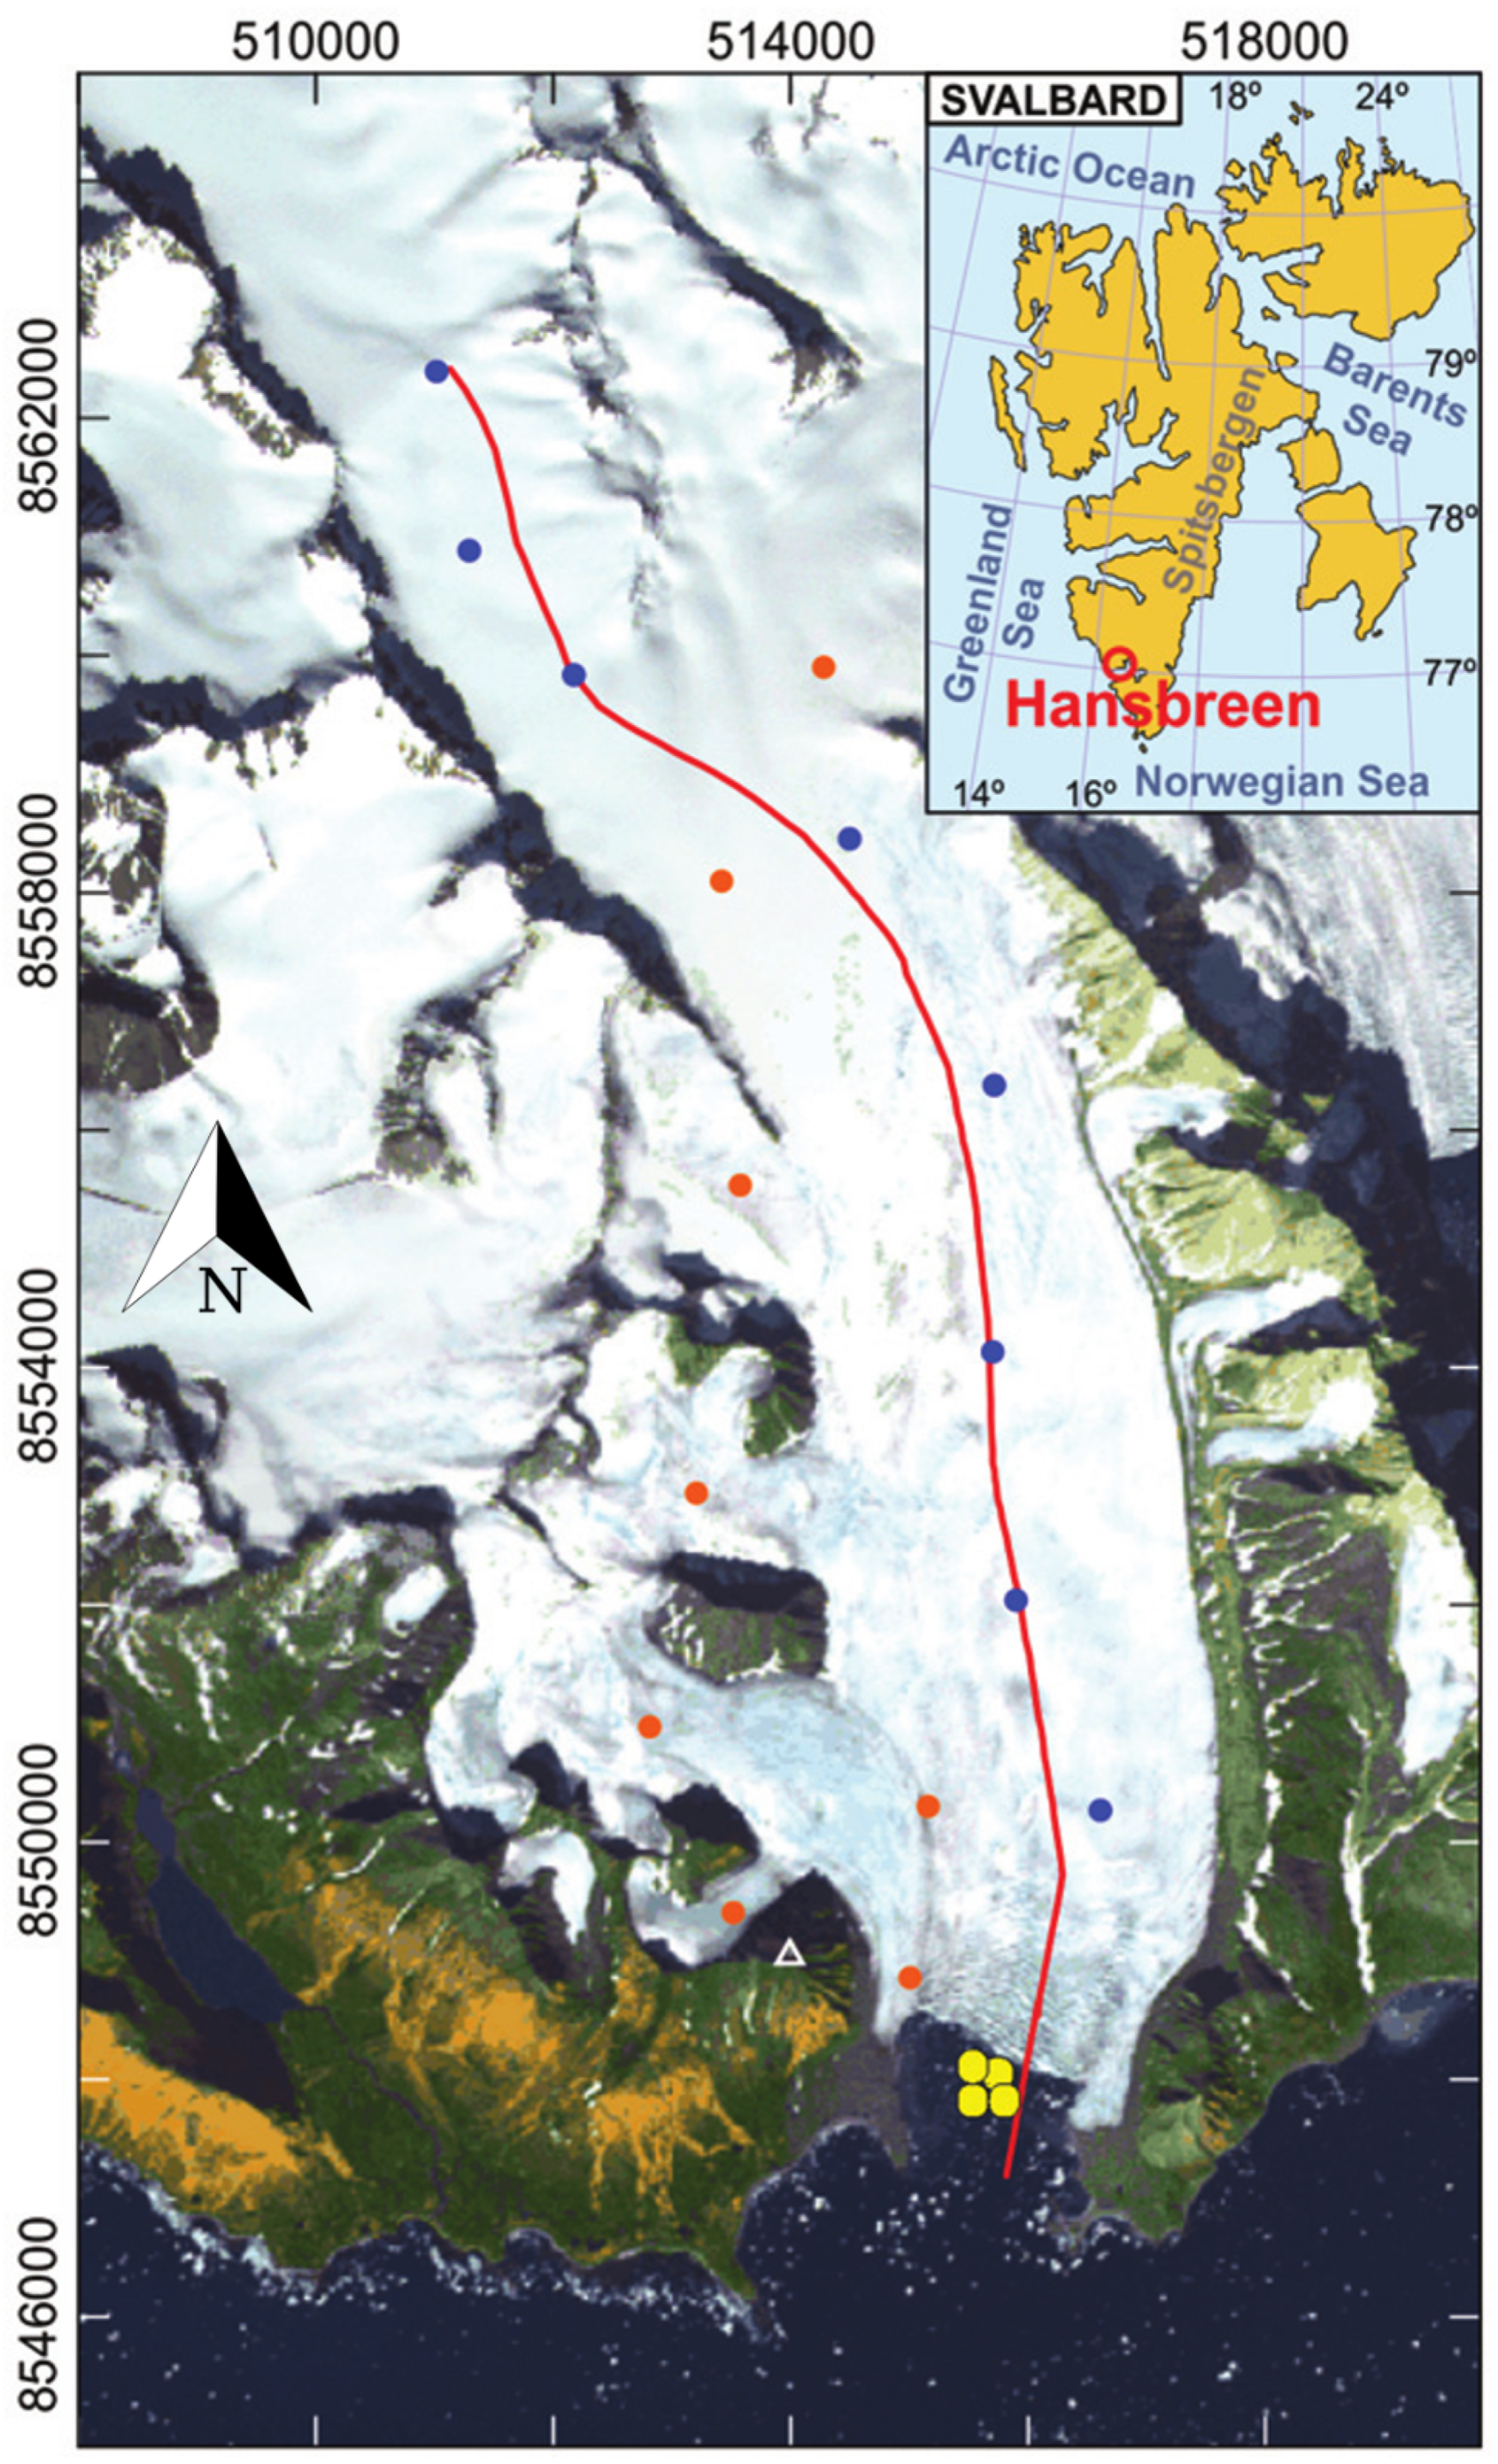
The glacier-fjord system Hansbreen-Hansbukta is located in one of the branches of Hornsund fjord in South West Spitsbergen, Svalbard, at ∼77°N, ∼15.6°E (
Figure 2). Hansbreen is a polythermal tidewater glacier flowing southward that covers an area of ∼57 km
2. It is about 16 km long with a low mean surface slope of around 1.8° on average along the central flowline [
49]. Its calving front is 1.5 km wide with a vertical face ∼100 m thick at the central flowline, of which 50 to 60 m are below the sea level. The seasonal retreat of Hansbreen usually starts in June/July and lasts until late autumn/early winter, and the average summer and winter fluctuations amount to
and 79 m, respectively [
50]. As for Hansbukta, it is a ∼2 km long bay, with a maximum depth of ∼77 m. Temperature and salinity in Hansbukta experiences strong seasonal variability, ranging from
to 3°C and from 34.6 to 31.8 psu between April and August, respectively.
2.2. Observations
There are a set of observations needed to constrain the glacer-fjord model: glacier velocities, surface meltwater, bedrock topography, glacier front position, and fjord properties.
We use the gridded surface velocity data of [
45], which were obtained by applying Bayesian Kriging techniques [
52] on daily horizontal velocities measured at a set of stakes located along the glacier (see blue dots in
Figure 2).
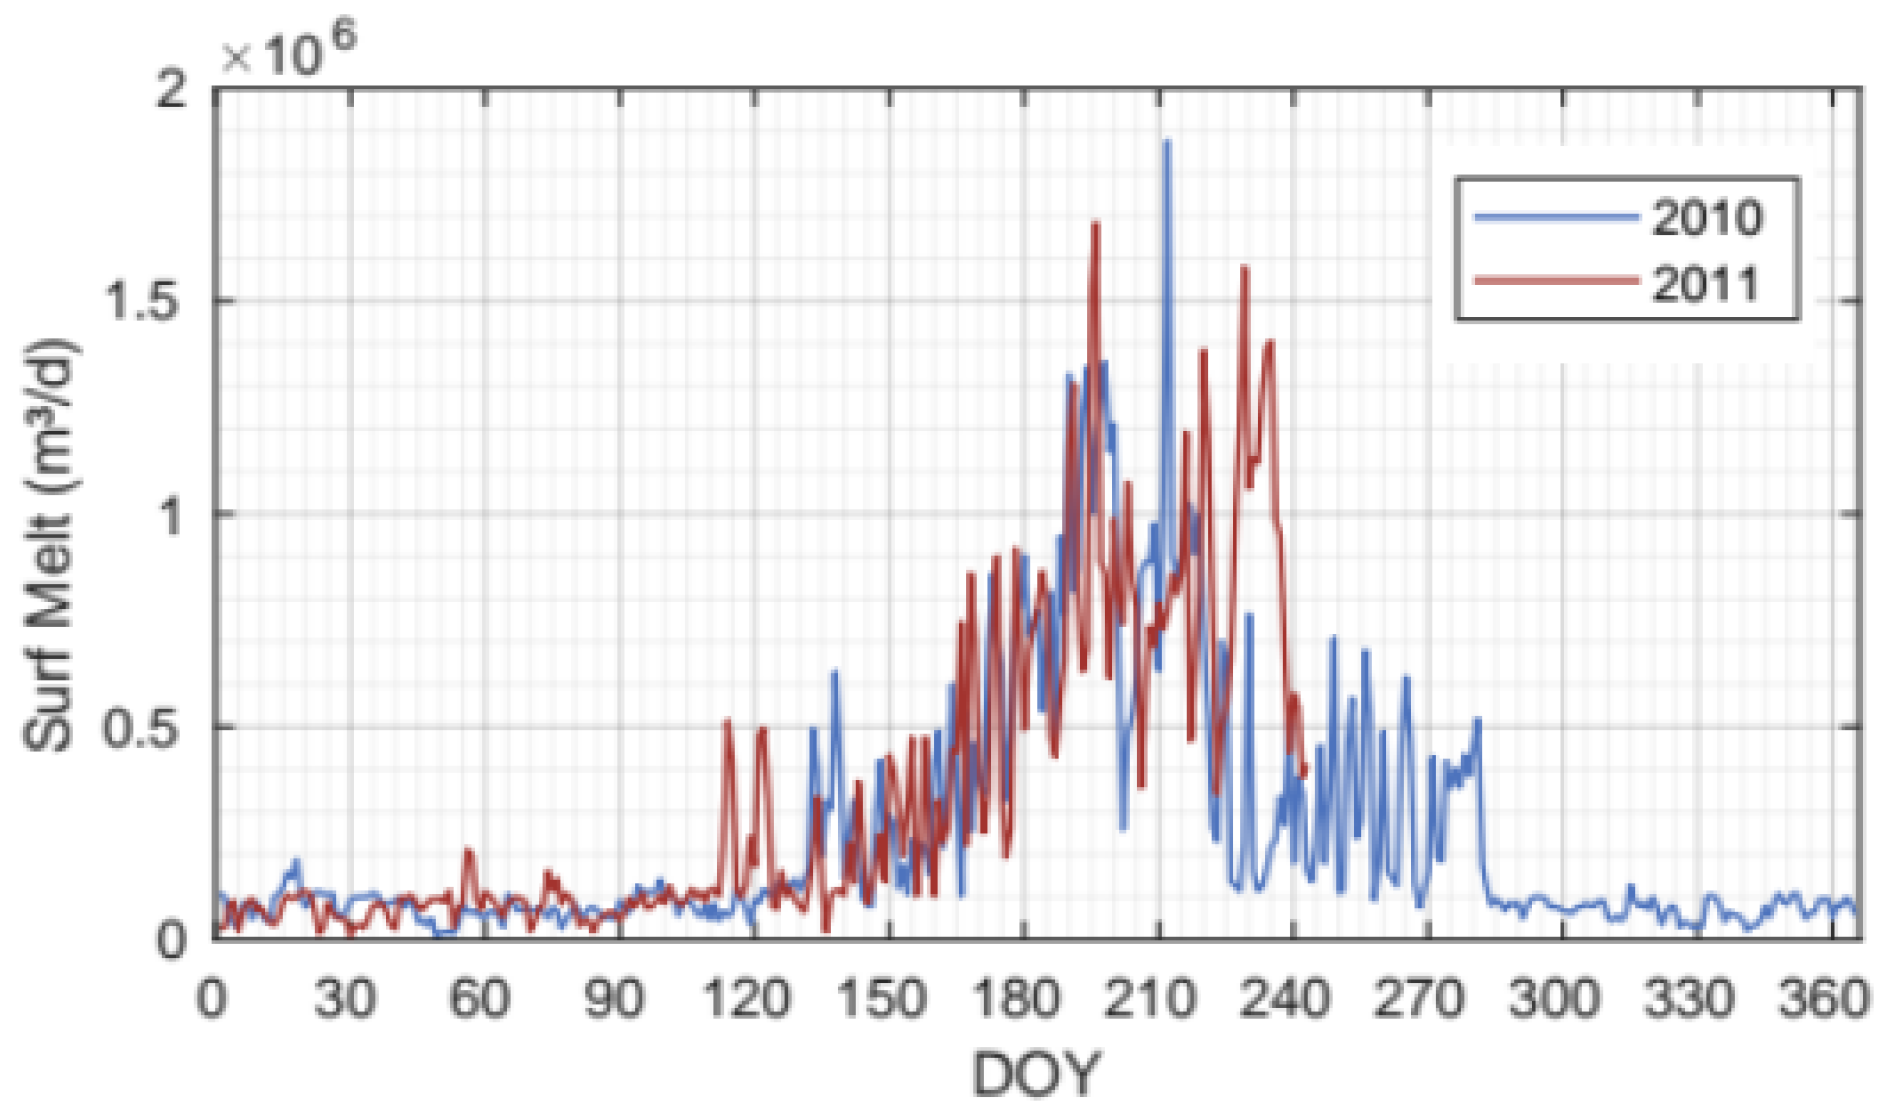
Surface mass balance (SMB) and surface meltwater (SMW) (
Figure 3) were obtained from downscaled European Arctic Reanalysis data at 2 km horizontal and hourly temporal resolutions, constrained by automatic weather stations and stake observations [
53]. The surface elevation came from the SPIRIT digital elevation model for gentle slopes, with a 30 m RMS absolute horizontal precision and 40 m resolution. Bedrock topography was inferred from ground-penetrating radar data [
49,
54].
We take the Hansbreen weekly front positions obtained from time-lapse camera images processed and described in [
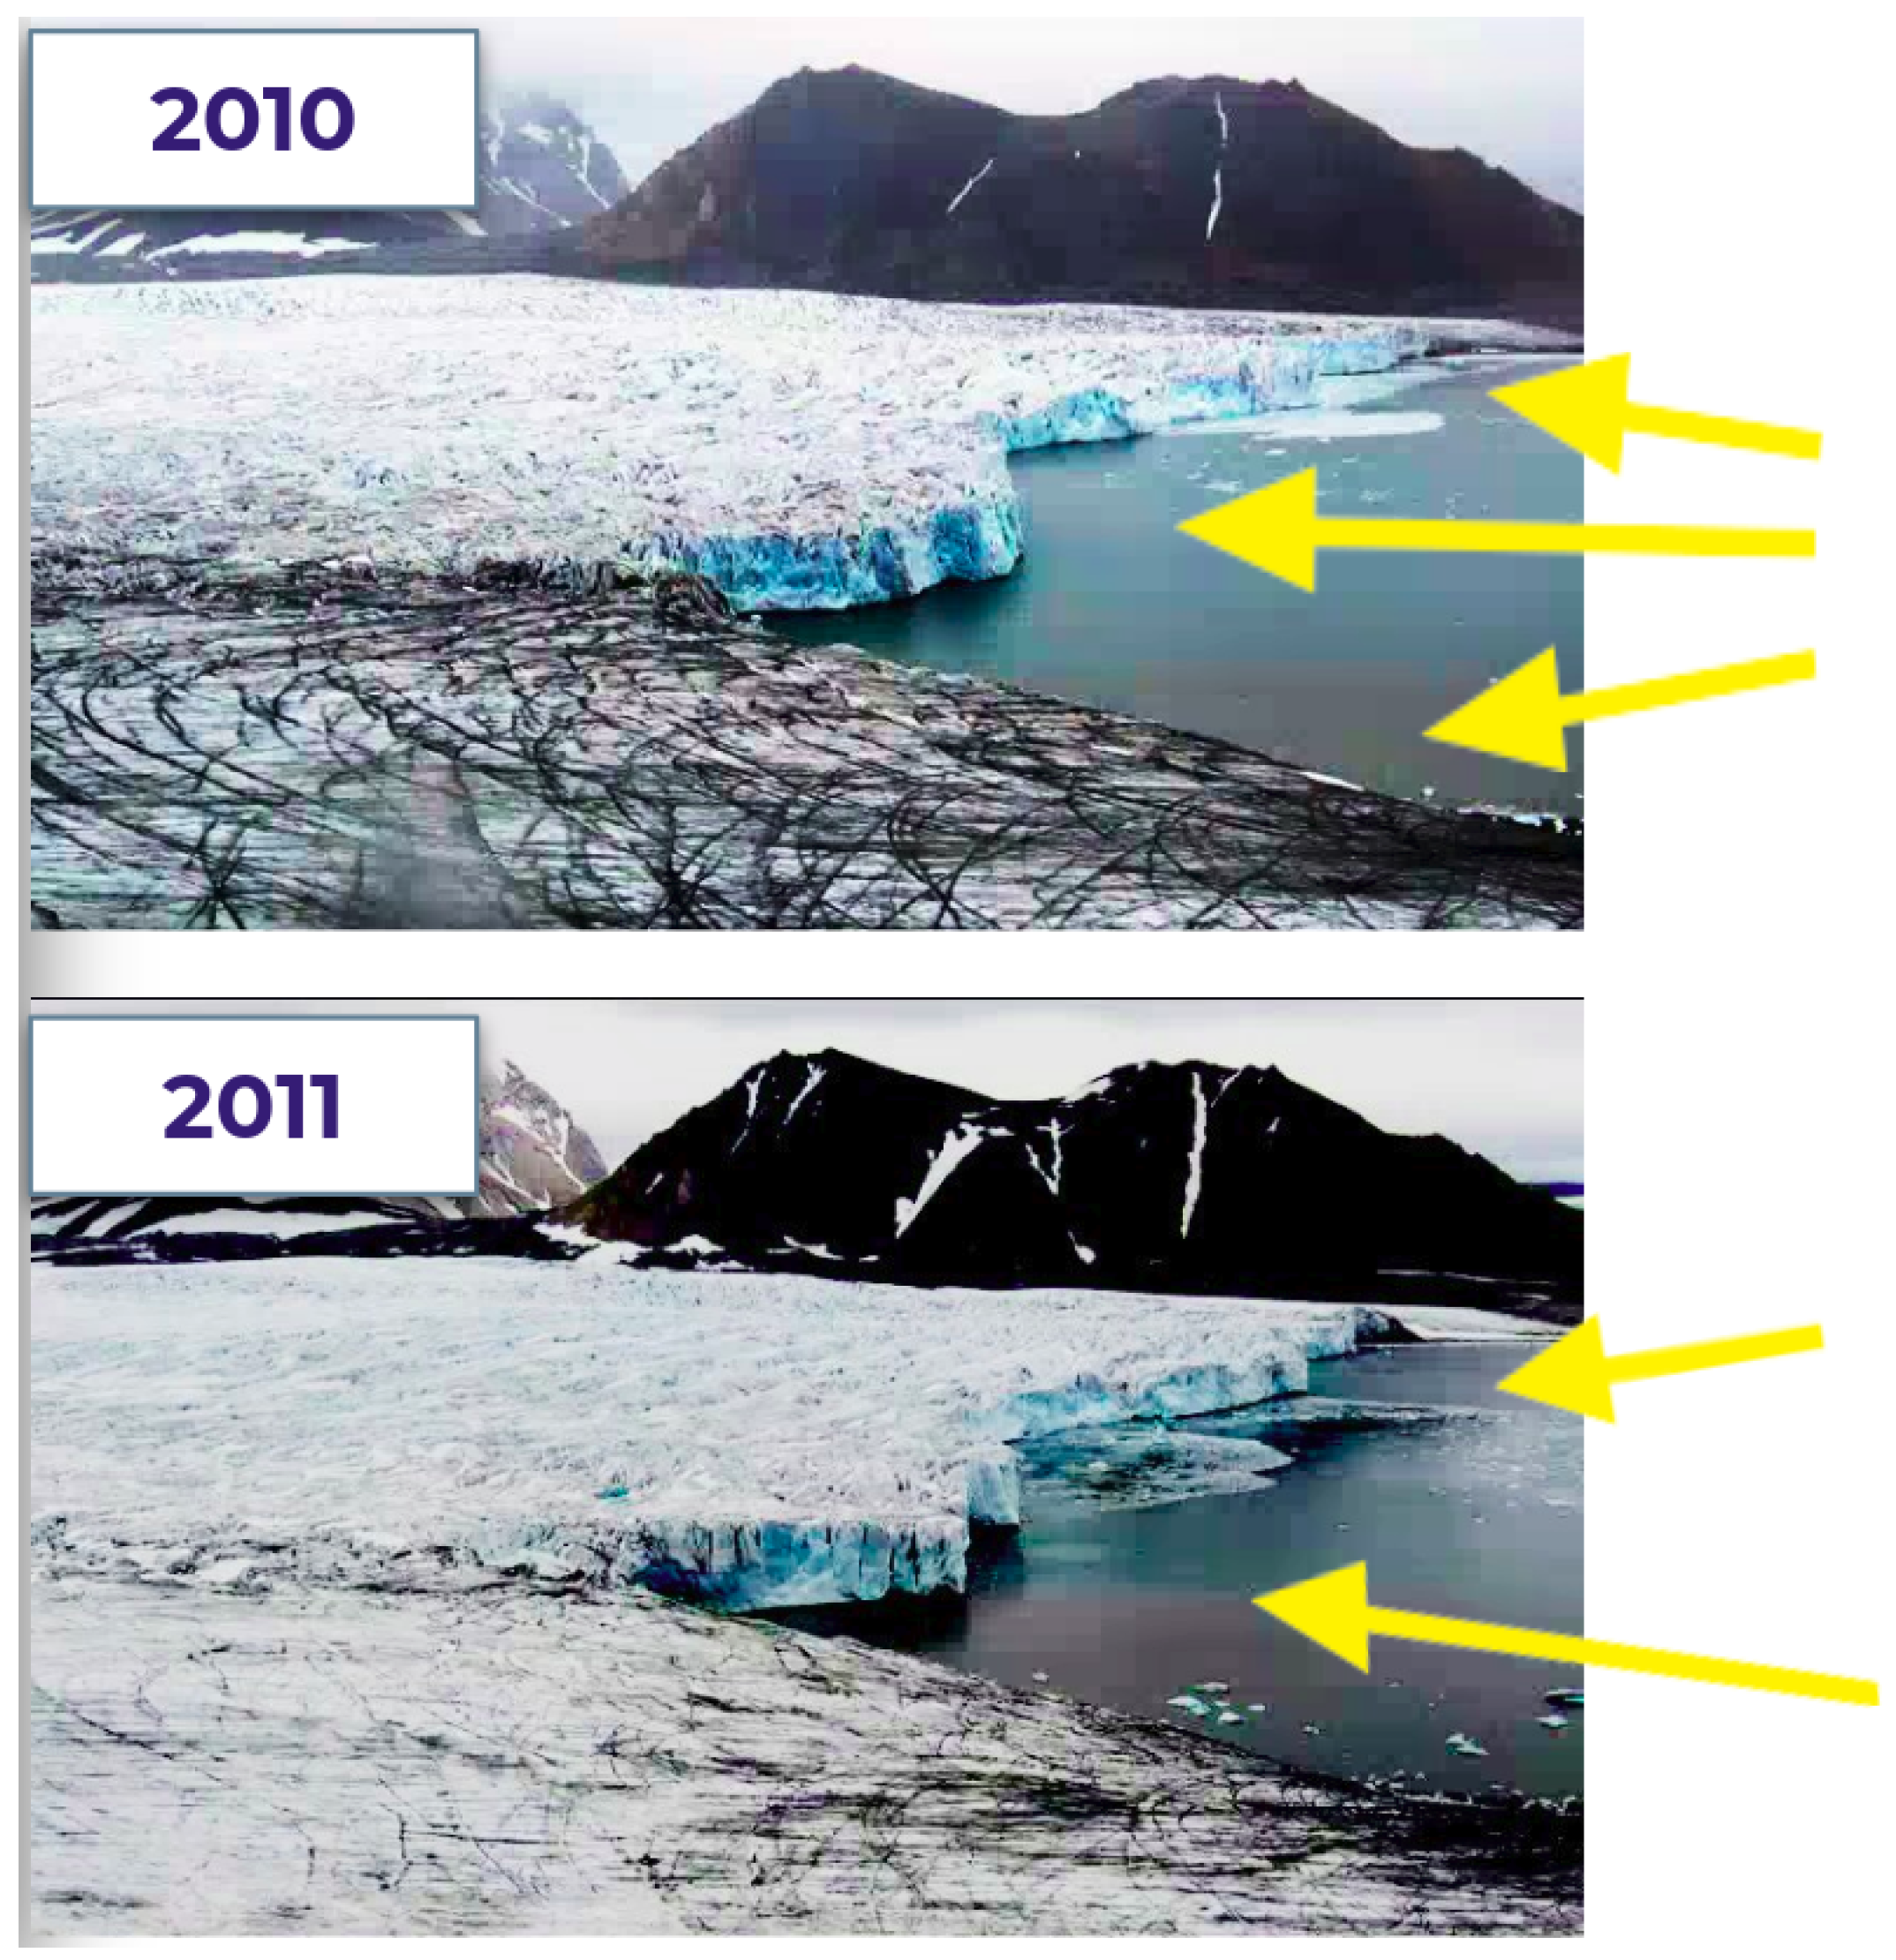
55]. We also analyzed all the imagery searching for plume-activity locations. In some of the winter images, plume activity was observed as a free-of-ice patch of the fjord surface attached to the glacier terminus. In summer periods, the imprint of the plume was recognised by a sediment patch at the fjord surface close to the glacier front (
Figure 4).
Hydrography of Hansbukta has been monitored from 2010 up to date by the IOPAS (Institute of Oceanology Polish Academy of Science) and the data used in this study were already published in [
17,
51], as well as used in [
45]. We give here some information of the fjord data used in this study. CTD (conductivity, temperature and depth profiler) data were collected at different casts in Hansbukta (yellow points in Fig.
Figure 1). Temperature and salinity measurements were vertically averaged every 1 dbar (1 kPa), giving a vertical resolution of 1 m.
2.3. The Models
We use the coupled glacier-fjord model of [
45], which was built on the open-source, full-Stokes, finite element, ice flow model Elmer/Ice [
56]. [
45] coupled the different processes of the system: glacier dynamics, calving, and subglacial hydrology models for the glacier component, as well as line plume and submarine melt models for the fjord component. The different models coupled are briefly explained in the following subsections, though we refer to [
45] for exhaustive information.
2.3.1. Glacier Dynamics + Calving
The model solves the full-Stokes equations for ice flow, with rheology defined by Glen’s flow law (e.g., [
57]) and uses the calving implementation described by [
46,
47,
58,
59]. This implementation was initially postulated by [
60,
61], and later improved by [
62,
63] for use in a 3D framework. This calving criterion has been chosen because Benn et al. [
64] demonstrated that the crevasse depth (CD) calving law reflects the glaciological controls on calving and exhibits considerable skill in simulating seasonal fluctuations. CD are calculated by
where
is the net stress (positive for extension and negative for compression). The terms on the right-hand side represents the balance of forces: the first corresponds to the opening force of longitudinal stretching, where
represents the effective stress,
and the sign function (
) ensures that crevasses opening is only produced under longitudinal extension; the second term corresponds to the ice overburden pressure, which leads to creep closure, where
is the ice density,
g is the gravity acceleration and
d the crevasse depth.
stands for the water pressure inside crevasses, which is here considered to be zero for surface crevasses and controlled by the subglacial hydrological system for basal crevasses, and at the calving front can be expressed as:
being
the density of water at the calving front and
Z the elevation with respect to sea level. The sea-level elevation,
, is set to 0 m. When calving occurs, the model calculates a calving vector which is normal to the calving front, maps pre-calving to post-calving node positions, and remesh the main mesh.
2.3.2. Buoyant Plume + Submarine Melting
Due to the density differences between meltwater and fjord water, subglacially discharged water rises in contact with the calving front, mixing turbulently with the surrounding water and producing melting at the ice–water interface.
We rely on the line plume model of [
21,
65] to simulate the buoyant plume generated by sublacial discharge of meltwater entering the fjord. This line plume model has shown to accurately reproduce this phenomenon in tidewater glacier terminus [
28,
66], and is implemented in Elmer/Ice [
46,
47] as a continuous sheet-style ’line’ plume, split into coterminous segments across the calving front. To compute the submarine melt rates at the glacier terminus, the thermodynamical equilibrium at the ice-ocean interface [
67] is solved (see [
17] for further details).
The plume model is initialized by the subglacial discharge at each node of the grounding-line, where, depending on the experiment (
Section 2.4), the subglacial discharge values are obtained either as a solution of the subglacial hydrology model (
Section 2.3.3), or within a single imposed channel centered with the flow line. The calculated melt rates are then applied to modify the geometry of the submerged part of the calving front.
2.3.3. Subglacial Hydrology
The subglacial hydrology of Hansbreen is simulated by using the Glacier Drainage System module (GlaDS) of Elmer/Ice [
68]. GlaDS simulates both inefficient distributed drainage, represented by a sheet of water that covers the whole area of the glacier, and efficient channelized drainage, represented by a series of channels generated on the edges of the mesh elements of the domain (see more detail in [
69]). The main parameters of the model are set out in
Table 1.
We use GladS to obtain subglacial discharge estimates at the grounding line. Water is not permitted to flow through the lateral boundaries, and we set the hydraulic potential,
, to zero at the grounding line. From the combination of Eq. (
2) and the hydraulic potential, we get
Water entering the hydrological system is mainly derived from surface meltwater (
Figure 3). We account also for a small portion of basal meltwater, which is assumed to be spread and is calculated using a geothermal heat flux of 63 mW m
−2 [
68].
2.4. Experiments
We simulate the glacier-fiord system of Hansbreen-Hansbukta from April to December 2010. Two distinct models were employed, both incorporating the same components: glacier dynamics, calving, buoyant plume, and submarine melting. The primary difference between the models lies in the treatment of subglacial hydrology.
By comparing the results from both models, we aim to gain insights into the role of subglacial hydrology in glacier front retrat and the dynamics of Hansbreen-Hansbukta system.
3. Results
3.1. Discharging Channels from the suBglacial Hydrology Model
The subglacial hydrology model is coupled with the glacier dynamics and mass balance of Hansbreen. The subglacial water drainage system evolves dynamically over time, influenced by factors such as surface meltwater input, bedrock topography, and water-induced erosion within the ice.
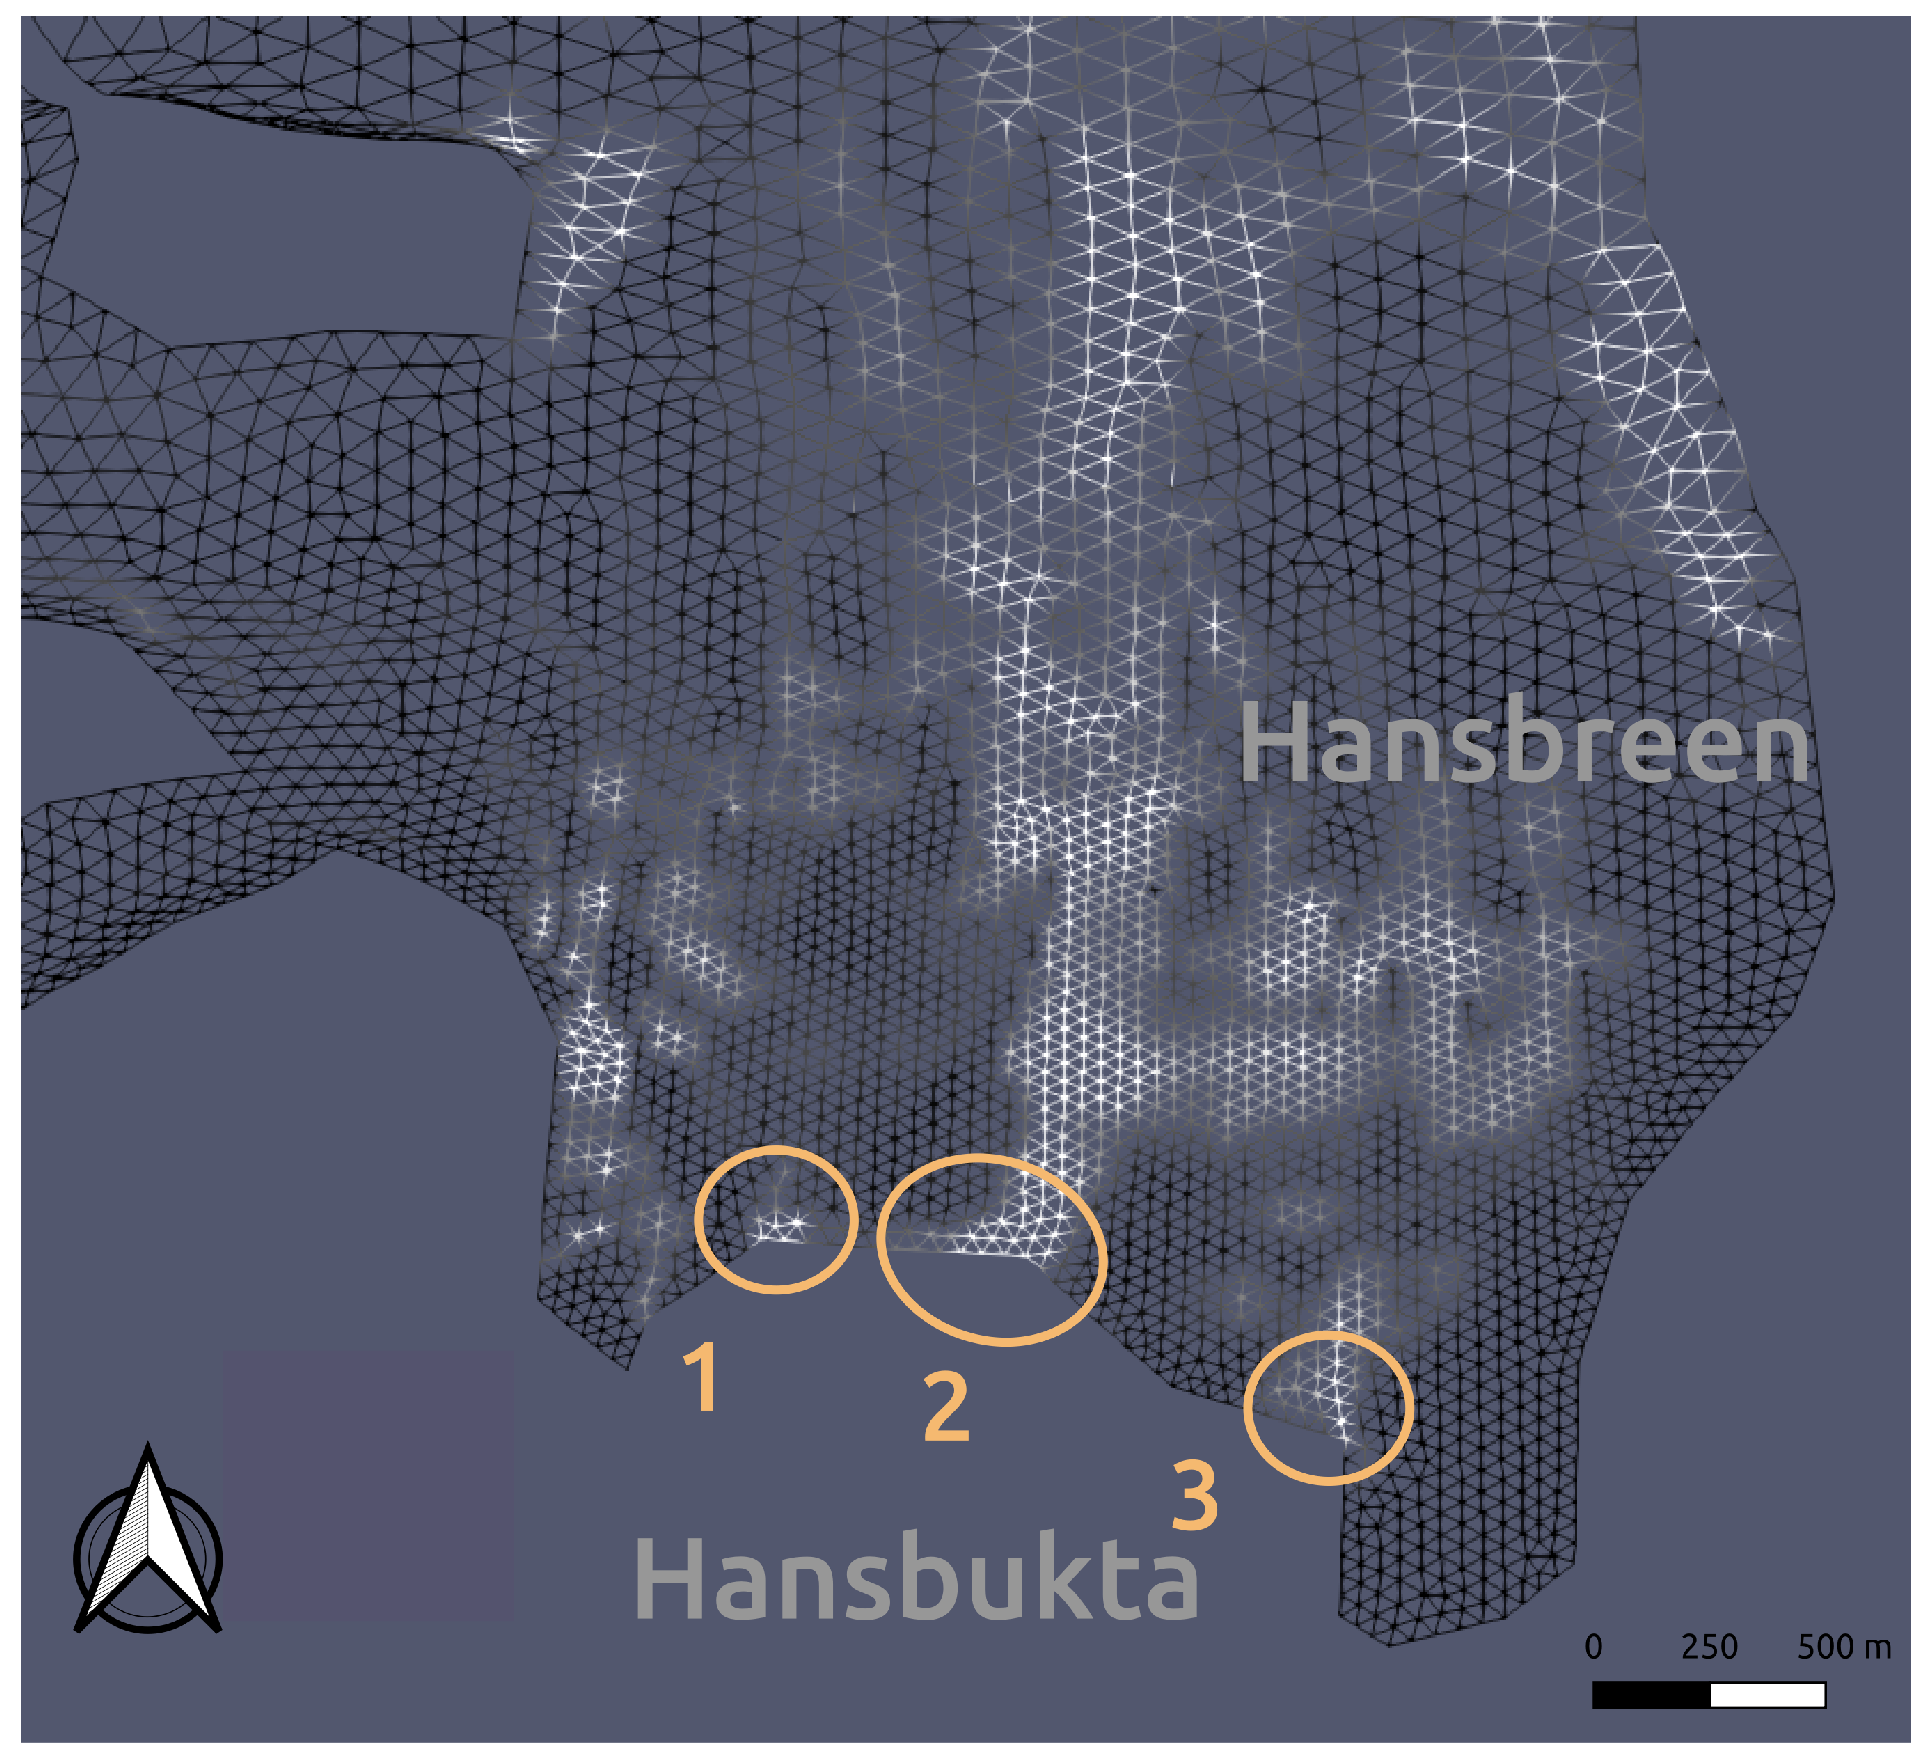
Figure 5 presents the modeled configuration of the subglacial drainage system in September, at the end of the melt season, when the drainage system is considered to be well established and more efficient.
The subglacial hydrology model identifies three distinct channels, each exhibiting unique characteristics. The largest channel, approximately 100 m in width, is situated in the deepest region (
m depth) on the central-western side of the Hansbreen terminus (highlighted in orange and labeled as channel 2 in
Figure 5). The other two channels, each approximately 50 m wide and shallower (
m depth), are located closer to the glacier margins (identified as channels 1 and 3 in
Figure 5). This three-channel configuration predicted by the model corresponds closely with observational data. Time-lapse imagery (
Figure 4) shows distinct plume patches at the glacier terminus, which are consistent with the positions of the modeled channels, indicating the presence of subglacial water discharge.
3.2. Performance of the Two Models Against Observed Glacier Terminus
After running Model 1 and Model 2 from April to December 2010, we obtain the various positions of the Hansbreen front over time.
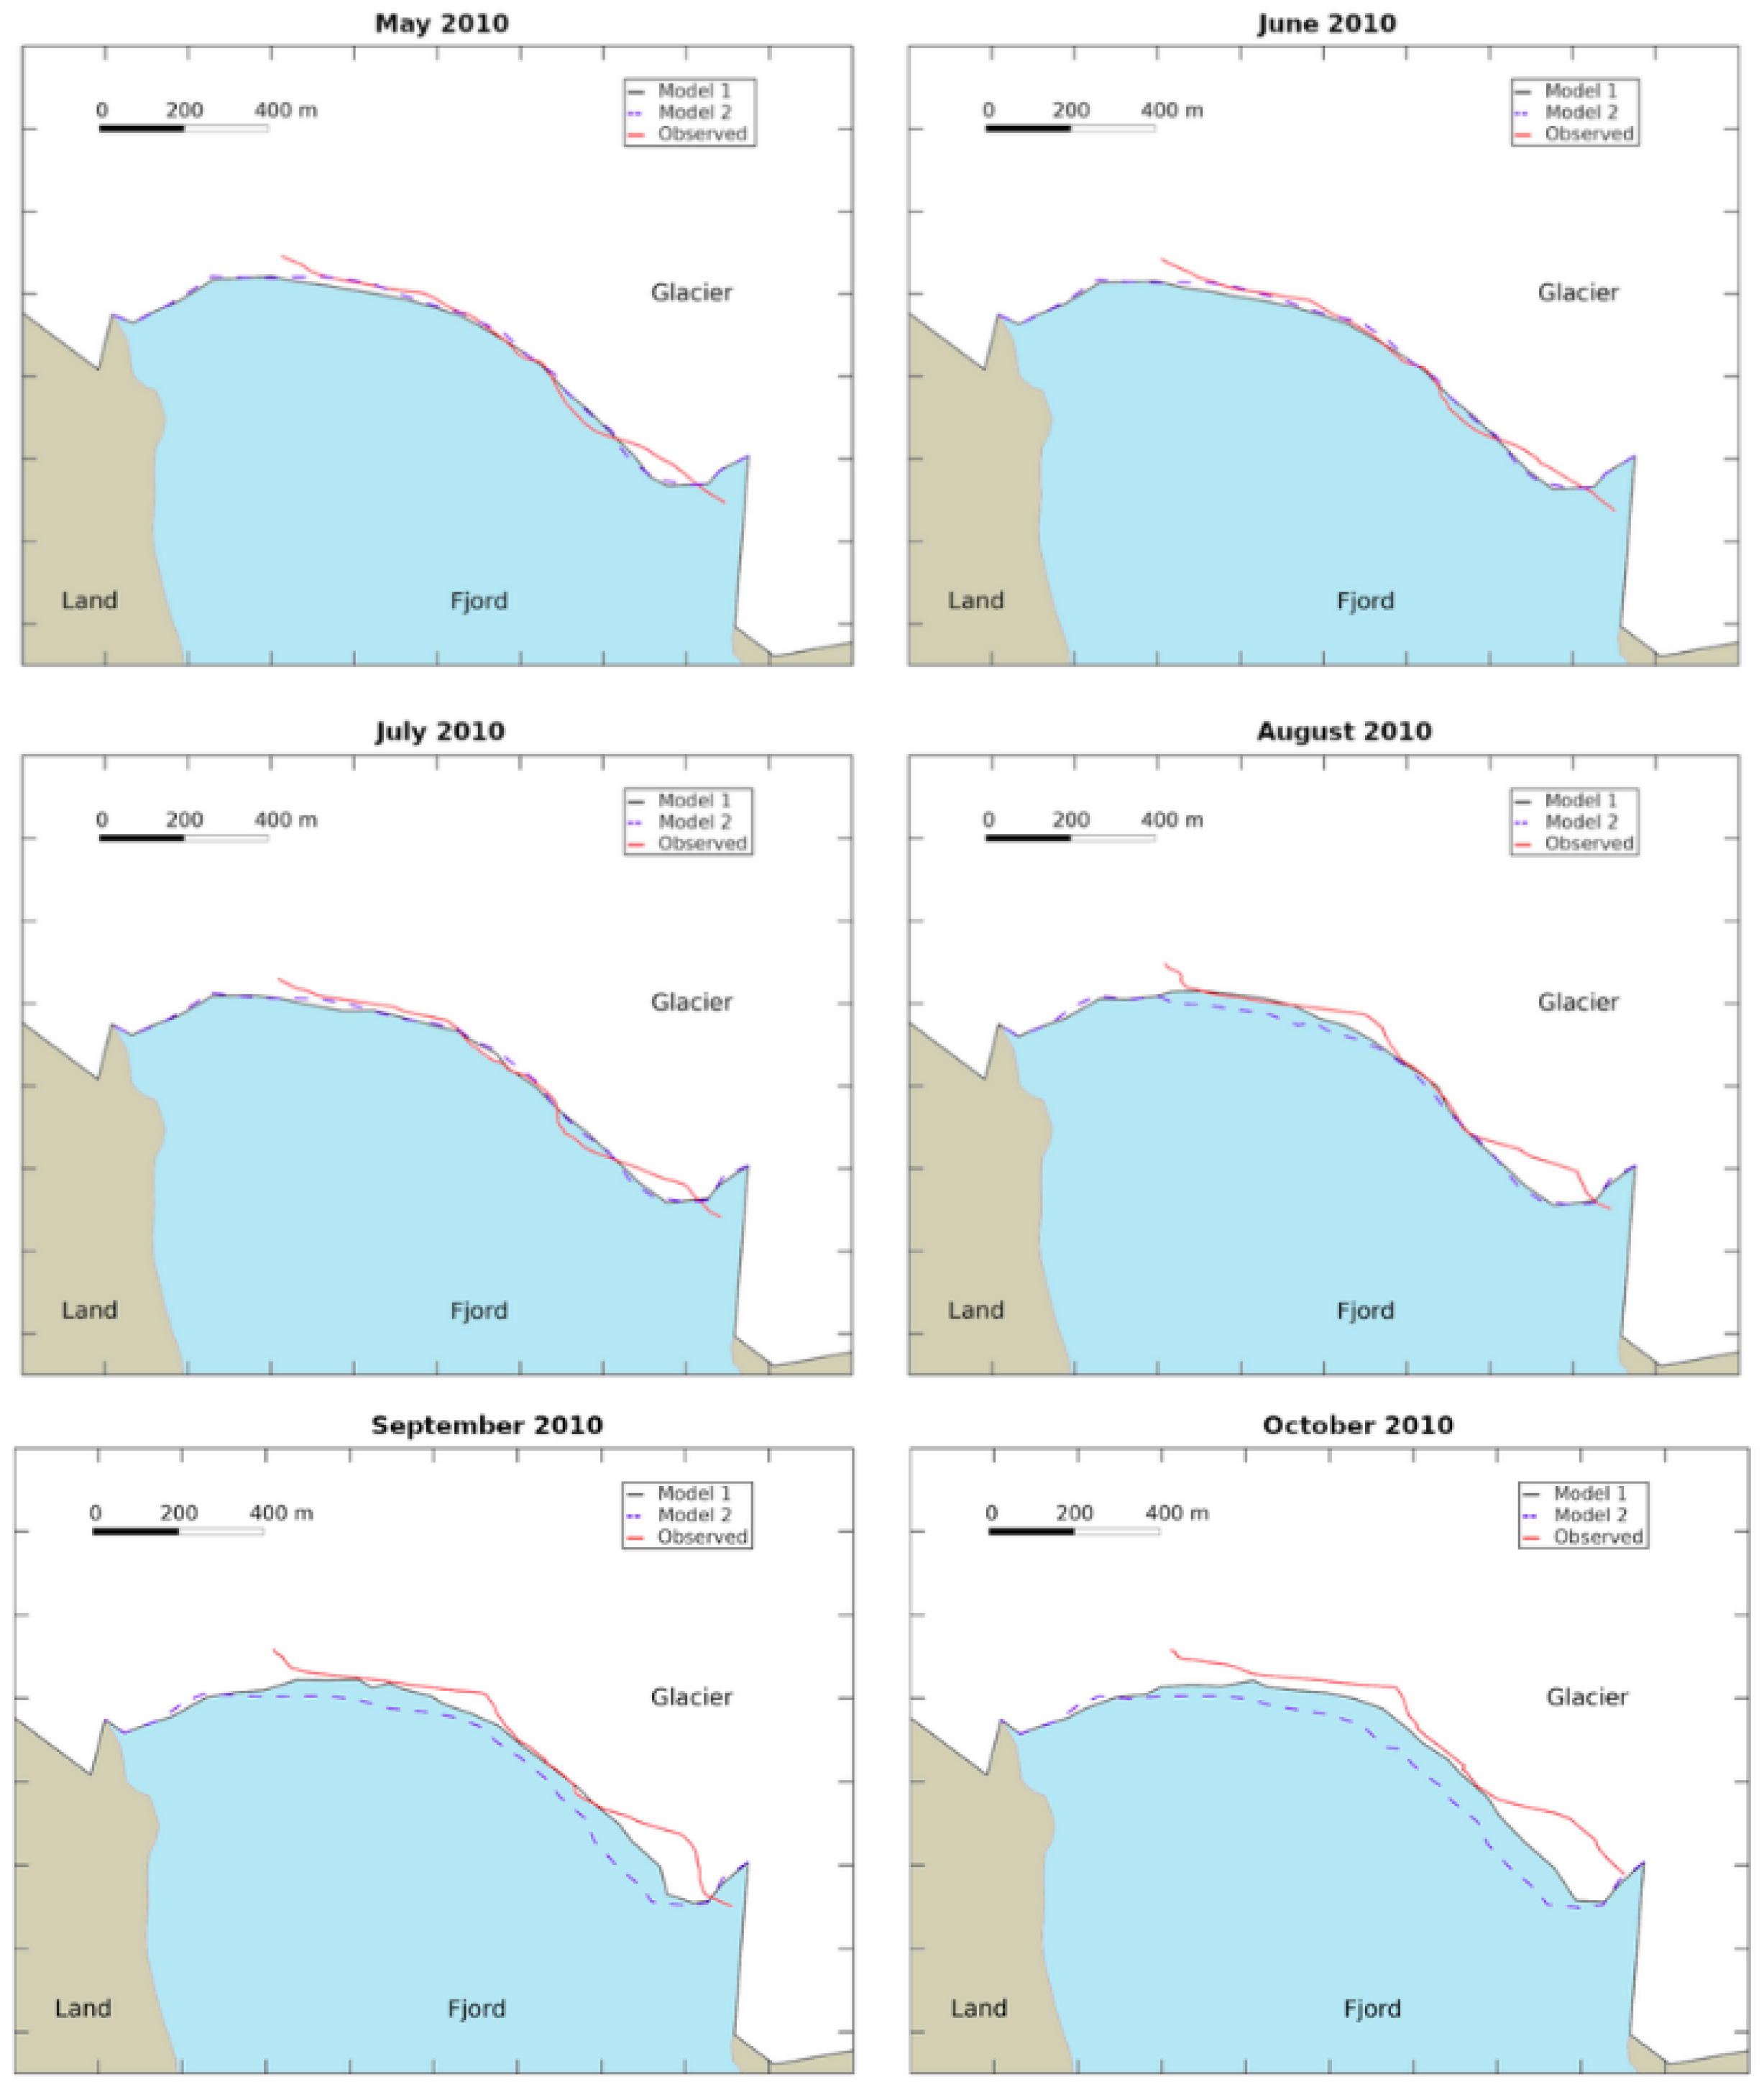
Figure 6 graphically represents the observed and modeled monthly positions for a qualitative analysis between Models 1 and 2. On the other hand,
Table 2 quantifies the longitudinal differences of each model against observations. This quantification results from calculating the area difference between observed and modeled, divided by the observed width of the glacier front. Negative values indicate that observed front is more advanced than modeled one.
The results in
Figure 6 show a very good approximation of both models to the observations during the initial months of the simulation (May and June), during which there are minimal changes in the position and morphology of the glacier front. The longitudinal difference in April is so small (
) that it is not graphically represented (see values in
Table 2). For the months of May and June, both models exhibit a longitudinal difference of
compared to the observed front. However, it is noteworthy that Model 1 presents a glacier front that is a bit more retreated than observed.
Starting in July, this situation changes, and the front begins to retreat more significantly until October, thereby increasing the differences between both models and the observations. These differences become remarkable in the eastern margin from July, and at the center of the glacier terminus from August, and maintained in both cases until October. The longitudinal differences of Model 1 (Model 2) against observations increase from ∼13 m (∼32 m) m in July, to ∼ 76 m (∼122 m) in October (
Table 2). Although neither model exactly matches the observed front position, Model 1, which is coupled with the sophisticated subglacial hydrology model, provides results that are much closer to the observations, reducing the longitudinal difference presented by Model 2 by up to 50%.
3.3. Comparison of Frontal Ablation Between the Two Models
Frontal ablation refers to the mass loss of a glacier at its terminus. As previously described in the introduction (
Section 1) and illustrated in
Figure 1, the front of a tidewater glacier can experience mass loss primarily through two mechanisms: calving, which is associated with the detachment of icebergs, and submarine melting. The latter is influenced not only by the temperature of the fjord but is also enhanced by buoyant plumes generated by subglacial meltwater discharges. In this section, we quantify the frontal ablation associated with these two main mechanisms: calving and submarine melting, for the two models employed in the simulations.
3.3.1. Calving
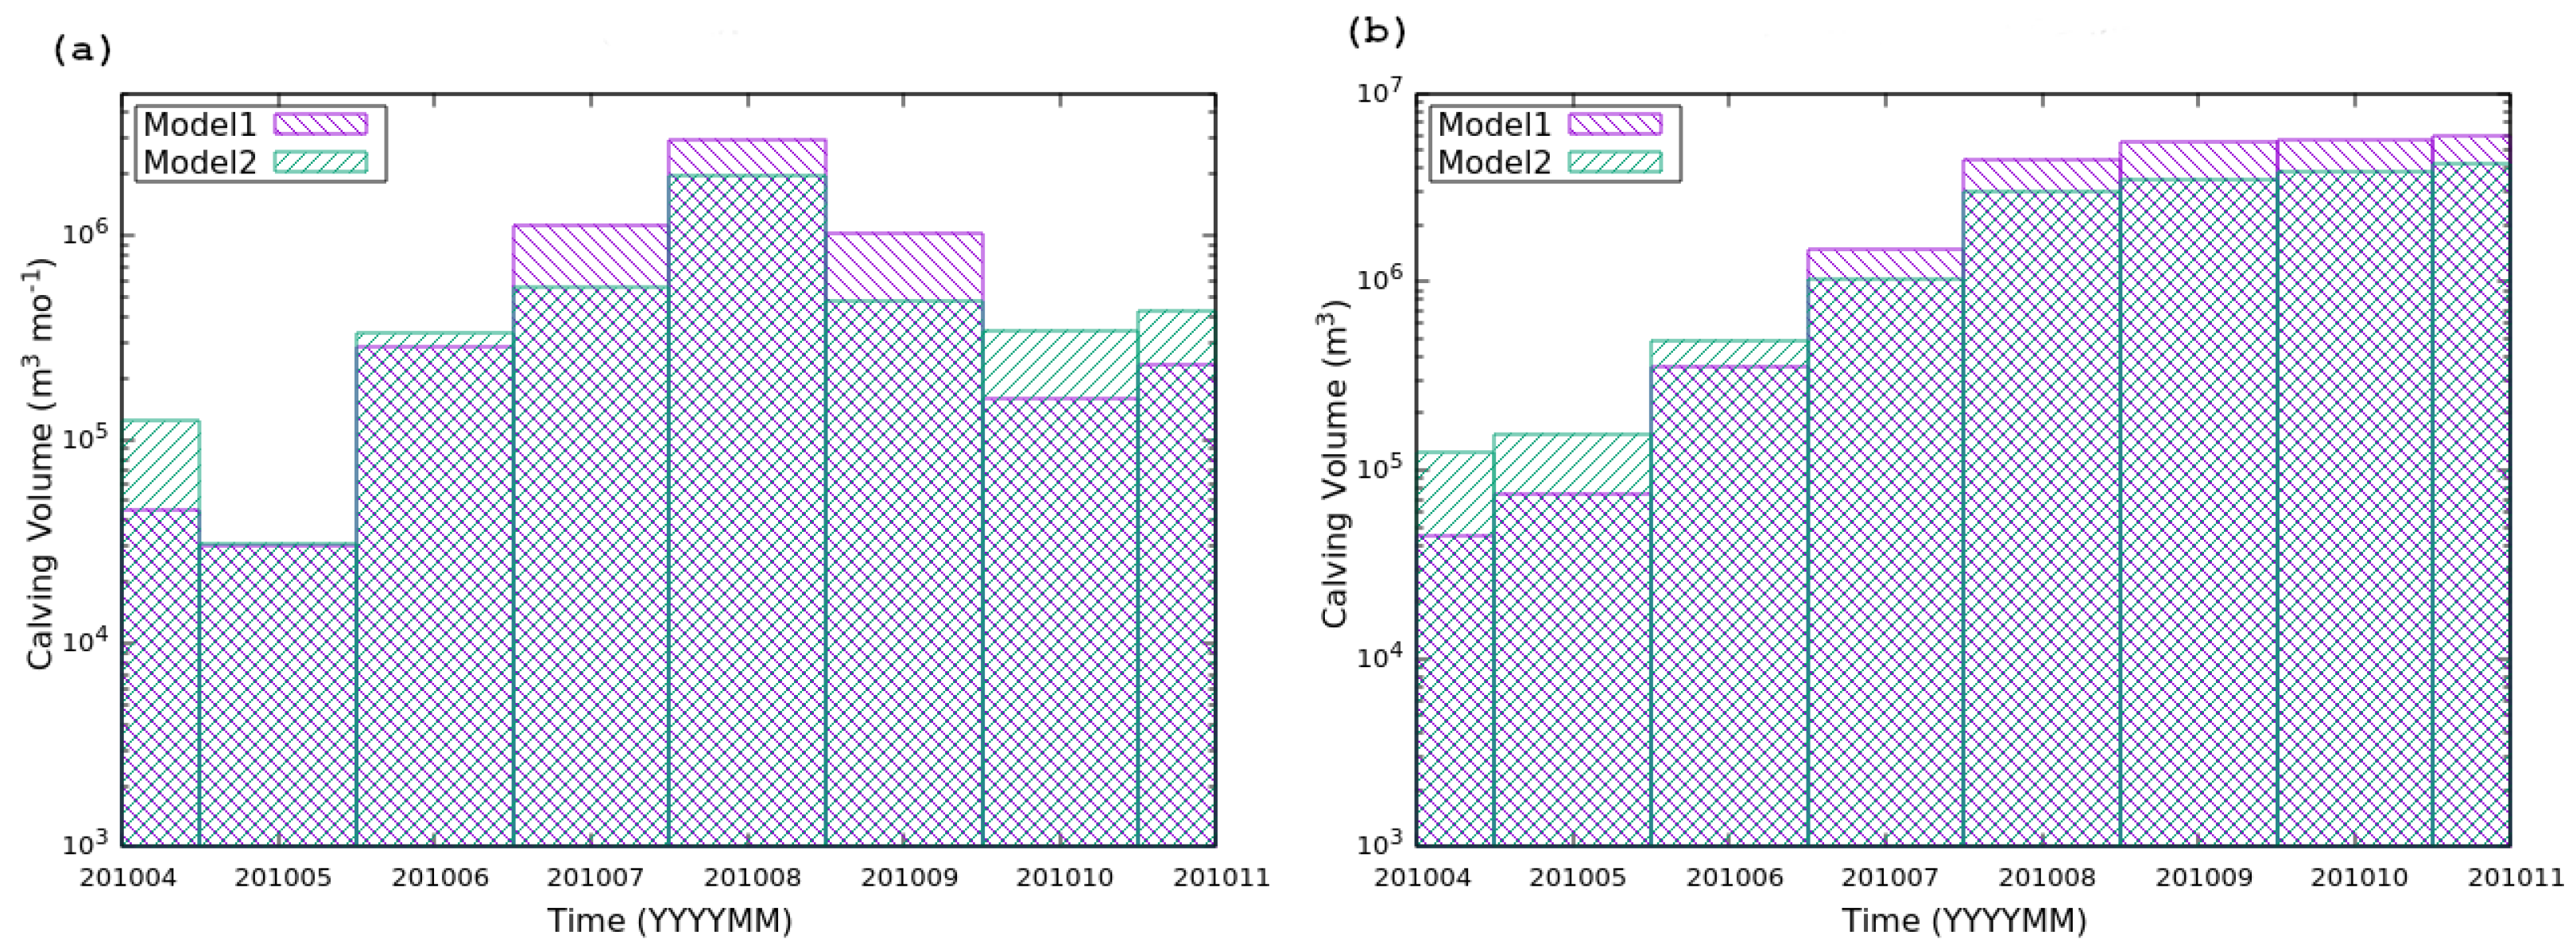
In general terms, the simulation results indicate that the volume of mass loss due to calving increases throughout the melt season, peaking in August (
Figure 7a). Following September, the mass loss from calving begins to decline. This trend is consistent with the pattern observed for surface meltwater (
Figure 3), highlighting the interrelationship between these two mass-loss mechanisms.
Focusing on the calving volume presented in
Figure 7a, the minimum monthly mass loss rates, approximately
, occur in May for both models. In April and June, Model 2, which assumes a single discharge channel, exhibits a greater calving volume than Model 1. However, this situation reverses in the subsequent months (July, August, and September), when the mass loss from calving is more pronounced. In July and September, the calving volume for Model 2 is around
, while Model 1 reaches calving volumes of up to
. This suggests that the resolution and coupling of the subglacial hydrology model with the glacier dynamics model (Model 1) facilitate more than double the frontal ablation due to calving during July and September, which are months characterized by significant surface melting (see
Figure 3). In August, both models exhibit their highest monthly calving volumes, with Model 1 reaching
and Model 2 reaching
.
Except for the first three months (April to June), the total mass loss accumulated due to calving is greater in Model 1 along the melt season, which reaches a total of
(∼6 Mt) by November (
Figure 7b). In Model 2, the mass loss from calving amounts to a total of
(∼4 Mt), which is one-third less than that of Model 1. This highlights the significant importance of incorporating the subglacial hydrology model into the glacier dynamics model when calculating frontal ablation due to calving.
3.3.2. Submarine Melting
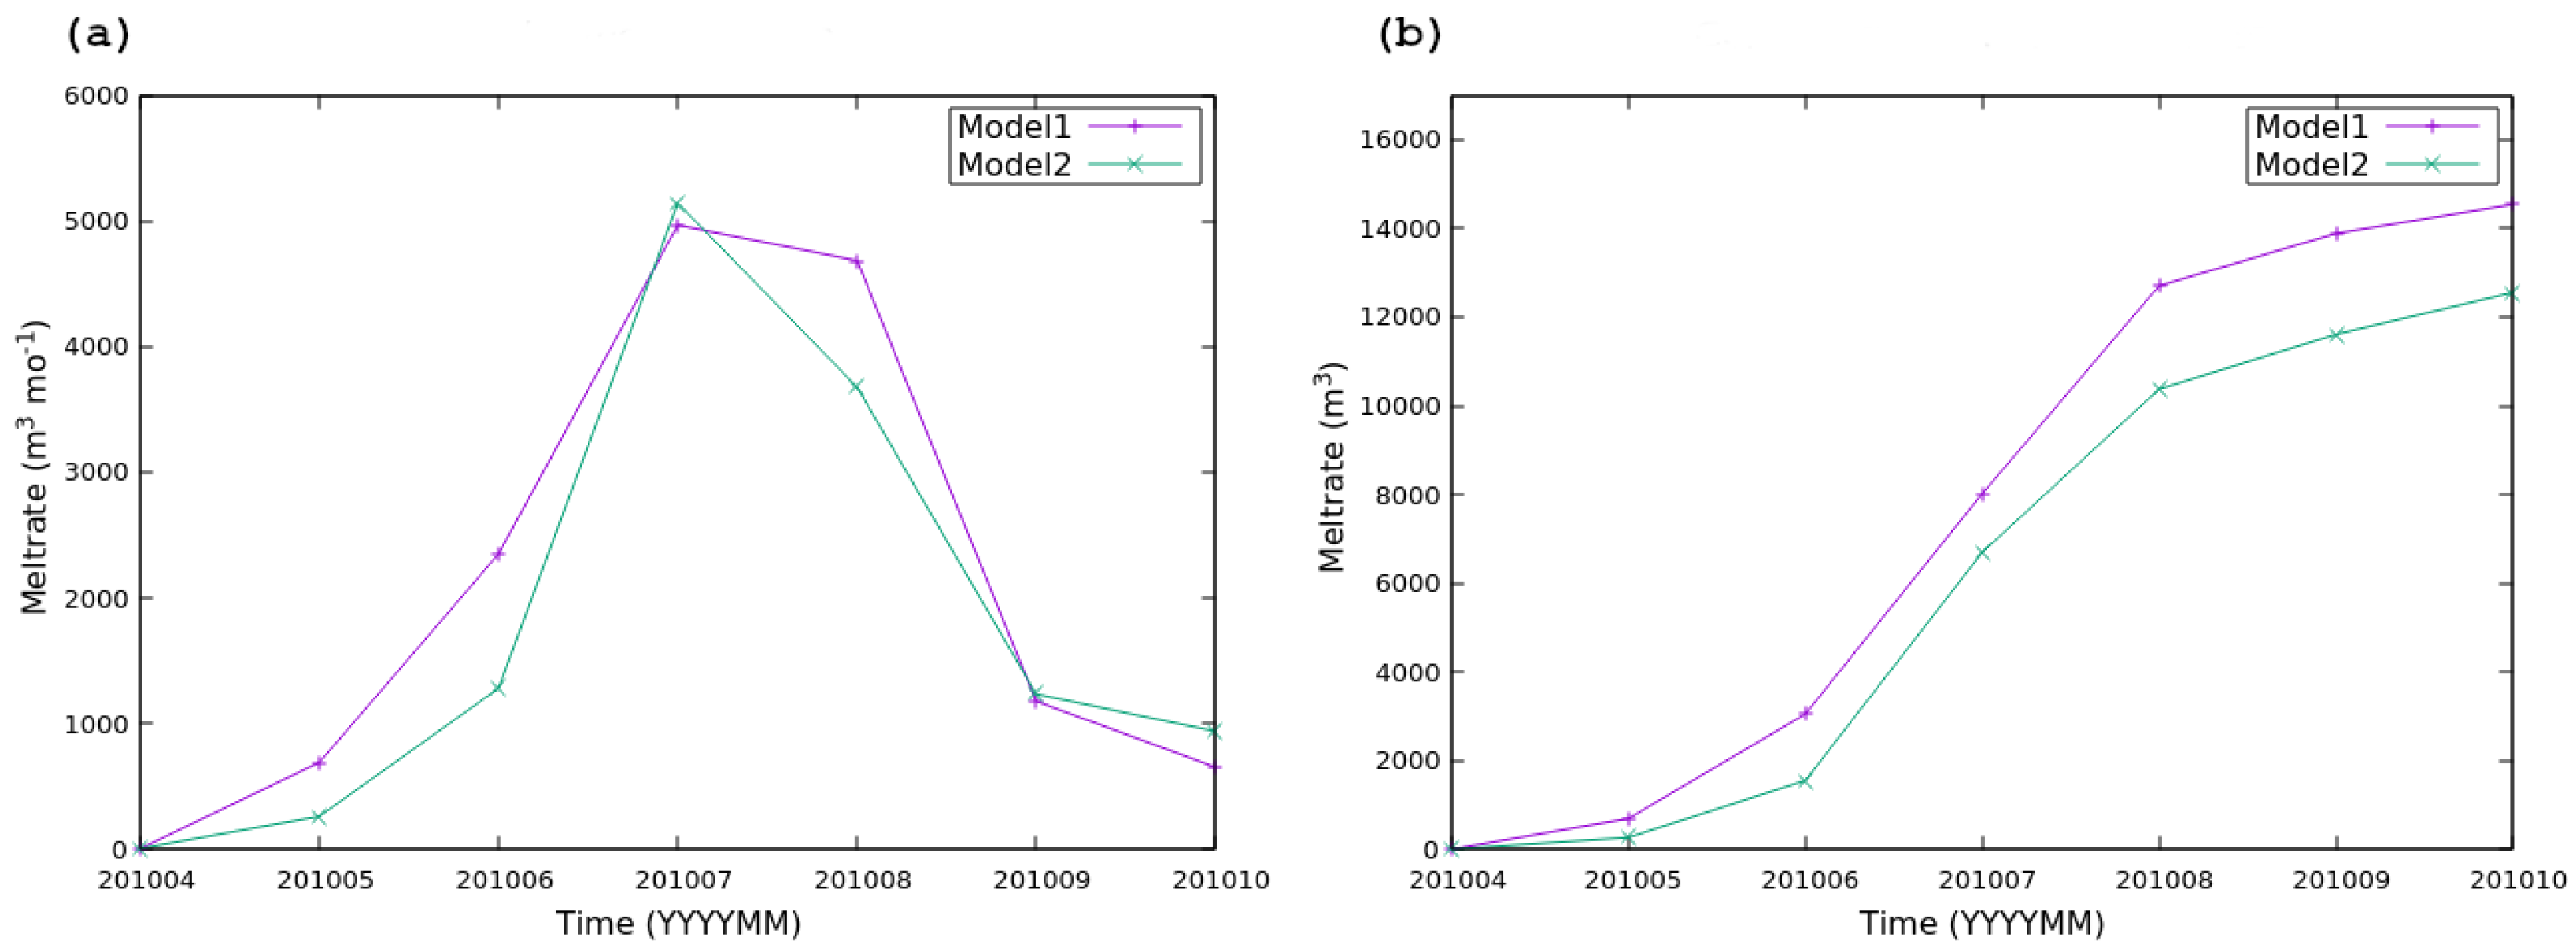
Submarine melting refers to the submerged portion of a glacier terminus that melts due to direct contact with seawater or fjord waters. In our simulations of Hansbreen glacier, we computed the monthly submarine ice melt (
Figure 8a) and noticed that both models exhibit a similar general pattern to that of calving (
Figure 7a) and surface meltwater (
Figure 3) throughout the simulation period.
In April, submarine melting is minimal, coinciding with cold temperatures in the fjord and low subglacial discharge. This melting progressively increases, reaching its peak in July, which occurs one month prior to the maximum calving volume (see
Figure 7a). Following this peak, submarine melting decreases again until the end of the simulation.
The results indicate that monthly submarine melting rates are consistently higher in Model 1 compared to Model 2 throughout the simulation, with the exception of July, when melting reaches its maximum of 5000 m
3 month
−1 in both models.
Figure 8b illustrates the accumulation of frontal ablation resulting from submarine melting. It is evident that Model 1 generates greater mass loss due to submarine melting than Model 2 for the entire duration of the simulation. By the end of the simulation, the total ice-volume loss attributed to submarine melting is 15000 m
3 in Model 1 and 12500 m
3 in Model 2.
4. Discussion
4.1. Subglacial Hydrology as an Important Component of the Glacier-Fjord System
Subglacial hydrology plays a crucial role in the dynamics of tidewater glaciers. It is interconnected with various processes, relying on surface meltwater while also influencing ice velocities, subglacial discharge, submarine melting, and iceberg calving [
15,
23,
70,
71,
72]. Understanding these interactions is essential for accurately modeling glacier behavior [
42] and predicting future changes in response to climate variability.
Our study demonstrates that resolving the subglacial hydrology model significantly enhances the accuracy of predicting the position of the glacier front (
Figure 6 and
Table 2). By resolving the subglacial water flow, we can account for the complex network of drainage channels that develop beneath the glacier (
Figure 5). This complexity allows for a more realistic simulation of how water moves and exerts pressure at the glacier base, altering the basal sliding coefficient and ultimately affecting glacier velocity and frontal stability [
32,
34,
35].
These additional channels facilitate greater subglacial water flow, which aligns with sediment plume observations in our study (
Figure 4) and has also been reported by [
15,
71]. This increased flow contributes to higher submarine melting rates (
Figure 8), consistent with the findings of [
28,
72]. Moreover, the presence of multiple drainage channels amplifies mass loss through calving (
Figure 7) as a consequence of enhanced net stress differences at the glacier terminus [
51].
In contrast, simplifying subglacial hydrology by assuming a single discharge channel at the tidewater glacier terminus—an approach commonly found in the scientific literature [e.g., [
17,
21,
22,
51,
73]—leads to less accurate predictions of the glacier front position, as shown in
Figure 6. In our study, the results from the oversimplified model indicate that the glacier front is further advanced than both the comprehensive model and actual observations. This suggests that subglacial hydrology is a crucial component in modeling the entire glacier-fjord system.
This discrepancy arises because the simplified model is limited to a single discharge channel, which fails to account for the multiple drainage pathways present at the glacier front. Consequently, it does not accurately capture the pressure distribution along the entire base of the glacier. This results in smaller differences in glacier velocities at the front, which hinders the destabilization of the glacier front and promotes less calving (
Figure 7). Ultimately, this leads to a glacier terminus that is more advanced than what is actually observed (
Figure 6).
In summary, the interaction between subglacial water dynamics and frontal ablation is essential for understanding the overall mass balance of Arctic tidewater glaciers.
4.2. Implications of Simplifying the Subglacial Hydrology Component in the Modeling Context
The complex interplay between surface meltwater, subglacial discharge, and iceberg calving highlights the essential requirement for precise modeling of subglacial hydrology [
42,
46,
47]. Our research demonstrates that in months characterized by reduced surface meltwater production (
Figure 3), the variance in glacier front position between the hydrology-resolving model and the simplified model is negligible (
Figure 6 and
Table 2). Conversely, as surface meltwater production increases, the discrepancies between the two modeling approaches become increasingly significant (
Figure 6 and
Table 2). Importantly, the model that incorporates subglacial hydrology exhibits a closer alignment with observations, indicating its superior accuracy in representing the underlying physical processes.
In our simulation, which encompasses a single year from April to December 2010, we observed a notable difference in mass loss attributed to calving between the two modeling approaches (
Figure 7). The coupled model indicated a mass loss of 6 Mt, whereas the simplified model recorded a significantly lower mass loss of 4 Mt. This discrepancy underscores the importance of subglacial hydrology, particularly as surface meltwater increases. Consequently, in the context of rising atmospheric and oceanic temperatures, and the high sensitivity of tidewater glaciers to these changes [
6,
7,
8,
50], the reliance on predictive models that oversimplify subglacial hydrological processes may result in a considerable underestimation of glacier retreat rates in future climate change scenarios.
While simplified models present advantages in terms of reduced computational costs when studying glacier dynamics [
51,
61,
74,
75], it is crucial to consider these benefits in light of their inherent limitations. To properly adjust the parameterization of the subglacial hydrology, further comparative simulations of both modeling approaches (simplified and resolved) are necessary, using empirical observations from a diverse range of glacier-fjord systems with varying characteristics and under different atmospheric and oceanic conditions. This approach will provide a more comprehensive understanding of how each model responds to specific environmental factors. Furthermore, such studies would facilitate the incorporation of an appropriate error range for the simplified models, thereby addressing their limitations and enabling a more accurate assessment of mass loss and front retreat in Arctic glaciers.
Furthermore, the incorporation of artificial intelligence methodologies into glaciological research is increasingly being recognized as a valuable advancement for mapping glacier basal sliding [
76], detecting glacier-snow lines [
77], and modeling glacier melt dynamics [
78] or surface mass balance (e.g., [
79,
80,
81]). These techniques require training on observational datasets or data generated from existing models. Consequently, to ensure the reliability of predictions derived from these advanced methodologies, it is imperative to produce model results that are both accurate and representative of the real glacier-fjord system. This foundational aspect will significantly enhance the credibility of future forecasts concerning glacier dynamics and their responses to climate change.
5. Conclusions
This study highlights the critical role of subglacial hydrology in the dynamics of tidewater glaciers, emphasizing its influence on glacier front position, submarine melting, and iceberg calving. Our findings demonstrate that coupling the glacier dynamics model with a resolved subglacial hydrology model significantly improves the accuracy of predicting glacier front positions compared to the simplified model that assumes a single discharge channel. The complexity of subglacial drainage networks seems essential for capturing the pressure distribution at the glacier base, which directly affects glacier stability and mass loss through calving.
As surface meltwater production increases, the discrepancies between the comprehensive and simplified models become more pronounced. Within a single melt season, the simplified model underestimates up to 1/3 of the mass loss due to calving, underscoring the necessity of incorporating subglacial hydrology in predictive models. The observed differences in mass loss due to submarine melting and calving further illustrate the importance of accurate modeling in understanding glacier responses to climate change.
In light of rising temperatures and the sensitivity of tidewater glaciers, reliance on oversimplified models may lead to significant underestimations of glacier retreat rates. Future research should focus on comparative simulations across diverse glacier-fjord systems to refine parameterizations of subglacial hydrology and enhance the reliability of predictions. Additionally, properly integrating artificial intelligence methodologies into glaciological research holds promise for reducing computational effort for glacier dynamics modeling.
Our findings highlight that a comprehensive approach is essential for improving predictions of glacier behavior and understanding the broader implications for sea-level rise and climate change.
Author Contributions
Conceptualization, E.DeA.; model implementation, J.M-H.; formal analysis, E.DeA.; investigation, E.DeA.; data curation, K.S.; writing—original draft preparation, E.DeA. and J.M-H.; writing—review and editing, K.S. and J.O.; funding acquisition, J.O. All authors have read and agreed to the published version of the manuscript.
Funding
E. De Andrés is supported by Margarita-Salas Grant No. UP2021-035 under the Next Generation-EU program. This research was also funded by grant PID2020-113051RB-C31 from MCIN / AEI / 10.13039/501100011033 / FEDER, UE.
Data Availability Statement
Acknowledgments
In this section you can acknowledge any support given which is not covered by the author contribution or funding sections. This may include administrative and technical support, or donations in kind (e.g., materials used for experiments).
Conflicts of Interest
The authors declare no conflicts of interest. The funders had no role in the design of the study; in the collection, analyses, or interpretation of data; in the writing of the manuscript; or in the decision to publish the results.
References
- Tesi, T.; Muschitiello, F.; Mollenhauer, G.; Miserocchi, S.; Langone, L.; Ceccarelli, C.; Panieri, G.; Chiggiato, J.; Nogarotto, A.; Hefter, J.; Ingrosso, G.; Giglio, F.; Giordano, P.; Capotondi, L. Rapid Atlantification along the Fram Strait at the beginning of the 20th century. Science Advances 2021, 7. [Google Scholar] [CrossRef] [PubMed]
- Strzelewicz, A.; Przyborska, A.; Walczowski, W. Increased presence of Atlantic Water on the shelf south-west of Spitsbergen with implications for the Arctic fjord Hornsund. Progress in Oceanography 2022, 200, 102714. [Google Scholar] [CrossRef]
- Tepes, P.; Gourmelen, N.; Nienow, P.; Tsamados, M.; Shepherd, A.; Weissgerber, F. Changes in elevation and mass of Arctic glaciers and ice caps, 2010–2017. Remote Sensing of Environment 2021, 261, 112481. [Google Scholar] [CrossRef]
- Tepes, P.; Nienow, P.; Gourmelen, N. Accelerating Ice Mass Loss Across Arctic Russia in Response to Atmospheric Warming, Sea Ice Decline, and Atlantification of the Eurasian Arctic Shelf Seas. Journal of Geophysical Research: Earth Surface 2021, 126, 1–21. [Google Scholar] [CrossRef]
- Hock, R.; Huss, M. Glaciers and climate change. In Climate Change; Elsevier, 2021; pp. 157–176. [CrossRef]
- Nuth, C.; Gilbert, A.; Köhler, A.; McNabb, R.; Schellenberger, T.; Sevestre, H.; Weidle, C.; Girod, L.; Luckman, A.; Kääb, A. Dynamic vulnerability revealed in the collapse of an Arctic tidewater glacier. Scientific Reports 2019, 9, 5541. [Google Scholar] [CrossRef]
- Luckman, A.; Benn, D.I.; Cottier, F.; Bevan, S.; Nilsen, F.; Inall, M. Calving rates at tidewater glaciers vary strongly with ocean temperature. Nature Communications 2015, 6, 8566. [Google Scholar] [CrossRef]
- Holmes, F.A.; Kirchner, N.; Kuttenkeuler, J.; Krützfeldt, J.; Noormets, R. Relating ocean temperatures to frontal ablation rates at Svalbard tidewater glaciers: Insights from glacier proximal datasets. Scientific Reports 2019, 9, 9442. [Google Scholar] [CrossRef]
- Błaszczyk, M.; Ignatiuk, D.; Uszczyk, A.; Cielecka-Nowak, K.; Grabiec, M.; Jania, J.A.; Moskalik, M.; Walczowski, W. Freshwater input to the Arctic fjord Hornsund (Svalbard). Polar Research 2019, 38. [Google Scholar] [CrossRef]
- Cogley, J.G.; Hock, R.; Rasmussen, L.A.; Arendt, A.A.; Bauder, A.; Braithwaite, R.J.; Jansson, P.; Kaser, G.; Möller, M.; Nicholson, L.; Zemp, M. Glossary of Glacier Mass Balance and Related Terms. Technical report, IACS, 2011.
- Huss, M.; Hock, R. A new model for global glacier change and sea-level rise. Frontiers in Earth Science 2015, 3, 1–22. [Google Scholar] [CrossRef]
- Hanna, E.; Pattyn, F.; Navarro, F.; Favier, V.; Goelzer, H.; van den Broeke, M.R.; Vizcaino, M.; Whitehouse, P.L.; Ritz, C.; Bulthuis, K.; Smith, B. Mass balance of the ice sheets and glaciers – Progress since AR5 and challenges. Earth-Science Reviews 2020, 201, 102976. [Google Scholar] [CrossRef]
- Mankoff, K.D.; Straneo, F.; Cenedese, C.; Das, S.B.; Richards, C.G.; Singh, H. Structure and dynamics of a subglacial discharge plume in a <scp>G</scp> reenlandic fjord. Journal of Geophysical Research: Oceans 2016, 121, 8670–8688. [Google Scholar] [CrossRef]
- De Andrés, E.; Slater, D.; Straneo, F.; Otero, J.; Das, S.; Navarro, F. Surface emergence of glacial plumes determined by fjord stratification. The Cryosphere 2020, pp. 1–41. [CrossRef]
- How, P.; Benn, D.I.; Hulton, N.R.J.; Hubbard, B.; Luckman, A.; Sevestre, H.; van Pelt, W.J.J.; Lindbäck, K.; Kohler, J.; Boot, W. Rapidly changing subglacial hydrological pathways at a tidewater glacier revealed through simultaneous observations of water pressure, supraglacial lakes, meltwater plumes and surface velocities. The Cryosphere 2017, 11, 2691–2710. [Google Scholar] [CrossRef]
- Motyka, R.J.; Dryer, W.P.; Amundson, J.; Truffer, M.; Fahnestock, M. Rapid submarine melting driven by subglacial discharge, LeConte Glacier, Alaska. Geophysical Research Letters 2013, 40, 5153–5158. [Google Scholar] [CrossRef]
- DE ANDRÉS, E.; OTERO, J.; NAVARRO, F.; PROMIŃSKA, A.; LAPAZARAN, J.; WALCZOWSKI, W. A two-dimensional glacier–fjord coupled model applied to estimate submarine melt rates and front position changes of Hansbreen, Svalbard. Journal of Glaciology 2018, 64, 745–758. [Google Scholar] [CrossRef]
- Straneo, F.; Cenedese, C. The Dynamics of Greenland’s Glacial Fjords and Their Role in Climate. Annual Review of Marine Science 2015, 7, 89–112. [Google Scholar] [CrossRef]
- Sciascia, R.; Straneo, F.; Cenedese, C.; Heimbach, P. Seasonal variability of submarine melt rate and circulation in an East Greenland fjord. Journal of Geophysical Research: Oceans 2013, 118, 2492–2506. [Google Scholar] [CrossRef]
- Xu, Y.; Rignot, E.; Fenty, I.; Menemenlis, D.; Flexas, M.M. Subaqueous melting of Store Glacier, west Greenland from three-dimensional, high-resolution numerical modeling and ocean observations. Geophysical Research Letters 2013, 40, 4648–4653. [Google Scholar] [CrossRef]
- Slater, D.A.; Nienow, P.W.; Cowton, T.R.; Goldberg, D.N.; Sole, A.J. Effect of near-terminus subglacial hydrology on tidewater glacier submarine melt rates. Geophysical Research Letters 2015, 42, 2861–2868. [Google Scholar] [CrossRef]
- Slater, D.A.; Straneo, F.; Das, S.B.; Richards, C.G.; Wagner, T.J.W.; Nienow, P.W. Localized Plumes Drive Front-Wide Ocean Melting of A Greenlandic Tidewater Glacier. Geophysical Research Letters 2018, 45, 12350–12358. [Google Scholar] [CrossRef]
- Jackson, R.H.; Motyka, R.J.; Amundson, J.M.; Abib, N.; Sutherland, D.A.; Nash, J.D.; Kienholz, C. The Relationship Between Submarine Melt and Subglacial Discharge From Observations at a Tidewater Glacier. Journal of Geophysical Research: Oceans 2022, 127, e2021JC018204. [Google Scholar] [CrossRef]
- O’Leary, M.; Christoffersen, P. Calving on tidewater glaciers amplified by submarine frontal melting. The Cryosphere 2013, 7, 119–128. [Google Scholar] [CrossRef]
- Vallot, D.; Adinugroho, S.; Strand, R.; How, P.; Pettersson, R.; Benn, D.I.; Hulton, N.R.J. Automatic detection of calving events from time-lapse imagery at Tunabreen, Svalbard. Geoscientific Instrumentation, Methods and Data Systems 2019, 8, 113–127. [Google Scholar] [CrossRef]
- Schild, K.M.; Renshaw, C.E.; Benn, D.I.; Luckman, A.; Hawley, R.L.; How, P.; Trusel, L.; Cottier, F.R.; Pramanik, A.; Hulton, N.R.J. Glacier Calving Rates Due to Subglacial Discharge, Fjord Circulation, and Free Convection. Journal of Geophysical Research: Earth Surface 2018, 123, 2189–2204. [Google Scholar] [CrossRef]
- Holmes, F.A.; van Dongen, E.; Kirchner, N. Modelled frontal ablation and velocities at Kronebreen, Svalbard, are sensitive to the choice of submarine melt rate scenario. Journal of Glaciology 2023, pp. 1–12. [CrossRef]
- Fried, M.J.; Catania, G.A.; Bartholomaus, T.C.; Duncan, D.; Davis, M.; Stearns, L.A.; Nash, J.; Shroyer, E.; Sutherland, D. Distributed subglacial discharge drives significant submarine melt at a Greenland tidewater glacier. Geophysical Research Letters 2015, 42, 9328–9336. [Google Scholar] [CrossRef]
- Fried, M.J.; Carroll, D.; Catania, G.A.; Sutherland, D.A.; Stearns, L.A.; Shroyer, E.L.; Nash, J.D. Distinct Frontal Ablation Processes Drive Heterogeneous Submarine Terminus Morphology. Geophysical Research Letters 2019, 46, 12083–12091. [Google Scholar] [CrossRef]
- Sutherland, D.A.; Jackson, R.H.; Kienholz, C.; Amundson, J.M.; Dryer, W.P.; Duncan, D.; Eidam, E.F.; Motyka, R.J.; Nash, J.D. Direct observations of submarine melt and subsurface geometry at a tidewater glacier. Science 2019, 365, 369–374. [Google Scholar] [CrossRef]
- Bunce, C.; Nienow, P.; Sole, A.; Cowton, T.; Davison, B. Influence of glacier runoff and near-terminus subglacial hydrology on frontal ablation at a large Greenlandic tidewater glacier. Journal of Glaciology 2021, 67, 343–352. [Google Scholar] [CrossRef]
- Bartholomew, I.; Nienow, P.; Sole, A.; Mair, D.; Cowton, T.; King, M.A. Short-term variability in Greenland Ice Sheet motion forced by time-varying meltwater drainage: Implications for the relationship between subglacial drainage system behavior and ice velocity. Journal of Geophysical Research: Earth Surface 2012, 117, 1–17. [Google Scholar] [CrossRef]
- Bell, R.E. The role of subglacial water in ice-sheet mass balance. Nature Geoscience 2008, 1, 297–304. [Google Scholar] [CrossRef]
- Zwally, H.J.; Abdalati, W.; Herring, T.; Larson, K.; Saba, J.; Steffen, K. Surface Melt-Induced Acceleration of Greenland Ice-Sheet Flow. Science 2002, 297, 218–222. [Google Scholar] [CrossRef]
- van de Wal, R.S.W.; Boot, W.; van den Broeke, M.R.; Smeets, C.J.P.P.; Reijmer, C.H.; Donker, J.J.A.; Oerlemans, J. Large and Rapid Melt-Induced Velocity Changes in the Ablation Zone of the Greenland Ice Sheet. Science 2008, 321, 111–113. [Google Scholar] [CrossRef] [PubMed]
- Cowton, T.; Nienow, P.; Sole, A.; Wadham, J.; Lis, G.; Bartholomew, I.; Mair, D.; Chandler, D. Evolution of drainage system morphology at a land-terminating Greenlandic outlet glacier. Journal of Geophysical Research: Earth Surface 2013, 118, 29–41. [Google Scholar] [CrossRef]
- Fountain, A.G.; Walder, J.S. Water flow through temperate glaciers. Reviews of Geophysics 1998, 36, 299–328. [Google Scholar] [CrossRef]
- Nienow, P.; Sharp, M.; Willis, I. Seasonal changes in the morphology of the subglacial drainage system, Haut Glacier d’Arolla, Switzerland. Earth Surface Processes and Landforms 1998, 23, 825–843. [Google Scholar] [CrossRef]
- Weertman, J. General theory of water flow at the base of a glacier or ice sheet. Reviews of Geophysics 1972, 10, 287–333. [Google Scholar] [CrossRef]
- Hodgkins, R. Glacier hydrology in Svalbard, Norwegian high arctic. Quaternary Science Reviews 1997, 16, 957–973. [Google Scholar] [CrossRef]
- Decaux, L.; Grabiec, M.; Ignatiuk, D.; Jania, J. Role of discrete water recharge from supraglacial drainage systems in modeling patterns of subglacial conduits in Svalbard glaciers. The Cryosphere 2019, 13, 735–752. [Google Scholar] [CrossRef]
- Flowers, G.E. Modelling water flow under glaciers and ice sheets. Proceedings of the Royal Society A: Mathematical, Physical and Engineering Sciences 2015, 471, 20140907. [Google Scholar] [CrossRef]
- Kamb, B.; Raymond, C.F.; Harrison, W.D.; Engelhardt, H.; Echelmeyer, K.A.; Humphrey, N.; Brugman, M.M.; Pfeffer, T. Glacier Surge Mechanism: 1982-1983 Surge of Variegated Glacier, Alaska. Science 1985, 227, 469–479. [Google Scholar] [CrossRef]
- Kamb, B. Glacier surge mechanism based on linked cavity configuration of the basal water conduit system. Journal of Geophysical Research: Solid Earth 1987, 92, 9083–9100. [Google Scholar] [CrossRef]
- Muñoz-Hermosilla, J.M.; Otero, J.; De Andrés, E.; Shahateet, K.; Navarro, F.; Pérez-Doña, I. A 3D glacier dynamics–line plume model to estimate the frontal ablation of Hansbreen, Svalbard. The Cryosphere 2024, 18, 1911–1924. [Google Scholar] [CrossRef]
- Cook, S.J.; Christoffersen, P.; Todd, J.; Slater, D.; Chauché, N. Coupled modelling of subglacial hydrology and calving-front melting at Store Glacier, West Greenland. The Cryosphere 2020, 14, 905–924. [Google Scholar] [CrossRef]
- Cook, S.J.; Christoffersen, P.; Todd, J. A fully-coupled 3D model of a large Greenlandic outlet glacier with evolving subglacial hydrology, frontal plume melting and calving. Journal of Glaciology 2022, 68, 486–502. [Google Scholar] [CrossRef]
- Möller, M.; Navarro, F.; Huss, M.; Marzeion, B. Projected sea-level contributions from tidewater glaciers are highly sensitive to chosen bedrock topography: a case study at Hansbreen, Svalbard. Journal of Glaciology 2023, 69, 966–980. [Google Scholar] [CrossRef]
- Grabiec, M.; Jania, J.A.; Puczko, D.; Kolondra, L.; Budzik, T. Surface and bed morphology of Hansbreen, a tidewater glacier in Spitsbergen. Polish Polar Research 2012, 33, 111–138. [Google Scholar] [CrossRef]
- Błaszczyk, M.; Jania, J.A.; Ciepły, M.; Grabiec, M.; Ignatiuk, D.; Kolondra, L.; Kruss, A.; Luks, B.; Moskalik, M.; Pastusiak, T.; Strzelewicz, A.; Walczowski, W.; Wawrzyniak, T. Factors Controlling Terminus Position of Hansbreen, a Tidewater Glacier in Svalbard. Journal of Geophysical Research: Earth Surface 2021, 126, 1–20. [Google Scholar] [CrossRef]
- De Andrés, E.; Otero, J.; Navarro, F.J.; Walczowski, W. Glacier–plume or glacier–fjord circulation models? A 2-D comparison for Hansbreen–Hansbukta system, Svalbard. Journal of Glaciology 2021, 67, 797–810. [Google Scholar] [CrossRef]
- Perez-Doña, I.; Otero, J. Sobre el uso de Kriging Bayesiano para estimar la evolución de las velocidades en superficie del Glaciar Hansbreen (Svalbard). 10a Asamblea Hispano-Portuguesa de Geodesia y Geofísica 2023.
- Finkelnburg, R. Climate variability of Svalbard in the first decade of the 21st century and its impact on Vestfonna ice cap, Nordaustlandet. Doctoral thesis, Technischen Universität Berlin, 2013. [CrossRef]
- Navarro, F.J.; Martín-Español, A.; Lapazaran, J.J.; Grabiec, M.; Otero, J.; Vasilenko, E.V.; Puczko, D. Ice Volume Estimates from Ground-Penetrating Radar Surveys, Wedel Jarlsberg Land Glaciers, Svalbard. Arctic, Antarctic, and Alpine Research 2014, 46, 394–406. [Google Scholar] [CrossRef]
- Otero, J.; Navarro, F.J.; Lapazaran, J.J.; Welty, E.; Puczko, D.; Finkelnburg, R. Modeling the Controls on the Front Position of a Tidewater Glacier in Svalbard. Frontiers in Earth Science 2017, 5. [Google Scholar] [CrossRef]
- Gagliardini, O.; Zwinger, T.; Gillet-Chaulet, F.; Durand, G.; Favier, L.; de Fleurian, B.; Greve, R.; Malinen, M.; Martín, C.; Råback, P.; Ruokolainen, J.; Sacchettini, M.; Schäfer, M.; Seddik, H.; Thies, J. Capabilities and performance of Elmer/Ice, a new-generation ice sheet model. Geoscientific Model Development 2013, 6, 1299–1318. [Google Scholar] [CrossRef]
- Cuffey, K.; Paterson, W. The Physics of Glaciers, 4th ed.; Elsevier: Oxford, UK, 2010. [Google Scholar]
- Todd, J.; Christoffersen, P.; Zwinger, T.; Råback, P.; Chauché, N.; Benn, D.; Luckman, A.; Ryan, J.; Toberg, N.; Slater, D.; Hubbard, A. A Full-Stokes 3-D Calving Model Applied to a Large Greenlandic Glacier. Journal of Geophysical Research: Earth Surface 2018, 123, 410–432. [Google Scholar] [CrossRef]
- Todd, J.; Christoffersen, P.; Zwinger, T.; Råback, P.; Benn, D.I. Sensitivity of a calving glacier to ice–ocean interactions under climate change: new insights from a 3-D full-Stokes model. The Cryosphere 2019, 13, 1681–1694. [Google Scholar] [CrossRef]
- Benn, D.I.; Hulton, N.R.; Mottram, R.H. ‘Calving laws’, ‘sliding laws’ and the stability of tidewater glaciers. Annals of Glaciology 2007, 46, 123–130. [Google Scholar] [CrossRef]
- Nick, F.; Van der Veen, C.; Vieli, A.; Benn, D. A physically based calving model applied to marine outlet glaciers and implications for the glacier dynamics. Journal of Glaciology 2010, 56, 781–794. [Google Scholar] [CrossRef]
- Otero, J.; Navarro, F.J.; Martin, C.; Cuadrado, M.L.; Corcuera, M.I. A three-dimensional calving model: numerical experiments on Johnsons Glacier, Livingston Island, Antarctica. Journal of Glaciology 2010, 56, 200–214. [Google Scholar] [CrossRef]
- Todd, J.; Christoffersen, P. Are seasonal calving dynamics forced by buttressing from ice mélange or undercutting by melting? Outcomes from full-Stokes simulations of Store Glacier, West Greenland. The Cryosphere 2014, 8, 2353–2365. [Google Scholar] [CrossRef]
- Benn, D.I.; Todd, J.; Luckman, A.; Bevan, S.; Chudley, T.R.; Åström, J.; Zwinger, T.; Cook, S.; Christoffersen, P. Controls on calving at a large Greenland tidewater glacier: stress regime, self-organised criticality and the crevasse-depth calving law. Journal of Glaciology 2023, pp. 1–16. [CrossRef]
- Jenkins, A. Convection-driven melting near the grounding lines of ice shelves and tidewater glaciers. Journal of Physical Oceanography 2011, 41, 2279–2294. [Google Scholar] [CrossRef]
- Jackson, R.H.; Shroyer, E.L.; Nash, J.D.; Sutherland, D.A.; Carroll, D.; Fried, M.J.; Catania, G.A.; Bartholomaus, T.C.; Stearns, L.A. Near-glacier surveying of a subglacial discharge plume: Implications for plume parameterizations. Geophysical Research Letters 2017, 44, 6886–6894. [Google Scholar] [CrossRef]
- Holland, D.M.; Jenkins, A. Modeling Thermodynamic Ice–Ocean Interactions at the Base of an Ice Shelf. Journal of Physical Oceanography 1999, 29, 1787–1800. [Google Scholar] [CrossRef]
- GAGLIARDINI, O.; WERDER, M.A. Influence of increasing surface melt over decadal timescales on land-terminating Greenland-type outlet glaciers. Journal of Glaciology 2018, 64, 700–710. [Google Scholar] [CrossRef]
- Werder, M.A.; Hewitt, I.J.; Schoof, C.G.; Flowers, G.E. Modeling channelized and distributed subglacial drainage in two dimensions. Journal of Geophysical Research: Earth Surface 2013, 118, 2140–2158. [Google Scholar] [CrossRef]
- Stevens, L.A.; Straneo, F.; Das, S.B.; Plueddemann, A.J.; Kukulya, A.L.; Morlighem, M. Linking glacially modified waters to catchment-scale subglacial discharge using autonomous underwater vehicle observations. The Cryosphere 2016, 10, 417–432. [Google Scholar] [CrossRef]
- Jouvet, G.; Weidmann, Y.; Kneib, M.; Detert, M.; Seguinot, J.; Sakakibara, D.; Sugiyama, S. Short-lived ice speed-up and plume water flow captured by a VTOL UAV give insights into subglacial hydrological system of Bowdoin Glacier. Remote Sensing of Environment 2018, 217, 389–399. [Google Scholar] [CrossRef]
- Cowton, T.R.; Todd, J.A.; Benn, D.I. Sensitivity of Tidewater Glaciers to Submarine Melting Governed by Plume Locations. Geophysical Research Letters 2019, 46, 11219–11227. [Google Scholar] [CrossRef]
- Carroll, D.; Sutherland, D.A.; Hudson, B.; Moon, T.; Catania, G.A.; Shroyer, E.L.; Nash, J.D.; Bartholomaus, T.C.; Felikson, D.; Stearns, L.A.; Noël, B.P.Y.; van den Broeke, M.R. The impact of glacier geometry on meltwater plume structure and submarine melt in Greenland fjords. Geophysical Research Letters 2016, 43, 9739–9748. [Google Scholar] [CrossRef]
- Nick, F.; Oerlemans, J. Dynamics of tidewater glaciers: comparison of three models. Journal of Glaciology 2006, 52, 183–190. [Google Scholar] [CrossRef]
- Amundson, J.M.; Truffer, M.; Zwinger, T. Tidewater glacier response to individual calving events. Journal of Glaciology 2022, 68, 1117–1126. [Google Scholar] [CrossRef]
- Umlauft, J.; Johnson, C.W.; Roux, P.; Trugman, D.T.; Lecointre, A.; Walpersdorf, A.; Nanni, U.; Gimbert, F.; Rouet-Leduc, B.; Hulbert, C.; Lüdtke, S.; Marton, S.; Johnson, P.A. Mapping Glacier Basal Sliding Applying Machine Learning. Journal of Geophysical Research: Earth Surface 2023, 128, e2023JF007280. [Google Scholar] [CrossRef]
- Prieur, C.; Rabatel, A.; Thomas, J.B.; Farup, I.; Chanussot, J. Machine Learning Approaches to Automatically Detect Glacier Snow Lines on Multi-Spectral Satellite Images. Remote Sensing 2022, 14, 3868. [Google Scholar] [CrossRef]
- Gogineni, A.; Chintalacheruvu, M.R.; Kale, R.V. Modelling of snow and glacier melt dynamics in a mountainous river basin using integrated SWAT and machine learning approaches. Earth Science Informatics 2024. [Google Scholar] [CrossRef]
- Bolibar, J.; Rabatel, A.; Gouttevin, I.; Galiez, C.; Condom, T.; Sauquet, E. Deep learning applied to glacier evolution modelling. The Cryosphere 2020, 14, 565–584. [Google Scholar] [CrossRef]
- Bolibar, J.; Rabatel, A.; Gouttevin, I.; Zekollari, H.; Galiez, C. Nonlinear sensitivity of glacier mass balance to future climate change unveiled by deep learning. Nature Communications 2022, 13, 409. [Google Scholar] [CrossRef] [PubMed]
- Ren, W.; Zhu, Z.; Wang, Y.; Su, J.; Zeng, R.; Zheng, D.; Li, X. Comparison of Machine Learning Models in Simulating Glacier Mass Balance: Insights from Maritime and Continental Glaciers in High Mountain Asia. Remote Sensing 2024, 16, 956. [Google Scholar] [CrossRef]
|
Disclaimer/Publisher’s Note: The statements, opinions and data contained in all publications are solely those of the individual author(s) and contributor(s) and not of MDPI and/or the editor(s). MDPI and/or the editor(s) disclaim responsibility for any injury to people or property resulting from any ideas, methods, instructions or products referred to in the content. |
© 2024 by the authors. Licensee MDPI, Basel, Switzerland. This article is an open access article distributed under the terms and conditions of the Creative Commons Attribution (CC BY) license (http://creativecommons.org/licenses/by/4.0/).
